Differential Requirement of ZAP-70 for CD2-Mediated Activation Pathways of Mature Human T Cells
[Hamadi, 3(7): July, 2014] ISSN: 2277-9655
Scientific Journal Impact Factor: 3.449
(ISRA), Impact Factor: 1.852
http: // www.ijesrt.com (C)International Journal of Engineering Sciences & Research Technology
[245-257]
IJESRT INTERNATIONAL JOURNAL OF ENGINEERING SCIENCES & RESEARCH
TECHNOLOGY
Removal of Pb2+, Cu2+ and Cd2+ Metals from Simulated Wastewater in Single and
Competitive System Using Locally Porcelanite Noor J. Hamadi *1, Ahmed Abd Mohammed2, Ahmed Hassoon Ali3
*1,2University of Baghdad , College of Engineering, Environmental Engineering Department,Iraq 3University of Al-Mustansiriya, College of Engineering, Environmental Engineering Department, Iraq
Abstract The equilibrium uptake of lead (Pb2+), copper (Cu2+) and cadmium (Cd2+) ions, both singly and in
combination, by locally Iraqi porcelanite rocks (PC) was studied in a batch system. The porcelanite rock was
characterized using BET, and FTIR. Adsorption isotherms were developed for the single, and ternary-component
systems and expressed by the mono- and multi-component Langmuir, Freundlich, Redlich–Peterson , Sips and khan
models .The model parameters were estimated by nonlinear regression method using Statistica version-6 software.
To understand the action of metals uptake, factors influencing the adsorption of the heavy metals including pH,
initial metal ion concentration, weight of the adsorbent, mixing speed, contact time and temperature were
investigated. It was found that the mono- and multi-component adsorption equilibrium data fitted very well to the
Langmuir model with high determination coefficient (R2). The maximum loading capacity (qmax) was 76.104, 33.288
and 30.254 mg/g for Pb2+, Cu2+ and Cd2+respectively. However, in ternary system the loading capacity decreased
because of competition between ions to binding sites of adsorbent. Adsorption data were modeled using the pseudo-
first and pseudo-second-order kinetic, Elovich and intraparticle diffusion models. It was seen that the pseudo-
second-order kinetic equation could best describe the adsorption kinetics. Thermodynamic parameters showed that
the adsorption of investigated heavy metals onto PC was exothermic, spontaneous in nature and the process is
physiosorption. The Fourier Transform Infrared spectroscopy (FTIR) analysis indicated that carbonyl (C=O) and
hydroxyl (–OH) groups in PC played an important role in the adsorption process. In conclusion, PC was found
suitable as an abundant adsorbent for removal of the selected metal ions from aqueous solutions.
Keywords: Adsorption; Porcelanite rocks (PC); Lead; Copper; Cadmium; Adsorption isotherms.
Introduction Many industrial and metallurgical processes
in addition to some human activities produce rapidly
increasing amounts of wastewater containing heavy
metals ions in appreciable concentration. At least 20
of these metal ions are classified as toxic [1].In
addition these ions are no degradable and thus
persistent, leading to both ecological and health
problems even at low concentration [2]. For these
reasons, the presence of heavy metal ions in the
environment at concentrations above critical values is
unacceptable and their removal from the wastewater
is of primary importance. Removal of toxic heavy
metals or decreasing their concentrations to the
permitted levels before discharge is important and is
becoming more important with an increase in
industrial activities [3]
There are many methods for the removal of
heavy metals from aqueous solutions, such as
adsorption, chemical precipitation, ion exchange,
membrane processes, reverse osmosis, chemical
oxidation, precipitation, etc. Adsorption is the most
popular method in which activated carbon or ion
exchange resins are usually applied. Activated carbon
adsorption has been recommended by the USEPA as
one of the best available technologies (BAT) [4] in
removal of heavy metals and organic compounds, but

[Hamadi, 3(7): July, 2014] ISSN: 2277-9655
Scientific Journal Impact Factor: 3.449
(ISRA), Impact Factor: 1.852
http: // www.ijesrt.com (C)International Journal of Engineering Sciences & Research Technology
[245-257]
it is highly expensive especially for developing
countries. In recent years, there has been a
continuous search for locally available and cheaper
adsorbents for the replacement of activated carbon
for removal of a variety of heavy metals [5].
There is scope for developing adsorbents
from low-cost materials. Many natural and synthetic
materials are used for this purpose. Recently, natural
materials have gained importance [6][7]. The choice
of these materials depends on their availability, cost
and adsorption capacity. Therefore, studies are now
focusing on new natural adsorbents with low cost and
local availability, such as Chitosan [8], bentonite [9],
zeolite [10], clay minerals [11], olive mill residues
[12], fly ashes [13], coal [14], rice husk [15], waste
tea leaves [16], peanut hull pellets [17] and
biosorbents [18].
The aim of this study was to investigate the lead,
copper and cadmium adsorption using porcelanite
rock sample. Iraq is one of the major courtiers in
porcelanite production. Langmuir, Freundlich,
Reddlich-Peterson, Sips and khan models were
applied to describe and predict the adsorption
equilibrium. Four kinetic models including pseudo-
first-order, pseudo-second-order, intraparticle
diffusion and elovich models were used to determine
the mechanism of adsorption. The thermodynamic
parameters such as standard free energy, enthalpy
and entropy were also evaluated. In addition, the
effect of various parameters affecting adsorption
behavior of heavy metals such as contact time, pH,
adsorbent dose, initial concentration, mixing speed
and temperature are considered. Furthermore,
specific surface area (BET), infrared spectra (FTIR),
are verified for characterization of porcelanite
adsorbent.
Materials and methods Adsorbent preparation
The porcelanite rocks sample used in this
study is supplied by the general company for
geological survey and mineralogy-ministry of
industry and minerals (GCGSM). The porcelanite
rocks samples was ground in a mortar and sieved into
mesh 0.6, 1 mm and geometric mean diameter was
taken. Then the grounded sample was washed with
distilled water to remove any non-adhesive impurities
and small particles and then dried at 376 K for 24 h
to remove moisture.
Characterization of prepared PC
BET surface areas of the prepared
porcelanite rocks was determined from N2
adsorption isotherm data collected at 77 K (Autosorb-
1-MP, Quantachrome Corporation, Boynton Beach,
FL, USA). Prior to analysis, adsorbent samples were
outgassed for 20 h at 423 K. The apparent density is
determined using Hg picnometry analysis (Autotap,
Quantachrome, USA).Micropore volume and
mesopore volume were computed fromN2 adsorption
isotherm data using the Density Functional Theory
(DFT) with the N2_carb1.gai kernel (PC software
version 1.51, Quantachrome, BoyntonBeach, FL). In
addition, the mesopore volume was computed using
the Barrett, Joyner, and Halenda (BJH) method
because this method captures the entire mesopore
range (20– 500A° ) while the DFT method was only
able to calculate a mesopore volume for pores with
widths in the range of 20–360A°. A more detailed
description of the procedures used for adsorbent
characterization is given elsewhere [19]. Chemical
and Physical analyses of the PC are summarized in
Table 1. Fourier Transform Infrared Spectroscopy
(FTIR, Nicolet 6700, USA) was employed to
determine the type of functional groups present on
adsorbent’s surface before and after adsorption. Table 1. General Characteristics of prepared porcelanite
rocks adsorbent.
Parameter Value
Average particle diameter,
mm
0.775
Bulk density, Kg m-3 816
BET Surface area, m2 g-1 71.92
Particle porosity 0.532
Elemental Analysis Weighted average, %
P2O5 1.98
CaO 10.75
MgO 2.1
TiO2 0.1
SiO2 70.4
Fe2o3 0.79
Na2O 2.59
K2O 0.12
Al2O3 1.75
Loss of ignition 9.42
Batch adsorption studies
The aqueous solutions of metal ions used in
the present investigation were prepared by using
analytical grade chemicals. Individual stock metal ion
solutions of 1000 mg/L concentration of Pb+2 from
Pb(NO3)2, Cu2+ from CuSO4.5H2O and Cd2+ from
Cd(NO3)2 respectively were prepared. In the case of

[Hamadi, 3(7): July, 2014] ISSN: 2277-9655
Scientific Journal Impact Factor: 3.449
(ISRA), Impact Factor: 1.852
http: // www.ijesrt.com (C)International Journal of Engineering Sciences & Research Technology
[245-257]
Cd+2, nitrate is used instead of sulphate to avoid
metal precipitation, though the effect of the anion
was negligible. These stock solutions were used to
prepare dilute solutions of these ions by dilution with
distilled water. The stock solutions were acidified to
4< pH<6 using concentrated HNO3 in order to
prevent the formation of metal hydroxide and to
return the metal ion to the dissolve state [20].
Batch experiments for optimization of
process parameters were carried out in 250 ml round
bottom flasks with working volume of 100 ml at 125
rpm in an incubator cum orbital shaker (Heidolph,
No.549-59000-0-0, Germany).All the experiments
were carried out in triplicates and average results
were used. The range of various process parameters
was varied as pH: 1-6, adsorbent mass: 0.1-1.4 g,
contact time: 0- 360 min, initial concentration: 25-
100 mg/L, and temperature: 10oC-60 oC.
Metal analysis
The concentration of remaining Pb2+, Cu2+
and Cd2+ in solution after adsorption was determined
as follow: Samples (40 ml) were transferred into a
micro centrifuge tube and centrifuged at 3000 rpm
for 5 minutes, to remove suspended materials in the
samples. Supernatant (10 ml) was transferred to 100
ml volumetric flask and acidified with 90 ml of 10%
nitric acid (HNO3) to get a standard solution of
100ml. These samples were stored in a freezer to
terminate the reaction until measurement [12]. These
samples were analyzed using Atomic absorption
Spectrophotometer (AAS, Buck, Accusys 211, USA).
The capacity uptake qeq, adsorbed amount adsorbate
onto unit weight of adsorbent, and removal
percentage (Er, %) were calculated, respectively,
using the following equations:
M
CCVq
eqoL
eq
)( (1)
100
oC
eqCoC
rE (2)
Where Co and Ceq is the initial and final equilibrium
concentration of the metal ion respectively (mg/L),
VL the volume of solution (L) and M is the adsorbent
mass (g).
Adsorption isotherm Single component isotherm models
Five models for single system have been
tested: Langmuir model, Freundlich model,
Reddlich–Peterson model, Sips model and Khan
Model [21]:
Langmuir model: eqbC
eqbCq
eqq
1
max (3)
Where qeq is the amount of pollutant bound to per g
of PC at equilibrium (mg/g) and Ceq is the residual
(equilibrium) pollutant concentration left in solution
after binding (mg/L). qmax is the maximum amount
(maximum loading capacity) of pollutant per unit
weight of adsorbent to form a complete monolayer on
the surface bound at high Ceq(mg/g), and b (L/mg)is a
constant related to the affinity of the binding sites.
Freundlichmodel:n
eqCkeqqF
/1 (4)
Where KF(mg/g)(L/mg)1/n and n are the mono-
component Freundlich constants characteristic of the
system.
Redlich–Peterson model: eqRP
eqRP
eqCa
CKq
1 (5)
Where KRP(mg/gL/mg), aRP (L/mg)β and β are the
Redlich–Peterson parameters.
Sips model (Combination of Langmuir-Freundlich
Model) :
n
eqbC
neqCmbq
eq/11
/1
(6)
where b (L/mg)is a constant related to the affinity of
the binding sites and n are the mono-component
Freundlich constants characteristic of the system
Khan model: ka
eCkb
eCkbQeq
)1(
max
(7)
Where, Qmax (mg/g), bk (l/mg) and ak represent the
model parameters.
Multicomponent isotherm models
One of the difficulties in describing the
adsorption of pollutants from waste streams is that
wastewaters contain not one, but many kinds of
pollutants. When several components are present,
interference and competition phenomena for
adsorption sites occur and lead to a more complex
mathematical formulation of the equilibrium.
Therefore, competitive isotherms attempt to express
relationships between the adsorbed quantity of one
component and the concentrations of all other
components, either in solution or already adsorbed.
Several isotherms have been proposed to describe
equilibrium and competitive adsorption for such a
system. The long and tedious experimental method
[Hamadi, 3(7): July, 2014] ISSN: 2277-9655
Scientific Journal Impact Factor: 3.449
(ISRA), Impact Factor: 1.852
http: // www.ijesrt.com (C)International Journal of Engineering Sciences & Research Technology
[245-257]
for obtaining competitive adsorption data has rapidly
given rise to the idea of predicting multi-component
isotherms from the single component ones only and
competitive non-modified adsorption models were
developed:
Extended Langmuir model:
N
j
eqjCjb
eqiCibiqieq
1
1
max, (8)
Where Ceqiand qeqiare the unadsorbed concentration
of each component in the mixture at equilibrium and
the adsorbed quantity of each component per g of
adsorbent at equilibrium, respectively, bi and qimax are
derived from the corresponding individual Langmuir
isotherm equations [22].
Extended Freundlich model:
N
1j
n
eqjj
n1
eqi
n1n
eqiFi
eqij
i
CbC
CKq (9)
Where Ceqiand qeqiare the unadsorbed concentration
of each component in the mixture at equilibrium and
the adsorbed quantity of each component per g of
adsorbent at equilibrium, respectively, KFi and ni are
derived from the corresponding individual Freundlich
isotherm equations [22].
Redlich-Peterson model:
N
j
j
eqjRPj
eqiRPi
eqi
Ca
CKq
1
1
(10)
Where KRPi, aRPj and biare the Redlich–Peterson
parameters derived from the corresponding individual
Redlich–Peterson isotherm equations (Aksu and
Akpınar, 2000).
Combination of Langmuir and freundlich model:
The competitive Langmuir-Freundlich model related
to the individual isotherm parameters is expressed in
the following equation [23].
i
i
n
ie
N
i
i
n
ieiim
ie
Cb
Cbqq
1
,
1
1
,,
,
1
(11)
Study of adsorption kinetics Kinetic studies of adsorption for Pb2+, Cu2+
and Cd2+onto porcelanite rocks were carried out at
the initial concentration of 50 mg/ L (in 250 mL flask
during shaking at 250 rpm) for contact times in the
range of 30 to 360 min. For understanding the
mechanism of adsorption process and determining
the rate of dominating step, the adsorption data were
analyzed using four simplest kinetic models such as
pseudofirst- order, pseudo-second-order, Elovich and
intraparticle diffusion model [24][25]:
Pseudo-First Order:
)303.2
(log)log(tLk
eqqtqeqq (12)
where qeq is the amount of Pb2+, Cu2+ and Cd2+
adsorbed at equilibrium (mg/g); qt is the amount of
Pb2+, Cu2+ and Cd2+adsorbed at time t (mg/g); and kL
is the equilibrium rate constant of pseudo-first
sorption (min -1).
Pseudo-Second Order: eqq
t
eqqsktq
t
2
1 (13)
Where Ks (g/mg.min) is the rate constant of
adsorption.
Intraparticle diffusion model: Ctidktq 2/1 (14)
Where Kid (mg/g min1/2) is the rate constant of
intraparticle diffusion, C is the value of intercept
which gives an idea about the boundary layer
thickness, that is, the larger intercept; the greater is
the boundary layer effect.
Elovich kinetics model: tb
bab
tq ln1
ln1
(15)
Where a and b parameter related to equation.
Adsorption thermodynamics Based on fundamental thermodynamic
concepts, it is assumed that in an isolated system,
energy cannot be gained or lost and the entropy
change is the only driving force. The apparent
equilibrium constant for the process has been shown
to be [26]:
KcRToG ln (16)
eq
eqo
cC
CCK
(17)
Also, enthalpy changes (ΔHo) and entropy
changes (ΔSo) can be estimated by the following
equation:
ToSoHoG (18)
where ΔG° is standard Gibbs free energy change in
kJ/mol; ΔH° is change in enthalpy (heat of
adsorption, kJ/mole), ΔS° is change in entropy in
kJ/mol, R is the universal gas constant (=0.8314
kJ/mol.K) and T is the temperature in K.

[Hamadi, 3(7): July, 2014] ISSN: 2277-9655
Scientific Journal Impact Factor: 3.449
(ISRA), Impact Factor: 1.852
http: // www.ijesrt.com (C)International Journal of Engineering Sciences & Research Technology
[245-257]
Results and Discussion Characterization of the adsorbent
In order to find out which functions are responsible
for Pb2+, Cu2+ and Cd2+ adsorption, FTIR analysis of
PC was carried out. Figure 1 show the spectra of raw
and treated PC samples. The sharp bands near 455
define the Si–OH stretches. The peak at 790.81 cm-1
is associated with the PH group. The band at 1095.50
cm-1 is Si-O-Si and those at 1442.75 and 1654.92 are
C=O groups. The sharp peaks at 2870.08, 3248.13
and 3614.60 are the O-H stretch [27]. Peak
displacement decreasing define the change in the
structure with Pb2+ Cu2+ and Cd2+ imply the related
functional groups to be responsible for the adsorption
process. From these findings, it can be concluded that
lead adsorbed more strongly than copper and
cadmium respectively. Table 2 shows the main
functional groups before and after PC was loaded
with Pb2+, Cu2+ and Cd2+ ions. The results show that
the bands of hydroxyl and carbonyl groups shifted to
higher transmission (peaks of adsorption) and
therefore it plays the major role in adsorption of these
ions. The bands of functional groups shifted to higher
transmission with a total amount of 266.5, 201, and
108.5% for PC loaded with Pb2+, Cu2+, and Cd2+,
respectively. Therefore, the order of adsorption of
heavy metals removed by on the surface of PC is the
following: Pb2+ > Cu2+ > Cd2+. Figure 1: FTIR analysis (a) raw PC (b) Cd2+ loaded
PC (c) Cu2+ loaded PC (d) Pb2+ loaded PC
Table 2: Functional groups before and after PC was
loaded with Pb2+, Cu2+, and Cd2+ ions in the single system
Effect of pH
The influence of pH on the removal efficiency
for the different metals is shown in Figure 2.
Experiments concerning the effect of pH on the
adsorption were carried out in the range of pH not
influenced by the metal precipitation as metal
hydroxide which is occurs at pH above 6 [28]. At
very low pH (1-3), metal uptake was less and this is
due to the fact that adsorbent surface protonate and
the adsorbent surface become positively charge and
access of metal ions to adsorbent surface would be
restricted as a result of repulsive forces. Metal uptake
increased with pH around 4. At this pH, functional
groups onto adsorbent surface deprotonate and the
adsorbent surface becomes negatively charged (i.e.,
increasing of OH- groups), so in this region of pH
metal ions can favorably be attracted onto the
adsorbent [29]. Further, increasing the pH causes
decreasing of negatively sites and thus reduce
removal efficiency [30].
Wave
Number,
cm-1
Type
of
bond
Function
al
group
Difference
in peaks adsorption(%)
Pb 2+ Cu2+ Cd 2+
3614.60 -OH- Hydroxyl
group 33 29.5 14
3248.13 -OH- Hydroxyl
group 43 35 21
2870.08 -OH- Hydroxyl
group 56.5 38.6 33.6
1654.92 C=O carbonyl
groups 37.5 31 14
1442.75 C=O carbonyl
groups 35.5 25.5 8.5
1095.5 Si-O-
Si
Siloxane
groups 9 6 6
790.81 -PH
Phosphine
groups 36 24 6
455 Si–
OH
Silanol
groups 16 7 5
Sum of differences in peaks
adsorption %, after-before
adsorption =
266.5
% 201%
108.5
%

[Hamadi, 3(7): July, 2014] ISSN: 2277-9655
Scientific Journal Impact Factor: 3.449
(ISRA), Impact Factor: 1.852
http: // www.ijesrt.com (C)International Journal of Engineering Sciences & Research Technology
[245-257]
Figure 2: Effect of pH on the adsorption of metal ions
onto PC at Co= 50 mg/L, agitation speed=200 rpm,
contact time = 4 h, adsorbent dose=0.5 g/100mL and
temperature= 30 oC
Effect of agitation speed
The effect of the agitation speed on the
removal efficiency of all the metal ions using PC is
shown in Figure 3. The efficiency values increase
from: 56.866 to 93.453% for Lead, 38.706 to
90.152% for Copper and 34.472to 83.136 for
Cadmium respectively. It can be clearly seen that
mixing speed increases the removal efficiency until it
reaches a certain value and further increase is then of
no benefit (i.e., above 250 rpm). The increase in
efficiency is due to the increase in turbulence and as
a consequence, the decrease in the external mass
transfer resistance thickness around the adsorbent
particles with increase in mixing speed [31].
Moreover these results clearly indicate that a mixing
speed of 250 rpm is sufficient to obtain maximum
removal efficiency by reducing the boundary layer
thickness to a minimum value.
Figure 3: Effect of agitation speed on the adsorption of heavy
metal onto PC at Co= 50 mg/L, pH= 4, contact time = 4 h,
adsorbent dose=0.5 g/100mL and temperature= 30 oC.
Effect of adsorbent Mass The effect of varying the adsorbent dose
(mass) on the adsorption of various metal ions is
shown in Figure 4. It is clearly seen that the removal
efficiency increases as the PC mass increases. As the
PC mass increases the number of binding sites for the
ions also increases. After some point, adsorption
capacity was steady due to a screen effect between
adsorbent, this produced a block of the adsorbent
active sites by an increase of adsorbate (heavy metal
ions) in the system [32]. Similar observations were
also made by other investigators [20] [33]. Removal
efficiency increases for Lead from: 66 to 97%,
42.222 to 95.514% for Copper and 32to 90.758% for
Cadmium. Thus in next experiments, the optimum
dosage was fixed at 0.7, 1.2 and 1.3 for Pb2+, Cu2+
and Cd2+ respectively.
Figure 4: Effect of adsorbent dose on the adsorption of
heavy metals onto PC at Co= 50 mg/L, pH= 4, contact
time = 4 h, agitation speed=250 rpm and temperature
= 30 oC.
Effect of contact time and adsorption kinetics
Contact time plays an important role in the
efficient removal of heavy metals using PC.
Therefore, the adsorption of Pb2+, Cu2+ and Cd2+ at
constant temperature, initial concentration, optimum
agitation speed, optimum adsorbent dose and
optimum pH was studied as a function of contact
time to determine the equilibrium time. The influence
of contact time on the adsorption capacity for
different metal ions is shown in Figure 5. Removal
efficiency increases for lead from 0 to 98.347%, for
copper from 0 to 96.333% and cadmium from 0 to
94.374% as the contact time increases from 0 to 360
min. The results clearly revealed that rate of
30
40
50
60
70
80
90
100
0 1 2 3 4 5 6 7pH
RE
(%
)
Pb (II)
Cu (II)
Cd (II)
20
30
40
50
60
70
80
90
100
0 50 100 150 200 250 300 350
Agitation speed (rpm)
RE
(%
)
Pb (II)
Cu (II)
Cd (II)
20
30
40
50
60
70
80
90
100
0 0.1 0.2 0.3 0.4 0.5 0.6 0.7 0.8 0.9 1 1.1 1.2 1.3
Adsorbent dose (g)
RE
(%
)
Pb (II)
Cu (II)
Cd (II)

[Hamadi, 3(7): July, 2014] ISSN: 2277-9655
Scientific Journal Impact Factor: 3.449
(ISRA), Impact Factor: 1.852
http: // www.ijesrt.com (C)International Journal of Engineering Sciences & Research Technology
[245-257]
adsorption is higher at the beginning and this is due
to availability of a large number of active sites on the
adsorbent. As these sites are exhausted, the uptake
rate is controlled by the rate at which the adsorbate is
transported from the exterior to the interior sites of
the adsorbent particles [34]. Maximum removals
were attained with in the first 240 min of stirring
time. There must not be seemed to be much benefit
after 300 min. Therefore the equilibrium time was set
to be 300min in further experiments.
Figure 5: Effect of contact time on the adsorption of
heavy metals onto PC at Co= 50 mg/L, pH= 4, optimum
adsorbent dose, agitation speed=250 rpm and
temperature= 30 oC
The effect of contact time on adsorption
kinetics had been studied with initial concentration of
50 mg/L at 303K, pH 4, adsorbent mass 0.5 g.
Adsorption kinetics was modeled by the pseudo first-
order Lagergren, pseudo second-order rate equation,
intraparticle diffusion equations, and elovich model.
Table 3 demonstrates the results of these models. The
rate of adsorption on PC observed to follow the
second-order rate law derived by Lagergren Eq. (13).
Fig. 6 shows the Lagergren plot of t/qt vs. time (min)
for the three metal ions. . The calculated values of ks
for each solute were found to be0.003, 0.005, and
0.004 (g/mg.min) for Pb2+, Cu2+, and Cd2+ ions,
respectively. This indicates that the rate of mass
transfer of Cu2+ is higher than the other components.
In other words, Cu2+is adsorbed by the PC at a higher
rate than others. However, the value of constant (C)
in the intraparticle diffusion model is not equal to
zero, suggesting that adsorption proceeds from
boundary layers mass transfer across the interfaces to
the intraparticle diffusion within the pores of
adsorbent. This indicates the mechanisms of Cd2+,
Cu+2 and Cd+2 adsorption are complex and both the
surface adsorption and intraparticle diffusion
contribute to the rate-determining step [35].
Table 3 Kinetic models parameters for Cd2+, Cu2+and
Cd2+ions adsorption onto PC.
Figure 6: Pseudo-second order model for adsorption of
metal ions onto PC. Effect of initial metal ion concentration
The experiment was performed at distinct
initial Pb2+, Cu2+ and Cd2+ concentrations ranging
from 25 to 100 mg/L. As shown in Figure 7, the
efficiency values decreases from: 99.8 to 88.236%
0
20
40
60
80
100
120
0 100 200 300 400
Contact time (min)
RE
(%
)
Pb (II)
Cu (II)
Cd (II)
0
20
40
60
80
100
120
0 30 60 90 120 150 180 210 240 270 300 330 360 390
Time (min)
t/qt (m
in g
/mg)
Pb(II)
Cu (II)
Cd (II)
Model Paramet
ers Pb2+ Cu2+ Cd2+
Pseudo-first-
order
qeq
(mg/g) 33.014 20.869 29.635
KL
(L/min) 0.030 0.030 0.033
R2 0.826 0.816 0.739
Pseudo-
second-order
qeq
(mg/g) 7.758 4.484 4.151
Ks
(g/mg.mi
n)
0.003 0.005 0.004
R2 0.986 0.978 0.973
Intraparticle
diffusion
C 1.864 0.511 0.194
Kid
(mg/g.mi
n0.5)
0.358 0.208 0.194
R2 0.934 0.949 0.969
Elovich
A
(mg/g.mi
n)
0.88 0.458 0.047
b-
(g/mg) 0.784 1.363 1.502
R2 0.972 0.959 0.935

[Hamadi, 3(7): July, 2014] ISSN: 2277-9655
Scientific Journal Impact Factor: 3.449
(ISRA), Impact Factor: 1.852
http: // www.ijesrt.com (C)International Journal of Engineering Sciences & Research Technology
[245-257]
for lead, 97.576 to 84.457% for copper and 90.276 to
79.013% for cadmium respectively as the initial
concentration increased from 25 to 100 mg/L. This is
due to the lack of binding sites in the PC sample for
the adsorption of metal ions at higher concentrations.
The effect of initial metal concentration could be
explained as follow: at low metal ion/adsorbent ratio,
metal ion adsorption involves higher energy binding
sites. As the metal ion/adsorbent ratio increase (i.e.,
at higher initial concentration), the higher energy
binding sites are saturated and adsorption begins on
lower energy binding sites, resulting in decrease in
the adsorption efficiency [32].
Figure 7: Effect of initial concentration on the adsorption
of heavy metals onto PC at pH= 4, agitation speed=250
rpm, optimum adsorbent dose, contact time = 5h and
temperature= 30 oC
Effect of temperature and adsorption
thermodynamics
The temperature has two major effects on
the adsorption process. Increasing the temperature
will increase the rate of adsorbate diffusion across the
external boundary layer and in the internal pores of
the adsorbent particles because liquid viscosity
decreases as temperature increases. In addition,
temperature affects the equilibrium capacity of the
adsorbent depending on weather the interaction
between the adsorbent and the adsorbate is
exothermic or endothermic [31]. Figure 8 shows the
adsorption efficiency of Pb2+, Cu+2 and Cd+2ions onto
PC at six different temperatures of 10, 20, 30, 40, 50
and 60 0C. It can be seen that as the temperature
increases, the adsorption capacity of Lead, copper
and Cadmium all decrease drastically. For instance,
for an initial concentration is 50 mg/L the adsorption
efficiency of the adsorbent decreases from 99.338 to
92.968 %, 98.49 to 88.398% and from 97.536 to
79.316% for Lead, Copper and cadmium ions
respectively as the temperature increase from 10 to
60 oC. As a whole, it is clearly seen that as the
temperature increases the loading capacity for the
same initial adsorbate concentration decreases. This
means that the rate of desorption was more
significant than the rate of adsorption, which implies
that adsorption is an exothermic reaction, a well-
known scientific fact [36].
Table 4 shows the thermodynamic constants
of adsorption for Pb2+, Cu+2 and Cd+2onto PC. The
value of enthalpy ΔH° was −38.844, -34.768, and -
36.131kJ/mol for Pb2+, Cu+2 and Cd+2 ions,
respectively, suggested the physiosorption and
exothermic nature of adsorption. This is also
supported by the decrease in the values of uptake
capacity of adsorbent with the rise in temperature
[37]. The values of entropy ΔS°, -0.0954, -0.0872,
and -0.0968/mol K, reflect the affinity of Pb2+, Cu+2
and Cd+2ions to be adsorbed onto PC. The negative
values of ΔG°confirm the feasibility of the process
and the spontaneous nature of adsorption [38].
Figure 8: Effect of temperature on the adsorption of
heavy metals onto PC at Co= 50 mg/L, pH= 4, agitation
speed=250 rpm, optimum adsorbent dose, contact time =
5h
60
70
80
90
100
0 20 40 60 80 100
Initial concentration Co (mg/L)
RE
(%) Pb (II)
Cu (II)
Cd (II)
60
70
80
90
100
0 10 20 30 40 50 60 70
Temperature (oC)
RE
(%
)
Pb (II)
Cu (II)
Cd (II)

[Hamadi, 3(7): July, 2014] ISSN: 2277-9655
Scientific Journal Impact Factor: 3.449
(ISRA), Impact Factor: 1.852
http: // www.ijesrt.com (C)International Journal of Engineering Sciences & Research Technology
[245-257]
Table 4 Thermodynamic parameters for the adsorption of
Pb2+, Cu+2 and Cd+2 onto PC.
Adsorption isotherm models
Adsorption isotherms constants for single
component systems
The parameters for each model for single
component system were estimated by nonlinear
regression using STATISTICA version-6 software.
All parameters with the square of the correlation
coefficient (R2) are summarized in Tables 5. The
adsorption isotherms for single component system of
Pb+2, Cu+2 and Cd2+ onto PC are shown in Figure 9,
10, 11.
Figure 9: Adsorption isotherm for lead onto PC
Figure 10: Adsorption isotherm for copper onto PC
Materials and methods Subheading
Subheading should be 10pt Times new
Roman, justified.
This section should be typed in character
size 10pt Times New Roman, Justified
Figure 11: Adsorption isotherm for cadmium onto PC
Metal
Temper-
ature
(K)
-ΔG◦
(kJ.mol−1)
-ΔH◦
(kJ.mo1−1)
-ΔS◦
(J.mol−1K−1) R2
Pb2+
383
393
303
313
323
333
11.790
10.652
10.293
8.928
8.379
6.749
38.844 0.0954 0.974
Cu2+
383
393
303
313
323
333
9.828
9.485
8.234
7.875
6.447
5.622
34.768 0.0872 0.975
Cd2+
383
393
303
313
323
333
8.655
7.549
7.104
5.911
4.869
3.721
36.131 0.0968 0.989
0 2 4 6 8 10 12 14 16 18 20 22 24 26 28 30
Ce (mg/L)
0
2
4
6
8
10
12
14
16
18
20
22
24
qe (
mg/g
)
Cu2+ isotherm, Co= 50 mg/L
Experimental
Theoretical (Langmuir)
0 5 10 15 20 25 30 35 40
Ce (mg/L)
0
2
4
6
8
10
12
14
16
18
20
qe (
mg/g
)
Cd2+ isotherm, Co= 50 mg/L
Experimental Theoretical
(Langmuir)
0 2 4 6 8 10 12 14 16 18
Ce (mg/L)
0
5
10
15
20
25
30
35
40
qe (
mg/g
)
Experimental
Theoretical (Langmuir)
Pb2+ isotherm, Co= 50 mg/L

[Hamadi, 3(7): July, 2014] ISSN: 2277-9655
Scientific Journal Impact Factor: 3.449
(ISRA), Impact Factor: 1.852
http: // www.ijesrt.com (C)International Journal of Engineering Sciences & Research Technology
[245-257]
Table 5 Parameters of single solute isotherm for metal
ions onto PC
From Figure 9, 10, 11 and Table 5 for single
component systems, the following conclusions can be
drawn:
1. The Langmuir model gives the best fit for
the experimental data for single, binary and
ternary component adsorption system for
lead, copper and cadmium ions recognized
by the highest values of (R2). This indicates
that the adsorption process occurs as a mono
layer. 2. The equilibrium isotherm for each
component is of favorable type (i.e., 0 < RL<
1). RLPb2+= 0.307, RLCu
2+= 0.249 and RLCd2+
= 0.373. 3. The adsorption capacity (qm) for lead is
greater than copper and cadmium in single
system, Pb2+ (qm) 76.104 mg/g˃ Cu+2 (qm)
33.288 mg/g ˃ Cd+2 (qm) 30.254 mg/g. This
behavior may be attributed to several
reasons from which the hydrated ionic
radius Å . The ions with hydrated radius
smaller than the pore size are able to move
easily within the pores. The hydrated ionic
radius are as follow: Pb2+ (4.01 Å ) ˂ Cu2+
(4.19 Å) ˂ Cd2+ (4.26 Å). In addition, the
molar mass is as follow: Pb(NO3)2 331.2
g·mol−1˃ CuSO4.5H2O 249.69 g·mol−1 ˃
Cd(NO3)2 236.42 g·mol−1. A comparison of the maximum adsorption capacity
(qmax) of the PC sample with that of some other
adsorbents reported in the literature is given in
Table 6. Table 6 Adsorption capacities (qmax, mg/g) for metal ions
of various adsorbents
Adsorption isotherms constants for ternary
component systems
The adsorption isotherms for ternary
component systems of pb+2, Cu+2 and Cd2+ onto PC
are shown in Figure 12, whereas Table 7 represents
the parameters of each used model and the square of
the correlation coefficient (R2) are also shown in this
Table.
Model Parameters Pb2+ Cu2+ Cd2+
Freundlich
Kf,
(mg/g)(L/mg
)(1/n)
3.851 2.729 1.511
n 1.304 1.604 1.464
R2 0.991 0.985 0.982
Langmuir
qm(mg/g) 76.104 33.288 30.254
b(L/mg) 0.045 0.060 0.034
R2 0.994 0.993 0.992
RL 0.307 0.249 0.373
Redlich–
Peterson
KRP(mg/g
L/mg)
0.098 1.962 0.029
aRp(L/mg)mR -0.976 0.052 -0.989
β -0.009 1.037 -0.014
R2 0.989 0.990 0.975
Combinatio
n of
Langmuir-
Freundlich
qm (mg/g) 75.026 30.996 21.498
b (L/mg)1/n 0.046 0.061 0.030
n 0.995 0.951 0.7852
R2 0.993 0.991 0.990
Khan
Qmax (mg/g) 40.285 31.790 28.921
bk,(L/mg) 0.088 0.063 0.035
ak 0.653 0.973 0.969
R2 0.993 0.992 0.989
References
Cd2+
qm
(mg/g)
Cu2+
qm
(mg/g)
Pb2+
qm
(mg/g)
Adsorbent
[39] 1.14 Kaolinite
[40] 0.144 0.169 Sand
[32] 69.2 80.6
Dried
activated
sludge
[41] 243.9 Crab shell
[42] 5.17 Natural
zeolite
[43] 16.7 58.1 Rice husk
[44] 52.21 Activated
carbon
[45] 2.32 8.00 modified
diatomite
[46] 1.814 Phosphate
rock
[47] 2.445 Cement
Kiln Dust
Present
study 30.254 33.288 76.104 PC
[Hamadi, 3(7): July, 2014] ISSN: 2277-9655
Scientific Journal Impact Factor: 3.449
(ISRA), Impact Factor: 1.852
http: // www.ijesrt.com (C)International Journal of Engineering Sciences & Research Technology
[245-257]
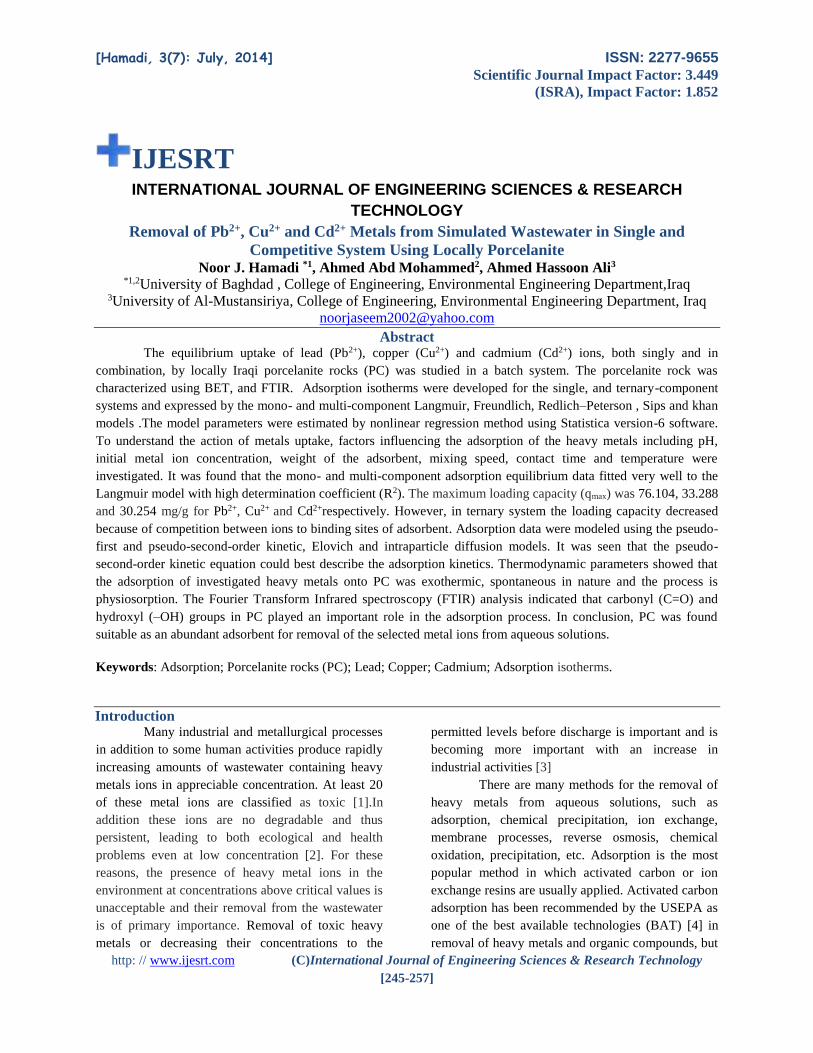
Figure 12: Adsorption isotherms of (Pb2++ Cu2+ + Cd2+)
in ternary system onto PC
Table 7: Parameters of ternary systems solutes isotherms
for Pb2+, Cu2+ and Cd2+ ions onto PC.
For ternary system, Table 7 and Figure 12 show that,
extended Langmuir model seems to give the best fitting for
the experimental data for metal ions adsorption in
combined system. There is a weak competition in ternary
systems in the adsorption capacity of Lead, whereas the
uptake of Copper and Cadmium is much reduced by the
presence of Lead solute due to high affinity between Lead
and PC as cleared from Figure12.
7. Conclusions In batch adsorption studies, data showed that
Porcelinate rocks had considerable potential for the
removal of lead, copper and cadmium from aqueous
solution. Langmuir isotherm was fitted very well with
experimental data. From the Langmuir isotherm, the
maximum adsorption capacity of the PO sample was found
as 76.104, 33.288 and 30.254 for Pb2+, Cu2+ and Cd2+
respectively for single system (Pb2+>Cu2+>Cd2+). However,
for combined system the adsorption capacity decreased
Due to competitive between ions toward
adsorbent surface. Optimum adsorption conditions for ions
removal are as follows: pH 4, contact time 240 min,
adsorbent mass= 0.7 ,1.2,1.3g for Pb2+,Cu2+,Cd+2
respectively , mixing speed 250 rpm. The maximum
adsorption capacity of the Porcelinate rock was found to
decrease as the temperature increases. It was clear that the
adsorption kinetics of metal ions to porcelinate rock obeyed
pseudo-second order adsorption kinetics. The adsorption
reaction was found to have negative values of both ΔHo and
ΔSo. This suggests an exothermic reaction and an increase
in randomness at the solid-liquid interface during the
adsorption of metal ions onto the adsorbent. The
interactions are thermodynamically favorable and are
accompanied by increase in Gibbs energy. Thus,
thermodynamic parameters showed that adsorption of Pb2+,
Cu2+ and Cd2+ on porcelinate rock was spontaneous in
nature and that the process is physiosorption. The results
obtained indicate that it is possible to design a continuous
process for wastewater treatment by adsorbing the ions.
This continuous process will be subjected of further
investigations in our labs.
References 1. L. De Oliveria Franco, R. De Cussia, Maia,
C. Porto, A.L. Sacconi Messias, F. A. K.
Fukushima, and G.M. De Campos-Takak,
"Heavy metals biosorption by chitosan
isolated from cunninghamella elegans (IFM
46109)", Brazilian J. Microbiol., 35, 243–
247, 2004.
2. BW Atkinson, F. BUX, and
HC.Kasan,"Bioremediation of metal-
contaminated industrial effluents using
waste sludges". Water Sci. Technol. 34(9),
9-15, 1998.
3. S.M. Lee, and A.P.Davis, "Removal of
Cu(II) and Cd(II) from aqueous solution by
seafood processing waste sludge", Water
Res. 35 (2) 534–540, 2000.
4. C. D. Adams, and T. L.Watson,"Treatability
of s-triazine herbicide metabolites using
powdered activated carbon", Journal of
environmental engineering, 327-330, 1996.
5. M.M. Swamy, I.D. Mall, B. Prasad, and I.M.
Mishra," Sorption characteristics of O-
cresol on bagasse fly ash and activated
Ternary system
Model Parameter
s Pb2+ Cu2+ Cd2+
Extended
Langmuir
qm (mg/g) 54.519 19.300 16.583
b (L/mg) 0.053 0.045 0.038
R2 0.994 0.990 0.989
RL 0.272 0.309 0.347
Extended
Freundlich
KF,(mg/g)(
L/mg)1/n 1.995 1.007 0.707
n 1.308 1.551 1.508
R2 0.988 0.984 0.984
Redlich-
Peterson
kRp(mg/g) 120.122 47.709 24.598
aRp(L/mg) ß
0.006 -0.010 0.007
ß 1.227 1.229 1.096
R2 0.989 0.988 0.971
Combination
of Langmuir-
Freundlich
qm (mg/g) 34.431 14.5273 11.178
b (L/mg) 0.0708 0.045 0.0272
` n 0.791 0.807 0.7389
R2 0.993 0.989 0.983
0 5 10 15 20 25 30 35 40 45
Var1
0
5
10
15
20
25
30
35
CoPb2+, Cu
2+, Cd
2+= 50 mg/L
Extended Langmuir model
Ce mg/L
(mg/L)
Cu2+
Pb2+
2+Cd
qe
(mg
/g)
[Hamadi, 3(7): July, 2014] ISSN: 2277-9655
Scientific Journal Impact Factor: 3.449
(ISRA), Impact Factor: 1.852
http: // www.ijesrt.com (C)International Journal of Engineering Sciences & Research Technology
[245-257]
carbon” , Indian J. Env. Hlth., 40 (1), 67-
78, 1998.
6. G. Yan and T. Viraraghavan, "Heavy metal
removal from aqueous solution by fungus
Mucorrouxii", Water Res., 37, 4486–4496,
2003.
7. M.I Kandah,"The potential use of low-grade
phosphate rocks as adsorbent", Chem. Eng.
Techol., 25 921–924, 2002.
8. K.H. Chu, "Removal of copper from
aqueous solution by chitosan in prawn shell:
adsorption equilibrium and kinetics", J.
Haz. Mat., 90, 77–95, 2002.
9. R. Naseem, and S.S. Tahir, "Removal of Pb
(II) from aqueous/acidic solutions by using
bentonite as an adsorbent". Water Res.,
35(16) 3982–3986, 2001.
10. J. Peric, M. Trogo and N.
VukojevicMedvidovic, "Removal of zinc,
copper and lead by natural zeolite: a
comparison of adsorption isotherms". Water
Res., 38, 1893–1899, 2004.
11. S. Babel, and T.A. Kurniawan, "Low-cost
adsorbents for heavy metals uptake from
contaminated water: review", J. Haz. Mat.,
B97, 291–243, 2003.
12. F. Veglio, F. Beolchini, and M.
Prisciandano,"Sorption of copper by
olivemill residues", Water Res., 37, 4895–
4903,2003.
13. C.-J. Lin, and J.-E. Chang," Effects of fly
ash characteristics on the removal of Cu (II)
from aqueous solution", Chemosphere, 44,
1185–1192,2001.
14. G.S.Gupta, G. Prasad, and V.N. Singh,"
Removal of chrome dye from aqueous-
solutions by mixed adsorbents- fly ash and
coal",Water Res., 24 45–50, 1990.
15. N. Khalid, Ahmad, S. Kiani, S.N. and J.
Ahmed," Removal of mercury from aqueous
solutions by adsorption to rice husks", Sep.
Sci. Technol., 34(16) 3139–3153, 1999.
16. T.W. Tee, and A.R.M. Khan, "Removal of
lead, cadmium and zinc by waste tea
leaves", Environ.Technol. Lett., 9(11)1223–
1232, 1988.
17. P.D. Johnson, M.A. Watson, J. Brown, and
I.A. Jefcoat, " Peanut hull pellets as a single
use sorbent for the capture of Cu (II) from
wastewater", Waste Management, 22, 471–
480, 2002.
18. P.Solori, A. Zouboulis, K. Matrix, and G.
Stalidis,"Removal of toxic metals by
biosorption onto nonliving sewage
sludge."Sep. Sci. Technol., 31 1075–1092,
1996.
19. D.R.U. Knappe, A. Rossner, S.A. Snyder
and C. Strickland, "Alternative Adsorbents
for the Removal of Polar Organic
Contaminants", American Water Works
Association Research Foundation, Denver,
Colorado, 2007.
20. A., Hammaini, F. A., Ballester, M.L.
Blazquez, and J.A. Munoz, " Biosorption of
heavy metals by activated sludge and their
desorption characteristics", J. Environ.
Manage., 84(4) 419-426, 2006.
21. K.Vijayaraghavan, and YS. Yun,
"Biosorption of C.I. Reactive Black 5 from
aqueous solution using acid-treated biomass
of brown seaweed Laminaria sp" Dyes Pigm
76, 726–32, 2008.
22. Z. Aksu, and D. Akpınar, "Modelling of
simultaneous biosorption of phenol and
nickel(II) onto dried aerobic activated
sludge", Separation and Purification
Technology 21, 87–99, 2000
23. A. Fahmi, and K., Munther, "Competitive
adsorption of Nickel and Cadmium on sheep
monure waste, Experimental and Prediction
Studies",SeparationScience and Technology,
Vol. 38(2), pp. 483-497,2003.
24. J., Febrianto, A. N., Kosasih , J., Sunarso,
Y-H Ju,., N., Indraswati , and S. Ismadji, "
Equilibrium and kinetic studies in
adsorption of heavy metals using
biosorbent: A summary of recent studies-
Review" J. Hazard. Mater., 162, 616-
645,2009.
25. B. Kiran, and A. Kaushik,"Chromium
binding capacity of Lyngbya putealis
exopolysaccharides", Biochem. Eng., J. 38,
47-54,2008.
26. H., Tang, W. Zhou, and L. Zhang,
"Adsorption isotherms and kinetics studies
of malachite green on chitin hydrogels", J.
Hazard. Mater., 218– 225, 2012.
27. DS. Soejoko, and MO. Tjia," Infrared
spectroscopy and X-ray diffraction study on
the morphological variations of carbonate
and phosphate compounds in giant prawn
(Macrobrachium rosenbergii) skeletons
during its moulting period", J. Mater. Sci.
38, 2087–2093, 2002.
28. A.I., Zouboulis, M.X. Loukidou, and K.A.

[Hamadi, 3(7): July, 2014] ISSN: 2277-9655
Scientific Journal Impact Factor: 3.449
(ISRA), Impact Factor: 1.852
http: // www.ijesrt.com (C)International Journal of Engineering Sciences & Research Technology
[245-257]
Matis," ‘Biosorption of toxic metals from
aqueous solutions by bacteria strains
isolated from metal-polluted soils’", Process
Biochem., 39, 909–916,2004
29. A. Setatnia, A. Madami, M.Z. Bakhti, L.
Keryous, Y. Mansouri, and R. Yous,
"Biosorption of Ni2+ from aqueous solution
by a NaOH treated bacterial dead
Streptomicesrimosus biomass", Minerals
Eng., 17, 903-911, 2004.
30. M.A. Martin-Lara, F. Herninz, M. Calero,
G. Blzquez, and G. Tenorio,"
Surfacechemistry evaluation of some solid
wastes from olive-oil industry used for lead
removal from aqueous solutions", Biochem.
Eng. J., 44, 151-159, 2009.
31. B. Yasemin, and Z. Tez, "Adsorption
studies on ground shells of hazelnut and
almond", J. Hazazrdous Materials,
149(1)35-41,2007.
32. Z. Al-Qodah,"Biosorption of heavy metal
ions from aqueous solutions by activated
sludge". Desalination J., 196, 164-176,
2006.
33. S.D. Kumar, V. M. Subbaiah, A. S. Reddy,
and A. Krishnaiah, " Biosorption of phenolic
compounds from aqueous solutions onto
chitosan-abrusprecatorius blended beads". J
ChemTechnolBiotechnol., 84, 972-981,
2009.
34. K.L., Dorris, B., Yu, Zhang, Y. Shukla, and
S.S. Shukla," The removal of heavy metal
from aqueous solutions by sawdust
adsorption-removal of copper".,, J.
Hazardous Materials, B80 33-42, 2000.
35. A. H. Ali, "Performance of
Adsorption/Biosorption for Removal of
Organic and Inorganic Pollutants", Thesis,
University of Baghdad, college of
engineering, 2011.
36. Y. Sag and T. Kutsal, "Determination of the
biosorption heats of heavy metal ions on
Zoogloea and Rhizopusarrhizus", Biochem.
Eng. J., 6, 145-151, 2000.
37. B. Zubeyde, C. Ercan, and D. Mehmet,
"Equilibrium and thermodynamic studies on
biosorption of Pb(II) onto Candida albicans
biomass",J Hazard Mater 161, 62–67, 2009.
38. A.H Sulaymon, K.W. Ahmed,"Competitive
adsorption of furfural and phenolic
compounds onto activated carbon in fixed
bed column". Environ SciTechnol 42(2),
392–397, 2008.
39. V. Chantawong, N.W. Harvey and V.N.
Bashkin, "Comparison of heavy metal
adsorptions by thai kaolin and ballclay",
Asian Journal of Energy &
Environmental.1, 33–48, 2001.
40. M. A. Awan, I. A. Qazi, I. Khal, "Removal
of heavy metals through adsorption using
sand", Journal of environmental science 15,413-416, 2003.
41. K. Vijayaraghavan, KPalanivelu and M.
Velan, "Biosorption of copper (II) and
Cobalt (II) from aqueous solution by crab
shell particles", Bioreour technol. 97, 1411-
1419, 2006.
42. M. Minceva, L. Markovska, and V.
Meshko, "Removal of Zn2+, Cd2+ and Pb2+
from binary aqueous solution by natural
zeolite and granulated activated carbon",
Macedonian Journal of Chemistry and
Chemical Engineering, 26(20) 125–134,
2007.
43. K. K. Krishnani, X. Meng, C.
Christodulatos, and M.Boddu, "Biosorption
mechanism of nine different heavey metals
onto biomatrix from rice husk",
J.Hazard.Mater..153, 1222-1234, 2008.
44. H. M. Abdul-Hameed,."Competitive
adsorption of heavy metals onto activated
carbon in fixed bed column", Ph.D. Thesis
,University of Baghdad, College of
Engineering, 2009.
45. P. Pookmanee, P. Thippraphan and S.
Phanichphant, "Removal of Heavy Metals
from Aqueous Solution by Natural and
Modified Diatomit", Journal of the
Microscopy Society of Thailand .4, 103-
107, 2011.
46. M.K. Razi and S. Yahyaabadi, "Adsorption
consideration of Ni+2,Fe2+,Cr3+ and Co2+ by
phosphate ore and it is concentrate from
solution in isotherm model", International
Journal of Research and Reviews in Applied
Sciences.10, 397-406, 2012.
47. Y. Swesi, A. Elmeshergi, A. Elalem and W.
Alfoghy, "Utilization of Cement Kiln Dust in
AdsorptionTechnology", International
Journal of Chemical, Materials Science and
Engineering .7 ,14-16, 2013.
Copyright © 2022 FDOKUMEN


![Complexes with lignin model compound vanillic acid. Two different carboxylate ligands in the same dinuclear tetracarboxylate complex [Cu2(C8H7O4)2(O2CCH3)2(CH3OH)2]](https://static.fdokumen.com/doc/165x107/634161588e4a224f800682ce/complexes-with-lignin-model-compound-vanillic-acid-two-different-carboxylate-ligands.jpg)


![Diverse coordination of two ligands in ferromagnetic [Cu(μ-HCO2)2(3-pyOH)]n and [Cu2(μ-HCO2)2(μ-3-pyOH)2(3-pyOH)2(HCO2)2]n](https://static.fdokumen.com/doc/165x107/634161422ac0ffbf8a091276/diverse-coordination-of-two-ligands-in-ferromagnetic-cum-hco223-pyohn-and.jpg)