Immunoreactivity of some epitopes in longtime inappropriately stored paraffin-embedded tissues
Upload
independentCategory
view
2download
0
Int. J. Electrochem. Sci., 6 (2011) 6410 - 6423
International Journal of
ELECTROCHEMICAL SCIENCE
www.electrochemsci.org
Direct Quantification of Cu2+
in Cachaça Using a Solid Paraffin-
Based Carbon Paste Electrode Chemically Modified with 2-
Aminothiazole-Silica-Gel
Dayane A. Costa, Regina M. Takeuchi, André L. Santos*
Faculdade de Ciências Integradas do Pontal, Universidade Federal de Uberlândia, Rua 20, 1600, Bairro
Tupã, Ituiutaba, Minas Gerais, CEP 38304402, Brasil. *E-mail: [email protected]
Received: 13 October 2011 / Accepted: 3 November 2011 / Published: 1 December 2011
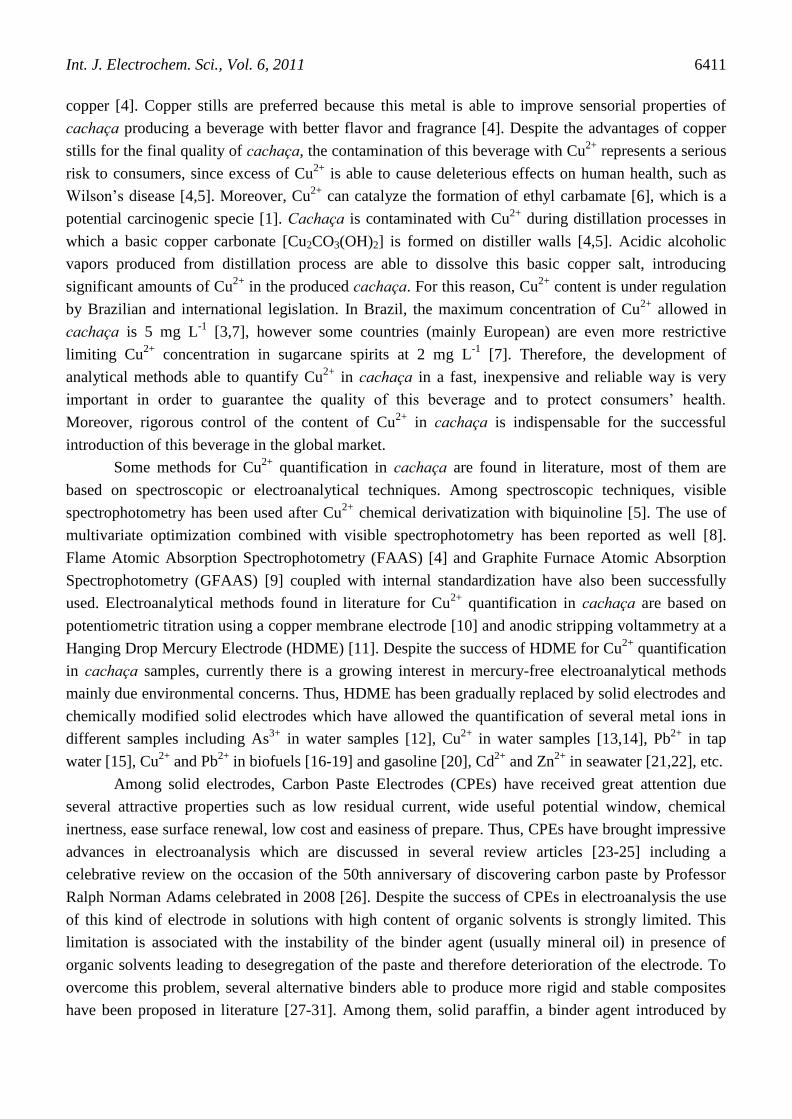
A solid paraffin-based carbon paste electrode modified with 2-aminothiazole-silica-gel (SPCPE-SiAt)
was used for direct quantification of Cu2+
in sugarcane spirits (cachaça) samples by anodic stripping
voltammetry. The composite formed between carbon powder and solid paraffin was totally stable in
ethanol/water mixtures enabling the quantification of Cu2+
directly in the samples without any
pretreatment procedure. Under optimized conditions, LOD and LOQ were, respectively 1.8 µmol L-1
(0.11 mg L-1
) and 5.4 µmol L-1
(0.33 mg L-1
). These values are remarkably below the maximum Cu2+
content allowed by Brazilian (5 mg L-1
) and European legislation (2 mg L-1
). This fact strongly
suggests that the proposed method can be adopted for cachaça quality control regarding Cu2+
content.
Four commercial samples were analyzed by using the proposed method and the results were compared
with those obtained from FAAS official method. t-test has shown that there are no statistical
differences between the results provided by both methods at 95% confidence level. In addition, F-test
showed that the precision of these methods are statistically equivalent. These results are a clear
demonstration of the good accuracy of the proposed electroanalytical method.
Keywords: Cachaça, Copper determination, Anodic Stripping Voltammetry, Carbon Paste electrode,
2-Aminothiazole silica gel
1. INTRODUCTION
Brazilian sugarcane spirits, whose name is established by Brazilian legislation as cachaça, is an
alcoholic beverage containing from 38 to 48% ethanol by volume [1,2]. Cachaça industry plays an
important role on Brazilian economy since it is responsible for generation of almost 0.5 million direct
jobs producing more than US$ 2 billion per year [1,3]. Cachaça is produced by distillation of
previously fermented sugarcane juice and this process is usually conducted in distillers fabricated with
Int. J. Electrochem. Sci., Vol. 6, 2011
6411
copper [4]. Copper stills are preferred because this metal is able to improve sensorial properties of
cachaça producing a beverage with better flavor and fragrance [4]. Despite the advantages of copper
stills for the final quality of cachaça, the contamination of this beverage with Cu2+
represents a serious
risk to consumers, since excess of Cu2+
is able to cause deleterious effects on human health, such as
Wilson’s disease [4,5]. Moreover, Cu2+
can catalyze the formation of ethyl carbamate [6], which is a
potential carcinogenic specie [1]. Cachaça is contaminated with Cu2+
during distillation processes in
which a basic copper carbonate [Cu2CO3(OH)2] is formed on distiller walls [4,5]. Acidic alcoholic
vapors produced from distillation process are able to dissolve this basic copper salt, introducing
significant amounts of Cu2+
in the produced cachaça. For this reason, Cu2+
content is under regulation
by Brazilian and international legislation. In Brazil, the maximum concentration of Cu2+
allowed in
cachaça is 5 mg L-1
[3,7], however some countries (mainly European) are even more restrictive
limiting Cu2+
concentration in sugarcane spirits at 2 mg L-1
[7]. Therefore, the development of
analytical methods able to quantify Cu2+
in cachaça in a fast, inexpensive and reliable way is very
important in order to guarantee the quality of this beverage and to protect consumers’ health.
Moreover, rigorous control of the content of Cu2+
in cachaça is indispensable for the successful
introduction of this beverage in the global market.
Some methods for Cu2+
quantification in cachaça are found in literature, most of them are
based on spectroscopic or electroanalytical techniques. Among spectroscopic techniques, visible
spectrophotometry has been used after Cu2+
chemical derivatization with biquinoline [5]. The use of
multivariate optimization combined with visible spectrophotometry has been reported as well [8].
Flame Atomic Absorption Spectrophotometry (FAAS) [4] and Graphite Furnace Atomic Absorption
Spectrophotometry (GFAAS) [9] coupled with internal standardization have also been successfully
used. Electroanalytical methods found in literature for Cu2+
quantification in cachaça are based on
potentiometric titration using a copper membrane electrode [10] and anodic stripping voltammetry at a
Hanging Drop Mercury Electrode (HDME) [11]. Despite the success of HDME for Cu2+
quantification
in cachaça samples, currently there is a growing interest in mercury-free electroanalytical methods
mainly due environmental concerns. Thus, HDME has been gradually replaced by solid electrodes and
chemically modified solid electrodes which have allowed the quantification of several metal ions in
different samples including As3+
in water samples [12], Cu2+
in water samples [13,14], Pb2+
in tap
water [15], Cu2+
and Pb2+
in biofuels [16-19] and gasoline [20], Cd2+
and Zn2+
in seawater [21,22], etc.
Among solid electrodes, Carbon Paste Electrodes (CPEs) have received great attention due
several attractive properties such as low residual current, wide useful potential window, chemical
inertness, ease surface renewal, low cost and easiness of prepare. Thus, CPEs have brought impressive
advances in electroanalysis which are discussed in several review articles [23-25] including a
celebrative review on the occasion of the 50th anniversary of discovering carbon paste by Professor
Ralph Norman Adams celebrated in 2008 [26]. Despite the success of CPEs in electroanalysis the use
of this kind of electrode in solutions with high content of organic solvents is strongly limited. This
limitation is associated with the instability of the binder agent (usually mineral oil) in presence of
organic solvents leading to desegregation of the paste and therefore deterioration of the electrode. To
overcome this problem, several alternative binders able to produce more rigid and stable composites
have been proposed in literature [27-31]. Among them, solid paraffin, a binder agent introduced by
Int. J. Electrochem. Sci., Vol. 6, 2011
6412
Kauffman and Petit [32,33] has attracted attention because it presents low cost and allows preparing
electrodes in a fast and simple way.
Our group has demonstrated that Solid Paraffin-based Carbon Paste Electrodes chemically
modified with 2-Aminothiazole-Silica gel (SPCPE-SiAt) are totally stable in ethanol media, which has
allowed the use of these electrodes for quantification of Cu2+
[34] and Ni2+
[35] directly in commercial
ethanol fuel samples. SPCPE-SiAt was very efficient to extract metal species from ethanol fuel
samples by chelation at 2-aminothiazole groups. After extraction, the electrode was transferred to an
electrochemical cell containing a supporting electrolyte in which the metallic specie accumulated at
electrode surface was detected by stripping voltammetry. This strategy was very efficient to prevent
interference effects. However, extraction step required a very long preconcentration time (20 min) to
achieve the desired sensitivity which led to very low analytical frequency. Cesarino et al. [36,37] have
demonstrated that the combination between chelating properties of organofunctionalized silica and
electrodeposition process is very efficient to preconcentrate metal ions at electrode surface in a fast
way. This strategy has allowed developing high analytical frequency and sensitive stripping
voltammetric methods for simultaneous determination of several metal ions in natural water and
ethanol fuel samples [36,37]. Recently, our group has demonstrated that this strategy is also efficient in
order to achieve fast and simultaneous anodic stripping voltammetric determination of Cu2+
and Pb2+
in water samples using a SPCPE-SiAt [38]. This work has also showed that the use of solid paraffin as
binder agent presents some advantages over mineral oil because solid paraffin produces a more robust
composite which presents lower background currents providing higher sensitivity and lower detection
limits (LOD).
Despite the highly attractive features of CPEs chemically modified with organofunctionalized
silica for Cu2+
quantification in sugarcane spirits samples, there is only one report about it in literature
using conventional CPEs prepared with mineral oil as binder agent [39]. To the best of our
knowledgement, the literature does not present works describing the use of a composite totally stable
in ethanolic solutions for Cu2+
determination directly in sugarcane spirits samples. This stability is very
important in order to develop a sensor with high lifetime. In this context this is the first work
describing de use of a SPCPE-SiAt for direct determination of Cu2+
in cachaça samples in a very fast
and sensitive way without any sample pretreatment procedure.
2. EXPERIMENTAL
2.1. Reagents
Stock solutions of copper were prepared from Cu2+
Atomic Absorption 1000 mg L−1
standard
solution (Fluka). 0.1 mol L−1
acetate buffer solutions (pH = 4.7) were used as supporting electrolyte in
all electrochemical experiments. All used solutions were prepared with ultrapure water (ASTM type I,
resistivity >18 MΩ cm) produced from a Megapurity®
water purification system. Absolute ethanol
(Vetec) was used to perform studies in ethanol:water mixtures.
Int. J. Electrochem. Sci., Vol. 6, 2011
6413
Silica gel (Merck) with specific surface area between 486-520 m2 g
−1 and average pore
diameter of 0.6 nm was used to construct SPCPE-SiAt. 2-aminothiazole (Aldrich) was used to achieve
silica functionalization. The 2-aminothiazole organofunctionalized silica gel was prepared according to
the procedure previously described by Roldan et al.[40] Spectroscopic carbon powder with 1-2 μm
particle size from Merck was used to obtain the SPCPEs. Solid paraffin from Synth was used as the
binder agent.
2.2. Apparatus
Differential pulse anodic stripping voltammetry was performed using a μAUTOLAB type III
potentiostat/galvanostat coupled to a microcomputer and controlled by GPES 4.9 software.
Electrochemical experiments were performed at room temperature in an one-compartment
electrochemical cell filled with 10 mL of analyzed solution. A three electrode system comprising a
platinum wire auxiliary electrode, a KCl saturated-Ag/AgCl (AgClsat) reference electrode and a
homemade SPCPE working electrode was used in all electrochemical experiments. FAAS experiments
carried out for comparative purposes were performed at a SHIMADZU-FAAS spectrophotometer
model AA-680.
2.3. Electrode preparation
SPCPEs-SiAt were prepared by hand-mixing 2-aminothiazole functionalized silica and carbon
powder at the ratio 20%:40% (w:w). This mixture was homogenized in a mortar and pestle for 20 min
and subsequently it was added to melted paraffin whose mass percentage was always kept at 40%. This
new mixture was again homogenized in a thermostated bath (65-75oC) for 10 min. This final mixture
was placed in an insulin syringe (internal diameter of 5 mm) containing a copper piston to provide
electric contact. Appropriate packing was achieved by pressing the composite against a weighing paper
placed on a flat piece of glass. Before their first use, all electrodes were hand-polished on a weighing
paper until a smooth surface was obtained.
2.4. Analytical procedure
Before their utilization, SPCPEs-SiAt were preconditioned by applying +0.35 V vs. Ag/AgClsat
for 60 s. This electrochemical procedure was adopted after each measurement.
The analytical procedure comprised three steps: 1) metallic ions electrodeposition at SPCPE-
SiAt, 2) differential pulse anodic stripping voltammograms recording, 3) electrochemical surface
regeneration by applying +0.35 V vs. Ag/AgClsat for 60 s. All these steps were conducted directly in
cachaça samples containing supporting electrolyte (acetate buffer 0.1 mol L-1
). Analytical parameters
involved in the proposed method were submitted to optimization studies which were conducted in a
spiked cachaça sample. This procedure was adopted in order to keep the conditions in optimization
studies as close as possible to real analysis conditions. Four cachaça samples were analyzed by the
Int. J. Electrochem. Sci., Vol. 6, 2011
6414
proposed method and the obtained results were compared with those obtained by official method
according Brazilian legislation (NBR-13921 [41]). In order to keep sample properties almost
unchanged for voltammetric analyses, acetate buffer was prepared by adding the reagents directly in
the sample. This procedure avoids drastic sample dilution because just 58 μL of glacial acetic acid and
136 mg of H3CCOONa.3H2O were added to 10 mL of the sample. No additional sample pretreatment
was adopted.
3. RESULTS AND DISCUSSION
3.1. Preliminary studies
In a previous work [34] we have demonstrated that the best composition of SPCPEs-SiAt is
40% (m/m) of solid paraffin, 40% (m/m) of carbon powder and 20% (m/m) of SiAt. We have observed
that higher contents of SiAt lead to a decrease in peak currents for copper and provide poor
voltammetric profiles.
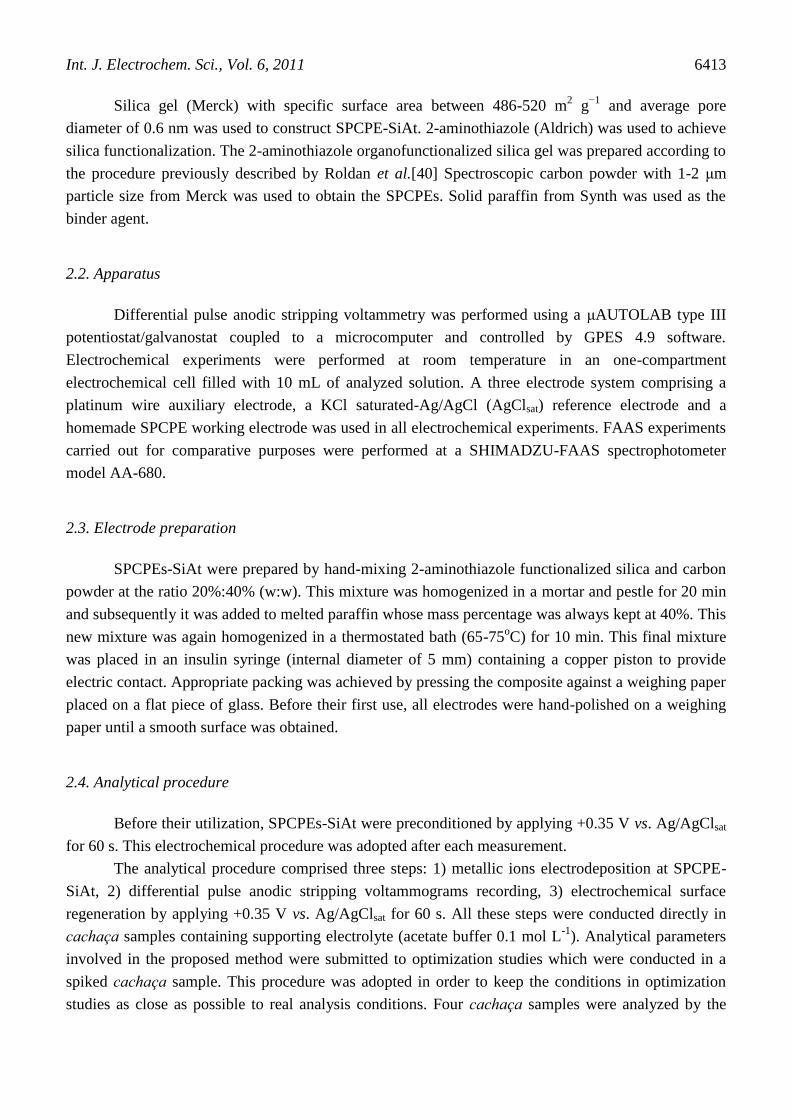
Figure 1. Differential pulse anodic stripping voltammograms recorded in a mixture ethanol:water
(40:60 v/v) containing 0.1 mol L−1
acetate buffer solution (pH = 4.7) spiked with 25 µmol L−1
Cu2+
. Accumulation potential: −0.3 V; accumulation time: 180 s. Scan rate: 10 mV s−1
; pulse
amplitude: 50 mV; pulse width: 25 ms. (—) SPCPE-Si(20%). (—) SPCPE-SiAt(20%).
These observations are probably associated to an increase in electrical resistance of the
electrode promoted by the replacement of conductive carbon powder by non-conductive SiAt. On the
other hand, SiAt contents lower than 20% (m/m) led to lower sensitivity. Solid paraffin contents have a
strong influence on the mechanical strength of the composite. It was observed that contents lower than
40% (m/m) lead to unacceptably fragile composites. Higher solid paraffin contents have produced
highly resistive composites which forbid their practical application as electrodes. Therefore, based on
Int. J. Electrochem. Sci., Vol. 6, 2011
6415
our previous experience, SPCPEs-SiAt containing 40% (m/m) of solid paraffin, 40% (m/m) of carbon
powder and 20% (m/m) of SiAt were also used in the present work.
Initially, the voltammetric response of copper at SPCPE-SiAt(20%) was compared with that
observed at a non-functionalized SPCPE-silica (SPCPE-Si). This study was performed in a mixture
ethanol:water (40:60 v/v) containing acetate buffer and spiked with 25 µmol L-1
of Cu2+
. Differential
pulse anodic stripping voltammograms obtained in this study are presented in Figure 1.
Figure 1 shows that copper anodic stripping voltammetric peaks are observed not only at
SPCPE-SiAt(20%) but also at SPCPE-Si(20%) indicating that both electrodes are able to detect
copper. These peaks are not observed when the same experiments are performed in absence of Cu2+
(data not shown). From the voltammograms presented at Figure 1 it can be observed double peaks
associated with the anodic stripping of copper. These double peaks are observed at both electrodes at
+0.3 V (main peak) and at +0.44 V (secondary peak). It is important to mention that in a previous work
we have observed that this secondary peak is absent at a non modified SPCPE when the
preconcentration step is performed in a totally aqueous solution [38]. Moreover we have observed that
if preconcentration step is performed at open circuit conditions in ethanol media the secondary peak is
also absent [34]. Thus, although the origin and nature of these double peaks are not completely
understood we can conclude that they are dependent on both the presence of silica or
organofunctionalized silica at electrode surface and the procedure adopted for copper accumulation.
The secondary peak is probably a copper adsorption post-peak which is present only when the
experimental conditions enable very strong adsorption, i.e. electrodeposition at SPCPE-SiAt/Si.
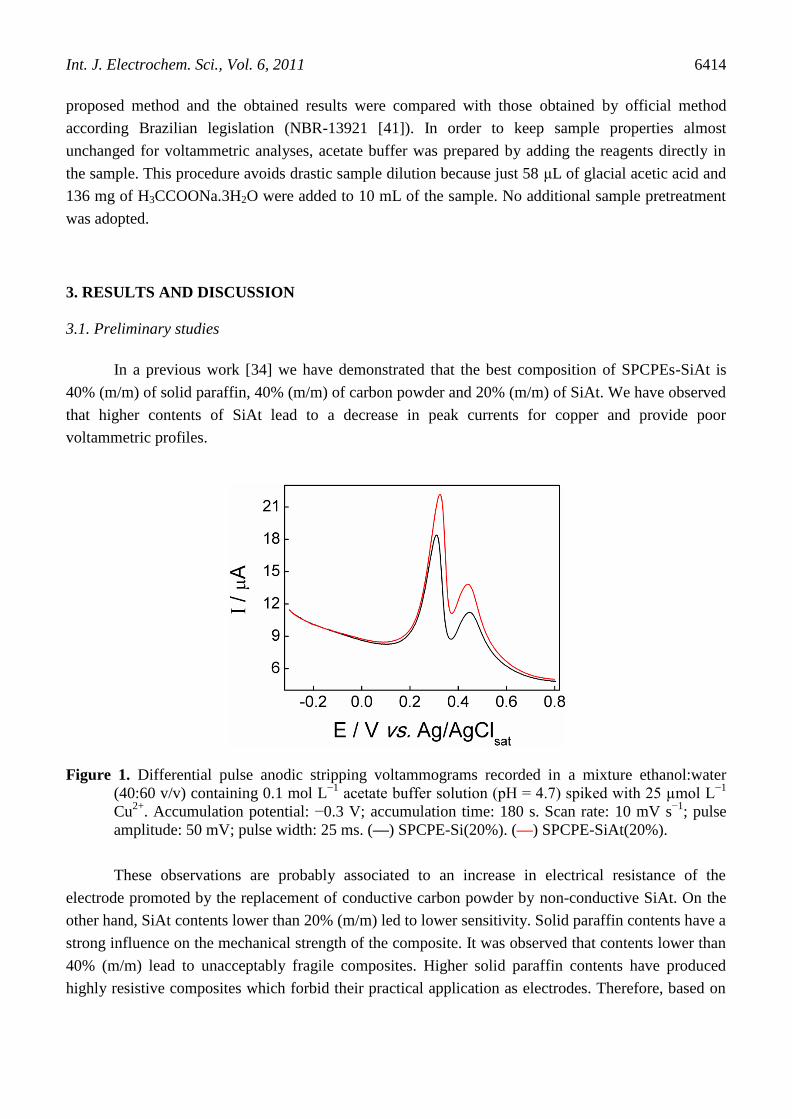
Figure 2. Successive differential pulse anodic stripping voltammograms recorded in a cachaça sample
containing acetate buffer 0.1 mol L-1
(pH = 4.7) and spiked with 2 µmol L-1
Cu2+
.
Accumulation potential: −0.4 V; accumulation time: 180 s. Scan rate: 10 mV s−1
; pulse
amplitude: 50 mV; pulse width: 25 ms. (—) 1st (—) 2
nd (—) 3
rd (—) 4
th voltammetric scan.
Int. J. Electrochem. Sci., Vol. 6, 2011
6416
Only the main peak at +0.3 V was used for analytical studies due its higher intensity which
allows the development of a more sensitive electroanalytical method. Peak currents (ip) for this peak
were calculated from a linear extrapolation of its pre-peak baseline. Figure 1 clearly shows that
SPCPE-SiAt provides higher sensitivity than SPCPE-Si and therefore the organofunctionalized silica
presents analytical advantages over non-functionalized silica for copper quantification. It was observed
that ip provided by SPCPE-SiAt is approximately 34% higher than that obtained with Si-SPCPE which
is a considerable gain in sensitivity. This increase of ip is a demonstration that the combination
between electrodeposition and chelation at 2-aminothiazole is efficient to improve the sensitivity.
After the demonstration that SPCPE-SiAt presents better analytical performance than
SPCPE-Si, the repeatability of the voltammetric measurements was evaluated. This study was
performed in a cachaça sample containing acetate buffer 0.1 mol L-1
and spiked with 2 µmol L-1
Cu2+
.
Figure 2 presents the successive differential pulse anodic stripping voltammograms obtained in this
study. From Figure 2 it can be observed a continuous increase on ip values for successive cycles,
indicating that copper previously accumulated at electrode surface is not completely removed during
the voltammetric scan. This behavior can be explained regarding copper is oxidized to Cu2+
during the
voltammetric measure and this ionic form can partially remain adsorbed onto electrode surface via
chelation at S and N atoms of 2-aminothiazole groups leading to the observed memory effect. The
results presented in Figure 2 clearly show that these experimental conditions lead to unacceptably low
repeatability. In order to overcome this limitation, an electrochemical regeneration step was introduced
which consists in the application of +0.35 V during 60 s under constant stirring. This procedure has
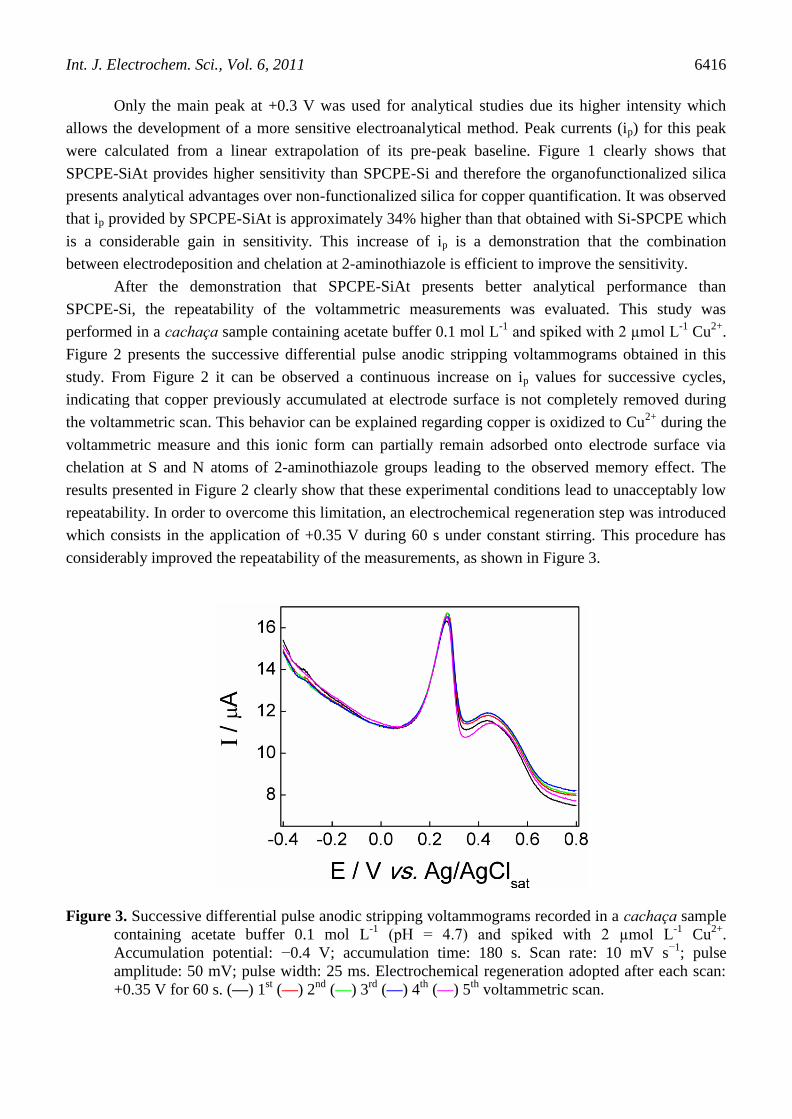
considerably improved the repeatability of the measurements, as shown in Figure 3.
Figure 3. Successive differential pulse anodic stripping voltammograms recorded in a cachaça sample
containing acetate buffer 0.1 mol L-1
(pH = 4.7) and spiked with 2 µmol L-1
Cu2+
.
Accumulation potential: −0.4 V; accumulation time: 180 s. Scan rate: 10 mV s−1
; pulse
amplitude: 50 mV; pulse width: 25 ms. Electrochemical regeneration adopted after each scan:
+0.35 V for 60 s. (—) 1st (—) 2
nd (—) 3
rd (—) 4
th (—) 5
th voltammetric scan.
Int. J. Electrochem. Sci., Vol. 6, 2011
6417
The objective of the electrochemical regeneration is to keep the electrode positively charged
removing Cu2+
from electrode surface by electrostatic repulsion. The electrochemical regeneration was
very efficient to remove copper from electrode surface which was demonstrated by the good
repeatability observed when this procedure was adopted. Adopting this electrochemical regeneration
procedure and using the same electrode surface, it was observed a relative standard deviation (RSD)
for ip values of 1.9% (n = 5). Besides its efficiency, the electrochemical regeneration is very practical,
because it avoids excessive electrode manipulation and polishing after each measure, contributing to
decrease the time consumed in the analyses.
3.2. Optimization of operational parameters
As above mentioned, the composition of SPCPE-SiAt was not submitted to optimization
studies, based on our previous experience with this kind of electrode the following composition was
chosen for analytical applications: 40% (m/m) of solid paraffin, 40% (m/m) of carbon powder and
20% (m/m) of SiAt. Supporting electrolyte was also not submitted to optimization studies. It is well
known that a slight acidic media is the most appropriated for stripping analysis of metals because this
media prevents metal ion hydrolysis. Extremely low pH values must be avoided because they promote
intensive hydrogen evolution during electrodeposition step leading to poor sensitivity. In addition,
intensive hydrogen evolution could promote composite desegregation damaging electrode surface and
comprising the repeatability. Finally extremely acidic medium should be avoided because in this
condition N and S atoms from 2-aminothiazole would be protonated making impossible the
preconcentration of metallic cations. Thus, a pH close to 5 seems to be the most appropriate to perform
metal voltammetric stripping analysis. Buffer acetate is very effective in this region of pH, therefore it
was selected as supporting electrolyte in this work.
All other operational parameters involved in the analytical procedure were optimized. The first
optimized parameter was preconcentration time (tpc). This study was conducted in a cachaça sample
containing acetate buffer 0.1 mol L-1
and spiked with 2 µmol L-1
Cu2+
. Preconcentration potential (Epc)
was kept at −0.2 V. The effect of preconcentration time was evaluated from 60 to 300 s, higher
preconcentration time were not evaluated because the objective of this work is to develop an analytical
method with high analytical frequency. Moreover, the content of copper in commercial samples is
relatively high making unnecessary long preconcentration times. In the studied range, a linear
relationship between ip and preconcentration time was observed according to the equation:
ip(µA) = −0.02 + 1.41 tpc (min) with linear correlation coefficient (R) equal to 0.9986. In order to
obtain the best compromise between sensitivity and analytical frequency, tpc = 180 s was adopted in
subsequent studies.
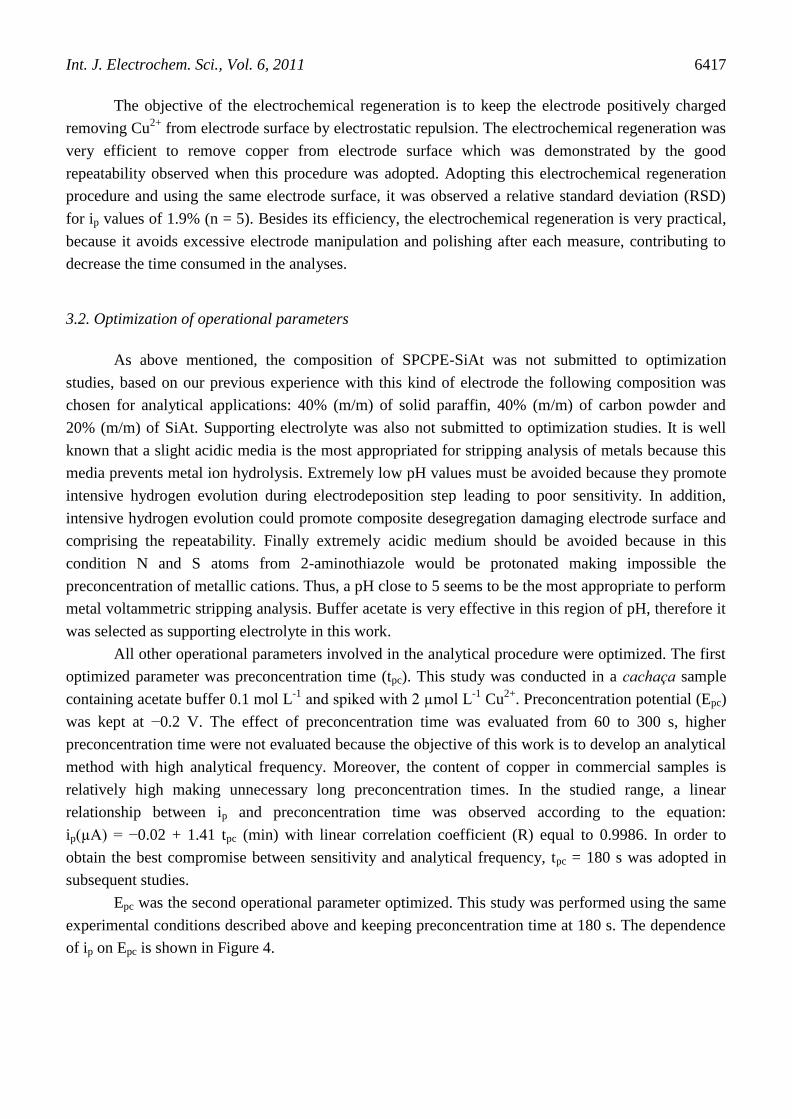
Epc was the second operational parameter optimized. This study was performed using the same
experimental conditions described above and keeping preconcentration time at 180 s. The dependence
of ip on Epc is shown in Figure 4.
Int. J. Electrochem. Sci., Vol. 6, 2011
6418
Figure 4. Dependence of ip on Epc. Ip values obtained from differential pulse anodic stripping
voltammograms recorded in a cachaça sample containing acetate buffer 0.1 mol L-1
(pH = 4.7)
and spiked with 2 µmol L-1
Cu2+
. Accumulation time: 180 s. Scan rate: 10 mV s−1
; pulse
amplitude: 50 mV; pulse width: 25 ms. Electrochemical regeneration adopted after each scan:
+0.35 V for 60 s.
From Figure 4 it can be observed that Epc more negative than −0.3 V are unable to improve
sensitivity. On the other hand potentials less negative than −0.3 V have caused a remarkable decrease
on ip values, compromising the sensitivity. Regarding that excessively negative potentials can
compromise selectivity in voltammetric stripping analysis, Epc = −0.3 V was adopted in subsequent
experiments.
The parameters involved in DPV were also submitted to optimization studies, keeping the same
experimental conditions above described and the other operational parameters were kept at the
previously optimized values. These optimization studies were conducted in order to achieve the best
compromise between peak width and peak intensity. Following this criteria the best voltammetric
conditions found were: pulse amplitude of 50 mV, pulse width of 25 ms and scan rate equal 10 mV s-1
.
3.3. Analytical studies
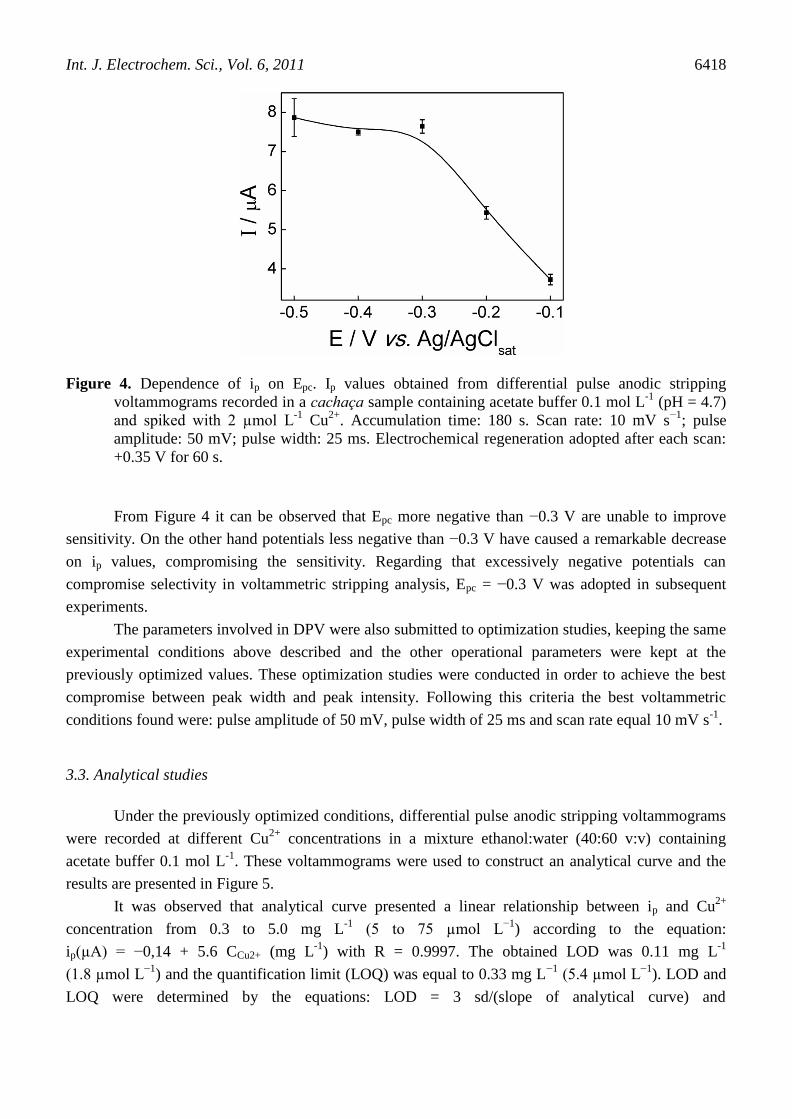
Under the previously optimized conditions, differential pulse anodic stripping voltammograms
were recorded at different Cu2+
concentrations in a mixture ethanol:water (40:60 v:v) containing
acetate buffer 0.1 mol L-1
. These voltammograms were used to construct an analytical curve and the
results are presented in Figure 5.
It was observed that analytical curve presented a linear relationship between ip and Cu2+
concentration from 0.3 to 5.0 mg L-1
(5 to 75 µmol L−1
) according to the equation:
ip(µA) = −0,14 + 5.6 CCu2+ (mg L-1
) with R = 0.9997. The obtained LOD was 0.11 mg L-1
(1.8 µmol L−1
) and the quantification limit (LOQ) was equal to 0.33 mg L−1
(5.4 µmol L−1
). LOD and
LOQ were determined by the equations: LOD = 3 sd/(slope of analytical curve) and
Int. J. Electrochem. Sci., Vol. 6, 2011
6419
LOQ = 10 sd/(slope of analytical curve) [42]. sd corresponds to standard deviation of the blank. The
error of the intercept of analytical curve was used to determine sd. The obtained LOD and LOQ were
significantly higher than those obtained when SPCPE-SiAt was used to determine copper in water
samples [38]. This loss of sensitivity can be attributed to the presence of ethanol. Several works have
demonstrated that ethanol causes a remarkable decrease on the intensity of anodic stripping
voltammetric peaks for many metal ions [17,19,43]. Despite these higher LOD and LOQ compared
with those obtained in totally aqueous medium [38], their values are considerably below the maximum
copper amount allowed in cachaça by Brazilian (5 mg L-1
) and international (2 mg L-1
) legislation.
This fact suggests that the proposed method can be successfully used for reliable quantification of
copper in cachaça samples.
Figure 5. Differential pulse anodic stripping voltammograms recorded in a mixture ethanol:water
(40:60 v:v) containing 0.1 mol L−1
acetate buffer solution spiked with: (—) 0, (—) 0.32; (—)
0.48; (—) 0.63; (—) 1.9; (—) 3.2 and (—) 4.8 mg L-1
de Cu2+
. Epc = −0.3 V; tpc = 180 s. Pulse
amplitude: 50 mV; Scan rate: 10 mV s−1
; pulse width: 25 ms. Inset: analytical curve.
Electrochemical regeneration adopted after each scan: +0.35 V for 60 s.
Compared with AAS-based methods described in literature for Cu2+
quantification in cachaça
samples, the proposed method has the advantage of using a simple and relatively inexpensive
instrumentation. In addition, the proposed voltammetric method does not require any chemical Cu2+
derivation step which is an advantage over visible spectrophotometric methods previously reported in
literature. Compared with other electroanalytical methods described in literature for Cu2+
quantification in cachaça samples, the present method is faster than potentiometric titration and it is
mercury-free. Moreover, the composite used in this work is totally stable in ethanol:water mixtures
which means that the proposed electrode presents a very long lifetime. Therefore, the main advance for
Int. J. Electrochem. Sci., Vol. 6, 2011
6420
Cu2+
determination in cachaça samples introduced by this method is provided by the high stability of
the electrode which allows Cu2+
determination directly in the samples in a very simple, fast and
inexpensive way with no needing of chemical derivation step or sample pretreatment procedures.
3.4. Real samples analyses
SPCPEs-SiAt were used to determine Cu2+
in four commercial cachaça samples acquired from
local market. Two of these samples were produced by industrial processes and the others were home-
made produced. Each one of these samples was submitted to three replicate determinations by standard
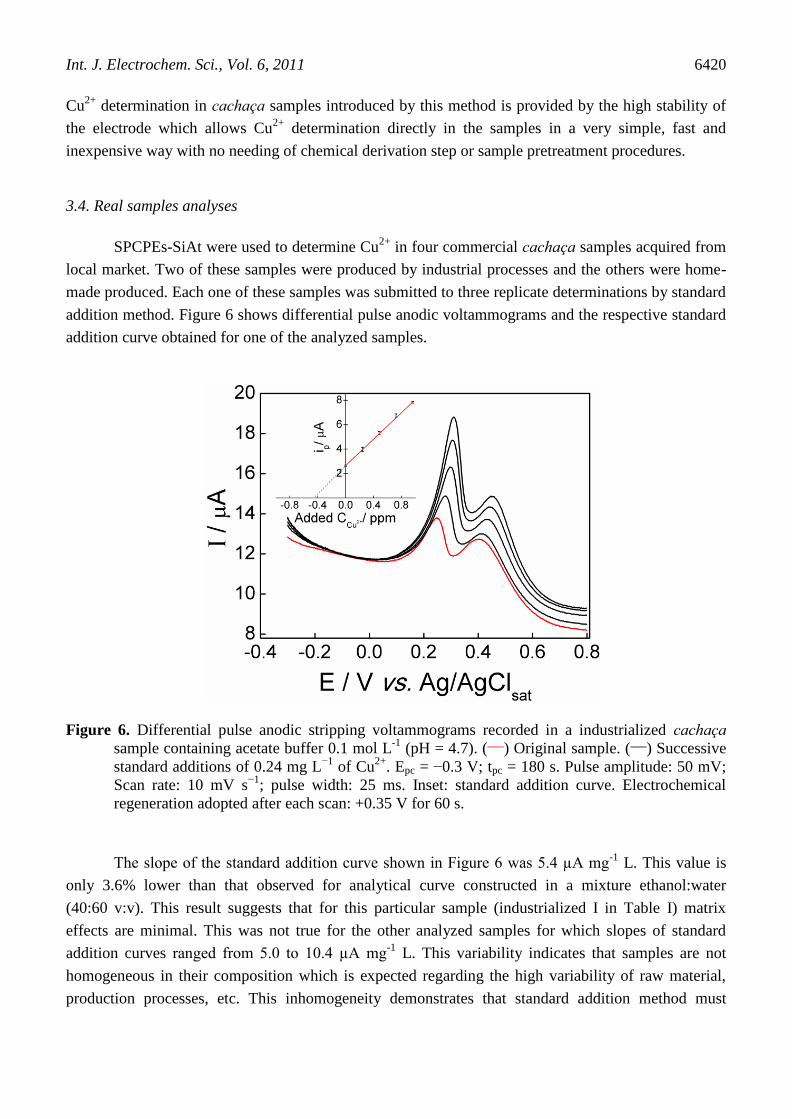
addition method. Figure 6 shows differential pulse anodic voltammograms and the respective standard
addition curve obtained for one of the analyzed samples.
Figure 6. Differential pulse anodic stripping voltammograms recorded in a industrialized cachaça
sample containing acetate buffer 0.1 mol L-1
(pH = 4.7). (___
) Original sample. (___
) Successive
standard additions of 0.24 mg L−1
of Cu2+
. Epc = −0.3 V; tpc = 180 s. Pulse amplitude: 50 mV;
Scan rate: 10 mV s−1
; pulse width: 25 ms. Inset: standard addition curve. Electrochemical
regeneration adopted after each scan: +0.35 V for 60 s.
The slope of the standard addition curve shown in Figure 6 was 5.4 µA mg-1
L. This value is
only 3.6% lower than that observed for analytical curve constructed in a mixture ethanol:water
(40:60 v:v). This result suggests that for this particular sample (industrialized I in Table I) matrix
effects are minimal. This was not true for the other analyzed samples for which slopes of standard
addition curves ranged from 5.0 to 10.4 µA mg-1
L. This variability indicates that samples are not
homogeneous in their composition which is expected regarding the high variability of raw material,
production processes, etc. This inhomogeneity demonstrates that standard addition method must
Int. J. Electrochem. Sci., Vol. 6, 2011
6421
always be used for Cu2+
determination in cachaça samples in order to avoid errors caused by matrix
effects whose nature and intensity are strongly depend on the sample. The slope of the standard
addition curve obtained for one of the analyzed sample (home-made II in Table I) was very high
(10.4 µA mg-1
L) which suggests that the ethanol content in this sample is exceptionally low.
The contents of copper found in the analyzed samples by the proposed method were compared
with those found by official FAAS method. FAAS analyses were performed according to the
procedure specified in Brazilian Technical Norm NBR 13921 [41] which establish the official
procedure for Cu2+
quantification in cachaça samples. The results obtained in this comparative study
are summarized in Table I.
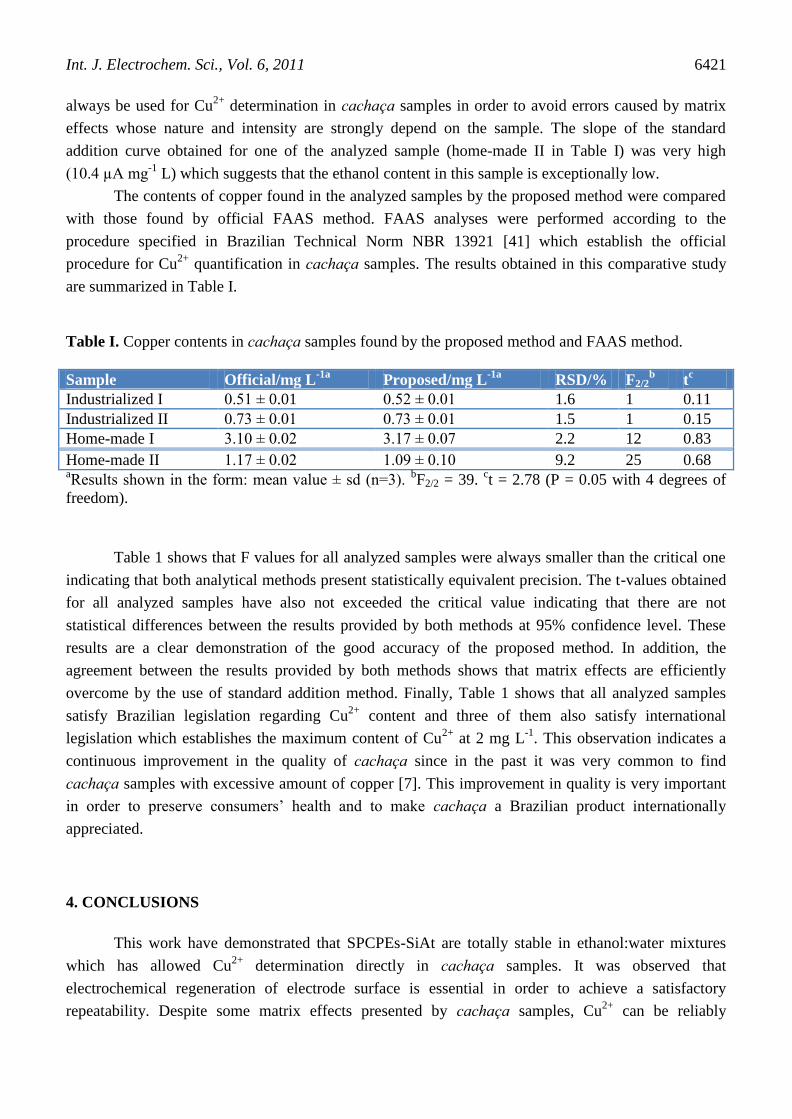
Table I. Copper contents in cachaça samples found by the proposed method and FAAS method.
Sample Official/mg L-1a
Proposed/mg L-1a
RSD/% F2/2b t
c
Industrialized I 0.51 ± 0.01 0.52 ± 0.01 1.6 1 0.11
Industrialized II 0.73 ± 0.01 0.73 ± 0.01 1.5 1 0.15
Home-made I 3.10 ± 0.02 3.17 ± 0.07 2.2 12 0.83
Home-made II 1.17 ± 0.02 1.09 ± 0.10 9.2 25 0.68 aResults shown in the form: mean value ± sd (n=3).
bF2/2 = 39.
ct = 2.78 (P = 0.05 with 4 degrees of
freedom).
Table 1 shows that F values for all analyzed samples were always smaller than the critical one
indicating that both analytical methods present statistically equivalent precision. The t-values obtained
for all analyzed samples have also not exceeded the critical value indicating that there are not
statistical differences between the results provided by both methods at 95% confidence level. These
results are a clear demonstration of the good accuracy of the proposed method. In addition, the
agreement between the results provided by both methods shows that matrix effects are efficiently
overcome by the use of standard addition method. Finally, Table 1 shows that all analyzed samples
satisfy Brazilian legislation regarding Cu2+
content and three of them also satisfy international
legislation which establishes the maximum content of Cu2+
at 2 mg L-1
. This observation indicates a
continuous improvement in the quality of cachaça since in the past it was very common to find
cachaça samples with excessive amount of copper [7]. This improvement in quality is very important
in order to preserve consumers’ health and to make cachaça a Brazilian product internationally
appreciated.
4. CONCLUSIONS
This work have demonstrated that SPCPEs-SiAt are totally stable in ethanol:water mixtures
which has allowed Cu2+
determination directly in cachaça samples. It was observed that
electrochemical regeneration of electrode surface is essential in order to achieve a satisfactory
repeatability. Despite some matrix effects presented by cachaça samples, Cu2+
can be reliably
Int. J. Electrochem. Sci., Vol. 6, 2011
6422
quantified in these samples if standard addition method is used. The use of an accumulation potential
directly in the analyzed sample enables using very short preconcentration time significantly improving
the sensitivity and analytical frequency which has allowed Cu2+
determination directly in cachaça in a
simple and fast way with no needing of any sample pretreatment procedure.
ACKNOWLEDGEMENTS
The authors are grateful to Fundação de Amparo à Pesquisa do Estado de Minas Gerais (FAPEMIG,
contract no. CEX APQ-00291-09) and Conselho Nacional de Desenvolvimento Científico e
Tecnológico (CNPq) for financial support. The student D.A. Costa is especially grateful for the
scholarship received from PIBIC/UFU/CNPq program. We also acknowledge Prof. Dr. Pedro M.
Padilha from UNESP (Universidade Estadual Paulista, Botucatu-SP) for kindly supply us SiAt.
Finally, A.L. Santos and R.M. Takeuchi are especially grateful to Prof. Dr. Nelson R. Stradiotto from
UNESP (Araraquara-SP) for all lessons, friendship and help at these initial stages of our academic
career.
References
1. I.C.C. Nóbrega, J.A.P. Pereira, J.E. Paiva, D.W. Lachenmeier, Food Chem., 117 (2009) 693.
2. L.M. Zacaroni, M.G. Cardoso, A.A. Saczk, W.D. Santiago, J.P. Anjos, J. Masson, F.C. Duarte,
D.L. Nelson, Quim. Nova, 34 (2011) 320.
3. Anonymous, Website: http://www.g21.com.br/materias/materia.asp?cod=20378&tipo=noticia.
4. K. Miranda, A.G.G. Dionísio, E.R. Pereira-Filho, Microchem. J., 96 (2010) 99.
5. S.A.N. Rocha, A.F. Dantas, H.V. Jaeger, A.C.S. Costa, E.S. Leão, M.R. Gonçalves, Spectrochim.
Acta Part A, 71 (2008) 1414.
6. B.C. Janegitz, A. Oliveira, M.S. Gomes, E.R. Sartori, E.R. Pereira-Filho, O. Fatibello-Filho, Quim.
Nova, 33 (2010) 458.
7. R.A. Labanca, M.B.A. Glória, V.J.P. Gouveia, R.J.C.F. Afonso, Quim. Nova, 29 (2006) 1110.
8. L.F.S. Caldas, B.B.A. Francisco, A.D.P. Netto, R.J. Cassella, Microchem. J., 99 (2011) 118.
9. N.M. Caldas, S.R. Oliveira, J.A. Gomes Neto, Anal. Chim. Acta, 636 (2009) 1.
10. I.V. Kucher, F.A.M. Silva, Quim. Nova, 22 (1999) 339.
11. P.J.S. Barbeira, L.H. Mazzo, N.R. Stradiotto, Analyst, 120 (1995) 1647.
12. M. Rajkumar, S. Thiagarajan, S.-M. Chen, Int. J. Electrochem. Sci., 6 (2011) 3164.
13. M.R. Ganjali, S. Aghabalazadeh, M. Khoobi, A. Ramazani, A. Foroumadi, A. Shafiee, P. Norouzi,
Int. J. Electrochem. Sci., 6 (2011) 52.
14. J. Zhuang, L. Zhang, W. Lu, D. Shen, R. Zhu, D. Pan, Int. J. Electrochem. Sci., 6 (2011) 4690.
15. D. Pan, L. Zhang, J. Zhuang, T. Yin, W. Lu, W. Qin, Int. J. Electrochem. Sci., 6 (2011) 2710.
16. E.S. Almeida, M.A.N.A. Monteiro, R.H.O. Montes, R. Mosquetta, N.M.M. Coelho, E.M. Richter,
R.A.A. Muñoz, Electroanalysis, 22 (2010) 1846.
17. R.A.A. Muñoz, L. Angnes, Microchem., J. 77 (2004) 157.
18. R.M. Takeuchi, A.L. Santos, M.J. Medeiros, N.R. Stradiotto, Microchim. Acta, 164 (2009) 101.
19. M.F. Bergamini, S.I. Vital, A.L. Santos, N.R. Stradiotto, Eclet. Quim., 31 (2006) 45.
20. W.S. Cardoso, T.C.O. Fonseca, A.L.B. Marques, E.P. Marques, J. Braz. Chem. Soc., 21 (2010)
1733.
21. C. Muñoz, M. Zúñiga, V. Arancibia, J. Braz. Chem. Soc., 21 (2010) 1688.
22. V.Arancibia, M. Zúñiga, M.C. Zúñiga, R. Segura, M. Esteban, J. Braz. Chem. Soc., 21 (2010) 255.
23. I. Svancara, A. Walcarius, K. Kalcher, K. Vytras, Cent. Eur. J. Chem., 7 (2009) 598.
24. J. Zima, I. Svancara, J. Barek, K. Vytras, Crit. Rev. Anal. Chem., 39:204–227, 2009.
Int. J. Electrochem. Sci., Vol. 6, 2011
6423
25. I.Švancara, K. Vytřas, J. Barek, Z. Zima, Crit. Rev. Anal. Chem., 31 (2001) 311.
26. I.Svancara, K. Vytras, K. Kalcher, A. Walcarius, J. Wang, Electroanalysis, 21 (2009) 7.
27. I. Cesarino, E.T.G. Cavalheiro, C.M.A. Brett, Michrochim. Acta, 171 (2010) 1.
28. M.F.S. Teixeira, A.Z. Pinto, O. Fatibello-Filho, Talanta, 45 (1997) 249.
29. L. Moreno-Baron, A. Merkoçi, S. Alegret, Electrochim. Acta, 48 (2003) 2599.
30. S. Santos, E.T.G. Cavalheiro, Anal. Lett., 44 (2011) 850.
31. A.G.-V. Prada, N. Pena, C. Parrado, A.J. Reviejo, J.M. Pingarrón, Talanta, 62 (2004) 896.
32. C. Petit, J.-M. Kauffmann, Anal. Proc., 32 (1995) 11.
33. C. Petit, A. Gonzalez-Cortes, J.-M.; Kauffmann, Talanta, 42 (1995) 1783.
34. R.M. Takeuchi, A.L. Santos, N.R. Stradiotto, Talanta, 71 (2007) 771.
35. R.M. Takeuchi, A.L. Santos, N.R. Stradiotto, Anal. Chim. Acta, 584 (2007) 295.
36. I.Cesarino, E.T.G. Cavalheiro, C.M.A. Brett, Electroanalysis, 22 (2010) 61.
37. I.Cesarino, G. Marino, E.T.G. Cavalheiro, Fuel, 89 (2010) 1883.
38. D.H. Silva, D.A. Costa, R.M. Takeuchi, A.L. Santos, J. Braz. Chem. Soc., 22 (2011) 1727.
39. I.Cesarino, G. Marino, J.R. Matos, E.T.G. Cavalheiro, Talanta, 75 (2008) 15.
40. P.S. Roldan, I.L. Alcântara, G.R. Castro, J.C. Rocha, C.C.F. Padilha, P.M. Padilha, Anal. Bional.
Chem., 375 (2003) 574.
41. Associação Brasileira de Normas Técnicas, NBR 13921, Aguardente de Cana - Determinação de
Cobre, 1997.
42. J.C. Miller, J.N. Miller, Significance tests. In Statistic for analytical chemistry, 3rd ed., Ellis
Horwood Limited, New York, (1993).
43. M.F. Oliveira, A.A. Saczk, L.L. Okumura, A.P. Fernandes, M. Moraes, N.R. Stradiotto, Anal.
Bioanal. Chem., 380 (2004) 135.
© 2011 by ESG (www.electrochemsci.org)
Copyright © 2022 FDOKUMEN