REMOTE SENSING IN PHYTOSOCIOLOGY: THE MAP OF VEGETATION OF THE ROME PROVINCIA
14
Vol. V ANNALI DI BOTANICA nuova serie 2005 REMOTE SENSING IN PHYTOSOCIOLOGY: THE MAP OF VEGETATION OF THE ROME PROVINCIA G. F ANELLI*, M. BIANCO PIETRO****, P. CAZZAGON**, D. D’ANGELI**, S. DE CORSO***, M. DE SANCTIS*, P. GIOIA***, A. RAMELLO**, G. RINIERI**, A. SERAFINI SAULI*, P. TESCAROLLO**, A. TESTI*, S. PIGNATTI* *Dipartimento di Biologia Vegetale, Orto Botanico, Università di Roma “La Sapienza” **Cooperativa Pineto 2000 ***IPT Informatica per il Territorio e l’ambiente ****Università del Molise, Dip. Scienze e tecnologie dell’ambiente e del territorio, Isernia ABSTRACT - Remote sensing is rapidly spreading in monitoring ecological systems: it has been cur- rently used to derive maps of ecological formations, primary productivity, geological maps, urban sprawl etc. Vegetation mapping examples are still relatively scarce. In Italy we can remember the computer-assisted vegetation map of Castel Porziano, the map of monti Sibillini and the cooper- ative project “Cartanatura” that mapped a large fraction of the Italian territory at the scale 1:50.000. Vegetation mapping heavily depend on quality of satellite images and of phytosocio- logical information. The map of vegetation of the Rome Provincia is a project funded by local authorities that aims at the phytosociological mapping of the vegetation of the Rome Provincia, an area large about 5000 km 2 . Rocks, soils, geomorphology, vegetation are very divers, from beech woodlands on limestone on a few mountain range above 1000 m, to interesting dune and salt marshes vegetation. The landscape is moreover highly fragmented, due both to complex geo- morphology (intricate network of small rivers, valleys and hills) and extensive human impact. We relied on SPOT images, with a resolution of 10 m and 4 bands. We adopted an operator-assisted approach, relying on algorithms that interpret the spectral bands on the base of supplied phytoso- ciological information. Preliminary results are promising. We could map a few relatively large sectors of the Provincia, and it was possible to prepare partial maps with very fine detail. – SPOT images seem superior in determining phytosociological units, probably due to high reso- lution, whereas LANDSAT images are fit in emphasizing structural characters of plant cover; – There is a very high percentage of correctly classified vegetation units (about 90%) and in many cases it was possible to present a phytosociologically detailed map (up to the level of associa- tion); – Algorithms used in classifying satellite images can be useful in helping phytosoiological inter- pretation. Often it was possible to recognize affinities and distinctions among vegetation types that are not at all obvious with the usual floristic tabulation.
-
Upload
independent -
Category
Documents
-
view
0 -
download
0
Transcript of REMOTE SENSING IN PHYTOSOCIOLOGY: THE MAP OF VEGETATION OF THE ROME PROVINCIA
Vol. V ANNALI DI BOTANICA nuova serie 2005
REMOTE SENSING IN PHYTOSOCIOLOGY:THE MAP OF VEGETATION OF THE ROME PROVINCIA
G. FANELLI*, M. BIANCO PIETRO****, P. CAZZAGON**, D. D’ANGELI**,S. DE CORSO***, M. DE SANCTIS*, P. GIOIA***, A. RAMELLO**, G. RINIERI**,
A. SERAFINI SAULI*, P. TESCAROLLO**, A. TESTI*, S. PIGNATTI**Dipartimento di Biologia Vegetale, Orto Botanico, Università di Roma “La Sapienza”
**Cooperativa Pineto 2000***IPT Informatica per il Territorio e l’ambiente
****Università del Molise, Dip. Scienze e tecnologie dell’ambiente e del territorio, Isernia
ABSTRACT - Remote sensing is rapidly spreading in monitoring ecological systems: it has been cur-rently used to derive maps of ecological formations, primary productivity, geological maps, urbansprawl etc. Vegetation mapping examples are still relatively scarce. In Italy we can remember thecomputer-assisted vegetation map of Castel Porziano, the map of monti Sibillini and the cooper-ative project “Cartanatura” that mapped a large fraction of the Italian territory at the scale1:50.000. Vegetation mapping heavily depend on quality of satellite images and of phytosocio-logical information. The map of vegetation of the Rome Provincia is a project funded by localauthorities that aims at the phytosociological mapping of the vegetation of the Rome Provincia,an area large about 5000 km2. Rocks, soils, geomorphology, vegetation are very divers, frombeech woodlands on limestone on a few mountain range above 1000 m, to interesting dune andsalt marshes vegetation. The landscape is moreover highly fragmented, due both to complex geo-morphology (intricate network of small rivers, valleys and hills) and extensive human impact. Werelied on SPOT images, with a resolution of 10 m and 4 bands. We adopted an operator-assistedapproach, relying on algorithms that interpret the spectral bands on the base of supplied phytoso-ciological information. Preliminary results are promising. We could map a few relatively largesectors of the Provincia, and it was possible to prepare partial maps with very fine detail.
– SPOT images seem superior in determining phytosociological units, probably due to high reso-lution, whereas LANDSAT images are fit in emphasizing structural characters of plant cover;
– There is a very high percentage of correctly classified vegetation units (about 90%) and in manycases it was possible to present a phytosociologically detailed map (up to the level of associa-tion);
– Algorithms used in classifying satellite images can be useful in helping phytosoiological inter-pretation. Often it was possible to recognize affinities and distinctions among vegetation typesthat are not at all obvious with the usual floristic tabulation.
KEY WORDS - Satellite images; supervised classification, SPOT.Nomenclature follows Anzalone (1994, 1996).
INTRODUCTION
Remote sensing is mainly concerned with ecosystem-level properties of vegeta-tion, for instance biomass, productivity and LAI (Jasinski, 1990; Todd & Hoffer,1998; Tucker & Sellers, 1986, Tucker et al., 1985; Huete, 1998, Weiser et al., 1986,Friedl et al. 1994), or deals with preparing physiognomic maps of plant cover usedprincipally in assessing landscape change (e.g. Huete, 1998; Harvey & Hill, 2001;William, 1985; Borfecchia et al., 2001). Although examples of remotely sensedphytosociological maps are not very numerous, supervised phytosociological inter-pretation of satellite images is nonetheless an already grown-up field of research(e.g Della Rocca et al., 2001). Many attempts in Italy and elsewhere allowed toassess the possibility to prepare phytosociological maps of more or less extensiveareas of vegetation by means of remote sensing. Nonetheless, in most cases only acoarse classification of vegetation has been thus far obtained, often relying heavilyon structural characters of vegetation. Moreover, it has been little explored if remotesensing can help phytosociologists not only in recognizing vegetation units in thefield, but also in the definition of vegetation units.
The map of vegetation covers the territory of the Rome Provincian, a localadministrative unit that interests on the town of Rome and surrouding areas. Theproject is funded by local authorities; it has begun in 2004 and currently in progress.The work is based on a large phytosociological database of about 2000 relevés anda long field experience of the working group.
The plant cover of this area is extremely diverse, due varied geomorphology,lithology and climate, and highly fragmented and often heavily impacted, althoughalso many spots of semi-natural vegetation still exists. The phytosociological analy-sis of this territory is therefore a difficult challenge, and many topics hereabout aredebated (e.g. Lucchese & Pignatti, 1990). This area represents therefore an ideal testfor the efficiency and the resolution of currently used methods in the interpretationof remotely sensed images.
The project is still in an initial phase. Nonetheless we could map about 40 % ofthe area, and a few interesting results appeared. The aim of this study is:
– to test at which level of detail it is possible to push the analysis of satellite images;
– to test the efficiency of SPOT images;
– to ask if semi-automatic classification of spectral signatures can help in the defi-nition of vegetation types.
MATHERIAL AND METHODS
Study siteThe Rome Provincia covers an area of 538,181 ha around the town of Rome
(FIGURE 1). There are two main rivers, the Tiber and its influent the Aniene. Other
166
smaller rivers are the Arrone, from lake of Bracciano, Mignone, and Treja, all in theNW sector of the Provincia. An intricate network of small rivers and ditches is pres-ent. In the Provincia five relatively large lakes of volcanic origin are present:Bracciano, Martignano, Albano, Nemi, Giulianello. Morphology is rather varied.The following main units can be recognized:
– the coastal dune belt;
– the plain of the Tiber and the surrounding low hills, with their intricate networkof small fluvial valleys (Campagna Romana);
– a hilly volcanic district 300-600 m high in the North-West (Monti della Tolfa andMonti Sabatini);
– the Vulcano Laziale, an extinct Volcano that reaches 950 m a.s.l.;
– the limestone massif of Monti Lepini in the SE (with the peak of M.te Semprevisa1368 m) and the isolated Mount Soratte in the N;
– the area of the Antiappennino, a series of limestone mountains about 1000 m high(Monti Ruffi, Tiburtini, Prenestini, Lucretili);
– the mountains of Central Appennines (monti Simbruini), where the highest peaksof the Provincia are present (m.te Taurinio 1959 m, M.te Autore 1853 m.
Geology is diverse (Bigi et al., 1988). In the Appennines (in the eastern sectorof the Provincia) mainly Jurassic-Cretaceous limestones and marls are present. Twolarge extinct volcanoes are present, and pyroclastites and lavas outcrop in most ofthe lowlands of the Provincia. Sedimentary alluvial rocks are present mainly alongthe Tiber, in a layer underlying the pyroclastites. Small Pliocene clays outcrops arepresent in the surroundings of Rome. After Blasi (1994) two phytoclimatic regionscan be recognized, with two transitional belts (TABLE 1):
167
FIGURE 1 - Black and white satellite image of Rome Provincia.
– Temperate region: without a period of summer drought, abundant summer rainsand winter minimum temperatures around 0 °C. This region includes the moun-tain areas;
– Transitional temperate region: with 2 months of summer drought and summerrains about 110 mm. The Valleys of Tiber is mostly comprised in this region;
– Transitional Mediterranean region: with 2-3 months of summer drought. Most ofthe Provincia below 1000 m a.s.l. is comprised in this region;
– Mediterranean region: with 3-4 months of summer drought. This region intereststhe coastal belt.
The Rome Provincia counts 4,000,000 inhabitans, with a density of 719 peo-ple/km2. Main towns are Rome, Civitavecchia, Guidonia, Tivoli. Most of the terri-tory of the Provincia is cultivated (TABLE 2); nonetheless about 30% of the area isoccupied by natural vegetation, in particular coppices. In the Provincia 56 areas pro-tected by European Union (ZPS and SIC) and 38 parks and reserves are present.
Due to complex climate, geology and morphology, the vegetation of the area isvery diverse. Schematically, the following main types can be recognized (Lucchese& Pignatti, 1990; Blasi et al., 1995):
Dune vegetation: along the coast a relatively narrow strip of dune vegetation(Ammophiletea Br.-Bl. et Tx ex Westhoff et al. 1946) is present, often with impor-tant examples.
Evergreen Mediterranean woodland (Quercetea ilicis Br.-Bl. in Br.-Bl. et al.1952): Evergreen woodlands are present mainly along the coast, on sands, and onsteep slopes in the low mountains (Bianco et al., 2002).
Deciduous mixed woodlands (Quercetalia pubescentis Klika 1933): deciduouswoodlands occur in most of the area of the Provincia below 1000 m a.s.l. The maintree species are Quercus cerris and Ostrya carpinifolia. Quercus frainetto, Quercuspetraea, Quercus pubescens, Acer campestre, Acer obtusatum, Carpinus betulus,Carpinus orientalis, Fraxinus ornus are frequently associated. Most woodlands aretreated as coppices, but also a few older woodlands are present. The syntaxonomy ofthis vegetation is difficult, due to high variability and anthropical impoverishment.
Hygrophilous woodlands: along the rivers and in ponds and lakes woodlandswith Populus ssp, Fraxinus angustifolia subsp. oxycarpa, Quercus robur occur.These woodlands are fragmented and greatly reduced due to anthropical pressure.
Mountain beech woodlands (Fagetalia sylvaticae Pawl. 1928): Fagus sylvaticawoodlands occur in a belt above 1000 m a.s.l.
Grasslands: the main types are grasslands dominated by annuals (Thero-Brachypodietea Br.-Bl. et al. 1952) in the lowlands and perennial grasslands(Festuco-Brometea Br.-Bl. et Tx. 1943) in the mountains. These vegetation typesare very rich in species (Fanelli, 1998) and diverse, but extensive stands are presentonly in Rome and in the limestone mountains.
Supervised classification of satellite imagesThe vegetation classes have been obtained by supervised classification, applied
to a multispectral image of satellite SPOT5 (21 july 2002), employing the PCI
168

Geomatica software (Harvey & Hill, 2001). Main characteristics of SPOT5 imagesare pixel size of 10 m and 4 spectral bands:
Green 0.50-0.59 µmRed 0.61-0,68 µmNear infrared 0.78-0.89 µmShort-wave infrared 1.58-1.75 µm
The classification phase has concerned the collection of training areas in PCIGeomatica Platform, of classes representative areas and their statistical elaboration.The algorithm, used for the classification has been the Maximum Likelihood (withnull class). The statistical analysis and elaboration followed the steps below:
– PCA Analysis of training sites; correlation among spectral bands and estimate ofunimodality of the relative histogram;
– scatter plot analysis to determine the quality of training areas;
– coincident spectral plot analysis in order to define the spectral signatures and tovalue the overlap degree between the classis on different band;
– analysis of confusion matrix to estimate the signature separability between theclasses;
– preliminary classification of training areas to find the useless ones and to controltheir coherence;
– final classification of the classes;
– photointerpretation and feature extraction of areas larger then 2500 m2;
– field control of feature results.
RESULTS
The supervised could distinguish 64 vegetation or land use classes, in manycases at the level of association. The vegetation types are well separated after theirspectral signature, with only about 5-10 % overlap. Average accuracy is 95.50,overall accuracy 98.23. Field control could retrieve about 80-90 % of classes recog-nised by supervised classification when the area occupied by a patch was larger than200-300 m2.
Problems arose with grasslands; pioneer stages and mosaics with shrubs areoften misclassified; moreover, the algorithm often cannot distinguish between per-manent grasslands and temporarily uncultivated crops.
In an exploration of potentialities of LANDSAT images, these could recognizemost but not all of the types recognized with SPOT images; moreover LANDSATemphasize structural differences, to which SPOT images are relatively insensitive.
169
We present below three examples of actual mapping attempts and we discussstrength and limitations of our approach.
Quercus cerris deciduous woodlandsIn the study area, two main types of deciduous Quercus cerris woodlands can be
recognized: a thermophilous type, and a mesophilous type.The thermophilous deciduous woodland occurs in the coastal belt (Fanelli,
2002). It represents a deciduous woodland in a Mediterranean climatic belt, and isdifferentiated in particular by the presence of species such as Quercus frainetto (thatrarely occurs also in the mesophilous type), Cytisus villosus, Phillyrea latifolia,Echinops siculus, Ornithogalum pyraenaicum, Melica arrecta, Luzula forsteri,Carex olbiensis, Cornus sanguinea. This community has been referred to Echinopo-Quercetum cerridis Blasi et Paura 1993, Lathyro-Quercetum cerridis Bonin etGamisans 1976, Quercetum fraientto-cerridis Horvat 1959 or to Quercetum frainet-to-suberis Blasi et al. 1997 (Lucchese & Pignatti 1990, Pignatti 1998, Filesi 2001).
The mesophilous type occurs far from the coast, and is more diverse. Differentvariants are present, that could even be referred to different associations. Thesetypes can be differentiated by species such as Carpinus orientalis (which less fre-quently occurs also in the thermophilous type), Cornus mas, Platanthera bifolia,Lathyrus venetus, Bromus ramosus. On steeper slopes Celtis australis, Hippocrepisemerus subsp. emeroides, Orchis purpurea, Orchis provincialis are present (i.e.Coronillo emeri-Quercetum cerridis). Coppices are poor in diagnostic species anda few of the species distinctive of thermophilous deciduous woodlands occur. Thevariants have been variously referred to Coronillo emeri-Quercetum cerridis Blasi1984, Carpino orientalis-Quercetum cerridis Blasi 1984, Rubio peregrinae-Quercetum cerridis Pigntti E. et Pignatti S. 1968 (Blasi, 1984; Biondi et al.; 2001;Pignatti, 1998). These associations are usually referred to an alliance endemic toCentral Italy, Teucrio siculi-Quercion cerridis Ubaldi 1988, or to Carpinion Issler1931. These vegetation types are nonetheless difficult to distinguish and debate isstill on going about Quercus cerris-frainetto woodlands of central Latium (Biondiet al., 2001).
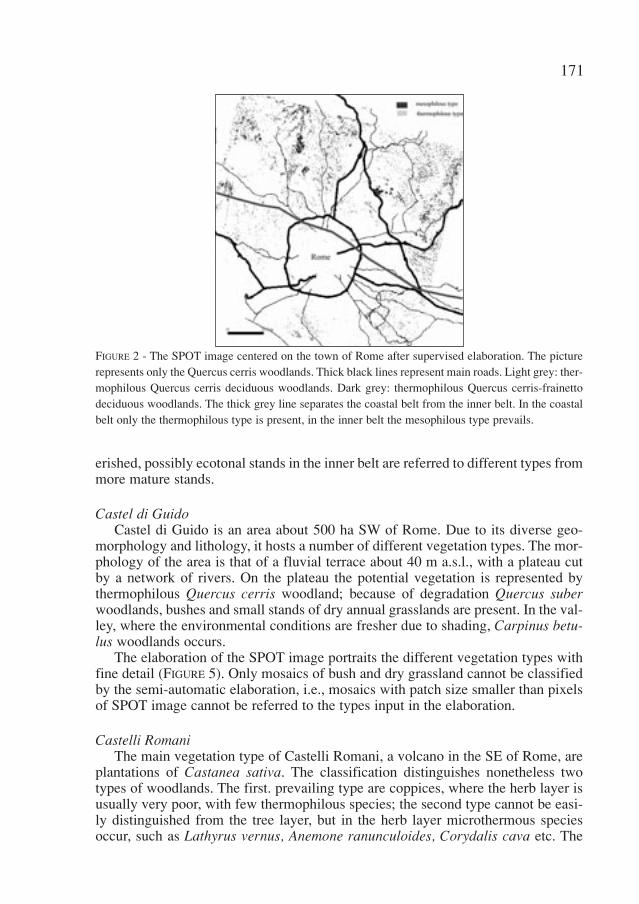
The semi-automatic elaboration of the spot image clearly distinguishes the twovegetation types. On the elaboration of the SPOT5 image (FIGURE 2) two belts couldbe distinguished. In the coastal belt, belonging to Mediterranean climate, only ther-mophilous type occurs, whereas in the inner, transitional Mediterranean belt,mesophilous and thermophilous types are present, with a prevalence of the latter.Here coppices, with poor undergrowth, are usually referred to the thermophiloustype (FIGURE 3).
The two types are largely overlapping on spectral band 1 and 2, whereas theyare particularly well separated on band 3 (NIR) and in part on band 4 (SWIR)(FIGURE 4). The eleboration probably thus relies on water and thermal status of thewoodland types. A differentiation related to the structure of the woodlands shouldbe excluded, because structure is independent of classification; both coppices andolder woodlands of thermophilous and mesophilous types are represented, where-as thermophilous and mesophilous woodlands are present with both coppices andolder woodlands.
In summary, the elaboration distinguishes well two closely related types; impov-
170
erished, possibly ecotonal stands in the inner belt are referred to different types frommore mature stands.
Castel di GuidoCastel di Guido is an area about 500 ha SW of Rome. Due to its diverse geo-
morphology and lithology, it hosts a number of different vegetation types. The mor-phology of the area is that of a fluvial terrace about 40 m a.s.l., with a plateau cutby a network of rivers. On the plateau the potential vegetation is represented bythermophilous Quercus cerris woodland; because of degradation Quercus suberwoodlands, bushes and small stands of dry annual grasslands are present. In the val-ley, where the environmental conditions are fresher due to shading, Carpinus betu-lus woodlands occurs.
The elaboration of the SPOT image portraits the different vegetation types withfine detail (FIGURE 5). Only mosaics of bush and dry grassland cannot be classifiedby the semi-automatic elaboration, i.e., mosaics with patch size smaller than pixelsof SPOT image cannot be referred to the types input in the elaboration.
Castelli RomaniThe main vegetation type of Castelli Romani, a volcano in the SE of Rome, are
plantations of Castanea sativa. The classification distinguishes nonetheless twotypes of woodlands. The first. prevailing type are coppices, where the herb layer isusually very poor, with few thermophilous species; the second type cannot be easi-ly distinguished from the tree layer, but in the herb layer microthermous speciesoccur, such as Lathyrus vernus, Anemone ranunculoides, Corydalis cava etc. The
171
FIGURE 2 - The SPOT image centered on the town of Rome after supervised elaboration. The picturerepresents only the Quercus cerris woodlands. Thick black lines represent main roads. Light grey: ther-mophilous Quercus cerris deciduous woodlands. Dark grey: thermophilous Quercus cerris-frainettodeciduous woodlands. The thick grey line separates the coastal belt from the inner belt. In the coastalbelt only the thermophilous type is present, in the inner belt the mesophilous type prevails.
latter type usually occurs higher above sea level. This result was unexpected, andhas been recognized only in the phase of verification of the elaboration. In a pre-liminary classification, chestnut woodlands were classified in the same class asthermophilous beech woodlands, which is probably correct, although difficult toassess due to impoverished herb layer.
DISCUSSION
It was relatively easy to obtain a detailed classification of vegetation of the area,notwithstanding noteworthy syntaxonomical difficulties in the phytosociology ofvegetation types occurring in the Rome Provincia. These results concerns mainlywoody vegetation; grasslands are less efficiently classified. Problems arise mainlywhere the mosaic of vegetation has finer grain than the pixel size of SPOT images;in this case the spectral signature is intermediate between different types, and thealgorithm cannot interpret well the vegetation. These problems arose in particularin mosaics of grasslands and shrubs.
In many examples of algorithmic classification of remotely sensed images, it isnot possible to test the phytosociological detail of classification, because very dif-ferent types only are present, for instance decidouous and evergreen woodlands (e.g.Della Rocca et al. 2001; Harvery & Hill, 2001). A notable exception is the map ofMonti Sibillini, where closely related grassland could be distinguished (Borfecchiaet al., 2001). In the Rome Provincia, closely related associations, possibly belongingto the same alliance, that sometimes have not even been distinguished at the level ofassociation, could be recognized. The potentialities of remote sensing in mappingvegetation seem therefore very promising and further research should be rewarding.
172
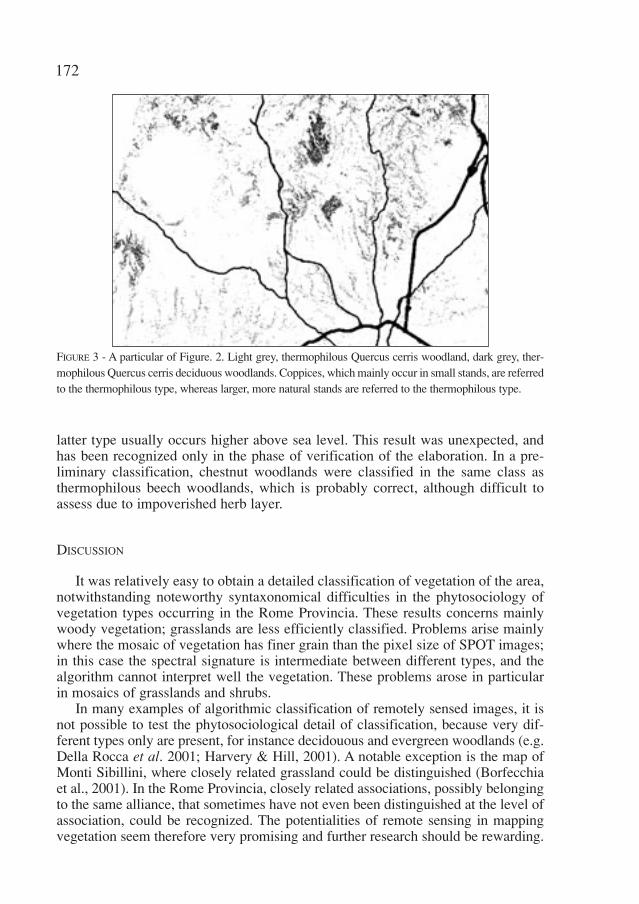
FIGURE 3 - A particular of Figure. 2. Light grey, thermophilous Quercus cerris woodland, dark grey, ther-mophilous Quercus cerris deciduous woodlands. Coppices, which mainly occur in small stands, are referredto the thermophilous type, whereas larger, more natural stands are referred to the thermophilous type.
It is interesting that in a few cases unexpected results of classification fitted thephytosociology of vegetation types. For instance, many coppices in the inner sectorof the Provincia are closer to coastal thermophilous woodlands than twomesophilous woodlands farther from the sea, according to the semi-authomaticelaboration. This was suspected, but was difficult to demonstrate due to impover-ished floristic composition of these coppices. In fact, coppices are transitionalbetween the thermophilous and the mesophilous type; they present a few indicatorspecies of the thermophilous type and a few thermophilous species, that enter in theimpoverished floristic composition due to drying following cuttings. The classifi-cation of these stands results therefore rather puzzling. Chestnut woodlands werenicely distinguished into a fresher and a warmer type, that were previouslyunrecognised in the analysis, again because of impoverishment of coppices. In othercases, affinities recognizable with floristic tabulation of relevés were supported andconfirmed by the semi-automatic classification. Chestnut coppices resulted allied tobeech woodlands, an affinity quite obvious in typical stands, much more difficult torecognize in impoverished coppices. In summary, the spectral signature is an ancil-lary help to phytosociological classification, in particular where tables of relevés areunsaturated due to anthropical impact.
Interpretation of satellite images has often relied on a large number of bands;nonetheless, in our study it seems that resolution is much more important than thenumber of spectral channels in determining vegetation types. SPOT images are rel-atively unexpensive satellite images. Their main characteristics are a finer pixel sizewith respect to more broadly used LANDSAT images and a smaller number of spec-tral bands (only four). These characteristics seem perfectly fit to prepare detailedvegetation mapping of relatively large areas up to the level of association.
173
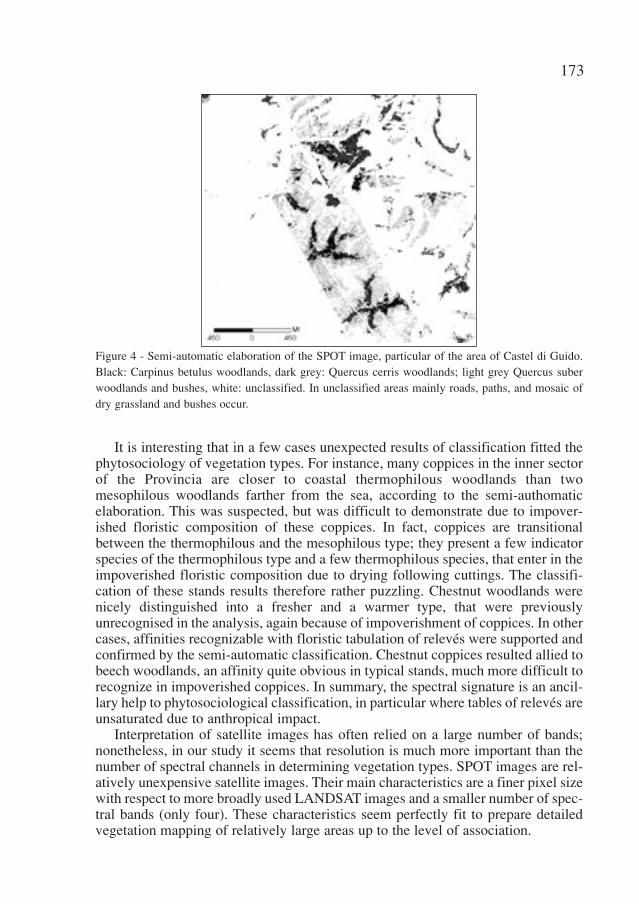
Figure 4 - Semi-automatic elaboration of the SPOT image, particular of the area of Castel di Guido.Black: Carpinus betulus woodlands, dark grey: Quercus cerris woodlands; light grey Quercus suberwoodlands and bushes, white: unclassified. In unclassified areas mainly roads, paths, and mosaic ofdry grassland and bushes occur.
CONCLUSIONS
SPOT images can map effectively, accurately and with great phytosociologicaldetail the vegetation of this complex area. It would be interesting to compare theseresults with analogous elaboration of other images, for instance hyperspectralimages. Nonetheless, SPOT images are relatively unexpensive and easily available,and they should be recommended for phytosociological surveys. More sensitiveimages could be used in particular researches.
The analysis of spectral signatures of vegetation helps phytosociological inter-pretation. This doesn’t mean that we can automatically define vegetation units onthe base of spectral bands; interpretation of results of elaboration of satellite imagesrequires a firm knowledge of the floristic variability of vegetation. Nonetheless, itcan be very useful in many cases were the classification is difficult and debated.
REFERENCES
ANZALONE B., 1994 - Prodromo della flora romana (elenco preliminare della piante vascolari spon-tanee del Lazio) - Aggiornamento. Parte 1a Pteridophyta, Gymnospermae, AngiospermaeDycotyledones. Ann. Bot. (Roma) 52 suppl. 11: 1-81.
ANZALONE B., 1996 - Prodromo della flora romana (elenco preliminare della piante vascolari spon-tanee dei Lazio) - Aggiornamento. Parte 2a: Angiospermae Monocotyledones. Ann. Bot. (Roma)52 suppl. 11: 1-81.
BIANCO P.M., FANELLI G., DE LILLIS M., 2002 - Flora e vegetazione di Castel Fusano (Roma). Quad.Bot. Ambientale Appl. 13: 125-181.
BIGI G., COSENTINO D., PAROTTO M., 1988 - Modello litostratigrafico-strutturale della regione Lazio.Regione Lazio, Dipartimento di Scienze della Terra Università degli studi di Roma “LaSapienza”.
BIONDI E., GIGANTE D., PIGNATTELLI S., VENANZONI R., 2001 - I boschi a Quercus frainetto Ten.Presenti nel territorio centro meridionale della penisola italiana. Fitosociologia 33: 97-111.
BLASI C., 1984 - Quercus cerris and Quercus frainetto woods in Latium (central Italy). Ann. Bot.(Roma) 42: 7-19.
BLASI C., 1994 - Fitoclimatologia del Lazio. Fitosociologia 27: 151-175.BLASI C., DOWGIALLO G., FIOLLIERI M., LUCCHESE F., MAGNI D., PIGNATTI S., SADORI L., 1995 - La
vegetazione naturale potenziale dell’are romana. Atti del Convegno Lincei 115 “La vegetazioneItaliana”: 413-451, Acc. Naz. Lincei, Roma
BORFECCHIA F., DE CECCO L., DIBARI C., IANNETTA M., MARTINI S. & SCHINO G., 2001 - Ottimizzazionedella stima della biomassa pascoliva nel parco nazionale dei Monti Sibillini tramite dati satelli-tari e rilievi a terra. Congresso ASITA, 9-12 ottobre 2001.
DELLA ROCCA A..B., PIGNATTI S., MUGNOLI B., BIANCO P.M., 2001 - La carta della vegetazione dellaTenuta Presidenziale di Castel Porziano. In: Il sistema ambientale della tenuta presidenziale diCastel Porziano. Ricerche sulla complessità di un ecosistema forestale costiero mediterraneo.Acc. Naz. Delle Scienze, Roma.
FANELLI G. 1998 - Dasypyrum villosum vegetation in the territory of Rome. Rend. Fis. Acc. Lincei 9:155-176.
FANELLI G., 2002 - Analisi fitosociologica dell’area metropolitana di Roma. Braun-Blanquetia 27: 1-257.
174
FILESI L., 2001 Vegetatione attuale e potenziale della Tenuta di Castel di Guido. in Corona P. (ed.) Irimboschimenti della Tenuta di Castel di Guido: materiali di studio: 31-43 Comune di Roma,Roma.
FRIEDL M. A., MICHAELSEN J., DAVIS F. W., WALKER H. AND SCHIMEL D.S., 1994 - Estimating grass-land biomass and leaf area index using ground and satellite data. International Journal of RemoteSensing, vol. 15, no. 7: 1401-1420.
HARVERY K. R. AND HILL G.J.E., 2001- Vegetation mapping of a tropical freshwater swamp in theNorthern Territory, Australia: a comparison of aerial photographs, Landsat TM and SPOT satel-lite imagery. Int. J. of Remote Sensing 22: 2911-2925.
HUETE A.R., 1998 - A Soil-Adjusted Vegetation Index (Savi). Remote Sensing of Environment 25: 295-309.
JASINSKI M.F., 1990 - Sensitivity of the Normalized Difference Vegetation Index to subpixel canopycover, soil albedo and pixel scale. Remote Sensing of Environment 32:169-187.
LUCCHESE F., PIGNATTI S., 1990 - Sguardo sulla vegetazione del Lazio marittimo. Quad. Acc. Naz.Lincei 264: 5-48.
PIGNATTI S., 1998 I boschi d’Italia. Sinecologia e biodiversità. UTET, Torino.TODD S.W., HOFFER R. M., 1998 - Responses of Spectral Indices to Variations in Vegetation Cover and
Soil Background. Photogrammetry Engineering and Remote Sensing 64: 915-921.TUCKER C. J. AND SELLERS P. J., 1986 - Satellite remote sensing of primary production. International
Journal of Remote Sensing 7: 1395-1416.TUCKER C.J., VANPRAET C.L., SHARMAN M.J., VAN ITTERSUM G, 1985 - Satellite Remote Sensing of
Total Herbaceous Biomass Production in the Senegalese Sahel: 1980-1984. Remote Sensing ofEnvironment 17: 233-249.
WEISER R.L., ASRAR G., MILLER G.P., KANEMASU E.T., 1986 - Assessing Grassland BiophysicalCharacteristics from Spectral Measurements. Remote Sensing of Environment, 20: 141-152.
175
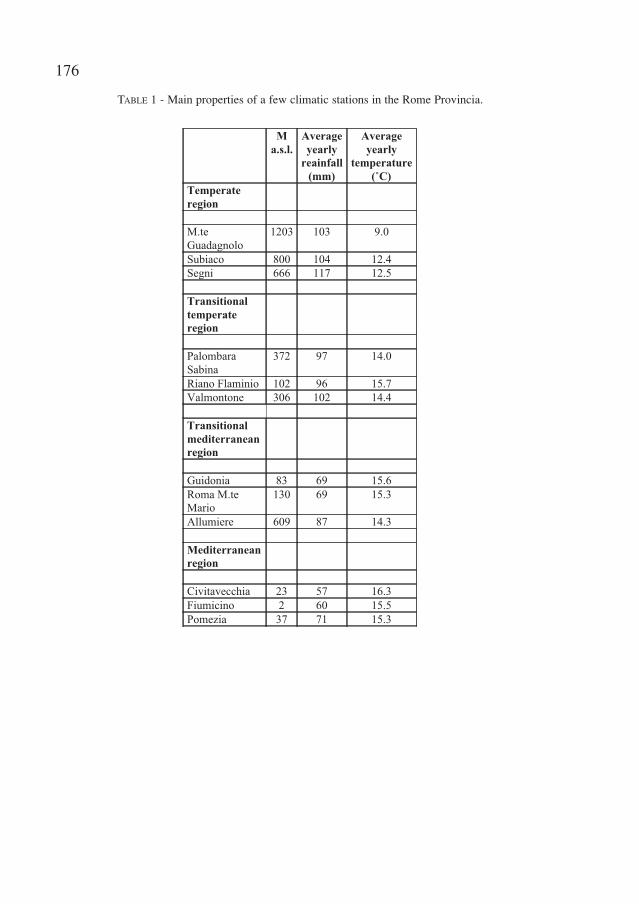
TABLE 1 - Main properties of a few climatic stations in the Rome Provincia.
M
a.s.l.
Average
yearly
reainfall
(mm)
Average
yearly
temperature
(˚C)
Temperate
region
M.te
Guadagnolo
1203 103 9.0
Subiaco 800 104 12.4
Segni 666 117 12.5
Transitional
temperate
region
Palombara
Sabina
372 97 14.0
Riano Flaminio 102 96 15.7
Valmontone 306 102 14.4
Transitional
mediterranean
region
Guidonia 83 69 15.6
Roma M.te
Mario
130 69 15.3
Allumiere 609 87 14.3
Mediterranean
region
Civitavecchia 23 57 16.3
Fiumicino 2 60 15.5
Pomezia 37 71 15.3
176
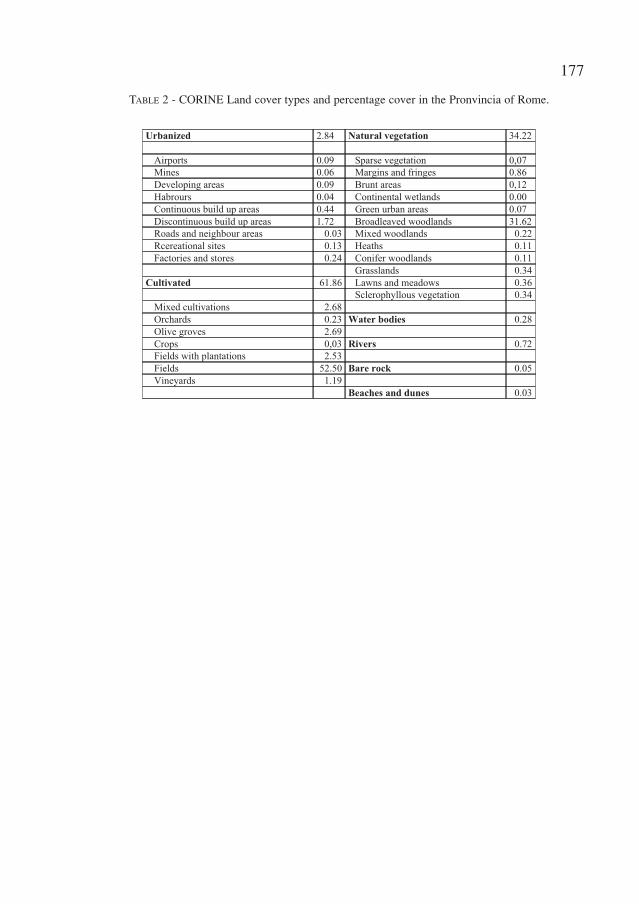
TABLE 2 - CORINE Land cover types and percentage cover in the Pronvincia of Rome.
Urbanized 2.84 Natural vegetation 34.22
Airports 0.09 Sparse vegetation 0,07
Mines 0.06 Margins and fringes 0.86
Developing areas 0.09 Brunt areas 0,12
Habrours 0.04 Continental wetlands 0.00
Continuous build up areas 0.44 Green urban areas 0.07
Discontinuous build up areas 1.72 Broadleaved woodlands 31.62
Roads and neighbour areas 0.03 Mixed woodlands 0.22
Rcereational sites 0.13 Heaths 0.11
Factories and stores 0.24 Conifer woodlands 0.11
Grasslands 0.34
Cultivated 61.86 Lawns and meadows 0.36
Sclerophyllous vegetation 0.34
Mixed cultivations 2.68
Orchards 0.23 Water bodies 0.28
Olive groves 2.69
Crops 0,03 Rivers 0.72
Fields with plantations 2.53
Fields 52.50 Bare rock 0.05
Vineyards 1.19
Beaches and dunes 0.03
177

178