REMOTE MONITORING OF EMISSIONS FROM ON-ROAD ...
130
REMOTE MONITORING OF EMISSIONS FROM ON-ROAD VEHICLES A PRIMER Remote monitoring of emissions from on-road vehicles report.indd 1 Remote monitoring of emissions from on-road vehicles report.indd 1 24/06/22 4:47 PM 24/06/22 4:47 PM
-
Upload
khangminh22 -
Category
Documents
-
view
2 -
download
0
Transcript of REMOTE MONITORING OF EMISSIONS FROM ON-ROAD ...

REMOTEMONITORING OFEMISSIONS FROM
ON-ROAD VEHICLES
A PRIMER
Remote monitoring of emissions from on-road vehicles report.indd 1Remote monitoring of emissions from on-road vehicles report.indd 1 24/06/22 4:47 PM24/06/22 4:47 PM

Remote monitoring of emissions from on-road vehicles report.indd 2Remote monitoring of emissions from on-road vehicles report.indd 2 24/06/22 4:47 PM24/06/22 4:47 PM

REMOTEMONITORING OFEMISSIONS FROM
ON-ROAD VEHICLES
A PRIMER
Remote monitoring of emissions from on-road vehicles report.indd 3Remote monitoring of emissions from on-road vehicles report.indd 3 24/06/22 4:47 PM24/06/22 4:47 PM

Research director: Anumita Roychowdhury
Technical research: Deepak Agarwal, Ebyt Technologies Pvt. Ltd
CSE research team: Jai Prakash and Vivek Chattopadhyaya
Cover: Ajit Bajaj
Production: Rakesh Shrivastava and Gundhar Das
This is a collaborative study between the Centre for Science and Environment and Ebyt Technologies Pvt. Ltd
© 2022 Centre for Science and Environment
Material from this publication can be used, but with acknowledgement.
Maps used in this document are not to scale.
Citation: Anumita Roychowdhury 2022, Remote Monitoring of Emissions from On-road Vehicles: A Primer, Centre for Science and Environment , New Delhi
Published byCentre for Science and Environment41, Tughlakabad Institutional AreaNew Delhi 110 062Phones: 91-11-40616000 Fax: 91-11-29955879E-mail: [email protected]: www.cseindia.org
Shakti Sustainable Energy Foundation (Shakti) seeks to facilitate India’s transition to a sustainable energy future by aiding the design and implementation of policies in the following sectors: clean power, energy efficiency, sustainable urban transport, climate policy and clean energy finance.
The views/analysis expressed in this report/document do not necessarily reflect the views of Shakti Sustainable Energy Foundation. The Foundation also does not guarantee the accuracy of any data included in this publication nor does it accept any responsibility for the consequences of its use.
For private circulation only
The Centre for Science and Environment is grateful to the Swedish International Development Cooperation Agency (Sida) for their institutional support.
The Centre for Science and Environment is grateful for valuable advice from the International Council on Clean Transportation–The Real Urban Emissions Initiative (TRUE).
Remote monitoring of emissions from on-road vehicles report.indd 4Remote monitoring of emissions from on-road vehicles report.indd 4 24/06/22 4:47 PM24/06/22 4:47 PM

5
Contents
WHY THIS STUDY? 9
NEXT STEPS 15
1. RSD programme needs to be designed to meet a diverse set of objectives 15
2. Strengthen technical regulations on remote sensing and amend CMVR to create mandate for its implementation 16
3. Develop national guidance framework for implementation of the RSD programme in states 17
4. Support roll out of lighthouse projects on RSD in selected cities 18
5. Provide technical knowledge support to implementation of RSD programme and build awareness 18
SECTION 1: HOW THE FOCUS OF NEW VEHICLE- EMISSION REGULATIONS IS SHIFTING TOWARDS REAL-WORLD EMISSIONS PERFORMANCE 19
1. How have mass emission regulations evolved in India? 19
2. How have regulatory emissions testing methods for compliance evolved in India? 20
3. How have vehicle-emission and compliance programmes evolved in India? 23
4. How is the focus shifting towards real driving emissions? 28
5. What is causing variance between certified emissions levels and real-world driving emissions? 31 5.1 What are the regulatory causes? 32
5.2 What are the technical causes? 35
6. What further post BSVI reforms are awaited in 2023? 37
Remote monitoring of emissions from on-road vehicles report.indd 5Remote monitoring of emissions from on-road vehicles report.indd 5 24/06/22 4:47 PM24/06/22 4:47 PM

6
REMOTE MONITORING OF EMISSIONS FROM ON-ROAD VEHICLES: A PRIMER
SECTION 2: POLICY IMPERATIVES AND PILOTS ON RSD IN INDIA 39
1. What is genesis of the RSD programme in India? 39
2. What are the policy imperatives of RSD programme in India? 44
3. What are the technology pathways for remote sensing monitoring? 47
4. What is the difference between portable emissions monitors (PEMSs) and remote sensing devices (RSDs)? 53
5. How do we understand the measurement units (conversion of pollutant from gm/kg to gm/km)? 58
6 How does RSD help to assess and develop emissions factor of vehicles? 59
7. How do we understand RSD data representativeness? 62
8. How to design an RSD programme for implementation? 66
9. How are locations for RSD monitoring selected? 67 General considerations 68 Sampling plan development and securement of permits and approvals? 71
10. How is RSD equipment set up? 74
11. How does RSD equipment procurement need to focus on data sampling and processing? 75
Data collection 75 Data processing and number plate matching 75 Data reporting 77
Data reporting fields 77
12. How is fleet average emission measurement estimated? 80
13. How to cross-check on I/M performance? 84
14. How to use remote sensing data to evaluate the effectiveness of a programme? 85
15. How to relate RSD with the traffic flow factors? 86
16. How to ensure overall fleet coverage? 86
17. How to understand breakdown of emissions? 86
Remote monitoring of emissions from on-road vehicles report.indd 6Remote monitoring of emissions from on-road vehicles report.indd 6 24/06/22 4:47 PM24/06/22 4:47 PM

7
18. How does RSD help to identify high emitters? 87
19. How can emissions cut point be defined? 88
20. What is clean screening of vehicles? 91
21. How to correlate RSD monitoring with PUC results in India? 92
22. How many RSD devices are needed in a city? 94
23. How much will it cost to implement an RSD programme? 94
24. How can RSD programme be leveraged for enforcement and pull-over inspection? 95
25. What are the operational limitations of the remote sensing programme? 97
26. Is there a challenge of emissions variability? 99
27. What are the other limitations? 99
28. What is Automotive Indian Standards (AIS-170) covering remote sensing activities in India? 100
29. What are the salient points of AIS 170? 100
30. What are the gaps in AIS 170? 101
SECTION 3: WORLDWIDE REMOTE-SENSING REGULATIONS AND COMPLIANCE 103
1. Remote-sensing programme in Hong Kong 103
2. Remote-sensing programme in China 105
3. Remote-sensing programme in USA 106
4. Remote-sensing programme in Europe 111
5. Remote-sensing programme in Mexico City 1126. Remote-sensing programme in Indonesia 112
Remote monitoring of emissions from on-road vehicles report.indd 7Remote monitoring of emissions from on-road vehicles report.indd 7 24/06/22 4:47 PM24/06/22 4:47 PM

SECTION 4: WAY FORWARD: NEED GUIDANCE FRAMEWORK FOR IMPLEMENTATION OF RSD 113
1. RSD programme needs to be designed to meet a diverse set of objectives 113
2. Strengthen technical regulations on remote sensing and amend CMVR to create mandate for its implementation 114
3. Develop national guidance framework for implementation of the RSD programme in states 115
4. Support roll out of lighthouse projects on RSD in selected cities 116
5. Provide technical knowledge support to implementation of RSD programme and build awareness 116
REFERENCES 117
ANNEXURE: Understanding AIS 170 122
Remote monitoring of emissions from on-road vehicles report.indd 8Remote monitoring of emissions from on-road vehicles report.indd 8 24/06/22 4:47 PM24/06/22 4:47 PM
9
Why this study?In 2020, India became the first major vehicle producing country to leapfrog directly from Bharat Stage IV (BSIV) mass emissions standards for new vehicles and fuels to Bharat Stage VI (BSVI) standards by skipping Bharat Stage V (BSV) level altogether. This was achieved within a span of three years from the date of the notification of BSVI emissions standards in 2017. This has enabled significant improvement in technology pathways and emission levels in all segments of new vehicles.
Despite this big win, there are concerns around the emissions performance of the new technologies in the real world. Evidences have mounted in Europe to show how even after complying with the certification requirements of Euro VI emissions standards several light duty diesel vehicle models have remained high emitters on road.
Diesel gate has exposed the deliberate use of defeat devices or rigged software to circumvent the rules to pass the vehicle certification tests while emissions increase during real world operations. OEMs optimized the emission control strategy to meet very specific conditions of laboratory emission test, as opposed to designing effective emission controls for sustained and durable performance during real-world driving.
The reason for such manipulation is the conflict between fuel economy penalty associated with advanced NOx controls and consumer interest in fuel savings. Several car models were found with NOx emissions rates significantly higher than prescribed limits when driven in real world conditions. This has exacerbated air pollution problems in urban centres.
European regulators have responded to this challenge by further reforming the emissions regulations related to vehicle testing methods, in-service compliance requirements and real world driving emissions monitoring with the help of portable emissions monitors to strengthen the regulatory regime for vehicles. Spate of reforms have followed focussing on controlling real world driving emissions. As some of these requirements were already adopted for heavy duty vehicles, the focus of subsequent reforms shifted more towards light duty vehicles. These reforms have helped to reduce the emissions gaps between certification level and the real world driving emissions in Europe.
Remote monitoring of emissions from on-road vehicles report.indd 9Remote monitoring of emissions from on-road vehicles report.indd 9 24/06/22 4:47 PM24/06/22 4:47 PM

10
REMOTE MONITORING OF EMISSIONS FROM ON-ROAD VEHICLES: A PRIMER
Globally, growing interest in strong compliance regime for durable emissions performance is also catalysing improvement in on-road emissions monitoring with more advanced techniques like remote sensing measurements to make the on-road surveillance more effective and enable better emission profiling of different generation of vehicle technologies and fuel types and their on-road performance.
India is at the cusp of change. After meeting the basic norms of BSVI emissions standards in 2020, India is now gearing up for further reforms to be adopted from 2023 onwards to include real world driving emission (RDE) tests using portable emission measurement systems (PEMS) for certification of vehicles, more exacting driving test cycle, and in-service compliance requirements, among other reforms for new vehicles. In-service compliance and enforcement programme will be implemented. In-use conformity testing can ensure vehicles are meeting emission standards within set deterioration rates.
Moreover, India has already adopted vehicle recall programme. In case of failure of vehicle emission compliance at any stage of vehicle lifecycle is an important requirement. Although laws recognize the right of the central government and state governments to recall vehicles when they are not in compliance, there is no official procedure set up to carry this out in practice. A proper procedure for recalls should be drawn up in collaboration with the automotive industry. The threat of a recall, and the costs associated with it, are strong incentives for manufacturers to produce vehicles that meet standards throughout their useful life.
This has naturally triggered the interest in further advancing the monitoring of emissions from in-use vehicles to ensure that vehicles remain low emitting on road.
However, the current on-road vehicle inspection programme called pollution under control certificate programme (PUC), is based on simple idle testing of carbon monoxide and hydrocarbon at two speed idle tests along with Lambda test for petrol vehicles and smoke density test for diesel vehicles. PUC is a weak programme as it is difficult to do quality control and ensure credible tests in large number of small and decentralised test centres with poorly skilled staff. The overall compliance level in terms of number of vehicles turning up for tests is also very low in most parts of India.
Moreover, vehicle re-registration is required only after 15 years of initial purchase. Nor are vehicle registration, proof of insurance, and PUC certification coordinated through a system that would allow for the verification of all at the same time. This may improve if annual registration for all vehicles is implemented, including
Remote monitoring of emissions from on-road vehicles report.indd 10Remote monitoring of emissions from on-road vehicles report.indd 10 24/06/22 4:47 PM24/06/22 4:47 PM

11
PUC testing and other I/M procedures. This will have the advantage of creating a system in which multiple vehicle regulations are dealt with at once. It will also ensure that PUC testing is done for owners to register vehicles.
However, the enforcement program and in-use test procedures based on simple idling test only passes or fails a vehicle. A full-scale mass emission test would be more representative of actual vehicle condition.
The archaic programme is not designed to address emission performance of new generation emissions control technologies and related surveillance requirements. Cities need large scale screening of emissions performance of the fleet, identification of the worst polluters for effective remedial action, profiling of emissions from different genre of vehicle technologies and fuel types, providing feedback on real world emission performance of the technologies, ensuring more effective enforcement and implementing new generation strategies like low emissions zones. PUC is not designed for that.
Globally, cities are moving towards more advanced systems of remote sensing monitoring to replace or supplement simple physical tests that are difficult to monitor and enforce, with more smart remote monitoring approaches that have now become possible.
Simply put, remote sensing is a light source and a detector that is placed on the side of the road or at a height to transmit a laser beam to measure exhaust emissions remotely via spectroscopy as vehicles pass by and cross the light path. This can measure exhaust plume, and detect a range of pollutants including opacity, nitric oxide, carbon monoxide, hydrocarbons, and carbon monoxide in 0.5 seconds in the exhaust plumes of vehicles. This allows emissions measurements of large number of vehicles when they are being driven on the road and thus, do not require physical tests.
This can record emission rates from thousands of individual vehicles along with speed and acceleration across all driving conditions daily. This can test several vehicles per hour and within an interval of one second. A camera captures the image of the vehicle’s number plate which, if connected with a vehicle registration database, can identify the make, model, certified emission standard, fuel type, rated power and other details. This system can screen large number of vehicles in a day.
Globally, remote sensing is implemented with certain key objectives – i) Identify high emitting vehicles that are the worst polluters on road to pull them over for
Remote monitoring of emissions from on-road vehicles report.indd 11Remote monitoring of emissions from on-road vehicles report.indd 11 24/06/22 4:47 PM24/06/22 4:47 PM

12
REMOTE MONITORING OF EMISSIONS FROM ON-ROAD VEHICLES: A PRIMER
proper checks and repair; ii) Clean screening of vehicles so that low emitting vehicles do not have to unnecessarily go for physical emissions inspection tests and avoid adding to the cost of inspection; iii) characterize the emissions profile of the on-road fleet that can help to evaluate the established inspection and maintenance programmes and also provide feedback on the technology performance; and Iv) Use this monitoring system to regulate and restrict movement of polluting vehicles in low emissions zones earmarked in cities.
Moreover, remote sensing helps to detect individual high-emitting vehicles that are caused by poor vehicle maintenance, or removal and tampering of emission control systems, or accidental malfunctioning of emission control equipment among others. The problem could also be with the manufacturing of vehicles that may lead to poor design or defects in the emissions control components or poor durability of the emissions control-related components and intentional cheating of emissions standards and the use of defeat devices. Thus, an advanced emissions monitoring system can help to address a diverse set of objectives.
India has to take the decision on advancing on-road emissions monitoring. The mandate for such an application is emerging slowly in India. The first ever mandate came in the city of Kolkata in 2010 when the Calcutta High Court while addressing the problem of emissions from old vehicles had asked for such an upgradation of on-road emissions monitoring. Ever since then remote sensing monitoring is being carried out in the city on a limited scale for enforcement.
Subsequently, International Centre for Automotive Technology (ICAT) the vehicle testing agency in India, has carried out a pilot project on remote sensing in Delhi. This was taken note of by the Supreme Court of India in the ongoing public interest litigation on air pollution in Delhi and the National Capital Region (NCR). Following the recommendations from its former monitoring body Environment Pollution (Prevention and Control) Authority (EPCA) the Supreme Court had directed the Ministry of Road Transport and Highways (MoRTH) to frame the appropriate rules for its implementation and directed the Delhi government to implement the programme during 2018-19. In response MoRTH has drafted the rules under the Automotive Indian Standard 170.
In the meantime, several cities that are implementing their respective clean air action plans under the National Clean Air Programme (NCAP) have included remote sensing measurements as part of their mitigation strategy for vehicular pollution. These cities include Mumbai in Maharashtra, Kolkata, Asansol, Barrackpore, Durgapur, Haldia, Raniganj in West Bengal and Bhubaneswar in
Remote monitoring of emissions from on-road vehicles report.indd 12Remote monitoring of emissions from on-road vehicles report.indd 12 24/06/22 4:47 PM24/06/22 4:47 PM

13
Odisha. Delhi has already been mandated to implement the RSD programme by the Supreme Court of India.
This has created opportunities for developing a framework for implementation in cities. Being a very new area of intervention there is very little understanding of this new monitoring technique and associated regulatory framework. There is considerable curiosity about the scope and nature of this programme.
In view of this Centre for Science and Environment (CSE) has decided to create this primer to address the frequently asked questions that the regulatory and implementing agencies are asking. CSE has engaged with several state transport departments to understand the key regulatory and technical questions related to this programme.
There is considerable curiosity about the nature and scope of application of remote sensing system, its application vis a vis the PUC programme, type of remote sensing technology and instrumentation, method of emission measurements, data processing and analytics, programme design, fleet screening, cost of the programme, enforcement strategy, and the rules and regulations that need to govern this program.
There is also a strong interest in understanding this strategy against the backdrop of the rapidly evolving mass emissions standards and testing procedures with the shifting focus on real world driving emissions and its monitoring strategy. This inter-linkage is important.
To demystify the key aspects of remote sensing application and its technical complexity this primer is the first step towards informing the national level guidance framework for adoption and implementation of remote sensing measurement system in Indian cities.
This review has therefore tapped into the global learning curve and drawn lessons from the local pilot projects carried out in Indian cities of Delhi and Kolkata. Very little knowledge and information exist in public domain on remote sensing. Globally, a substantial part of the global assessment has been carried out by the International Council on Clean Transportation (ICCT) along with the global initiative on Real Urban Emissions initiative. This network has generated substantive part of the global knowledge and evidences from the initiatives implemented in cities of the US, Europe and China.
Remote monitoring of emissions from on-road vehicles report.indd 13Remote monitoring of emissions from on-road vehicles report.indd 13 24/06/22 4:47 PM24/06/22 4:47 PM

14
REMOTE MONITORING OF EMISSIONS FROM ON-ROAD VEHICLES: A PRIMER
In India, the lead has been taken by the International Centre for Automotive Technology (ICAT), the vehicle testing and certification agency, that has carried out a pilot project in Delhi in 2018 and generated substantial local evidences and insights for designing of a RSD programme. In addition to this, Kolkata, the capital city of West Bengal, has already implemented this programme on a limited scale following a directive from the Calcutta High Court in the context of phasing out of old vehicles in the city. This programme is in place for about 10 years and is being used to issue notices to the vehicle owners who are non-compliant. This programme is awaiting further modernisation and needs guidance based on the learning from the new initiatives globally.
In the meantime, MoRTH has framed the Automotive Indian Standards 170 (AIS-170) which provides the technical guidance on remote sensing equipment, remote sensing data analytic and reporting, designing of the programme, installation, networking, and data sharing and it is also expected to recommend gross polluter thresholds for different vehicle and different fuel types.
While this is a useful document that can provide guidance on its implementation to the state governments there are still gaps that need to be addressed to make this document more robust. The AIS-170 document needs to provide more detailed guidance/or procedures for designing the programme in terms of selecting sites of RSD measurement, procedures for data analysis for implementation of RSD programme, guidance on estimation of emissions cut points for high emitters vehicles or provide guidelines on how PUC and remote sensing can co-exists and what will be considered for vehicles to be declared compliant or non-compliant.
While AIS 170 is work in progress, parallel action is needed to notify the provision of remote sensing monitoring under the Central Motor Vehicle Act and Rules to make its implementation a legal requirement.
Centre for Science and Environment has conducted this review of remote sensing strategies against the backdrop of evolving emissions regulations for vehicles, in partnership with the EbyT Technologies Private Ltd that was also involved with the designing of the pilot project of ICAT in Delhi. CSE has also engaged with the ICCT to get insight and guidance on this programme and to leverage its research in this area.
This primer is designed to answer the specific questions that have emerged from the several transport departments in due course of implementing several initiatives related to clean air action in states.
Remote monitoring of emissions from on-road vehicles report.indd 14Remote monitoring of emissions from on-road vehicles report.indd 14 24/06/22 4:47 PM24/06/22 4:47 PM

15
Next stepsThis review had made it clear that given the inherent weaknesses of the PUC programme (plagued by very low level of compliance, inadequate calibration of equipment, lack of audit of PUC centres, improper tests, and vulnerability to fraud)—there is virtually no alternative effective mechanism for robust surveillance. This poses serious risks as all emissions control equipment are designed for certain efficiency and durability for the life span of the vehicles. If vehicles are not watched carefully for good maintenance practices, quality manufacturing and emissions cheating, the polluted cities of India can be in serious trouble. Remote sensing can certainly help with large-scale screening, surveillance and compliance.
Consistent with the global trend, application of remote sensing needs to gather momentum in India along with appropriate regulatory framework. It is therefore necessary to pay attention to the following aspects of the RSD programme design and implementation.
1. RSD programme needs to be designed to meet a diverse set of objectivesThe objectives include:(a) Identify high emitting vehicles that are the super emitter through “dirty
screening” and to pull them over for proper checks and repair. This ‘dirty screening’ identifies vehicles that are not in compliance and need to be sent for proper inspection.
(b) Identify low emitting vehicles through the “clean screening” so that they do not have to unnecessarily go for physical emission inspection tests. This reduces the cost of inspection testing and improves public acceptance of the programme.
(c) Improve detection of tampering with emission control systems in vehicles: Individual vehicles may have non-functional emissions control systems, either due to malfunction or tampering. RSD application can detect and discourage tampering and identify malfunctioning vehicles for repair.
(d) Characterize the emission factors of the on-road fleet to evaluate the established inspection and maintenance programme and to provide feedback on the technology’s performance. This can help to assess vehicle deterioration over several years and help to develop deterioration factors for policy implementation.
Remote monitoring of emissions from on-road vehicles report.indd 15Remote monitoring of emissions from on-road vehicles report.indd 15 24/06/22 4:47 PM24/06/22 4:47 PM

16
REMOTE MONITORING OF EMISSIONS FROM ON-ROAD VEHICLES: A PRIMER
(e) Address real world emissions performance. Evidences from different geographies have proven that tighter emissions regulations do not necessarily translate into lower emissions from in-use vehicles. Lax regulatory regime can also be exploited by vehicle manufacturers as was noted in the diesel gate scandal. These challenges have also created the need for extra vigilance and need for alternative emissions measurement methods including remote sensing device.
(f) Public awareness to build support for developing new policy based on real-world emissions data. Cities can build public support and encourage low emissions zones and scrappage policy. This can help vehicle owners to better understand the need for policies to remove polluting vehicles from road.
2. Strengthen technical regulations on remote sensing and amend CMVR to create mandate for its implementation The Ministry of Road Transport and Highways (MoRTH) is framing the AIS 170 technical regulations for RSD implementation. While this needs to be further strengthened, it is also necessary to amend the CMVR to give a mandate and define the rules for its implementation and enforcement. The rules need to define the scope of its implementation.
Simultaneously, MORTH needs to address the current gaps in AIS 170 document to make the guidance more robust. It may be noted that in the 60th Meeting of Standing Committee on Implementation of Emission Legislation (SCOE) held on 22nd August 2019 and an AIS panel was constituted to finalize technical guidance on remote sensing equipment, remote sensing data reporting which specifies design, construction, networking, and data sharing of a motor vehicle and recommend polluter thresholds for different vehicle and different fuel types. Subsequently, in the 61st Meeting of SCOE held on 13th February 2020, it was directed to consider polluter thresholds based on prevalent emission norms, and in the absence of authentic data for these thresholds, the Committee had agreed to consider the first year as monitoring phase to arrive at threshold values. This may be taken forward.
The AIS 170 are being framed to provide technical guidance on remote sensing equipment, remote sensing data reporting and analytics, design, construction, networking, and data sharing of motor vehicle and to recommend polluter thresholds for different vehicle and different fuel types. As observed earlier, the AIS 170 defines the RSD equipment device specifications such as equipment range
Remote monitoring of emissions from on-road vehicles report.indd 16Remote monitoring of emissions from on-road vehicles report.indd 16 24/06/22 4:47 PM24/06/22 4:47 PM

17
and accuracy for emission pollutants. The specifications define device’s emission measurement capabilities to be followed while implementing RSD programs. AIS 170 document should comprehensively address all the regulatory issues for implementation.
As ICCT has further recommended with respect to AIS 170, it is crucial that the draft makes it mandatory to measure CO2 absorption. RS does not measure tailpipe concentration directly. It is recalculated from the pollutant/CO2 absorptions ratio (and only done correctly for stochiometric engines, therefore not for diesels). Without CO2 absorption, pollutant absorptions alone are hardly useful. ICCT also recommends making NO measurement mandatory, as well as primary NO2. Modern diesel can emit up to 50 per cent of NOx as NO2. There can be a risk that RS with NO, but without NO2, will underestimate real-world NOx emissions of diesel vehicles.
While this is work in progress, quicker efforts are needed to address the gaps. For instance, elaborate the procedure for site selection for remote sensing; define the scope and nature of data analysis needed; classify different remote sensing technologies that are available in the market and what technologies will be best suited for India; give details on how emissions cut points are to be derived above which a vehicle is considered high emitter; provide clear guidelines on how PUC and remote sensing can co-exists and if the vehicle needs to pass both to remain road worthy; what regulatory action is needed in case a vehicle is identified as high emitter; and provide details on how the computer system at monitoring site should communicate with VAHAN database. Also provide guidance on technology requirements from NIC (National Informatics Centre) to be followed if some entity wants to access VAHAN data for implementing remote sensing program. All these limitations in the current AIS 170 need to be addressed for finalization.
3. Develop national guidance framework for implementation of RSD programme in states National-level enforcement framework needs to be defined under the Central Motor Vehicles Act and Rules to enable implementation of RSD programme across the country. Ministry of Road Transport and Highways needs to amend the Motor vehicle Rules to incorporate the provision of remote sensing monitoring for enforcement and to provide legal back up to its implementation and enforcement in cities.
The RSD programme requires a national guidance framework to guide cities on its implementation and detail out the full scope of implementation including
Remote monitoring of emissions from on-road vehicles report.indd 17Remote monitoring of emissions from on-road vehicles report.indd 17 24/06/22 4:47 PM24/06/22 4:47 PM

18
REMOTE MONITORING OF EMISSIONS FROM ON-ROAD VEHICLES: A PRIMER
technology and site selection, system design, data analytics, enforcement strategies, fleet screening, technology feedback system, management of old vehicles, enabling low emissions zones among others.
This also requires a clear legal framework for technology adoption and prevent legal dispute between vehicle owners with valid PUC certificate and authorities who have identified their vehicles as high emitter through remote sensing device. MoRTH needs to issue a notification under CMVR to make this programme enforceable and not keep it discretionary.
4. Support roll out of lighthouse projects on RSD in selected citiesAs this is a very new area of intervention and cities do not have experience, it is necessary to support the first set of programmes in selected cities including those that have already taken steps in this direction including Delhi and Kolkata to implement the RSD programme. These can be the lighthouse projects to demonstrate the pathways and systems for implementation and enforcement in Indian cities. This will also help to build local market for RSD technologies in India. This is needed to build confidence and capacity of the implementing agencies in cities. State governments with support from the central government can plan the time bound phase in and designing of the programme.
5. Provide technical knowledge support to implementation of RSD programme and build awarenessCities that will design and implement new programmes as part of their clean air action plans and those who have established programme like Kolkata need technical support and capacity building. Vehicle testing agencies and the appropriate technical bodies need to provide technical knowledge support to the state governments related to instrumentation, data analytics, network and system design, adoption of gross polluter threshold, clean and dirty screening approaches, among others. Such application can open up several opportunities for regulatory interventions for pollution control. These include enforcement of low emissions zones.
Remote monitoring of emissions from on-road vehicles report.indd 18Remote monitoring of emissions from on-road vehicles report.indd 18 24/06/22 4:47 PM24/06/22 4:47 PM

19
SECTION 1: How the focus of new vehicle-emission regulations is shifting towards real-world emissions performance
1. How have mass emission regulations evolved in India?Indian regulations for four-wheeled vehicles follow European Union regulatory pathways. The implementation of progressive standards in India has generally lagged behind equivalent EU standards by about 5 years in major cities and 10 years nationwide. In general, standards for two- and three-wheeled vehicles have been developed independently, and do not follow the European model. In India, BS VI emission regulations came into effect from April 1, 2020. India did not go with BS V implementation and directly jumped to BS VI implementation. Emission regulations have harmonized across India at BSVI level.
BS VI NOx and PM emissions limits for light duty diesel vehicles are lower than BS IV levels. NOX emission limits are reduced by 68 per cent relative to BS IV levels. PM emission limit reductions vary by vehicle class and range from 82 per cent –93 per cent. For all light-duty diesel vehicle classes, the tightening of the PM emission standard is accompanied by the introduction of a particle number (PN) emission limit of 6 × 1,011/km. Together, the more stringent PM standard and new PN limit will ensure vehicle manufacturers use DPFs, the best available PM control technology for diesel engines.
For SI engines in BS VI standards, limits for CO and HC remain same from corresponding limits of CO and HC. NOx limits are reduced by 25 per cent. BS VI also proposes PM and PN emission limits for gasoline direct injection engines. PM and PN emission limits for gasoline direct injection (GDI) vehicles are set at the same level as those for light-duty diesel vehicles, though manufacturers may meet an optional 6×10¹²/km PN limit rather than the more stringent 6×10¹¹/km during the first three years of BS VI implementation. Tighter BSVI emission standards should promote the use of gasoline particulate filters (GPF) to control PM emissions from GDI vehicles (see box: Successive stages of mass emissions standards for new vehicles in India).
Remote monitoring of emissions from on-road vehicles report.indd 19Remote monitoring of emissions from on-road vehicles report.indd 19 24/06/22 4:47 PM24/06/22 4:47 PM

20
REMOTE MONITORING OF EMISSIONS FROM ON-ROAD VEHICLES: A PRIMER
For heavy-duty vehicles, PM limits are reduced by 50 per cent and 67 per cent from BS IV levels as measured on steady-state and transient dynamometer test cycles, respectively. The more stringent PM standard is accompanied by a particle number emission standard of 8 × 10¹¹/kWh for steady-state cycle testing and 6 × 10¹¹/kWh for transient cycle testing. PN emission limit is introduced for first time in BS VI standard.
Unlike BS IV standards, WHTC and WHSC are laboratory test cycles followed in BS VI standards for heavy duty vehicles. The WHSC and WHTC are more representative of real-world driving conditions and better capture driving modes where pollutant emissions can be elevated, such as low-speed, low-load driving. Specifically, the WHSC include average engine load about half that of the ESC, while the WHTC requires both cold and hot start conditions and includes more than twice the idling time of the ETC.
2. How have regulatory emissions testing methods for compliance evolved in India?The purpose of all vehicle emission testing is to standardize the way different vehicles are certified for emissions and to ensure that vehicles are tested and certified as close to real driving conditions. To ensure vehicle compliance towards emission regulation various testing requirements are followed.
Laboratory testing for vehicle certification: Lab testing is carried out on a chassis dynamometer in a specially designed testing facility. At least two of the wheels of the vehicle are spinning during the test, but the vehicle itself remains stationary. The driving resistances (vehicle inertia, rolling resistance, aerodynamic resistance) are previously determined in a separate test (the road load test) and are then simulated in the laboratory by adjusting the resistance of the chassis dynamometer. The exhaust of the vehicle is collected and analysed to calculate emission levels and fuel consumption for the test cycle. Details of the test cycle (speeds, accelerations, etc.) and test procedure (ambient temperature, etc.) are defined in a test protocol (for example, NEDC in the EU). Results of vehicle laboratory testing are generally reproducible, i.e. if two different laboratories test the same vehicle and apply the same testing conditions, they then should obtain very similar test results. On the other hand, vehicle laboratory testing is somewhat artificial and not fully representative of real-world driving, which often results in unrealistically low emission levels. To overcome this shortcoming, a series of laboratory tests under different conditions can be carried out for one vehicle to better represent the full range of real-world driving situations.
Remote monitoring of emissions from on-road vehicles report.indd 20Remote monitoring of emissions from on-road vehicles report.indd 20 24/06/22 4:47 PM24/06/22 4:47 PM
21
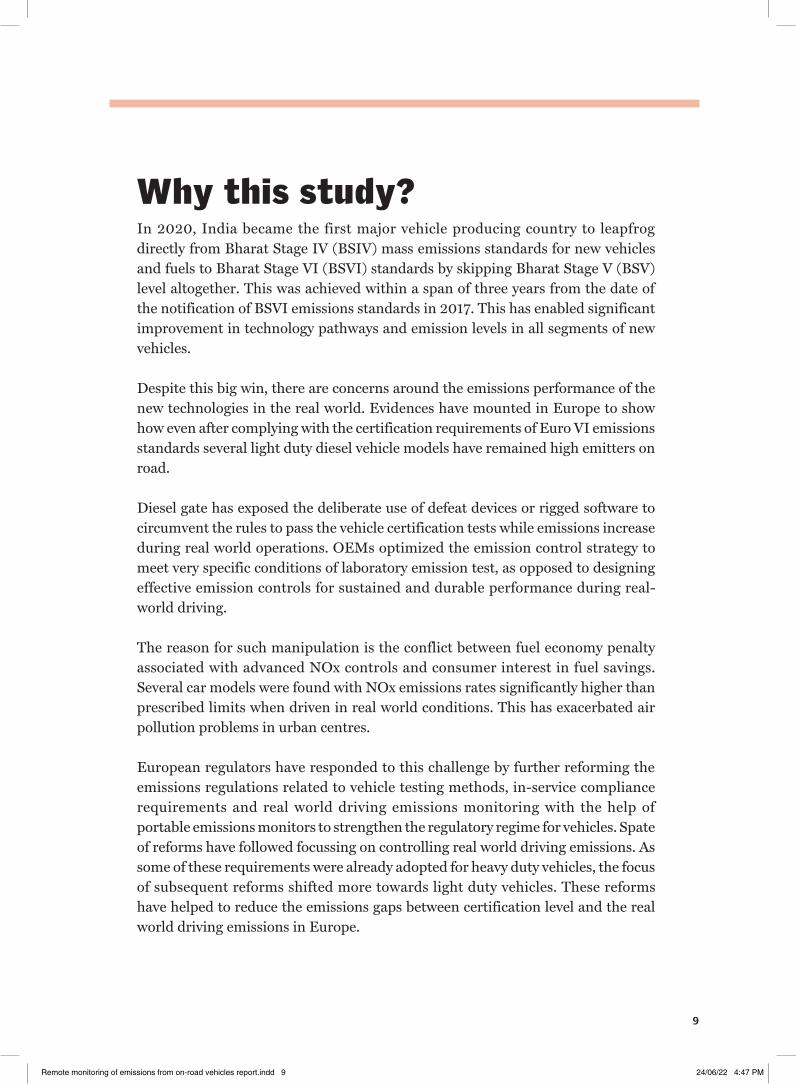
SUCCESSIVE STAGES OF MASS EMISSIONS STANDARDS FOR NEW VEHICLES IN INDIA
Indian BS III to BS VI emission limits for different pollutants for light duty diesel vehicles
Item Unit BS3 BS4 Euro 5 BS6
CO g/km 0.64 0.50 0.5 0.50
HC+NOX g/km 0.56 0.30 0.23 0.17
NOX g/km 0.50 0.25 0.18 0.08
PM g/km 0.05 0.025 0.0045 0.0045
PN Number NA NA 6 X 10¹¹ 6 X 10¹¹
New requirement in BS 6
Indian BS III to BS VI emission limits for different pollutants for light duty petrol and CNG vehicles
Item Unit BS3 BS4 Euro 5 BS6
CO g/km 2.3 1.0 1.0 1.0
HC g/km 0.20 0.10 0.10 0.10
NOX g/km 0.15 0.08 0.06 0.06
PM* g/km NA NA NA 0.0045
PN* Number NA NA NA 6 X 10¹¹
New requirement in BS 6
*PM and PN limits are applicable for direct injection system
Note: Like BS IV, NEDC vehicle cycle is followed for type approval for certifying BS VI vehicles. Implementation date of WLTC cycle is yet not finalized.
Remote monitoring of emissions from on-road vehicles report.indd 21Remote monitoring of emissions from on-road vehicles report.indd 21 24/06/22 4:47 PM24/06/22 4:47 PM

22
REMOTE MONITORING OF EMISSIONS FROM ON-ROAD VEHICLES: A PRIMER
On-road testing: On-road testing is carried out on a vehicle while driving on a normal road, being part of the normal traffic flow. The most widely used technique for on-road emissions testing is PEMS, which involves equipping the vehicle with portable, on-board analysers. The main PEMS unit is temporarily attached to the back of the vehicle, and the vehicle exhaust is collected, analysed, and recorded as it is driven. On-road testing results are highly representative of real world driving when carried out under everyday driving conditions.
However, the results are only representative of the driving conditions of the individual test, and they lack the reproducibility of laboratory tests, making it challenging to incorporate these techniques in regulations. In addition, the results are influenced by uncontrolled sources of variability (e.g., traffic or weather conditions), and they are thus not easily reproducible, i.e., testing the same vehicle at two different locations will produce two different results. Even testing the same vehicle at the same location twice will likely give two different results. In return, on road tests provide the most complete information about the real-world emissions behaviour of vehicles and are excellent tools for linking specific driving conditions to emission rates and identifying shortcomings in the control of certain pollutants.
Indian BS III to BS VI emission limits for different pollutants for heavy duty diesel vehicles
Item Unit BS3 BS4 Euro 5 BS6
CO g/kWh 5.45 4.0 4.0 4.0
NOXg/kWh 5.00 3.5 2.0 0.46
NMHC g/kWh 0.78 0.55 0.55 NA
Methane g/kWh 1.60 1.10 1.10 0.50
THC* g/kWh NA NA NA 0.16
PM g/kWh 0.16 0.03 0.03 0.01
PN Number NA NA NA 6 X 10¹¹
NH3 g/kWh NA NA NA 0.01
New requirement in BS 6
(*NMHC is replaced by THC in BS6)
Remote monitoring of emissions from on-road vehicles report.indd 22Remote monitoring of emissions from on-road vehicles report.indd 22 24/06/22 4:47 PM24/06/22 4:47 PM

23
3. How have vehicle emission and compliance programmes evolved in India?In India, six government-owned autonomous test agencies are tasked with doing type approval and COP testing. A vehicle manufacturer sends new vehicles for type approval to any one of the agencies for certification. If the vehicle passes the test, a certification is issued. It the emission test on prototype vehicle fails, the vehicle is rejected and sent back to the manufacturer, who then rectifies the vehicle for any faults and resubmits the vehicle for type approval to testing agencies. For confirmatory of production, a testing agency must select from manufacturer assembly line randomly but at specified periodicity.
Before vehicle selection, test agency must intimate to the manufacturer the month in which the vehicle must be selected. The manufacturer services the vehicle before the emission tests will be performed. COP tests are conducted once or twice a year for four-wheeled vehicles, depending on production quantity. For two- and three-wheelers, COP tests are conducted every three months, every six months, or once a year, depending on vehicle production. Sample sizes are between 10 and 100 vehicles in most cases. In cases where production volume is less than 250 vehicles every six months, a minimum of five vehicles must be tested.
In vehicle emission tests from CoP, the statistical mean of emission should be below set norms to get the CoP certificate. In case of failure, test agencies send the copies of test report from type approval test to MoRTH (Ministry of Road Transport and Highway), which has the final authority in deciding to withdraw type approval certificate from manufacturer. In this process MoRTH also considers recommendations and advice of SCOE (Standing Committee on Implementation of Emission Legislation) and manufacturer.
In case the type-approval certificate is withdrawn, manufacturer is given a chance to rectify the problem and resubmit the vehicle for testing. If the vehicle passes the second test, type approval certificate is approved. If failure occurs again, the process detailed in the previous paragraph is repeated. This can continue until up to 32 vehicles have failed COP testing. After this, MoRTH takes further action including ordering a vehicle recall of all the vehicles failing the COP tests.
For in-use compliance testing, currently only commercial vehicles are required annually to go for annual fitness tests starting just two years after their original sale. Private vehicles are not required to undergo annual fitness tests until after 15 years of their registration. For type-approval and COP testing, India has taken steps to bolster its compliance and enforcement program over the past decade. Nevertheless,
Remote monitoring of emissions from on-road vehicles report.indd 23Remote monitoring of emissions from on-road vehicles report.indd 23 24/06/22 4:47 PM24/06/22 4:47 PM

24
REMOTE MONITORING OF EMISSIONS FROM ON-ROAD VEHICLES: A PRIMER
problems persist, and the system can be improved further. This is essential as the emission control systems are advancing rapidly and becoming more sophisticated. These require strong monitoring to optimise their life long performance on road (see box: New generation emission control technologies in BSVI vehicles).
The following are the main differences between India’s emission compliance programme and world’s best practices followed for vehicle emissions compliance:
· In India there is no central regulatory agency to regulate vehicle emission compliance issues, making enforcement of vehicle emission compliance difficult. There should be one central regulator that should be responsible to frame comprehensive vehicle emission compliance programme.
· India also lacks in-use conformity testing that is carried out at the national level. While the COP programme is intended to ensure that all new vehicles meet standards, the lack of in-use conformity testing prevents the country from testing a representative sample of vehicles on the road to ensure that they are meeting emission standards within set deterioration rates.
· Vehicle registration in India is not required until 15 years after initial purchase. Nor are vehicle registration, proof of insurance and PUC certification coordinated through a system that allows for the verification of all at the same time. India can implement annual registration for all vehicles, encompassing PUC testing and other I/M procedures. This will have the advantage of creating a system in which multiple vehicle regulations are dealt with at once. It will also ensure that PUC testing is done for owners to register vehicles.
· India’s enforcement programme that is not up to par with international best practices is its in-use test procedures. In India, a simple idling test is conducted that only passes or fails a vehicle. A full-scale mass emission test would be more representative of actual vehicle condition.
· Vehicle recalls in case of failure of vehicle emission compliance at any stage of vehicle lifecycle is an important requirement. In India, although laws recognize the right of the central government and state governments to recall vehicles when they are not in compliance, there is no official procedure set up to carry this out in practice. A proper procedure for recalls should be drawn up in collaboration with the automotive industry. The threat of a recall, and the costs associated with it, are strong incentives for manufacturers to produce vehicles that meet standards throughout their useful life.
Remote monitoring of emissions from on-road vehicles report.indd 24Remote monitoring of emissions from on-road vehicles report.indd 24 24/06/22 4:47 PM24/06/22 4:47 PM

25
NEW-GENERATION EMISSION-CONTROL TECHNOLOGIES IN BSVI VEHICLES
In India BS VI comes into effect, after 1st April 2020 for the type approval of all new vehicles sold. From BS IV to BS VI, there is 68 per cent reduction in NOx and 82 per cent reduction in PM. Moreover, new particle number limit is also introduced from BS VI. Such emission reduction requires introduction of new after treatment technologies. The following sections presents a brief overview of emission reduction technologies needed to comply with BS VI regulations.
NOX AND PM REDUCTION TECHNOLOGIESNOx control for BS VI light-duty vehicles is based primarily on two technologies: lean NOx traps (LNTs) and selective catalytic reduction (SCR). These technologies can be applied in combination with exhaust gas recirculation (EGR) or with in-cylinder control strategies (e.g., fuel injection delay and other combustion improvements that reduce the need for aftertreatment systems).
IN CYLINDER CONTROLIn cylinder control strategies adjust combustion process to keep engine out emissions at low level. Such strategies include aggressive use of EGR (Exhaust Gas recirculation), compression ratio reduction, use of two-stage turbocharging, variable valve lift, combustion chamber reshaping, and a reduction of fuel injection pressure. The main drawback of relying solely on in cylinder control strategies is that these strategies have limited success in controlling NOx emissions at engine high load operations. Light duty cycle such as NEDC do not have engine high load event and as such can still be made emission compliant without a NOx aftertreatment control system. However, vehicle emissions behaviour will be unsatisfactory in real world driving scenario where frequent high load engine operations are encountered.
SELECTIVE CATALYTIC REDUCTION (SCR)SCR stands for selective catalytic reduction. It is an aftertreatment technology that chemically breaks down NOx. This requires an injection of aqueous solution of Urea, that serves as a reducing agent for NOx. Urea solution is stored in a separate tank mounted on a vehicle chassis and must be refilled periodically. Urea vaporizes in the exhaust to yield CO2 and ammonia (NH3). NOx emissions in the exhaust gas react with the NH3 in the catalyst to yield gaseous nitrogen (N2) and water. SCR aftertreatment technology is needed primarily for heavy-duty vehicle from BS IV onwards. However, SCR technology have made great advances such that their application to light duty vehicles is also now possible. SCR technology suffers some drawbacks. SCR requires that catalyst temperature should be in a particular range to effectively reduce NOx. Due to this SCR is not suited for vehicle applications where the vehicle operations are performed in cold ambient conditions or urban driving where there is stop and go kind of traffic.
The effectiveness of an SCR system in reducing NOx emissions is dependent on a host of design parameters, including catalyst material, catalyst volume, urea dosing/control strategy, and physical system layout. It is also temperature-dependent: Below some threshold for exhaust temperature, the injected urea cannot be converted to NH3. At low exhaust temperatures, catalyst activity also falls sharply.
LEAN NOX TRAPS (LNT)Lean NOx traps combine oxidation and reduction catalysts with an NOx adsorber that chemically binds and stores NOx under lean-burn conditions when the engine operates with excess air as compared what is required under stoichiometric conditions. The oxidation catalyst converts NO to NO2 in engine lean operations. NO2 is stored as nitrate in catalyst wash coat. When NOx trap is saturated and there is no further capacity to store more NO2,
Remote monitoring of emissions from on-road vehicles report.indd 25Remote monitoring of emissions from on-road vehicles report.indd 25 24/06/22 4:47 PM24/06/22 4:47 PM

26
REMOTE MONITORING OF EMISSIONS FROM ON-ROAD VEHICLES: A PRIMER
the catalyst is regenerated. During NOx trap regeneration the engine operation is switched to fuel rich mode for few seconds. This causes the stored NOx to be desorbed and subsequently reduced to N2 and O2 in the reduction catalyst.
Unlike SCR, LNT does not require external reducing agent and they are much more compact and lighter compared to SCR. Therefore, it is a preferred NOx aftertreatment device for light duty vehicles. Periodical, regeneration of NOx trap induces a fuel penalty typically in range of 2–4 per cent. NOx adsorbers also adsorb sulphur oxides and therefore require ultra-low sulphur content (below 15 ppm) in the diesel fuel. Also, since sulphur oxides are more difficult to desorb than NOx, LNTs need to run periodical desulfation regeneration cycles to remove them.
One of most challenging aspect of integrating LNT in vehicle application is minimizing impact of fuel penalty and simultaneously achieving a NOx reduction as desired. Another problem with LNTs is that the NOx storage capacity of the catalyst is fixed. This means that, as engine load increases, the frequency of trap regeneration events also needs to increase, and this carries additional fuel penalties.
DIESEL OXIDATION CATALYST (DOC)Diesel oxidation catalyst are catalytic converters designed to reduce Carbon Monoxide (CO), Hydrocarbon (HC) and particulate emissions from diesel engine. The diesel oxidation catalyst is designed to oxidize carbon monoxide, gas phase hydrocarbons, and the soluble organic fraction (SOF) of diesel particulate matter to CO2 and H2O. Another purpose of DOC is to regenerate the downstream Diesel Particulate Filter (DPF) which traps small black carbon particles. When the filter needs to be regenerated small fuel is injected either late in combustion cycle or just upstream to DOC to increase the DOC temperature. Successful operation of DOC requires low sulphur fuel (less than 10 ppm) else the DOC catalyst gets poisoned.
DIESEL PARTICULATE FILTER (DPF)Diesel particulate filters (DPF) are devices that physically capture diesel particulates to prevent their release to the atmosphere. They have filtration efficiency of more than 90%. Diesel particulate filters have become the most effective technology for the control of diesel particulate emissions. Collected particulates are removed from the filter, continuously or periodically, through thermal regeneration. Diesel filters are highly effective in controlling solid particulate emissions.
Diesel particulate filters can quickly accumulate considerable volumes of soot. The collected particulates would eventually cause excessively high exhaust gas pressure drop in the filter, which would negatively affect the engine operation. Therefore, diesel particulate filter systems must provide a way of removing particulates from the filter to restore its soot collection capacity. This removal of particulates, known as the filter regeneration, can be performed either continuously, during regular operation of the filter, or periodically, after a pre-determined quantity of soot has been accumulated. Thermal regeneration of diesel particulate filters is typically employed, where the collected particulates are oxidized—by oxygen and/or nitrogen dioxide—to gaseous products, primarily to carbon dioxide.
To ensure that particulates are oxidized at a sufficient rate, the filter must operate at a sufficient temperature. In some filter systems, the source of heat is the exhaust gas stream itself. In this type of filter system, referred to as a passive filter, the filter regenerates continuously during the regular operation of the engine. Passive filters usually incorporate some form of a catalyst, which lowers the soot oxidation temperature to a level that can be reached by exhaust gases during the operation of the vehicle. Another approach which may be needed to facilitate reliable regeneration involves several active strategies for increasing the filter temperature (engine management, fuel combustion in the exhaust system, electric heaters, etc.). Regeneration of such devices, known as active filters, is usually performed periodically, as determined by the vehicle’s control system.
Remote monitoring of emissions from on-road vehicles report.indd 26Remote monitoring of emissions from on-road vehicles report.indd 26 24/06/22 4:47 PM24/06/22 4:47 PM

27
The Figure 1 below shows the integration of different aftertreatment technologies in modern BSVI compliant diesel engine. The exhaust aftertreatment consists of DOC which reduces carbon monoxide (CO) and hydrocarbon (HC). Next in line is DPF which is used to capture black carbon particles. DPF is closely coupled with DOC to preserve heat generated during oxidation of CO and HC. This heat is used to regenerate DPF. After collecting the particles from the gases in the DOC and DPF, there is still nitric oxide (NO) and nitrogen dioxide (NO2) left in the exhaust. The exhaust progresses from the DOC and DPF into the SCR system which converts the toxic NOx and urea mixture into harmless nitrogen gas (N2) and water vapor (H2O), which effectively eliminates harmful emissions resulting in near zero emissions from the exhaust.
ON-BOARD DIAGNOSTICS (OBD)On-board diagnostic (OBD) systems monitor the performance of engine and aftertreatment components, including those responsible for controlling emissions. The OBD system does not directly measure emissions but detects system malfunctions that could potentially lead to high emissions. The OBD system is designed to help ensure proper operation of the emission control equipment, alerting the driver in the case of malfunctions, so that vehicles meet emission limits during everyday use. OBD systems supply important feedback about engine maintenance needs and point toward potentially urgent repairs. OBD assists in the service and repair of vehicles by providing a simple, quick, and cost-effective way to identify problems by retrieving vital automobile diagnostics data. OBD systems are also a vital component of inspection and maintenance programs for reducing in-use emissions by identifying high-emitting vehicles that need repairs. OBD is also the primary means by which components covered by emissions warranty are identified.
The general OBD requirements describe when and how the OBD system must operate, and the basic rules to convey the information to the driver/mechanic. This includes detecting the malfunction, storing a trouble code, activating the malfunction indication light (MIL), and defining the contents of the freeze frame information. OBD monitoring requirements are set for each vehicle system and can be split into two categories: requirements that include emission threshold monitoring and requirements that cover general system functionality also called non-threshold monitoring. Threshold monitoring requirements apply to the most critical emission control systems. The MIL, a small lamp indicator on driver dashboard, is activated when sensors infer/detect a malfunction that has been previously correlated in the laboratory with emission levels above certain limit values. Each limit value is set
Figure 1: Integration of different aftertreatment control devices
Source: ICCT White paper—Urban off-cycle NOx emissions from Euro IV/V trucks and buses
Engine with EGR HC, CO
Reduction
DOC DPF Tailpipe
Urea dosing
UREA TANK
SCR CATALYST
PM
ReductionNOx
Reduction
N2, H2O, CO2
Remote monitoring of emissions from on-road vehicles report.indd 27Remote monitoring of emissions from on-road vehicles report.indd 27 24/06/22 4:47 PM24/06/22 4:47 PM

28
REMOTE MONITORING OF EMISSIONS FROM ON-ROAD VEHICLES: A PRIMER
4. How is the focus shifting towards real driving emissions?Even after meeting the advanced mass emissions standards, there is a wide discrepancy between certified emission levels and emission levels encountered in real world driving conditions. The emission from vehicles is certified on standard chassis dynamometer drive cycles which are a predetermined time-speed profile that the vehicle under test must follow in a laboratory while its exhaust emissions are measured. The drive cycles are laid out in such a way that they provide realistic approximation of actual conditions that vehicle encountered during real driving.
During the standard drive cycle test there is a narrow boundary such as ambient temperature, ambient pressure, vehicle speed and load profile etc. which must be followed as a part of standard procedure. This standardization is also important to ensure that results from different vehicles can be directly compared, and that all vehicles sold in a given market are held to the same standards. However, this is not always possible in real driving where the ambient temperature, pressure, vehicle speed and engine load profile can be totally different than one in which the vehicle is certified.
Increased level of stringency in controlling the regulated emissions from vehicles and lack of updates to vehicle certification procedure have encouraged engineering strategies that ensure good fuel economy within the prescribed emission limits for as long as vehicle is driven in narrow boundary conditions of the standardized test. This section will present the emission data from real world to show the divergence between certified emissions and real-world emissions. This section will also cover some of the regulatory and technical reasons that is causing the divergence in vehicle emissions.
as a multiplier of the emission standard limit (e.g. 1.5 times applicable federal test procedure (FTP) standards).
Non-threshold monitoring covers most systems and involves checking for function and rational component performance along with electrical checks for signals that compose the OBD system. This includes monitoring of certain engine and aftertreatment components for total failure, ability to achieve a designated command target, response rate to reach the specified target, circuit continuity, voltage, current, and other characteristics for each separate system. The monitoring strategies for both threshold and non-threshold monitoring must be designed to detect problems, and at the same time, avoid giving either false passes or false malfunction indications. Monitoring is expected to occur under normal driving conditions for in-use vehicles; it also must be reproducible under specific testing conditions. Some signals can be monitored continuously (e.g., circuit continuity), but others require that manufacturers define the conditions needed for the monitoring test to occur (e.g., minimum exhaust gas temperatures for catalyst light-off). (Francisco Posada and John German, 2016)
Remote monitoring of emissions from on-road vehicles report.indd 28Remote monitoring of emissions from on-road vehicles report.indd 28 24/06/22 4:47 PM24/06/22 4:47 PM

29
Modern emission control technologies are quite effective in controlling emissions from diesel engines. Pollutants such as CO and HC are controlled by DOC which is quite effective in controlling both the pollutants if engine is running hot. Similarly, PM filtration device, DPF is quite efficient in capturing 90 per cent of carbon particles.
The main problem of emission compliance comes from NOx and CO2. The emerging evidence globally show emission divergence between certified emission and real-world emissions mostly in the case of NOx and CO2 emissions.
A wide spectrum of studies available from ICCT and other agencies indicate this divergence. In the light-duty segment several manufacturers show increasing trend of NOx emissions confirmatory factors from Euro V to Euro VI standard. Substantial number of vehicles fail to qualify the regulatory RDE requirements and have confirmatory factors an order of magnitude higher than legal requirements.
Illustratively, an ICCT assessment of NOx emission results (in g/km) for Euro 5 and Euro 6 cars show the on-road NEDC emissions from most vehicles are outside the range of legal limits of 180 mg/km for Euro 5 and 80 mg/km for Euro 6. Neither driving dynamics nor narrow boundary conditions justify the high NOx emissions during on-road NEDC driving. This suggests use of defeat strategies while controlling NOx emissions in diesel passenger cars (Degraeuwe and Weiss, 2017).
Despite meeting more stringent regulatory standards for exhaust emissions, many new Euro IV and V heavy-duty trucks and buses equipped with selective catalytic reduction (SCR) systems also have significantly elevated emissions of nitrogen oxides (NOx) during in-use driving, particularly when operating in urban conditions (see Graph 1: Comparison of NOx results from Euro V and Euro VI vehicles for both on-road NEDC and RDE testing).
Yet another study from VTT shows the NOx emission comparison for Euro IV and Euro V compliant engines for two heavy duty vehicles with respect to vehicle speed. Both the vehicles are fitted with SCR system for reducing NOx emissions. But the NOx emissions from urban driving are significantly higher than rural or motorway driving in both Euro IV and Euro V vehicles.
Results of laboratory tests of 18,000-kg delivery trucks with Euro IV type-approved engines tested over both a low-speed delivery truck cycle and a high-
Remote monitoring of emissions from on-road vehicles report.indd 29Remote monitoring of emissions from on-road vehicles report.indd 29 24/06/22 4:47 PM24/06/22 4:47 PM

30
REMOTE MONITORING OF EMISSIONS FROM ON-ROAD VEHICLES: A PRIMER
speed highway cycle. In these figures, the light-blue line represents the adjusted Euro IV emissions limit. As shown, NOx emissions from all trucks were below the adjusted Euro IV limit when tested on the highway cycle, but NOx emissions from most trucks were significantly higher when tested on the delivery truck cycle ((VTT Technical Research Centre of Finland, 2009).
The effectiveness of an SCR system in reducing NOx emissions (percentage reduction of engine-out NOx) is dependent on a host of design parameters. One of the important parameters is temperature of the SCR catalyst. Below some threshold for exhaust temperature, the injected urea cannot be converted to ammonia. At low exhaust temperatures, catalyst activity also falls off sharply. This behaviour of SCR catalyst is the main reason why the SCR efficiency falls in urban driving or low engine speed operations (see Graph 2: In-use NOx emissions for 18 tonne Euro V truck).
Graph 1: Comparison of NOx results from Euro V and Euro VI vehicles for both on-road NEDC and RDE testing
0
500
1000
1500
2000
2500
0
NOXemissions (mg/km) during on-road NEDC tests
NO
X e
mis
sion
(m
g/km
) du
ring
RD
E te
sts
Euro 5 Euro 6
Euro standard
1:1 ra
tio
Euro 6 and RDE compliant
Euro
6 la
bora
tory
lim
it 8
0m
g/km
Euro
5 la
bora
tory
lim
it 1
80
mg/
km
1000500 1500 2000 2500
Source: ICCT White Paper – Road tested: Comparative overview of real-world versus type-approval NOx and CO2 emissions from diesel cars in Europe
Remote monitoring of emissions from on-road vehicles report.indd 30Remote monitoring of emissions from on-road vehicles report.indd 30 24/06/22 4:47 PM24/06/22 4:47 PM

31
5. What is causing variance between certified emissions levels and real-world driving emissions?Despite having more stringent regulatory norms, many vehicles have still significantly elevated emissions during in-use driving conditions. The elevated emissions levels are seen not only for light duty but also for heavy duty vehicles. It is necessary to understand the reasons and causes of different aspect of type approval process that might not be so effective in controlling emissions in real world conditions. There are regulatory reasons that deals with legislative and procedural aspect of certifying the vehicles emissions and there are technical reasons dealing in control strategies implemented by manufacturer.
5.1. What are the regulatory causes? It is necessary to understand some aspects of new vehicle certification test and approval system that have bearing on real world emission performance on road. As for vehicle emissions, there are several reasons for the gap between type-approval and real-world values. One of these is flexibility in road-load determination, for
Graph 2: In-use NOx emissions for 18 tonne Euro V truck
0
1
2
3
4
5
6
7
0 10 20 30 40 50 60 70 80
Average speed in km/h
NO
x em
issi
on in
g/k
Wh
NOx50% load100% load
Vehicle 3, EURO V, SCR
ETC limit
Urban Rural Motorway
Source: Kleinebrahm, M. et al. (2008). On-Board Measurements of EURO IV / V Trucks, Final Report, a research project of the Federal Environmental Agency (FKZ: 204 45 144). Germany: TUV NORD Mobilität.
Remote monitoring of emissions from on-road vehicles report.indd 31Remote monitoring of emissions from on-road vehicles report.indd 31 24/06/22 4:47 PM24/06/22 4:47 PM

32
REMOTE MONITORING OF EMISSIONS FROM ON-ROAD VEHICLES: A PRIMER
which vehicle manufacturers can generate favourable results, for example, by selecting specially prepared tires during type approval test. Vehicle manufacturers can reduce rolling friction between tire and chassis dynamometer rolls that can have significant effect in reducing CO2 emissions. Global review shows that vehicle manufacturers are also able to take advantage of many regulatory loopholes (Kühlwein - 2016).
The type approved road load values underestimate the chassis dynamometer load and lead to emission benefits. However, if the realistic road load values are used in type approval testing, then most of the manufacturer will find their vehicles significantly underperforming compared to the vehicle emission targets. This problem is compounded because the type approval agencies do not carry independent testing to verify the authenticity of manufacturer supplied road load values in Europe unlike US.
Moreover, manufacturers in Europe are not obligated to disclose road load values used in certification testing so that they can be verified by some third-party testing agency. Studies have shown that under estimating road load coefficient is one of the primary reasons of higher emissions in test cycle on-road New European Driving Cycle (NEDC) cycle that is used for emission certification of light duty vehicles in Europe.
For instance, controlling nitrogen oxides (NOx) emissions from Euro VI diesel passenger cars is one of the biggest technical challenges facing car manufacturers. The regulatory reasons include flexibility in road-load determination, road NEDC cycle comprising low engine RPM and load points and weak in-use confirmatory requirements. Technical reasons include ability to calibrate emission control devices that can reduce the effectiveness of emission control system outside the limits of test conditions to suits other requirements such as improved fuel economy or cost of urea reagent.
Passenger cars are certified on light duty cycle such as NEDC. The NEDC cycle comprised of low engine RPM (Revolutions per minute) and engine load. The Graph 3 that captures the results of studies carried out in ICAT shows the plot of engine torque with respect to engine RPM for one passenger car. All the engine RPM and load points are plotted (blue triangles) with respect to engine full load curve in solid black line. All engine operating points during NEDC lies within the narrow confine of engine operating envelope. This coupled with low road values ensures that engine operation remain within small engine operation range. Smaller engine operation range is easier to optimize for emissions as compared
Remote monitoring of emissions from on-road vehicles report.indd 32Remote monitoring of emissions from on-road vehicles report.indd 32 24/06/22 4:47 PM24/06/22 4:47 PM

33
Graph 3: Engine RPM and engine load points for NEDC cycle for passenger car
Source: Deepak Agarwal, 2018, Data derived from passenger car vehicle test on NEDC cycle conducted on chassis dynamometer
Graph 4: Engine RPM and engine load points for ETC cycle for heavy-duty vehicles
600 800 1000 1200 1400 1600 1800 2000 2200 2400
Engine RPM (RPM)
-50
0
50
100
150
200
250
300
350
Engin
e Torq
ue (N
m)
Source: Deepak Agarwal, 2018, Data derived from heavy duty engine on ETC test conducted on engine test bench
Remote monitoring of emissions from on-road vehicles report.indd 33Remote monitoring of emissions from on-road vehicles report.indd 33 24/06/22 4:47 PM24/06/22 4:47 PM

34
REMOTE MONITORING OF EMISSIONS FROM ON-ROAD VEHICLES: A PRIMER
to the entire engine operation map. ETC (engine transient cycle) which is used to certify heavy duty vehicles is shown in Graph 4. Unlike NEDC, ETC covers the whole engine operating range, causing emission optimization throughout the engine map. Thus, ETC cycle is more representative of the full range of in-use driving conditions.
High in-use NOx emissions from BS IV/VI type-approved trucks and buses during urban driving are a consequence of limitations in the type-approval process. All emission certification programs require a manufacturer to demonstrate compliance with specific numerical emission limits when the engine or vehicle is tested over one or more specific test cycles. BS IV/VI type approval is based on engine testing using the ETC and the European Steady-state Cycle (ESC). The ESC is composed of a series of steady-state engine load points while the ETC is a transient cycle in which engine speed and load are varied continually over the duration of the test.
Both these test cycles are not representative of conditions encountered in real world driving. In both the cycles engine load is relatively high, which causes the exhaust temperature to run hotter than the average exhaust temperatures of real-world driving. Furthermore, during type approval process most of the manufacturer certify their engines on warm/ hot engine. Under these conditions, SCR fitted engine operate at very good NOx conversion efficiency and can meet ETC test limits even if the system has poor NOx conversion efficiency at low exhaust temperature. SCR system having poor low-temperature NOx reduction efficiency results in elevated NOx emissions during in-use urban driving (Lowell & Kamakaté 2012).
The test cycle limitation is further compounded by weak in-use confirmatory requirements. With regards to in-use confirmatory the legislation says, “under all randomly selected load conditions, belonging to a definite control area and with the exception of specified engine operating conditions which are not subject to such a provision, the emissions sampled during a time duration as small as 30 seconds shall not exceed by more than 100 per cent the limit values”. The details on definite control area and specified engine operating conditions are not clarified in current standards. In lack of clarity of these terms, manufacturers interpret these requirements to mean that in-use emissions at any point in engine operation should not exceed twice as high as ETC legal limits.
Remote sensing and PEMS emission testing share the common objective of measuring emission of in-use vehicles. There is a strong correlation between
Remote monitoring of emissions from on-road vehicles report.indd 34Remote monitoring of emissions from on-road vehicles report.indd 34 24/06/22 4:47 PM24/06/22 4:47 PM

35
the results of emissions from PEMS and remote sensing device. To compare remote-sensing measurements with type-approval limits from PEMS or chassis dynamometer test, a solution could be to convert the fuel-specific results into distance-specific estimates. That can be done using real-world CO2 data for each vehicle model, but it would require additional information about the vehicle being measured.
5.2 What are the technical causes?A lot depends on how technical parameters are played around with. Normally, diesel vehicles with low real-world NOx emissions run with active and well-functioning EGR and SCR systems. But vehicles with higher real-world emissions seem to operate with EGR systems that are inactive or partly inactive. In that case, the SCR system is not able to reduce the high engine-out NOx emissions.
Some manufacturers are unnecessarily turning off the EGR outside of NEDC testing conditions (German, 2016a). Many manufacturers have intentionally adopted the EGR calibration in such a way that it is turned off during cold ambient temperature. At low temperatures moisture condenses on the EGR valve and pipes and trap soot from the exhaust gas leading to build up of deposits in intake manifold. On the pretext of engine protection engine manufacturer reduces the use of EGR at low ambient temperatures. Protecting engine is a valid exemption from type approval regulation. However, this exemption provides manufacturers a valid reason to frequently cut-off EGR during engine operations where it is most required. Ideally, EGR should be cut-off at colder temperature after a cold start, when engine is cold, but EGR should be restored as engine and exhaust temperatures rise.
EGR system is designed to handle EGR flow rates that are typically encountered during type approval cycles. One of the main components of EGR system includes EGR cooler that cools down the EGR gases before they are introduced into the combustion chamber. If the EGR cooler is designed to handle flow encountered during test cycle, then cooler will be undersized and function at reduced efficiency during high engine speed and load operations experienced in real world driving. Such a device would not constitute defeat device as per European regulations. However, they would be termed as defeat device as per EPA recommendations.
Desired EGR flow required to meet emission targets depends on lot of factors such as engine speed and load, turbocharger position, engine temperature etc. At high engine loads high amount of EGR is required. However, higher engine
Remote monitoring of emissions from on-road vehicles report.indd 35Remote monitoring of emissions from on-road vehicles report.indd 35 24/06/22 4:47 PM24/06/22 4:47 PM

36
REMOTE MONITORING OF EMISSIONS FROM ON-ROAD VEHICLES: A PRIMER
loads require high fresh air to burn excess fuel. Higher EGR rates during high engine load deprives, turbocharger of precious exhaust energy required to run turbocharger at higher RPMs to generate extra boost (higher boost corresponds to higher fresh air in engine) needed to burn extra fuel. Thus, at high engine load the system reaches the design trade-off point where it simultaneously requires both high EGR and high boost. It is much easier for calibration engineers to simply shut the EGR system off outside the test-cycle window than to optimize EGR strategy under all conditions. One of the challenges for regulators is to differentiate between conditions when EGR reduction is needed and when engineers are taking shortcuts (Bernard, German, Kentroti and Muncrief, 2019).
Aftertreatment systems are typically sized/designed for conditions of the test cycle. Size typically refers to what the system can handle in terms of flow rate/capacity. Conversion efficiency over the aftertreatment catalyst declines as the exhaust flow increases. To maintain conversion efficiency at larger flow rates requires a larger, more expensive catalyst than is required to pass the NEDC test. NOx emissions increase at higher engine speeds and loads because the aftertreatment catalyst has been sized to the NEDC, this would most likely be considered an illegal defeat device in the United States but not in Europe.
Manufacturers have considerable flexibility with how they design emissions strategies, such as how they calibrate a vehicle’s engine and its aftertreatment. For example, a TNO study, found that there is a considerable difference between the NOx conversion efficiency of vehicle SCR catalysts during NEDC laboratory testing and on the road (Kadjik, van Mensch, and Spreen, 2015). The vehicle manufacturers are not using the same optimized SCR conversion strategy during real world driving as they use during type approval test. The calibrated use of urea reagent (e.g., the timing of its injection to ensure that it mixes properly with exhaust gas) is one of the factors influencing SCR conversion rates. This is due to fact that manufacturers are using less urea reagent than is necessary for best NOx conversion. Due to this, real driving NOx emissions are higher than NOx emissions in certification test. The main reasons vehicle manufacturers have adapted their engine calibration strategies this way is because:
1) Cars have smaller urea tank and difficult to pack in small cars. If the reagent requirement is less than same tank can be used for travelling greater distance without the need to fill the reagent again.
2) Less urea dosing requires a smaller SCR catalyst which reduces the cost of catalyst thus reducing the cost of whole vehicle.
Remote monitoring of emissions from on-road vehicles report.indd 36Remote monitoring of emissions from on-road vehicles report.indd 36 24/06/22 4:47 PM24/06/22 4:47 PM

37
3) Calibrating the engine for high NOx emissions can reduce particulate emissions. Lower particulate emissions mean the particulate filter would require fewer periodic regenerations, which in turn would allow for the use of a cheaper, less durable filter and could reduce fuel consumption.
6. What further post BSVI reforms are awaited in 2023?India is poised for further reforms in 2023 to further strengthen the BSVI emissions regulations to incorporate real world driving regulations, in service compliance requirements and confirmatory factor for enforcement.
For heavy-duty vehicles, from 1st April, 2020, emission measurement on vehicles using portable emissions measurement systems (PEMS) are to be carried out on road for data collection. 1st April, 2023 onwards in-service conformity factor is expected to be applicable. There will be PEMS demonstration test at the type-approval stage. The vehicle is expected to meet the requirements of in-service compliance. World Not-To-Exceed (WNTE) off-cycle laboratory testing limits for gaseous and particulate exhaust emissions limits are given in BS VI notification. In service compliance of vehicles will be as per procedure laid down in AIS137 and as amended from time to time. April 1, 2020 onwards, real-world driving cycle emission measurement using PEMS are being carried out for data collection. From April 1, 2023 real world driving cycle emission conformity will be applicable. Not-to-exceed emission limits will be prescribed based on conformity factors to be assessed by 2023.
With regard to the light duty vehicles substantial reforms are needed. In-service compliance linked to RDE for light duty vehicles is needed. But confirmatory factor has not yet been notified. Need effective confirmatory factor as otherwise more lenient margin will lead to compromises and high real world emissions. Also adoption of PEMS testing for in-service Conformity test is important. India has not yet adopted WLTP yet for mass emissions testing – RDE testing should be validated against WLTP as the current MIDC is weak. It will be helpful to disclose RDE results. It is necessary to define test trip on roads more appropriately. It is recommended that the total NOx emissions measurements are adopted as per the package 4 of Europe or increase the weighing factor in the urban driving category in the driving pattern. This will promote in-cylinder or EGR based NOx reduction strategies at low load, which the SCR system will not reduce.
Remote monitoring of emissions from on-road vehicles report.indd 37Remote monitoring of emissions from on-road vehicles report.indd 37 24/06/22 4:47 PM24/06/22 4:47 PM

38
REMOTE MONITORING OF EMISSIONS FROM ON-ROAD VEHICLES: A PRIMER
Light duty vehicles segment requires stronger market surveillance and an independent verification testing and inspection by regulatory authorities of in-use vehicles and components. AIS 137 has asked for manufacturer to ensure that emissions information is made available on a publicly accessible website without costs. But government and testing agencies would also need to release data. European automakers do public discloser of data.
It is necessary for India to stay on track of these reforms and implement these requirements in 2023 to make the certification testing and in-service compliance more stringent.
Remote monitoring of emissions from on-road vehicles report.indd 38Remote monitoring of emissions from on-road vehicles report.indd 38 24/06/22 4:47 PM24/06/22 4:47 PM

39
SECTION 2: Policy imperatives and pilots on RSD in India
While emission regulations and testing parameters for new vehicle certification are being reformed in India and substantial changes are expected 2023 onwards to improve real world emissions regulations and in service compliance requirements, it is necessary to assess the opportunities for advancing emissions monitoring of on-road vehicles. There is considerable interest in adopting remote sensing monitoring methods to improve surveillance of on-road vehicles in Indian cities.
1. What is the genesis of the RSD programme in India? First-generation field trial of remote sensing application was carried out in Delhi and Pune way back in 2004-05. The Union Ministry of Road Transport and Highways (MORTH) had set up a committee under Automotive Research Association of India (ARAI) to make recommendations on inspection and certification centres in India. The committee had recommended that if the ongoing field trials are found to be effective in identifying grossly polluting vehicles then this could be adopted to supplement the I/M system in India. At that time, the cost of RSD was considered prohibitive.
A field trial of RSD was carried out in Delhi and Pune by Automotive Research Association of India (ARAI) during 2004-05. The ARAI Report of the Technical Committee on Inspection and Certification System in India for MORTH noted that out of the total measurements in the pilot scheme, 92 per cent of the total results for cars and 78 per cent of the total results for buses and trucks were valid. But for two wheelers, only 28 per cent of the results were valid. The capture rate was low. The emissions measurement of two-three wheelers were highly uncertain due to low exhaust volume from small tailpipes of these vehicles. It was explained that the devices were not aligned with the tailpipes of these small vehicles with relatively smaller plumes of emissions that decay quite fast before a minimum number of readings can be taken.
Kolkata RSD programme: Subsequently, Kolkata became the first and the only city to implement remote sensing programme on a limited scale. This was catalysed by the directive from the Calcutta High Court in relation to the phase out of older vehicles in 2009. This had also directed improvement in in-use emissions surveillance. Currently, Kolkata has two RSD devices and one mobile RSD unit.
Remote monitoring of emissions from on-road vehicles report.indd 39Remote monitoring of emissions from on-road vehicles report.indd 39 24/06/22 4:47 PM24/06/22 4:47 PM

40
REMOTE MONITORING OF EMISSIONS FROM ON-ROAD VEHICLES: A PRIMER
According to the department of transport, it is possible to collect approximately 4,000 data-points daily, and measure the emissions of CO, CO2, HC, NOx, and smoke. These devices operate for 8 working hours and five days a week at strategic locations.
There is an extensive system in place that records and issues show-cause notices to the vehicle owners whose vehicles are found to be high emitting based on remote sensing measurements. The mobile remote sensing devices are placed in strategic locations by rotation. The show cause notices are sent directly to the vehicle owners. The notice carries the picture of the vehicle with registration plate, date and location of testing and the emissions result. To identify the high emitting vehicles, the PUC norms including the smoke opacity value as per rules 115 and 116 of the Central Motor Vehicles Rules, 1989 is applied. The vehicle owners are requested to bring the vehicle to a specified inspection centre for further verification within 15 days. Failing that, the owner is liable to pay a fine under section 190(2) of Motor Vehicle Act and such other action per law.
When vehicle owners are intimated by the department about their polluting vehicles they often challenge on the grounds that they have a valid PUC certificate and should not be penalised. This requires MORTH to clarify how remote sensing monitoring will co-exist with the PUC programme.
However, the number of instruments are inadequate to expand the programme and cover the entire city. This programme also requires more upgraded instruments. There were plans to procure three more units of RSD. But the tendering process repeated three times during 2010, 2011, and 2012 have not been successful.
Department of Transport, West Bengal, has taken the initiative to analyse a data set from the RSD application during 2015 to 2020 (see Graph 5: Vehicles screened from the year 2015 to 2020 in Kolkata using RSD and Graph 6 Screening of vehicles based on different vintage, fuel type, and vehicle category). Based on this several observations have been highlighted.
· About 51 lakh vehicles were screened during five years with RSD. Overall, 3.4 and 3.7 percent of vehicles were found to be highly polluted. Notably, about 6-7 per cent of total vehicles were found to be dirty/or high emitters according to the yardstick adopted.
· In 2018 and 2019, Kolkata city has reported seven months of vehicle inspection using RSD. A smaller date set for that period show that 7 per cent of vehicles
Remote monitoring of emissions from on-road vehicles report.indd 40Remote monitoring of emissions from on-road vehicles report.indd 40 24/06/22 4:47 PM24/06/22 4:47 PM

41
were identified as dirty vehicles. In 2020, about 19,0367 vehicles were screened in four months and amongst them 9 per cent of the screened vehicles were identified as high emitters.
· As expected, more than 10 years old vehicles recorded higher emission by a factor of 2 as compared to less than 10 years old diesel vehicles. Among petrol vehicles, more than 15 years old have recorded three-times higher compared to the less than 10-year-old vehicles.
· Among the less than 10 years diesel vehicles, 4.3 per cent transport that are commercial vehicles were high emitters and 1.2 per cent non-transport or privately owned vehicles were high emitters. Among transport vehicles, 3.4 per cent buses, 5.3 per cent emergency vehicles, and 4.2 per cent goods vehicles were identified as high emitters.
· The more than 10-year-old diesel vehicle category had three-times higher emitters compared to the non-transport vehicles. Among them, 11 per cent taxis, 10.1 per cent goods vehicles, 7.7 per cent buses and 5.1 per cent Omni buses were found to be high emitters.
· In the category of less than 15 year old petrol vehicles, 3.2 transport vehicles and 3.6 percent non-transport vehicles were identified as high emitters. In the transport/commercial petrol vehicles category, the highest emitters were emergency vehicles (16.4 per cent), followed by goods vehicles (11.9 per cent) and Omni buses (7.1 per cent). However, in non-transport petrol category omni buses (19.4 per cent) were more polluting compared to transport omni-buses.
· In the more than 15 years old petrol vehicles category, transport vehicles had 2-times lower high emitters compared to non-transport vehicles. In the transport/commercial category, emergency vehicles were highly polluting (15.4 per cent), while in non-transport category, 10.1 per cent cars and 12.3 per cent omni buses were identified as high emitters.
Based on this programme the transport Department has collected Rs. 8 lakh penalty charges during 2019–20. Moreover, RSD in Kolkata have exhibited how this helps the regulators to evaluate the vehicle emission performance on the road. The Supreme Court of India in its order dated On May 10, 2018, has highlighted the remote sensing programme of Kolkata in the context of its implementation in Delhi.
Remote monitoring of emissions from on-road vehicles report.indd 41Remote monitoring of emissions from on-road vehicles report.indd 41 24/06/22 4:47 PM24/06/22 4:47 PM

42
REMOTE MONITORING OF EMISSIONS FROM ON-ROAD VEHICLES: A PRIMER
Graph 5: Vehicles screened from 2015 to 2020 in Kolkata using RSD
49155 5015551989
28892
33110
17376
0
200000
400000
600000
800000
1000000
2015-16 2016-17 2017-18 2018 (7 months) 2019 (8 months) 2020 (4 months)
Dirty screened
Clean screened
Source: Transport Department, Government of West Bengal
Remote sensing monitoring in Kolkata
Source: CSE
Remote monitoring of emissions from on-road vehicles report.indd 42Remote monitoring of emissions from on-road vehicles report.indd 42 24/06/22 4:47 PM24/06/22 4:47 PM
43
Graph 6: Screening of vehicles based on different vintage, fuel type and vehicle category
0
1
2
3
4
5
6
7
8
9
10
Overall vehicle
Pol
luit
ng v
ehic
le (
in p
erce
nt)
Diesel
Petrol
0
1
2
3
4
5
6
7
8
9
10
Diesel
< 10 years > 10 years
0
2
4
6
8
10
12
14
16
18
20
Petrol
< 15 years > 15 years
0
1
2
3
4
5
6
7
8
9
10
< 10 years old diesel
Pol
luit
ng v
ehic
le (
in p
erce
nt)
Transport
Bus
Goods vehicles
Emergency vehicles
Non-Transport
0
2
4
6
8
10
12
14
16
18
20
> 10 years old diesel
TransportTaxisGoods vehiclesBusOmni BusesNon-Transport
0
5
10
15
20
25
30
35
40
45
50
< 15 years old petrol
Pol
luit
ng v
ehic
le (
in p
erce
nt)
Transport
Emergency vehicles
Goods vehicles
Omni Buses
Non-Transport
Omni Buses
0
5
10
15
20
25
30
35
40
45
50
> 15 years old petrol
Transport
Emergency vehicles
Non-Transport
Cars
Omni Buses
Source: Transport Department, Government of West Bengal
Remote monitoring of emissions from on-road vehicles report.indd 43Remote monitoring of emissions from on-road vehicles report.indd 43 24/06/22 4:47 PM24/06/22 4:47 PM

44
REMOTE MONITORING OF EMISSIONS FROM ON-ROAD VEHICLES: A PRIMER
The current challenge is to position the RSD programme vis-à-vis the PUC programme for enforcement. There is also an expectation of guidance framework for RSD monitoring and technical regulations.
2. What are the policy imperatives of RSD programme in India? The Supreme Court on May 10, 2018 while responding to the recommendations from the Environment Pollution and Prevention Control (EPCA) in the ongoing public interest litigation on air pollution, had instructed the Delhi government to look into the implementation of remote sensing technology for screening of polluting vehicles on-road. This was among the recommendations of EPCA in response to an earlier Supreme Court order of March 23, 2018, that had asked EPCA to examine the new parameters that could help to improve the current vehicle inspection system.
Around that time ICAT had initiated a pilot on RSD in Delhi. On July 8, 2019 the Supreme Court directed EPCA to submit a proposal based on the report submitted by ICAT. It was also pointed out that the technology is found to be working well in Kolkata also.
As part of that deliberation, the Supreme Court had directed EPCA, “With respect to remote sensing technology a report has been filed by International Centre for Automotive Technology (ICAT). It is pointed out by Amicus Curiae that remote sensing technology has been found to be helpful in reducing the pollution level and it is a finding of the ICAT that it is effective method to check pollution. As to put it into operation, time prayed on behalf of the EPCA to consider and submit a report. As the matter is urgent and is in connection with the reduction of pollution, we grant only fifteen days time to the EPCA to submit a proposal after consulting various stakeholders.”
In response to this directive the EPCA initiated consultation with all concerned agencies including the Union Ministry of Road Transport and Highways (MoRTH) and Transport Department of National Capital Territory of Delhi to identify the key steps needed for implementation and submitted a report on July 26, 2019. In this EPCA made the following recommendations:
· Within three months, MORTH to frame rules under CMVR for use of remote sensing, including penalties so that enforcement is possible and notify the gross polluter threshold under CMVR as recommended by ICAT.
Remote monitoring of emissions from on-road vehicles report.indd 44Remote monitoring of emissions from on-road vehicles report.indd 44 24/06/22 4:47 PM24/06/22 4:47 PM

45
· Within two months MoRTH to issue technical guidance on design of programme, including equipment, networking and data sharing.
· Within three months Department of Transport Delhi to issue global tender for purchase of five machines and its operation as well as finalize sites and sampling plan.
On July 29, 2019, the Supreme Court took these recommendations on board and issued notices to the MORTH and the Department of Transport, NCT of Delhi.
Clean Air Action Plans and RSD: Yet another impetus for the RSD programme emerged from the clean air action plans of non-attainment cities under the National Clean Air Programme (NCAP) of the Ministry of Environment and Forests and Climate Change (MoEFCC). This programme targets to reduce particulate pollution by 20-30 per cent from 2017 level by 2024. Several city plans while seeking to strengthen the PUC programme have also recommended advancement of their vehicle inspection programme by incorporating remote sensing monitoring. Mumbai in Maharashtra, Kolkata, Asansol, Barrackpore, Durgapur, Haldia, Raniganj in West Bengal and Bhubaneswar in Odisha, have included RSD in their respective clean air action plans. Delhi has already been mandated to implement the RSD programme by the Supreme Court of India.
If taken forward as planned then RSD can become a scalable programme in India.
Demystifying RSD application to frame national guidance on remote sensingCities embarking on a RSD programme need a robust guidance framework for its implementation. It is necessary to deepen the understanding about the scope of its application and benefits, technology pathways and related surveillance technologies, regulations and norms, enforcement mechanism, data analytics, diverse scope of its use, and the overall preparedness needed for its implementation.
As the MORTH has embarked on developing the automotive standards for RSD it is shaping up a guidance framework. This needs to be developed further to be more robust and also demystified for the implementing agencies to understand the salient features of this programme.
In addition to this, global experience with RSD application and the body of research created by the ICCT and the TRUE initiative provide a valuable learning curve for India.
Remote monitoring of emissions from on-road vehicles report.indd 45Remote monitoring of emissions from on-road vehicles report.indd 45 24/06/22 4:47 PM24/06/22 4:47 PM

46
REMOTE MONITORING OF EMISSIONS FROM ON-ROAD VEHICLES: A PRIMER
Measuring emissions with remote sensing device: Remote sensing data is generated as the vehicles are being driven on the road. The advantages of using remote sensing data are several, including:
· Emission measurement from vehicle is unscheduled and no makeup of emission data is possible from vehicle owners.
· If measured properly, remote sensing data truly represent emission level from sample of vehicle in a given programme area.
· Remote sensing measurement can be implemented at fraction of cost as compared to vehicle inspection and maintenance programmes.
· Vehicle emissions can be tested in wide range of driving conditions which is not possible through other means of emission testing.
· Vehicles that often cannot be tested due to vehicle size on dynamometers can be tested using remote sensing equipment.
· The on-road data can evaluate the extent to which owners are maintaining their vehicles prior to emission testing.
Increasingly, the focus is shifting towards generating data in the real world to improve technology performance of the vehicles.
Stationary air samplerThe target vehicle passes through the stationary exhaust sampling location which houses the emission analyser. The sampler captures the target vehicle exhaust plume and measure the concentration of pollutants.
Figure 2: Types of extractive systems (right: exhaust plume chaser; left: stationary air sampler)
Source: ICCT PAPER—Worldwide use of remote sensing to measure motor vehicle emissions
Updraftexhaust intake
Plumecapturedevice
Analyser
Downdraftexhaust intake
Instrumenttrailer ALPR
Remote monitoring of emissions from on-road vehicles report.indd 46Remote monitoring of emissions from on-road vehicles report.indd 46 24/06/22 4:47 PM24/06/22 4:47 PM

47
3. What are the technology pathways for remote sensing monitoring?At the outset it is necessary to understand the emerging technology pathways for RSD.
Globally, remote sensing devices are being used to screen the on-road vehicle fleet, separate them into low-emitters and high-emitters, and to focus station-based inspection resources on the high emitters/polluters. Remote Sensing is a quick and convenient form of motor vehicle emissions testing. Remote sensing devices (RSD) can measure exhaust carbon monoxide (CO), carbon dioxide (CO2), hydrocarbons (HC), nitrogen oxides (NO and NO2), and particulate matter (PM) as well as evaporative HC as vehicles drive through ultraviolet (UV) and infrared (IR) beams cast across a roadway. Some research instruments (FEAT) can additionally measure emissions of ammonia (NH3) and sulphur dioxide (SO2). The EDAR instrument can be tuned to measure various specific hydrocarbons such as methane (CH4) and ethylene (C2H4) (Ropkins, 2017). In addition, RSDs measure the speed and acceleration of the passing vehicle to understand the emissions measured and captures an image of the license plate to identify the vehicle. Speed and acceleration provide a measure for the vehicle’s engine load, conventionally expressed as vehicle specific power (VSP).
Remote sensing devices (RSDs) use the principle of light absorption (i.e., spectroscopy) to determine exhaust and evaporative emissions levels as vehicles travel on the road. RSDs require no physical connection to the vehicle (physical or electronic). RSDs are specially adapted emission analysers that span the road, allowing vehicles to travel through the analyser for a remote, unobtrusive measurement of the trailing emissions.
RSDs continuously project and return a safe low-power beam of infrared (IR) and ultraviolet (UV) light across the road at tailpipe height and measure the number of characteristic frequencies absorbed by the pollutants: IR for carbon monoxide and hydrocarbons, and UV for nitrogen oxide and particulate matter. Pre-car measurements are subtracted from post-car emissions measurement to determine the vehicle’s contribution.
Complete combustion burns (i.e. oxidizes) hydrocarbons (i.e. fuel) completely to carbon dioxide and water. By measuring the ratios of the products of incomplete combustion (i.e., carbon monoxide and hydrocarbons) to carbon dioxide, effects
Remote monitoring of emissions from on-road vehicles report.indd 47Remote monitoring of emissions from on-road vehicles report.indd 47 24/06/22 4:47 PM24/06/22 4:47 PM

48
REMOTE MONITORING OF EMISSIONS FROM ON-ROAD VEHICLES: A PRIMER
of dilution are also eliminated. The mathematics (i.e. chemical mass balance) of combustion chemistry allow the pollutant ratios (CO/CO2, HC/ CO2, and NO/ CO2) to be converted to more familiar tailpipe concentrations for enforcement purposes. Calculations are specific to the type of fuel used by the vehicle, e.g., diesel, petrol or compressed natural gas.
A remote sensing device (RSD) is comprised of three systems linked to a computer (1) a speed and acceleration measurement system, (2) a license plate capture system, and (3) the emissions analyser that measures the pollutants. The speed and acceleration (S/A) system is a system with two light beams separated by a fixed distance spanning the road at tire height. The time required for a vehicle’s front tires to travel the known distance between S/A beams provides speed, and the change in speed of the front and rear tires provides acceleration. A vehicle first travels through the S/A beams and registers speed and acceleration on the computer.
The camera then captures a digital image of the license plate for identification purposes once the vehicle exits the analyser beam, which then measures the emissions behind the vehicle. A sophisticated software performs several quality reviews to ensure a robust and representative emission measurement has been made before validating and registering the overall record in real time. Remarkably, the coordinated measurement of the three systems is completed in less than one second, enabling RSDs to collect thousands of valid records an hour, traffic permitting.In addition to gaseous emissions, RSD can measure particulate emissions. The RSD system reports UV smoke from diesel vehicles. It may be noted that where older diesel vehicles predominantly emit larger, coarse mode, PM of larger average size (~1.5 µm), today’s modern diesels equipped with controlled devices emit smaller, accumulation mode, PM of 0.25 µm average size.
Remote sensing requirement is that the light beam should penetrate the vehicle exhaust plume to measure the pollutants. Remote sensing technology can be applied to any vehicle class with horizontal exhaust pipe just a few centimetres above ground level. Remote sensing is used in light duty (Carslaw et al.; 2011) heavy duty (Burgard et al., 2006), rail locomotive (Popp, Bishop, and Stedman 1999), aircrafts (Peter J. Popp and Donald H. Stedman 1997), snowmobile (Bishop, Burgard, Dalton, Stedman 2006) and two- and three-wheeler (Donald H. Stedman and Gary A. Bishop) applications.
Remote monitoring of emissions from on-road vehicles report.indd 48Remote monitoring of emissions from on-road vehicles report.indd 48 24/06/22 4:47 PM24/06/22 4:47 PM

49
Any light-based emission measurement system is susceptible to environmental factors including rain, fog, dust etc. These factors will reduce the camera visibility, causing the failure of camera system to legibly capture the vehicle number plate. These factors will reduce the number of good records which will ultimately affect the through put of valid records. This will be noticed by RSD programme managers and causes needs to be identified and fixed.
In India availability of remote sensing technology is limited. The white paper on worldwide use of remote sensing to measure motor vehicle emissions, ICCT, April 2019, shows that the remote sensing technology has evolved quite significantly over the last decade. These systems have evolved much beyond the conventional systems.
Open path: A light source and light detector are placed either at the side of or above a roadway, and the light source is reflected back by a mirror or reflective strip on the other side. The light absorbed by the exhaust plume as the light passes through is measured and correlated to the concentration of certain pollutants in the exhaust plume. The pollutant concentration as measured before the vehicle crosses the light beam is taken as background pollution and subtracted from the measurement. The system also includes speed and acceleration detectors and a license plate camera. All systems currently use infrared and ultraviolet light
Figure 3: How the remote sensing measurement setup looks
Source: ICCT PAPER—Worldwide use of remote sensing to measure motor vehicle emissions
Remote monitoring of emissions from on-road vehicles report.indd 49Remote monitoring of emissions from on-road vehicles report.indd 49 24/06/22 4:47 PM24/06/22 4:47 PM

50
REMOTE MONITORING OF EMISSIONS FROM ON-ROAD VEHICLES: A PRIMER
sources through arc lamp, such as xenon, or lasers. The use of lasers as the light source can increase the sampling rate along an individual exhaust plume from about 100 times per second to more than 10,000 times per second, potentially improving speed and accuracy.
Setup 1: Crossroad
Video camera &license plate reader
Data processing& video display
Speedaccelerationdetector
&
Source &detector module& weather sensor
Lateral transfermirror
There are main two manufacturers of open path systems.
Setup 2: Overhead: Overhead systems work similarly to cross-road systems and are capable of conducting measurements at sites with multiple lanes as well as collecting measurements from any vehicle independently of exhaust stack height. Cross-road systems must be positioned in line with the height of the exhaust stack
Remote monitoring of emissions from on-road vehicles report.indd 50Remote monitoring of emissions from on-road vehicles report.indd 50 24/06/22 4:47 PM24/06/22 4:47 PM

51
Reflector strip
Camera(speed &license plate)
Weather sensor
Source & detectormodule & data processing
Source: White Paper on Worldwide use of remote sensing to measure motor vehicle emissions, ICCT, April 2019
Extractive (academic domain): Extractive remote sensing captures a portion of the target vehicle exhaust plume and directs that exhaust to pollutant analyzers to measure exhaust concentrations.
Setup 1: Exhaust plume chaser: A vehicle equipped with on-board emission analyzers chases vehicles while sampling the air behind them. A portion of the target vehicle exhaust plume is captured using a sampling line with its inlet on the exterior of the chase vehicle. This exhaust sample is routed to pollutant analyzers to measure exhaust concentrations.
Plumecapturedevice
Analyzer
Source: White paper on worldwide use of remote sensing to measure motor vehicle emissions, ICCT, April 2019
Setup 2: Stationary samplingThe measurement method is similar to the plume chaser, except that target vehicles drive past a fixed sampling location with sampling inlets placed in close proximity to the tailpipes/exhaust stacks of passing vehicles.
Remote monitoring of emissions from on-road vehicles report.indd 51Remote monitoring of emissions from on-road vehicles report.indd 51 24/06/22 4:47 PM24/06/22 4:47 PM

52
REMOTE MONITORING OF EMISSIONS FROM ON-ROAD VEHICLES: A PRIMER
WHO ARE THE RSD TECHNOLOGY PROVIDERS?
The most obvious question surfacing is regarding the supply of these instruments. There is perhaps one remote sensing device supplier in India.
As the ICCT review shows, there are several other suppliers in the global market (see Annexure: List of suppliers, but this is not an exhaustive list).
In view of this the transport departments may request for information from different suppliers on different indicators to understand the variation in the specifications of the instruments. Based on these specifications, the transport departments can develop the tender. The tender may include different specifications related to number of pollutants that the machine can monitor; speed and acceleration that the instrument can monitor, accuracy level of measurements, type of camera and camera resolution, calibration methodology etc.
Table: Remote sensing technologies and manufacturersType Position Provider /
InventorEquipment name Measurement Measures
Open path
Cross-road University of Denver
FEAT Arc lamp light beam with mirror reflector
CO, HC, CO2, NO, NO2,NH3, SO2, opacity
Cross-road Opus RSD 4600 and older Arc lamp light beam with mirror reflector
CO, HC, CO2, NO, opacity
RSD 5000 CO, HC, CO2, NO, NO2,NH3, opacity
Cross-road Environmental Technology Consultants
R-series S650 Arc lamp light beam with mirror reflector
CO, CO2, HC, NO, NO2
Cross-road; Overhead
Dopler Eco Technologies
DPL7000 Series Laser light beam with mirror reflector
CO, CO2, HC, NO, opacity
Overhead HEAT LLC EDAR Laser curtain with strip reflector
CO, total and speciated HC, CO2, NO, NO2, opacity
Overhead Anhui Baolong Arc lamp light beam with mirror reflector
CO, CO2, HC, NO, opacity
Extractive
Overhead sampling
University of California, Berkeley
Exhaust plume sample
CH4, NO, NO2, NH3 BC,PM, PN, PN size,
Overhead sampling
CARB Portable Emissions Acquisition System (PEAQS)
Exhaust plume sample
Black carbon and NOx
Overhead sampling in Shed
University of Denver
OHMS Exhaust plume sample
CO, CO2, HC, NO, NO2, N2O, PM, PN, BlackCarbon
Roadside sampling Czech Technical University
Exhaust plume sample
CO, CO2, NOx, PM, PN
Roadside sampling University of Münster
Exhaust plume sample
NOx, CO2, PN
Plume chaser University of Heidelberg
ICAD Exhaust plume sample
NO, NO2, CO2
Plume chaser University of Birmingham
SNIFFER Exhaust plume sample
NO, NO2, CO2
Plume chaser CARB Mobile Measurement Platform (MMP)
Exhaust plume sample
CO, CO2, HC, NOx, PM, PN,Black Carbon
Source: ICCT Paper: Worldwide use of remote sensing to measure motor vehicle emissions, 2018
Remote monitoring of emissions from on-road vehicles report.indd 52Remote monitoring of emissions from on-road vehicles report.indd 52 24/06/22 4:47 PM24/06/22 4:47 PM

53
Updraftexhaust intake
Downdraftexhaust intake
Instrumenttrailer ALPR
It is also important to understand how other governments and research bodies are evaluating the technologies. New remote sensing programmes are now being rolled out in London, Paris, Berlin and US cities. Some information, available as in 2018 shows highlight some of the key characteristics of RSD technologies. These are indicative and may have changed further in the recent times. For more details on current RSD technologies in the market see Annexure 3.
4. What is the difference between portable emissions monitors (PEMSs) and remote sensing devices (RSDs)?
Currently, remote sensing and portable emissions measurement system (PEMS) share the common objective of measuring on-road emissions of vehicles. Therefore there is a curiosity about how to relate the two approaches.
The two techniques differ mainly on how their emissions are measured. Remote sensing can measure emissions from thousands of vehicles per day as they pass by. A snapshot of the exhaust plume content is collected from each passing vehicle, equivalent to about one second’s worth of emissions data for a single operating condition. Portable emissions measurement system testing (i.e. PEMS) uses sensors and analytical equipment mounted on a selected vehicle to directly measure the second-by-second emission rate of a vehicle as it is being driven on the road during a given trip, driving style and weather conditions.
In one study (Sjödin1, et. al. 2018) Euro 5 and Euro 6 cars were tested using PEMS and comparison is done with emission data derived from the CONOX remote sensing database for NOx emissions on a make, brand, and vehicle model basis. PEMS data is derived from government and 3rd party sources. Governmental PEMS testing data (on 105 Euro 5 models and 93 Euro 6 models) were retrieved from Belgium, Germany, France, UK and the Netherlands. 3rd party PEMS testing data (on 124 Euro 5 models and 220 Euro 6 models) were from organisations such as TNO, Emissions Analytics, Allgemeiner Deutscher Automobil-Club (ADAC),
Remote monitoring of emissions from on-road vehicles report.indd 53Remote monitoring of emissions from on-road vehicles report.indd 53 24/06/22 4:47 PM24/06/22 4:47 PM

54
REMOTE MONITORING OF EMISSIONS FROM ON-ROAD VEHICLES: A PRIMER
Deutsche Umwelthilfe (DUH) and the Auto motor and sport magazine. The results of the comparison between NOX emissions derived from remote sensing measurements and from PEMS testing on a vehicle model basis (of Euro 5) (see Graph 7: Comparison of NOx emissions (g/kg of fuel) measured from PEMS with NOx emissions measured from remote sensing device for Euro 5 passenger cars).
The main conclusion from the study was that there is good agreement between PEMS and remote sensing data. This study captures and compares the emissions from PEMS and remote sensing data with respect to per kg of fuel burned.
In another study (ICAT 2018) correlation activity between RSD and Portable Emission Measurement system (Sensors, SEMTECH® LDV) on four vehicles was carried out in Mileage Accumulation Chassis Dynamometer (MACD) at ICAT (International Centre of Automotive Technology) on Modified Indian driving cycle (MIDC). In this activity instantaneous emission from PEMS and remote sensing device were compared. PEMS probe was extended into the end of exhaust sample tube. This meant that the PEMS senses pure exhaust with no dilution. Therefore, it can directly measure concentrations of CO, CO2, and NO from exhaust. On the other hand, the RSD measured diluted exhaust after it has been released into the air and directed across the RSD beam path. Because the amount of dilution varies and is not known, the RSD measured ratios of CO to CO2, HC to CO2 and NO to CO2. Concentrations were further derived from a combustion equation. To compare PEMS and RSD measurements, the ratios of CO to CO2 and NO to CO2 were calculated from the PEMS concentrations and these ratios are the values shown in the correlation graphs below (see Graph 8: Instantaneous CO emission [as ratio of CO2] comparison between PEMS and RSD on modified Indian driving cycle and Graph 9: Instantaneous NOx emission [as ratio of CO2] comparison between PEMS and RSD on modified Indian driving cycle)
The Graphs 8 and 9 show vehicle speed or desired vehicle speed as measured by the dyno to keep track of where in the Modified Indian Drive Cycle (MIDC) the measurement was taken. The horizontal scales show cumulative seconds for each test. The vertical axis shows the ratio of pollutant with respect to CO2. The main conclusion from above study is that both PEMS and remote sensing data shows good correlation.
There are some other studies and presentation from manufacturers that shows the comparison of their RSD devices with PEMS (Woopen H. 2018).
Remote monitoring of emissions from on-road vehicles report.indd 54Remote monitoring of emissions from on-road vehicles report.indd 54 24/06/22 4:47 PM24/06/22 4:47 PM

55
The second study, by the Universities of Birmingham and Leeds and King’s College London, used the comparison of EDAR and on-board Portable Emissions Measurement System (PEMS) (Ropkins et. al 2017) collected under real-world conditions to investigate in situ EDAR performance. Given the analytical challenges associated with aligning these very different measurements, the observed agreements (e.g., EDAR versus PEMS R2 0.92 for CO/CO2; 0.97 for NO/CO2; 0.82 for NO2/CO2; and 0.94 for PM/CO2) indicate that EDAR also provides a representative measure of vehicle emissions under real-world conditions
Graph 7: Comparison of NOx emissions (g/kg of fuel) measured from PEMS with NOx emissions measured from remote sensing device for Euro V passenger cars
Source: Real driving emissions from diesel passenger cars measured by remote sensing and as compared with PEMS and chassis dynamometer measurements CONOX Task 2 report
Remote monitoring of emissions from on-road vehicles report.indd 55Remote monitoring of emissions from on-road vehicles report.indd 55 24/06/22 4:47 PM24/06/22 4:47 PM

56
REMOTE MONITORING OF EMISSIONS FROM ON-ROAD VEHICLES: A PRIMER
Graph 8: Instantaneous CO emission (as ratio of CO2) comparison between PEMS and RSD on modified Indian driving cycle
Graph 9: Instantaneous NOx emission (as ratio of CO2) comparison between PEMS and RSD on modified Indian driving cycle
Remote monitoring of emissions from on-road vehicles report.indd 56Remote monitoring of emissions from on-road vehicles report.indd 56 24/06/22 4:47 PM24/06/22 4:47 PM

57
Graph 11: Comparison of HEAT (EDAR) remote sensing device with PEMS
Graph 10: Comparison of OPUS remote sensing device with HORIBA OBS PEMS
y = 0.8864xR² = 0.9085
0
50
100
150
200
250
300
350
400
450
500
0 100 200 300 400 500 600
RS
D
OBS
Nissan NO/CO2
RSD NOCO2
y = 0.9469xR² = 0.8602
0
0.1
0.2
0.4
0.4
0.5
0.6
0.7
0.0 0.1 0.2 0.3 0.4 0.5 0.6 0.7R
SD
OBS
Nissan CO/CO2
RSD NOCO2
Remote monitoring of emissions from on-road vehicles report.indd 57Remote monitoring of emissions from on-road vehicles report.indd 57 24/06/22 4:47 PM24/06/22 4:47 PM

58
REMOTE MONITORING OF EMISSIONS FROM ON-ROAD VEHICLES: A PRIMER
5. How do we understand the measurement units (conversion of pollutant from gm/kg to gm/km)? Emission rates measured by remote sensing are instantaneous, usually under positive acceleration, and without idling. Their unit is typically gram (or mole) pollutant emitted per gram (or mole) CO2 emitted. Emission factors from type approval or RDE tests are typically cycle or trip averages, and thus include constant speeds, accelerations, decelerations and idling, and possibly also cold start extra emissions. The regulatory limits for pollutants are defined as the mass of pollutant per unit of distance travelled (e.g., grams [g] per kilometre [km]) for light-duty vehicles and per unit of output of mechanical energy (e.g., g/kilowatt hour) for heavy-duty vehicles. Obtaining the emissions in above units requires measuring the pollutant mass emission rate. A general formula for the pollutant mass emission rate is described below. It is proportional to the pollutant concentration and to the total exhaust mass flow.
Pollutant mass rate = C × pollutant tailpipe concentration × exhaust mass flow
In the equation, C is the ratio between the densities of the pollutant and the total exhaust, and it mainly depends on the pollutant studied and the fuel used.
Even though mass emissions are a function of tailpipe pollutant concentrations, as shown in the equation above, the main risk with using pollutant concentrations for assessing vehicles pollutant emission levels is the lack of information about the mass flow of the pollutants. Vehicles equipped with diesel engines tend to exhibit higher exhaust mass flow rates than most vehicles with gasoline engines when tested in similar conditions (e.g., same power demand). This is due to their need to run with a large excess of air. In other words, even when there are similar tailpipe concentrations for gasoline and diesel vehicles, the diesel vehicles are emitting more mass emissions. This means that the crucial link for enabling comparisons between emission rates as measured by remote sensing with those measured in conventional emission tests is the fuel consumption in mass or volume unit per distance driven.
The ICCT has carried out extensive study on this aspect. A snapshot of the ICCT studies is presented in the ANNEX 1. Some of its highlights are included in this section.
Remote monitoring of emissions from on-road vehicles report.indd 58Remote monitoring of emissions from on-road vehicles report.indd 58 24/06/22 4:47 PM24/06/22 4:47 PM

59
6. How does RSD help to assess and develop emissions factor of vehicles?Systematic generation of emissions data can help to develop and validate emissions factors of different generation of vehicles. The emissions from a vehicle are influenced by different factors including, but not limited to, engine efficiency, type of fuel, driving pattern, vehicle maintenance, traffic, adulterated fuel, aging fleet, routes, passenger load, cargo load, management, urban planning, weather conditions among others. Special efforts are made by vehicle testing agencies from time to time to carry out proper loaded mode emissions tests on different genre of vehicles to develop emissions factors that are needed to estimate the trend in pollution load from vehicles. In fact, Automotive Research Association of India has developed such factors in India.
RSD creates the opportunity to validate such efforts and help to assess emissions rates from vehicles to further help develop or amend emissions factors and enhance understanding of different weather and driving patterns on emissions rates. International Council on Clean Transportation (ICCT) has carried out extensive analysis of the RSD data in London and other cities of Europe including Zurich to highlight some of the dimensions related to emissions factors. Some of its highlights as well as those from other studies are captured here. In fact, this emissions profiling of on-road vehicles in European and US cities have brought out the dimensions of diesel gate.
Emission factor per vehicle category: Remote sensing data can be used to provide average emission rates for specific vehicle classes such as passenger cars, light duty commercial vehicles, heavy duty etc. The average emission rate per vehicle class can be calculated in similar way as fleet average. Data on vehicle category is derived from vehicle registry. The representativeness can be increased by measurements at different sites, thus capturing a different fleet and different driving conditions. ICCT studies on RSD initiatives in London in 2012 shows petrol cars have NOx emissions rates below the fleet average. NOx emissions from the on-road diesel cars and heavy-duty vehicles are higher (see Annex 1: Summary highlights of ICCT assessment of RSD data in different global cities).
Emission factors by emission standards: Average emission rate of vehicle vintage meeting different emission standard can be determined by certified emission and compared with the emissions measured by remote sensing device. For instance, the ICCT review of RSD measurements in London in 2012 and in Zurich in 2000- –12 shows that in diesel cars, NOx emissions are increasing in the real driving mode even though technology pathways have improved with improvement in mass emissions
Remote monitoring of emissions from on-road vehicles report.indd 59Remote monitoring of emissions from on-road vehicles report.indd 59 24/06/22 4:47 PM24/06/22 4:47 PM

60
REMOTE MONITORING OF EMISSIONS FROM ON-ROAD VEHICLES: A PRIMER
standards. The high average emission level indicates that many manufacturers have car models with high on-road NOx emission rates. Comparatively, petrol cars are closer to the regulatory emission limit values.
Effect of ambient temperature on emission factors: Vehicle homologation testing is carried out at standard air temperature of 20-30°C. However, remote sensing measurements can be carried out at varied ambient temperature conditions. For instance, several ICCT assessment includes the analysis of the measurement campaign in Gothenburg, Sweden, that was conducted between September and November 2016, with temperatures ranging from about 8°C to 25°C during the day. The ICCT review shows that the real world NOx emission increased by 50 per cent for Euro 5 compliant vehicle when the ambient temperature reduced from 20°C to 10°C. This data also suggests that most vehicle manufacturers are inclined to turn off NOx control through EGR as the ambient temperature reduces (see (See Annex 1: Summary highlights of ICCT assessment of RSD data in different global cities).
Effect of exhaust aftertreatment deterioration on emission factors: The vehicle passing through remote sensing measurement site represent a wide variety of vehicles in terms of vehicle age and distance travelled. Remote sensing data can be used to compare how vehicle emission deteriorate with age and distance covered. Such analysis is helpful to measure the aftertreatment durability under real driving conditions. When the measurements are spaced over a larger interval, it becomes possible to monitor the after-treatment durability over a longer period. The ICCT review of the global RSD programme shows increasing NO emission rate from diesel vans/pick-ups equipped with selective catalytic reduction (SCR) systems in the US beginning with vehicle model year 2009. The NO emission rate increases by 50 per cent and more within just three years of service for model year 2011, 2012, and 2013 vehicles (see Annexure: Understanding AIS 170). Remote sensing provides representative age-specific emission rates, and higher-quality data that can help to derive deterioration factors. With sufficient data, analysis can be further broken into individual vehicle model year and vehicle make to get insights into deterioration in after-treatment technology (see Graph 12: Emission deterioration of gasoline cars with increased mileage for different emission standards).
Effect of driving conditions on emission factors: Remote sensing data is collected for a wide range of vehicle driving conditions measured in terms of vehicle speed and acceleration. The average of several thousand instantaneous emission rates from remote sensing is comparable to an emission rate averaged over a test cycle or test trip with a few thousand second-by-second readings. Studies have
Remote monitoring of emissions from on-road vehicles report.indd 60Remote monitoring of emissions from on-road vehicles report.indd 60 24/06/22 4:47 PM24/06/22 4:47 PM

61
compared the on-road NOx emission rate of diesel Euro 4 cars measured remotely in Zurich (campaigns 2011 to 2014) (Borken-Kleefeld, Franco, and Chen, 2015) with the modelled emission rate derived from emission factor database, HBEFA 3.2 (HBEFA 3.2 2014) as a function of engine load. The emission rate per kilogram of fuel burned scales linearly with engine load for Euro 4 compliant cars. The key advantage of remote sensing is that emission rates are not bound to any specific cycles. The measurement of emissions from off-cycle or cycle engine operating points are possible with RSD. This can help to indicate the potential of emissions outside the regulated range of the RDE test trip window remain within bounds or not. The RSD data also demonstrates the difference in emissions performance of smaller diesel engines (below 2 litres capacity), and larger diesel engines (greater than 2 litres capacity) (see Graph 13: NOx emission rate as a function of engine power for diesel cars certified to Euro IV standards).
Graph 12: Emission deterioration of gasoline cars with increased mileage for different emission standards
cum. veh. mileage (100 km)
12
9
6
3
0
40
30
20
10
0
NOx
Euro 1
Euro 1
Euro 2
Euro 2
Euro 3 Euro 3
Euro 4
Euro 4
CO
g/kg
fue
l
g/kg
fue
l
0 50 100 150 200 250 0 50 100 150 200 250
cum. veh. mileage (100 km)
Source: Borken-Kleefeld, Chen Y. 2014—New emission deterioration rates for gasoline cars e Results from long-term measurements. http://dx.doi.org/10.1016/j.atmosenv.2014.11.013 1352-2310/
Remote monitoring of emissions from on-road vehicles report.indd 61Remote monitoring of emissions from on-road vehicles report.indd 61 24/06/22 4:47 PM24/06/22 4:47 PM

62
REMOTE MONITORING OF EMISSIONS FROM ON-ROAD VEHICLES: A PRIMER
7. How do we understand RSD data representativeness?Remote sensing campaigns can cover a wide range of driving conditions that affect emissions performance. Therefore, it is important to choose a variety of measurement sites to capture different ranges of driving and ambient conditions relevant to urban emissions. Experts advise that sites selection therefore should not create systemic bias in the data based on driving conditions, vehicle attributes, sampling characteristics for different emissions standards and fuel types. It is important to measure at all the driving conditions of interest and measure at adequate number of sites which is also adequately distributed so that individual sites cannot have disproportionate impact on the global sample. A wide range of driving conditions have been captured in remote sensing measurements in Europe. This also bears out the relationship between ambient temperature, acceleration and speed.
Graph 13: NOx emission rate as a function of engine power for diesel cars certified to Euro IV standards
Source Borken and Dallmann 2018 , White paper: Remote sensing of motor vehicle exhaust emissions. The International Council on Clean Transportation
VSP or engine power (kW/tonne)
Euro 4 diesel cars - Remote sensing Euro 4 diesel cars - Modeled (HBEFA 3.2)
y = 0.28x + 8.23 R2 = 0.93
y = 0.32x + 10.92 R2 = 0.93
0 10 20 30 40
25
20
15
10
5
0
NO
X e
mis
sion
rat
e (g
/kg
fuel
)
Remote monitoring of emissions from on-road vehicles report.indd 62Remote monitoring of emissions from on-road vehicles report.indd 62 24/06/22 4:47 PM24/06/22 4:47 PM

63
The data from New Delhi Real World Emission Survey of ICAT shows ambient temperature generally follows a bell-shaped distribution with the median ranging from 33.3–34.4°C. The distribution of Vehicle Specific Power (VSP) that is an estimate of the power demand on the engine during driving, is less symmetrical but also has a clear central tendency with median values ranging from 3.09–3.91 kW/ton. Lastly, the plot of vehicle acceleration on the y-axis over speed on the x-axis indicate that most vehicles across all groups were measured at a speed between 0 and 25 km/h and accelerating with -15 to 10 kilometres per hour per second (km/h/s).
Graph 14: Relationship between engine load and NOx emission factor for different emission standards
Euro 2 Euro 3
Euro 4 Euro 5
0.0000
0.0025
0.0050
0.0075
0.0100
0.0000
0.0025
0.0050
0.0075
0.0100
0 10 20 0 10 20
VSP (kW/t)
NO
x/C
O2
rat
io Engine size
<2 litre
>2 litre
Source - David Carslaw, Glyn Rhys-Tyler 2013 - Remote sensing of NO2 exhaust emissions from road vehicles - A report to the City of London Corporation and London Borough of Ealing
Remote monitoring of emissions from on-road vehicles report.indd 63Remote monitoring of emissions from on-road vehicles report.indd 63 24/06/22 4:47 PM24/06/22 4:47 PM

64
REMOTE MONITORING OF EMISSIONS FROM ON-ROAD VEHICLES: A PRIMER
Heavy duty diesel vehicles have two normal distribution curves for ambient temperature signifying the low records captured for this class of vehicles. For BS3 complaint heavy duty only 1268 valid records are available while for BS4 compliant heavy duty 4928 records are available. From this data it can be inferred that the remote sensing sites chosen have low vehicle turnover from these two categories of vehicles. Average ambient temperature for heavy duty vehicle is 22.1-23.4°C signifying the remote sensing measurements were collected close to winter months (see Graph 15: Summary of remote sensing test conditions broken into vehicle class, fuel type and emission standard: petrol light duty and Graph 16: Summary of remote sensing test conditions broken into vehicle class, fuel type and emission standard: diesel light duty and Graph 17: Summary of remote sensing test conditions broken into vehicle class, fuel type and emission standard: Diesel heavy duty ).
Graph 15: Summary of remote sensing test conditions broken into vehicle class, fuel type and emission standard: petrol light duty
Bharat Stage 3 Petrol
9756 vehicles
Bharat Stage 4 Petrol
40518 vehicles
0 40
Ambient Temperature (DegC)
0
100
200
300
400
500
No.
of R
ecor
ds
BS 3 Petrol - Light Duty Vehicle
-40 -20 0 20
VSP(kW/ton)
0
500
1000
1500
2000
No.
of R
ecor
ds
0 10 20
Vehicle Speed(kmph)
-15
-10
-5
0
5
10
Veh
icle
Acc
(m/s
2)
0 40
Ambient Temperature (DegC)
0
500
1000
1500
2000
No.
of R
ecor
ds
BS 4 Petrol - Light Duty Vehicle
-40 -20 0 20
VSP(kW/ton)
0
2000
4000
6000
8000
No.
of R
ecor
ds
0 10 20
Vehicle Speed(kmph)
-15
-10
-5
0
5
10
Veh
icle
Acc
(m/s
2)
Data source: All of the above figures are derived from data from RSD project (New Delhi real world emission study (NDRWES) using remote sensing technology)
Remote monitoring of emissions from on-road vehicles report.indd 64Remote monitoring of emissions from on-road vehicles report.indd 64 24/06/22 4:47 PM24/06/22 4:47 PM

65
Graph 16: Summary of remote sensing test conditions broken into vehicle class, fuel type and emission standard: diesel light duty
Bharat Stage 3 Diesel
9727 vehicles
Bharat Stage 4 Diesel
66042 vehicles
0 40
Ambient Temperature (DegC)
0
100
200
300
400
500
No.
of R
ecor
ds
BS 3 Diesel - Light Duty Vehicle
-40 0
VSP(kW/ton)
0
500
1000
1500
No.
of R
ecor
ds
0 10 20
Vehicle Speed(kmph)
-15
-10
-5
0
5
10
Veh
icle
Acc
(m/s
2)
0 40
Ambient Temperature (DegC)
0
1000
2000
3000
No.
of R
ecor
ds
BS 4 Diesel - Light Duty Vehicle
-40 0
VSP(kW/ton)
0
2000
4000
6000
8000
10000
No.
of R
ecor
ds
0 10 20
Vehicle Speed(kmph)
-15
-10
-5
0
5
10
Veh
icle
Acc
(m/s
2)
Data source: All of the above figures are derived from data from RSD project (New Delhi real world emission study (NDRWES) using remote sensing technology)
Remote monitoring of emissions from on-road vehicles report.indd 65Remote monitoring of emissions from on-road vehicles report.indd 65 24/06/22 4:47 PM24/06/22 4:47 PM

66
REMOTE MONITORING OF EMISSIONS FROM ON-ROAD VEHICLES: A PRIMER
8. How to design an RSD programme for implementation?There is considerable curiosity regarding the key aspects and elements of the programme design for RSD that need to be demystified.
The most important local learning has come from the ICAT pilot study on remote sensing in Delhi in 2018 that has generated valuable data needed for designing a detailed programme for RSD implementation. ICAT has published a detailed technical report on this pilot project. Understanding the salient features of this study and by combining them with the lessons from some of the global initiatives can help to build public and policy understanding of the RSD programme. As several cities in India are planning implementation of RSD programme, tapping this learning curve is important to build the national guidance on RSD implementation.
Graph 17: Summary of remote sensing test conditions broken into vehicle class, fuel type and emission standard: diesel heavy duty
Bharat Stage 3 Diesel
1268 vehicles
Bharat Stage 4 Diesel
4928 vehicles
20 40
Ambient Temperature (DegC)
0
10
20
30
40
50
No.
of R
ecor
ds
BS 3 Diesel - Heavy Duty Vehicle
0 20
VSP(kW/ton)
0
100
200
300
400
500
No.
of R
ecor
ds
0 10 20
Vehicle Speed(kmph)
-15
-10
-5
0
5
10
Veh
icle
Acc
(m/s
2)
0 40
Ambient Temperature (DegC)
0
50
100
150
No.
of R
ecor
ds
BS 4 Diesel - Heavy Duty Vehicle
-40 -20 0 20
VSP(kW/ton)
0
500
1000
1500
No.
of R
ecor
ds
0 10 20
Vehicle Speed(kmph)
-15
-10
-5
0
5
10
Veh
icle
Acc
(m/s
2)
Data source: All of the above figures are derived from data from RSD project (New Delhi real world emission study (NDRWES) using remote sensing technology)
Remote monitoring of emissions from on-road vehicles report.indd 66Remote monitoring of emissions from on-road vehicles report.indd 66 24/06/22 4:47 PM24/06/22 4:47 PM

67
The key objectives of the ICAT’s pilot study (Henceforth New Delhi real world emission study) have been (a) To develop “gross threshold points” to identify the high emitting vehicles; (b) To correlate RSD techniques and PUC results (see Fig. 4: Activities and deliverables of RSD study by ICAT in Delhi-NCR). Based on this the MoRTH, has recommended implementation and suggested technical guidance framework for RSD monitoring.
While planning and designing a RSD programme several elements will have to be addressed for implementation. Here are some basic facts to answer some of the frequently asked questions.
9. How are locations for RSD monitoring selected? There are important criteria that need to be considered before finalizing locations for installation of remote sensing devices. The location of remote sensing site witness a range of driving conditions that in turn effect the vehicle emission rates as a function of engine load. Within the same site the driving conditions vary, causing different emission measurements from remote sensing device. Therefore, even single sites usually cover a wide range of engine loads, so that the average
Figure 4: Activities and deliverables of RSD study by ICAT in Delhi-NCR
Source: International Centre for Automotive Technology (ICAT 2019–10)
Data analysis, processing and reporting
√ Date processing
√ Data matching
√ Statistical analysis
√ Reporting
√ Project planning
√ Site selection
√ Site approval and linking local authorities
√ Cut-point/Threshold limit learning
√ Pool over inspections
Data collection
Planning and operation
Remote monitoring of emissions from on-road vehicles report.indd 67Remote monitoring of emissions from on-road vehicles report.indd 67 24/06/22 4:47 PM24/06/22 4:47 PM

68
REMOTE MONITORING OF EMISSIONS FROM ON-ROAD VEHICLES: A PRIMER
emission rate is based on a broad operating window. It is recommended to measure at different sites that covers wide range of driving conditions and a broader cross section of the fleet so that representative data can be captured.
General considerations· The site should be selected based on objective of the study. Any site selected
should have sufficient space to mount the equipment and allow safe setup and calibration of instruments.
· Installation of remote sensing equipment should not disturb the ongoing traffic nor there should this interfere with the other street activities and pedestrian movement.
· If the objective of the study is to correlate the idle emission with remote sensing device, then sufficient space needs to be allocated for stopping suspected vehicles (flag by RSD) and check their idle emissions.
· Measured concentration from remote sensing device should be ascribed to individual vehicles. This is possible only when vehicles ply in clearly separable way without corrupting the exhaust plume of other vehicles. With the top-down configuration of the EDAR instrument, emissions from traffic on multi-lane roadways can also be measured.
· The site should be safe for the drivers, operators, and remote sensing devices.
· Single lane traffic (or multi-lane that could be directed to single lane) with enough shoulder space to install the device is preferred if crossroad setup configuration is used. However, if overhead setup configuration is used then there should be enough space to mount the pole on which device can be installed.
· The optical path length from source and detector should be no longer than 13 m to avoid decreased sensitivity and increased background noise for non-dispersive IR and UV techniques.
· To get good fleet characterization, a site where high vehicle turnover is witnessed should be chosen. From such sites large data can be collected from short amount of time.
Remote monitoring of emissions from on-road vehicles report.indd 68Remote monitoring of emissions from on-road vehicles report.indd 68 24/06/22 4:47 PM24/06/22 4:47 PM

69
· RSD site should be chosen such that engine should be under load so that exhaust contain combustion gases. Hence a positive acceleration or some small road gradients are desirable at the RSD site. Furthermore. sites where vehicles accelerate onto a motorway or uphill or from a stop sign or from traffic lights are also ideal location for installing RSD. A good indicator of engine load is vehicle specific power (VSP) parameter. VSP is calculated from vehicle speed, acceleration, the grade of the road, aerodynamic drag, and rolling resistance. Wind speed and direction as well as vehicle shape can also affect the aerodynamic drag on the vehicle and therefore VSP. At low deceleration rates, fuel is still injected to counter frictional losses in the drivetrain, aerodynamic and rolling resistance losses, and the power consumption of auxiliary equipment, to avoid decelerating too quickly. For typical passenger vehicles, fuel injection is disabled only when VSP is less than about -5 kW/t. Thus, remote sensing measurements with VSP values less than -5 kW/t threshold are considered as invalid.
· Site should be chosen such that maximum valid records can be collected without compromising geographic coverage and data quality.
· Remote sensing coverage area should be such that emission measurement distribution should roughly match the vehicle population else the data collected would be skewed towards one vehicle class or one fuel type and does not represent the true fleet composition in a geographical area.
· As RSD measure instantaneous emissions, one RSD measurement of a vehicle often time does not give true picture of vehicle performance. Hence any RSD coverage should allow for multiple observations of vehicles when sites are repeated. If there are multiple observations of same vehicle, then average emissions will be more accurate than single sighting.
· RSD data should be collected in different seasons of the year, capturing data from wide range of ambient temperatures.
Selection of RSD monitoring is decided by the measurement objectives.· RSD cannot distinguish between emissions from cold engine to hot engine. A
good choice for RSD location would be to measure cold start vehicle emissions from long term parking lot and highway exit for hot engine emissions. RSD should be located at place where there is low probability of vehicle cold start to exclude false detection of high emitter particularly for gasoline cars.
· Urban sites can be chosen if the objective of the study is to compare the
Remote monitoring of emissions from on-road vehicles report.indd 69Remote monitoring of emissions from on-road vehicles report.indd 69 24/06/22 4:47 PM24/06/22 4:47 PM

70
REMOTE MONITORING OF EMISSIONS FROM ON-ROAD VEHICLES: A PRIMER
emission rates during urban and moderate driving conditions like conditions encountered in vehicle homologation tests. When conducting research, such as on the emission rates during aggressive driving that simulate the off-cycle emission rates, then the above restrictions do not necessarily apply.
· Additional selection criteria should be taken into consideration for different study purposes. Off-cycle high-load or high emission events should be avoided as well, e.g. steep hills. For emission factors and emission model development purposes, several sites covering different driving conditions and vehicle types are needed.
· If the objective of the study is to compare the effectiveness of vehicle I/M (Inspection and Maintenance) program, then RSD should be installed at both I/M area and out of I/M area. Comparison between the two will help in ensuring that I/M centres are effective in checking and controlling the health of overall vehicle fleet.
· The RSD program objective is important criteria for selecting a site. If the objective is to measure vehicle emissions from particular class of vehicle, then sites where those vehicles ply should be chosen. A congested city market is full of 2/3 wheelers. Such place is ideal to study vehicle emissions of 2/3 wheelers. Proper vehicle funnelling may be required to force the vehicles through RSD setup. However, necessary permissions may be required from local authorities to set up an RSD device.
How was the site selected for the Delhi ICAT study? On-road RSD monitoring was carried out for five different toll plaza locations (see Figure 7: Location of five RSD monitoring on google map) during 9-month sampling period. The sites were approved by National Highway Authority of India (NHAI~under MORTH) and Public Works Department (PWD). Five toll plazas were selected to conduct this remote sensing study in Delhi, NCR. These include: (1) Indira Gandhi International (IGI) Toll Plaza; (2) Gurgaon-Faridabad Toll Plaza; (3) Kherki Daula Toll Plaza (Manesar); (4) Sonipat Toll Plaza; (5) Main Faridabad (Sarai Chowk) Toll Plaza. The site selection was governed by the following criteria: (a) Vehicle emissions will be measured during rapid acceleration phase; (b) Vehicles will pass through a single lane for them to be covered efficiently by emission analyzer; (c) Installation of RSD does not disturb the running traffic or obstruct other activities on road including pedestrian movement; (d) Different entry points to Delhi, National Capital Region (NCR) to be covered (see Map 1: Location of five RSD monitoring on Google map)
Remote monitoring of emissions from on-road vehicles report.indd 70Remote monitoring of emissions from on-road vehicles report.indd 70 24/06/22 4:47 PM24/06/22 4:47 PM

71
Sampling plan development and securement of permits and approvals Develop sampling plan and select sites for measurements. Obtain necessary permits and approvals to conduct sampling. The sampling plan should include details of selected measurement location(s), sampling schedule, expected daily sample size, expected number of measurement days, and other details relevant to testing strategy and preparation. The format for reporting data will also be established.
Need indication of the total footprint of the selected remote sensing instrument package and description of any modifications to existing roadways that would be required for the installation of sampling equipment. Other relevant details, such as power requirements, should also be provided. Any sampling equipment constraints that would serve to limit the scope of suitable measurement locations (e.g. need for single lane roadway) or instrument deployment and data collection
Map 1: Location of five RSD monitoring on Google map
Source: International Centre for Automotive Technology (ICAT2019–20)
Sonipat toll
Main Faridabad toll
Gurgoan Faridabad toll
IGIA toll
Manesar toll
Remote monitoring of emissions from on-road vehicles report.indd 71Remote monitoring of emissions from on-road vehicles report.indd 71 24/06/22 4:47 PM24/06/22 4:47 PM

72
REMOTE MONITORING OF EMISSIONS FROM ON-ROAD VEHICLES: A PRIMER
(e.g. ambient weather conditions—temperature, rain, high winds, etc.) should be noted in the proposal.
In Delhi before the actual data collection on road could start, some activities and approvals were necessary for the effective execution of RSD program. In Delhi necessary approvals from local authorities such as NHAI (National Highway Authority of India), traffic police, PWD (Public Works Department) needs to be taken. Each of these department has different protocols when it comes to giving permission for such activities. VAHAN database access was required to retrieve vehicle information from registration plate captured by RSD camera during on road data collection with remote sensing device. The information from VAHAN database was merged with emission data collected during on road testing for final analysis. In India, vehicle information is hosted in VAHAN database, which is owned by NIC (National Informatics Centre).
Vehicles monitored for the ICAT study: It is evident that a total of 30,5371 vehicles were captured over the sampling period of this study. Out of these, data of 176,667 vehicles matched with VAHAN database (central data server for vehicle registration information of MORTH). The VAHAN database was accessed to retrieve vehicle information (Fuel type, vehicle type, and technology) from the number plate captured by camera during the on road RSD monitoring. This data was linked with emission data collected by emission analyser during monitoring (see Table 1: Summary of vehicle data collected from on-road RSD measurement). The VAHAN database was provided by MORTH, and ICAT developed front end of the webpage application and created a server for hosting webpage to access VAHAN. Table 2 illustrates how vehicle types are categorized in the VAHAN database, and how vehicles were benchmarked for further analysis from RSD (see Table 2: Benchmarking of vehicle categories into vehicle type of VAHAN database).
Remote monitoring of emissions from on-road vehicles report.indd 72Remote monitoring of emissions from on-road vehicles report.indd 72 24/06/22 4:47 PM24/06/22 4:47 PM

73
Table 1: Summary of vehicle data collected from on-road RSD measurementS. no. Details Vehicle data
collection
Remarks
1 Total vehicle
captured
305,371 Total vehicles those passed through RSD during the
overall study
2 Total valid data 176,667 Valid data of 1,76,667 vehicles was captured during the
study. Valid implies that vehicle emissions, vehicle speed &
acceleration and vehicle registration number were
captured for these vehicles during data collection. Vehicle
details were further matched using VAHAN database
3 Additional data
collected
16,542 This is additional number of vehicles whose emissions
could
be measured but speed & acceleration and vehicle
registration number could not be captured. This data
contained majority of heavy-duty vehicles
Source: International Centre for Automotive Technology (ICAT 2019–20)
Table 2: Benchmarking of vehicle categories into vehicle type of VAHAN database
S. No. Vehicle Category Assumed vehicle type from
VAHAN database
1 LMV Light motor vehicle LDV
2 LPV Light passenger vehicle LDV
3 LGV < 3500 kg gross weight Light goods vehicle LDV
4 LGV > 3500 kg gross weight Light goods vehicle HDV
5 2WN 2-wheeler 2–3 wheels
6 2W 2-wheeler 2–3 wheels
7 3WT 3-wheeler 2–3 wheels
8 3WN 3-wheeler 2–3 wheels
9 MGV Medium goods vehicle HDV
10 MPV Medium passenger Vehicle HDV
11 HGV Heavy Goods Vehicle HDV
12 HPV Heavy Passenger Vehicle HDV
13 HMV Heavy Motor Vehicle HDV
14 MMV Motorized Mechanic Vehicle HDV
Source: International Centre for Automotive Technology (ICAT 2019–20)
Remote monitoring of emissions from on-road vehicles report.indd 73Remote monitoring of emissions from on-road vehicles report.indd 73 24/06/22 4:47 PM24/06/22 4:47 PM

74
REMOTE MONITORING OF EMISSIONS FROM ON-ROAD VEHICLES: A PRIMER
9. How is RSD equipment set up?The instrument consists of three units which needs to be installed. The light and mirror need to be aligned with each other so that light beam emitted by source device should be collected by the mirror module. The height of the source module needs to be adjusted so that light beam pierces the exhaust beam. The speed measurement bar needs to have its signal at the height of the wheels. And finally, the camera must be adjusted to capture the back number plate well. Depending on the remote sensing device, the equipment needs to be calibrated at prespecified frequency which depends on equipment specification to prevent equipment drift. The calibration should be done every hour during operation until the stability of the individual system is quantified and characterized using statistical process control methods. Once control charts have been established, the calibration frequency may be reduced appropriately. Several puffs of gas designed to simulate all measured components of the exhaust are released from a cylinder containing certified amounts of NO, CO, CO2, and propane into the optical beam path. The ratio readings from the instrument are compared to those certified by the cylinder manufacturer. In this way the system compares the pollutant ratios in a known standard gas cylinder and those measured in the vehicle exhaust. The gases used for the second calibration shall by certified to +/-2% of a known standard and be in the following ranges:
· CO 1–9 per cent· HC as C3 300–4,100 ppm· NO 15,00–3,600 ppm· CO2 5–14 per cent (with the balance oxygen free nitrogen)
When the setup and calibrations are completed, emissions from passing vehicles are measured.
Instruments used for the ICAT study: Information available from the ICAT report shows that the study was performed using a remote sensing RSD4600 system from M/s Opus Inspection, USA. The RSD4600 detects vehicle emissions when a car drives through an invisible light beam the system projects across a roadway. Three principle components are as follows:
i. Source/Detector Module (SDM)- measurement of pollutants of interest using absorption spectroscopy
ii. Speed/Acceleration Module (SAM)- capture vehicle operating mode at time of emissions generation
Remote monitoring of emissions from on-road vehicles report.indd 74Remote monitoring of emissions from on-road vehicles report.indd 74 24/06/22 4:47 PM24/06/22 4:47 PM

75
iii. Camera module- capture image of license plat from the rear from passenger vehicles
The installation and placing of one set of RSD monitoring placed at IGI toll plaza is demonstrated (see Figure 8: RSD installation at toll plaza (IGI Toll), Delhi-NCR).
10. How does RSD equipment procurement need to focus on data sampling and processing?Indian cities will soon be procuring new remote sensing devices. Such procurement will require detailed RFPs and proposals for tendering and procurement. It is therefore important to understand some of the performance indicators that other governments and agencies globally are focusing on. Some of these have been reviewed to identify key technical points regarding the remote sensing equipment procurement to guide action in Indian cities. RFPs and proposals need to focus on the following salient features. These can be further expanded during the actual procurement phase.
Data collectionDescribe in detail how they will sample exhaust emissions from all variations of vehicle exhaust configurations, and for carrying out measurements of exhaust air pollutant emissions and operating conditions of vehicles passing the sampling location(s) and for recording the number plates of sampled vehicles. At a minimum,
Figure 5: RSD installation at toll plaza (IGI Toll), Delhi-NCR
Source: International Centre for Automotive Technology (ICAT 2019–20)
Remote monitoring of emissions from on-road vehicles report.indd 75Remote monitoring of emissions from on-road vehicles report.indd 75 24/06/22 4:47 PM24/06/22 4:47 PM

76
REMOTE MONITORING OF EMISSIONS FROM ON-ROAD VEHICLES: A PRIMER
the remote sensing instrument should be capable of measuring the concentrations of the following species in the exhaust plumes of individual vehicles:· Carbon dioxide (CO2)· Carbon monoxide (CO)· Nitric oxide (NO)· Nitrogen dioxide (NO2)· Hydrocarbons (HC)· Opacity and/or particulate matter (PM)· Optional: Ammonia (NH3)
The achievable measurement precision for each of these species should be detailed in the proposal, as well as any additional pollutant measurement capabilities. Also include as part of the instrument package equipment for the measurement of the operating conditions of vehicles undergoing emissions measurements, GPS location of the site, lane direction, and road grade.
Specifically, measure the speed and acceleration of passing vehicles at the time of emissions measurement. Ambient weather conditions (e.g. temperature, relative humidity, wind speed and direction) should also be measured concurrently with emissions measurements. Finally, contractors should record the number plate of each sampled vehicle.
The contractor is responsible for the proper set-up and operation of all equipment and for conducting appropriate instrument calibrations to ensure data quality. Detailed calibration records shall be provided in the final report.
During the sampling campaign the contractor should provide regular status updates detailing the progress of the campaign to date and any deviations from the original sampling plan. The frequency of status updates will be agreed upon during the planning phase of the project.
Data processing and number plate matching Following the data collection phase of the project, the contractor will be responsible for processing collected emissions and operational data and reporting in a format agreed upon during Task 1. Criteria for establishing the validity of individual emissions measurement records should be detailed in the final report.
Provide data in a format agreed upon during the planning stage of the project. A detailed list of desired data fields to be included. Provide records for individual vehicles grouped into the following three categories:
Remote monitoring of emissions from on-road vehicles report.indd 76Remote monitoring of emissions from on-road vehicles report.indd 76 24/06/22 4:47 PM24/06/22 4:47 PM

77
1. Vehicles with valid emissions measurements matched to vehicle registry2. Vehicles with valid emissions measurements not matched to vehicle registry3. Vehicles with invalid emissions measurements matched to vehicle registry
Criteria for establishing the validity of individual emissions measurement records should be detailed in the final report. The contractor will be responsible for matching vehicle technical information provided by the authority with emissions records.
Data reporting The contractor/operator will deliver a full report, with emphasis placed on the data collection and processing phases of the project. The report should contain at least the following items: 1. Detailed sampling plan2. Description of measurement location(s)3. Description of sampling equipment4. Instrument calibration records5. Summary of data collection campaign6. Details of data processing and validation approach
Detailed analysis of the collected data, e.g. data aggregation by vehicle type, model year, emission control level, operating mode, etc., is outside the scope of this project. The contractor is welcome to perform and report such analyses, though the budget for these steps should not come at the expense of other project activities of greater importance, e.g. data collection.
Data reporting fieldsThe following fields should be included in the final vehicle emissions database provided by the contractor:· Vehicle passage date and time· Vehicle speed [mph]· Vehicle acceleration [mph/s]· Vehicle specific power [kW/tonne]· Concentration CO2 [%]· Concentration CO [ppm]· Concentration NO [ppm]· Concentration NO2 [ppm]· Concentration HC [ppm as propane or other reference hydrocarbon]· Opacity (or concentration PM)· Ratio CO/CO2
Remote monitoring of emissions from on-road vehicles report.indd 77Remote monitoring of emissions from on-road vehicles report.indd 77 24/06/22 4:47 PM24/06/22 4:47 PM

78
REMOTE MONITORING OF EMISSIONS FROM ON-ROAD VEHICLES: A PRIMER
· Ratio NO/CO2· Ratio NO2/CO2· Ratio HC/CO2· Ratio PM/CO2· Emission rate CO [g/kg fuel]· Emission rate NO [g/kg fuel]· Emission rate NO2 [g/kg fuel]· Emission rate NOx [g/kg fuel as NO2]· Emission rate HC [g/kg fuel]· Ambient temperature [°F]1. Relative humidity [%] 2. Barometric pressure [mbar] 3. Wind speed [m/s]4. Wind direction [°]5. Precipitation6. Road grade (%)
Desired vehicle technical information is included below:1. Plate number2. Vehicle identification number3. Vehicle type/category4. Fuel type5. Vehicle make
Government will reserve the right to make minor modifications to the Scope of Services for the Contract resulting from this RFP. Such modifications may include, but are not limited to, assignment to the Contractor of programmatic tasks not previously specified but within general parameters of the RFP. Payment for completion of these tasks will be negotiated by the parties.
Project evaluation procedure and criteria involves cleaning and validating the data collected through remote sensing device. Most of the work at this step involves transcribing number plates, which can be done using automated systems using OCR software which is part of remote sensing device software. OCR software scan the camera image, captured by RSD camera system, and extract the vehicle number plate information. For all the vehicle numbers transcribed using OCR software, a vehicle information is extracted from central vehicle registry database. Emission data along with other information collected by remote sensing device such as speed, acceleration is merged with vehicle information collected through vehicle registry database.
Remote monitoring of emissions from on-road vehicles report.indd 78Remote monitoring of emissions from on-road vehicles report.indd 78 24/06/22 4:47 PM24/06/22 4:47 PM

79
Data analysis: The last step in remote sensing is data analysis. Data analysis is broken into various categories which depend on type of data extracted from vehicle registry.
Evaluate data integrity: The data collected from remote sensing should meet minimum standards of quality to be used in analyses. Following criterion must be applied to remove suspect test records:
· Measurements with inadequate signal strengths.
· Measurements with too much uncertainty.
· Measurements from sites where data is suspected of being compromised during any period of the data collection.
· Measurements from sites or sessions that appear to have unusually high or low average emissions levels.
· Analysis for high emitters should exclude measurements with Vehicle Specific Power (VSP) less than 3kW/t and greater than 25 kW/t.
Other RFP elements include anticipated contract term; compliance with law; contract provisions and requirements; subcontractor compliance notice; and anticipated payment structure.Technical proposal a. Demonstrated quantity and quality of successful relevant experienceb. Project management processc. Methodology
i. Provide a detailed methodology ii. Describe the deliverables.iii. Provide a description of the remote sensing equipment that will be used for
this project.iv. Provide a timeline for the development of the tasks.
Price proposal and project evaluation procedure and criteria
Remote monitoring of emissions from on-road vehicles report.indd 79Remote monitoring of emissions from on-road vehicles report.indd 79 24/06/22 4:47 PM24/06/22 4:47 PM

80
REMOTE MONITORING OF EMISSIONS FROM ON-ROAD VEHICLES: A PRIMER
12. How is fleet average emission measurement estimated? RSD can be used to measure average fleet emissions. This measurement when collected over a period can be translated to what extent tightened emission limits led to emission reduction in on road emission. Short term average emissions from RSD inform about the average CO, HC, NOx emissions of the fleet. However, with comparable measurements over several years can be used to analyse the development of average fleet emissions over time. All this information is very useful for a comparison with the average emission factors as well as fleet composition assumed in an emission inventory or an emission model.
Graph 18 shows the average fleet emissions data from New Delhi Real World Emission Survey (ICAT 2018). Figure 48 shows fleet characterization of emission from different class of vehicles based on fuel types and vehicle weight. Horizontal axis shows the pollutant and for each pollutant data is further segregated with respect to fuel type and vehicle class (light duty, heavy duty etc.). Diesel vehicle emits less CO and HC as compared to petrol or CNG vehicles.
Similarly, all measurements from remote sensing data points to a significant discrepancy of NOx emission control under test cycle and on-road driving conditions for diesel cars. Together with the strong increase of diesel cars in India the failing control of their NOx emission is made responsible for persistent non-compliance with NO2 ambient air quality standards.
The change of average emissions of the rolling fleet depends on the unit emissions of each vehicle class on the fleet turnover, i.e., the share of new vehicles with progressively lower unit emissions added and of old vehicles with higher unit emissions retired, and the respective mileage of the different vehicles. This behaviour is exhibited in the data collected data from New Delhi Real World Emission Survey.
The emissions trend by model year for combinations of vehicle type and fuel. Heavy-duty diesel-powered vehicles have the highest NO emissions (see Graph 19: Average NO emissions by vehicle type, fuel and model year). Light-duty diesel powered vehicles have higher NO than the other light-duty vehicles. Even though NO standards were tightened in 2005 and again in 2010, NO emissions from light and heavy-duty vehicles appear to be relatively constant by model year. This behaviour is unexpected as emission standards have been tightened not only for gasoline but also for diesel cars in India, and all diesel cars, heavy duty vehicles have been shown to really have lower NOx emissions over the homologation cycle (NEDC).
Remote monitoring of emissions from on-road vehicles report.indd 80Remote monitoring of emissions from on-road vehicles report.indd 80 24/06/22 4:47 PM24/06/22 4:47 PM

81
Graph 19: Average NO emissions by vehicle type, fuel and model year
0
500
1000
1500
2000
2500
3000
2006 2007 2008 2009 2010 2011 2012 2013 2014 2015 2016 2017 2018
NO
ppm
HDV_CNG ONLY HDV_DIESEL LDV_CNG ONLY
LDV_CNG_Petrol LDV_DIESEL LDV_PETROL
Data source: New Delhi real world emission study using remote sensing device
Graph 18: Average emissions by vehicle type and fuel
0
200
400
600
800
1000
1200
1400
1600
1800
2000
CO*2000 HC*3 NO UVSmoke*7500
HDV_CNG ONLY HDV_DIESEL LDV_CNG ONLY
LDV_CNG_Petrol LDV_DIESEL LDV_PETROL
Data source: New Delhi real world emission study using remote sensing device
Remote monitoring of emissions from on-road vehicles report.indd 81Remote monitoring of emissions from on-road vehicles report.indd 81 24/06/22 4:47 PM24/06/22 4:47 PM

82
REMOTE MONITORING OF EMISSIONS FROM ON-ROAD VEHICLES: A PRIMER
MORE NUANCED FLEET CHARACTERIZATION
Remote sensing data can be analysed in greater details depending on sample size and vehicle information available from vehicle registry (Borken and Dallmann 2018). As shown in figure below top level shows the fleet emission characterization. The top level can be broken in into further details that can answer following questions:· How diesel cars emissions compared to petrol cars?· Within same fuel type what proportion of cars comply with different emission standards?· For same fuel type and emission standard, how are the emissions from two manufacturers compare?· For same manufacturer how are different models, which comply with same emission standards and having
same fuel type, compare?
A map of real-world emissions can be developed by monitoring real-driving emissions in different locations of the city or area. Because of this, portable RSDs can be deployed in different roads and streets every few days. Emissions can be analysed based on different parameters such as:· Urban parameters: city district, specific site, road slope, road type, traffic intensity, etc.· Vehicle parameters: fuel type, vehicle type, vehicle age, Euro standard, weight, brand, model, etc.· Traffic parameters: traffic intensity, time slot of the day, nearby traffic incidents, etc.
12. How to cross-check on I/M performance?A remote sensing programme is being used as an on-road complement to existing station-based periodic emissions inspection programs. Vehicles must periodically (e.g., annually) report for an emissions inspection at specialized centres which are setup under Inspection & Certification (I&C) programmes.
As vehicles ply on the roads during their inspection cycle, RSDs installed at different places characterize the on-road emissions distribution of the motor vehicle fleet and efficiently distinguish between the highest and the lowest emitters.
The lowest emitting vehicles can be notified stating that they are certified as compliant by RSD and may complete their I&C requirement including paying the applicable fee online without physical tests in I&C stations.
At any time during the inspection cycle, the highest emitters can be notified stating that they need to report (e.g., within 30 days) for re-inspection and re-certification. If highest emitters are not repaired to be compliant, they need to be retired and replaced. This approach helps to focus the I&C tests on the most polluting vehicles and this leads to emissions reduction and accelerated fleet turnover.
Finally, a proper low-emitter exemption programme (i.e. clean screen) fees can fund all remote sensing operations. While this will reduce the cost to the state, it will also substantially improve the convenience and effectiveness of the I&C program. Thus, emission monitoring through remote sensing devices is used
Remote monitoring of emissions from on-road vehicles report.indd 82Remote monitoring of emissions from on-road vehicles report.indd 82 24/06/22 4:47 PM24/06/22 4:47 PM

83
Figure 6: Coarsest to finest level of breakup from remote sensing data
Source: ICCT White paper: Remote sensing of motor vehicle exhaust emissions
Ave
rage
emis
sion
rat
e
Sampled car fleet
Gasolinecars
Euro 5diesel
Mfr. A
A1 A2 A3
Dieselcars
Euro 6diesel
Mfr. B
Euro 6 diesel make
Euro 6 diesel modal
Ave
rage
emis
sion
rat
eA
vera
geem
issi
on r
ate
Ave
rage
emis
sion
rat
eA
vera
geem
issi
on r
ate
Remote monitoring of emissions from on-road vehicles report.indd 83Remote monitoring of emissions from on-road vehicles report.indd 83 24/06/22 4:47 PM24/06/22 4:47 PM

84
REMOTE MONITORING OF EMISSIONS FROM ON-ROAD VEHICLES: A PRIMER
for emission inspection convenience and effectiveness (see Fig. 5: Use of remote sensing in inspection and maintenance programme).
14. How to use remote sensing data to evaluate the effectiveness of a programme? Remote sensing data can be used in several ways to evaluate the effectiveness of an I&C programme:· Remote sensing measurement of vehicles happen at different times and quite
randomly between scheduled I&C tests. Therefore, remote sensing data can be used to assess how quickly effectiveness of repair diminishes over time and extent of repair just prior to the I&C tests, as well as track changes in fleet emissions due to changes in test procedures.
Figure 7: Use of remote sensing in inspection and maintenance programme
Source: Etest corporation
Remote monitoring of emissions from on-road vehicles report.indd 84Remote monitoring of emissions from on-road vehicles report.indd 84 24/06/22 4:47 PM24/06/22 4:47 PM

85
· Remote sensing programmes measure almost every vehicle that drive past the instrument on the road, regardless of whether it is participating in the I&C program. Remote sensing data therefore can be used to estimate the number and emissions of vehicles legally exempted from, or illegally avoiding, the I&C programme, as well as estimating their emissions. In addition, remote sensing data can identify individual vehicles that never complete the current I&C cycle, or that do not report for testing in a subsequent test cycle but are still being driven in the I/M area.
Evaluate sample distribution: Depending on type of information retrieved from the vehicle registry, vehicles can be segregated into different classes based on:· total number of registered vehicles.· total number of registered light-duty gasoline vehicles, trucks, etc.· total number of registered heavy-duty diesel vehicles, trucks; etc. · total number of registered motorcycles/scooters etc.
For each vehicle class, total vehicles registered in a programme area (either based on district boundaries or based on area zip code) can be compiled. This data can be compared with the data on aggregate fleet composition, based on the vehicle classes, for the programme area. This can help to determine if the vehicles measured satisfactorily represent the programme area. If any gross discrepancies occur in the data, then appropriate causes for such discrepancies need to be investigated. For any real distortions in the representativeness of the sample, specific recommendations about how to correct such distortions in both future studies and current programs recommend the steps needed for improved methods for site selection or improved methods for remote sensing screening.
15. How to relate RSD with traffic flow factors?The number of vehicles passing from remote sensing equipment at each site should be compared with traffic flow information in last 24-hours. Based on traffic information from all sites, statistical correlation should be done to check if 24-hour traffic counts and measured traffic flows from remote sensing equipment match. If such correlation exists for either all sites or specific types of sites, then criteria should be developed to identify remote sensing sites that maximize fleet coverage in future remote sensing programmes. If statistically significant variations exist between different sites, then factors such as geographic, road type, traffic flow direction, etc. needs to be identified that contributed to the differences.
Remote monitoring of emissions from on-road vehicles report.indd 85Remote monitoring of emissions from on-road vehicles report.indd 85 24/06/22 4:47 PM24/06/22 4:47 PM

86
REMOTE MONITORING OF EMISSIONS FROM ON-ROAD VEHICLES: A PRIMER
16. How to ensure overall fleet coverage? The observed fleet coverage in a remote sensing program area can be calculated by getting information on vehicle fleet composition based on parameters such as vehicle class, vehicle model year from vehicle registry. This data can be compared with measured data from remote sensing devices. Percentage coverage of vehicles can be calculated by taking the ratio of vehicles observed in program area against the composition of vehicles, based on above parameters, in same program area. If the ratio is low, then reasons for low coverage can be investigated and effective measures can be taken to improve vehicle coverage for current and future RSD programs.
17. How to understand breakdown of emissions?Emissions by vehicle type and model year from observations of vehicles in the programme area can be grouped. For each group, data will be sorted by emission level and presented in appropriate increments (quartiles, deciles, etc.) for the overall fleet. Results for older vehicles will be aggregated into model year ranges if there is an insufficient sample for each model year. As an example, classification of light duty petrol vehicles can be based on the predominant vehicle technology approaches: · pre-catalytic converter · catalytic converter/carburetted · closed loop/carburetted · closed loop/fuel injected · OBD I/OBDII
Moreover, from speed/acceleration and site grade data vehicle specific power can be calculated. Measurements can be classified according to vehicle specific power, and average emissions can be plotted. Measurements with a VSP value that exceeds the range covered by certain certification test procedures will be excluded because they may legitimately be operating with an enriched fuel/air mixture.
18. How does RSD help to identify high emitters?As mentioned earlier, on-road remote sensing has been used to filter out vehicles with highest absolute emissions in the fleet. These are mostly older vehicles or vehicles with dysfunctional after-treatment.
Graph 20 shows the percentile emission distribution for NOx and PM for heavy duty diesel vehicle for New Delhi Real World Emission Survey (ICAT 2018). For this analysis, pollutants were plotted from lowest to highest value and distribution of emissions as a percent of observations were determined. The percentile
Remote monitoring of emissions from on-road vehicles report.indd 86Remote monitoring of emissions from on-road vehicles report.indd 86 24/06/22 4:47 PM24/06/22 4:47 PM

87
Graph 20: Distribution of NO emissions from HDV diesel
Data source: New Delhi real world emission study using remote sensing device, 2018
Graph 21: Distribution of UV smoke emissions from HDV diesel
Data source: New Delhi real world emission study using remote sensing device, 2018
Remote monitoring of emissions from on-road vehicles report.indd 87Remote monitoring of emissions from on-road vehicles report.indd 87 24/06/22 4:47 PM24/06/22 4:47 PM

88
REMOTE MONITORING OF EMISSIONS FROM ON-ROAD VEHICLES: A PRIMER
distribution shows that 89 per cent of CO, 91 per cent of HC, 64 per cent of NO and 70 per cent of smoke is caused by top one per cent polluting vehicles. It these vehicles are taken off from the road then there will be significant reduction in emissions from heavy duty vehicles (see Graph 21: Distribution of UV smoke emissions from HDV diesel).
Small number of vehicles are causing significant emissions. This is expected because old vehicles have higher emissions either due to aftertreatment performance deterioration or aging. The frequency of high emitters among newer models is much lower.
19. How can emissions cut point be defined? Data from initial part of remote sensing measurement should be used to define emission cut points for different vehicle class (light duty, heavy duty, 2 wheelers etc.). Definition of emission cut point is important to identify high and gross emitters. If there is sufficient data the cut points can be further segregated not only based on vehicle class but also on fuel type within the same vehicle class (light duty petrol, light duty diesel, heavy duty diesel etc.). For cut point definition, usually 5 per cent percentile rule is followed, implying that top 5 per cent vehicle causes maximum emission.
Remote sensing technology uses a snapshot measurement to determine if a passing vehicle is clean or high emitting. However, the transient emissions of vehicles are highly variable. It is important to recognize that a vehicle with high instantaneous emissions does not necessarily mean that it is a permanent high emitter. Clean vehicles may have high emissions occasionally, such as during load change conditions. To ensure the confidence of high-emitters determination by remote sensing, a key procedure is that the cutpoints should be safely above the emission levels of clean vehicles while still capture as many high-emitting vehicles as possible.
Therefore, the remote sensing cutpoints are defined as the highest instantaneous emission levels of vehicles that could still pass the regulatory emission test. In practical implementation of remote sensing enforcement program, other procedures to ensure the confidence of high-emitters determination include: 1) using remote sensing readings only within the speed and acceleration ranges of the regulatory emission cycle to avoid off-cycle emissions; and 2) using two units of remote sensing systems with one second distance in between, and both measurements must be above the cutpoints to classify vehicle as high emitter.
Remote monitoring of emissions from on-road vehicles report.indd 88Remote monitoring of emissions from on-road vehicles report.indd 88 24/06/22 4:47 PM24/06/22 4:47 PM

89
Finally, cutpoints are expressed in relative concentration ratio of NO/CO2 (ppm/%) which is the only measured parameter in a remote sensing system. NO concentration can be calculated based a key assumption that the engine is running under stoichiometric or rich conditions with no excess oxygen in the exhaust. This is true for the gasoline and LPG (or spark ignition) engines, but not for diesel (or compression ignition) engines. This is believed to be a main reason leading to the issue of frequent false detection of diesel high emitters (Y. Huang, B. Organ, J.L. Zhou, N.C. Surawski, Y.S. Yam, E.F.C. Chan 2019).
In the first step a large sample of same class of vehicle should be taken. A sample should consist of vehicle from same class, fuel type and emission standard. The sample should also consist of vehicle from different model year while still fulfilling above requirements. The sample of vehicle chosen should undergo regulatory emission test on chassis dynamometer. Based on emission test results, emission data of different pollutant should be arranged in ascending order for different pollutant and percentile emission plots as shown in below figures should be prepared. While selecting vehicle, care should be taken such that vehicle sample should consists of mix of vehicles which passes and fails the regulatory emission tests. In above plots solid green line shows percentile emission plot vehicles that passes the emission test while dashed red line shows the percentile emission plot for vehicles that fails the emission test (see Graph 22: CO (a), HC (b) and NOx (c) emission percentiles of pass and failed vehicles).
As shown in figure, CO HC and NOx concentrations of both pass and failed vehicles have some difference between emission concentration. A good choice of cutpoints is 99 per cent percentile of emission from pass vehicles. From each plot, (CO, HC and NOx) a vertical line from 99 per cent percentile of pass vehicle a horizontal line is projected onto red line of failed vehicles. The 99th emission percentiles of pass vehicles equal to the x percentile CO, y percentile HC and z percentile NOx of failed vehicles. This means, if the 99th emission percentile levels of pass vehicles are used as the cut points, a high-emitter will have (100-x) %, (100-y) % and (100-z) % of chance to be identified as high-emitting in CO, HC and NOx by a snapshot remote sensing measurement, respectively. A threshold of 99 percentile from pass vehicle will ensure that no pass vehicle will be classified as high emitter in remote sensing measurement.
Diesel vehicles have much lower CO and HC emissions but higher NOx emissions than gasoline vehicles do. So, for diesel vehicle CO, HC percentile curves for pass and failed vehicles will be very close, thus increasing the possibility of classifying
Remote monitoring of emissions from on-road vehicles report.indd 89Remote monitoring of emissions from on-road vehicles report.indd 89 24/06/22 4:47 PM24/06/22 4:47 PM

90
REMOTE MONITORING OF EMISSIONS FROM ON-ROAD VEHICLES: A PRIMER
Graph 22: CO (a), HC (b) and NOx (c) emission percentiles of pass and failed vehicles
0.0
0.1
0.2
0.3
0% 20% 40% 60% 80% 100%
CO
(%
)
Percentile
0% 20% 40% 60% 80% 100%
Percentile
0% 20% 40% 60% 80% 100%
Percentile
(a)Pass vehicles
Failed vehicles
0
4
8
12
16
HC
(pp
m)
(b)Pass vehicles
Failed vehicles
0
200
400
600
800
NO
x (p
pm)
(c)Pass vehicles
Failed vehicles
Source: Y. Huang, B. Organ, J.L. Zhou, N.C. Surawski, Y.S. Yam, E.F.C. Chan - Characterisation of diesel vehicle emissions and determination of remote sensing cutpoints for diesel high-emitters. Environmental Pollution 2019; 252: 31-38. DOI: https://doi.org/10.1016/j.envpol.2019.04.130
Remote monitoring of emissions from on-road vehicles report.indd 90Remote monitoring of emissions from on-road vehicles report.indd 90 24/06/22 4:47 PM24/06/22 4:47 PM

91
a vehicle as false emitter. Greater the separation between pass and failed vehicle higher the chance of classifying the vehicle as high emitter.
20. What is clean screening of vehicles? Clean screening refers to the program where vehicles are exempted from inspection after being detected several times in remote sensing measurement as having very low emissions. The programme offers convenience to vehicle owners by exempting them to visit inspection centre when their vehicle is flagged clean by remote sensing device. In a way it is the opposite of the high-emitter screening discussed above. The “clean pass” limits are set quite low to guarantee clean operation also under different than measured driving conditions. All relevant pollutants need to be measured as there are no reliable correlations among them.
Other applications of remote sensing can be:· RSD screening programs can amass very large databases of on-road emissions
measurements. For example, the largest US clean screen programmes gather millions of high-quality (i.e. valid) measurement annually. Such databases can be mined for numerous other beneficial applications of remote sensing data.
· Gross liquid (i.e. fuel) leak detection: Virginia issues advisory notices to gross liquid leakers.
· Remote sensing can be used to understand emission control device (i.e. catalyst) deterioration factors.
· Remote sensing data can be used for verification of on-board diagnostic systems. This helps to understand if the vehicle OBD systems are functional and serve their intended purpose.
21. How to correlate RSD monitoring with PUC results in India? As noted earlier, a separate Pollution Under Control (PUC) program is required for vehicles in India. The PUC program in most cities mandates an emissions test twice a year (four times a year in Delhi) for every vehicle and requires that emissions do not exceed set norms. Only new vehicles require a test after the first year For petrol, CNG, and LPG vehicles, emissions are measured at low idling conditions, while for diesel-operated vehicles, a snap acceleration (a protocol that involves repeatedly snapping the throttle fully open to go from an idling engine to full power) or free acceleration test is used. PUC tests have evolved over time for different generation of mass emissions standards. PUC norms for BSIV and BSVI
Remote monitoring of emissions from on-road vehicles report.indd 91Remote monitoring of emissions from on-road vehicles report.indd 91 24/06/22 4:47 PM24/06/22 4:47 PM

92
REMOTE MONITORING OF EMISSIONS FROM ON-ROAD VEHICLES: A PRIMER
compliant vehicles have been tightened further (see PUC norms for BS IV or BS VI vehicles powered by petrol, LPG and CNG).
However, PUC tests is not appropriate for vehicles fitted with advance emission controls system on diesel vehicle complying BS VI emission norms. For diesel vehicles PUC programme required free acceleration smoke (FAS) test. Modern diesel vehicles complying BS VI are fitted with diesel particle filter which traps 99 per cent of black carbon particles. So, majority of BSVI diesel vehicles will qualify the FAS test in PUC (see Table 3: PUC norms for BS IV or BS VI vehicles powered by petrol, LPG and CNG).
Table 3: PUC norms for BS IV or BS VI vehicles powered by petrol, LPG and CNGS. no. Type of vehicle Idle limits emission High Idle emission limits
(RPM-2500 ± 200)
CO% HC (n
hexane Equivalent
ppm)
CO % Lambda (λ)
(1) (2) (3) (4) (5) (6)
1. Compressed Natural Gas/ Liquefied
Petroleum Gas driven four wheelers
manufactured as per Bharat Stage IV or
Bharat Stage VI Norms
0.3 200 --- 1 ± 0.03 or
as declared
by the
manufacturer
2. Manufactured as per Bharat Stage IV or
Bharat Stage VI Norms
0.3 200 0.2
Table 4: PUC norms for BS VI vehicles powered by dieselS. no. Method of Test Maximum Smoke Density
Light absorption coefficient
(1/meter)
Hartidge unit
(1) (2) (3) (4)
1. Free acceleration test for turbo charged engine and naturally
aspirated engine for vehicle manufactured as per pre-Bharat
stage IV norms
2.45 65
2. Free acceleration test for turbo charged engine and naturally
aspirated engine for vehicle manufactured as per Bharat
stage IV norms
1.62 50
3. Free acceleration test for turbo charged engine and naturally
aspirated engine for 4 Wheelers manufactured as per Bharat
stage VI norms
0.7 26
4. Free acceleration test for turbo charged engine and naturally
aspirated engine for two/three Wheelers manufactured as per
Bharat stage VI norms
1.5 48
Remote monitoring of emissions from on-road vehicles report.indd 92Remote monitoring of emissions from on-road vehicles report.indd 92 24/06/22 4:47 PM24/06/22 4:47 PM

93
There is considerable curiosity among transport regulators with regard to the coexistence of remote sensing and PUC programmes as enforcement measures. However, to understand the compatibility of PUC and RSD programmes more data is needed to analyse statistically if there is significant correlation between the two.
In the ICAT 2018 study, vehicles identified as high emitters by RSD were pulled over for checking their idle emissions. RSD flagged a total of 52 vehicles as high emitters and they were therefore pulled over. Out of 52 vehicles 35 vehicles passed the idle emissions checks while 17 vehicles had failed idle emissions checks with approximate correlation of 33 per cent (17 out of 52 vehicles) and established for regulated pollutants as per Rule 116 of CMVR, 1989.
Furthermore, the ICAT study also compared the emission level of vehicles from RSD and emissions from the regulatory cycle on which the vehicle was homologated. For the study, 16 high emitter vehicles identified (based on 99 per cent percentile factor) by RSD were run on a regulatory cycle on which the vehicle is originally homologated. Emissions from the regulatory cycle are compared with emission level from RSD based on 99 per cent percentile emission criterion. Out of 16 vehicles only 10 vehicles failed the regulatory test, although the expectation was that all 16 vehicles would fail the regulatory tests. This implies that a few high emitters identified by RSD can still pass the regulatory test as per Rule 116 of CMVR, 1989.
This pilot study highlights the fact that there is not much correlation between PUC and RSD to identify high emitters.
Under the Indian PUC programme, periodic physical checks of exhaust emissions from vehicles will continue to assess compliance with limits imposed on idling emissions. However, it is important to understand that the remote sensing programme will screen vehicles on the road to identify gross or very high emitters.
It is possible that some vehicles may escape or even pass PUC tests and yet experience technical anomalies that may make them high emitters between two scheduled PUC tests. PUC test is no load test which has little relevance to classify vehicles as high or low emitters. Due to the limitations of PUC, remote emission measurement using RSD is a better method to measure fleet vehicle emissions and make recommend strategies for reducing on-road emissions.
Remote monitoring of emissions from on-road vehicles report.indd 93Remote monitoring of emissions from on-road vehicles report.indd 93 24/06/22 4:47 PM24/06/22 4:47 PM

94
REMOTE MONITORING OF EMISSIONS FROM ON-ROAD VEHICLES: A PRIMER
22. How many RSD devices are needed in a city? There is no clear benchmark for the number of monitors that a city needs to have. The size of the city, traffic volume and the level of ambition of the programme will influence that decision.
For instance, a big city like Beijing with ambitious air pollution programme has 30 remote sensors; a small city like Hong Kong has about 15 monitors. Experts guess estimate that a city like Delhi may require 10 monitors and Kolkata may perhaps require 5 that can be used more effectively. These sensors can be strategically and flexibly located in different parts of the city for rapid screening of vast section of traffic.
23. How much will it cost to implement an RSD programme?The primary factor governing the cost of any RSD programme depends on program objective. If the programme objective is to evaluate emissions from vehicles plying on highways, the cost of setup and manpower will be less as compared to measuring vehicle emissions on congested city roads. For setting up RSD instruments in city roads additional safety of manpower and equipment needs to be arranged, thus increasing programme cost.
The cost of RSD programme also depends on number of sites selected for monitoring vehicle emissions. Greater the number of sites, higher will be cost of the programme.
The cost of the RSD programme also depends on technology chosen for RSD device. Laser based device from HEAT is more expensive then IR/UV based device from OPUS.
Ultimately, the ambition level of the remote sensing expectation will be determine by the cost of these instruments. This will need more scoping. However, the available data from different countries show that remote sensing devices may largely cost in the range of Rs 2.5–3+ crore in India. The overhead monitors and the attendant systems will cost more.
24. How can an RSD programme be leveraged for enforcement and pull-over inspection? Based on the RSD monitoring the law enforcement agencies can stop and pull out the high emitters and send them for repair. Notices can be issued online and the vehicles can be asked to go for repair and report back for tests.
Remote monitoring of emissions from on-road vehicles report.indd 94Remote monitoring of emissions from on-road vehicles report.indd 94 24/06/22 4:47 PM24/06/22 4:47 PM

95
RSD enables pull over inspection. During the pilot programme of ICAT pull-over inspection by ICAT along with Traffic police was conducted at ICAT at Kherki Duala Toll Plaza (Manesar). 17 (8 diesel+8 CNG/Petrol + 1 Petrol) vehicles out of 52 were identified as gross-polluter, 35 vehicle (~67 % of total inspection) vehicles were passed with respect to RSD data. (See Table Summary of pull-over inspection during study period). 17 vehicles failed idle emission testing determined either through 4 gas analyzers in case of CNG, Petrol powered vehicles and opacimeter in case of Diesel vehicles. About 9 vehicles had failed with considerable margin. (see Table 5: Summary of pull-over inspection during study period).
However, as global programmes show, remote sensing can also alert the local law enforcement agencies about the potential tempering of aftertreatment system in vehicles especially heavy duty vehicles. To save operating cost many fleet operators usually disable the AdBlue injection system that is needed to control NOx emissions. This manipulation is done in different ways, some of them with the so-called “AdBlue killers”, which are devices that can be purchased for a very low price and can be easily installed into driver’s cabin. The AdBlue killer makes the computer believe that it is injecting AdBlue when it is not. Finding and penalizing such drivers or fleet operators are required by enforcing agencies.
The only option to catch manipulation is to have real time emission measurement that can be performed by remote sensing device. This can improve the effectiveness
Table 5: Summary of pull-over inspection during study periodS. no. Descriptions Details
1 No. of vehicles passed by RSD Approx. 3,152
2 No. of vehicles identified as high polluters
based on cut points defined
66
3 No. of vehicles successfully pulled over for
inspection
52 (remaining 14 vehicles either run away or didn’t
cooperate for inspection after being stopped)
4 Inspection Summary Out of these 52 vehicles; 35 passed and 17 failed idle
emission testing determined either through 4 gas
analysers in case of CNG, Petrol powered vehicles and
opacimeter in case of diesel vehicles
Out of 17 failed vehicles, 8 were powered by diesel, 8 by
CNG-petrol (bi-fuel vehicles but were running on CNG at
the time of pull over) and 1 by petrol
Out of 17 failed vehicles, 9 failed by considerable margin
and failed marginally
Source: International Centre for Automotive Technology (ICAT 2019)10
Remote monitoring of emissions from on-road vehicles report.indd 95Remote monitoring of emissions from on-road vehicles report.indd 95 24/06/22 4:47 PM24/06/22 4:47 PM

96
REMOTE MONITORING OF EMISSIONS FROM ON-ROAD VEHICLES: A PRIMER
of enforcement and prevent tampering (see Fig. 8: Real driving emission monitoring for heavy duty vehicle to catch AdBlue killers.)
25. What are the operational limitations of the remote sensing programme?RSD have various limitations in hardware. measurement accuracy, road type and configuration, vehicle traffic and speed, meteorological parameters, and tailpipe configuration.
Following challenges were faced during the ICAT pilot study:· During unfavourable meteorological condition such as rain, fog etc., RSD
camera was unable to capture the number plate data of vehicles. Also, less lighting and less visibility in night was also difficult for camera to capture number plate data.
· The different orientations of tail pipe in heavy duty vehicles are one of major challenges to collect RSD data. Special arrangement has been made for keeping camera on the way of upstream gas analyser.
· Approximately, 1-2 per cent vehicles registration details were not available in central server (VAHAN database) but vehicle emission datasets were collected. Therefore, these data were discarded.
· One of the major challenges to getting convince people for getting their vehicle inspected during pull over inspection. Many of the vehicle owners ran away or disputed during inspection.
· Public movement during on road measurement is resulted in data loss.
Figure 8: Real driving emission monitoring for heavy duty vehicle to catch AdBlue killers
Source: https://www.opusrse.com/remote-sensing-applications/police-enforcement/
The RSD measures the real emissions
If a truck surpasses a certain limit,it gives an alert
The policeman inspects the truck to find a manipulation
Remote monitoring of emissions from on-road vehicles report.indd 96Remote monitoring of emissions from on-road vehicles report.indd 96 24/06/22 4:47 PM24/06/22 4:47 PM

97
· RSD device is based on optics and mirrors, which play important role to maintaining alignment of light source to capture the plume. Due to dust and pollution, mirrors had to be frequently changed to get correct emission data.
· High traffic volumes in individual lanes at toll was acquired long-time for RSD data collection as compared proposed time in this study. As a result, the planned six-month data collection required 9 months to reach the 175,000 valid measurements target.
· Space constraints at toll, the individual components of RSD were dismounted in the night and store near storage shed. The repeated mounting of RSD’s accessories and cables can cause more system failures than expect.
· Dynamic cut-points need to be also challenged during screening programmed which is dependent on vehicle speed, acceleration, and load etc.
These issues need to be understood in greater detail.
Signal to noise (S/N) considerations: Remote sensing measurements would be very easy if all the emissions are measured directly behind the car exhaust tail pipe. In such a case light absorbed by pollutant would be large and S/N will cause any limitations. In fact, vehicle tailpipes are not in standardized configurations, vehicle engine sizes are not uniform, and there is very rapid turbulent dilution of the exhaust behind vehicles moving faster than about 5 mph. Thus, one has to make an engineering trade-off between a desire to measure emission from maximum vehicles and still have adequate S/N ratio so as not to detect incorrect emission values.
Remote sensing instrument builder’s challenge is to build a system in which changes in IR and UV intensity due to exhaust dilution are accurately measured in all weather conditions beside a normal road at a measurement frequency of 100 Hz. Further the exhaust dilution, harder it becomes to capture the signal of adequate strength for accurate detection of pollutant gases. This bleak outlook is somewhat mitigated by the fact that the light source need only maintain a stable intensity for about two seconds for a complete measurement series and the fact that the data reduction process averages for 1/2 sec.
Weather: Measuring light intensity from remote sensing device over greater path length of light (distance between source and detector module) can be inhibited by bad weather which otherwise would not be a problem. Snowflakes and heavy rain
Remote monitoring of emissions from on-road vehicles report.indd 97Remote monitoring of emissions from on-road vehicles report.indd 97 24/06/22 4:47 PM24/06/22 4:47 PM

98
REMOTE MONITORING OF EMISSIONS FROM ON-ROAD VEHICLES: A PRIMER
add too much noise to measurement channels. Wet or very dusty roadways cause a plume of spray or dust behind vehicles moving above about 10 mph. These plumes also add noise to the system, and generally increase the data rejection rate to an unacceptable level.
Interference: The HC (hydrocarbons) wavelength suffers from some interference from gas phase, particulate phase and water also called steam plumes which forms from colder vehicles operating at low ambient temperatures. When steam plumes are so thick such that light from all wavelengths are absorbed or scattered too much for useful data to be acquired.
Optical alignment: If the instrument is not perfectly optically aligned, the voltages are likely to be very sensitive to equipment vibration. Since moving vehicles both shake the roadway and generate wind pulses, rigid instrument mounting is as important as perfect internal and external optical alignment. Software is written so that these noise sources generate invalid flags. Proper alignment at a well characterized RSD-site can yield 95 per cent valid RSD readings on passing vehicles.
26. Is there a challenge of emission variability? Emissions of motor vehicles are not constant from second to second or from day to day. Broken vehicles often seem to have a large random component to their emissions irrespective of what test is used to make the measurement. Some vehicle emission variability has known causes such as the initial operation of cold vehicles before the engine control system stabilizes and the catalyst begins operation, or when the vehicle is accelerated at full throttle. Both situations give rise to large CO and HC emissions from even well-maintained vehicles but can be minimized through careful site selection.
27. What are the other limitations?• Remote sensing device works most accurately under slight acceleration, e.g.,
uphill roads; therefore, emissions during idle and deceleration are considered as invalid.
• Evaporative emissions do not correlate with carbon dioxide emitted from fuel combustion. While it is harder to locate the exact source of evaporative emissions, any lack of correlation with CO2 emissions points to a leakage that could warrant closer follow-up inspection of the individual vehicle.
Remote monitoring of emissions from on-road vehicles report.indd 98Remote monitoring of emissions from on-road vehicles report.indd 98 24/06/22 4:47 PM24/06/22 4:47 PM
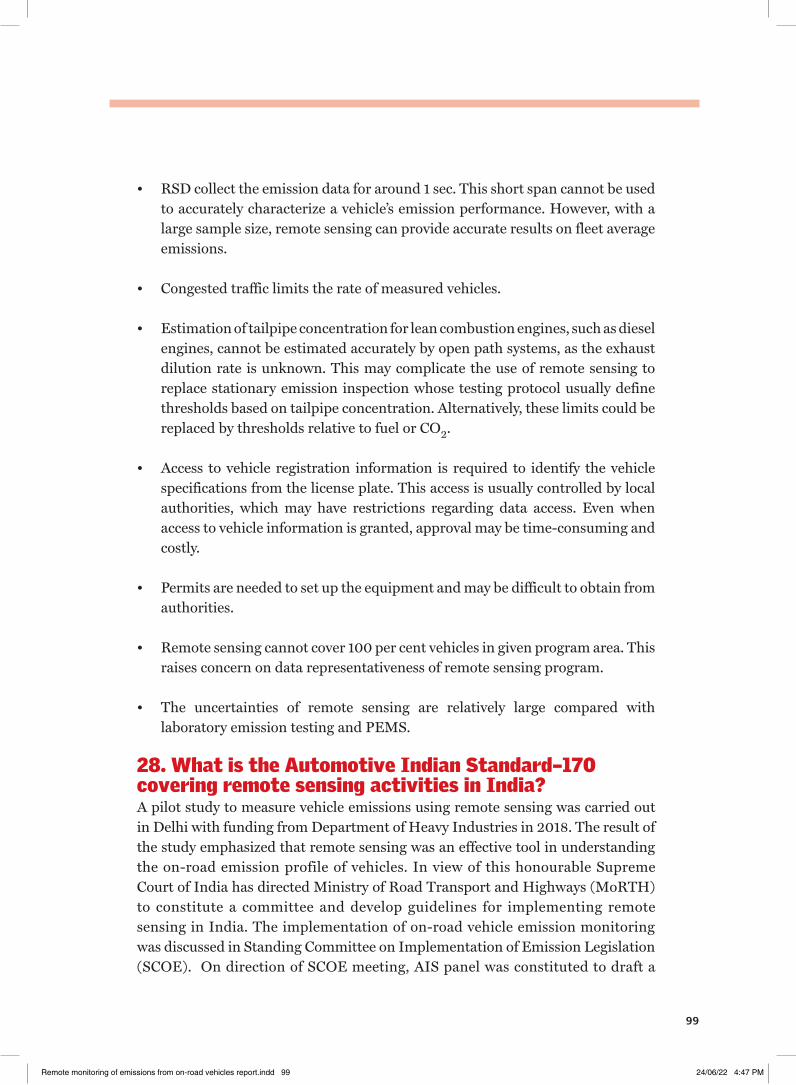
99
• RSD collect the emission data for around 1 sec. This short span cannot be used to accurately characterize a vehicle’s emission performance. However, with a large sample size, remote sensing can provide accurate results on fleet average emissions.
• Congested traffic limits the rate of measured vehicles.
• Estimation of tailpipe concentration for lean combustion engines, such as diesel engines, cannot be estimated accurately by open path systems, as the exhaust dilution rate is unknown. This may complicate the use of remote sensing to replace stationary emission inspection whose testing protocol usually define thresholds based on tailpipe concentration. Alternatively, these limits could be replaced by thresholds relative to fuel or CO2.
• Access to vehicle registration information is required to identify the vehicle specifications from the license plate. This access is usually controlled by local authorities, which may have restrictions regarding data access. Even when access to vehicle information is granted, approval may be time-consuming and costly.
• Permits are needed to set up the equipment and may be difficult to obtain from authorities.
• Remote sensing cannot cover 100 per cent vehicles in given program area. This raises concern on data representativeness of remote sensing program.
• The uncertainties of remote sensing are relatively large compared with laboratory emission testing and PEMS.
28. What is the Automotive Indian Standard–170 covering remote sensing activities in India?A pilot study to measure vehicle emissions using remote sensing was carried out in Delhi with funding from Department of Heavy Industries in 2018. The result of the study emphasized that remote sensing was an effective tool in understanding the on-road emission profile of vehicles. In view of this honourable Supreme Court of India has directed Ministry of Road Transport and Highways (MoRTH) to constitute a committee and develop guidelines for implementing remote sensing in India. The implementation of on-road vehicle emission monitoring was discussed in Standing Committee on Implementation of Emission Legislation (SCOE). On direction of SCOE meeting, AIS panel was constituted to draft a
Remote monitoring of emissions from on-road vehicles report.indd 99Remote monitoring of emissions from on-road vehicles report.indd 99 24/06/22 4:47 PM24/06/22 4:47 PM

100
REMOTE MONITORING OF EMISSIONS FROM ON-ROAD VEHICLES: A PRIMER
technical requirement for remote sensing implementation in India. SCOE also directed to consider polluter thresholds based on prevalent emission norms and in the absence of authentic data for these thresholds, the committee had agreed to consider the first year as monitoring phase to arrive at threshold values.
The output of the AIS panel was the formation of AIS 170 document which focuses on technical guidance on remote sensing equipment, remote sensing data reporting which specifies design, construction, networking, and data sharing of motor vehicle and recommend polluter thresholds for different vehicle and different fuel types.
29. What are the salient points of AIS 170?
• AIS 170 defines the RSD equipment device specifications such as equipment range and accuracy for emission pollutants. The specifications define device’s emission measurement capabilities to be followed while implementing RSD programmes.
• It also defines different standards such as IS/IEC 60529 (for ingress protection), IEC 61000 (Electromagnetic compatibility) that device must comply.
• AIS 170 defines the list of parameters such as emission measurements, vehicle registration details, operating conditions, time and date of measurement, RSD device details etc. that shall be recorded in RSD programme evaluation studies.
• It gives a list of IT hardware and infrastructure required to set up the device at the monitoring station.
• It gives the requirement on how and at what frequency the RSD device should be calibrated, a failure of which may affect the device accuracy to measure pollutants.
• It gives the steps required to properly set up the devices at the site.
• It gives an indication on how valid and invalid vehicle records are classified.
Remote monitoring of emissions from on-road vehicles report.indd 100Remote monitoring of emissions from on-road vehicles report.indd 100 24/06/22 4:47 PM24/06/22 4:47 PM

101
30. What are the gaps in AIS 170?• The procedure does not elaborate on consideration to be followed while
choosing remote sensing sites. The document also does not define what data analysis needs to be carried out for effective monitoring of remote sensing programme.
• The procedure fails to classify different remote sensing technologies that are available in the market and what technologies will be best suited for India. For some of the current RSD technologies equipment calibration is not required as they are based on different measurement principle. However, the document has generically covered all equipment as having the requirement of periodic calibration.
• It does not give any details on how emissions cut points, above which a vehicle is considered high emitters, are defined.
• The document lacks in providing clear guidelines on how PUC and remote sensing can co-exists and if the vehicle needs to pass both to remain road worthy.
• AIS 170 document is not clear on regulatory action to be taken in case if the vehicle is identified as high emitter. The lack of clear legal framework will slow the technology adoption and causes legal dispute between vehicle owners who think that their vehicle has valid PUC certificate and authorities who had identified vehicle as high emitter through remote sensing device.
• AIS 170 document does not provide details on how the computer system at monitoring site should communicate with VAHAN database. Nor it gives any details on technology requirements from NIC (National Informatics Centre) to be followed if some entity wants to access VAHAN data for implementing remote sensing programme.
As ICCT has further recommended with respect to AIS 170, it is crucial that the draft makes it mandatory to measure CO2 absorption. RS does not measure tailpipe concentration directly. It is recalculated from the pollutant/CO2 absorptions ratio (and only done correctly for stochiometric engines, therefore not for diesels). Without CO2 absorption, pollutant absorptions alone are hardly useful. ICCT also recommends making NO measurement mandatory, as well as
Remote monitoring of emissions from on-road vehicles report.indd 101Remote monitoring of emissions from on-road vehicles report.indd 101 24/06/22 4:47 PM24/06/22 4:47 PM

102
REMOTE MONITORING OF EMISSIONS FROM ON-ROAD VEHICLES: A PRIMER
primary NO2. Modern diesel can emit up to 50 per cent of NOx as NO2. There can be a risk that RS with NO, but without NO2, will underestimate real-world NOx emissions of diesel vehicles.
AIS 170 document should comprehensively address the challenges posed by model engine technology. In view of this national regulations for vehicle emission monitoring using remote sensing should be prepared that provide guidelines on how to implement remote sensing program in India. Cities that want to carry out remote-sensing programmes will refer to the national regulation to screen for and take actions against non-compliant high-emitting diesel vehicles. The standardized remote sensing data can also be used for purposes that are not covered in the regulation, such as fleet screening, evaluating the in-use vehicle emission level, and identifying high-emitting models that may have manufacturing defects.
Remote monitoring of emissions from on-road vehicles report.indd 102Remote monitoring of emissions from on-road vehicles report.indd 102 24/06/22 4:47 PM24/06/22 4:47 PM

103
SECTION 3: Worldwide remote-sensing regulations and compliance
Remote sensing technology is widely used world over to measure in-use vehicle emissions. The program is implemented in 27 countries. Programmes in more than three-quarters of these countries used data from remote sensing to monitor fleet emissions. Programmes in some US states, mainland China, Hong Kong, South Korea, Canada, Mexico, Austria, Iran, Bulgaria, Germany, Spain, and Denmark have used or plan to use remote sensing to identify individual high emitters. The sections below give an overview of the remote sensing programme implemented in some countries.
1. Remote sensing programme in Hong KongHong Kong is one of the first megacities where remote sensing has been extensively tested since 1993 under the auspices of the Hong Kong Environmental Protection Department (HKEPD) and is currently used for regulatory enforcement. From 1st September 2014, the HKEPD started to use remote sensing as an enforcement tool for detecting high-emitting vehicles in Hong Kong. The HKEPD enforcement program utilized two sets of remote sensing equipment that were placed with one-second distance on a slight incline. All the data was transmitted to a remote data storage and then post processed by the HKEPD to identify the vehicle manufacture year, model, fuel type and emission certification levels. For a vehicle to be identified as a high emitter, there must be two measurements above the cutpoints, and the driving characteristics must be within the speed/acceleration ranges of the laboratory testing cycle. The measurement data would be rejected
Table 6: Remote sensing emission limits for gasoline and LPG in Hong KongEmission standards NO (ppm) CO (%) HC (ppm)
Pre Euro 4,000 5 500
Euro 1 2,000 2 500
Euro 2 1500 2 500
Euro 3 750 2 500
Euro 4 750 2 500
Euro 5 750 2 500
Euro 6 750 2 500
Remote monitoring of emissions from on-road vehicles report.indd 103Remote monitoring of emissions from on-road vehicles report.indd 103 24/06/22 4:47 PM24/06/22 4:47 PM

104
REMOTE MONITORING OF EMISSIONS FROM ON-ROAD VEHICLES: A PRIMER
if the traffic was near to standstill (< 10 km/h). The cutpoints were determined based on a large database of remote sensing and chassis dynamometer tests. The regulation in Hong Kong only applies to gasoline and liquid petroleum gas (LPG) vehicles. Emission limits are set for NO, CO, and HC, in the units of concentration. The limits are given in table below:
Figure 9: Implementation of remote sensing of vehicles in Hong Kong
Source: Remote sensing of on-road vehicle emissions: mechanism, applications and a case study from Hong Kong
Data storage and post-processing
Emission test notice
Vehicle serviced/repaired and tested in 12 working days
HKTET certificate
License retained
Licensecancelled
NO
NO
NO
YES
YES
Determination of high-emitter
Remote monitoring of emissions from on-road vehicles report.indd 104Remote monitoring of emissions from on-road vehicles report.indd 104 24/06/22 4:47 PM24/06/22 4:47 PM

105
Figure 9 shows the Hong Kong remote sensing programme implementation. When both the remote sensing measurements exceeds the prescribed threshold then the vehicle is considered non-compliant. The vehicle non-compliance is intimated to vehicle owner, who will be given 12 days to fix the issues causing high emissions by going to authorized service centres. At the authorized service centres the vehicle is required to pass Hong Kong transient emission test on chassis dynamometer.
2. Remote-sensing programme in ChinaOn July 27, 2017, China’s Ministry of Environmental Protection (MEP) released details of a national regulation for measuring pollutants in exhaust from in-use diesel vehicles using remote-sensing equipment. According to the ICCT review of 2017, China is the first country in the world to implement such a programme at a national level. The regulations replaced all local regulations related to monitoring diesel vehicle emissions with remote sensing. The regulations define a uniform protocol for local authorities to follow if they decide to implement or have already implemented the remote sensing programme in their local jurisdiction. The goal of the regulation is to eliminate the top 5 per cent of high emitting vehicles, and it applies to both light-duty and heavy-duty diesel vehicles.
The regulation sets the limit for PM emissions through diesel vehicles using opacity and Ringelmann blackness parameters. NO limits are also set. However, NO limits are only used to screen high-emitting vehicles. A vehicle is considered non-compliant if it exceeds the limit for the same pollutant in two or more consecutive remote-sensing tests within 6 months. A non-compliant vehicle is subjected to penalty and is required to be repaired. Owners receiving the warning are also given the opportunity to contest the test results. Remote sensing limits imposed by the regulation is given in table below:
China has been using remote sensing since 2005. By the end of 2016, around 70 cities in seven provinces and the two municipalities of Beijing and Tianjin had adopted remote-sensing programme. At present, the Jing-Jin-Ji region of Northern China, comprising 26 cities, has about 160 remote sensing sets installed. An additional 140 sets will be installed in the coming year. This does not include mobile units. There are about 10 devices per city, although Beijing has about 30 of these units.
Table 7: Remote sensing limits for diesel vehicle in ChinaPollutants Limit
Opacity 30%
Ringelmann blackness Level 1 (20%)
NO 1500 ppm
Remote monitoring of emissions from on-road vehicles report.indd 105Remote monitoring of emissions from on-road vehicles report.indd 105 24/06/22 4:47 PM24/06/22 4:47 PM

106
REMOTE MONITORING OF EMISSIONS FROM ON-ROAD VEHICLES: A PRIMER
Figure 10: Typical remote sensing programme works
Source: Etest corporation
Remote monitoring of emissions from on-road vehicles report.indd 106Remote monitoring of emissions from on-road vehicles report.indd 106 24/06/22 4:47 PM24/06/22 4:47 PM

107
Figure 10: Typical remote sensing programme works
Source: Etest corporation
Remote monitoring of emissions from on-road vehicles report.indd 107Remote monitoring of emissions from on-road vehicles report.indd 107 24/06/22 4:47 PM24/06/22 4:47 PM

108
REMOTE MONITORING OF EMISSIONS FROM ON-ROAD VEHICLES: A PRIMER
Vehicles that fail remote-sensing testing are either required to be sent for regular inspection testing to verify non-compliance or are directly sent for repair until they pass the inspection testing. These can work even on congested roads. Information available from China shows that these can work effectively with a traffic speed of around 25-30km/hour.
In Chinese cities, the data scatter is between 10km/hour to 50 km/hour. It is expected to work with a peak hour speed of 15-20 km/hour. On an average, RSD is expected to cost about Rs 2.5 crore. In China, total 2671 RSD are deployed by the end of year 2019 and additional 960 devices are also planned.
A high-emitting vehicle typically refers to a vehicle that is banned for entry in the city for setting low-emission zone by the local government. In Beijing, 10 percent of high emitters contributed 50 percent of vehicle emissions. Therefore, the RSD programme is compulsory and set a goal to eliminate the top 5 per cent of emitters in the fleet in China33.
In 2021, Beijing legislated “the Regulations on Pollution Prevention and Control from Motor Vehicles and Non-Road Mobile Machinery”. Beijing has also set local standards for high emissions petrol vehicle through remote sensing. China has also started remote sensing monitoring of heavy duty vehicles (HDV) and developed local standards for HDV.
3. Remote sensing programme in USARemote sensing has been used in the United States for about 30 years. Although it was initially limited to research and fleet-emission monitoring, some states like Indiana, Massachusetts, Texas, and Virginia have introduced programs that seek to detect the worst-emitting vehicles and request their repair.
In markets where avoiding a station-based emissions inspection offers motorists real convenience and time-savings, on-road low emitter certification program can be a great way to introduce remote sensing into a periodic emissions inspection program. It encourages proper maintenance and will be popular with the public. A low emitter certification program (known popularly in the United States as “Clean Screening”) operates as a fee-based on-road inspection service, which can:
• Fund all remote sensing data collection and clean screen activities.• Simultaneously identify on-road high emitters and enforce emissions standards
and programmes.
Remote monitoring of emissions from on-road vehicles report.indd 108Remote monitoring of emissions from on-road vehicles report.indd 108 24/06/22 4:47 PM24/06/22 4:47 PM

109
• Provide millions of on-road emissions measurements for other activity and emissions monitoring applications, all at no cost to the governing agency.
Other funding mechanisms such as portions of inspection fees, low emissions zone (LEZ) charges or high-emitter penalties can be used where clean screening is not a viable approach. In markets that are suffering from very high levels of vehicular pollution effective enforcement is necessary.
Regardless of how remote sensing is introduced, because any screening application will generate very large quantities of data, the program most focus as much on managing and automating data processing and management as the on-road data collection activities. The best approach is to develop a comprehensive cloud-based Data Management System (DMS), securely accessed by contractor and clients that can support all intended applications as shown in Figure 56 below.
1. All on-road sites for enforcement and monitoring applications are recorded and managed within the DMS.
2. All RSD data collected at those sites are remotely uploaded to the DMS.
3. Optical Character Recognition (OCR) software automatically transcribes license plates.
4. License plates are merged with vehicle information from the vehicle registry. This is not a trivial process and requires a great deal of upfront IT work to automate and function seamlessly.
5. Post-collection quality review algorithms are applied to the RSD data automatically. Vehicle Specific Power (VSP) are other parameters that can be automatically calculated based on the retrieved vehicle information.
6. Automated DMS scanners continuously screen high-emitters (HE), low-emitters (LE), gross liquid leakers (GLL), and smoky vehicles (SV) based on approved qualifying rules.
7. Screened candidates can be made available to the governing authorities for review and approval prior to issuing notices.
8. Vehicle owner information (e.g. name and physical or email-address) is provided by the registry for the candidates being notified.
Remote monitoring of emissions from on-road vehicles report.indd 109Remote monitoring of emissions from on-road vehicles report.indd 109 24/06/22 4:47 PM24/06/22 4:47 PM

110
REMOTE MONITORING OF EMISSIONS FROM ON-ROAD VEHICLES: A PRIMER
9. Notices are sent to all HEs, LEs, GLLs, and SVs as directed by the governing agency.
10. Low emitters (i.e., clean screen candidates) can pay for their test and complete their I&C requirement online, via phone or mail.
11. The outcomes of all LE, HE, GLL and SV cases can be managed using DMS software customized for the governing agency.
12. Numerous other analyses can be performed with the on-road RSD data amassed during the screening program. Some can be automated; others conducted by manually mining the database.
A complete on-road emissions screening program providing all three principal applications; Clean Screening, High Emitter Identification and Fleet Characterization is commonly referred to as a “Total Screen Program”.
Cities like New York are now expanding remote sensing monitoring to address the problem of the growing discrepancies between the number of pollutants detected in vehicle exhaust during certification tests and the amount that the vehicle emits in “real-world” operation—on-road, in normal driving. Real-world emissions data will also give a better understanding about reasons for high emissions from on-road. The Real Urban Emissions (TRUE) initiative presented real-world emission and remote sensing data and analyzed for strategic decision making and support clean air action plan and vehicle emission control policies.
Roadside Emission Monitoring System Network is also included in California’s new HDV I/M programme. They are deploying real-time emission monitoring network throughout the state using RSD, and this network will screen for high emitting vehicles for I/M compliance. Automated License Plate Recognition (ALPR) camera captures license plate numbers and vehicle information. It is also used for cross-check with HD I/M database to identify vehicles operating in California without a valid compliance certificate.
4. Remote-sensing programme in EuropeTRUE Initiatives on RSD techniques has catalysed several programmes in Europe. In Europe, the remote sensing campaigns have been conducted in France, Spain, Sweden, Germany, Switzerland, and the United Kingdom. These have generated valuable data and shown the potential of the application in designing pollution control programmes and implementing low emissions zones.
Remote monitoring of emissions from on-road vehicles report.indd 110Remote monitoring of emissions from on-road vehicles report.indd 110 24/06/22 4:47 PM24/06/22 4:47 PM

111
In Brussels, the TRUE Initiative has presented particle numbers (PNs) from diesel vehicles combined with RSD technique to develop screening for high-emitting vehicles. Data collected was also evaluated to check the frequency of diesel particulate filters (DPF) tampering and malfunction. This has shown that the high emitters can have significant impacts on reducing emissions and improving air quality.
Belgian government has agreed to implement vehicle inspection using RSD technique for Euro 5b, and later diesel cars and vans by July 2022. Based on the result, they will set the PNs standard. If vehicle exceeds greater than 1 million particle/cm3, then vehicle owner will receive a red card for testing and may need to replace. If the vehicle PNs range between 0.25 million to 1 million particle/cm3, the vehicle owner will receive warning message. Germany also proposes similar regulation from January 2023 onwards. In Poland, RSD campaign has been initiated in Krakow for passenger vehicles. It found more NOX exceedance in new diesel-powered vehicle as compared than in gasoline vehicles. Also oldest vehicles contribute excessively to air pollution levels due to more lenient mass emission norms. Mardid has initiated pilot study in early 2021, for screening of high-emitting vehicles.5
Figure 11: Remote sensing studies in Europe by TRUE initiative
Source: The Real Urban Emissions (TRUE) Initiative
London 2017–2018TRUE Europe
remote sensing studies
Brussels 2020
Warsaw 2020
TRUE seeks to supply cities with data regarding the real-world emissions of their vehicle fleets and equip them with technical information that can be used for strategic decision making.
Paris 2018
Remote monitoring of emissions from on-road vehicles report.indd 111Remote monitoring of emissions from on-road vehicles report.indd 111 24/06/22 4:47 PM24/06/22 4:47 PM

112
REMOTE MONITORING OF EMISSIONS FROM ON-ROAD VEHICLES: A PRIMER
RSD also allows vehicle identification that is compliant with LEZ standards. This may also be designed for sending notices to owners of high-emitting vehicles.6
5. Remote-sensing programme in Mexico City Recent testing campaigns have helped to evaluate the effectiveness of the existing high emitting vehicles detection program. Otherwise, the older programme relied on visual observation of high emissions. But high emitting vehicles often do not have visible emissions, and thus the program has a limited capability. Recently, remote sensing measurements have been used to evaluate the system and guide the development of programs to complement the existing vehicle emission inspection programme. Additionally, differences in average emissions between regions with different inspection and maintenance regulation are used to identify which strategies are most effective.7
6. Remote-sensing programme in IndonesiaThe TRUE-Asia has introduced real-world emission in Jakarta, Indonesia. The Government of Jakarta has proposed study on exhaust emission measurement on in-use vehicle using RSD technique for diesel vehicles. In Jakarta, The RSD programme intends to measure the emissions of 100,000 vehicles. This data will be used to identify high-emitting vehicles and to evaluate vehicle emission regulations and set more stringent emission standards.
Remote monitoring of emissions from on-road vehicles report.indd 112Remote monitoring of emissions from on-road vehicles report.indd 112 24/06/22 4:47 PM24/06/22 4:47 PM

113
SECTION 4: Way forward: Need guidance framework for implementation of RSD
This review had made it clear that given the inherent weaknesses of the PUC programme (plagued by very low level of compliance, inadequate calibration of equipment, lack of audit of PUC centres, improper tests, and vulnerability to fraud)—there is virtually no alternative effective mechanism for robust surveillance of on-road vehicles. This poses serious risks as all emissions control equipment are designed for certain efficiency and durability for the life span of the vehicles. If vehicles are not watched carefully for good maintenance practices, quality of manufacturing and emissions cheating, the polluted cities of India can be in serious trouble. Remote sensing can certainly help with large-scale screening, surveillance and compliance.
Consistent with the global trend, application of remote sensing needs to gather momentum in India along with appropriate regulatory framework. It is therefore necessary to pay attention to the following aspects of the RSD programme design and implementation.
1. RSD programme needs to be designed to meet a diverse set of objectives(a) Identify high emitting vehicles that are the super emitter through “dirty
screening” and to pull them over for proper checks and repair. This ‘dirty screening’ identifies vehicles that are not in compliance and need to be sent for proper inspection.
(b) Identify low emitting vehicles through the “clean screening” so that they do not have to unnecessarily go for physical emission inspection tests. This reduces the cost of inspection testing and improves public acceptance of the programme.
(c) Improve detection of tampering with emission control systems in vehicles: Individual vehicles may have non-functional emissions control systems, either due to malfunction or tampering. RSD application can detect and discourage tampering and identify malfunctioning vehicles for repair.
Remote monitoring of emissions from on-road vehicles report.indd 113Remote monitoring of emissions from on-road vehicles report.indd 113 24/06/22 4:47 PM24/06/22 4:47 PM

114
REMOTE MONITORING OF EMISSIONS FROM ON-ROAD VEHICLES: A PRIMER
(d) Characterize the emission factors of the on-road fleet to evaluate the established inspection and maintenance programme and to provide feedback on the technology’s performance. This can help to assess vehicle deterioration over several years and help to develop deterioration factors for policy implementation.
(e) Address real world emissions performance. Evidences from different geographies have proven that tighter emissions regulations do not necessarily translate into lower emissions from in-use vehicles. Lax regulatory regime can also be exploited by vehicle manufacturers as was noted in the diesel gate scandal. These challenges have also created the need for extra vigilance and need for alternative emissions measurement methods including remote sensing device.
(f) Public awareness to build support for developing new policy based on real-world emissions data. Cities can build public support and encourage low emissions zones and scrappage policy. This can help vehicle owners to better understand the need for policies to remove polluting vehicles from road.
2. Strengthen the technical regulations on remote sensing and amend the CMVR to create a mandate for its implementation Ministry of Road Transport and Highways (MoRTH) is framing the AIS 170 technical regulations for RSD implementation. While this needs to be further strengthened, it is also necessary to amend the CMVR to give a mandate and define the rules for its implementation and enforcement. The rules need to define the scope of its implementation.
Simultaneously, MORTH needs to address the current gaps in AIS 170 document to make the guidance more robust. It may be noted that in the 60th Meeting of Standing Committee on Implementation of Emission Legislation (SCOE) held on 22nd August 2019 and an AIS panel was constituted to finalize technical guidance on remote sensing equipment, remote sensing data reporting which specifies design, construction, networking, and data sharing of a motor vehicle and recommend polluter thresholds for different vehicle and different fuel types. Subsequently, in the 61st Meeting of SCOE held on 13th February 2020, it was directed to consider polluter thresholds based on prevalent emission norms, and in the absence of authentic data for these thresholds, the Committee had agreed to consider the first year as monitoring phase to arrive at threshold values. This may be taken forward.
Remote monitoring of emissions from on-road vehicles report.indd 114Remote monitoring of emissions from on-road vehicles report.indd 114 24/06/22 4:47 PM24/06/22 4:47 PM

115
The AIS 170 are being framed to provide technical guidance on remote sensing equipment, remote sensing data reporting and analytics, design, construction, networking, and data sharing of motor vehicle and to recommend polluter thresholds for different vehicle and different fuel types. As observed earlier, the AIS 170 defines the RSD equipment device specifications such as equipment range and accuracy for emission pollutants. The specifications define device’s emission measurement capabilities to be followed while implementing RSD programs. AIS 170 document should comprehensively address all the regulatory issues for implementation.
As ICCT has further recommended with respect to AIS 170, it is crucial that the draft makes it mandatory to measure CO2 absorption. RS does not measure tailpipe concentration directly. It is recalculated from the pollutant/CO2 absorptions ratio (and only done correctly for stochiometric engines, therefore not for diesels). Without CO2 absorption, pollutant absorptions alone are hardly useful. ICCT also recommends making NO measurement mandatory, as well as primary NO2. Modern diesel can emit up to 50 per cent of NOx as NO2. There can be a risk that RS with NO, but without NO2, will underestimate real-world NOx emissions of diesel vehicles.
While this is work in progress, quicker efforts are needed to address the gaps. For instance, elaborate the procedure for site selection for remote sensing; define the scope and nature of data analysis needed; classify different remote sensing technologies that are available in the market and what technologies will be best suited for India; give details on how emissions cut points are to be derived above which a vehicle is considered high emitter; provide clear guidelines on how PUC and remote sensing can co-exists and if the vehicle needs to pass both to remain road worthy; what regulatory action is needed in case a vehicle is identified as high emitter; and provide details on how the computer system at monitoring site should communicate with VAHAN database. Also provide guidance on technology requirements from NIC (National Informatics Centre) to be followed if some entity wants to access VAHAN data for implementing remote sensing program. All these limitations in the current AIS 170 need to be addressed for finalisation.
3. Develop national guidance framework for implementation of the RSD programme in states National level enforcement framework needs to be defined under the Central Motor Vehicles Act and Rules to enable implementation of RSD programme across the country. Ministry of Road Transport and Highways needs to amend the Motor vehicle Rules to incorporate the provision of remote sensing monitoring for
Remote monitoring of emissions from on-road vehicles report.indd 115Remote monitoring of emissions from on-road vehicles report.indd 115 24/06/22 4:47 PM24/06/22 4:47 PM

116
REMOTE MONITORING OF EMISSIONS FROM ON-ROAD VEHICLES: A PRIMER
enforcement and to provide legal back up to its implementation and enforcement in cities.
RSD programme requires a national guidance framework to guide cities on its implementation and detail out the full scope of implementation including technology and site selection, system design, data analytics, enforcement strategies, fleet screening, technology feedback system, management of old vehicles, enabling low emissions zones among others.
This also requires a clear legal framework for technology adoption and prevent legal dispute between vehicle owners with valid PUC certificate and authorities who have identified their vehicles as high emitter through remote sensing device. MoRTH needs to issue a notification under CMVR to make this programme enforceable and not keep it discretionary.
4. Support roll out of lighthouse projects on RSD in selected citiesAs this is a very new area of intervention and cities do not have experience, it is necessary to support the first set of programmes in selected cities including those that have already taken steps in this direction including Delhi and Kolkata to implement the RSD programme. These can be the lighthouse projects to demonstrate the pathways and systems for implementation and enforcement in Indian cities. This will also help to build local market for RSD technologies in India. This is needed to build confidence and capacity of the implementing agencies in cities. State governments with support from the central government can plan the time bound phase in and designing of the programme.
5. Provide technical knowledge support to implementation of RSD programme and build awarenessCities that will design and implement new programmes as part of their clean air action plans and those who have established programme like Kolkata need technical support and capacity building. Vehicle testing agencies and the appropriate technical bodies need to provide technical knowledge support to the state governments related to instrumentation, data analytics, network and system design, adoption of gross polluter threshold, clean and dirty screening approaches, among others. Such application can open up several opportunities for regulatory interventions for pollution control. These include enforcement of low emissions zones.
Remote monitoring of emissions from on-road vehicles report.indd 116Remote monitoring of emissions from on-road vehicles report.indd 116 24/06/22 4:47 PM24/06/22 4:47 PM
117
Bibliography
Baldino, C., Tietge, U., Muncrief, R., Bernard, Y., & Mock, P. 2017 – White paper: Road Tested: Comparative overview of real world versus type-approval NOx and CO2 emissions from diesel cars in Europe: The International Council on Clean Transportation.
Bernard Y, Tietge U, German J, Muncrief R, 2017 - Determination of real-world emissions from passenger vehicles using remote sensing data: True The real emission initiative
Bernard, German, Kentroti and Muncrief, 2019 – White paper: Catching defeat devices: how systematic vehicle testing can determine the presence of suspicious emission control strategies: The International Council on Clean Transportation.
Bernard, German, Muncrief 2019 - White paper - Worldwide use of remote sensing to measure motor vehicle emissions. The International Council on Clean Transportation.
Bishop, Burgard, Dalton, Stedman 2006 - In-use Emission Measurements of Snowmobiles and Snowcoaches in Yellowstone National Park, Final Report.
Borken and Dallmann 2018 - White paper – Remote sensing of motor vehicle exhaust emissions. The International Council on Clean Transportation
Borken-Kleefeld, J., Franco, V., & Chen, Y. (2015). Weitere Auswertungen Der Remote Sensing Messungen Des AWEL Zürich. Final Report for AWEL Zurich. Vienna.
Borken-Kleefeld, Chen Y. 2014 - New emission deterioration rates for gasoline cars e Results from long-term measurements. http://dx.doi.org/10.1016/j.atmosenv.2014.11.013 1352-2310/
Brett C. Singer and Robert A. Harley 1996 - A Fuel-Based motor vehicle emission inventory. Journal of the Air & Waste Management Association Volume 46 June 1996
Remote monitoring of emissions from on-road vehicles report.indd 117Remote monitoring of emissions from on-road vehicles report.indd 117 24/06/22 4:47 PM24/06/22 4:47 PM

118
REMOTE MONITORING OF EMISSIONS FROM ON-ROAD VEHICLES: A PRIMER
Burgard, Daniel A., Gary A. Bishop, Donald H. Stedman, Viktoria H. Gessner, and Christian Daeschlein. (2006). Remote Sensing of In-Use Heavy-Duty Diesel Trucks. Environmental Science & Technology 40 (22): 6938–42. doi:10.1021/es060989a
Carslaw, D.C., Beevers, S.D., Tate, J.E., Westmoreland, E.J., & Williams, M.L. (2011). Recent Evidence Concerning Higher NOx Emissions from Passenger Cars and Light Duty Vehicles. Atmospheric Environment 45 (39): 7053–63. doi:10.1016/j.atmosenv.2011.09.063.
Carslaw, D.C., & Rhys-Tyler, G. (2013). New Insights from Comprehensive On-Road Measurements of NOx, NO2 and NH3 from Vehicle Emission Remote Sensing in London, UK. Atmospheric Environment 81 (December): 339–47. doi:10.1016/j.atmosenv.2013.09.026.
Chen, Y., & Borken-Kleefeld, J. (2014). Real-Driving Emissions from Cars and Light Commercial Vehicles – Results from 13 Years Remote Sensing at Zurich/CH. Atmospheric Environment 88 (May): 157–64. doi:10.1016/j.atmosenv.2014.01.040.
DeFries, T. (2016). Evaluation of EDAR for Measurement of Simulated Exhaust Emissions
Degraeuwe & Weiss, 2017 - Does the New European Driving Cycle (NEDC) really fail to capture the NOX emissions of diesel cars in Europe? Environmental Pollution, 222, 234–241. doi:10.1016/j.envpol.2016.12.050
Donald H. Stedman and Gary A. Bishop - On-Road Emissions in Asia Measured by Remote Sensing.Eder, Kemmer, Lückert, & Sass, 2016 - OM 654- Launch of a new engine family by Mercedes-Benz. MTZ Worldwide, 77, 60–67. doi:10.1007/s38313-015-0097-4.
Francisco Posada and John German – 2016 – Review of LDV OBD requirements under the European, Korean and Californian emission programs. ICCT white paper
German, J. (2016a). “The emissions test defeat device problem in Europe is not about VW.”: The International Council on Clean Transportation.
Remote monitoring of emissions from on-road vehicles report.indd 118Remote monitoring of emissions from on-road vehicles report.indd 118 24/06/22 4:47 PM24/06/22 4:47 PM

119
German, J. (2016b). “Opel’s admissions of defeat device calibrations”.: The International Council on Clean Transportation.
Gruening, Bonnel, Clairotte, Giechaskiel, Valverde, Zardini, Carriero 2019 - Potential of Remote Sensing Devices (RSDs) to screen vehicle emissions; JRC Technical Report
Huanga et. al. 2018. - Remote sensing of on-road vehicle emissions: Mechanism, applications and a case study from Hong Kong. Journal Atmospheric Environment Volume 182, June 2018, Pages 58-74
ICAT 2018 - New Delhi real world emission study using remote sensing technology.
Kadjik, van Mensch, & Spreen, 2015 - Detailed investigations and real-world emission performance of Euro 6 diesel passenger cars.
Kleinebrahm, M. et al. (2008) - On-Board Measurements of EURO IV / V Trucks, Final Report, a research project of the Federal Environmental Agency (FKZ: 204 45 144). Germany: TUV NORD Mobilität.
Knirsch, Weiss, Möhn, & Pamio, 2014 - New generation of the Audi V6 TDI Engine, Part 2: thermodynamics, application, and exhaust cleaning. MTZ Worldwide, 75, 22–27
Kühlwein, J. (2016). Official vs. real-world road-load parameters in EU vehicle efficiency testing.
Lowell, D., & Kamakaté, F. (2012). White Paper No. 18: Urban off-cycle NOX emissions from Euro IV/V trucks and buses. Washington, DC: The International Council on Clean Transportation.
Peter J. Popp & Donald H. Stedman 1997 - Remote Sensing of Commercial Aircraft Emissions. Department of Chemistry and Biochemistry, University of Denver
Popp, Bishop, and Stedman 1999 - Remote Sensing of Railroad Locomotive Emissions: A Feasibility Study, Department of Chemistry and Biochemistry University of Denver.
Remote monitoring of emissions from on-road vehicles report.indd 119Remote monitoring of emissions from on-road vehicles report.indd 119 24/06/22 4:47 PM24/06/22 4:47 PM

120
REMOTE MONITORING OF EMISSIONS FROM ON-ROAD VEHICLES: A PRIMER
Ropkins, K. (2017). Some Observations Based on Complementary International Evaluations of Edar Vehicle Emissions Remote Sensing Technology Sensing. Presented at the 7th International PEMS Conference, Riverside, CA, March 31.
Ropkins et. al 2017 - Evaluation of EDAR vehicle emissions remote sensing technology: Journal - Science of the Total Environment, http://dx.doi.org/10.1016/j.scitotenv.2017.07.137 0048-9697
Sjödin, Å., Borken-Kleefeld, J., Carslaw, D., Tate, J., Alt, G.-M., De la Fuente, J., Bernard, Y., Tietge, U., McClintock, P., Gentala, R., Vescio, N., Hausberger, S. (2018) Real-driving emissions from diesel passenger cars measured by remote sensing and as compared with PEMS and chassis dynamometer measurements. CONOX Task 1 report IVL Report No. C 294.
Sjödin1, et. al. 2018 - Real driving emissions from diesel passenger cars measured by remote sensing and as compared with PEMS and chassis dynamometer measurements CONOX Task 2 report IVL Report
Tietge, U., Mock, P., German, J., Bandivadekar, A., & Ligterink, N. 2017 - From laboratory to road: A 2017 update of official and ‘real-world’ fuel consumption and CO2 values for passenger cars in Europe. The ICCT: Washington, DC
Yang L., Bernard Y., and Dallmann T. 2019 - Technical considerations for choosing a metric for vehicle remote-sensing regulations. The ICCT briefing
VTT Technical Research Center of Finland (2009). Heavy-Duty Vehicles: Safety, Environmental Impacts and New Technology “RASTU”, Summary Report 2006-2008 (VTT-R-04084-09). Espoo, Finland: VTT
Woopen H. 2018 - Remote Sensing: Measuring Emissions From Cars As They Drive By. Presentation from 21st Eco Innovation Forum Sofia | 06 February 2018Yang, Franco, Campestrini, German, & Mock, 2015 - NOX control technologies for Euro 6 diesel passenger cars.
Y. Huang, B. Organ, J.L. Zhou, N.C. Surawski, Y.S. Yam, E.F.C. Chan - Characterisation of diesel vehicle emissions and determination of remote sensing cut points for diesel high-emitters. Environmental Pollution 2019; 252: 31-38. DOI: https://doi.org/10.1016/j.envpol.2019.04.130
Remote monitoring of emissions from on-road vehicles report.indd 120Remote monitoring of emissions from on-road vehicles report.indd 120 24/06/22 4:47 PM24/06/22 4:47 PM

121
ICCT White Paper—Road tested: Comparative overview of real-world versus type-approval NOx and CO2 emissions from diesel cars in Europe
BSVI Notification, G.S.R. 889(E). 16th September, 2016
[https://www.downtoearth.org.in/blog/air/remote-sensing-smart-policing-of-emissions-on-road-60539]
Presentation by Secretary Transport Department, West Bengal, “Case study-“Remote Sensing Device for Monitoring Vehicular Pollution in Kolkata, India; https://www.cseindia.org/the-road-to-cleaner-emissions-10910)
https://diario.madrid.es/blog/notas-de-prensa/madrid-ensaya-con-la-primera-telecabina-medidora-de-emisiones-contaminantes-de-trafico/
https://www.esmartcity.es/2021/06/10/proyecto-piloto-medicion-tiempo-real-emisiones-contaminantes-trafico-madrid.
https://www.gob.mx/cms/uploads/attachment/file/555001/8.0_Informe_GENERAL_CAMe-sensor_remoto_contaminometro-FINAL..pdf
Remote monitoring of emissions from on-road vehicles report.indd 121Remote monitoring of emissions from on-road vehicles report.indd 121 24/06/22 4:47 PM24/06/22 4:47 PM

122
REMOTE MONITORING OF EMISSIONS FROM ON-ROAD VEHICLES: A PRIMER
Annexure 1Understanding AIS 170
City implementation strategy needs to pay attention to a range of parameters MORTH developed a technical guidance on implementing on-road remote sensing measurement in India. The implementation of on-road vehicle emissions monitoring was discussed with AIS panel and developed draft a technical requirement for remote sensing in India. Further, this draft is formed as AIS-170 documents which is focused on technical guidance on remote sensing equipment, remote sensing data reporting which specifies design, construction, networking, and data sharing of motor vehicle and recommend polluter thresholds for different vehicle and different fuel types.
Some of the salient key elements of AIS-170 is given below:
a) Understanding technical specifications of RSD instrument:
I. RSD components include emission analyzer, weather sensors, data storage and networking system, real-time evaluation, associated hardware and software.
II. RSD should be able to measure at least CO, HC, NO, smoke opacity, and other optional parameters. The range, resolution and error of these pollutants need to be specified (as illustrated in table).
III. RSD system should be able to provide ambient weather and site condition parameter. RSD must be GPS/IRNSS enabled to be able to identify the location of device and communication with the authorized servers for transmitting real-time data.
IV. The sampling rate of RSD device should be specified – for instance, greater than 1Hz. The system must capture the image of registration plate number by Optical Character Recognition (OCR) and FASTag reader linked to the central database. The parameters such as site, test-date and time, RSD-S.No., GPS location, emission reading, emission norms, threshold value, vehicle registration number, and vehicle FASTag ID should be linked with each vehicle record sequence number.
Remote monitoring of emissions from on-road vehicles report.indd 122Remote monitoring of emissions from on-road vehicles report.indd 122 24/06/22 4:47 PM24/06/22 4:47 PM

123
V. The power supply for RSD setup should have independent power backup within one-hour for stationary site and four hours for mobile RSD units. Battery should be compatible with 230V, 50 Hz single phase AC supply and battery should be supplied limited power with manufacturer’s specifications.
VI. The RSD should be able to capture all values of all categories of vehicles, irrespective of placement of the vehicle exhaust pipe i.e. front and rear, sides- either / both left or right, without any adjustment in the device fixture/frame.
VII. The system should be complete by data, photo-video data, backup data, router, network printer, mobile workstation, software support firewall, software linked with central database (e.g VAHAN/or any authorized server). Warning display of high emitter through on-road, SMS, email is needed.
VIII. Data storage capacity need to be at least 5,00,000 records.
IX. RSD should be compatible and portable.
X. The RSD system should be calibrated automatically within frequency of monthly interval and ensure the accuracy to be ± 95 % or at frequency. Manufacturer’s calibration certificate need to be provided with RSD.
XI. Auto-zero, internal adjustment, self-checking, malfunction errors facilities should be provided by RSD’s manufacturer.
XII. The device must be able to work in dusty environment that are typically encountered by the vehicles. IP rating (IS/IEC 60529: 2001) is used for specifying the environmental protection characteristics of the device.
XIII. The equipment should be stable under vibrations from operating conditions.
XIV. Needs tamper proofing to prevent unauthorized use.
XV. Significant faults (mechanical shocks, power interruptions), need to be addressed
Remote monitoring of emissions from on-road vehicles report.indd 123Remote monitoring of emissions from on-road vehicles report.indd 123 24/06/22 4:47 PM24/06/22 4:47 PM

124
REMOTE MONITORING OF EMISSIONS FROM ON-ROAD VEHICLES: A PRIMER
XVI. Address stability with time or drift
XVII. Repeatability should be required after 20 consecutive measurements.
XVIII. Dry heat test, Damp heat, Steady state test, power supply variation test should be provided.
XIX. Warm up-time should be less 10 min.
XX. Warranty and Maintenance of RSD instrument: minimum 2 years form date of purchased.
XXI. The RSD instruments need to provide Manufacturer’s trademark, year, model no. voltage, frequency, and power required RSD unit ID and serial No. by RSD’s manufacturer.
Mandatory and optional pollutants measuring from RSDParameter Range Min. Resolution Max. Absolute
intrinsic error*
Max. Relative
intrinsic error*
Mandatory pollutants
HC 0-12000 ppm vol ± 1 ppm vol ± 12 ppm vol ± 5%
CO# 0-13% vol 0.01% vol ± 0.06 vol ± 5%
Opacity$ 0-100% 0.1% ± 2% ± 5%
Optional pollutants
NO 0-6000 ppm ± 10 ppm ± 10 ppm ± 5%
NH3 0-4000 ppm ± 8 ppm ± 8 ppm ± 5%
CO2 0-999000 ppm ± 50 ppm ± 50 ppm ± 5%
SO2 0-6000 ppm ± 12 ppm ± 12 ppm ± 5%
CH4 0-6000 ppm ± 15 ppm ± 15 ppm ± 5%
NO2 0-6000 ppm ± 15 ppm ± 15 ppm ± 5%
Ambient weather and site condition parameter
Temperature - 5°C to 52°C - ± 0.5°
Relative
Humidity
5-95% - ± 3%
Wind speed 0 –25 m/s - ± 10%
Pressure 70-102.4 kPa - ± 5%
Slop angle -15° to +15° - ± 0.1°
Speed 0 - 120 km/ hr - ± 1%
Acceleration 35 km/h/s - ± 1%
Source: International Centre for Automotive Technology (ICAT 2019)10
Remote monitoring of emissions from on-road vehicles report.indd 124Remote monitoring of emissions from on-road vehicles report.indd 124 24/06/22 4:47 PM24/06/22 4:47 PM

125
b) Guidance on operations and data analysis
I. The key parameters should be recorded in all RSD program for each site. A log sheet can be used as hardcopy with following details such as: description of RSD equipment, name of operator, calibration details, repeatability, any unfavorable meteorological condition.
II. RSD components (speed and acceleration, license plate, and emission analyzer) and their sub-system should be linked with computer.
III. The orientation of camera, emission analyzer, and detector should be prescribed by manufactures.
IV. The trial-warm up and calibration is required as per guidelines of the manufacturer.
V. If the audit fails, the calibration is corrected, and the process is repeated until a successful calibration is achieved.
VI. After the setup is complete, the operator is required to perform periodic audits over the course of the working day cycle to verify and optimize the RSD’s calibration and accuracy.
VII. Emission and other data obtained during testing should be directly on central server (e.g VAHAN) on daily basis.
VIII. A cloud-based data management system should be developed for data storage, processing, review, and analysis.
IX. Physical verification of RSD instrument is required before the operation of RSD.
c) Guidance for Pull-over inspection:
I. Pull-over inspections can be carried out for the purpose of random sampling/ invalid data capturing/ high emitter vehicles.
II. RSD instrument can be also lined with PUC certification test, therefore RSD manufacturer can be supply PUC instrument complying with AIS-137 Part 8, as amended from time to time.
Remote monitoring of emissions from on-road vehicles report.indd 125Remote monitoring of emissions from on-road vehicles report.indd 125 24/06/22 4:47 PM24/06/22 4:47 PM

126
REMOTE MONITORING OF EMISSIONS FROM ON-ROAD VEHICLES: A PRIMER
III. On-road PUC measurements will be taken, and data shall be recorded as per the requirements of AIS-137 Part 8, as amended from time to time.
d) Guidance for Valid/or Invalid data
I. Invalid data information to be provided on daily basis or hourly basis in log sheet.
II. Negative VSP limits will be treated as invalid.
III. Exhaust plume of previous vehicle should not affect with current vehicle measurements.
IV. Other parameters should be invalid if missing/not matching license plate, VSP out of range, Delta CO2 is out of range.
e. Guidance for Threshold limit for high-emitting vehicles
I. During RSD monitoring, we should establish to capture accurate high emitter threshold value.
II. Threshold value can be developed by fuel type, vehicle category, and Emission norms (Bharat Stage).
III. High emitters shall be pulled and on-road PUC test to be carried out.
IV. Data shall be uploaded a centralised server (in conjunction with NIC).
V. RSD database shall be linked with VAHAN for information as required in Annexure -I
VI. Nodal agency to collate data and propose threshold limits.
VII. Necessary changes in the standard may be created based on RSD measurements.
e) Guidance for global tendering for procurement of RSD and its operations and cost:
Remote monitoring of emissions from on-road vehicles report.indd 126Remote monitoring of emissions from on-road vehicles report.indd 126 24/06/22 4:47 PM24/06/22 4:47 PM

127
Remote sensing technology and manufacturers in worldwideType Position Provider Model name Working measurement Pollutants measured
Open Path Cross-road University of
Denver
FEAT Arc lamp light beam
with mirror reflector
CO, HC, CO2, NO, NO2,
NH3, SO2, and opacity
Cross-road Opus RSD 5000, 4600
and older
Arc lamp light beam
with mirror reflector
CO, HC, CO2, NO, NO2,
NH3, SO2, and opacity
Cross-road Environmental
Technology
Consultants
R-series S650 Arc lamp light beam
with mirror reflector
CO, CO2, HC, NO, NO2
Cross-road;
Overhead
Dopler Eco
Technologies
DPL7000 Series Laser light beam with
mirror reflector
CO, CO2, HC, NO, opacity
Overhead HEAT LLC EDAR Laser curtain with strip
reflector
CO, total and speciated
HC, CO2, NO, NO2,
opacity
Overhead Anhui Baolong - Arc lamp light beam
with mirror reflector
CO, CO2, HC, NO, opacity
Extractive Overhead
sampling
University of
California,
Berkeley
CH4. NO, NO2, NH3. PM,
PN size
Overhead
sampling
CARB Portable
Emissions
Acquisition
System
(PEAQS)
Exhaust plume sample Black carbon and NOx
Overhead
sampling in
Shed
University of
Denver
OHMS Exhaust plume sample CO, CO2, HC, NO, NO2,
N2O, PM, PN, Black
Carbon
Roadside
sampling
Czech Technical
University
- Exhaust plume sample CO, CO2, NOX, PM, PN
Roadside
sampling
University of
Münster
Exhaust plume sample NOx, CO2, PN
Plume chaser University of
Heidelberg
ICAD Exhaust plume sample NO, NO2, CO2
Plume chaser University of
Birmingham
SNIFFER Exhaust plume sample NO, NO2, CO2
Plume chaser CARB Mobile
Measurement
Platform (MMP)
Exhaust plume sample CO, CO2, HC, NOX, PM,
PN, Black carbon
Source: ICCT (2019)14
Remote monitoring of emissions from on-road vehicles report.indd 127Remote monitoring of emissions from on-road vehicles report.indd 127 24/06/22 4:47 PM24/06/22 4:47 PM
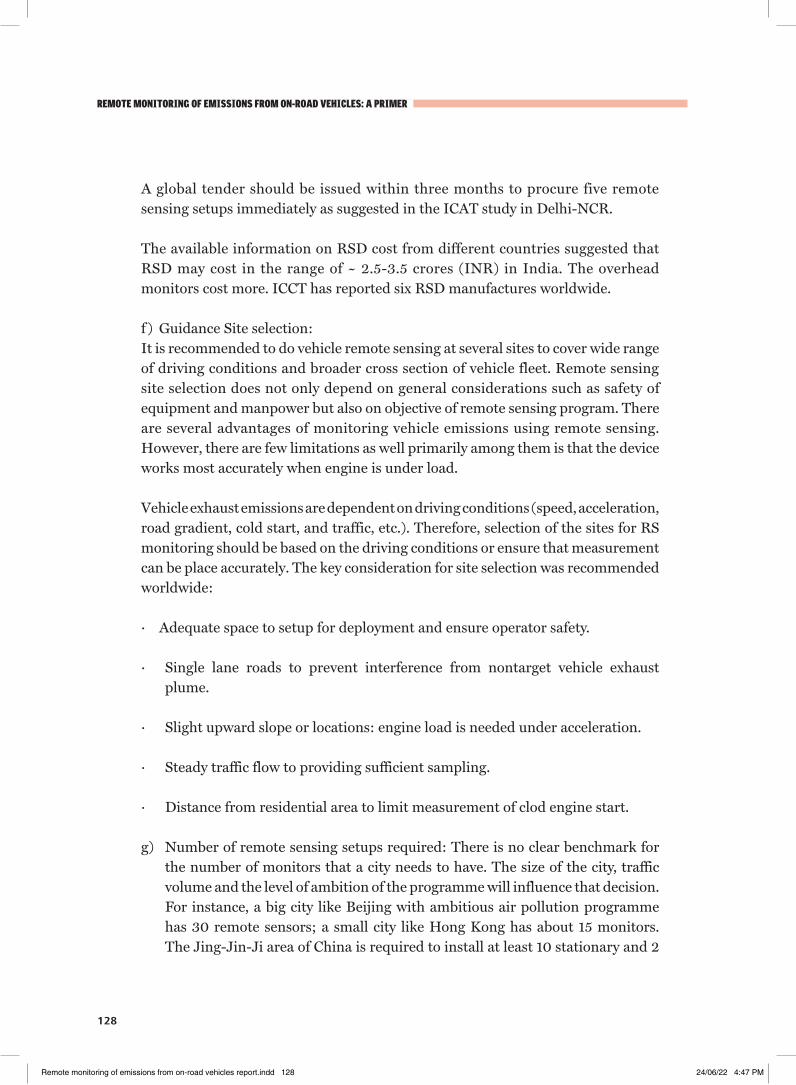
128
REMOTE MONITORING OF EMISSIONS FROM ON-ROAD VEHICLES: A PRIMER
A global tender should be issued within three months to procure five remote sensing setups immediately as suggested in the ICAT study in Delhi-NCR.
The available information on RSD cost from different countries suggested that RSD may cost in the range of ~ 2.5-3.5 crores (INR) in India. The overhead monitors cost more. ICCT has reported six RSD manufactures worldwide.
f ) Guidance Site selection: It is recommended to do vehicle remote sensing at several sites to cover wide range of driving conditions and broader cross section of vehicle fleet. Remote sensing site selection does not only depend on general considerations such as safety of equipment and manpower but also on objective of remote sensing program. There are several advantages of monitoring vehicle emissions using remote sensing. However, there are few limitations as well primarily among them is that the device works most accurately when engine is under load.
Vehicle exhaust emissions are dependent on driving conditions (speed, acceleration, road gradient, cold start, and traffic, etc.). Therefore, selection of the sites for RS monitoring should be based on the driving conditions or ensure that measurement can be place accurately. The key consideration for site selection was recommended worldwide:
· Adequate space to setup for deployment and ensure operator safety.
· Single lane roads to prevent interference from nontarget vehicle exhaust plume.
· Slight upward slope or locations: engine load is needed under acceleration.
· Steady traffic flow to providing sufficient sampling.
· Distance from residential area to limit measurement of clod engine start.
g) Number of remote sensing setups required: There is no clear benchmark for the number of monitors that a city needs to have. The size of the city, traffic volume and the level of ambition of the programme will influence that decision. For instance, a big city like Beijing with ambitious air pollution programme has 30 remote sensors; a small city like Hong Kong has about 15 monitors. The Jing-Jin-Ji area of China is required to install at least 10 stationary and 2
Remote monitoring of emissions from on-road vehicles report.indd 128Remote monitoring of emissions from on-road vehicles report.indd 128 24/06/22 4:47 PM24/06/22 4:47 PM

129
mobile sets of remote sensing equipment. The urban cities of India (-such as Delhi-NCR) may be required ~12-15 setups to adequately cover the entire area.
h) Pull over inspection: On-road pull-over inspections may be carried out for the purpose of random sampling/ invalid data capturing/ high emitter identification etc. The RSD manufacturer should be supplied a PUC instrument complying with AIS-137 Part 8, as modified from time to time. On-road PUC measurements will be taken, and data shall be recorded as per the requirements of AIS-137 Part 8.
Remote monitoring of emissions from on-road vehicles report.indd 129Remote monitoring of emissions from on-road vehicles report.indd 129 24/06/22 4:47 PM24/06/22 4:47 PM

130
REMOTE MONITORING OF EMISSIONS FROM ON-ROAD VEHICLES: A PRIMER
Centre for Science and Environment
41, Tughlakabad Institutional Area, New Delhi 110 062
Phones: 91-11-40616000 Fax: 91-11-29955879
E-mail: [email protected] Website: www.cseindia.org
Remote monitoring of emissions from on-road vehicles report.indd 130Remote monitoring of emissions from on-road vehicles report.indd 130 24/06/22 4:47 PM24/06/22 4:47 PM