Relative influence of natural watershed properties and human disturbance on stream solute...
16
Relative influence of natural watershed properties and human disturbance on stream solute concentrations in the southwestern Brazilian Amazon basin Trent Wade Biggs, 1 Thomas Dunne, 2 Tomas Ferreira Domingues, 3 and Luiz Antonio Martinelli 4 Received 18 September 2000; revised 3 December 2001; accepted 1 February 2002; published 21 August 2002. [1] We use a synoptic sampling of stream water to quantify the effect of soil type, rock type, deforestation extent determined by Landsat TM imagery, and urban population density on stream solute concentrations for 60 different watersheds in the dry season and 49 in the wet season in the southwestern Brazilian Amazon basin. Catchment areas range between 18 and 12,500 km 2 . Soil exchangeable cation content explains most of the variance in stream concentrations of cations, dissolved silicon (Si), and acid neutralizing capacity (ANC) in both forested and deforested basins based on regression analysis (R 2 range 0.61–0.81), though the mechanism underlying the relationship is unknown. We use the relationship between soil exchangeable cation content and stream solute concentrations in forested catchments to estimate the predisturbance and postdisturbance signal concentrations of stream solutes for deforested watersheds. Signal concentrations of potassium (K), sodium (Na), and chloride (Cl) increase with deforestation extent for streams on gneiss, granite, and sedimentary rock in both the dry and wet seasons after the effect of soil type has been statistically removed. Sulfate (SO 4 ) signal concentrations increase with deforestation extent in the dry season only. For catchments >40% deforested but with no urban populations, the ratios of disturbed to predisturbance stream concentrations range from 1.2 to 3.1 (K), 0.8 to 2.2 (Na), 0.7 to 2.7 (SO 4 ), and 2.4 to 14.6 (Cl) in the dry season and 1.2 to 2.2 (K) and 0.6 to 3.4 (Cl) in the wet season. Urban population density strongly affects Cl and SO 4 concentrations in both seasons and Na concentrations in the dry season; the urban signal comprises 40 – 58% of the dry season Cl signal and 83 – 89% of the wet season Cl signal for watersheds with >250 persons per km 2 . Streams on mica-schist, mafic rock and carbonate shale have higher concentrations of Ca, Mg, Si, and ANC than watersheds on gneiss, granite, tertiary sediments or sandstone for a given soil exchangeable cation content in both seasons. Simple mass balance calculations suggest that supplemental cattle salts could comprise a significant fraction of the Na and Cl signals in the wet season but would not significantly impact wet season concentrations of Ca, Mg, or K. INDEX TERMS: 1045 Geochemistry: Low- temperature geochemistry; 1806 Hydrology: Chemistry of fresh water; 1871 Hydrology: Surface water quality; 1886 Hydrology: Weathering (1625); KEYWORDS: stream chemistry, Amazon, deforestation, urbanization, biogeochemistry 1. Introduction [2] Large-scale clearing of tropical rain forests for agri- culture, ranching and timber has intensified globally in the past three decades [Melillo et al., 1996]. In the Brazilian Amazon, the total area deforested increased to over 550,000 km 2 in 1998, at an annual rate of 17,383 km 2 or 0.48% of the remaining forest per year. Deforestation occurs as spatially aggregated regional transformations, with 78% of the deforestation in the Amazon basin occurring in 19% of the Landsat TM satellite images that cover the basin [Instituto Nacional de Pesquisas Espaciais (INPE), 2000]. Despite the implications of these regional land use trans- formations for soil fertility and agricultural production [Fearnside, 1984], stream ecosystems and water quality [Downing et al., 1999], the processes that govern the biogeochemical response of large watersheds to deforesta- tion are poorly understood, and impacts on stream water chemistry have rarely been documented. Cutting and burn- ing of forest vegetation adds cations to surface soil horizons as ash and decomposing biomass and soil organic matter, causing temporary increases in soil exchangeable cations and pH [Nye and Greenland, 1960; Uhl and Jordan, 1984; de Moraes et al., 1996; Ho ¨lscher et al., 1997]. Leaching of this cation pulse from the soil may result in increased stream cation concentrations and fluxes from small tropical water- sheds [Williams and Melack, 1997], though it is unknown whether a stream cation signal is detectable in larger water- sheds of 10–10,000 km 2 . 1 Department of Geography, University of California, Santa Barbara, California, USA. 2 Donald Bren School of Environmental Science and Management and Department of Geological Sciences, University of California, Santa Barbara, California, USA. 3 Department of Biology, University of Utah, Salt Lake City, Utah, USA. 4 Centro de Energia Nuclear na Agricultura, Piracicaba, Brazil. Copyright 2002 by the American Geophysical Union. 0043-1397/02/2001WR000271$09.00 25 - 1 WATER RESOURCES RESEARCH, VOL. 38, NO. 8, 10.1029/2001WR000271, 2002
Transcript of Relative influence of natural watershed properties and human disturbance on stream solute...

Relative influence of natural watershed properties and human
disturbance on stream solute concentrations in the southwestern
Brazilian Amazon basin
Trent Wade Biggs,1 Thomas Dunne,2 Tomas Ferreira Domingues,3
and Luiz Antonio Martinelli4
Received 18 September 2000; revised 3 December 2001; accepted 1 February 2002; published 21 August 2002.
[1] We use a synoptic sampling of stream water to quantify the effect of soil type, rock type,deforestation extent determined by Landsat TM imagery, and urban population densityon stream solute concentrations for 60 different watersheds in the dry season and 49 in thewet season in the southwestern Brazilian Amazon basin. Catchment areas range between18 and 12,500 km2. Soil exchangeable cation content explains most of the variance in streamconcentrations of cations, dissolved silicon (Si), and acid neutralizing capacity (ANC) inboth forested and deforested basins based on regression analysis (R2 range 0.61–0.81),though the mechanism underlying the relationship is unknown. We use the relationshipbetween soil exchangeable cation content and stream solute concentrations in forestedcatchments to estimate the predisturbance and postdisturbance signal concentrations ofstream solutes for deforested watersheds. Signal concentrations of potassium (K), sodium(Na), and chloride (Cl) increase with deforestation extent for streams on gneiss, granite, andsedimentary rock in both the dry and wet seasons after the effect of soil type has beenstatistically removed. Sulfate (SO4) signal concentrations increase with deforestation extentin the dry season only. For catchments >40% deforested but with no urban populations,the ratios of disturbed to predisturbance stream concentrations range from 1.2 to 3.1 (K),0.8 to 2.2 (Na), 0.7 to 2.7 (SO4), and 2.4 to 14.6 (Cl) in the dry season and 1.2 to 2.2 (K) and0.6 to 3.4 (Cl) in the wet season. Urban population density strongly affects Cl and SO4
concentrations in both seasons and Na concentrations in the dry season; the urban signalcomprises 40–58% of the dry season Cl signal and 83–89% of the wet season Cl signal forwatersheds with >250 persons per km2. Streams on mica-schist, mafic rock and carbonateshale have higher concentrations of Ca,Mg, Si, andANC thanwatersheds on gneiss, granite,tertiary sediments or sandstone for a given soil exchangeable cation content in both seasons.Simple mass balance calculations suggest that supplemental cattle salts could comprise asignificant fraction of the Na and Cl signals in the wet season but would not significantlyimpact wet season concentrations of Ca, Mg, or K. INDEX TERMS: 1045 Geochemistry: Low-
temperature geochemistry; 1806 Hydrology: Chemistry of fresh water; 1871 Hydrology: Surface water quality;
1886 Hydrology: Weathering (1625); KEYWORDS: stream chemistry, Amazon, deforestation, urbanization,
biogeochemistry
1. Introduction
[2] Large-scale clearing of tropical rain forests for agri-culture, ranching and timber has intensified globally in thepast three decades [Melillo et al., 1996]. In the BrazilianAmazon, the total area deforested increased to over 550,000km2 in 1998, at an annual rate of 17,383 km2 or 0.48% ofthe remaining forest per year. Deforestation occurs asspatially aggregated regional transformations, with 78% ofthe deforestation in the Amazon basin occurring in 19% of
the Landsat TM satellite images that cover the basin[Instituto Nacional de Pesquisas Espaciais (INPE), 2000].Despite the implications of these regional land use trans-formations for soil fertility and agricultural production[Fearnside, 1984], stream ecosystems and water quality[Downing et al., 1999], the processes that govern thebiogeochemical response of large watersheds to deforesta-tion are poorly understood, and impacts on stream waterchemistry have rarely been documented. Cutting and burn-ing of forest vegetation adds cations to surface soil horizonsas ash and decomposing biomass and soil organic matter,causing temporary increases in soil exchangeable cationsand pH [Nye and Greenland, 1960; Uhl and Jordan, 1984;de Moraes et al., 1996; Holscher et al., 1997]. Leaching ofthis cation pulse from the soil may result in increased streamcation concentrations and fluxes from small tropical water-sheds [Williams and Melack, 1997], though it is unknownwhether a stream cation signal is detectable in larger water-sheds of 10–10,000 km2.
1Department of Geography, University of California, Santa Barbara,California, USA.
2Donald Bren School of Environmental Science and Management andDepartment of Geological Sciences, University of California, SantaBarbara, California, USA.
3Department of Biology, University of Utah, Salt Lake City, Utah, USA.4Centro de Energia Nuclear na Agricultura, Piracicaba, Brazil.
Copyright 2002 by the American Geophysical Union.0043-1397/02/2001WR000271$09.00
25 - 1
WATER RESOURCES RESEARCH, VOL. 38, NO. 8, 10.1029/2001WR000271, 2002

[3] Natural spatial variation in soil type and geologycomplicate the detection and quantification of the impactof deforestation on regional stream chemistry. The chem-ical composition of streams draining watersheds withminimal anthropogenic disturbance varies as a functionof watershed physiography [Thierfelder, 1998], geology[Meybeck, 1987; Dethier, 1986; Billett et al., 1996] andsoil type [Billett and Cresser, 1992]. On the cratons ofthe Amazon basin, variations in topography and rock typecan result in different solute yields under forested con-ditions [Stallard, 1983; Edmond et al., 1995; Freyssinetand Fara, 2000]. Forested catchments in the humidtropics on soils with high base cation saturation exportup to an order of magnitude more cations in stream waterthan those on cation-poor soils [Bruijnzeel, 1991]. Ifdeforestation occurs preferentially on soils with highcation contents, stream solute concentrations may behigher in deforested watersheds than in forested water-sheds due to natural variability and not to the effects ofhuman disturbance. Detection of the effect of deforesta-tion on stream chemistry requires a better understandingof the natural pedologic and geologic controls on predis-turbance conditions and subsequent catchment response todisturbance.[4] Studies of the impact of deforestation on stream
solute composition have focused on vegetation conversionand subsequent succession as the main processes affectingstream solutes [Bormann and Likens, 1979; Vitousek andReiners, 1975; Williams and Melack, 1997]. However,deforestation at a regional scale involves not only replace-ment of forest vegetation with grass and cropland, but alsoestablishment of service centers and urban areas. For theAmazon as a whole, the percent of the population residingin urban areas exceeded 50% in 1980 [Brower and Godfrey,1997], providing potential sources and transport of solutesto receiving streams. While the influence of urban sourceson stream chemistry has been demonstrated in temperate[Novotny and Chesters, 1981; Meybeck, 1998; Prowse,1987] and subtropical zones [Martinelli et al., 1999; Ometoet al., 2000] and has been suggested to be important intropical systems [Downing et al., 1999], it has not beendocumented in tropical rain forest landscapes undergoingrapid, regional land use transformations.[5] The objective of the present study is to determine
the relative influence of soil exchangeable cation content,rock type, deforestation, and urban population density onstream concentrations of base cations, dissolved silicon,chloride and sulfate in both the dry and wet seasons in ahumid tropical region undergoing regional land use trans-formation.
2. Field Area
[6] The Brazilian State of Rondonia lies in the south-western Amazon basin (8�–13�S, 60�–66�W) on the Bra-zilian craton, which has a basement of pre-Cambrian gneiss(Figure 1). Plutons dominated by biotite-amphibole gran-ites, quartz syenites and quartz monzonites intrude into thecraton throughout the state’s center (27% of the sampledcatchments’ area). Tertiary sediments overlie the craton inthe north. In the southeastern part of the state, carbonateshale with interbedded sandstone covers 3.5% of the study
area, and white quartz sandstone with no carbonates cover20% [Companhia de Pesquisa de Recursos Minerais(CPRM ), 1997]. Mica-schist and localized intrusions ofgabbro cover 3.7% and 2.8% of the study area, respectively,also in the southeast. The Tertiary sediments form a dis-sected plain, with elevations between 60 and 160 m. On thecraton, topography is gently undulating (average slopes 2–5%) with occasional rocky hills and small massifs up to600m in elevation [RADAMBRASIL, 1978]. Hillslopesrange between 590–1200 m long [Ballantine, 2001], whichis typical of humid tropical areas with low relief and densevegetation cover [Moglen et al., 1998].[7] Soil types in the state include Oxisols (as described
by Natural Resources Conservation Service (NRCS)[1999]), Latossolo distrofico in the Brazilian Soil Classi-fication System, [Camargo et al., 1987]), Entisols (SolosAluvias Distroficos) and Inceptisols (Cambissolos) in thenorth on the Tertiary sediments. Oxisols, Ultisols (Podzo-lico distrofico) and Alfisols (Solos eutroficos) occur on thecraton, and Entisols (Areias Quartzosas Distroficas) onwhite quartz sands in the southeast (Figure 1) [EmpresaBrasileira de Pesquisa Agropecuaria (EMBRAPA), 1983].[8] Rainfall in the study area averages 1930–2690 mm/yr
with a distinct wet season lasting from October to April, andaverage runoff ranges from 563–926 mm/yr, as measuredby 9 rain and discharge stations maintained by the AgenciaNacional de Energia Eletrica (ANEEL) and CPRM. Thestreams of the state are dilute, with total cations rangingfrom 126 to 243 meq/L for the Jamari and Jiparana rivers[Mortatti et al., 1992], compared to 200–450 meq/L forother streams on siliceous terrain in the Amazon basin andto 422 meq/L for the Amazon main stem at Obidos [Stallard,1983]. Dissolved silicon and bicarbonate comprise between74–80% of total dissolved solids by mass. Calcium andsodium are the dominant cations, ranging between 26 and35% (Ca) and 22 and 39% (Na) of total cations on anequivalent basis [Mortatti et al., 1992].[9] The undisturbed vegetation includes dense tropical
rain forest (Floresta Densa, 17% of Rondonia state area)similar to that found in the central Amazon basin and openmoist tropical forest (Floresta Ombrofila Aberta, 61% ofstate area), which is often dominated by palms and has amore open canopy than dense tropical rain forest [RADAM-BRASIL, 1978]. Savannas are present but limited, coveringup to 5–8% of 3 catchments in the southeast as estimatedfrom Landsat TM imagery (unpublished data).[10] The first modern wave of colonization in Rondonia
began in the early 1970s. Approximately 1 million peoplemigrated to the state and settled along the principal highwayBR-364 between 1970 and 1990 (Figure 1). By 1998,53,275 km2, or 22% of the State’s area had been deforested,representing 9.6% of the deforested area of the AmazonBasin [INPE, 2000]. Land use has been dominated byreplacement of forest with grassland for cattle ranching[Pedlowski et al., 1997]. Up to 50% of the cleared area isin some stage of regrowth [Pedlowski et al., 1997; Rignot etal., 1997], though recent Landsat TM surveys indicate lowrates of pasture abandonment and 18% of cleared areas insecondary succession [Roberts et al., 2002]. Of the 1.2million people living in Rondonia in 1996, 62% resided inurban settlements of between 767 and 238,314 persons[Instituto Brasileiro de Geografıa e Estatisticas (IBGE),
25 - 2 BIGGS ET AL.: NATURAL AND HUMAN CONTROLS STREAM CHEMISTRY

1996]. Fertilizer use is rare [Jones et al., 1995] thoughranchers supply cattle with salts containing Na, Cl, Mg, Ca,S, and P (H. Schmitz, Fundacao Fauna e Flora TropicaisRondonia, personal communication, 1998).
3. Methods
3.1. Stream Samples
[11] Stream water samples were collected at 60 differentsites in the dry season (August 1998) and at 49 differentsites in the wet season (late January–early February 1999,Figures 1 and 2). Each stream was sampled only once alongits course, so each watershed represents an independentsample. The pH and conductivity were measured on the
unfiltered samples using an Orion 250A pH meter and anOrion 115 conductivity meter. The samples were thenfiltered in the field with Gelman GFF 0.7 mm filters, keptat 4�C and then frozen prior to transport from the state foranalysis. Cations were analyzed by flame atomic absorptionspectrometry (Varian model AA6), dissolved silica by thecolorimetric acid-molybdate method, acid-neutralizingcapacity (ANC) by Gran-titration [Stumm and Morgan,1981], and chloride, nitrate and sulfate by ion chromatog-raphy (Dionex model DX500). Eighty-seven percent of dryseason samples and 76% of wet season samples had <10%error in cation-anion balance, and samples in both seasonshad high correlation between total cations and total anions(r2 = 0.98 dry season, 0.94 wet season). A more detailed
Figure 1. State of Rondonia with sample locations, lithology, soil orders and urban areas. Streamnetwork includes sampled area only. The original soils map has been coarsened to emphasize regionalpatterns in soil type.
BIGGS ET AL.: NATURAL AND HUMAN CONTROLS STREAM CHEMISTRY 25 - 3

description of quality assurance analysis is included else-where [Biggs, 2000].
3.2. Watershed Properties
[12] Watershed boundaries were digitized into a geo-graphic information system using 1:100,000 scale topo-graphic maps and the coordinates of collection pointsrecorded in the field with a global positioning system. Landuse was determined from a mosaic of eight Landsat The-matic Mapper (TM) images from 1996 classified usingspectral mixture analysis (SMA) as described by Robertset al. [1998]. Spectral end-members for soil, shade, non-photosynthetic vegetation, and green vegetation wereselected from the image to generate end-member fractionimages. Training areas were then selected to develop adecision classification tree that used end-member fractionvalues to assign pixels to one of five categories: pasture,regenerating forest, mature forest, urban/bare and water.Natural grasslands were classified manually via imageinterpretation. Due to the difficulty of spectrally separatingpasture from regenerating vegetation, the designation‘‘deforested’’ for this study includes both pasture andregenerating vegetation. This definition represents a com-plex mosaic of clearings of different ages and regeneratingforest in various stages of regrowth as recognized by SMAand includes no information about the successional status ofvegetation in the watershed.[13] Soil exchangeable cation contents (S) were calculated
for each watershed from digitized soil maps and soil profileanalyses from the Sigteron project [Cochrane, 1998]. Themethodology used in the Sigteron project delineates soil-terrain units that contain ‘‘a distinctive, often repetitive,pattern of landform, lithology, surface form, slope, parentmaterial, and soil.’’ [Food and Agriculture Organization(FAO), 1993] Each soil-terrain unit is assigned multiple soiltypes and the percentage cover of each soil type within theunit. The soil exchangeable cation content S for a givenwatershed and cation is calculated as a weighted average ofthe soil exchangeable cation contents for each soil type:
S ¼Xw
v¼1
Xm
k¼1
lvkXk
Av
Atot
ð1Þ
where w is the number of terrain units in the watershed, m isthe number of soil types in terrain unit v, lvk is the fractionof terrain unit v covered by soil type k, Xk is the average
kilomoles of exchangeable cation per hectare in the upper1.3 m of soil for soil type k, Av is the area of the catchmentcovered by terrain unit v, and Atot is the total catchment area.Exchangeable cation content for soil type k is calculated as
Xk ¼
Pr
j¼1
Pn
i¼1
arijMijd
nð2Þ
where rij is the bulk density of soil in profile i in-depthinterval j in kg/m3,Mij is the exchangeable cation concentra-tion of soil profile i at depth interval j in kmol/kg, d is thedepth of interval j in meters, a is 10,000 m2/ha, n is thenumber of soil profiles of type k at depth interval j, and r isthe number of depth intervals. Four depth intervals of 0–20 cm, 20–50 cm, 50–80 cm, and 80–130 cm were chosenbased on the most common depth intervals sampled in theSigteron project. The predisturbance soil exchangeablecation content, Sfor, was calculated using soil profiles locatedin forested areas only (2152 of 2932 profiles), which includedreserves, areas with selective logging activity, and extractivereserves. We included forested pits only because we use theexchangeable cation content to estimate predisturbancesolute concentrations. Including profiles in deforested areaswould overpredict predisturbance soil exchangeable cationcontents and also overpredict predisturbance stream soluteconcentrations.[14] Bulk density (rij) was measured for only 413 of the
10680 soil samples, and was calculated for the rest of thesoil profiles from a linear regression on soil texture andorganic carbon. Previous studies find that regression modelperformance improves when models are calibrated fordifferent soil types and horizons [Bernoux et al., 1998].To test the influence of different bulk density regressions onthe calculated Xk and S, regression models of bulk densitywere parameterized both for all samples and in regressionsthat stratified samples by soil depth and soil type. Thecalculated Xk and S differ by <10% among the differentregressions used to predict bulk density, so the bulk densityregression model parameterized using all 413 soil samplesis used to calculate Xk and S.[15] The percent of each watershed covered by each of 24
different lithologies was calculated using a 1:1,000,000geologic map from CPRM [1997]. The 24 different rocktypes were aggregated into groups of pre-Cambrian gneiss,biotite-amphibole granitic intrusions, carbonate shale, are-nitic sandstone with no carbonates, Tertiary sediments,
Figure 2. Discharge hydrograph for the Rio Branco in central Rondonia with a basin area of 1221 km2.Shaded areas show the synoptic sampling periods.
25 - 4 BIGGS ET AL.: NATURAL AND HUMAN CONTROLS STREAM CHEMISTRY

mica-schist, and mafic rocks. These groups were furtheraggregated into acid lithology (gneiss, granite, sandstone,Tertiary sediments) and basic lithology (mica-schist, maficrocks, and carbonate shale).[16] Urban population density was calculated as the
number of persons living in urban areas in the catchmentdivided by watershed area to yield urban population/km2.The urban population included all persons living in areasdesignated as urban by the IBGE in the 1996 census, whichincludes settlements defined as urban by local municipallaw, and in the 1996 census included settlements rangingbetween 24 and 238,314 persons.
3.3. Partitioning Stream Chemistry Into Backgroundand Signal Concentrations
[17] Stream chemistry may be partitioned conceptuallyinto a predisturbance background concentration and a signalconcentration due to human disturbance:
Ct ¼ Cf þ Cd ð3Þ
where Ct is the observed concentration of a solute in thestream, Cf is the predisturbance, forested backgroundconcentration and Cd is the signal concentration of the solutedue to deforestation and urbanization, all in mmol/L. Cf ispredicted from a regression of the soil exchangeable cationcontent (Sfor) versus stream solute concentration for forestedcatchments only, called the background or BKG model:
Cf ¼ bso þ bsSfor þ es ð4Þ
where bso, bs, and es are the intercept, slope and error terms ofthe regression. The Cf includes solutes that originate bothfrom atmospheric deposition and from catchment sources,and the two are not statistically separated in equation (4).Forested catchments include those with <15% of the totalcatchment area deforested by 1996 (n = 14 dry season, n = 12wet season). Where Landsat TM images were available for1998, the deforestation extent was recalculated for theforested watersheds, and watersheds with significant landcover changes were excluded from the BKG regressions.[18] Substituting equation (4) into equation (3), the defor-
estation signal concentration is
Cd ¼ Ct � bso þ bsSfor þ es� �
ð5Þ
The relation between deforestation percent and the streamsignal concentration is quantified by the signal (SIG)regression:
Cd ¼ bdDþ bRSSfor þ ed ð6Þ
where D is the percent of the catchment cleared up to andincluding 1996 as measured by the classified Landsat TMimagery, bd is the deforestation regression slope, bRS is theresidual soil parameter, and ed is the regression error. Weinclude Sfor and bRS in the SIG regression to test theassumption that the regression parameters of equation (4)are constant over the study area.[19] Least squares estimation of the regression param-
eters in equations (4) and (6) assumes that the independ-
ent variable does not have error [Draper and Smith,1998]. The Sfor calculated from equations (1) and (2)has error and violates this assumption. Within a given soiltype, the standard deviations of Xi and Sfor exceed theirmeans for all cations, indicating that a functional relation-ship may be a more robust estimation of the bs [Draperand Smith, 1998]. To test the influence of estimating bsand Cf using a geometric mean functional relationshipversus a least squares linear regression, the predictedbackground concentrations of all solutes were calculatedusing the bs determined with both estimation techniques.Background concentrations (Cf) estimated using a geo-metric mean functional relationship differ from the leastsquares estimates by <2.5 mM for Ca, 1 mM for Mg, 4 mMfor K, 7 mM for Si, and 9 mM for ANC for all soilexchangeable cation contents in the dry season, and by<2 mM for Ca, 7 mM for Mg, 6 mM for K, 34 mM for Si,and 16 mM for ANC in the wet season. These errors inbackground concentration introduced by assuming fixedSfor are small relative to both the errors in the regressionand to the magnitude of the signal concentrations. Theleast squares estimate of bs is used here because it allowsfor estimation of the standard error and confidenceintervals of bs.[20] The residuals of all signal regressions equation (6)
were heteroscedastic, which may result in inaccurateestimates of the standard error and p value of the regres-sion parameters. The standard error and p values of b inequation (6) were estimated using a bootstrap resamplingwith 1000 repetitions, which assumes no particular distri-bution of residuals [Chernick, 1999]. The mean and stand-ard deviation of the 1000 realizations of the regressionparameters were used to test the significance level of theparameters by a t test.[21] The variance explained by soil exchangeable cation
contents includes the variance explained by Sfor in both theBKG regression and SIG regression and is calculated as
R2 soil ¼ 1� SSESIG=TSSraw ð7Þ
where SSESIG is the sum of squared errors of the SIGregression equation (6) with Sfor as the only independentvariable, and TSSraw is the total sum of squares of the rawconcentrations.
4. Results
4.1. Watersheds Properties
[22] The sampled watersheds range from 18 to 12,500km2 and include the major soil and rock types found inRondonia (Figure 1) from forested catchments with highcation contents (Sfor) to heavily deforested catchments oncation-poor soils (Table 1). Watersheds >40% deforestedhave higher Sfor, ECEC, CEC, and pH than forested water-sheds. Because Sfor includes soil profiles under forestedvegetation only, this suggests that deforestation hasoccurred preferentially on soils with higher predisturbancecation contents (Table 1). Eight dry season and six wetseason watersheds have an urban population density >5persons per km2. Deforestation percent (D) correlatesweakly but significantly (p < 0.05) with soil exchangeablecation content (STz), urban population density, and water-
BIGGS ET AL.: NATURAL AND HUMAN CONTROLS STREAM CHEMISTRY 25 - 5

shed area [Biggs, 2000] Note that all watershed propertyand stream chemistry data are available electronically.1
4.2. Watershed Properties and Stream Chemistry:Acid Lithology Only
[23] Stream concentrations of base cations, dissolved Si,and ANC correlate with soil exchangeable cation contentsin streams draining both forested and deforested catchments(Figure 3). Stream Na correlates more strongly with SK thanwith SNa, which may be due to the large number of zerovalues for exchangeable Na in the soil profile analyses,limiting the precision of Na soil measurements. Theserelationships are used to calibrate the BKG model (equation(4)). The intercepts of the linear regressions, bso, are notsignificantly different from zero for any solute in eitherseason but are used to calculate the background (Cf) andsignal (Cd) concentrations (Table 2). The background con-centrations of SO4 and Cl are the mean of the SO4 and Clconcentrations in streams draining forested catchments.Similar relationships between Sfor and stream solute con-centrations hold in the wet season, and only a statisticalsummary of results is presented for the wet season (Table 2).[24] To reduce the confounding effect of rock type on
stream solute concentrations, the parameters of the SIGregressions equation (6) are estimated using watersheds ongneiss-granite, Tertiary sediment or arenitic sandstone only.The residual soil regression parameter bRS exceeds zero forCa, Mg, and ANC, suggesting that the BKG model does notaccount for all predisturbance variability in stream solutes.Soil exchangeable cation content alone explains between0.70 and 0.83 of the variance in stream Ca, Mg, Si, andANC concentrations, and between 0.60 and 0.69 of thevariance in stream K and Na concentrations for catchmentswith an urban population density <5 persons/km2 (Table 3and Figure 3). Dry season signal concentrations of Na, Cl,SO4 and K have statistically significant deforestation
parameters (Table 3 and Figure 4). In the wet season, Clhas a significant deforestation parameter, and K and Nahave significant deforestation parameters when the interceptof equation (6) is not constrained to zero. Signal Ca, Mg,ANC, and Si concentrations do not have significant regres-sion parameters in either season (p > 0.05).[25] For the two most highly urbanized watersheds (288
and 499 persons/km2) chloride concentrations are 37 and73 mM higher than the SIG regression predictions fordeforested, nonurbanized catchments in the dry season, and13 and 32 mM higher in the wet season. This urban signalconcentration comprises 61–73% of the dry season chloridesignal and 73–81%of thewet season chloride signal for thosetwo watersheds. For SO4, the urban signal concentration is71–85% of the total deforestation signal concentration in thedry season, and 100% of the total signal in the wet season.StreamCa,Mg, K, Si, and ANC do not have significant urbanregression parameters in either season. Area does not have asignificant regression parameter for any solute, either alone orwith any other combination of variables.[26] The ratio of observed stream concentrations (Ct) to
predisturbance concentrations (Cf) decrease in the order Cl >K > Na > SO4 for catchments >40% deforested (Table 4).Urban watersheds have more than double the signal con-centrations of chloride in both seasons.
4.3. Effect of Geology on Stream Solute Concentrations
[27] Streams on basic rock types have higher Ca, Mg, Si,and ANC concentrations than streams on acid lithology fora given soil exchangeable cation content in both seasons(Table 5). The relationship between soil cation content andstream solute concentrations is linear for both lithologies,with different slopes and intercepts for each lithology(Figure 5). Stream K concentrations are slightly higher forwatersheds on mica-schist, but not for watersheds on maficrocks and carbonate shale.[28] Rock type confounds the detection and quantifica-
tion of the effect of deforestation on stream solute concen-trations for watersheds on basic lithology. Most solutes,including Ca, Mg, Si, and ANC, have statistically signifi-cant deforestation regression parameters when catchmentswith basic lithology are included in equation (6), but this is
Table 1. Watershed Attributes as Mean (Range) for Three Deforestation Classes, Dry Season Watersheds
Deforestation Extent
0–15% 15–40% >40%
Number of watersheds 15 24 20Soil properties, kmol/haS_Na 2.3 (1.7–3.4) 2.6 (1.9–3.8) 2.8 (1.9–3.6)S_Ca 129 (36–510) 206 (36–443) 319 (40–520)S_Mg 41 (12–137) 59 (14–118) 85 (21–131)S_K 14 (5–39) 19 (7.5–34) 24 (9.3–34)S_TZ 186 (55–690) 287 (59–594) 431 (73–689)S_ECEC 412 (230–820) 509 (320–740) 600 (380–780)S_CEC 773 (530–1220) 910 (730–1140) 1000 (740–1180)S_ pH (pH units) 4.8 (4.5–5.6) 4.9 (4.4–5.5) 5.2 (4.5–5.7)
Number of watershedsGneiss-granite 7 17 9Sandstone or Tertiary sediments 5 3 1Basic lithology (>33% area) 1 4 10
Urban population, persons/km2 0.3 (0–4) 0.3 (0–5.6) 29 (0–499)Area, km2 2620 (80–12540) 454 (10–2580) 201 (11–1090)
1 Supporting data tables are available via Web browser or viaAnonymous FTP from ftp://agu.org, directory ‘‘append’’ (Username =‘‘anonymous’’, Password = ‘‘guest’’); subdirectories in the ftp site arearranged by paper number. Information on searching and submittingelectronic supplements is found at http://www.agu.org/pubs/esupp_about.html.
25 - 6 BIGGS ET AL.: NATURAL AND HUMAN CONTROLS STREAM CHEMISTRY

likely an artifact due to the higher background concentra-tions on basic lithology and does not demonstrate an effectof deforestation on stream Ca, Mg, Si or ANC.
4.4. Solute Sources
[29] Determination of which anions accompany eachcation in solution can indicate whether cation concentra-tions are influenced by human disturbance. ‘‘Mobile’’ orstrong acid anions such as sulfate and nitrate have been usedto assess the contribution of anthropogenic sulfuric andnitric acid deposition to cation leaching and catchmentacidification [Kirchner, 1992] and multiple regression equa-tions can be used to separate the effect of each anion oncation concentrations [Christ et al., 1999]. We use Cl as atracer of human disturbance and ANC to indicate mineral
weathering and exchange of cations with hydrogen ions inthe soil column. Stream ANC does not have a statisticallysignificant deforestation parameter (Table 3), and weassume here that it has natural sources only. The relativeinfluence of human and natural sources on a cation con-centration may be assessed with a multiple linear regression:
Ct ¼ bCl Cl½ � þ bANC ANC½ � þ e ð8Þ
where Ct is the concentration of a given cation, bCl is theregression parameter associated with Cl concentrations,bANC is the regression parameter associated with ANCconcentrations, and e is the error term. Nitrate and sulfatecomprise a small proportion of total anions on an equivalentbasis (average 7%), and do not have significant regressionparameters when included in equation (8).
Figure 3. Watershed soil exchangeable cation contents (Si) versus stream solute concentrations (mM)grouped by deforestation extent for nonurbanized watersheds on gneiss-granite, arenitic sandstone, andtertiary sediments during the dry season. The solid lines indicate the relationship between soilexchangeable cation content and stream solute concentration using forested watersheds only (BKG), andthe dashed lines indicate the relationship using all watersheds (BKG + SIG model).
Table 2. Regression Results for Forested Stream Solute Concentrations Versus Watershed Averaged Soil Properties (BKG model)a
StreamSolute
SoilRegressorVariable
Regression Slope (bs) R2 SEE
Dry Season(n = 14)
Wet Season(n = 11)
DrySeason
WetSeason
DrySeason
WetSeason
Ca S_Ca 0.14 (0.02)b 0.11 (0.01)b 0.82 0.86 11 6.5Mg S_Mg 0.34 (0.05)b 0.23 (0.03)c 0.76 0.85 7.9 3.5K S_K 2.6 (0.3)b 1.5 (0.4)d 0.84 0.57 13 13Si S_TZ 0.48 (0.05)b 0.48 (0.13)d 0.86 0.55 46 72Na S_Na 61 (18)d 32 (14)e 0.53 0.36 36 23Na S_K 4.0 (0.5)b 2.7 (0.3)b 0.89 0.87 18 10ANC S_TZ 0.61 (0.06)b 0.39 (0.09)d 0.89 0.69 53 49
aSi was calculated using soil profiles in forest vegetation only. SEE is the standard error of estimate of the regression. Forested streams are those with<15% deforestation in 1996. None of the intercepts of the linear models (bsoi) was significantly different from zero to p < 0.05.
bp < 0.0001.cp < 0.001.dp < 0.01.eNot significant at 0.05 level.
BIGGS ET AL.: NATURAL AND HUMAN CONTROLS STREAM CHEMISTRY 25 - 7
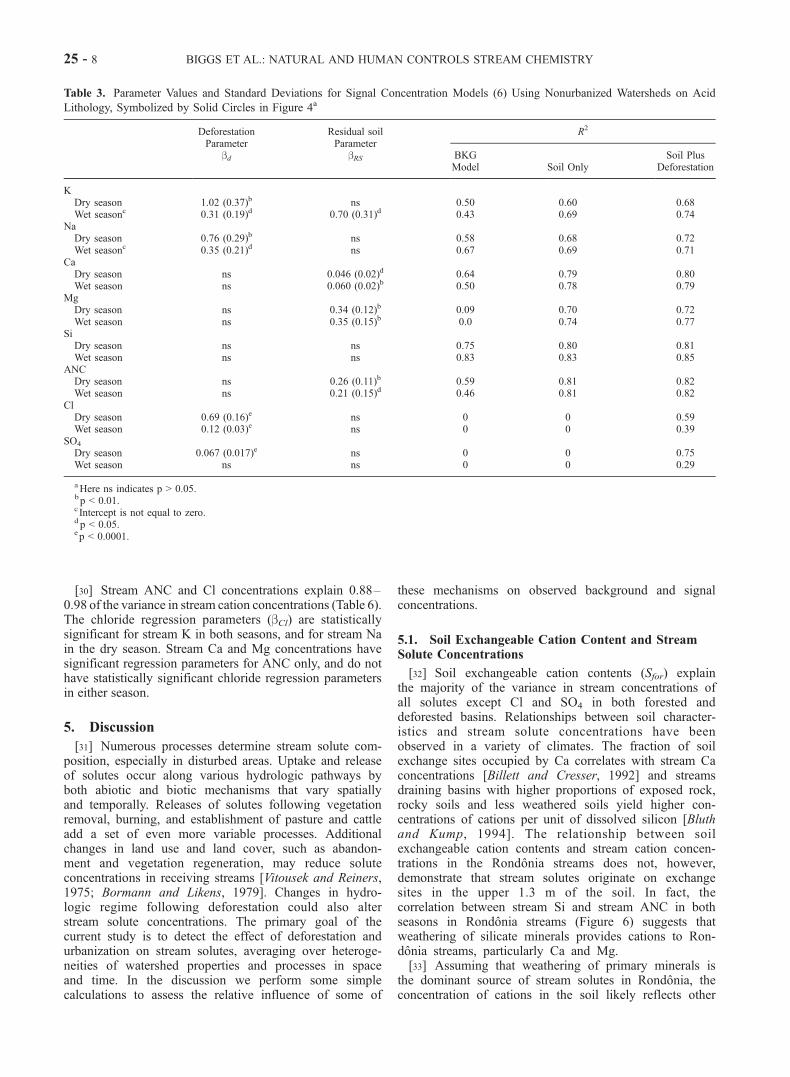
[30] Stream ANC and Cl concentrations explain 0.88–0.98 of the variance in stream cation concentrations (Table 6).The chloride regression parameters (bCl) are statisticallysignificant for stream K in both seasons, and for stream Nain the dry season. Stream Ca and Mg concentrations havesignificant regression parameters for ANC only, and do nothave statistically significant chloride regression parametersin either season.
5. Discussion
[31] Numerous processes determine stream solute com-position, especially in disturbed areas. Uptake and releaseof solutes occur along various hydrologic pathways byboth abiotic and biotic mechanisms that vary spatiallyand temporally. Releases of solutes following vegetationremoval, burning, and establishment of pasture and cattleadd a set of even more variable processes. Additionalchanges in land use and land cover, such as abandon-ment and vegetation regeneration, may reduce soluteconcentrations in receiving streams [Vitousek and Reiners,1975; Bormann and Likens, 1979]. Changes in hydro-logic regime following deforestation could also alterstream solute concentrations. The primary goal of thecurrent study is to detect the effect of deforestation andurbanization on stream solutes, averaging over heteroge-neities of watershed properties and processes in spaceand time. In the discussion we perform some simplecalculations to assess the relative influence of some of
these mechanisms on observed background and signalconcentrations.
5.1. Soil Exchangeable Cation Content and StreamSolute Concentrations
[32] Soil exchangeable cation contents (Sfor) explainthe majority of the variance in stream concentrations ofall solutes except Cl and SO4 in both forested anddeforested basins. Relationships between soil character-istics and stream solute concentrations have beenobserved in a variety of climates. The fraction of soilexchange sites occupied by Ca correlates with stream Caconcentrations [Billett and Cresser, 1992] and streamsdraining basins with higher proportions of exposed rock,rocky soils and less weathered soils yield higher con-centrations of cations per unit of dissolved silicon [Bluthand Kump, 1994]. The relationship between soilexchangeable cation contents and stream cation concen-trations in the Rondonia streams does not, however,demonstrate that stream solutes originate on exchangesites in the upper 1.3 m of the soil. In fact, thecorrelation between stream Si and stream ANC in bothseasons in Rondonia streams (Figure 6) suggests thatweathering of silicate minerals provides cations to Ron-donia streams, particularly Ca and Mg.[33] Assuming that weathering of primary minerals is
the dominant source of stream solutes in Rondonia, theconcentration of cations in the soil likely reflects other
Table 3. Parameter Values and Standard Deviations for Signal Concentration Models (6) Using Nonurbanized Watersheds on Acid
Lithology, Symbolized by Solid Circles in Figure 4a
DeforestationParameter
bd
Residual soilParameter
bRS
R2
BKGModel Soil Only
Soil PlusDeforestation
KDry season 1.02 (0.37)b ns 0.50 0.60 0.68Wet seasonc 0.31 (0.19)d 0.70 (0.31)d 0.43 0.69 0.74
NaDry season 0.76 (0.29)b ns 0.58 0.68 0.72Wet seasonc 0.35 (0.21)d ns 0.67 0.69 0.71
CaDry season ns 0.046 (0.02)d 0.64 0.79 0.80Wet season ns 0.060 (0.02)b 0.50 0.78 0.79
MgDry season ns 0.34 (0.12)b 0.09 0.70 0.72Wet season ns 0.35 (0.15)b 0.0 0.74 0.77
SiDry season ns ns 0.75 0.80 0.81Wet season ns ns 0.83 0.83 0.85
ANCDry season ns 0.26 (0.11)b 0.59 0.81 0.82Wet season ns 0.21 (0.15)d 0.46 0.81 0.82
ClDry season 0.69 (0.16)e ns 0 0 0.59Wet season 0.12 (0.03)e ns 0 0 0.39
SO4
Dry season 0.067 (0.017)e ns 0 0 0.75Wet season ns ns 0 0 0.29
aHere ns indicates p > 0.05.bp < 0.01.c Intercept is not equal to zero.dp < 0.05.ep < 0.0001.
25 - 8 BIGGS ET AL.: NATURAL AND HUMAN CONTROLS STREAM CHEMISTRY

catchment properties that regulate stream chemistry andthe weathering rate of primary minerals. Soils developedon mafic rocks and mica-schist have consistently higherpH and cation concentrations than soils on acid igneousand metamorphic rock, so the soil exchangeable cationcontent may serve as an indirect index of rock andsaprolite weathering rate [Holmes et al., 2000]. Streamson a given rock type have differing solute concentrations(Figures 3 and 5), suggesting that depth to weatherablebedrock may also impact stream solute concentrations inaddition to the differences caused by bedrock mineralogy.Stream solute concentrations and fluxes decrease as soilthickness increases, because thick soils reduce the volumeof annual runoff in contact with fresh bedrock [Stallard,1985]. Further information on the relationship between soildepth, soil exchangeable cation concentrations and bed-rock and soil mineralogy would help elucidate the mech-
anisms relating soil exchangeable cation contents andstream solute concentrations.
5.2. Effect of Rock Type on Stream SoluteConcentrations
[34] Streams draining watersheds on basic rock typeshave higher concentrations of Ca, Mg, Si, and ANC in bothseasons than watersheds on acid lithology for a given soilexchangeable cation content (Figure 5, Si only), with dryseason Mg being the most affected (Table 5). The sensitivityof Mg to rock type likely reflects the high Mg concen-trations of mafic rocks. The ratios of solute concentrationsin streams on basic lithology to streams on acid lithology(Table 5) are consistent with previous comparisons of theweathering rates of different rock types. Meybeck [1987]estimated that gabbro, carbonate shale, and carbonate rocks
Figure 4. Signal concentrations versus deforestation percent (D) in (a) dry and (b) wet seasons. Bestfit lines were determined with nonurbanized watersheds on gneiss-granite, tertiary sediments, orarenitic sandstone. Solid circles indicate watersheds on acid lithology with urban population density<5 persons/km2. Pluses indicate acid lithology, urban population density >5 persons/km2, andasterisks indicate >33% of watershed area on basic lithology and urban population density >5 persons/km2.Nonurbanized watersheds on basic lithology are not shown.
BIGGS ET AL.: NATURAL AND HUMAN CONTROLS STREAM CHEMISTRY 25 - 9

weather at 1.3, 2.5, and 12 times the rate of granite-gneiss,respectively. Deforestation obscures the effect of rock typeon K concentrations, indicating the importance of biologiccycling and disturbance for determining K release fromecosystems in addition to mineral weathering.
5.3. Deforestation Signals
[35] Vegetation disturbance increases the concentrationand fluxes of solutes from small watersheds in a variety ofclimatic, geologic and soil conditions. At Hubbard Brook,New Hampshire, clear-cutting of forest and suppression ofvegetation regrowth increased stream concentrations byfactors of 1.7 for Na, 4.6–5.8 Ca, 3.9 Mg, 9.5–11 K, 1.4dissolved Si, and 1.4 Cl. In the humid tropics, Williams andMelack [1997] documented ratios of postdisturbance to
predisturbance concentrations of 3.8 for Na, 6.8 for Ca,3.8 for Mg, 1.3 for Cl, 1.4 for SO4 and 10.5 for K in acatchment in the central Amazon basin one year followingcutting and burning of 80% of the catchment vegetation.The changes in stream cation and ANC following defor-estation of small watersheds in these past studies exceed thechanges measured in Rondonia, where we observed nostatistically significant changes in stream Ca, Mg andANC, and disturbed to predisturbance ratios of 1.5 and1.3 (Na) and 2.2 and 1.7 (K) in the dry and wet seasons,respectively. By contrast, changes in chloride in the Ron-donia streams exceed changes measured in the small water-sheds, suggesting that other processes besides vegetationconversion influence stream Cl response to deforestation.[36] The lower cation and ANC response in the Rondonia
streams may be due to a number of factors, includingsecondary succession, physiography, sampling strategy,and clearing age. Uptake of nutrients during secondarysuccession reduces the concentration of solutes in streams[Bormann and Likens, 1979; Vitousek and Reiners, 1975].While previous studies report that 47% of deforested areasin the Amazon basin are in some stage of regrowth [Rignotet al., 1997], more recent estimates using Landsat TMimagery and airborne videography suggest that regrowthrates in Rondonia are relatively low (18%) and that mostcleared areas remain in pasture after clearing (D. A. Roberts,unpublished data, 2001). Given these land use character-istics, regrowth may have some influence on stream cationconcentrations but is not likely to be the main mechanismattenuating land use signals in streams.
Table 4. Concentration Partitions for Catchments >40% Deforested, Acid Lithology Only as Mean (Standard Deviation)a
Nonurban Watersheds Urban Population >200persons/km2
Dry(N = 10)
Wet(N = 8)
Dry(N = 2)
Wet(N = 2)
NaTotal concentration (Ct) 153 (92) 77 (43) 185 (16) 76 (36)Predisturbance (Cf) 96 (32) 60 (39) 55 (42) 30 (21)Deforestation signal (Cd) 56 (75) 17 (39) 38 (8) 16 (4)Urban signal – – 91 (17) 31 (16)Ratio of Total:Soil (Ct:Cf ) 1.5 (0.7) 1.3 (0.6) 4.5 (3.1) 2.9 (0.8)
KTotal concentration (Ct) 133 (69) 69 (25) – –Predisturbance (Cf ) 62 (22) 52 (15) – –Deforestation signal (Cd) 71 (62) 17 (22) – –Ratio of Total:Soil (Ct:Cf ) 2.2 (0.9) 1.7 (0.5) – –
SO4
Total concentration (Ct) 6.9 (4.3) 2.4 (0.8) 24 (14) 2.9 (0.7)Predisturbance (Cf ) 4.2 2.0 4.2 2.0Deforestation signal (Cd) 2.7 (4.3) 0.4 (0.8) 3.4 (0.7) 0Urban signal – – 21 (13) 0.9 (0.7)Ratio of Total:Soil (Ct:Cf ) 1.7 (1.0) 1.2 (0.4) 5.8 (3.3) 1.4 (0.3)
ClTotal concentration (Ct) 57 (41) 13 (6.0) 129 (5.4) 31 (12)Predisturbance (Cf ) 6.8 4.4 6.8 4.4Deforestation signal (Cd) 50 (41) 8.6 (6.7) 35 (7) 6.0 (1.3)Urban signal – – 87 (2) 25 (11)Ratio Ct:Cf 8.5 (6.1) 2.0 (1.4) 19 (1) 7.1 (2.7)
aCti is the observed concentration in the stream, Cfi is the predicted background concentration based on the BKG regression, and Cdi is the signalconcentration (3).
Table 5. Ratio of Solute Concentrations in Streams on Basic
Lithology to Solute Concentrations in Streams on Acid Lithology
for a Given Soil Exchangeable Cation Contenta
Dry Season Wet Season
Ca 1.9–2.7 0.8–2.5Mg 2.7–4.3 1.2–2.4Si 1.8–2.3 1.8–2.0ANC 1.8–2.9 0.8–3.2
aThe stream concentrations on each lithology were calculated usingregressions of stream solute concentrations versus soil exchangeable cationcontent parameterized using watersheds on acid lithology only and usingwatersheds with >33% of the drainage area on basic lithology.
25 - 10 BIGGS ET AL.: NATURAL AND HUMAN CONTROLS STREAM CHEMISTRY

[37] Physiographic characteristics in Rondonia may alsoreduce the impact of surface disturbance on stream chem-istry. The long hillslopes (�590–1200 m) and deep soils ofthe sampled catchments increase water residence times andthe path length of solutes transported through the soilcompared with the temperate zone studies, which occurredon catchments with relatively thin soils on steeper, shorterslopes. Elements mobilized by vegetation combustion andorganic matter mineralization may be retained on exchangesites within the soil/saprolite during transport in the longhillslopes, buffering streams from the effects of land usechange on solute concentrations. Increases in soil pH raisesoil cation exchange capacity, further increasing the abilityof the soil to retain cations input after surface disturbance[Nye and Greenland, 1960].[38] The synoptic sampling strategy may also under-
estimate stream solute responses to deforestation due toundersampling of storm events. In small watersheds, con-centrations of stream solutes, especially K, often increaseduring storm events in undisturbed [Elsenbeer et al., 1995]and disturbed catchments [Williams and Melack, 1997]. Dryseason samples do not capture these higher flows and thepotentially high solute concentrations associated with them.Wet season samples represent a mixture of wet season baseflow and storm flows, depending on the location of thesample relative to the location, spatial extent, intensity andduration of storm events in the watershed. The fraction oftotal discharge occurring as storm flow is likely to be lowerin large catchments sampled during stable hydrologic con-ditions (Figure 2) compared with small, intensively sampled
catchments [Williams and Melack, 1997] that demonstratelarger impacts of land use activities on solute concentra-tions. To the extent that the synoptic sampling does notsample storm flows with high solute concentrations, thesynoptic sampling method may underestimate the effect ofdisturbance on stream composition and annual solute fluxes.[39] Finally, the lack of a strong land use signal for Ca
and Mg and relatively low signal for K may be due to theduration of the impact of deforestation on soil water andstream solute concentrations. High concentrations of Ca inseepage water last only four months following deforestationin the eastern Amazon basin [Holscher et al., 1997], andsoil water from deforested areas in the northern Amazonbasin have elevated concentrations of K and Mg for 2 yearsthat return to predisturbance levels 5 years after burning[Uhl and Jordan, 1984]. At the small catchment scale,stream Ca concentrations decrease after 3 years followingclear-cutting of a small watershed in the eastern UnitedStates [Likens et al., 1998], and stream K concentrations fallwithin 5 years but exceed the predisturbance concentrationsfor 15 years [Likens et al., 1994]. The average age ofclearings in the Rondonia watersheds ranges between 5and 17 years as measured from a series of Landsat TMimages (D. A. Roberts, unpublished data, 2001), whichexceeds the duration of the solute pulses measured in soiland stream waters of previous studies. It is possible thatdeforestation impacts Ca and Mg concentrations, but thatthe pulse of solutes is short-lived and difficult to detect inwatersheds where the average pasture age exceeds thelength of the pulse. In that case, the fraction of newly
Figure 5. Relationship between soil exchangeable cation content and stream dissolved siliconconcentrations for streams on acid lithology (solid circles), for streams with >33% of the watershed areaon mica-schist (open squares) and for streams >33% on mafic rock and carbonate shale and <20% onmica-schist (open triangles).
Table 6. Regression Coefficients of Stream Cation Concentrations Versus Stream Cl and Stream ANC for Streams Draining Acid
Lithology and Nonurbanized Catchments Only (Equation (8))a
Dry Season Wet Season
b_Cl b_ANC R2 b_Cl b_ANC R2
K 0.83 (0.18)b 0.14 (0.02)b 0.92 1.9 (0.6)c 0.11 (0.02)b 0.88Na 0.56 (0.22)d 0.21 (0.02)b 0.92 ns 0.20 (0.03)b 0.81Ca ns 0.15 (0.01)b 0.98 ns 0.17 (0.01)b 0.94Mg ns 0.15 (0.01)b 0.95 ns 0.15 (0.01)b 0.96
aHere ns indicates p > 0.05.bp < 0.0001.cp < 0.01.dp < 0.05.
BIGGS ET AL.: NATURAL AND HUMAN CONTROLS STREAM CHEMISTRY 25 - 11

cleared and/or burned area in a watershed may moreaccurately predict stream signals due to deforestation thanthe aggregate measure used here that includes clearings ofall ages.[40] The presence of K, Na, and SO4 stream signals and
the lack of Ca and Mg signals are consistent with geo-chemical models of the mobility of elements added to soil ascombusted biomass. Ludwig et al. [1999] combined thegeochemical model PHREECQ with experimental data andfound that only 4.7–14.3% of the Ca and 24.7–54.5% ofthe Mg added to an Amazon Acrisol as wood ash werereleased into soil water, the remainder being retained oncation exchange sites. The low mobility of Ca and Mgcontrasts with the relatively high mobility of K (55–72% ofthe added K was in dissolved form), Na (70–80% dis-solved) and SO4 (72–85% dissolved). These differences insolubility may explain the different behavior of streamsolutes following deforestation, where the most soluble(K, Na, and SO4) have detectable stream responses tovegetation disturbance, and the least soluble (Ca and Mg)do not. This does not prove that the K, Na, and SO4 arederived only from ash, or that solubility variation aloneexplains differences in solute behavior following deforesta-tion, but suggests that differences in solubility may be onemechanism explaining the differences in solute responses todeforestation, and that differences in solubility are consis-tent with observed solute responses for large (10–10,000km2) watersheds.[41] Deforestation alters not only the mobility of elements
in the landscape, but also the hydrologic conditions thatdetermine stream solute concentrations and fluxes. Removalof forest vegetation causes decreases in evapotranspiration,increased groundwater recharge and subsequent increases inannual runoff [Williams and Melack, 1997; Bosch andHewlett, 1982]. Though it was not possible to measurepredisturbance and postdisturbance discharge for thesampled catchments, deforestation in Rondonia most likelyincreases discharge in both dry and wet seasons, whichwould reduce stream solute concentrations due to dilution.Changes in discharge are probably not responsible for theobserved increases in stream solute concentrations, and theNa, K, SO4 and Cl signals observed here result fromenhanced mobilization and transport of solutes to streams.[42] The considerable scatter about the least squares
regression lines in Figures 4a and 4b suggests that streamsvary widely in their response to deforestation at the scale of
18–12,500 km2. Such variability is expected in a regionalsurvey where aggregate and static measures of watershedproperties are used to interpret stream solute concentrations.The deforestation extent measured by Landsat TM imageryused here does not account for other variables that may beimportant for determining solute composition, including thedynamics of land use history, pasture age and successionalstatus [Vitousek and Reiners, 1975]. We also have notincluded the location of deforested areas in relation todrainage networks, the presence or absence of riparianzones, and soil properties other than Si such as soil texturethat might influence solute release rates [Smith et al., 1997].The lack of correlation of stream Ca, Mg, and ANCconcentrations with deforestation extent does not conclu-sively demonstrate that deforestation has no influence onthe concentrations of these solutes. Rather, the influence ofdeforestation on Ca, Mg and ANC is not detectable due tothe strong natural controls on predisturbance concentrationsand to the potential variability of stream solute response todeforestation.
5.4. Urban Signals
[43] Deforestation at a regional scale is not only a processof vegetation conversion for agriculture, but also involvesaggregation of human populations in settlements. This isexpressed in stream Na, Cl and SO4 concentrations, whichhave strong signals in urbanized catchments. The impact ofurban areas is expected to increase with time as urbanizationprogresses and urban populations increase. Streams drainingurbanized watersheds in the more industrialized Brazilianstate of Sao Paulo have 75% higher chloride concentrationsand 91% higher SO4 concentrations than nonurbanizedwatersheds [Martinelli et al., 1999]. Urban areas have beenidentified as strong contributors to stream Cl concentrations,with sources including a wide range of domestic andindustrial processes [Prowse, 1987].
5.5. Solute Sources
[44] Simple mass balance calculations can give a prelimi-nary assessment of the potential contributions of burned anddecaying biomass, and cattle salts to stream signal concen-trations in nonurbanized catchments. The volume-weightedmean deforestation signal concentration of solute i(VWMi)may be calculated by assuming that solutes from burned and
Figure 6. Stream Si versus ANC. Symbols are as in Figures 4 and 5.
25 - 12 BIGGS ET AL.: NATURAL AND HUMAN CONTROLS STREAM CHEMISTRY

decaying biomass are released into streams at a constant rateover a time period t:
VWMi ¼103DBi 1� uið Þ
qtð9Þ
where VWMi is in mM, D is the percent of the catchmentdeforested, Bi is the biomass content of element i in kmol/ha,ui is the fraction of element i lost to the atmosphere viaparticle transport and volatilization during burning, q isannual specific discharge in mm/year, and t is in years.Though the element content of biomass has not beenmeasured for Rondonia’s open tropical rain forests, totalbiomass has been measured in Rondonia and does not differsignificantly from the biomass of rain forests for whichelemental data are available (Table 7). The range ofelemental composition of Rondonia’s open rain forests istherefore assumed to be similar to other forests in the
Amazon basin. Belowground biomass on moderately fertileto infertile soils varies between 3.4% and 14% of totalbiomass (Table 7). An upper bound on the VWMi can beestimated on the assumption that belowground biomassdecomposes and represents 15% of total biomass, and alower bound can be specified if there is no export ofelements contained in belowground biomass to streams. Thenet amount of each cation transferred to the atmosphere dueto volatilization and particle transport (ui) varies from a lowof zero if cations are deposited locally within the watershedto a high of field-scale measured values for cation export inash if those particles are exported beyond watershedboundaries. Specific discharge (q) is 650 mm/year, theaverage for 1998 and 1999 for 7 discharge stations in thestate.[45] In addition to combusted biomass, additional cations,
chloride and sulfur added via supplemental minerals andsalts given to cattle may influence stream chemistry. Table 7
Table 7. Estimates of Forest Biomass and Cattle Salt Element Inputs, the Expected Volume-Weighted Signal Concentration Expected
from the Export of 50% of that Biomass and Cattle Salt in Rondonia Streams, and Comparison with Observed Signals from Nonurbanized
Watersheds
Biomass,Mg/ha
Na,kmol/ha
Ca,kmol/ha
Mg,kmol/ha
K,kmol/ha
Si,kmol/ha
Cl,kmol/ha
SO4,kmol/ha
Aboveground biomass (Bi)Central Amazon basina 314 4.92 66.4 31.7 12.2 21.9 – –Infertile soils, central
Amazon basinbabove 406 – 10.8 8.7 11.2 – – –
Infertile soils, centralAmazon basinb
below 32.3 – 1.4 1.1 0.8 – – –
Fertile soils, Venezuelac 402 – 84.5 17.5 77.4 – – –Rondonia, Brazild 290–495 – – – – – – –Rondonia, Brazile 285 – – – – – – –Brazilf – – – – – – 3.3 –Rondonia, Brazilg 355–399 – – – – – – 1.8–2.1
Soil exchangeable poolh – 1.7–3.6 36–520 12–131 5–34 – – –Input from cattle salts per yeari – 0.01–0.15 0.006–0.09 0.001–0.021 – – 0.01–0.15 0.001–0.01Fraction of biomass element lost
to atmosphere during burning(ui)
j
– 0.17–0.23 0.09–0.24 0.17–0.43 0.16–0.31 0 0.83i 0.67–0.68
Concentration of biomasselements in runoff for 50%deforestation averagedover 10 years, k mM
– 29–43 63–748 38–277 59–685 169 4–25 5.3–19
Concentration of biomasselements in runoff for 50%deforestation averaged over50 years, k mM
– 5.8–8.6 13–150 7.6–55.5 12–137 34 0.8–5 1.1–3.7
Concentration of cattle salts inannual runoff i
– 0.8–12 0.5–7.3 0.1–1.6 – – 0.8–12 0.06–0.9
Total signal concentration from10 year averaged biomassexport and cattle salts
30–55 64–755 38–279 59–596 169 5–37 5.3–18.5
Observed wet season signalconcentration (Cdi)
hMean ± SD 17 ± 39 – – 17 ± 22 – 9 ± 7 –
Observed backgroundconcentration (Cfi)
60 ± 39 75 ± 37 64 ± 26 52 ± 15 278 ± 96 4.4 2.0
aLucas et al. [1993].bKlinge [1976] as cited by Vitousek and Sanford [1986].cHase and Folster [1982].dAlves et al. [1997].eBrown et al. [1995].fMcKenzie et al. [1996].gGuild et al. [1998].hThis study, Table 4.iH. Schmitz (personal communication, 1999). Calculated for 50% of watershed as pasture and stocking densities between 0.1 and 1.5 cattle/ha.jMackensen et al. [1996].kEquation (9), this study.lLobert et al. [1999].
BIGGS ET AL.: NATURAL AND HUMAN CONTROLS STREAM CHEMISTRY 25 - 13

shows the range of cation and chloride inputs expected fromthe supply of cattle salts at 0.9 kg salt/month per head (H.Schmitz, personal communication, 1998), at stocking den-sities reported for the Amazon basin between 0.1 and 1.5head per hectare [Loker et al., 1997; Weinhold, 1999]. Thecalculations assume no net retention of salt ions in cattlebiomass or on soil exchange sites, and that all ranchers givecattle supplemental salts.[46] Sodium and chloride have the largest potential con-
tribution from cattle salts relative to the 10-year averagebiomass contribution, with 2–30% (Na) and 4–75% (Cl) oftheir VWM potential signal concentrations attributable tocattle salts, depending on cattle stocking density and themagnitude of the biomass signal. Although high concen-trations of K may occur in cattle wastes [Withers et al.,1998], no additional K is added in the supplemental saltsreported here. Cattle-derived K originates in ingested bio-mass, which may alter the form and rate of transport but notthe ultimate source of K to streams.[47] The wet season land use signal concentrations of Na,
K, SO4 and Cl for nonurbanized watersheds fall within therange of the 10-year VWMi concentrations from the exportof biomass and cattle salts (Table 7). Averaged over 50years, the biomass input could still provide most of theobserved K signal, but the observed Na and Cl signalsrequire inputs from other sources, here assumed to be cattlesalts. The low SO4 signals measured in streams correspondwith the low concentration of sulfur in biomass, a high lossof sulfur during biomass burning, and low inputs from cattlesalts.[48] The calculated VWMi overestimates the actual
amount of elements available for export to streams, sincethe calculation assumes that soils and regenerating biomassdo not absorb or assimilate any elements mobilized bydeforestation. It may also underestimate the amounts ofavailable elements, since regenerating vegetation may makepreviously inorganically held elements biologically activeand available for release in the next burning cycle [Nye andGreenland, 1960]. Finally, deforested catchments likelyhave higher runoff rates than forested catchments due tothe reduction of evapotranspiration following removal offorest vegetation. This would cause runoff volumes to behigher in deforested basins and disturbance effects on streamconcentrations to be lower. Despite these uncertainties, theobserved land use signal concentrations fall within andbelow the range of concentrations of Na, Cl, K, and SO4
expected from exporting biomass element content and cattlesalts over a decadal timescale. This does not prove thatbiomass and cattle salts are the only sources of the signal, butdoes demonstrate the likelihood and provides a frameworkfor testing the effect of remaining uncertainties on calculatedsignal concentrations. Soil cation reservoirs could contributeeven more cations to soil and stream waters followingdisturbance, but their influence is not calculated here.
6. Conclusion
[49] Natural variations in soil and rock type exert strongcontrols on all stream solute concentrations except Cl andSO4. Soil exchangeable cation content is the best predictorof the concentrations of all stream solutes except chlorideand sulfate, which depend on deforestation extent andurban population density. The mechanism relating soil
cation content to stream solute concentrations is notknown, but may be related to the effect of soil depth onbedrock weathering rates. Deforestation happens preferen-tially on soils with high cation contents, so streamsdraining deforested watersheds have higher Ca, Mg, Si,and ANC concentrations than streams draining forestedwatersheds due to natural variations in soil properties androck type and not to human disturbance. Rock typeinfluences stream Ca, Mg, Si, and ANC concentrationsand further complicates the detection of human impacts ontheir concentrations.[50] The natural controls on stream chemistry may be
statistically removed to demonstrate that K, Na, and Clconcentrations in both seasons and SO4 in the dry seasondepend on deforestation extent for nonurbanized water-sheds, though the response is highly variable. Stream Kand Na concentrations are associated with stream Cl con-centrations, indicating anthropogenic contributions tostream Na concentrations in the dry season and to streamK in both seasons. Stream Ca, Mg and ANC may beinfluenced by deforestation, but the effect is either too smallor too variable to be detected given natural variability due tosoil and rock type. The weak stream signal may be causedby retention on cation exchange sites or by the duration ofsolute pulses following deforestation that may not bedetectable averaged over a catchment with variable pastureages. Watershed level indices of pasture age and regrowthrates may help explain the substantial variation in watershedlevel responses to regional deforestation.[51] Land use activities besides vegetation conversion are
important for determining the ultimate impact of regionaldeforestation on stream solute concentrations. Cattle saltinputs likely impact Na and Cl concentrations, particularlyduring the dry season, and urban areas significantly influ-ence stream Cl and SO4 concentrations in urbanized water-sheds. Further research could examine how these otherprocesses deliver solutes to streams, and for what watershedsizes each becomes important in determining human impacton stream chemistry.
[52] Acknowledgments. Reynaldo Victoria from the Centro de Ener-gia Nuclear na Agricultura, Eraldo Matricardi of Planafloro, Harald Schmitzof the Fundacao Fauna e Flora Tropicais Rondonia, and Maria Alves daSilva Bahia of Centro de Aguas e Esgoto de Rondonia helped with fieldlogistics and data acquisition. John Melack, Oliver Chadwick, HelmutElsenbeer, and one anonymous reviewer provided valuable comments onthe manuscript. Jim Sickman, Frank Setaro, and Bob Petty assisted withchemical analyses. Charles Kiedman classified the satellite imagery. Thiswork was supported by the National Aeronautic and Space Agency-EOS(Earth Observing System) Amazon Project, NAGW-5233, and by a NASAEarth System Science graduate student fellowship.
ReferencesAlves, D. S., J. V. Soares, S. Amaral, E. M. K. Mello, S. A. S. Almeida, O.F. Da Silva, and A. M. Silveira, Biomass of primary and secondaryvegetation in Rondonia, Global Change Biol., 3, 451–461, 1997.
Ballantine, J. A., The response of groundwater flow to topography anddeforestation in humid tropical regions, M.A. thesis, Department of Geo-graphy, Univ. of Calif., Santa Barbara, 2001.
Bernoux, M., D. Arrouays, C. Cerri, B. Volkoff, and C. Jolivet, Bulkdensities of Brazilian Amazon soils related to other soil properties, SoilSci. Soc. Am. J., 62, 743–749, 1998.
Biggs, T. W., Tropical land use change effects on stream flow chemistry atthe regional scale: A deforestation signal in the southwestern BrazilianAmazon, M.A. thesis, Dep. of Geogr., Univ. of Calif., Santa Barbara,2000.
25 - 14 BIGGS ET AL.: NATURAL AND HUMAN CONTROLS STREAM CHEMISTRY

Billett, M. F., and M. S. Cresser, Predicting stream-water quality usingcatchment and soil chemical characteristics, Environ. Pollut., 77, 263–268, 1992.
Billett, M. F., J. A. H. Lowe, K. E. Black, and M. S. Cresser, The influenceof parent material on small-scale spatial changes in streamwater chem-istry in Scottish upland catchments, J. Hydrol., 187, 311–331, 1996.
Bluth, G. J. S., and L. R. Kump, Lithologic and climatologic controls ofriver chemistry, Geochim. Cosmochim. Acta, 58, 2341–2359, 1994.
Bormann, F. H., and G. E. Likens, Pattern and Process in a ForestedEcosystem, Springer-Verlag, New York, 1979.
Bosch, J. M., and J. D. Hewlett, A review of catchment experiments todetermine the effect of vegetation changes on water yield and evapotran-spiration, J. Hydrol., 55, 3–23, 1982.
Brower, J. O., and B. J. Godfrey, Rainforest Cities: Urbanization, Devel-opment, and Globalization of the Brazilian Amazon, p. 7, ColumbiaUniv. Press, New York, 1997.
Brown, I. F., L. A. Martinelli, W. W. Thomas, M. Z. Moreira, C. A. C.Ferreira, and R. A. Victoria, Uncertainty in the biomass of Amazonianforests—An example from Rondonia, Brazil, For. Ecol. Manage., 75,175–189, 1995.
Bruijnzeel, L. A., Nutrient input–output budgets of tropical forest ecosys-tems: A review, J. Tropical Ecol., 7, 25–36, 1991.
Camargo, M. N., E. Klamt, and J. H. Kauffman, Sistema Brasileiro deClassificacao de Solos, Separata B. Inf. Soc. Bras. Ci. Solo Campinas,12, 11–33, 1987.
Chernick, M. R., Bootstrap Methods: A Practicioner’s Guide, pp 70–78,John Wiley, New York, 1999.
Christ, M. J., C. T. Driscoll, and G. E. Likens, Watershed- and plot-scaletests of the mobile anion concept, Biogeochemistry, 47, 335–353, 1999.
Cochrane, T. T., Sigteron: Sistema de Informacao geografica paras os ter-renos e solos do estado de Rondonia, Brasil, Porto Velho, Tecnosolo/DHV Consultants BV, 1998.
Companhia de Pesquisa de Recursos Minerais (CPRM), Mapa Geologicodo Estado de Rondonia, Ministerio de Minas e Energia, Porto Velho,Brazil, 1997.
de Moraes, J. F. L., B. Volkoff, C. C. Cerri, and M. Bernoux, Soil propertiesunder Amazon forest and changes due to pasture installation in Rondo-nia, Brazil, Geoderma, 70, 63–81, 1996.
Dethier, D. P., Weathering rates and the chemical flux from catchments inthe Pacific Northwest, U.S.A., in Rates of Chemical Weathering of Rocksand Minerals, edited by S. M. Colman and D. P. Dethier, pp. 503–530,Academic, San Diego, Calif., 1986.
Downing, J. A., et al., The impact of accelerating land use change on the N-cycle of tropical aquatic ecosystems: Current conditions and projectedchanges, Biogeochemistry, 46, 109–148, 1999.
Draper, N. R., and H. Smith, Applied Regression Analysis, pp. 89–96, JohnWiley, New York, 1998.
Edmond, J. M., M. R. Palmer, C. I. Measures, B. Grant, and R. F. Stallard,The fluvial geochemistry and denudation rate of the Guayana Shield inVenezuela, Colombia and Brazil, Geochim. Cosmochim. Acta, 59, 3301–3325, 1995.
Elsenbeer, H., A. Lack, and K. Cassel, Chemical fingerprints of hydrolo-gical compartments and flow paths at La Cuenca, western Amazonia,Water Resour. Res., 31, 3051–3058, 1995.
Empresa Brasileira de Pesquisa Agropecuaria (EMBRAPA), Mapa de Le-vantamento de Reconhecimento de Media Intensidade dos Solos do Es-tado de Rondonia, Porto Velho, Brazil, 1983.
Fearnside, P. M., Initial soil quality conditions on the Transamazon high-way of Brazil and their simulation in models for estimating human carry-ing capacity, Tropical Ecol., 25, 1–21, 1984.
Food and Agriculture Organization (FAO), Global and national soils andterrain digital databases, procedures manual, Rome, 1993.
Freyssinet, P., and A. S. Fara, Geochemical mass balance and weatheringrates of ultramafic schists in Amazonia, Chem. Geol., 170, 133–151,2000.
Guild, L. S., J. B. Kauffman, L. J. Ellingson, D. L. Cummings, and E. A.Castro, Dynamics associated with total aboveground biomass, C, nutri-ent pools, and biomass burning of primary forest and pasture in Rondo-nia, Brazil during SCAR-B, J. Geophys. Res., 103, 32,091–32,100,1998.
Hase, H., and H. Folster, Bioelement inventory of a tropical (semi-)ever-green seasonal forest on eutrophic alluvial soils, Western Llanos, Vene-zuela, Acta Oecol. Oecol. Plant., 3, 331–346, 1982.
Holmes, K., E. P. S. Filho, T. Muraoka, and O. A. Chadwick, The effect ofrock composition on soil nutrient levels in the seasonal tropical south-western Amazon (abstract), Eos Trans. AGU, 81(48), Fall Meet. Suppl.,B11C-08, 2000.
Holscher, D., R. F. Moller, M. Denich, and H. Folster, Nutrient input–output budget of shifting agriculture in eastern Amazonia, Nutrient Cy-cling Agroecosyst., 47, 49–57, 1997.
Instituto Brasileiro de Geografıacute;a e Estatisticas (IBGE), Contagem daPopulacao, Brasilia, 1996.
Instituto Nacional de Pesquisas Espaciais (INPE), Monitoring of the Bra-zilian Amazonian forest by satellite, 1998–1999, Sao Jose dos Campos,Brazil, 2000.
Jones, D. W., V. H. Dale, J. J. Beauchamp, M. A. Pedlowski, and R. V.O’Neill, Farming in Rondonia, Resour. Energy Econ., 17, 155–188,1995.
Kirchner, J. W., Heterogeneous geochemistry of catchment acidification,Geochim. Cosmochim. Acta, 56, 2311–2327, 1992.
Klinge, H., Bilanzierung von Hauptnahrstoffen im Okosystem tropischerRegenwald (Manaus)—Vorlaufige Daten, Biogeographica, 7, 59–76,1976.
Likens, G. E., C. T. Driscoll, D. C. Buso, T. G. Siccama, C. E. Johnson, G.M. Lovett, D. F. Ryan, T. Fahey, and W. A. Reiners, The biogeochem-istry of potassium at Hubbard Brook, Biogeochemistry, 25, 61–125,1994.
Likens, G. E., C. T. Driscoll, D. C. Buso, T. G. Siccama, C. E. Johnson, G.M. Lovett, T. J. Fahey, W. A. Reiners, D. F. Ryan, C. W. Martin, and S.W. Bailey, The biogeochemistry of calcium at Hubbard Brook, Biogeo-chemistry, 41, 89–173, 1998.
Lobert, J. M., W. C. Keene, J. A. Logan, and R. Yevich, Global chlorineemissions from biomass burning: Reactive chlorine emissions inventory,J. Geophys. Res., 104, 8373–8389, 1999.
Loker, W., R. Vera, and K. Reategui, Pasture performance and sustainabilityin the Peruvian Amazon: Results of long-term on-farm research, Agric.Syst., 55, 385–408, 1997.
Lucas, Y., F. J. Luizao, A. Chauvel, J. Rouiller, and D. Nahon, The relationbetween biological activity of the rain forest and mineral composition ofsoils, Science, 260, 521–523, 1993.
Ludwig, B., P. K. Khanna, D. Holscher, and B. Anurugsa, Modellingchanges in cations in the topsoil of an Amazonian Acrisol in responseto additions of wood ash, Eur. J. Soi Sci., 50, 717–726, 1999.
Mackensen, J., D. Holscher, R. Klinge, and H. Folster, Nutrient transfer tothe atmosphere by burning of debris in eastern Amazonia, For. Ecol.Manage., 86, 121–128, 1996.
McKenzie, L. M., Ward, D. E. and Hao, W. M., Chlorine and bromine inthe biomass of tropical and temperate ecosystems, in Biomass Burningand Global Change, vol 1., Remote Sensing, Modeling and InventoryDevelopment, and Biomass Burning in Africa, edited by J. S. Levine, pp.241–248, MIT Press, Cambridge, Mass., 1996.
Martinelli, L. A., A. V. Krusche, R. L. Victoria, P. B. D. Camargo, M.Bernardes, E. S. Ferraz, J. M. D. Moraes, and M. V. Ballester, Effectsof sewage on the chemical composition of Piracicaba River, Brazil,Water Air Soil Pollut., 110, 67–79, 1999.
Melillo, J. M., R. A. Houghton, D. W. Kicklighter, and A. D. McGuire,Tropical deforestation and the global carbon budget, Annu. Rev. EngergyEnviron., 21, 293–310, 1996.
Meybeck, M., Global chemical weathering of surficial rocks estimated fromriver dissolved loads, Am. J. Sci., 287, 401–428, 1987.
Meybeck, M., Man and river interface: Multiple impacts on water andparticulate chemistry illustrated in the Seine River basin, Hydrobiologia,374, 1–20, 1998.
Moglen, G. E., E. A. B. Eltahir, and R. L. Bras, On the sensitivity of drainagedensity to climate change, Water Resour. Res., 34, 855–862, 1998.
Mortatti, J., J. L. Probst, and J. R. Ferreira, Hydrological and geochemicalcharacteristics of the Jamari and Jiparana River basins (Rondonia, Bra-zil), GeoJ., 26, 287–296, 1992.
Natural Resources Conservation Service (NRCS), Soil Taxonomy: A BasicSystem of Soil Classification for Making and Interpreting Soil Surveys,2nd ed., U.S. Dep. of Agric., Washington, D.C., 1999.
Novotny, V., and G. Chesters, Handbook of Nonpoint Pollution: Sourcesand Management, Van Nostrand Reinhold, New York, 1981.
Nye, P. H., and D. J. Greenland, The Soil Under Shifting Cultivation, pp.66–83, Commonwealth Bureau of Soils, Harpenden, United Kingdom,1960.
Ometo, J. P. H. B., L. A. Martinelli, M. V. Ballester, A. Gessner, A. V.Krusche, R. L. Victoria, and M. Williams, Effects of land use onwater chemistry and macroinvertebrates in two streams of the Piraci-caba River basin, south–east Brazil, Freshwater Biol., 44, 327–337,2000.
Pedlowski, M. A., V. H. Dale, E. A. T. Matricardi, and E. P. da Silva Filho,Patterns and impacts of deforestation in Rondonia, Brazil, LandscapeUrban Plann., 38, 149–157, 1997.
BIGGS ET AL.: NATURAL AND HUMAN CONTROLS STREAM CHEMISTRY 25 - 15

Prowse, C. W., The impact of urbanization on major ion flux throughcatchments: A case study in southern England, Water Air Soil Pollut.,32, 277–292, 1987.
RADAMBRASIL, Levantamento de recursos naturais, Ministerio dasMinas e Energia, Dep. Nac. de Producao Miner., Rio de Janeiro, Brazil,1978.
Rignot, E., W. A. Salas, and D. L. Skole, Mapping deforestation andsecondary growth in Rondonia, Brazil, using imaging radar and thematicmapper data, Remote Sens. Environ., 59, 167–179, 1997.
Roberts, D. A., G. T. Batista, J. L. G. Pereira, E. Waller and B. W. Nelson,Change identification using multitemporal spectral mixture analysis: Ap-plications in eastern Amazonia, in Remote Sensing Change Detection:Environmental Monitoring Methods and Applications, edited by R. S.Lunetta and C. D. Elvidge, pp. 137–161, Ann Arbor Press, Chelsea,Mich., 1998.
Roberts, D. A., I. Numata, K. Holmes, G. Batista, T. Krug, A. Monteiro, B.Powell, and O. A. Chadwick, Large area mapping of land-cover change inRondonia using multitemporal spectral mixture analysis and decision treeclassifiers, J. Geophys. Res., 107, 10.1029/2001JD000374, in press, 2002.
Smith, R. A., G. E. Schwartz, and R. B. Alexander, Regional interpretationof water-quality monitoring data, Water Resour. Res., 33, 2781–2798,1997.
Stallard, R. F., Geochemistry of the Amazon, 2, The influence of geologyand weathering environment on the dissolved load, J. Geophys. Res., 88,9671–9688, 1983.
Stallard, R. F., River chemistry, geology, geomorphology and soils in theAmazon and Orinoco basins, in The Chemistry of Weathering, edited byJ. I. Drever, pp. 293–316, D. Reidel, Norwell, Mass., 1985.
Stumm, W., and J. J. Morgan, Aquatic Chemistry, 541 pp., John Wiley, NewYork, 1981.
Thierfelder, T., The morphology of landscape elements as predictors ofwater quality in glacial/boreal lakes, J. Hydrol., 207, 189–203, 1998.
Uhl, C., and C. F. Jordan, Succession and nutrient dynamics followingforest cutting and burning in Amazonia, Ecology, 65, 1476–1490,1984.
Vitousek, P. M., and W. A. Reiners, Ecosystem succession and nutrientretention: A hypothesis, BioScience, 25, 376–381, 1975.
Vitousek, P. M., and R. L. J. Sanford, Nutrient cycling in moist tropicalforest, Annu. Rev. Ecol. Syst., 17, 137–167, 1986.
Weinhold, D., Estimating the loss of agricultural productivity in the Ama-zon, Ecol. Econ., 31, 63–76, 1999.
Williams, M. R., and J. M. Melack, Solute export from forested and par-tially deforested catchments in the central Amazon, Biogeochemistry, 38,67–102, 1997.
Withers, P. J. A., H. G. McDonald, K. A. Smith, and C. G. Chumbley,Behaviour and impact of cow slurry beneath a storage lagoon, 1, Ground-water contamination 1975–1982, Water Air Soil Pollut., 107, 35–49,1998.
����������������������������T. W. Biggs, Department of Geography, University of California, Santa
Barbara, CA 93106, USA. ([email protected])T. F. Domingues, Department of Biology, University of Utah, Salt Lake
City, UT 84112-0840, USA.T. Dunne, Donald Bren School of Environmental Science and Manage-
ment and Department of Geological Sciences, University of California,Santa Barbara, CA 93106, USA.
L. A. Martinelli, Centro de Energia Nuclear na Agricultura, AvenidaCentenario 303, Piracicaba-SP, 13416-000, Brazil.
25 - 16 BIGGS ET AL.: NATURAL AND HUMAN CONTROLS STREAM CHEMISTRY