relationships between indoor and outdoor air pollution
17
RELATIONSHIPS BETWEEN INDOOR AND OUTDOOR AIR POLLUTION DAVID BRODAY Indoor Air Quality and Health – Environmental and Health Fund – 14/9/2021
-
Upload
khangminh22 -
Category
Documents
-
view
0 -
download
0
Transcript of relationships between indoor and outdoor air pollution

RELATIONSHIPS BETWEEN INDOOR AND OUTDOOR AIR POLLUTION
DAVID BRODAY
Indoor Air Quality and Health – Environmental and Health Fund – 14/9/2021

(Steinle et al., 2015)Indoor Air Quality matters
(not only in countries that use open
fire for cooking and/or heating)
NO2 concentration (ppb) Daily exposure to NO2
(Shafran-Nathan et al., 2018)

Indoor and outdoor air pollutants are subjected to distinct
processes
(Nazaroff et al., Atmospheric Environment, 2003; Weschler, Indoor Air, 2011)
Photochemistry is less importantphoton flux is lower (w/ different spectral distribution).
No precipitation scavenging indoors.
Engineered air cleaning devices only indoors
OutdoorIndoorAttribute
(heterogenous/
homogenous chemistry)
(heterogeneous/ surface
chemistry – faster)
Surface-to-volume ratio
(unlimited)
(limited due to economic
considerations)
Air exchange rate/ fresh
air/ ventilation
summerwinterT
wintersummerRH
Photochemistry
OHO3 Leading oxidant
wet deposition/
scavenging
dry deposition/ HVAC systems
(desorption)
Removal
windhuman activitiesResuspension
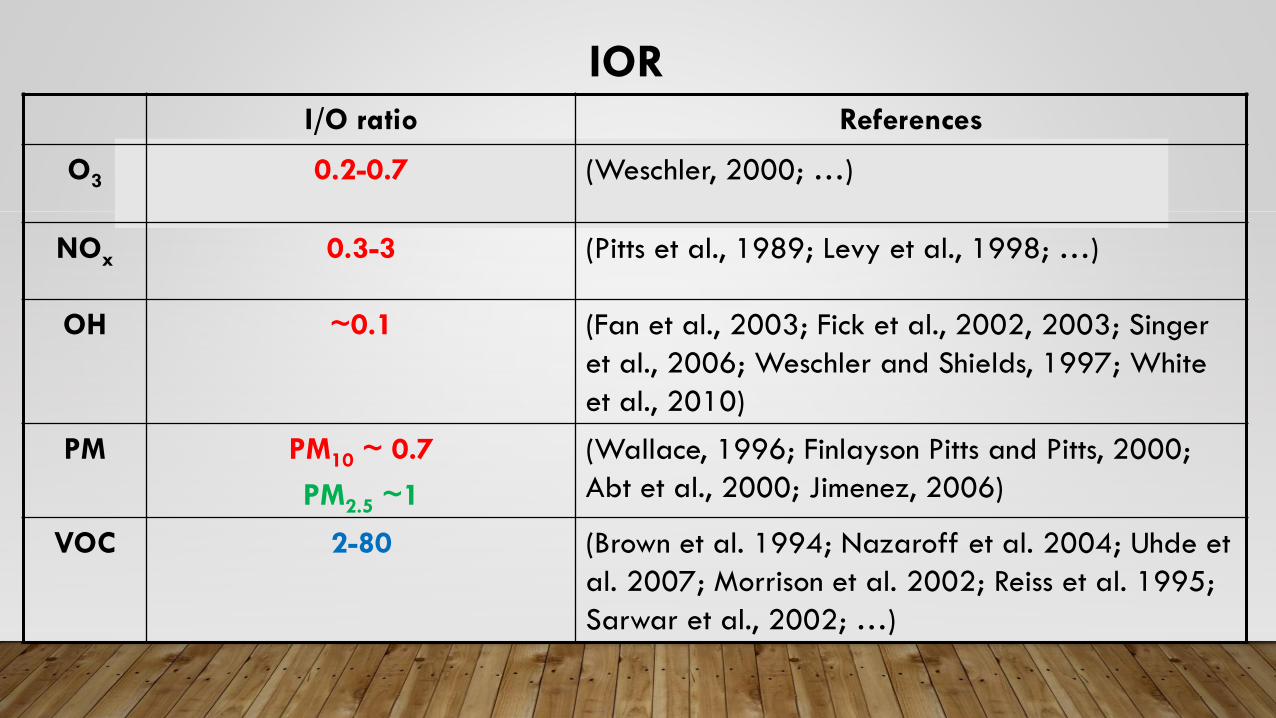
I/O ratio References
O3 0.2-0.7 (Weschler, 2000; …)
NOx 0.3-3 (Pitts et al., 1989; Levy et al., 1998; …)
OH ~0.1 (Fan et al., 2003; Fick et al., 2002, 2003; Singer
et al., 2006; Weschler and Shields, 1997; White
et al., 2010)
PM PM10 ~ 0.7
PM2.5 ~1
(Wallace, 1996; Finlayson Pitts and Pitts, 2000;
Abt et al., 2000; Jimenez, 2006)
VOC 2-80 (Brown et al. 1994; Nazaroff et al. 2004; Uhde et
al. 2007; Morrison et al. 2002; Reiss et al. 1995;
Sarwar et al., 2002; …)
IOR

(Chan, 2002)
What affects the
IOR
(PM4 & NOx; classroom in HK)

What affects IOR?(office in HBA at small mechanics shop area)

IOR varies (i.e. is a stochastic variable)
D: 6 - 18
N: 18 - 6
WD: Sun - Thu
WE: Fri - Sat
Diff. Stat. sig.
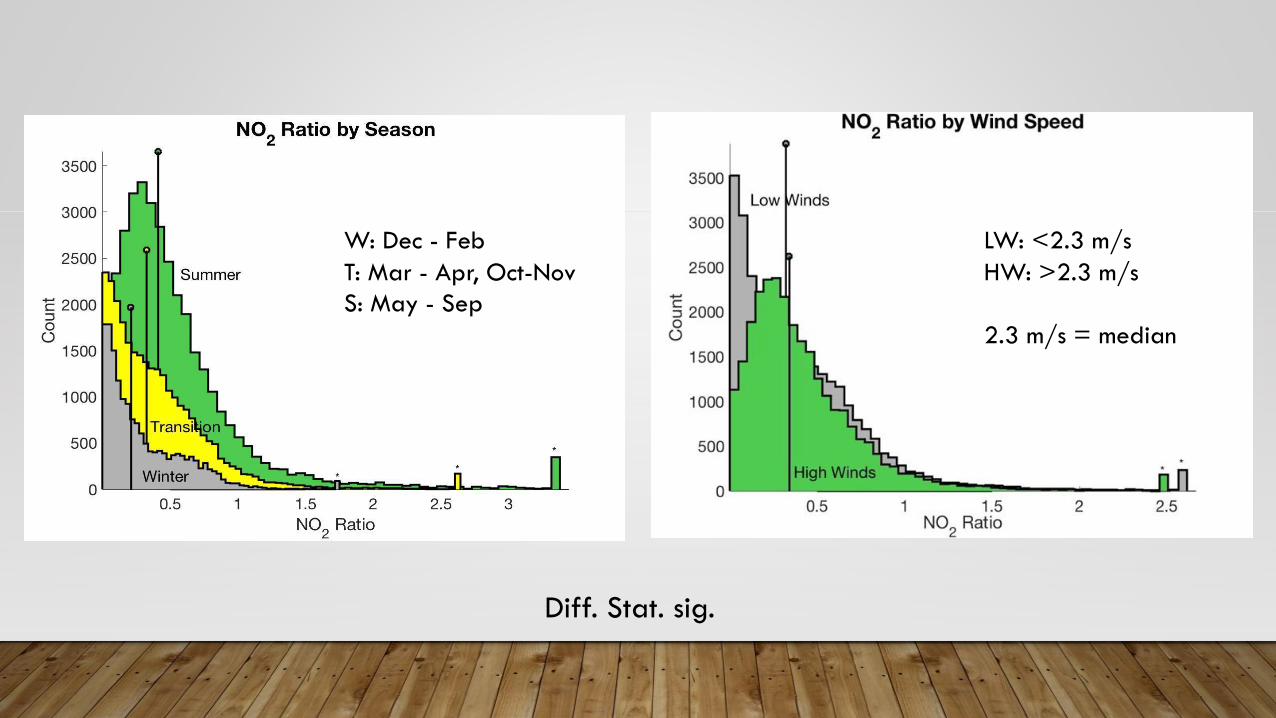
W: Dec - Feb
T: Mar - Apr, Oct-Nov
S: May - Sep
LW: <2.3 m/s
HW: >2.3 m/s
2.3 m/s = median
Diff. Stat. sig.

LT: <25% percentile
MHT: > 25% percentile
25% percentile = 16.3 oC
Diff. Stat. sig.
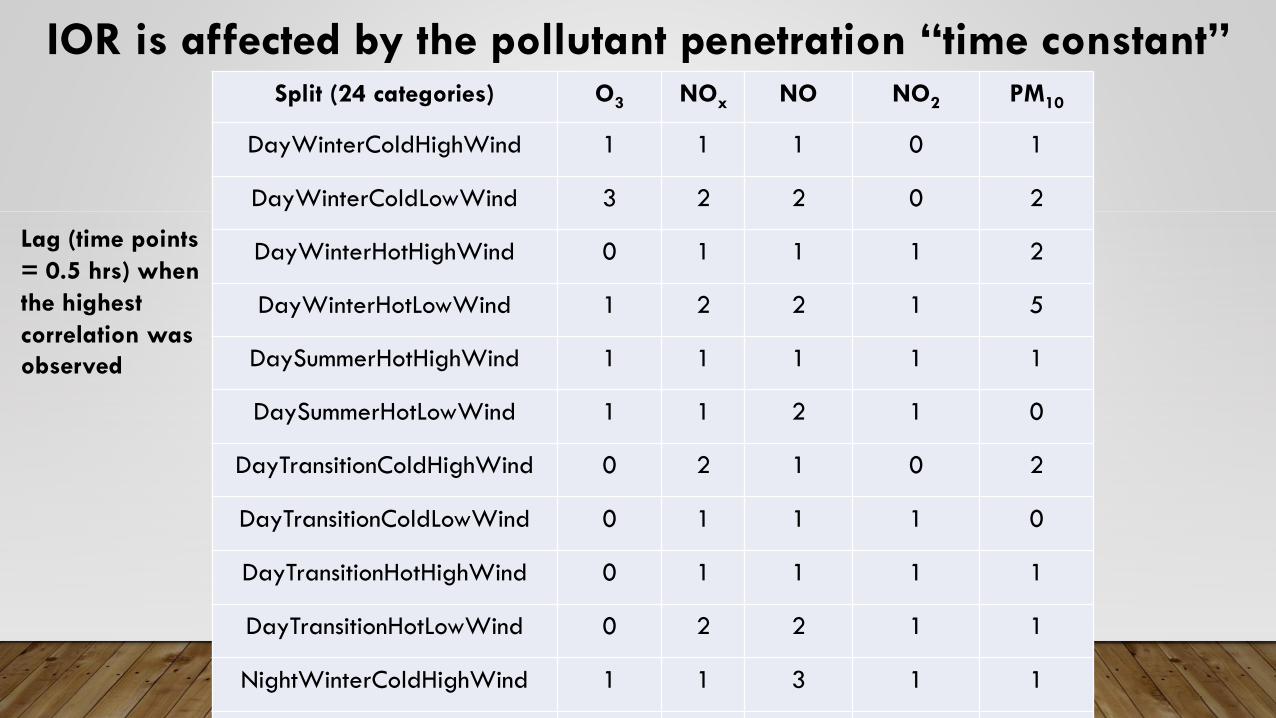
Split (24 categories) O3 NOx NO NO2 PM10
DayWinterColdHighWind 1 1 1 0 1
DayWinterColdLowWind 3 2 2 0 2
DayWinterHotHighWind 0 1 1 1 2
DayWinterHotLowWind 1 2 2 1 5
DaySummerHotHighWind 1 1 1 1 1
DaySummerHotLowWind 1 1 2 1 0
DayTransitionColdHighWind 0 2 1 0 2
DayTransitionColdLowWind 0 1 1 1 0
DayTransitionHotHighWind 0 1 1 1 1
DayTransitionHotLowWind 0 2 2 1 1
NightWinterColdHighWind 1 1 3 1 1
NightWinterColdLowWind 0 4 4 2 1
IOR is affected by the pollutant penetration “time constant”
Lag (time points
= 0.5 hrs) when
the highest
correlation was
observed

N,S,MHT
D,S
N,S.LT,HW
D,S,LT,HWD,T,MHT,HW
D,S,MHT,HW
IOR variability
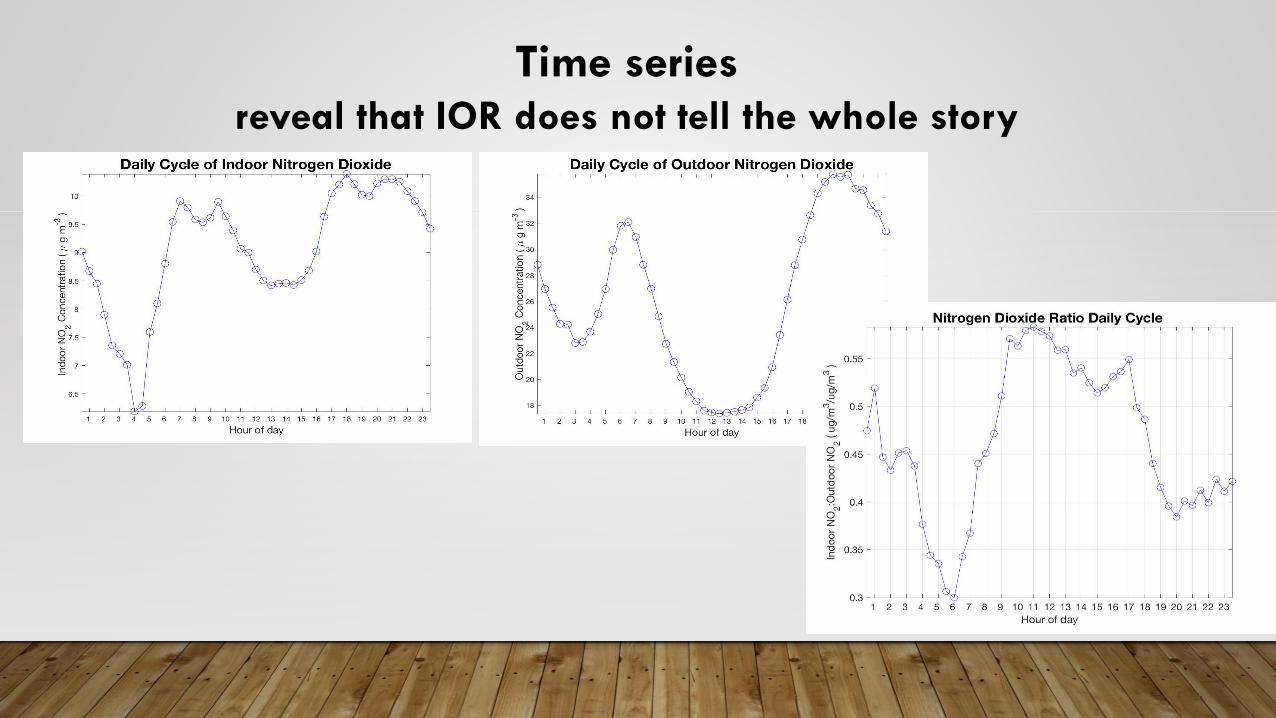
Time seriesreveal that IOR does not tell the whole story
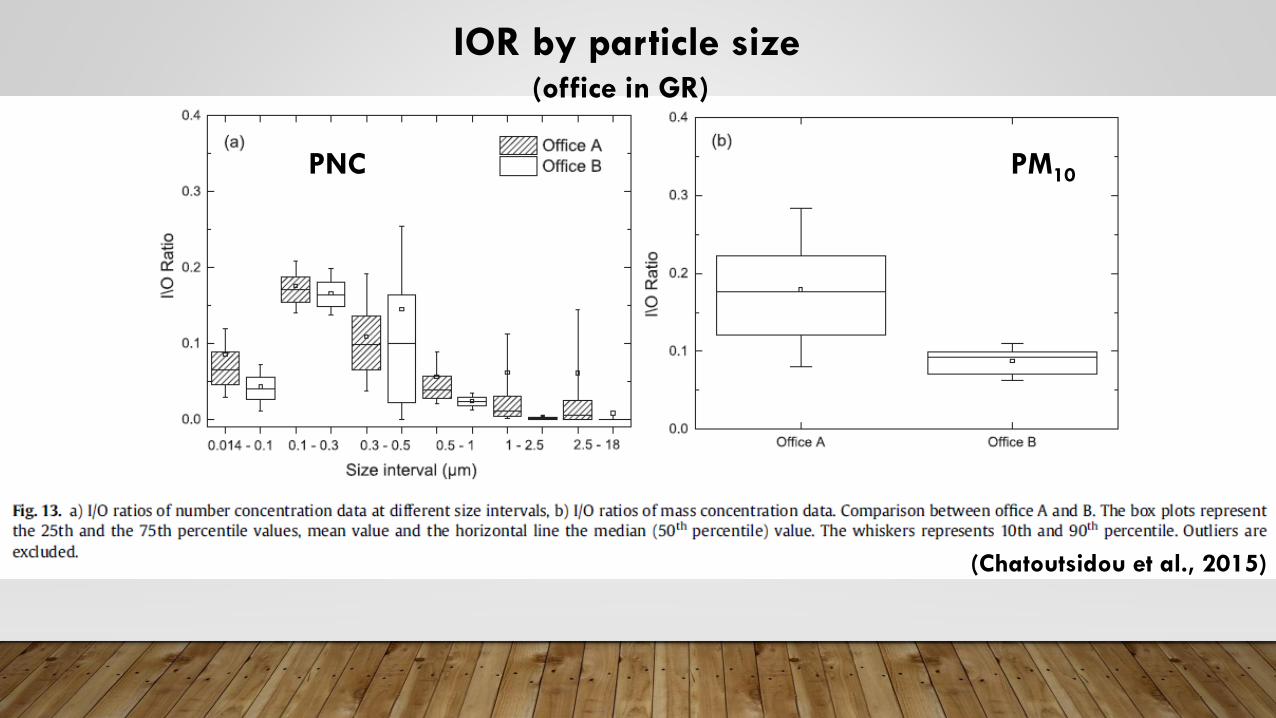
(Chatoutsidou et al., 2015)
PM10PNC
IOR by particle size(office in GR)

Physical drivers that affect IOR
and pollutant transport in built
environments
What affects the IOR?

Physical drivers of IOR and pollutant transport
Tin > Tout
TinTout Tout Tin
Tin < Tout
Pout Pin
Cold air
Hot air

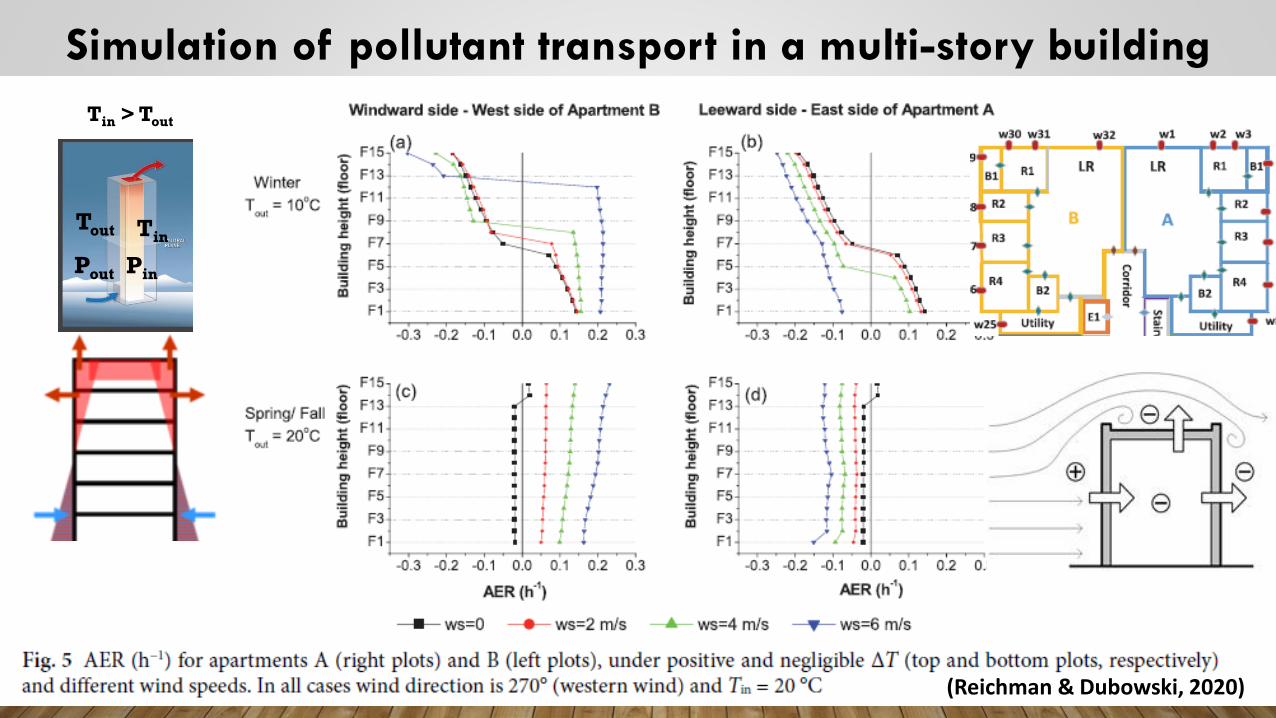
(Reichman & Dubowski, 2020)
Simulation of pollutant transport in a multi-story building
Tin > Tout
TinTout
Pout Pin