Outdoor Activity Outdoor maths - 2,00-3.00pm - Look in the pack

BioMed CentralEnvironmental Health
ss
Open AcceResearchChronic exposure to outdoor air pollution and diagnosed cardiovascular disease: meta-analysis of three large cross-sectional surveysLindsay JL Forbes*1, Minal D Patel1, Alicja R Rudnicka1, Derek G Cook1, Tony Bush2, John R Stedman2, Peter H Whincup1, David P Strachan1 and HR Anderson1Address: 1Division of Community Health Sciences, St George's, University of London, Cranmer Terrace, London SW17 0RE, UK and 2AEA Energy & Environment, The Gemini Building, Fermi Avenue, Harwell, Didcot, Oxfordshire OX11 0QR, UK
Email: Lindsay JL Forbes* - [email protected]; Minal D Patel - [email protected]; Alicja R Rudnicka - [email protected]; Derek G Cook - [email protected]; Tony Bush - [email protected]; John R Stedman - [email protected]; Peter H Whincup - [email protected]; David P Strachan - [email protected]; HR Anderson - [email protected]
* Corresponding author
AbstractBackground: Higher exposure to outdoor air pollution is associated with increased cardiopulmonarydeaths, but there is limited evidence about the association between outdoor air pollution and diagnosedcardiovascular disease. Our study aimed to estimate the size of the association between long termexposure to outdoor air pollution and prevalent cardiovascular disease.
Methods: We carried out a cross-sectional analysis of data on more than 19,000 white adults aged 45and older who participated in three representative surveys of the English population in 1994, 1998 and2003, examining the relationship between self-reported doctor-diagnosed cardiovascular disease andexposure to outdoor air pollutants using multilevel regression techniques and meta-analysis.
Results: The combined estimates suggested that an increase of 1 μg m-3 in concentration of particulatematter less than 10 microns in diameter was associated with an increase of 2.9% (95% CI -0.6% to 6.5%)in prevalence of cardiovascular disease in men, and an increase of 1.6% (95%CI -2.1% to 5.5%) in women.The year-specific analyses showed strongly positive associations in 2003 between odds of cardiovasculardisease in both men and women and exposure to particulate matter but not in 1994 or 1998. We foundno consistent associations between exposure to gaseous air pollutants and doctor-diagnosedcardiovascular disease.
Conclusion: The associations of prevalent cardiovascular disease with concentration of particulatematter less than 10 microns in diameter, while only weakly positive, were consistent with the effectsreported in cohort studies. The results provide evidence of the size of the association between particulateair pollution and the prevalence of cardiovascular disease but no evidence for an association with gaseouspollutants. We found strongly positive associations between particulate matter and cardiovascular diseasein 2003 only, which highlights the importance of replicating findings in more than one population.
Published: 13 July 2009
Environmental Health 2009, 8:30 doi:10.1186/1476-069X-8-30
Received: 9 September 2008Accepted: 13 July 2009
This article is available from: http://www.ehjournal.net/content/8/1/30
© 2009 Forbes et al; licensee BioMed Central Ltd. This is an Open Access article distributed under the terms of the Creative Commons Attribution License (http://creativecommons.org/licenses/by/2.0), which permits unrestricted use, distribution, and reproduction in any medium, provided the original work is properly cited.
Page 1 of 9(page number not for citation purposes)

Environmental Health 2009, 8:30 http://www.ehjournal.net/content/8/1/30
BackgroundHigher outdoor particulate concentration is associatedwith increased cardiopulmonary deaths in cohort stud-ies[1,2]. Many studies have shown short-term associa-tions between air pollution levels and cardiovascularevents up to a few weeks later [3]. However, we havefound no reports of large scale population studies ofchronic exposure to air pollution and cardiovascular mor-bidity rather than mortality, except for a cohort study inwomen which suggested that incidence of cardiovasculardisease in women is increased by exposure to fine partic-ulates [4].
To explore the association between chronic exposure toair pollution and cardiovascular morbidity, we examinedwhether exposure to outdoor air pollutant levels (particu-late matter less than 10 microns in diameter (PM10),nitrogen dioxide (NO2), sulphur dioxide (SO2) and ozone(O3)) was related to the prevalence of self-reported doc-tor-diagnosed cardiovascular disease collected duringthree cross-sectional surveys of the English populationcarried out in 1994, 1998 and 2003.
MethodsParticipants and outcome measuresThe Health Survey for England is a programme of annualsurveys of representative samples of people living in pri-vate households in England. We used data on adults par-ticipating in 1994, 1998 and 2003, years concentrating oncardiovascular disease and its risk factors.
In each survey year, adults were recruited using a multi-stage sampling strategy designed to generate a representa-tive sample of the English population [5,6]. Briefly, thesampling units were single postcode sectors (each con-taining around 2500 addresses; median area about 4square kilometres (km2)), except where the populationwas very sparse, where they consisted of two or moreneighbouring sectors. For each survey year, 720 samplingunits, representing about 10% of the total, were selectedwith a probability proportional to the number ofaddresses within it. From each selected sampling unit, 19addresses were drawn (18 in 1994). All householdswithin those addresses were invited to take part, unlessthey were businesses, institutions or vacant. All adults (upto a maximum of ten) living in each household at thoseaddresses were invited to complete a health question-naire. We considered people to have cardiovascular dis-ease if they said that they had had a heart attack, angina orstroke that had been diagnosed by a doctor.
ExposuresWe have described methods for assigning exposure in ourprevious publication [7]. Briefly, the National Centre forSocial Research provided postcode sector of residence for
all households in the Health Surveys for England in 1994,1998 and 2003. We assumed that annual average pollut-ant exposure for people living in each postcode sector wasthat of the 1 km2 where its centroid was located. We esti-mated annual average background exposure to PM10,NO2, SO2 and O3 for each 1 km2 of England using air dis-persion models using meteorological parameters and anemission inventory [8]. Additional file 1 provides furtherinformation.
Because data collection for each Health Survey is carriedout over the whole year and part of the following year, weaveraged the exposure estimate for each participant foreach pollutant for the data collection year and the previ-ous year, although, as we did not have pollution data for1993, for 1994 we used annual averages for 1994 only.
Statistical analysisThe median number of adults taking part in the HealthSurvey for England living in each postcode sector (thelevel at which pollutant exposure was estimated) was 22in 1994, 21 in 1998 and 21 in 2003. Therefore, we usedmultilevel logistic regression analyses to take account ofthe hierarchical structure of the data with a level for post-code sector. We analysed data on white adults aged 45years or older separately for men and women, to takeaccount of possible clustering of cardiovascular diseasewithin households, but did not allow for household levelin the analysis, because there were few households withmore than one adult aged 45 and older of each sex.
We examined crude associations within each survey yearbetween each pollutant and risk of self-reported doctor-diagnosed cardiovascular disease using multilevel logisticregression analysis with two levels: postcode sectorsformed the upper level and individuals within postcodesector formed the lower level. A random intercept modelwas used allowing for log odds of the outcome to vary bypostcode sector. We then controlled for the followingindividual level potential confounders: age (10-year agegroups); body mass index (quartiles); social class of headof household (UK Registrar General's classification); ciga-rette smoking (never, ex-, current); and region of resi-dence (8 regions).
We carried out fixed effects meta-analysis of the year-spe-cific estimates for each air pollutant using inverse varianceweighting. All analyses were performed using STATA ver-sion 9.2 (STATA Corporation, Texas, USA).
Ethical approvalIn 1994, 1998 and 2003, ethical approval was obtainedfrom all relevant Local and Multi-Centre Research EthicsCommittees by the National Centre for Social Research.Participants provided explicit consent to take part in the
Page 2 of 9(page number not for citation purposes)

Environmental Health 2009, 8:30 http://www.ehjournal.net/content/8/1/30
survey. We obtained approval to link air pollution data toHealth Survey for England data from the National Centrefor Social Research, having undertaken to follow proce-dures to protect participants' identities.
ResultsTable 1 shows the numbers of addresses, households andparticipants relevant to this analysis who took part in theHealth Surveys for England in 1994, 1998 and 2003. Sev-enty five per cent of households (27,143-36,350)approached by the Health Survey for England in thoseyears participated. Ninety-four per cent of people aged 45and older (23,941-25,570) living in those householdscompleted a questionnaire. Ninety six per cent of these(23,036-23,941) belonged to white ethnic groups (theethnic group of people who did not complete a question-naire is not known) and data on presence or absence ofreported diagnosed cardiovascular disease were availablefor all but six of these.
Among white adults aged 45 and older, over the periodstudied, we found an increase in the proportions belong-ing to non-manual social classes (45.6% in 1994 to 53.1%in 2003); a decrease in the proportion who currentlysmoked (22.4% in 1994 to 19.0% in 2003); and anincrease in the proportion with a body mass index greaterthan 30 kg m-2 (18.4% in 1994 to 23.7% in 2003). Wefound a small increase in the prevalence of cardiovasculardisease in white people aged 45 and older over the periodstudied (12.1% in 1994 to 13.7% in 2003). In each of thesurvey years, prevalence of cardiovascular disease
increased with increasing age, lower social class, increas-ing body mass index and smoking (Table 2).
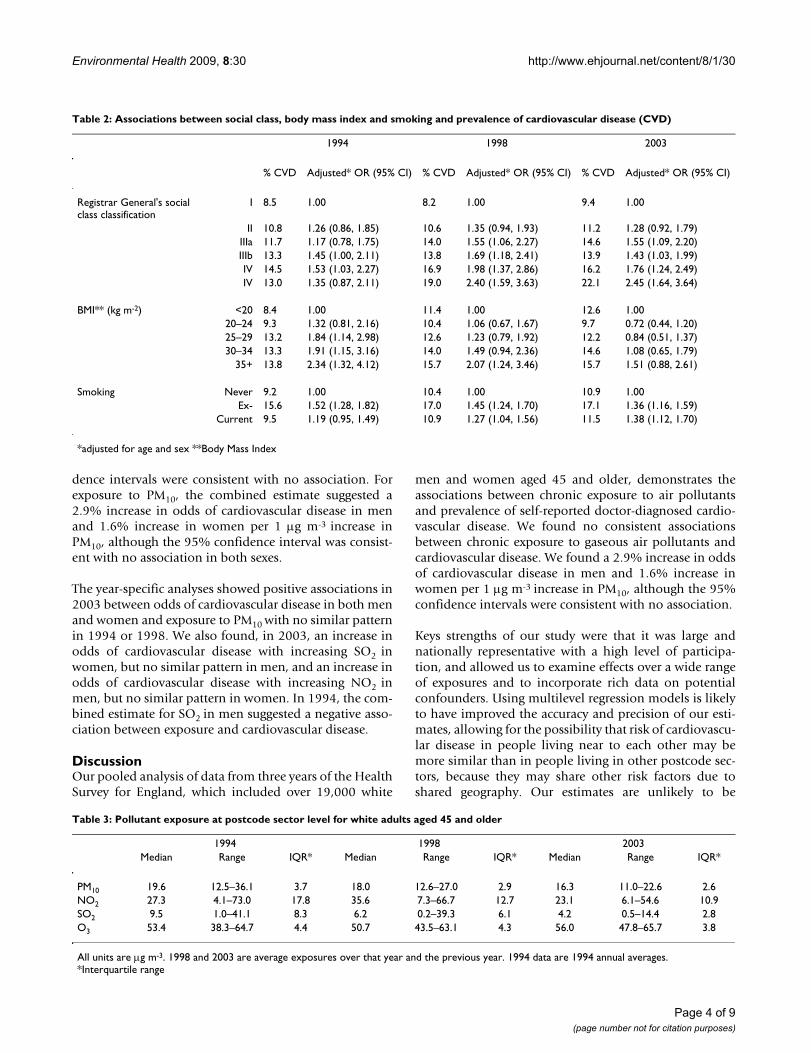
We had data on air pollution exposure for 93% of whiteadults aged 45 and older in 1994, 96% in 1998 and 99%in 2003. Table 3 shows summary statistics of outdoor airpollution exposure estimates at postcode sector level, forparticipating white adults aged 45 and older. For all pol-lutants, the variation across England became less markedbetween 1994 and 2003.
Average PM10 and SO2 concentrations fell over the period.NO2 concentrations increased between 1994 and 1998and fell to a lower level in 2003. We saw the opposite pat-tern for O3.
Tables 4 and 5 provide crude and adjusted results of mul-tilevel models estimating the associations between each ofthe four pollutants and prevalence of diagnosed cardio-vascular disease for each survey year, and the results of themeta-analysis. Figures 1 and 2 summarise the adjustedestimates as forest plots. Our results are presented per 1 μgm-3 increase in concentration. In 2003, a 1 μg m-3 increasein concentration would have represented about 1/2 to 1/3 of the interquartile range of PM10, about 1/11 of theinterquartile range of NO2, about 1/3 of the interquartilerange of SO2 and about 1/4 of the interquartile range ofO3.
The combined estimates per 1 μg m-3 increase in concen-tration of gaseous pollutants were small and all confi-
Table 1: Participants in the Health Survey for England 1994, 1998 and 2003
1994 1998 2003 All
Sampling units 720 720 720
Addresses selected within sampling units 12,960 13,680 13,680 40,320
Eligible addresses* 11,515 12,250 12,036 35,801
Eligible households† 11,709 12,446 12,195 36,350
Co-operating households** 9,068 9,208 8,867 27,143
Adults aged 45+ living in co-operating households 8,257 8,688 8,625 25,570
Adults aged 45+ who completed individual questionnaire 7,751 8,181 8,009 23,941
White adults aged 45+ who completed individual questionnaire 7,492 7,908 7,636 23,036
White adults with data on cardiovascular disease prevalence 7,492 7,906 7,632 23,030
*ineligible addresses were those where no private households were found† at some addresses has more than one household was resident there**defined as households where at least one adult completed a questionnaire
Page 3 of 9(page number not for citation purposes)
Environmental Health 2009, 8:30 http://www.ehjournal.net/content/8/1/30
dence intervals were consistent with no association. Forexposure to PM10, the combined estimate suggested a2.9% increase in odds of cardiovascular disease in menand 1.6% increase in women per 1 μg m-3 increase inPM10, although the 95% confidence interval was consist-ent with no association in both sexes.
The year-specific analyses showed positive associations in2003 between odds of cardiovascular disease in both menand women and exposure to PM10 with no similar patternin 1994 or 1998. We also found, in 2003, an increase inodds of cardiovascular disease with increasing SO2 inwomen, but no similar pattern in men, and an increase inodds of cardiovascular disease with increasing NO2 inmen, but no similar pattern in women. In 1994, the com-bined estimate for SO2 in men suggested a negative asso-ciation between exposure and cardiovascular disease.
DiscussionOur pooled analysis of data from three years of the HealthSurvey for England, which included over 19,000 white
men and women aged 45 and older, demonstrates theassociations between chronic exposure to air pollutantsand prevalence of self-reported doctor-diagnosed cardio-vascular disease. We found no consistent associationsbetween chronic exposure to gaseous air pollutants andcardiovascular disease. We found a 2.9% increase in oddsof cardiovascular disease in men and 1.6% increase inwomen per 1 μg m-3 increase in PM10, although the 95%confidence intervals were consistent with no association.
Keys strengths of our study were that it was large andnationally representative with a high level of participa-tion, and allowed us to examine effects over a wide rangeof exposures and to incorporate rich data on potentialconfounders. Using multilevel regression models is likelyto have improved the accuracy and precision of our esti-mates, allowing for the possibility that risk of cardiovascu-lar disease in people living near to each other may bemore similar than in people living in other postcode sec-tors, because they may share other risk factors due toshared geography. Our estimates are unlikely to be
Table 2: Associations between social class, body mass index and smoking and prevalence of cardiovascular disease (CVD)
1994 1998 2003
% CVD Adjusted* OR (95% CI) % CVD Adjusted* OR (95% CI) % CVD Adjusted* OR (95% CI)
Registrar General's social class classification
I 8.5 1.00 8.2 1.00 9.4 1.00
II 10.8 1.26 (0.86, 1.85) 10.6 1.35 (0.94, 1.93) 11.2 1.28 (0.92, 1.79)IIIa 11.7 1.17 (0.78, 1.75) 14.0 1.55 (1.06, 2.27) 14.6 1.55 (1.09, 2.20)IIIb 13.3 1.45 (1.00, 2.11) 13.8 1.69 (1.18, 2.41) 13.9 1.43 (1.03, 1.99)IV 14.5 1.53 (1.03, 2.27) 16.9 1.98 (1.37, 2.86) 16.2 1.76 (1.24, 2.49)IV 13.0 1.35 (0.87, 2.11) 19.0 2.40 (1.59, 3.63) 22.1 2.45 (1.64, 3.64)
BMI** (kg m-2) <20 8.4 1.00 11.4 1.00 12.6 1.0020–24 9.3 1.32 (0.81, 2.16) 10.4 1.06 (0.67, 1.67) 9.7 0.72 (0.44, 1.20)25–29 13.2 1.84 (1.14, 2.98) 12.6 1.23 (0.79, 1.92) 12.2 0.84 (0.51, 1.37)30–34 13.3 1.91 (1.15, 3.16) 14.0 1.49 (0.94, 2.36) 14.6 1.08 (0.65, 1.79)
35+ 13.8 2.34 (1.32, 4.12) 15.7 2.07 (1.24, 3.46) 15.7 1.51 (0.88, 2.61)
Smoking Never 9.2 1.00 10.4 1.00 10.9 1.00Ex- 15.6 1.52 (1.28, 1.82) 17.0 1.45 (1.24, 1.70) 17.1 1.36 (1.16, 1.59)
Current 9.5 1.19 (0.95, 1.49) 10.9 1.27 (1.04, 1.56) 11.5 1.38 (1.12, 1.70)
*adjusted for age and sex **Body Mass Index
Table 3: Pollutant exposure at postcode sector level for white adults aged 45 and older
1994 1998 2003Median Range IQR* Median Range IQR* Median Range IQR*
PM10 19.6 12.5–36.1 3.7 18.0 12.6–27.0 2.9 16.3 11.0–22.6 2.6NO2 27.3 4.1–73.0 17.8 35.6 7.3–66.7 12.7 23.1 6.1–54.6 10.9SO2 9.5 1.0–41.1 8.3 6.2 0.2–39.3 6.1 4.2 0.5–14.4 2.8O3 53.4 38.3–64.7 4.4 50.7 43.5–63.1 4.3 56.0 47.8–65.7 3.8
All units are μg m-3. 1998 and 2003 are average exposures over that year and the previous year. 1994 data are 1994 annual averages.*Interquartile range
Page 4 of 9(page number not for citation purposes)

Environmental Health 2009, 8:30 http://www.ehjournal.net/content/8/1/30
affected by clustering of cardiovascular disease withinhouseholds because we estimated associations in menand women separately.
Response was high to each level of request to participatein the Health Survey for England: 75% of householdsapproached participated; 91% of adults living in partici-pating households completed a questionnaire; and wehad air pollution data available on more than 93% of thepeople included in our analysis. However, we had verylimited information available about households who didnot participate and adults who did not complete a ques-tionnaire with which to assess the effect of non-responseon our results.
All methods of estimating individual exposure to air pol-lutants will misclassify individual exposure to a degree,because measuring actual exposure is impractical, espe-cially in large scale studies. Most commonly, researchershave used monitoring station data to assign exposure toall individuals living in large areas, which are likely toreflect individual exposure poorly. Other researchers haveused population density[2] or estimated traffic exposureto improve on these [9]. Our method of estimating indi-vidual exposure to outdoor air pollutants may be moreaccurate because it takes account many influences on airpollution levels. We estimated exposure using compre-hensive emission inventories combined with air disper-sion models taking into account meteorologicalinformation [8]. The emission inventories were con-
Forest plots of results of multilevel logistic regression models of associations between pollutant exposure and diagnosed cardi-ovascular disease in menFigure 1Forest plots of results of multilevel logistic regression models of associations between pollutant exposure and diagnosed cardiovascular disease in men. Horizontal lines correspond to 95% CI of estimated percentage change in odds of cardiovascular disease. Combined estimates are derived from fixed effects meta-analysis of year-specific estimates using inverse variance weighting. The size of the squares reflects the inverse variance of each year and, therefore, the weighting in the combined estimate. All estimates are adjusted for age (10 year age groups), social class of head of household (6 groups), body mass index (quartiles), cigarette smoking (never, ex-, current, and region of residence (8 groups), all as categorical varia-bles.
Percentage change in odds of diagnosed cardiovascular disease per 1�g m-3 increase in pollutant exposure
SO2 O3
PM10 NO2
Page 5 of 9(page number not for citation purposes)

Environmental Health 2009, 8:30 http://www.ehjournal.net/content/8/1/30
structed using information on any influence on air pollu-tion levels likely to have a measurable effect (includingpopulation density, emissions from roads from a combi-nation of traffic activity data, type of vehicle, railways, air-ports, industry and domestic heating) [10], and enabledus to account directly for dispersion and processes in theatmosphere, providing added value over monitoring sta-tion data or simple land use methods examining only ahandful of influences on air pollution levels. We used amore empirical approach to model ozone concentrations[11]. A comparison of modelled estimates with independ-ent data from local authority monitoring sites showedgood correlation for NO2 (r2 = 0.85)[12] and O3 (r2 =0.81–0.89),[13] and reasonable correlation for PM10 (r2 =0.32–0.34)[12].
For people living very close to main roads, proximity tothe road may be a better determinant of exposure thanmodelled levels. People living less than 50 metres from amain road have an increased prevalence of coronary arterycalcification, a predictor of coronary events [14]. While wedid not incorporate data on distance of residence frommain road this is unlikely to have influenced our results:people living so close to main roads for this to be animportant influence on health make up a very small pro-portion of the population and most of the fall in levels inparticulate matter occurs within the first 10 metres fromthe road [15].
We did not have measures of fine particulates (particulatematter less than 2.5 μm in diameter (PM2.5) which are
Forest plots of results of multilevel logistic regression models of associations between pollutant exposure and diagnosed cardi-ovascular disease in womenFigure 2Forest plots of results of multilevel logistic regression models of associations between pollutant exposure and diagnosed cardiovascular disease in women. Horizontal lines correspond to 95% CI of estimated percentage change in odds of cardiovascular disease. Combined estimates are derived from fixed effects meta-analysis of year-specific estimates using inverse variance weighting. The size of the squares reflects the inverse variance of each year and, therefore, the weighting in the combined estimate. All estimates are adjusted for age (10 year age groups), social class of head of household (6 groups), body mass index (quartiles), cigarette smoking (never, ex-, current, and region of residence (8 groups), all as categorical varia-bles.
PM10 NO2
SO2 O3
Percentage change in odds of diagnosed cardiovascular disease per 1�g m-3 increase in pollutant exposure
Page 6 of 9(page number not for citation purposes)

Environmental Health 2009, 8:30 http://www.ehjournal.net/content/8/1/30
thought to be the most toxic. There are very few PM2.5measurements in the UK on which to assess exposure.Studies comparing levels of PM10 and PM2.5 in the UKhave found them to be strongly associated: Harrison andcolleagues found strong correlations between hourlyPM10 and PM2.5 measurements at five monitoring sites inthe UK (r2 of between 0.59 and 0.94) [16]. The PM2.5/PM10 ratio varied from 0.63 to 0.73. Moreover, some ofthe most influential studies have found relationships
between cardiovascular mortality and PM10 that are simi-lar to those with PM2.5[1]
We believe that participant-reported doctor-diagnosedangina, heart attack or stroke is a valid measure of cardio-vascular disease. It was related to known risk factors as wewould expect. In the British Regional Heart Study, studyparticipants' reports of stroke and heart attack showed
Table 4: Associations between pollutant exposure and cardiovascular disease in men
1994 1998 2003 Combined estimate*n % increase (95% CI) n % increase (95% CI) n % increase (95% CI) n % increase (95% CI)
PM10 Crude 3073 -1.79 3427 -1.32 3331 8.24(-5.78, 2.36) (-5.60, 3.15) (2.95, 13.81)
Adjusted 2823 1.46 3034 0.16 2913 9.22 8770 2.88(-3.55, 6.73) (-6.10, 6.84) (1.72, 17.26) (-0.64, 6.51)
NO2 Crude 3073 -0.54 3427 -0.18 3331 2.53(-1.45, 0.37) (-1.23, 0.88) (1.25, 3.82)
Adjusted 2823 -0.21 3034 -0.08 2913 2.24 8770 0.37(-1.45, 1.04) (-1.47, 1.33) (0.47, 4.03) (-0.45, 1.20)
SO2 Crude 3073 -1.27 3427 1.12 3343 5.09(-2.83, 0.33) (-0.75, 3.02) (0.51, 9.88)
Adjusted 2823 -2.33 3034 0.42 2924 1.47 8781 -0.97(-4.35, -0.27) (-1.94, 2.83) (-4.43, 7.74) (-2.47, 0.54)
O3 Crude 3042 0.85 3405 0.62 3313 -2.33(-1.30, 3.03) (-2.04, 3.35) (-5.30, 0.74)
Adjusted 2785 0.35 3012 3.45 2903 -4.12 8700 0.33(-2.64, 3.43) (-0.50, 7.56) (-8.55, 0.51) (-1.79, 2.49)
Estimates are % increase in odds of cardiovascular disease with 1 μg m-3 increase in pollutant concentrationAdjusted estimates are adjusted for age (10 year age groups), social class of head of household (6 groups), body mass index (quartiles), cigarette smoking (never, ex-, current, and region of residence (8 groups), all as categorical variables*Combined estimate is derived from a fixed effects meta-analysis of year-specific estimates using inverse variance weighting.
Table 5: Associations between pollutant exposure and cardiovascular disease in women
1994 1998 2003 Combined estimate*n % increase (95% CI) n % increase (95% CI) n % increase (95% CI) n % increase (95% CI)
PM10 Crude 3904 1.63 4202 -0.89 4182 6.47(-2.52, 5.96) (-5.26, 3.67) (1.09, 12.15)
Adjusted 3385 1.02 3596 -2.91 3469 8.63 10440 1.61(-4.14, 6.47) (-9.62, 4.30) (0.58, 17.32) (-2.10, 5.45)
NO2 Crude 3904 0.12 4202 0.34 4182 1.78(-0.79, 1.04) (-0.75, 1.44) (0.44, 3.13)
Adjusted 3385 -0.10 3596 -0.27 3469 1.55 10440 0.18(-1.35, 1.16) (-1.83, 1.31) (-0.39, 3.53) (-0.69, 1.07)
SO2 Crude 3904 0.30 4202 2.01 4197 10.46(-1.24, 1.86) (0.16, 3.90) (5.72, 15.40)
Adjusted 3385 -0.34 3596 1.32 3482 8.35 10463 0.80(2.34, 1.70) (-1.22, 3.92) (1.98, 15.12) (-0.73, 2.36)
O3 Crude 3851 -0.60 4169 -0.04 4153 -3.21(-2.76, 1.60) (-2.79, 2.79) (-6.20, -0.12)
Adjusted 3333 0.51 3568 1.55 3453 0.23 10354 0.74(-2.64, 3.75) (-2.72, 6.00) (-4.70, 5.43) (-1.53, 3.07)
Estimates are % increase in odds of cardiovascular disease with 1 μg m-3 increase in pollutant concentrationAdjusted estimates are adjusted for age (10 year age groups), social class of head of household (6 groups), body mass index (quartiles), cigarette smoking (never, ex-, current, and region of residence (8 groups), all as categorical variables*Combined estimate is derived from a fixed effects meta-analysis of year-specific estimates using inverse variance weighting.
Page 7 of 9(page number not for citation purposes)
Environmental Health 2009, 8:30 http://www.ehjournal.net/content/8/1/30
high levels of agreement with reports of stroke and heartattack from primary care records [17].
We are unable to explain why the estimates of associationbetween cardiovascular disease and some of the measuresof air pollution were most marked in 2003. We found nodifferences in the characteristics of the participants ortheir exposure (for example, regional effects) that couldexplain it. We have considered that there could have beensomething unusual about particle constituents in 2003that could have caused this, but the absence of regionaleffects make this unlikely. We conclude that the strikingfindings in 2003 may be due to chance variation. If wehad presented only the 2003 data, our conclusions wouldhave been very different, suggesting a 90% increase inprevalence of cardiovascular disease per 10 μg m-3 increasein PM10; in other words, large effects that would have beenconsidered newsworthy. This highlights the importance ofreplicating findings in more than one population beforedrawing firm conclusions, and the pitfalls of selectivepublication. Publication bias has been demonstrated instudies of short term associations between air pollutionand health effects [18].
The UK Committee on the Medical Effects of Air Pollutionhas estimated that the excess risk of cardiopulmonarydeath associated with a 10 μg m-3 increase in PM2.5 is 9%(95% CI 3% to 16%) [19]. Although we examined preva-lence of cardiovascular disease and not cardiopulmonarydeath, the overall effect size we observed is three to sixtimes larger: in England, about two thirds of PM10 is madeup PM2.5 and this varies little across the country; anincreased odds of cardiovascular disease of 2.9% in menand 1.6% in women per 1 μg m-3 increase in PM10 equatesto an increase in odds of cardiovascular disease of 53% inmen and 27% in women per 10 μg m-3 increase in PM2.5.The United States study of cardiovascular events inwomen[4] found an even larger increase in risk of cardio-vascular death per 10 μg m-3 increase in PM2.5 (~80%),although that study's findings on risk of cardiovascularevents were of a similar order to ours (20% increase per 10μg m-3 increase in PM2.5).
ConclusionOur estimates provide some support for other studies ofthe effects of PM10 on cardiovascular disease. The com-bined estimates of all the years' data showed a weakly pos-itive association between PM10 and cardiovascular diseasethat was more consistent than for gaseous pollutants andwas present in both men and women. Variation in year-specific estimates highlights the importance of replicatingfindings in more than one population. We found no con-sistent associations between chronic exposure to gaseousair pollutants and diagnosed cardiovascular disease.
List of abbreviationsCVD: cardiovascular disease; PM10: particulate matter lessthan 10 microns in diameter; PM2.5: particulate matterless than 2.5 microns in diameter; NO2: nitrogen dioxide;SO2: sulphur dioxide; O3: ozone; μg m-3: microgrammesper cubic meter; km2: square kilometre; kg m-2: kilo-gramme per square metre; IQR: interquartile range; OR:odds ratio; CI: confidence interval.
Competing interestsThe authors declare that they have no competing interests.
Authors' contributionsLF designed the study, co-led the analysis and drafted thepaper. MP contributed to design, performed the statisticalanalyses, and contributed to drafting the paper. AR con-tributed to design, co-led statistical analysis, and contrib-uted to drafting the paper
DC contributed to design and conception of the study, theanalysis and interpretation, and critically reviewed thepaper. DS contributed to design and conception of thestudy, the analysis and interpretation of the data, and crit-ically reviewed the paper. TB contributed to design of thestudy, did analyses of air pollution data, and criticallyreviewed the paper
JS contributed to design of the study, did analyses of airpollution data, and critically reviewed the paper. PW con-tributed to design and conception of the study, contrib-uted to interpretation of the data, and critically reviewedthe paper. HRA contributed to design and conception ofthe study, contributed to interpretation of the data, andcritically reviewed the paper. All authors read andapproved the final manuscript.
Additional material
AcknowledgementsClaire Deverill, National Centre for Social Research, for providing data on postcode sector for the Health Survey for England participants. Funding: Department of Health, UK
The views expressed in this paper are those of the authors and not neces-sarily those of the funding agencies. The authors are independent of funders.
Additional file 1Models for estimating exposure to air pollutants. Further details of modelling exposure to air pollutants: emission inventories, modelling methods and validation.Click here for file[http://www.biomedcentral.com/content/supplementary/1476-069X-8-30-S1.doc]
Page 8 of 9(page number not for citation purposes)

Environmental Health 2009, 8:30 http://www.ehjournal.net/content/8/1/30
Publish with BioMed Central and every scientist can read your work free of charge
"BioMed Central will be the most significant development for disseminating the results of biomedical research in our lifetime."
Sir Paul Nurse, Cancer Research UK
Your research papers will be:
available free of charge to the entire biomedical community
peer reviewed and published immediately upon acceptance
cited in PubMed and archived on PubMed Central
yours — you keep the copyright
Submit your manuscript here:http://www.biomedcentral.com/info/publishing_adv.asp
BioMedcentral
Disclaimer: Data from the Health Survey for England are Crown Copyright and were used by permission of the Department of Health, UK Office for National Statistics and the Data Archive, University of Essex, England. Nei-ther the Department of Health, the Data Archive nor the Office for National Statistics bear any responsibility for the analysis and interpretation presented here.
References1. Pope CA III, Burnett RT, Thun MJ, Calle EE, Krewski D, Ito K,
Thurston GD: Lung cancer, cardiopulmonary mortality, andlong-term exposure to fine particulate air pollution. JAMA2002, 287:1132-1141.
2. Hoek G, Brunekreef B, Goldbohm S, Fischer P, Brandt PA van den:Association between mortality and indicators of traffic-related air pollution in the Netherlands: a cohort study. Lan-cet 2002, 360:1203-1209.
3. Committee on the Medical Effects of Air Pollutants: Cardiovasculardisease and air pollution. A report by the Committee on theMedical Effects of Air Pollutants. London, Department ofHealth; 2006.
4. Miller KA, Siscovick DS, Sheppard L, Shepherd K, Sullivan JH, Ander-son G, Kaufman JD: Long-Term Exposure to Air Pollution andIncidence of Cardiovascular Events in Women. N Engl J Med2007, 356:447-458.
5. Health Survey for England 1994: London, National Centre for SocialResearch, The Stationery Office; 1996.
6. Health Survey for England 2003: Methodology and Documenta-tion. Volume 3. Edited by: Proston K, Primatesta P. London, NationalCentre for Social Research, The Stationery Office; 2004.
7. Forbes L, Patel MD, Rudnicka A, Cook DA, Bush T, Stedman J, Whin-cup PH, Strachan D, Anderson HR: Chronic exposure to outdoorair pollution and markers of systemic inflammation. Epidemi-ology 2009, 20:245-253.
8. Stedman JR, Bush TJ, Vincent KJ, Kent AJ, Grice S, Abbott J: UK airquality modelling for annual reporting 2003 on ambient airquality assessment under Council Directives 96/62/EC, 1999/30/EC and 2000/69/EC. Report AEAT/ENV/R/179 2005 [http://www.airquality.co.uk/archive/reports/cat05/0501121424_dd12003mapsrep4.pdf]. Didcot, Oxfordshire, AEATechnology, National Environmental Technology Centre 23-3-2009
9. Jerrett M, Burnett RT, Ma R, Pope CA III, Krewski D, Newbold KB,Thurston G, Shi Y, Finkelstein N, Calle EE, Thun MJ: Spatial analysisof air pollution and mortality in Los Angeles. Epidemiology2005, 16:727-736.
10. Dore CJ, Watterson JD, Murrells TP, Passant NR, Hobson MM, Bag-gott SL, Thistlethwaite G, Goodwin JWL, King KR, Adams M, DownesMK, Walker C, Coleman PJ, Steward RA, Wagner A, Sturman J,Conolly C, Lawrence H, Li Y, Jackson J, Bush T, Grice S, Brophy N:UK emissions of air pollutants 1970 to 1994. AEAT/ENV/R/23592006 [http://www.airquality.co.uk/archive/reports/cat07/0701221151_Full_Report_NAEI_2004.pdf]. Didcot, Oxfordshire,National Atmospheric Emissions Inventory, AEA Technology,National Environmental Technology Centre 24-3-2009
11. Coyle M, Smith RI, Stedman JR, Weston KJ, Fowler D: Quantifyingthe spatial distribution of surface ozone concentration in theUK. Atmospheric Environment 2002, 36:1013-1024.
12. Kent AJ, Grice S, Stedman JR, Cooke S, Bush T, Vincent KJ, Abbot J:UK air quality modelling for annual reporting 2006 on ambi-ent air quality assessment under Council Directives 96/62/EC, 1999/30/EC and 2000/69/EC. AEA Energy & Environment.Report AEAT/ENV/R/2502 [http://www.airquality.co.uk/archive/reports/cat09/0807231621_dd12006mapsrep_v2.pdf]. 2007 23-3-0009
13. Stedman JR, Kent AJ: An analysis of the spatial patterns ofhealth related surface ozone metrics across the UK in 1995,2003 and 2005. Atmospheric Environment 2008, 42:1702-1716.
14. Hoffmann B, Moebus S, Mohlenkamp S, Stang A, Lehmann N, DraganoN, Schmermund A, Memmesheimer M, Mann K, Erbel R, Jockel KH,for the Heinz Nixdord Recall Study Investigative Group: ResidentialExposure to Traffic Is Associated With Coronary Athero-sclerosis. Circulation 2007, 116:489-496.
15. Particulate matter in the United Kingdom 2005 [http://www.defra.gov.uk/environment/airquality/publications/particulate-
matter/]. London, Air Quality Expert Group, Department of Environ-ment, Food and Rural Affairs 24-3-2009
16. Harrison RM, Yin J, Mark D, Stedman J, Appleby RS, Booker J,Moorcroft S: Studies of the coarse particle (2.5–10 [mu]m)component in UK urban atmospheres. Atmospheric Environment2001, 35:3667-3679.
17. Walker MK, Whincup PH, Shaper AG, Lennon LT, Thomson AG:Validation of patient recall of doctor-diagnosed heart attackand stroke: a postal questionnaire and record review com-parison. Am J Epidemiol 1998, 148:355-361.
18. Anderson HR, Atkinson RW, Peacock JL, Sweeting MJ, Marston L:Ambient particulate matter and health effects: publicationbias in studies of short-term associations. Epidemiology 2005,16:155-163.
19. Committee on the Medical Effects of Air Pollutants: Long-termexposure to air pollution: effect on mortality. A report bythe Committee on the Medical Effects of Air Pollutants.Draft report for comment. London, Department of Health; 2007.
Page 9 of 9(page number not for citation purposes)
Copyright © 2022 FDOKUMEN