A sense of comfort in open space around owner-built houses: the case of Campinas, Brazil

Comfort analysis of an outdoor space using RAYMAN
Tanya Afroz [ 0412012027 ]
A.K.M. Asharafuzzaman [ 0413012003 ]
Redwan Bashar [ 0413012005 ]
ARCH 6105
Environmental Design for Tropical Cities
Dr. Khandaker Shabbir Ahmed
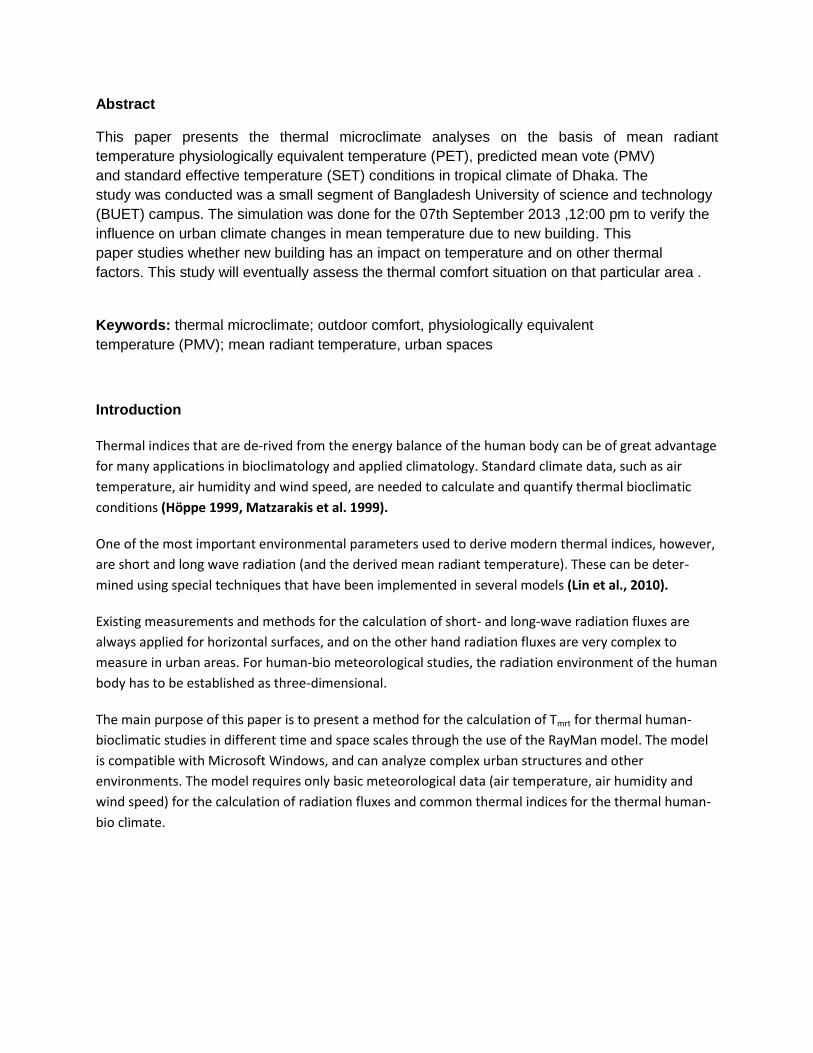
Abstract
This paper presents the thermal microclimate analyses on the basis of mean radiant
temperature physiologically equivalent temperature (PET), predicted mean vote (PMV)
and standard effective temperature (SET) conditions in tropical climate of Dhaka. The
study was conducted was a small segment of Bangladesh University of science and technology
(BUET) campus. The simulation was done for the 07th September 2013 ,12:00 pm to verify the
influence on urban climate changes in mean temperature due to new building. This
paper studies whether new building has an impact on temperature and on other thermal
factors. This study will eventually assess the thermal comfort situation on that particular area .
Keywords: thermal microclimate; outdoor comfort, physiologically equivalent
temperature (PMV); mean radiant temperature, urban spaces
Introduction
Thermal indices that are de-rived from the energy balance of the human body can be of great advantage
for many applications in bioclimatology and applied climatology. Standard climate data, such as air
temperature, air humidity and wind speed, are needed to calculate and quantify thermal bioclimatic
conditions (Höppe 1999, Matzarakis et al. 1999).
One of the most important environmental parameters used to derive modern thermal indices, however,
are short and long wave radiation (and the derived mean radiant temperature). These can be deter-
mined using special techniques that have been implemented in several models (Lin et al., 2010).
Existing measurements and methods for the calculation of short- and long-wave radiation fluxes are
always applied for horizontal surfaces, and on the other hand radiation fluxes are very complex to
measure in urban areas. For human-bio meteorological studies, the radiation environment of the human
body has to be established as three-dimensional.
The main purpose of this paper is to present a method for the calculation of Tmrt for thermal human-
bioclimatic studies in different time and space scales through the use of the RayMan model. The model
is compatible with Microsoft Windows, and can analyze complex urban structures and other
environments. The model requires only basic meteorological data (air temperature, air humidity and
wind speed) for the calculation of radiation fluxes and common thermal indices for the thermal human-
bio climate.
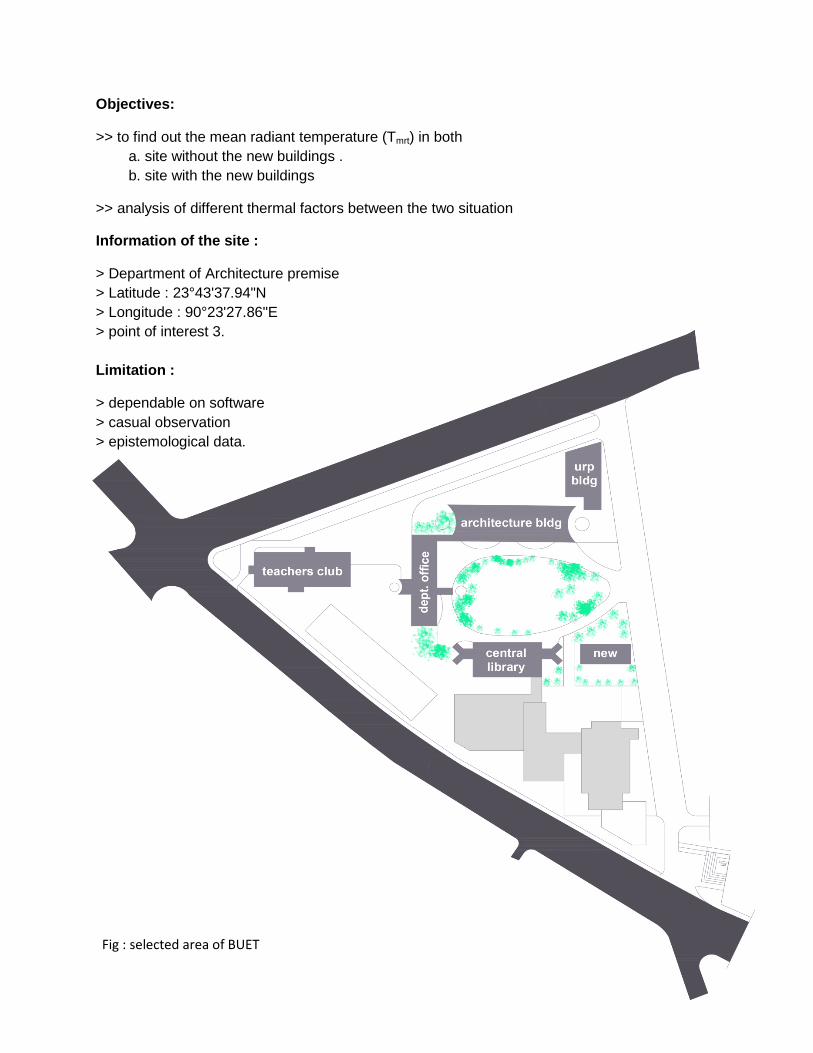
Objectives:
>> to find out the mean radiant temperature (Tmrt) in both
a. site without the new buildings .
b. site with the new buildings
>> analysis of different thermal factors between the two situation
Information of the site :
> Department of Architecture premise
> Latitude : 23°43'37.94"N
> Longitude : 90°23'27.86"E
> point of interest 3.
Limitation :
> dependable on software
> casual observation
> epistemological data.
Fig : selected area of BUET
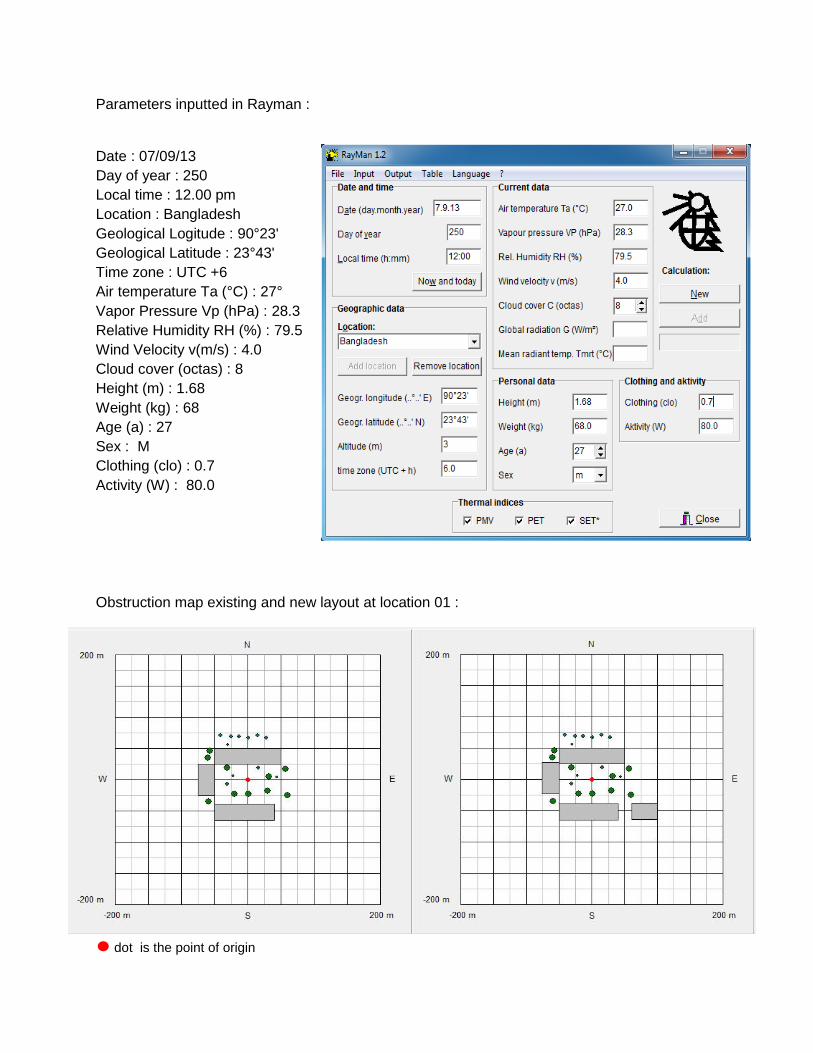
Parameters inputted in Rayman :
Date : 07/09/13
Day of year : 250
Local time : 12.00 pm
Location : Bangladesh
Geological Logitude : 90°23'
Geological Latitude : 23°43'
Time zone : UTC +6
Air temperature Ta (°C) : 27°
Vapor Pressure Vp (hPa) : 28.3
Relative Humidity RH (%) : 79.5
Wind Velocity v(m/s) : 4.0
Cloud cover (octas) : 8
Height (m) : 1.68
Weight (kg) : 68
Age (a) : 27
Sex : M
Clothing (clo) : 0.7
Activity (W) : 80.0
Obstruction map existing and new layout at location 01 :
dot is the point of origin
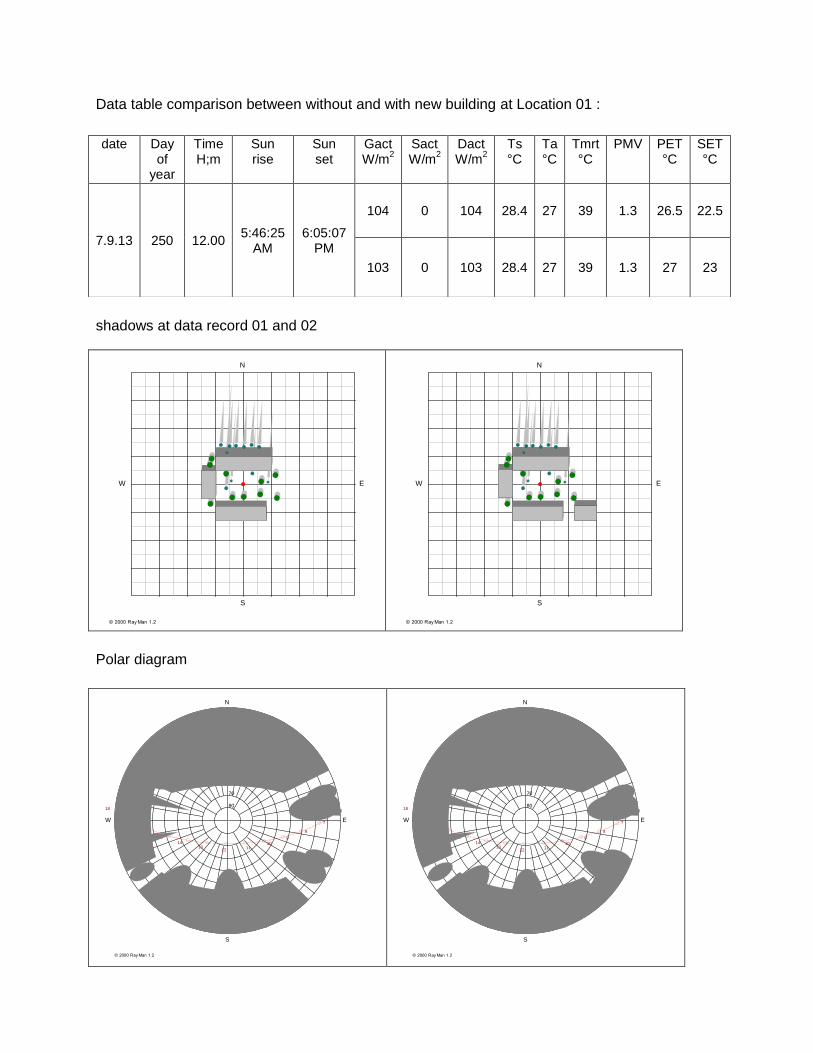
Data table comparison between without and with new building at Location 01 :
shadows at data record 01 and 02
Polar diagram
© 2000 Ray Man 1.2
N
W
S
E
© 2000 Ray Man 1.2
N
W
S
E
date Day of
year
Time H;m
Sun rise
Sun set
Gact W/m
2 Sact W/m
2
Dact W/m
2
Ts °C
Ta °C
Tmrt °C
PMV PET °C
SET °C
7.9.13 250 12.00 5:46:25
AM 6:05:07
PM
104 0 104 28.4 27 39 1.3 26.5 22.5
103 0 103 28.4 27 39 1.3 27 23
80
70
60
50
40
30
20
10
N
W
S
E
© 2000 Ray Man 1.2
6
7
8
9
1011
1213
14
15
16
17
1880
70
60
50
40
30
20
10
N
W
S
E
© 2000 Ray Man 1.2
6
7
8
9
1011
1213
14
15
16
17
18
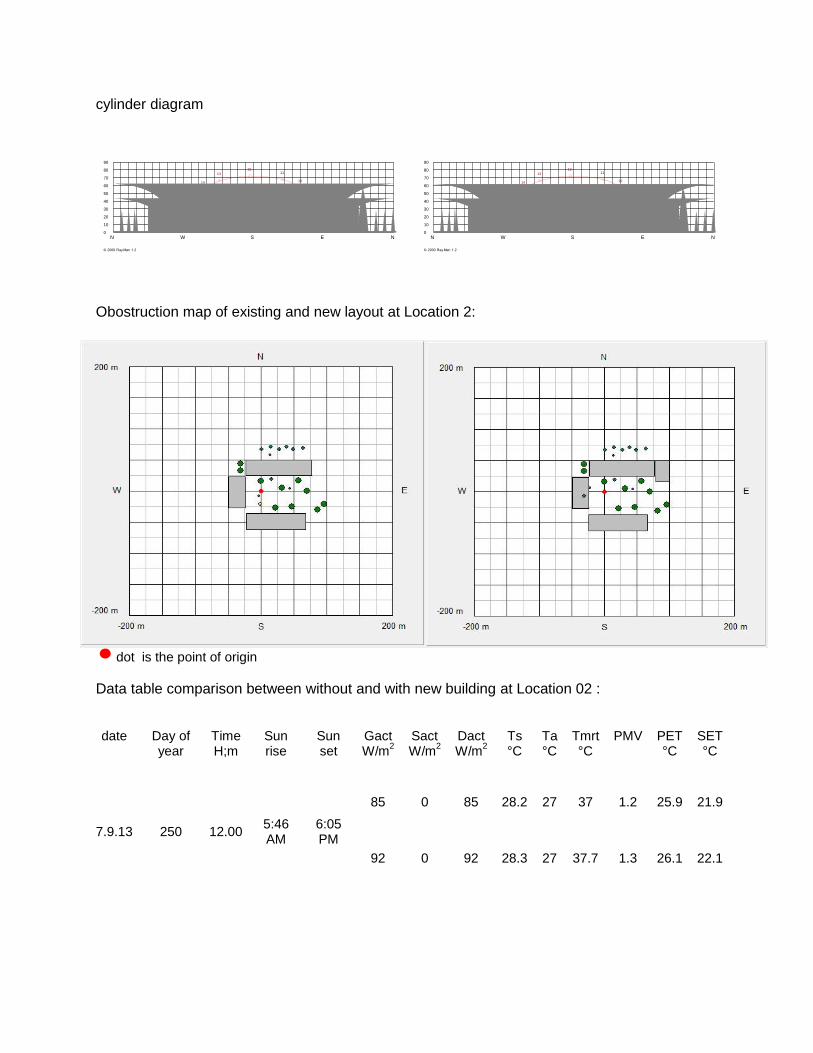
cylinder diagram
Obostruction map of existing and new layout at Location 2:
dot is the point of origin
Data table comparison between without and with new building at Location 02 :
date Day of year
Time H;m
Sun rise
Sun set
Gact W/m
2 Sact W/m
2
Dact W/m
2
Ts °C
Ta °C
Tmrt °C
PMV PET °C
SET °C
7.9.13 250 12.00 5:46 AM
6:05 PM
85 0 85 28.2 27 37 1.2 25.9 21.9
92 0 92 28.3 27 37.7 1.3 26.1 22.1
90
80
70
60
50
40
30
20
10
0
N W S E N
© 2000 Ray Man 1.2
6
7
8
9
10
1112
13
14
15
16
17
18
90
80
70
60
50
40
30
20
10
0
N W S E N
© 2000 Ray Man 1.2
6
7
8
9
10
1112
13
14
15
16
17
18
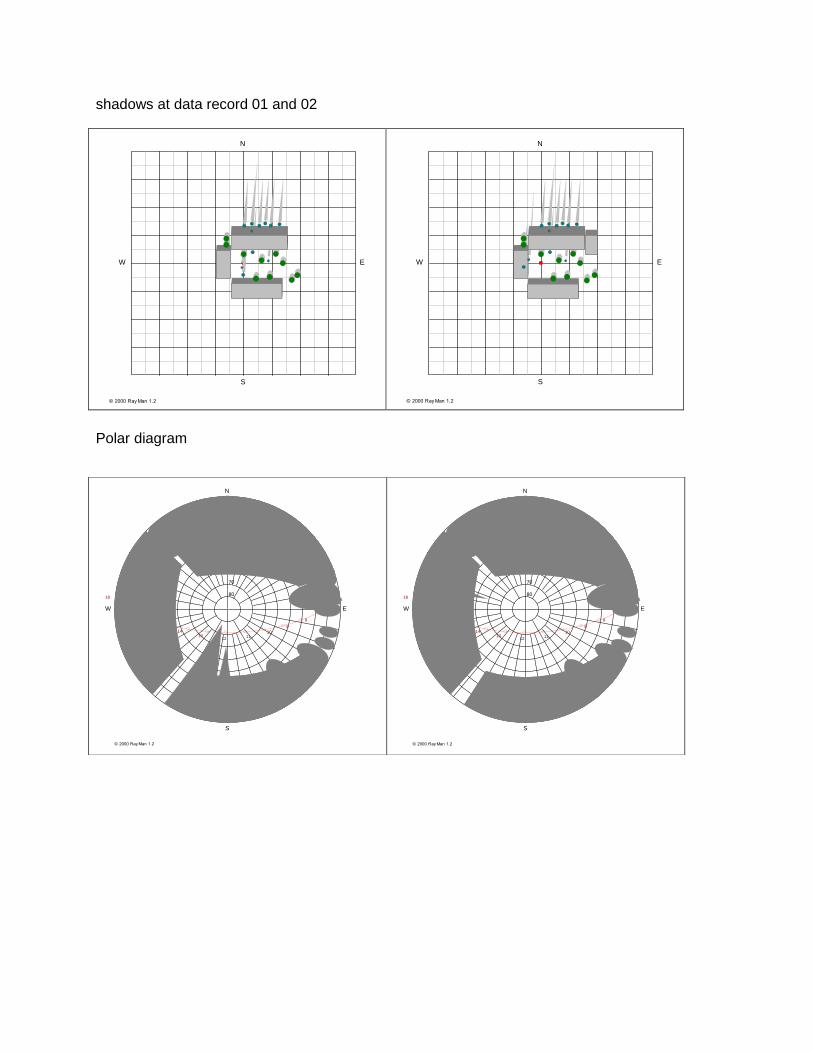
shadows at data record 01 and 02
Polar diagram
© 2000 Ray Man 1.2
N
W
S
E
© 2000 Ray Man 1.2
N
W
S
E
80
70
60
50
40
30
20
10
N
W
S
E
© 2000 Ray Man 1.2
6
7
8
9
1011
1213
14
15
16
17
1880
70
60
50
40
30
20
10
N
W
S
E
© 2000 Ray Man 1.2
6
7
8
9
1011
1213
14
15
16
17
18
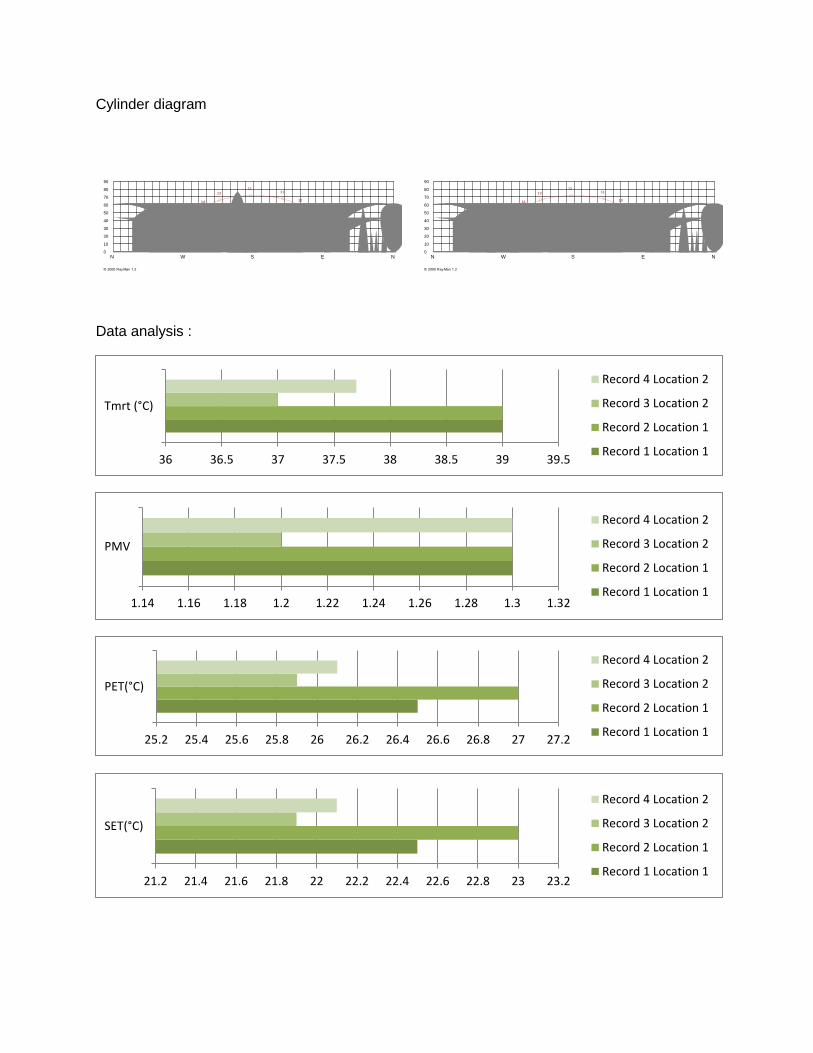
Cylinder diagram
Data analysis :
36 36.5 37 37.5 38 38.5 39 39.5
Tmrt (°C)
Record 4 Location 2
Record 3 Location 2
Record 2 Location 1
Record 1 Location 1
1.14 1.16 1.18 1.2 1.22 1.24 1.26 1.28 1.3 1.32
PMV
Record 4 Location 2
Record 3 Location 2
Record 2 Location 1
Record 1 Location 1
25.2 25.4 25.6 25.8 26 26.2 26.4 26.6 26.8 27 27.2
PET(°C)
Record 4 Location 2
Record 3 Location 2
Record 2 Location 1
Record 1 Location 1
21.2 21.4 21.6 21.8 22 22.2 22.4 22.6 22.8 23 23.2
SET(°C)
Record 4 Location 2
Record 3 Location 2
Record 2 Location 1
Record 1 Location 1
90
80
70
60
50
40
30
20
10
0
N W S E N
© 2000 Ray Man 1.2
6
7
8
9
10
1112
13
14
15
16
17
18
90
80
70
60
50
40
30
20
10
0
N W S E N
© 2000 Ray Man 1.2
6
7
8
9
10
1112
13
14
15
16
17
18
> From the analysis it can be seen that the Mean Radiant Temperature (Tmrt) in the two points of interests decreases after positioning the two new buildings. Because these two buildings create shade in the point of interests thus reduces the radiation and keep the temperature in the comfort level.
The Predicted Mean Vote (PMV) decreases after locating the buildings thus increase comfort ability.
Physiologically equivalent temperature (PET) decreases 2/3 °C after locating the buildings.
Standard effective temperature (SET*) also decreases like other parameters in the ray man simulation. Conclusion The result shows that before new building the Tmrt , PET, PMV, SET data decreases due to
new building location because of new formation of shading which protect the solar radiation at
the two points of interests. The presented model provides ample opportunities for research in
applied climatology and education. With easily available climate or meteorological data air
temperature, air humidity, wind speed radiation fluxes, and thermal indices for easy and
complex environments can be estimated. Additional information about clouds and global
radiation imported in the model can be the basis for a more appropriate estimation of the
radiation fluxes. Therefore, the RayMan model is a valuable tool for the planning and
construction of climate oriented dwellings and facilities for tourism resorts and urban planning. It
can also be used for the calculation of shade to be provided by special devices in tourism areas
and resorts in order to create more comfortable thermal conditions for recreational users and
visitors through protection from direct sunlight.
Copyright © 2022 FDOKUMEN