![[en]=> (LV-CAN200) - Teltonika Wiki](https://static.fdokumen.com/doc/165x107/63348b9f4e43a4bcd80d4495/en-lv-can200-teltonika-wiki.jpg)
LV Switchgear Outdoor - SP Energy Networks
32
LV Switchgear Outdoor ED2 Engineering Justification Paper ED2-NLR(A)-SPEN-001-SWG-EJP Issue Date Comments Issue 0.1 Jan 2021 Issue for SRG Issue 0.2 May 2021 Updated based on SRG comments and AECOM review Issue 1 June 2021 New template and final comments incorporated Issue 2 Nov 2021 Final Submission Scheme Name RIIO ED2 LV Switchgear Outdoor PCFM Cost Type Non-Load Related - Asset Replacement Activity Switchgear Condition Modernisation Primary Investment Driver Risk reduction as measured through NARMS Reference ED2-NLR(A)-SPEN-001-SWG Output Type Asset Modernisation Cost SPD: £15.466m | SPM: £15.715m Delivery Year 2023-2028 Reporting Table CV7a, CV10, CV14 Outputs included in ED1 Yes/No Business Plan Section Ensuring a Safe and Reliable Electricity Supply Primary Annex Annex 4A.10: Substations and Switchgear Strategy; EHV to LV Spend Apportionment ED1 ED2 ED3 £m £31.181m £m
-
Upload
khangminh22 -
Category
Documents
-
view
1 -
download
0
Transcript of LV Switchgear Outdoor - SP Energy Networks

LV Switchgear Outdoor ED2 Engineering Justification Paper
ED2-NLR(A)-SPEN-001-SWG-EJP
Issue Date Comments Issue 0.1 Jan 2021 Issue for SRG
Issue 0.2 May 2021 Updated based on SRG comments and AECOM review
Issue 1 June 2021 New template and final comments incorporated
Issue 2 Nov 2021 Final Submission
Scheme Name RIIO ED2 LV Switchgear Outdoor
PCFM Cost Type Non-Load Related - Asset Replacement
Activity Switchgear Condition Modernisation
Primary Investment Driver Risk reduction as measured through NARMS
Reference ED2-NLR(A)-SPEN-001-SWG
Output Type Asset Modernisation
Cost SPD: £15.466m | SPM: £15.715m
Delivery Year 2023-2028
Reporting Table CV7a, CV10, CV14
Outputs included in ED1 Yes/No
Business Plan Section Ensuring a Safe and Reliable Electricity Supply
Primary Annex Annex 4A.10: Substations and Switchgear Strategy; EHV to LV
Spend Apportionment ED1 ED2 ED3 £m £31.181m £m

ED2-NLR(A)-SPEN-001-SWG-EJP – LV Switchgear Outdoor Issue 2
1
Technical Governance Process Project Scope Development
IP1(S) To be completed by the Service Provider or Asset Management. The completed form, together with an accompanying report, should be endorsed by the appropriate sponsor and submitted for approval. IP1 – To request project inclusion in the investment plan and to undertake project design work or request a modification to an existing project IP1(S) – Confirms project need case and provides an initial view of the Project Scope IP2 – Technical/Engineering approval for major system projects by the System Review Group (SRG) IP2(C) – a Codicil or Supplement to a related IP2 paper. Commonly used where approval is required at more than one SRG, typically connection projects which require connection works at differing voltage levels and when those differing voltage levels are governed by two separate System Review Groups. IP2(R) – Restricted Technical/Engineering approval for projects such as asset refurbishment or replacement projects which are essentially on a like-for-like basis and not requiring a full IP2 IP3 – Financial Authorisation document (for schemes > £100k prime) IP4 – Application for variation of project due to change in cost or scope PART A – PROJECT INFORMATION Project Title: LV Switchgear Outdoor Modernisation Project Reference: ED2-NRL(S)-SPEN-001-SWG Decision Required: Concept approval for modernisation of LV switchgear outdoor (LV street furniture) Summary of Business Need: Based on data from CBRM and observed condition reports, assets have been identified as needing intervention in the ED2 price control period to ensure the level of risk across the LV and HV network is managed appropriately, whilst ensuring that intervention occurs at the most cost-beneficial time. The strategy outlined in this paper removes the worst condition and highest risk assets from the SPEN network at a volume which is deliverable and cost efficient for both licences. Summary of Project Scope, Change in Scope or Change in Timing: Intervention types outlined are majority CV7 Asset Replacement. The costs given cover the asset replacement works for LV switchgear outdoor not at substation (link boxes and pillars). Also included is civil works for LV street furniture and the legal & safety strategy for installing fire blankets in link boxes. This paper does not cover the strategy for LV switchgear assets at substations (such as LV Pillar ID or LV Pillar OD at substation) – see ED2-NLR(A)-SPEN-001-SWGTX-EJP. Expenditure Forecast (2020/21 Prices) Licence Area
Reporting Table Description
Total (£m)
Incidence (£m) 2023/24 2024/25 2025/26 2026/27 2027/28
SPD
CV7a Asset Replacement NARM 14.693 2.157 3.542 3.010 3.203 2.782
CV10 Civil Works Condition Driven LV Street Furniture 0.759 0.152 0.152 0.152 0.152 0.152
CV14 Legal & Safety Fire Blankets 0.014 0.003 0.003 0.003 0.003 0.003 Sub-Total 15.466
SPM
CV7a Asset Replacement NARM 14.824 3.549 3.249 2.674 2.693 2.660
CV10 Civil Works Condition Driven LV Street Furniture 0.877 0.175 0.175 0.175 0.175 0.175
CV14 Legal & Safety Fire Blankets 0.014 0.003 0.003 0.003 0.003 0.003 Sub-Total 15.715
This Proposal 31.181 PART B – PROJECT SUBMISSION Proposed by Alexandra Campbell Signature Date: 30.11.2021
Endorsed by Matthew Jones Signature Date: 30.11.2021
PART C – PROJECT APPROVAL Approved by Malcolm Bebbington Signature Date: 30.11.2021

ED2-NLR(A)-SPEN-001-SWG-EJP – LV Switchgear Outdoor Issue 2
2
Contents Technical Governance Process................................................................................................................ 1
Contents .................................................................................................................................................. 2
1 Introduction .................................................................................................................................... 3
2 Background Information ................................................................................................................. 3
3 Needs Case ...................................................................................................................................... 7
4 Optioneering ................................................................................................................................. 12
5 Detailed Analysis & Costs .............................................................................................................. 13
6 Deliverability & Risk ...................................................................................................................... 19
7 Conclusion ..................................................................................................................................... 26
8 Appendix 1 .................................................................................................................................... 28

ED2-NLR(A)-SPEN-001-SWG-EJP – LV Switchgear Outdoor Issue 2
3
1 Introduction This engineering justification paper contains the strategy for asset modernisation and intervention on low voltage (LV) switchgear located outdoor not at substations in both SPD and SPM for the price control period RIIO-ED2. This includes asset modernisation of LV link boxes (or UGBs) and LV Pillars outdoor (OD) not at substation, as well as LV street furniture civil works and link box fire blankets legal & safety expenditure. Models were created for the two asset categories to identify candidates for intervention, using internal asset management tools such as CBRM (based on CNAIM v2.1 methodology) and SAP to analyse asset health and risk scores combined with additional factors such as defect information, known type issues and SOPs. Investment in these areas is required to reduce volumes of assets in poor condition and with high criticality of failure, reducing the likelihood and consequence of asset failure. This also ensures that temporary LV network reconfiguration is possible when necessary, such as during fault conditions, which is the secondary driver for this programme.
This paper contains the strategy, costs and volumes for CV7 – Asset Replacement for the asset modernisation of link boxes and pillars OD not at substation, including costs for CV7 Civil Works associated with Asset Intervention. This paper also contains the strategy, costs and volumes of CV10 LV Street Furniture Civil Works and CV14 Legal & Safety Link Box Fire Blankets.
The costs outlined in this plan are slightly front-ended in both licence areas, with higher intervention activity in the middle of RIIO-ED2 and a reduction in activity in the other years of the period. The delivery profile for all asset modernisation activity has been calculated using the Optimisation Engine to find the most cost-beneficial year of intervention based on a number of constraints. The delivery profile for fire blankets and civil intervention is linear across the five years.
In total, 7,392 interventions are proposed in this EJP at a total cost of £31.181m.
2 Background Information The total volumes of all secondary substation plant assets considered in this strategy are shown in Table 2.1, as taken from CBRM on 01.10.2021:
Table 2.1. Total asset population of LV switchgear OD asset category
Asset Category SPD SPM LV Pillar OD not at substation 11,489 312 LV Link Box 9,770 21,121
The intervention strategy for these asset categories is to use a risk-based approach, factoring in other asset data collected throughout ED1 to identify candidates which require intervention within ED2.
Our overarching ED2 asset intervention strategy across all asset categories is built on 9 approaches:
Inspection & condition data collection: following ESQCR regulations by inspecting all our assets at regular intervals to ensure our assets are safe and secure, whilst gathering necessary condition data to inform our asset management database.
Health index and criticality mapping to develop risk score: using CNAIM v2.1 to assign health and consequence of failure scores to every NARMs asset, and SPEN company-specific scoring methodologies to assign health and risk scores to all non-NARMs assets.

ED2-NLR(A)-SPEN-001-SWG-EJP – LV Switchgear Outdoor Issue 2
4
Removing PTIs (Plant Type Issues)/SOPs (Suspension of Operational Practice): identifying assets which may have type issues or SOPs associated with their model and reducing the number of live SOPs and PTIs on our network.
Identifying optimum intervention type: assessing the intervention types possible for each asset and identifying the most cost-efficient and beneficial intervention to undertake in ED2.
Prioritisation of asset intervention: recognising that some assets require intervention sooner than others and prioritising based on condition data and local district knowledge.
Optimisation strategies: calculating the optimum time to intervene on an asset based on its long-term risk profile developed from known condition inputs.
Bundling: alignment of asset intervention works at the location or within the same programme to improve efficiency of schemes and reduce customer interruptions.
Automation and monitoring: introducing increased automation and monitoring on the HV and LV network to reduce customer interruptions (CIs) and customer minutes lost (CMLs), improve efficiency of our operational staff, and gain increased visibility of our network loading.
Repair & maintenance: ensuring all our assets are kept in working condition by maintaining and repairing in line with manufacturers’ recommendations and internal policies.
The specific asset management strategy for link boxes and pillars is given below.
LV link box strategy:
1. Continuing delivery of commitments under the RIIO-ED1 Link Box reopener, including removal of remaining population of HI5 assets in SPM and aligning the approach with assets in SPD.
2. Managing underlying network resilience and asset risk through CBRM asset modelling and recent intrusive inspection results.
3. Intrusive inspection and replacement of Link Box protection blankets where required and continuing operational review and management of link-box interconnectivity.
4. Removal of single-phase link boxes in SPM by jointing through or replacement with modern 2-way or 4-way alternative.
5. Civil intervention through LV street furniture CV10. From RIGs v6, this includes replacement of UGB pavement covers and repairs to UGB structures.
LV pillar OD (not at substation) strategy:
1. Targeted delivery of HI5 assets as modelled via CBRM using recent inspection data and existing hazard and defect data to improve underlying resilience, optimise network risk and improve network safety for staff and the public.
2. Incorporating findings from SPD and SPM Panel of Inquiries to inform and prioritise intervention activity on higher priority assets driven by public safety e.g. proximity to high footfall areas including schools, recreational areas, bus stops, shops etc.
3. Interventions planned and prioritised by exposure to high corrosive atmospheres using GB Corrosion index mapping.
4. Removal of street pillars and replacement with link boxes where possible. 5. Civil intervention through LV street furniture CV10. From RIGs v6, this includes all civil repairs
to LV pillars not involving full replacement of the pillar.

ED2-NLR(A)-SPEN-001-SWG-EJP – LV Switchgear Outdoor Issue 2
5
The health data for these assets is given in Table 2.2. This shows the future health scores at the end of ED2 (2028), i.e. without intervention.
Table 2.2. Future health scores – end of ED2 using CNAIM v2.1
Asset Class SPD SPM
HI1 HI2 HI3 HI4 HI5 HI1 HI2 HI3 HI4 HI5 LV Pillar OD not at substation 2,279 35 1,884 4,036 3,255 103 0 89 52 68
LV Link Box 2,881 512 3,973 417 1,987 9,634 1,830 3,196 2,843 3,618
Recent inspections and analysis of defect notifications raised against OD LV Pillars indicate that there are many assets in poor condition. Many of them were found to have missing bungs, evidence of vandalism, and high levels of corrosion.
From the table above, 5,242 LV street assets in SPD and 3,686 assets in SPM are forecast to reach HI5 by the end of RIIO-ED2. This corresponds to approximately 25% of SPD assets and 17% of SPM assets. Assets which are HI5 are significantly more likely to fail than HIs1-4, with the Probability of Failure (PoF) for a HI5 being 7.5x greater than that for a HI1 and 1.8x greater than that for a HI4. This is taken from CNAIM v2.1 in-year PoF weightings.
The statistics above highlight the constant need for investment in these assets to ensure the levels of network risk can be managed. The primary driver for investment in this EJP for RIIO-ED2 is the reduction of risk as measured through NARMs methodology, with the secondary driver of ensuring that network reconfiguration is still a possibility on our LV network. However, it should be emphasised that Health Index is not the only factor considered when prioritising assets for intervention, it is one of many influencing factors as described above.
2.1 ED1 Track Record
The ED1 track record for these assets is shown in Figure 1 to Figure 4.
Note that volumes are additions – there are to be no additions of LV street pillars in ED2, and so the volumes and costs are included under link boxes.

ED2-NLR(A)-SPEN-001-SWG-EJP – LV Switchgear Outdoor Issue 2
6
Figure 1. SPD Link Boxes ED1 Track Record
Figure 2. SPM Link Boxes ED1 Track Record
In SPD, deterioration of the link box and pillar fleet has led to an increased volume of replacements in RIIO-ED2 compared to RIIO-ED1.
In SPM, the link box reopener was a large investment programme in RIIO-ED1 and so RIIO-ED2 sees reduced volumes of replacements for this asset class due to improved condition and lower risk.
0.0
1.0
2.0
3.0
4.0
0
200
400
600
2016 2017 2018 2019 2020 2021 2022 2023 2024 2025 2026 2027 2028
RIIO-ED1 RIIO-ED2
Cost
s (£m
)
Volu
mes
SPD CV7a - Link Boxes
Actual - ED1 Vols Forecast - ED1 Vols Forecast - ED2 Vols
Actual - ED1 Costs Forecast - ED1 Costs Forecast - ED2 Costs
0.0
5.0
10.0
15.0
0
500
1000
1500
2000
2016 2017 2018 2019 2020 2021 2022 2023 2024 2025 2026 2027 2028
RIIO-ED1 RIIO-ED2
Cost
s (£m
)
Volu
mes
SPM CV7a - Link Boxes
Actual - ED1 Vols Forecast - ED1 Vols Forecast - ED2 Vols
Actual - ED1 Costs Forecast - ED1 Costs Forecast - ED2 Costs

ED2-NLR(A)-SPEN-001-SWG-EJP – LV Switchgear Outdoor Issue 2
7
Figure 3. SPD Pillars ED1 Track Record
Figure 4. SPM Pillars ED1 Track Record
3 Needs Case There are three main justifications for LV switchgear OD asset modernisation: to ensure or improve reliability of supply; to allow increased network reconfiguration; to reduce the levels of network asset risk. These are discussed below.
3.1 Reliability of Supply & Network Reconfiguration
Reliability of Supply
Society is increasingly reliant on electricity. Our DFES (Distribution Future Energy Scenarios) indicate that by 2030 we could have up to 1.8m Electric Vehicles (EVs) and 1.1m Heat Pumps connected across both our licence areas, and we could see levels of Distributed Generation increase by up to 200%. The electricity distribution network is critical to facilitating Net Zero. Additionally, vulnerable customers and large consumers are heavily reliant on electricity for many reasons, including medical, communications, manufacturing, and economical.
0.0
0.5
1.0
1.5
0
100
200
300
2016 2017 2018 2019 2020 2021 2022 2023 2024 2025 2026 2027 2028
RIIO-ED1 RIIO-ED2
Cost
s (£m
)
Volu
mes
SPD CV7a Pillars OD not at Sub
Actual - ED1 Vols Forecast - ED1 Vols Forecast - ED2 Vols
Actual - ED1 Costs Forecast - ED1 Costs Forecast - ED2 Costs
-0.010
0.000
0.010
0.020
0.030
0
2
4
6
2016 2017 2018 2019 2020 2021 2022 2023 2024 2025 2026 2027 2028
RIIO-ED1 RIIO-ED2
Cost
s (£m
)
Volu
mes
SPM CV7a - Pillars OD not at Sub
Actual - ED1 Vols Forecast - ED1 Vols Forecast - ED2 Vols
Actual - ED1 Costs Forecast - ED1 Costs Forecast - ED2 Costs

ED2-NLR(A)-SPEN-001-SWG-EJP – LV Switchgear Outdoor Issue 2
8
Ensuring our network continues to provide a reliable supply of electricity to all our customers is one of the key focusses in SPEN’s strategies for ED2. The LV network must be kept in good condition to ensure this, by reducing the number of LV asset failures which cause loss of supply. Table 3.1 shows the disposal volumes attributed to asset failure so far in ED1 for these asset classes.
Table 3.1. Asset Failures
Licence Asset Class 2016 2017 2018 2019 2020 2021 Total SPD LV Pillar (OD not at a Substation) 135 24 37 44 36 28 304
LV UGB 90 64 65 40 58 48 365
SPM LV Pillar (OD not at a Substation) 1 1 - - 1 0 3
LV UGB 84 117 112 112 79 78 582
Network Reconfiguration
Good asset condition of LV switchgear is also important to allow network reconfiguration during a fault situation. LV link boxes and OD pillars not at substations are essential for providing back-feeds during network faults to restore supplies to customers. This temporary reconfiguration of the network relies on the switch points being operable and safe.
Poor condition LV switch points could be especially dangerous as they are located in areas close to members of the public, and asset failures could have catastrophic safety or financial consequences. Table 3.2 shows the volume of explosive link box failures so far in RIIO-ED1 in both licences.
Table 3.2. Explosive link box failures
Year 2016 2017 2018 2019 2020 2021 Total SPD - 1 - 3 7 2 13
SPM 19 27 28 17 15 17 123
Removing some of this risk to keep the overall network risk at managed levels is an important part of our ED2 strategy, and is essential to ensure the distribution network continues to work efficiently and safely. Ignoring at-risk assets could have catastrophic consequences on customers’ supplies, the safety of the public and our employees, and the environment surrounding our assets.
3.2 Network Asset Risk
In order to understand the level of risk across the network, each asset is given a risk score using a common methodology across all UK DNOs – CNAIM v2.1. The risk score is a combination of health index and criticality of the asset. These can be thought of as the probability and consequence of failure.
At SPEN, known asset data such as age, location, and asset type combined with condition inputs from inspections is combined to develop the health index for each asset. The criticality index is developed from the safety, financial, environmental and network performance consequences of failure of each asset.
ED2-NLR(A)-SPEN-001-SWG-EJP – LV Switchgear Outdoor Issue 2
9
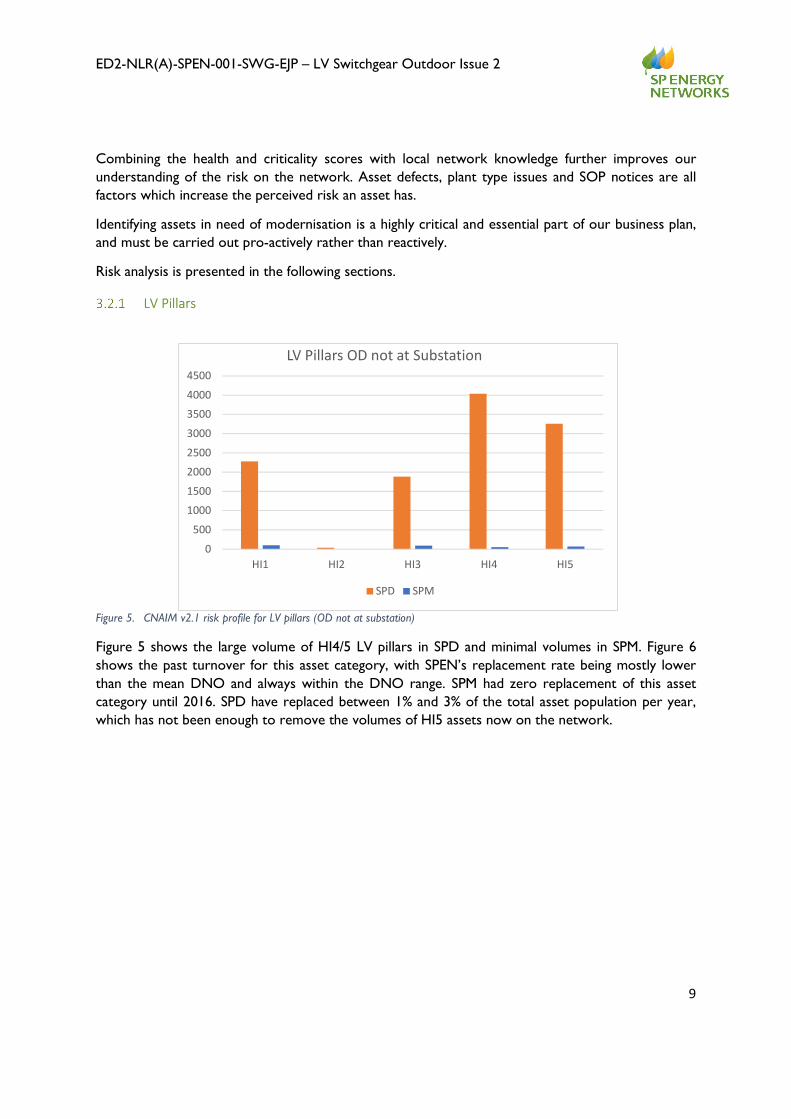
Combining the health and criticality scores with local network knowledge further improves our understanding of the risk on the network. Asset defects, plant type issues and SOP notices are all factors which increase the perceived risk an asset has.
Identifying assets in need of modernisation is a highly critical and essential part of our business plan, and must be carried out pro-actively rather than reactively.
Risk analysis is presented in the following sections.
LV Pillars
Figure 5. CNAIM v2.1 risk profile for LV pillars (OD not at substation)
Figure 5 shows the large volume of HI4/5 LV pillars in SPD and minimal volumes in SPM. Figure 6 shows the past turnover for this asset category, with SPEN’s replacement rate being mostly lower than the mean DNO and always within the DNO range. SPM had zero replacement of this asset category until 2016. SPD have replaced between 1% and 3% of the total asset population per year, which has not been enough to remove the volumes of HI5 assets now on the network.
0500
10001500200025003000350040004500
HI1 HI2 HI3 HI4 HI5
LV Pillars OD not at Substation
SPD SPM

ED2-NLR(A)-SPEN-001-SWG-EJP – LV Switchgear Outdoor Issue 2
10
Figure 6. Past turnover rate for LV pillars (OD not at substation)
LV Link Boxes
Figure 7. CNAIM v2.1 risk profile for LV link boxes
Figure 7 shows that in SPD, the Health Index profile is fairly symmetrical but with lower volumes of HI5 boxes. In SPM, the risk profiles are much more varied with a large volume being HI5. Figure 8
0
2000
4000
6000
8000
10000
12000
HI1 HI2 HI3 HI4 HI5
LV UGBs
SPD SPM

ED2-NLR(A)-SPEN-001-SWG-EJP – LV Switchgear Outdoor Issue 2
11
shows minimal turnover of link boxes in SPD in recent years, whilst in SPM the turnover rate has been increasing as a result of the ED1 reopener.
Figure 8. Past turnover rate for LV link boxes
LV Link Box ED1 Reopener The ED1 uncertainty mechanism for link boxes allowed expenditure for this category to be adjusted in SPM as a result of high volumes of HI5 assets. The additional expenditure allowed us to intervene on 4,137 assets in ED1 on top of the original volume of 1,935.
Link box assets in SPM have been subject to intrusive inspection to provide a health and risk index. As of 14/09/2020, 17,594 link boxes have been surveyed. These surveys must be carried out every 3 years. See Table 3.3 for the ED1 link box inspection data (taken from LVInspection dashboard 14/09/2020).
Table 3.3. Link box health scores from inspection programme
HI Volume of Link Boxes Surveyed Replaced
1 2,927 24
2 959 14
3 4,910 126
4 2,534 80
5 6,264 3,035
Total 17,594 3,279

ED2-NLR(A)-SPEN-001-SWG-EJP – LV Switchgear Outdoor Issue 2
12
Single Phase Link Box Removal A number of single-phase link boxes have been identified in the SPM licence by district staff. These have been requested for removal on safety grounds due to the lack of phase barriers, the use of non-standard links and the condition of bell covers. There are two options for the removal of these link boxes:
1. The first option is to excavate these link boxes live, then create customer outages (due to no back-feed on single phase concentric mains) and replace the assets.
2. The second option is to excavate, bolt the bell covers on to the link box and backfill the pit. This would then be covered back over with a flag stone, essentially creating a breech joint. This would be marked with clarity points on internal SPEN cable diagrams to show a historic single phase link box exists at this location.
The second option is considered to be the safest and most sensible for these link boxes. There are approximately 125 known single-phase link boxes on the network in SPM, more of which may be discovered as link box inspections progress. See Section 8 (Appendix 1) for the list of these.
LV Street Furniture Civil Works In CNAIM v2.1 methodology, the external and civil condition of LV link boxes and pillars feeds into the calculation of Health Index. These condition inputs can be improved or repaired without carrying out a full asset replacement. These works are covered under CV10 LV Street Furniture Civil Works.
Relevant link box observed condition inputs are:
Steel cover & pit condition Bell condition.
Relevant pillar observed condition inputs are:
Switchgear external condition Switchgear internal condition & operation.
By intervening on these assets through CV10, the Health Index can be reduced and the life expectancy extended without requiring the costs and time associated with full asset replacement (CV7).
Fire Blankets Through the RIIO-ED1 Link Box reopener, money was obtained to install fire blankets in link boxes in SPM. The strategy, set out in guidance document SWG-10-006, requires all legacy link boxes which are in a high-risk location to have a fire protection blanket installed.
Installing these fire blankets lowers the consequence of failure of these assets until intervention can take place. Once a new box is installed, the fire blanket can be recovered and installed elsewhere.
4 Optioneering There are three scenarios which were considered when creating the asset modernisation strategy for LV switchgear outdoor. These are discussed below.

ED2-NLR(A)-SPEN-001-SWG-EJP – LV Switchgear Outdoor Issue 2
13
Table 4.1. Optioneering table
# Options Decision Comment
Baseline Inspect and maintain assets, incur faults due to asset deterioration and respond to asset failure reactively over the course of ED2. Scheduled asset replacement deferred until the start of ED3. This is the “Do minimum” option.
Rejected This is the “do minimum” option.
Rejected as inconsistent with our asset management strategy
1 Replacement of all assets which already are or turn HI5 in ED2.
Considered Rejected due to deliverability constraints.
2 Proactive modernisation to replace and remove a large proportion of HI5 assets, including the removal of all assets which are HI5 at the start of ED2 plus a proportion which turn HI5 during the period.
Considered Rejected due to reduced NPV benefits over whole life once monetised risk benefits are considered.
3 Proactive modernisation as Option 2 above, plus improving the civil structure of remaining HI5 assets to reduce their Health Index to HI3 or HI4 and installation of fire blankets in priority link boxes. Also includes delivery profiles which were calculated by the Optimisation Engine.
Adopted See Section 5.1
5 Detailed Analysis & Costs 5.1 Selected Option Summary – Option 3 (Targeted Intervention with Civil
Works)
This option involves targeted replacement of LV link boxes and removal of LV street pillars in ED2, using prioritisation models to identify key intervention candidates based on collected asset data. The delivery profile of these assets was identified using the Optimisation Engine, which found the optimal year of intervention of each individual asset within ED2 based on CNAIM v2.1 methodology, taking into consideration programmed deliverability constraints – for more information see Annex 4A.4 Network Asset Risk Strategy.
As outlined earlier, LV pillars outdoor not at substation are to be removed in ED2, with a link box installed as its replacement. This is due to the higher levels of risk associated with pillars, such as public safety, network resilience, and environmental risk.

ED2-NLR(A)-SPEN-001-SWG-EJP – LV Switchgear Outdoor Issue 2
14
Replacement is the only asset modernisation intervention considered for LV street furniture, as refurbishment is not a cost-effective alternative. As mentioned earlier, LV pillars will be replaced with LV link boxes. Link boxes will be replaced like-for-like.
The models used to identify LV assets in both categories followed similar methodology. This is shown in Table 5.1 below, highlighting which approaches were used for each asset category.
Table 5.1. Methodology for identifying assets for targeted intervention
Approach LV Pillar OD not at sub LV link box CBRM Health Index Yes Yes CBRM Criticality Index Yes Yes Type Issues Yes – fibreglass pillars will be
targeted, as will solid type LV street pillars (Glasgow)
Yes – single phase link boxes were highlighted as high risk
Inspection data from SAP Yes – added to Health Index model as condition inputs
No
ED1 Reopener Inspection Data No – no ED1 reopener for LV pillars
Yes – data used to understand condition of assets and volumes in need of replacement
*Note: CBRM models in process of being finalised and assured. Plans will be finalised following CBRM model sign-off.
This option also includes expenditure against CV10 LV Street Furniture, targeting the remaining assets which turn HI5 in RIIO-ED2 and completing civil works to reduce their Health Index and increase their life expectancy. The benefit of civils work has been included in the CBA by reducing the Health Index from HI5 to HI4.
It also includes expenditure on LV Link Box Fire Blankets, which is the continuation of our RIIO-ED1 strategy to install a fire blanket in all legacy assets in high risk locations. This strategy is outlined in our internal policy document SWG-10-006 Guidance Document for the External and Internal Inspection of Link Boxes and the Installation Requirements of Protection Blankets.
There are no losses calculations included in this proposal due to the nature of assets included. Whole life benefit is almost purely based on monetised risk benefit from CNAIM v2.1, with the only cost being initial CAPEX and then inspections as per our Asset Management strategy. Inspection frequency does not vary based on asset age or Health Index and so this has no effect on this proposal.
The volumes identified for intervention using this methodology are shown in Table 5.2.
Table 5.2. Option 3 Intervention Volumes
Licence Asset Class CV Disposal Volume Addition Volume
SPD LV Link Box CV7 95 2,052
LV Pillar OD not at Substation CV7 1,957 0
Fire Blankets CV14 - 100
Street Furniture Civils CV10 - 1,390
SPM LV Link Box CV7 1,978 1,985
LV Pillar OD not at Substation CV7 7 0
Fire Blankets CV14 - 100

ED2-NLR(A)-SPEN-001-SWG-EJP – LV Switchgear Outdoor Issue 2
15
Licence Asset Class CV Disposal Volume Addition Volume
Street Furniture Civils CV10 - 1,765
Unit costs are given in Table 5.3. Derivation of costs for these options are based on the finalised SP Energy Networks RIIO-ED2 Unit Cost Manual for intervention (Annex 5A.5). This is based on bottom up cost assessment of the components of activity detailed within the RIGs Annex A for the above activities, SP Energy Networks contractual rates for delivery, market available rates and historic spend levels.
Unit costs for asset replacement are the same for each licence, as are costs for fire blankets. Street furniture works unit cost is based on RIIO-ED1 spend and so there is some regional variation due to different volumes of link boxes and pillars in each licence, meaning the scope of works completed varies.
Only the unit cost for an LV link box was used for CV7a, due to the strategy to replace all LV OD street pillars with link boxes where possible.
Table 5.3. Unit costs used to calculate CAPEX
Asset Class CV Table Unit Cost (£k) Link Box – 4-way CV7 7.699 Link Box – 2-way CV7 6.345 Fire Blankets* CV14 0.138 Street Furniture Civil Works – SPD CV10 0.546 Street Furniture Civil Works – SPM CV10 0.497
* denotes costs also have a pensions contribution on top.
The volumes of 2-way and 4-way link boxes were found using the RIIO-ED1 Link Box Reopener document, which gives the total split of 2-way and 4-way boxes in each licence. This split is shown below:
Table 5.4. RIIO-ED1 Link Box Reopener – Link Box Volumes Split by Number of Ways
2014/15 Volumes 2-way 4-way Total SPM Volumes 3,564 17,640 21,204 SPM Proportion 16.8% 72.2% 100% SPD Volumes 2,968 6,452 9,420 SPD Proportion 31.5% 69.5% 100%
The volumes of pillars to be replaced with 2-way and 4-way link boxes were found using asset data stored in the internal data management system SAP. Each street pillar has a number of ways assigned in SAP, and this model assumes that all pillars labelled “2-way” or “3-way” will be replaced with a 2-way link box. All other pillars have assumed to need replacing with a 4-way link box.
The optimised delivery profiles as calculated by the Optimisation Engine are given in Table 5.5.

ED2-NLR(A)-SPEN-001-SWG-EJP – LV Switchgear Outdoor Issue 2
16
Table 5.5. Option 3 Delivery Profiles
Licence Volume Type Asset Class CV
Table ED2 Delivery Profile 2023 2024 2025 2026 2027
SPD Addition LV Link Box CV7 290 489 431 438 404
LV Pillar OD not at sub CV7 0 0 0 0 0
Disposal LV Link Box CV7 23 21 17 17 17
LV Pillar OD not at sub CV7 267 468 414 421 387
Addition Link Box Fire Blankets CV14 20 20 20 20 20
Addition Street Furniture Civil Works CV10 278 278 278 278 278
SPM Addition LV Link Box CV7 595 597 393 200 200
LV Pillar OD not at sub CV7 0 0 0 0 0
Disposal LV Link Box CV7 475 435 358 361 356
LV Pillar OD not at sub CV7 0 0 2 5 0
Addition Link Box Fire Blankets CV14 20 20 20 20 20
Addition Street Furniture Civil Works CV10 353 353 353 353 353
The total cost for this option is £31.181m.
5.2 Alternative Options Summary – Option 1 (Replace all HI5)
This option involves replacing all assets which are HI5 or turn HI5 during ED2. The Health Index is found using CNAIM v2.1, using the Future Health Score as calculated for the last year of ED2.
As in Option 3, all pillars would be replaced with link boxes.
The volumes in this option are given in Table 5.6.
Table 5.6. Option1 Volumes
Licence Asset Class CV Disposal Volume
Addition Volume
SPD LV Link Box CV7 1,987 5,242
LV Pillar OD at Substation CV7 3,255 0
SPM LV Link Box CV7 3,618 3,686
LV Pillar OD at Substation CV7 68 0
The same unit costs as given in Option 3 would be used. The same methodology as Option 3 was used to identify the split of 2-way and 4-way link boxes.
The volumes in this option are split linearly throughout the 5 years, resulting in the below delivery profile.
ED2-NLR(A)-SPEN-001-SWG-EJP – LV Switchgear Outdoor Issue 2
17
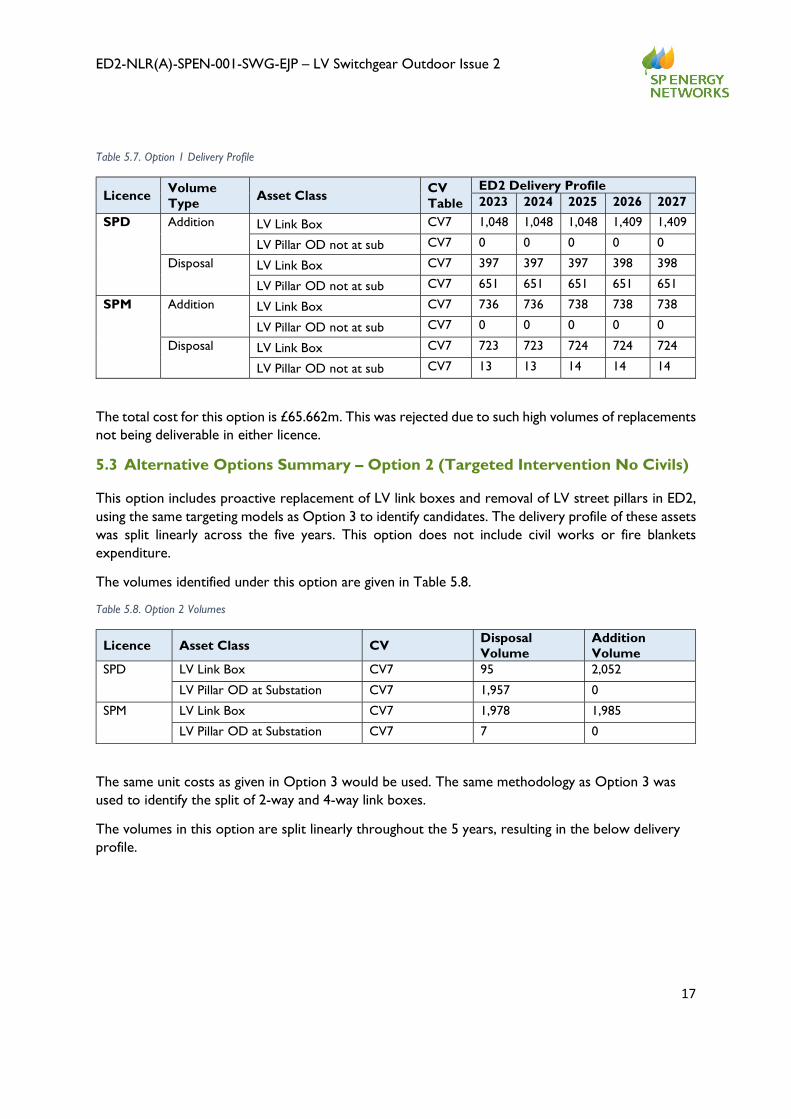
Table 5.7. Option 1 Delivery Profile
Licence Volume Type Asset Class CV
Table ED2 Delivery Profile 2023 2024 2025 2026 2027
SPD Addition LV Link Box CV7 1,048 1,048 1,048 1,409 1,409
LV Pillar OD not at sub CV7 0 0 0 0 0
Disposal LV Link Box CV7 397 397 397 398 398
LV Pillar OD not at sub CV7 651 651 651 651 651
SPM Addition LV Link Box CV7 736 736 738 738 738
LV Pillar OD not at sub CV7 0 0 0 0 0
Disposal LV Link Box CV7 723 723 724 724 724
LV Pillar OD not at sub CV7 13 13 14 14 14
The total cost for this option is £65.662m. This was rejected due to such high volumes of replacements not being deliverable in either licence.
5.3 Alternative Options Summary – Option 2 (Targeted Intervention No Civils)
This option includes proactive replacement of LV link boxes and removal of LV street pillars in ED2, using the same targeting models as Option 3 to identify candidates. The delivery profile of these assets was split linearly across the five years. This option does not include civil works or fire blankets expenditure.
The volumes identified under this option are given in Table 5.8.
Table 5.8. Option 2 Volumes
Licence Asset Class CV Disposal Volume
Addition Volume
SPD LV Link Box CV7 95 2,052
LV Pillar OD at Substation CV7 1,957 0
SPM LV Link Box CV7 1,978 1,985
LV Pillar OD at Substation CV7 7 0
The same unit costs as given in Option 3 would be used. The same methodology as Option 3 was used to identify the split of 2-way and 4-way link boxes.
The volumes in this option are split linearly throughout the 5 years, resulting in the below delivery profile.

ED2-NLR(A)-SPEN-001-SWG-EJP – LV Switchgear Outdoor Issue 2
18
Table 5.9. Option 2 Delivery Profile
Licence Volume Type Asset Class CV
Table ED2 Delivery Profile 2023 2024 2025 2026 2027
SPD Addition LV Link Box CV7 410 410 410 411 411
LV Pillar OD not at sub CV7 0 0 0 0 0
Disposal LV Link Box CV7 19 19 19 19 19
LV Pillar OD not at sub CV7 391 391 391 392 392
SPM Addition LV Link Box CV7 396 396 398 397 398
LV Pillar OD not at sub CV7 0 0 0 0 0
Disposal LV Link Box CV7 395 395 396 396 396
LV Pillar OD not at sub CV7 1 1 2 1 2
The total cost for this option is £29.522m. This was rejected as offers less NPV benefit over whole life once monetised risk is included in the analysis.
5.4 Options Technical Summary table
Table 5.10. Options technical summary
# Option Technical Summary
Baseline Inspect & maintain assets, incurring faults and replacing on failure.
No proactive replacement of assets in ED2, resulting in 710 asset failures. Targeted replacement begins in ED3. This is the “Do Minimum” option.
1 Replacement of all assets which already are or turn HI5 in ED2.
Modernisation through replacement of 5,242 assets in SPD and 3,686 assets in SPM, all of which are HI5 by the end of ED2 (using CNAIM v2.1 methodology to calculate future health score). Linear delivery profile. Rejected due to high volumes of replacement being undeliverable.
2 Proactive modernisation to replace and remove a large proportion of HI5 assets, including the removal of assets which are HI5 at the start of ED2 plus a proportion which turn HI5 during the period.
Targeted replacement of 2,052 assets in SPD and 1,985 assets in SPM, the majority of which are either HI5 at the start of ED1 or turn HI5 during ED2. This is part of a proactive modernisation programme to manage levels of network risk, delivered using a linear delivery profile. Rejected as when monetised risk is included in analysis, Option 3 has greater NPV benefit than Option 2.
3 As above but including civil works on street furniture assets to improve their condition and extend their life, plus installation of link box fire blankets in line with the ED1 strategy. Also includes optimised delivery profiles.
As above, with the inclusion of condition driven civil works on the remaining HI5 assets which are not replaced in ED2. This option also includes the installation of link box fire blankets in legacy assets in high risk locations, as outlined in the ED1 strategy document SWG-10-006. The asset modernisation works in this option are delivered using an optimised profile, as calculated by the Optimisation Engine. Adopted option as highest NPV benefit between Options 2 and 3.

ED2-NLR(A)-SPEN-001-SWG-EJP – LV Switchgear Outdoor Issue 2
19
5.5 Options Cost summary tables
Table 5.11. Options cost summary
# Option Cost Breakdown £m NARMs
Risk Change £/Risk
Baseline Replace 710 faulted assets £5.231m N/A N/A 1 Option 1 Replace 5,242 assets in SPD £38.122m
-£106.274m £0.618 Replace 3,686 assets in SPM £27.540m Total £65.662m
2 Option 2 Replace 2,052 assets in SPD £14.692m -£49.254m £0.599 Replace 1,985 assets in SPM £14.830m
Total £29.522m 3 Option 3
(selected) Replace 2,052 assets in SPD £14.692m
-£61.236m
(CV7 reportable NARMs: -£42.254m
CV10 NARMs equivalent benefit: -£11.982m)
£0.509
Improve civils for 1,390 assets in SPD
£0.759m
Install 100 fire blankets in SPD £0.014m Replace 1,985 assets in SPM £14.824m Improve civils for 1,765 assets in SPM
£0.877m
Install 100 fire blankets in SPM £0.014m Total £31.181m
6 Deliverability & Risk 6.1 Preferred Options & Output Summary
The preferred option is Option 3, entailing targeted replacement of HI5 LV assets as part of a planned modernisation programme to minimise asset failure and manage overall levels of network risk, whilst still allowing network reconfiguration where necessary. It also includes fire blanket installation to reduce criticality of link box failure, and civil works on LV street furniture to improve their health.
The total volumes and costs of this option are given in Table 6.1.
Table 6.1. Option 3 Summary
Licence SPD SPM Volume of Interventions 3,542 3,850 Cost of Interventions £15.466m £15.715m
6.2 Cost Benefit Analysis Results
The benefit to customers is shown by the CBA analysis results in Table 6.2.

ED2-NLR(A)-SPEN-001-SWG-EJP – LV Switchgear Outdoor Issue 2
20
Table 6.2. CBA Results (excluding NARMs benefits – see Section 6.8.2 for more detail)
Option no.
Options considered Decision NPVs based on payback periods
10 years
20 years
30 years
45 years
Whole Life NPV
Baseline Baseline Rejected
1 Alternative Option-1 Considered (£31.07) (£43.56) (£50.98) (£56.71) (£57.37)
2 Alternative Option-2 Considered (£12.49) (£17.51) (£20.49) (£22.79) (£23.06)
3 Alternative Option-3 Adopted (£13.38) (£18.74) (£21.92) (£24.37) (£24.65)
Full CBA can be found at ED2-NLR(A)-SPEN-001-SWG-CBA. No sensitivity analysis has been carried out as the CBA is purely cost and NARMs justified. There are no uncertainties relating to this expenditure programme which would affect the CBA.
Whilst Option 3 has a lower whole life NPV than Option 2, this option becomes the most NPV positive once NARMs benefits are included. See Section 6.8.2.
From CNAIM v2.1, plant assets are given a cost benefit of replacement based on their HI | C score. All assets which sit in the green cells in Table 6.3 have a positive cost benefit purely based on CNAIM methodology. 98% of LV UGBs and 100% of pillars identified for replacement / removal in this plan sit within these green cells and so are already justified based on CNAIM benefits alone.
Table 6.3. CNAIM v2.1 Cost Benefit Analysis
Cost Benefit: Monetised Risk (Long Term Risk) Benefit Of Like For
Like Replacement - Cost Of Replacement (£) HI1 HI2 HI3 HI4 HI5 LV UGB C1 1 10
C2 2 4 38 4 1,708 C3 1 2 305 C4
LV Pillar (OD not at a Substation)
C1 C2 1,390 C3 574
C4

ED2-NLR(A)-SPEN-001-SWG-EJP – LV Switchgear Outdoor Issue 2
21
6.3 Expenditure Profile
Table 6.4. Proposed expenditure profile
Licence Asset Class CV Table
ED2 Cost Profile, £m 2023 2024 2025 2026 2027
SPD LV Link Box CV7a 2.16 3.54 3.01 3.20 2.78
Street Furniture Civil Works CV10 0.15 0.15 0.15 0.15 0.15
Link Box Fire Blankets CV14 0.00 0.00 0.00 0.00 0.00
SPM LV Link Box CV7a 3.55 3.25 2.67 2.69 2.66
Street Furniture Civil Works CV10 0.18 0.18 0.18 0.18 0.18
Link Box Fire Blankets CV14 0.00 0.00 0.00 0.00 0.00 6.4 Risks
There are some risks associated with this proposed programme for LV street furniture modernisation in RIIO-ED2.
The first is with the strategy to replace LV pillars with link boxes where possible. Currently in the plan it is assumed that all pillars will be replaced with link boxes, however in reality that may not always be the case. There may be some instances where installation of a link box is not possible or is much more expensive than installing a new street pillar. In these instances, the pillar will be replaced like-for-like which is not currently reflected in this programme. As unit costs are fairly equivalent between these asset categories, this should not cause any risks to expenditure and will be just reflected during the RRP process.
Another risk is with the civil works proposed for LV street furniture. For this proposal, a unit cost of £0.546k and £0.497k has been used for SPD and SPM respectively. This is due to the large scope of works covered by this intervention, as specific modernisation costs could not be calculated for each individual asset. It is possible that the unit cost may not be enough for the large volumes to be modernised in RIIO-ED2, depending on how much work is required for each asset. However, as these unit costs are based on RIIO-ED1 expenditure it is likely that there will be sufficient expenditure by applying a standard unit cost in each licence.
A final risk relates to our forecast split of 2-way and 4-way link boxes. The forecast split is based on our total asset population, however there is no guarantee that the boxes modernised in RIIO-ED2 will be reflective of this. The reduced unit cost for 2-way link boxes may not be sufficient if a higher proportion of 4-way link boxes need to be modernised. The current split is the most accurate forecast that could be made based on available data and so it is assumed that the expenditure will be sufficient.
6.5 Outputs Included in RIIO ED1 Plans
There are no outputs expected to be delivered in ED1 that are funded within this proposal.
ED2-NLR(A)-SPEN-001-SWG-EJP – LV Switchgear Outdoor Issue 2
22
6.6 SP Manweb Company Specific Factors
The SP Manweb network is unique due to its alternative, interconnected and unit-protected design, adopted from its outset in the late 1940s and inherited when the electricity supply industry was privatised.
Over half of the SP Manweb network – predominantly that in urban areas across Merseyside, Cheshire, and Wirral – is operated fully interconnected at all voltage levels. The primary system is wholly configured to support this interconnected operation.
This unique design provides embedded benefits to our customers, including excellent reliability in terms of reduced interruptions, better facilitation of LCTs, and a network that is more readily adaptable to changing demand. However, these benefits are brought about by a handful of key design and engineering characteristics unique to our network. These characteristics result in additional costs associated with operating, maintaining and modernising the network.
The main area affected by this which is covered by this EJP is LV link boxes. Interconnected networks typically operate with the link boxes in their ‘closed’ position to improve security of supply, with current flowing through the assets during normal operation. Additionally, when a fault occurs, the presence of multiple fault level infeeds imposes significantly more demanding requirements. Hence the consequences of disruptive link box failures in interconnected networks are far more severe than in traditional radial networks.
In RIIO-ED1, we saw the average annual link box disruptive failure rate increase by 1,045% with respect to DPCR5 observed rates, due to asset age, condition and the interconnected nature of the SP Manweb network. For this reason, in RIIO-ED1, Ofgem allowed an adjustment to SP Manweb's allowance to cover the additional costs incurred.
The strategy involves replacing 7,392 link boxes at the end of their operational life, many of which are located at highly challenging locations in the city centre and areas with limited accessibility. The re-opener adjustment covered the direct costs of the 4,137 additional units delivered in RIIO-ED1, which we are on track to deliver.
The programme will conclude in 2025/26, with an additional 1,978 units delivered in RIIO-ED2 at a unit cost of £7.5k.
As the allowed re-opener adjustment in ED1 was specific to SP Manweb, we believe it is appropriate to incorporate this cost in the RIIO-ED2 CSF.
The CSF adjustment is based on a comparison to the volumes in our SP Distribution area, where we plan to deliver 95 units (at the same unit cost).
We have submitted a Company Specific Factor for SP Manweb, to which a proportion of the LV link box costs have been attributed.
These cost adjustments are set out in Memo Table M25* and the detailed methodology for calculating this adjustment are in Business Plan Annex 4.29: SP Manweb Company Specific Factors. *i.e. they do not affect CV7 CAPEX.
The CSF elements are as follows:

ED2-NLR(A)-SPEN-001-SWG-EJP – LV Switchgear Outdoor Issue 2
23
Table 6.5. CSF Elements
CV table
Asset Type
SPM Interconnected Network Typical Equivalent Radial
Network CSF Adj (£m)
Volumes Unit Cost
(£m) Totex (£m) Volumes
Unit Cost (£m)
Totex (£m)
7a LV Link Boxes 1978.00 0.00747 14.77 95.00 0.00747 0.71 14.06
6.7 Stakeholder Engagement
Robust stakeholder engagement has been completed to identify what is important for customers in RIIO-ED2, and to gain insights from key stakeholders such as manufacturers, community energy groups, water and transportation companies, business groups, academia and asset managers from a range of industry. This ensures that the views and needs of all key stakeholders, as well as customer acceptability, are reflected in the proposed costs and volumes in this paper.
Below is a summary of key relevant outcomes from stakeholder engagement for this programme of works. The views of the stakeholders can be explored in more detail in Annex 3.1: Co-creating our RIIO-ED2 business plan with our stakeholders, and in Annex 4A.10 Substations and Switchgear Strategy; EHV to LV.
Customer Feedback
“Network resilience, not having a power cut” was ranked the second most important priority by both domestic and commercial customers.
Investing in network asset risk, resilience and reliability is key to reducing the likelihood of customers experiencing an interruption. This programme of works supports this by removing end-of-life LV assets which have a high probability of failure and replacing them with new link box assets. Link boxes will allow network reconfiguration in fault scenarios, and new assets will be less likely to fail than the disposed assets.
Manufacturers
Manufacturers provided the following views: o Modernisation is essential to ensuring network resilience; o Given customers’ increasing reliance on electricity, it is important to have a focus on
reducing fault rates as well as reducing the extent of impact of faults on customers; o Increasing grid dynamic response capabilities has allowed many utilities worldwide to
improve existing infrastructure performance and quality of supply.
This programme of works will improve network resilience and reduce the impact of faults by allowing reconfiguration of the LV network to restore supplies in fault situations, and by removing poor condition LV assets from the network and public environment.

ED2-NLR(A)-SPEN-001-SWG-EJP – LV Switchgear Outdoor Issue 2
24
Energy Consultants
Energy consultants agreed that SP Energy Networks should continue to utilise proven interventions on network assets, and there has been clear support for SP Energy Networks to continue investing in network resilience [to reduce faults].
This EJP sets out a range of proven interventions including like-for-like replacement, replacement with alternative asset type, and street furniture civil works. SP Energy Networks have also sought to adopt proven innovative alternatives wherever possible such as fire blanket installation in high risk link boxes to mitigate the risk of an explosive failure.
Local Governments
Local governments agreed with SP Energy Networks’ approach of managing risk by focusing on replacing and modernising the poorest condition & highest risk assets.
This paper sets out how SP Energy Networks are intervening on highest priority assets. Annex 4A.4 – Network Asset Risk Strategy, contains more details on how SP Energy Networks engaged on this approach.
6.8 Future Pathways – Net Zero
Primary Economic Driver The key driver for this proposal is to manage overall levels of network risk in both licences and to reduce asset failure rates through targeted intervention on the highest risk assets in ED2. Condition, consequences of failure and type issues all drive the levels of risk an asset has and so are key drivers for this programme of work. The secondary driver for this programme is to continue facilitation of network reconfiguration.
Payback Periods The CBA indicates that neither Option 2 or Option 3 result in a positive NPV result over the 45-year assessment period when NARMs benefits are excluded. Option 2 has the highest NPV, £23.06m below baseline whilst Option 3 is £24.65m below baseline. This is because there are no benefits for this programme of work other than monetised risk benefits and a small safety benefit seen in Option 3.
However, once the CBA takes monetised risk benefit into account the most NPV positive option is Option 3 – with positive £32.65m whole life NPV as opposed to £22.97m for Option 2. For this reason, Option 3 is the chosen option.
Pathways and End Points Asset modernisation and intervention is a necessary requirement to manage overall levels of network risk by continuing to lead the way in asset management. As the deadline for Net Zero closes in, society’s reliance on the network will increase and work to reduce loss of supply by investing in our substation assets will become more critical than ever.
Asset Stranding Risks & Future Asset Utilisation There is not considered to be any asset stranding risk associated with this programme.

ED2-NLR(A)-SPEN-001-SWG-EJP – LV Switchgear Outdoor Issue 2
25
It has been assessed that the preferred option is consistent with the future generation and demand scenarios and that the risk of stranding is very low.
Losses / Sensitivity to Carbon Prices It has not been necessary to consider losses or carbon pricing as part of this investment programme.
In evaluating the preferred option, the Cost of Carbon associated with asset interventions has been assessed. We recognise that there is currently an over-arching challenge facing all infrastructure investments to understand the true cost of carbon for work undertaken, this challenge extends to the energy industry and electricity distribution sector.
To overcome this, we have worked alongside carbon accounting specialists at AECOM to link our asset activities to an activity category within the Carbon Trusts Environmentally Extended Input Output Database (EEIO). This EEIO conversion approach uses the OPEN IO database originally developed by the Sustainability Consortium at the University of Arkansas and further adapted by the Carbon Trust to assign a kg CO2e/£ for each category. We have converted this to a tonne/CO2e for our activities based on asset unit cost information where possible. This tonne/CO2e is then used to derive a monetary value of carbon using Ofgem’s CBA template.
Using this approach, we have been able to ensure the carbon costs for preferred and discounted options are captured within the final NPV of our associated CBA. The adopted option in this scheme carries a carbon cost of £0.053m. To see the detail on how cost of carbon has been calculated please see ED2-NLR(A)-SPEN-001-SWG-CBA.
During RIIO-ED2 we will continue to work with our supply chain to mature our understanding and visibility of accurate carbon accounting costs associated with the addition and disposal of assets on our network.
Whole Systems Benefits Whole system solutions have been considered as part of this proposal. No alternatives have been identified that could be provided through a whole systems solution. The completion of this scheme will maintain the integrity of the distribution network and its enduring ability to facilitate wider whole system benefits.
6.9 Environmental Considerations
Operational and embodied carbon emissions The LV Switchgear Modernisation programme has limited potential to impact on SPEN’s Business Carbon Footprint (BCF) and on the embodied carbon resulting from the delivery of the programme.
Upfront costs associated with this programme (e.g. embodied carbon from the manufacture and supply of components and associated civil engineering works) should be considered against our ongoing operational need to maintain the resilience of our assets and networks.
Supply chain sustainability For us to take full account of the whole-life carbon impact of our LV Switchgear Modernisation programme, we need access to reliable data to be provided by our suppliers. The need for carbon and

ED2-NLR(A)-SPEN-001-SWG-EJP – LV Switchgear Outdoor Issue 2
26
other sustainability credentials to be provided now forms part of our wider sustainable procurement policy.
We believe that such a requirement sends a strong message to our suppliers that we take sustainability seriously, and that such positive engagement is key to improving the overall sustainability of our collective supply chain.
Resource use and waste The LV Switchgear Modernisation programme will result in the consumption of resources and the generation of waste materials from end of life assets.
Where waste is produced it will be managed in accordance with the waste hierarchy which ranks waste management options according to what is best for the environment. The waste hierarchy gives top priority to preventing waste in the first instance, then preparing for re-use, recycling, recovery, and last of all disposal (e.g. landfill).
Biodiversity/ natural capital The LV Switchgear Modernisation programme will only affect developed sites containing existing assets, so the impact on, and the opportunity to improve biodiversity and natural capital is expected to be minimal.
Preventing pollution SPEN will always follow all relevant waste regulations and will make sure that special (hazardous) waste produced or handled by our business is treated in such a way as to minimise any effects on the environment.
Visual amenity SPEN continually seeks to reduce the landscape and visual effects of our networks and assets. However, as the LV Switchgear Modernisation programme only consists of relatively minor works to developed sites containing existing assets, there is little visual impact for us to mitigate in this instance.
Climate change resilience In addition to our efforts to minimise our direct carbon emissions in line with our net-zero ambitions, we are also conscious of the need to secure the resilience of our assets and networks in the face of a changing climate. We have also modified our policy on vegetation control in the face of higher temperatures and longer growing seasons.
7 Conclusion The RIIO-ED2 LV Switchgear outdoor investment programme is a targeted condition-driven modernisation programme designed to manage the levels of network risk by prioritising intervention on the poorest condition and highest risk assets in RIIO-ED2. Proposed investment levels are overall consistent with historic investment levels for these asset categories and can be sufficiently justified using CNAIM methodology and other cost benefit analysis tools. Assets have been identified through a targeted risk-based approach, which manages levels of network risk and reduces forecast asset failure rates by ensuring intervention occurs at the optimal time for each asset.

ED2-NLR(A)-SPEN-001-SWG-EJP – LV Switchgear Outdoor Issue 2
27
The option chosen in this EJP has the highest whole life NPV when monetised risk benefit is included in the cost benefit analysis, and has deliverable volumes which have been profiled using the Optimisation Engine to identify which year within ED2 is optimal for intervention on each asset.
This proposal results asset modernisation for 4,037 link box and street pillar assets across both licences (2,052 in SPD, 1,985 in SPM). It also includes condition-driven civils intervention on 3,155 LV assets (1,390 in SPD and 1,765 in SPM) which have been assumed to improve the health index of each asset. Also included in this proposal is the continuation of our RIIO-ED1 strategy to install link box fire blankets in our high-risk legacy link boxes, with this proposal seeing 100 new blankest purchased in each licence.
The total programme costs £31.181m, which is split with £15.466m in SPD and £15.715m in SPM, and there is a total monetised risk benefit of £61.236m.

ED2-NLR(A)-SPEN-001-SWG-EJP – LV Switchgear Outdoor Issue 2
28
8 Appendix 1 The list of known single phase link boxes which have been identified for replacement in ED2 are shown in Table 8.1.
Table 8.1. Known single phase link boxes, using CNAIM v2.1 for future health index
Asset ID District Age Future Risk Index Band 11166623 Wirral 61 HI5 | C2
11184946 Wirral 72 HI5 | C2
11167130 Wirral 61 HI5 | C1
11167060 Wirral 61 HI5 | C1
11166637 Wirral 61 HI3 | C2
11167116 Wirral 61 HI5 | C2
11185417 Wirral 61 HI5 | C2
11167141 Wirral 61 HI5 | C2
11185381 Wirral 61 HI5 | C3
11185442 Wirral 61 HI5 | C3
11185410 Wirral 61 HI5 | C2
11166835 Wirral 63 HI5 | C3
11166431 Wirral 61 HI5 | C2
11185403 Wirral 61 HI5 | C2
11167120 Wirral 61 HI5 | C2
11167004 Wirral 62 HI5 | C2
11167026 Wirral 60 HI5 | C2
11185426 Wirral 59 HI3 | C2
11185888 Wirral 61 HI3 | C2
11167108 Wirral 61 HI3 | C2
11167187 Wirral 61 HI5 | C2
11166628 Wirral 61 HI5 | C2
11166661 Wirral 61 HI3 | C2
11184679 Wirral 59 HI5 | C2
11166626 Wirral 61 HI5 | C3
11185907 Wirral 61 HI3 | C2
11166508 Wirral 61 HI3 | C2
11166639 Wirral 61 HI3 | C2
11185416 Wirral 61 HI5 | C2
11166651 Wirral 54 HI3 | C2
11185890 Wirral 68 HI5 | C2
11167160 Wirral 61 HI3 | C2
11185446 Wirral 59 HI3 | C2
11167188 Wirral 58 HI5 | C2

ED2-NLR(A)-SPEN-001-SWG-EJP – LV Switchgear Outdoor Issue 2
29
11167105 Wirral 61 HI5 | C1
11185398 Wirral 61 HI5 | C1
11166644 Wirral 61 HI5 | C3
11167034 Wirral 61 HI5 | C2
11188482 Mid Cheshire 67 HI2 | C1
11185409 Wirral 61 HI3 | C2
11167127 Wirral 61 HI5 | C2
11185370 Wirral 61 HI5 | C2
11184992 Wirral 66 HI4 | C2
11166543 Wirral 10 HI5 | C2
11184695 Wirral 72 HI2 | C2
11166640 Wirral 61 HI3 | C2
11185449 Wirral 59 HI5 | C2
11166645 Wirral 61 HI5 | C2
11166607 Wirral 59 HI3 | C2
11185402 Wirral 61 HI5 | C2
11166621 Wirral 60 HI5 | C2
11167729 Wirral 69 HI5 | C3
11184989 Wirral 66 HI2 | C2
11166552 Wirral 61 HI5 | C2
11185435 Wirral 61 HI5 | C3
11166647 Wirral 61 HI5 | C2
11166609 Wirral 61 HI3 | C2
11166608 Wirral 61 HI5 | C2
11167019 Wirral 61 HI5 | C2
11185382 Wirral 59 HI5 | C2
11166618 Wirral 61 HI5 | C2
11167030 Wirral 61 HI3 | C2
11167131 Wirral 61 HI5 | C2
11185909 Wirral 61 HI5 | C2
11166509 Wirral 61 HI3 | C2
11166619 Wirral 61 HI5 | C2
11167156 Wirral 61 HI4 | C2
11185447 Wirral 59 HI3 | C2
11166656 Wirral 61 HI4 | C2
11166604 Wirral 59 HI5 | C2
11166616 Wirral 60 HI5 | C2
11185425 Wirral 32 HI1 | C2
11166600 Wirral 61 HI3 | C2
11167021 Wirral 61 HI5 | C2

ED2-NLR(A)-SPEN-001-SWG-EJP – LV Switchgear Outdoor Issue 2
30
11185889 Wirral 13 HI1 | C2
11185047 Wirral 73 HI2 | C2
11166557 Wirral 61 HI3 | C2
11185373 Wirral 61 HI5 | C1
11167144 Wirral 61 HI5 | C2
11167035 Wirral 60 HI5 | C2
11167165 Wirral 61 HI3 | C2
11167728 Wirral 69 HI5 | C3
11178810 Wirral 68 HI2 | C3
11166660 Wirral 61 HI5 | C3
11166556 Wirral 59 HI3 | C2
11167100 Wirral 61 HI3 | C2
11185419 Wirral 61 HI5 | C2
11166648 Wirral 61 HI5 | C2
11185438 Wirral 61 HI3 | C2
11185440 Wirral 59 HI3 | C2
11185423 Wirral 61 HI5 | C3
11167161 Wirral 60 HI3 | C2
11166605 Wirral 61 HI3 | C2
11166632 Wirral 61 HI3 | C2
11184678 Wirral 73 HI5 | C2
11166599 Wirral 61 HI3 | C2
11184936 Wirral 72 HI5 | C2
11166630 Wirral 61 HI5 | C2
11184755 Wirral 72 HI2 | C2
11167064 Wirral 61 HI5 | C2
11166624 Wirral 62 HI3 | C2
11185445 Wirral 59 HI3 | C2
11185408 Wirral 61 HI5 | C2
11166634 Wirral 60 HI5 | C2
11185415 Wirral 61 HI3 | C2
11166615 Wirral 61 HI3 | C2
11167143 Wirral 61 HI5 | C2
11166654 Wirral 61 HI5 | C2
11167115 Wirral 61 HI3 | C2
11185450 Wirral 59 HI3 | C2
11183637 Wirral 59 HI5 | C3
11184764 Wirral 72 HI5 | C2
11185451 Wirral 61 HI5 | C2
11185004 Wirral 66 HI4 | C2

ED2-NLR(A)-SPEN-001-SWG-EJP – LV Switchgear Outdoor Issue 2
31
11185906 Wirral 60 HI5 | C2
11167065 Wirral 60 HI5 | C2
11167136 Wirral 14 HI5 | C2
11166625 Wirral 61 HI5 | C2
11167112 Wirral 61 HI3 | C2
11185421 Wirral 61 HI5 | C3
11166614 Wirral 62 HI3 | C2
11184762 Wirral 74 HI5 | C2
11185427 Wirral 60 HI5 | C2
11166659 Wirral 61 HI5 | C2
11166641 Wirral 61 HI3 | C2