Windsor, Ontario Exposure Assessment Study: Design and Methods Validation of Personal, Indoor, and...
15
Windsor, Ontario Exposure Assessment Study: Design and Methods Validation of Personal, Indoor, and Outdoor Air Pollution Monitoring Amanda J. Wheeler Air Health Science Division, Health Canada, Ottawa, Ontario, Canada Xiaohong Xu Department of Civil and Environmental Engineering, University of Windsor, Windsor, Ontario, Canada Ryan Kulka and Hongyu You Air Health Science Division, Health Canada, Ottawa, Ontario, Canada Lance Wallace Consultant, Reston, VA Gary Mallach, Keith Van Ryswyk, Morgan MacNeill, and Jill Kearney Air Health Science Division, Health Canada, Ottawa, Ontario, Canada Pat E. Rasmussen Exposure and Biomonitoring Division, Health Canada, Ottawa, Ontario, Canada Ewa Dabek-Zlotorzynska and Daniel Wang Analysis and Air Quality Division, Environment Canada, Ottawa, Ontario, Canada Raymond Poon Hazard Identification Division, Health Canada, Ottawa, Ontario, Canada Ron Williams Exposure Measurements and Analysis Branch, U.S. Environmental Protection Agency, Research Triangle Park, NC Corinne Stocco Air Health Science Division, Health Canada, Ottawa, Ontario, Canada Angelos Anastassopoulos Department of Civil and Environmental Engineering,Carleton University, Ottawa, Ontario, Canada J. David Miller Department of Chemistry, Carleton University, Ottawa, Ontario, Canada Robert Dales Populations Studies Division, Health Canada, Ottawa, Ontario, Canada Jeffrey R. Brook Air Quality Research Division, Environment Canada, Toronto, Ontario, Canada ABSTRACT The Windsor, Ontario Exposure Assessment Study evalu- ated the contribution of ambient air pollutants to per- sonal and indoor exposures of adults and asthmatic chil- dren living in Windsor, Ontario, Canada. In addition, the role of personal, indoor, and outdoor air pollution expo- sures upon asthmatic children’s respiratory health was assessed. Several active and passive sampling methods were applied, or adapted, for personal, indoor, and out- door residential monitoring of nitrogen dioxide, volatile TECHNICAL PAPER ISSN:1047-3289 J. Air & Waste Manage. Assoc. 61:142–156 DOI:10.3155/1047-3289.61.2.142 Copyright 2011 Air & Waste Management Association 142 Journal of the Air & Waste Management Association Volume 61 February 2011
-
Upload
independent -
Category
Documents
-
view
0 -
download
0
Transcript of Windsor, Ontario Exposure Assessment Study: Design and Methods Validation of Personal, Indoor, and...

Windsor, Ontario Exposure Assessment Study: Design andMethods Validation of Personal, Indoor, and Outdoor AirPollution Monitoring
Amanda J. WheelerAir Health Science Division, Health Canada, Ottawa, Ontario, Canada
Xiaohong XuDepartment of Civil and Environmental Engineering, University of Windsor, Windsor, Ontario, Canada
Ryan Kulka and Hongyu YouAir Health Science Division, Health Canada, Ottawa, Ontario, Canada
Lance WallaceConsultant, Reston, VA
Gary Mallach, Keith Van Ryswyk, Morgan MacNeill, and Jill KearneyAir Health Science Division, Health Canada, Ottawa, Ontario, Canada
Pat E. RasmussenExposure and Biomonitoring Division, Health Canada, Ottawa, Ontario, Canada
Ewa Dabek-Zlotorzynska and Daniel WangAnalysis and Air Quality Division, Environment Canada, Ottawa, Ontario, Canada
Raymond PoonHazard Identification Division, Health Canada, Ottawa, Ontario, Canada
Ron WilliamsExposure Measurements and Analysis Branch, U.S. Environmental Protection Agency, ResearchTriangle Park, NC
Corinne StoccoAir Health Science Division, Health Canada, Ottawa, Ontario, Canada
Angelos AnastassopoulosDepartment of Civil and Environmental Engineering,Carleton University, Ottawa, Ontario, Canada
J. David MillerDepartment of Chemistry, Carleton University, Ottawa, Ontario, Canada
Robert DalesPopulations Studies Division, Health Canada, Ottawa, Ontario, Canada
Jeffrey R. BrookAir Quality Research Division, Environment Canada, Toronto, Ontario, Canada
ABSTRACTThe Windsor, Ontario Exposure Assessment Study evalu-ated the contribution of ambient air pollutants to per-sonal and indoor exposures of adults and asthmatic chil-dren living in Windsor, Ontario, Canada. In addition, the
role of personal, indoor, and outdoor air pollution expo-sures upon asthmatic children’s respiratory health wasassessed. Several active and passive sampling methodswere applied, or adapted, for personal, indoor, and out-door residential monitoring of nitrogen dioxide, volatile
TECHNICAL PAPER ISSN:1047-3289 J. Air & Waste Manage. Assoc. 61:142–156DOI:10.3155/1047-3289.61.2.142Copyright 2011 Air & Waste Management Association
142 Journal of the Air & Waste Management Association Volume 61 February 2011

organic compounds, particulate matter (PM; PM � 2.5 �m[PM2.5] and � 10 �m [PM10] in aerodynamic diameter),elemental carbon, ultrafine particles, ozone, air exchangerates, allergens in settled dust, and particulate-associatedmetals. Participants completed five consecutive days ofmonitoring during the winter and summer of 2005 and2006. During 2006, in addition to undertaking the airpollution measurements, asthmatic children completedrespiratory health measurements (including peak flowmeter tests and exhaled breath condensate) and trackedrespiratory symptoms in a diary. Extensive quality assur-ance and quality control steps were implemented, includ-ing the collocation of instruments at the National AirPollution Surveillance site operated by Environment Can-ada and at the Michigan Department of EnvironmentalQuality site in Allen Park, Detroit, MI. During field sam-pling, duplicate and blank samples were also completedand these data are reported. In total, 50 adults and 51asthmatic children were recruited to participate, resultingin 922 participant days of data. When comparing themethods used in the study with standard reference meth-ods, field blanks were low and bias was acceptable, withmost methods being within 20% of reference methods.Duplicates were typically within less than 10% of eachother, indicating that study results can be used with con-fidence. This paper covers study design, recruitment,methodology, time activity diary, surveys, and qualityassurance and control results for the different methodsused.
INTRODUCTIONThe challenges of assigning exposure on an individualbasis have received increasing commentary in the litera-ture with several studies being conducted to better assessthe impact of exposure misclassification in health effectsresearch.1–3 The impact of air pollutants on the health ofsusceptible populations such as the elderly,4 diabetics,5
children,6 and asthmatics7–10 indicate that exposuresources and baseline health are important factors for guid-ing regulatory decisions related to ambient or indoor airquality guidelines or standards.
Human exposure to air pollution is influenced byindoor and outdoor sources as well as personal activities;the complex interplay of these factors complicates theinterpretation of personal exposures. This research willaddress these challenges by assessing exposures for adultpopulations and asthmatic children.
There are several air pollutants known to have po-tential human health impacts, including particulatematter (PM; PM � 2.5 �m [PM2.5] and � 10 �m [PM10]in aerodynamic diameter), nitrogen dioxide (NO2), al-lergens in settled dust, volatile organic compounds(VOCs), and ozone (O3), as well as constituents of PM2.5
such as elemental carbon (EC), ultrafine particles(UFPs), and metals. It is important to identify all po-tential sources of personal exposures to these pollutantsin an effort to understand source-specific impacts aswell as the potential for misclassification of exposureand the role that this may have on discerning healthimpacts. Outdoor sources include traffic emissions, in-dustrial emissions, long-range transport, secondary for-mation of pollutants in the atmosphere, and personalactivities such as refueling vehicles and using a barbe-cue. Outdoor-generated pollutants also affect indoorenvironments via infiltration11–13; therefore, housingcharacteristics that affect infiltration are important toconsider. Indoor sources of exposure also include off-gassing of building materials, combustion processessuch as cooking, use of personal care and cleaningproducts, cigarette smoke, and presence of pets.14 Sev-eral studies that have included personal, indoor, andoutdoor pollutant measurements have found that per-sonal exposures can exceed indoor and outdoor con-centrations.15–18 These findings suggest that not all per-sonal exposures are captured by residential indoor andoutdoor measurements. In the case of particulate airpollution, simple movement by residents in the homecan resuspend particles from clothes or carpeting. Beingclose to gas stoves may increase exposure to NO2 in-doors. Recent literature suggests that time spent in traf-fic can contribute significantly to personal exposuresfor various air pollutants.19–21 In addition, locationssuch as work, school, restaurants, and other indoorlocations are also known to contribute to personal ex-posures.22,23
As part of the Border Air Quality Strategy (BAQS), theWindsor, Ontario Exposure Assessment Study (WOEAS)was conducted in 2005 and 2006 in Windsor, Ontario, tounderstand air quality issues in this area. One objectivewas to examine the relationships between indoor andoutdoor concentrations and personal exposures to vari-ous air pollutants, including PM, O3, NO2, and VOCs. Thegoal of this research was to develop a better understand-ing of factors affecting these relationships for adults andasthmatic children. A second objective was to examinethe role of personal, indoor, and outdoor air pollutionexposures upon asthmatic children’s respiratory healthwith the goal of identifying what sources of exposure hadthe greatest impact upon health.
Windsor is a relatively small geographical area (120.6km2) that is impacted by various ambient air pollutionsources. It is the site of one of the major border crossingsto the United States and is therefore affected by largevolumes of commercial truck traffic. Windsor also hasseveral local industries such as automobile manufactur-ing. Finally, there is long-range transportation of pollut-ants from the United States.24,25
IMPLICATIONSIt is important to obtain data to identify any factors thatcan influence the relationships among personal, indoor,and outdoor concentrations for a range of air pollutants.Ensuring that the methods used are valid and compara-ble to reference methods used in typical air pollution,monitoring is crucial for data to be of use to regulators.These exposure data can then be used to develop riskmanagement policies that reduce personal and indoorexposures to air pollutants.
Wheeler et al.
Volume 61 February 2011 Journal of the Air & Waste Management Association 143

This manuscript presents the study design and meth-odology as well as important data for method validationsincluding quality assurance and control. It includes sum-mary results for recruitment, time activity diaries, andsurveys.
MATERIALS AND METHODSStudy Design
Health Canada and the University of Windsor con-ducted a personal exposure study with Windsor adultsin 2005 and asthmatic children in 2006. Personal andresidential indoor and outdoor exposures were assessedover a period of 10 days, with a total of 5 sampling dayseach in the winter (January to March) and summer (Julyto August) of each year. Pollutants included in thestudy were NO2, VOCs, O3, UFPs, EC, PM2.5, PM10, andcomponents of PM including EC, nitrate, and metals.Ancillary measurements included air exchange rates(AERs), temperature, relative humidity (RH), and settleddust as well as respiratory health measures collected forasthmatic children in 2006. Sampling began Mondayevenings at approximately 4:00 p.m. and ended onSaturday evenings at approximately the same time. Atthe end of each 24 � 3-hr interval, teams of two tech-nicians visited each home to refurbish sampling equip-ment, check for mechanical malfunctions, and admin-ister questionnaires. All data were collected over 8consecutive weeks per season, with a total of six homes
being sampled concurrently. Personal sampling wasconducted by having participants carry a small back-pack housing air pollution monitoring equipment. Par-ticipants were asked to keep the backpack with themthroughout their daily activities, although no directmethods were applied to assess compliance. If theywere in one location for an extended period of time(i.e., at school or work) they were instructed to placethe backpack close to them with the sampling inletfacing up. Indoor residential monitoring was con-ducted by placing equipment inside of the participant’shome (i.e., typically within the family or living roomwhere participants spent a substantial amount of time).Outdoor residential monitoring was located in thebackyard several meters away from the home and awayfrom any combustion sources such as barbecues anddriveways. Indoor and outdoor residential samplingwas conducted at breathing height (1.5 m). The WOEASdesign paralleled that of the U.S. Environmental Pro-tection Agency’s (EPA) Detroit Exposure and AerosolResearch Study (DEARS) with respect to sampling peri-ods, days of the week, and survey and questionnairedesign18 so that environmental data from both citiescould be used to investigate border air quality issues inthe region. Table 1 provides details for the methods andinstrumentation used in the WOEAS.
Approval was obtained from Health Canada andthe University of Windsor Research Ethics Boards to
Table 1. Target variables and instrumentation.
Variable Instrument/Equipment Principle Frequency Location
PM2.5 and PM10 (mass) Impactor Gravimetric Daily Indoor, outdoor, personal (PM10 2005personal only)
PM2.5-associated nitrate Impactor and denuder Daily Indoor, outdoor, personalPM2.5 (mass) TEOM Piezoelectric Daily Central site (NAPS)PM2.5 and coarse particles
(PM10-PM2.5)Dichotomous (virtual
impactor)Gravimetric Daily Outdoors only at Allen Park, Detroit, MI
NO2 Ogawa Diffusion Daily Indoor, outdoor, personalO3 Ogawa Diffusion Daily (summer only) Personal, outdoorFine particles (�0.1 �m
to �2.5 �m)DustTrak Optical Every 3 min Indoor, outdoorpDR Optical Every 3 min Personal (2006 only)
UFPs (number) (20 nm to�1 �m)
PTrak Condensation particlecounter (CPC)
Every 30 sec for 10 min eachhour
Indoor, outdoor
EC Aethalometer Absorption at 880nm
Every 3 min; alternatinglocation every half hourduring day and hourly atnight
Indoor, outdoor
AER PFT Tracer gas collection Daily IndoorTemperature/RH Smart Reader Plus 2 Thermistor thin film Every 3 min Indoor, outdoorHousehold characteristics
and personal activitiesQuestionnaire, diary Once per household, daily for
activitiesNA
Settled dust HVS3 vacuum Once after the completion ofthe air pollutionmeasurements
Indoor
Lung function PiKo-1 peak expiratoryflow meter
Morning and eveningpremedication use
Personal (2006 only)
Exhaled breath condensate(EBC)
RTube Evening daily Personal (2006 only)
Notes: Ancillary meteorological variables (wind speed and direction, atmospheric pressure, visibility, and weather conditions) were also obtained from EnvironmentCanada and added to the dataset. NA � not applicable.
Wheeler et al.
144 Journal of the Air & Waste Management Association Volume 61 February 2011

conduct this study and all personal information is pro-tected according to the Canadian Access to InformationAct and the Privacy Act.
Sample Population: Recruitment and RetentionIn 2005, an initial pool of potential volunteer participantfamilies was identified from the Windsor Children’s Re-spiratory Health Study.7 From the pool of potential par-ticipants, homes meeting inclusion criteria were ran-domly selected and their adult residents were approachedfor participation. Adults were considered eligible for studyinclusion if they were nonsmoking, living in a detachedhome, had an asthmatic child, were not occupationallyexposed to VOCs, and did not have any workplace restric-tions on carrying the personal monitoring equipment.Using these criteria, a pool of 90 eligible volunteers wasestablished. Among the eligible volunteers, preferencewas subsequently given to households that were spatiallydistributed across Windsor.
In 2006, eligible participants included physician-diagnosed asthmatic children between 10 and 13 yr ofage. Of the available pool of candidates drawn from aprevious study of 186 asthmatic children,4 further consid-eration was given to ensuring an approximately evenspatial distribution of homes across Windsor. Figure 1identifies residential locations.
Given the above mentioned eligibility criteria andthe need to ensure that there would be sufficient statis-tical power to assess the role of personal, indoor, andoutdoor air pollution exposures upon asthmatic chil-dren’s respiratory health, a power calculation was con-ducted. Statistical power estimates were calculated andapplied for both years by taking into account the re-peated measures design of the study. Because of corre-lations within the data, standard power calculationswere adapted to account for dependencies. Using amethodology described by Killip et al.,26 the effectivesample size was first calculated. This involved estimat-ing the intraclass correlation coefficient (ICC) for thestudy participants using personal monitoring data col-lected in previous publications; their values of the vari-ance of forced expiratory volume in 1 sec (FEV1) scoresin asthmatic children were also used.27,28
The ICC is a ratio of the variability between subjectsto the total variability,
ICC � � �sb
2
sb2 � sw
2 (1)
where sb2 is the variance between individuals and sw
2 is thevariance within individuals.
The effective sample size was then estimated by di-viding the total number of planned observations (n �
Figure 1. Map of participant locations and NAPS site.
Wheeler et al.
Volume 61 February 2011 Journal of the Air & Waste Management Association 145

480) each year by the design effect. As outlined by Killipet al.,26 the design effect was estimated as
DE � 1 � ��M � 1 (2)
where DE is the design effect and M represents the num-ber of observations taken in each cluster. PASS software2007 (NCSS) was then applied to estimate the percentchange in FEV1 for a 10-�g/m3 increase in PM2.5 thatcould be detected with a power of 80%.
On the basis of these calculations, 48 participantswere recruited in each of the years. The study design wasnot intended to recruit a representative selection of thepopulation but rather to identify homes of susceptibleindividuals.
Participant retention was encouraged through severaltechniques. Before recruitment, two technicians visitedeach residence to demonstrate the monitoring equipmentas well as to answer any questions. During this visit,consent was obtained, the baseline housing questionnairewas completed, visit schedules were discussed, and suit-able locations for the indoor and outdoor monitoringequipment were identified. At the end of each season,participants were provided with a personalized report de-scribing their individual data in comparison to otherswho were monitored during the same week. These reportscontained guidance material from the Canadian Mort-gage and Housing Corporation and Health Canada ondifferent air pollutants. These were provided at a meetingwhere the principal investigator discussed study findingsand was available to answer participants’ questions. Be-tween sampling seasons in 2006, children were invited toa pizza party with their parents to provide them with theopportunity to meet other participating children and dis-cuss their experiences.
Passive SamplersDuring 2005 and 2006, personal, indoor, and outdoorOgawa passive samplers (Ogawa & Company) were used
to measure exposures to O3 and NO2. The O3 badge wasonly used for personal and outdoor monitoring. Thesampler used a single nitrite-coated quartz-fiber filterpurchased from the manufacturer. When O3 is presentin the sampled air, it diffuses into the filter and oxidizesthe nitrite to nitrate on an equimolar basis. The NO2
badge uses a single carbonate-coated quartz-fiber filter(also purchased from the manufacturer) to trap NO2.18
Sampling times were approximately 24 � 3 hr for eachbadge. The badges were located within the breathingzone for the personal samples and were placed in amanifold-type device that housed all of the active andpassive samplers, thus ensuring constant airflow acrossthe face of the passive badges. Figure 2 demonstratesthe personal, indoor, and outdoor monitoring equip-ment setup. All Ogawa badges were refrigerated duringstorage and shipping.
The Ogawa filters were analyzed according to theOgawa Standard Operating Protocols. The only devia-tion from the O3 method was that the protocol assumestwo filters were used for measurements and in theWindsor situation there was only one filter. The sam-pling rate was therefore half of the rate cited in theprotocol. After exposure, the O3 nitrite-coated filter wasextracted with ultrapure (Milli-Q) water, whereas theNO2 carbonate-coated filter was extracted with 0.09%(v/v) hydrogen peroxide. Both extracts were analyzedby ion chromatography (IC) using Dionex DX-300 orDX-600 IC systems. Nitrate from the extracts of the O3
filter was analyzed using a Dionex IonPacAS15 columnand gradient elution, whereas nitrate and other anionsextracted from the NO2 filter was analyzed using aDionex-AS4A column with carbonate/bicarbonate elu-ent. Calibration checks were performed daily beforeanalysis of the field samples and once in every 10–15samples using standards prepared from National Insti-tute for Standards and Technology (NIST) traceablestandards.
Figure 2. Picture of equipment setup: (a) indoor and outdoor monitors, (b) personal setup, and (c) VOC canister.
Wheeler et al.
146 Journal of the Air & Waste Management Association Volume 61 February 2011

Selected VOCs in air were collected using cleaned andevacuated Summa canisters. During both years, indoorand outdoor measurements were made at each of theresidences using 6-L canisters deployed every 24 hr. Dur-ing 2005, the adult participants also carried a 1-L Summacanister within the padded backpack to monitor theirpersonal exposures. The canisters sampled at flow rates of3.5 and 0.5 mL/min for the 6- and 1-L canisters, respec-tively. The passive canister sampling systems includedfour basic components: an in-line Swagelok filter with a2-�m stainless-steel sintered filter to eliminate particu-lates, a restrictor, a Veriflow SC423XL back-pressure flowregulator, and a vacuum gauge. The back-pressure flowregulator ensured that approximately a 0.5- to 1-psi pres-sure drop across the restrictor was maintained until thecanister was within 1 to 2 psi of reaching atmosphericpressure, after which the regulator no longer maintaineda 1-psi differential across the orifice, resulting in a drop inflow rate. The flow controllers were assembled in thelaboratory and leak tested. EPA Compendium MethodTO-15 requires that the flow controllers be certified cleanbefore use. The flow controllers were certified as clean bypassing humidified, high-purity air through the flow con-troller into evacuated canisters that were then analyzedby gas chromatography–mass spectrometry; if no VOCconcentrations were greater than 0.2 parts per billion byvolume (ppbv), the flow controllers were determined tobe clean. The certified flow controllers were then cappedwith Swagelok fittings and shipped to the site for sam-pling. The Summa canister analysis methods followed theEPA Compendium Method TO-15. The 2005 VOC analyt-ical methods and quality assurance data have been pub-lished elsewhere.17
Continuous MeasurementsContinuous measurements of PM2.5, UFPs, EC, andtemperature/RH were collected indoors and outdoors ateach residence using DustTrak (model 8520, TSI), PTrak(model 8525, TSI), Aethalometer (AE-42, Magee ScientificCompany), and Smart Reader Plus 2 (ACR Systems, Inc.)monitors, respectively. These methods and their valida-tion are included in a companion manuscript detailingtheir performance,29 and precision and limits of detec-tion (LOD) calculation methods are summarized brieflybelow.
Two DustTrak instruments (one indoors and one out-doors) were deployed at each residence; these are opticalinstruments capable of measuring particles from approx-imately 0.3 �m in diameter up to 2.5 �m. The PTrakmeasurements of UFP number concentrations were alsoconducted indoors and outdoors but for only 10 min/hrin each location (twenty 30-sec averages) because oftheir limited alcohol storage reservoir volume. Al-though PTraks count all particles from 20 nm to 1 �m,the instrument is considered to monitor mainly UFPbecause approximately 80–99% of these particles arebelow 0.1 �m.30
The Aethalometer measures light absorption fromparticles collected on a quartz fiber tape. Because only alimited number of Aethalometers were available, only one
unit was operated at each residence to sample EC indoorsand outdoors; the intake was programmed to switch be-tween indoor sampling and outdoor sampling every 30min during the day and hourly at night. The PTrak in-struments were programmed to synchronize with theAethalometer as it switched from an indoor to an outdoorair intake.
In 2006, the asthmatic children carried an active sam-pling personal DataRAM (pDR) (Thermo Scientific) tomeasure continuous PM2.5; the cut size was ensured bypumping the intake air through a 1.8-L/min PM2.5 per-sonal environmental monitor (PEM; Chempass SystemR&P/Thermo) with no filter present. Like the DustTrak,the pDR uses optical means to measure particles smallerthan 2.5 �m and is laboratory calibrated to a NIST particlestandard.22 The pDR uses a laser at higher frequency (i.e.,lower wavelength) than the DustTrak; therefore, the high-est sensitivity regions for these instruments occurred atsomewhat different diameters.
Active SamplersPM (PM2.5 and PM10) was measured using the R&PChempass multipollutant PEM (Chempass System R&P/Thermo) as described in Demokritou et al.31 Teflon filterswere preconditioned for 24 hr before mass measurement,following EPA quality assurance guidelines,32 at HealthCanada’s Archimedes M3 buoyancy-corrected gravimetricanalysis facility.33 Average daily SD of blank referencefilter measurements was typically �0.5–0.6 �g (n � 10–14), resulting in daily laboratory detection limits (LDLs)of 1.5–1.6 �g on the basis of 3 times the standard devia-tion (SD).34 Method detection limits for the study pre-sented here are based on variability introduced through-out all preweighing and postweighing steps, includingstorage for the entire time elapsed from removal of thefilter from its packaging to the final postweighing (typi-cally 1–2 months).
PM2.5 and PM10 measurements were collected in allthree locations (indoor, outdoor, and personal) duringthe 2005 monitoring. During 2006, PM10 was measuredonly indoors and outdoors using the PEM; the personalPM10 inlet was replaced by an active pDR as describedabove. Technicians ensured that the PM2.5 and PM10 tar-get flow rates were 4 L/min with an acceptable range of�20%. Flow rates were assessed before and after samplingevery 24 hr using a soap bubble flow meter (AP Buck).
In addition to the PEM samplers, there were twolow-flow particulate samplers operating at 0.8 L/min.One collected EC/organic carbon (OC) onto a prefiredquartz-fiber 15-mm filter (Pall-Gelman) and the othercollected particulate-associated nitrate through a de-nuder, which scrubbed gas-phase nitrates before col-lecting the particulates on precoated 15-mm glass-fiberfilters (Pall Gelman). The EC/OC filter analysis has yetto be completed and will not be included in this paper.The nitrate denuders were unreliable in 2005 and partof the winter 2006 because of problems with field lab-oratory protocols; therefore, only the acceptable dupli-cate data are included in this paper.
During the winter and summer of 2006, a prefiredquartz 37-mm fiber filter (Pall-Gelman) was placed in lineafter the pDR to collect the preseparated particulates
Wheeler et al.
Volume 61 February 2011 Journal of the Air & Waste Management Association 147
(PM2.5) that passed through the PEM inlet and the pDRunit. This filter was in place for all 5 days of each seasonat a flow rate of 1.8 L/min. During summer 2006, the samefilter type was also located indoors for the same 5-dayperiod. The filters will be analyzed for traffic markers(hopanes) in an attempt to understand longer-term expo-sure to traffic-related air pollutants. Analysis of these fil-ters is still pending, so details are not included in thispaper.
Settled dust was sampled by technicians using thehigh-volume surface sampling system (HVS3) vac-uum.35 Samples were typically collected during visitsscheduled 1 week after the conclusion of winter moni-toring to ensure that the request not to vacuum for aweek before the settled dust collection did not interferewith the air pollution monitoring. The sampling re-quired a minimum of 2 m2 of the floor in the living areato be vacuumed for a 4-min period. Technicians wereasked to ensure the collection of at least 1 g of dust. Asmall weighing scale was used to pre- and postweigh theamber glass bottle used to collect the sample in thefield. In the event that 1 g of dust could not be collectedfrom the 2 m2 (e.g., on hardwood floors), further livingspace was sampled to ensure sufficient sample for allintended analyses, with technicians noting any in-crease in sample area. Samples were stored in amberglass jars and a brown paper bag for shipping.
On receipt of the samples, the dust was sieved beforeextraction with a nonmetallic 300-�m sieve to removeany coarse material. Dust samples were further sieved into300- to 150-�m and �150-�m size fractions and recom-bined for analysis of house dust mite allergen (DerP1 andDerF1), cat allergen (Feld1), endotoxin, and (133)--D-glucan.
Allergens were assayed by monoclonal enzyme-linked immunosorbent assay. Endotoxin analyses werecompleted in accordance with the 1996 version of theAmerican Industrial Hygiene Association protocol de-scribed in the Field Guide for the Determination of Biolog-ical Contaminants in Environmental Samples. (133)--D-glucan was analyzed using the limulus ameobocytelysate-based method.
Metals in airborne PM and in the settled dust weredetermined using inductively coupled plasma (ICP)–massspectrometry.36–38
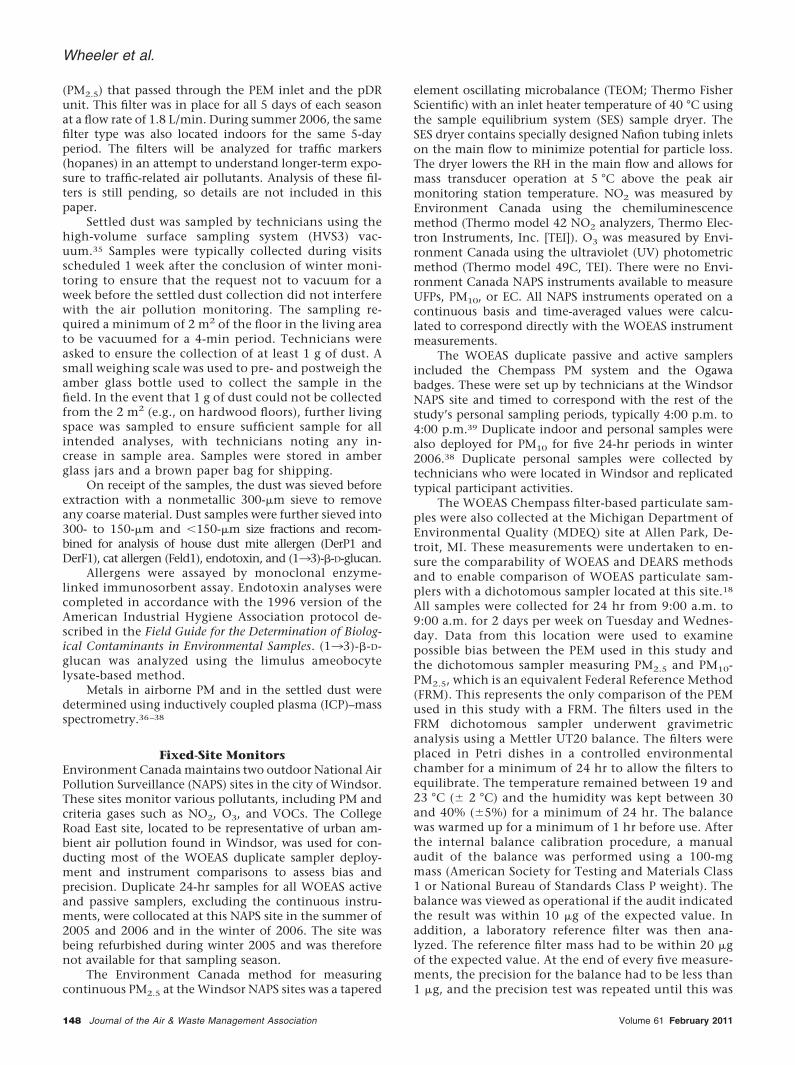
Fixed-Site MonitorsEnvironment Canada maintains two outdoor National AirPollution Surveillance (NAPS) sites in the city of Windsor.These sites monitor various pollutants, including PM andcriteria gases such as NO2, O3, and VOCs. The CollegeRoad East site, located to be representative of urban am-bient air pollution found in Windsor, was used for con-ducting most of the WOEAS duplicate sampler deploy-ment and instrument comparisons to assess bias andprecision. Duplicate 24-hr samples for all WOEAS activeand passive samplers, excluding the continuous instru-ments, were collocated at this NAPS site in the summer of2005 and 2006 and in the winter of 2006. The site wasbeing refurbished during winter 2005 and was thereforenot available for that sampling season.
The Environment Canada method for measuringcontinuous PM2.5 at the Windsor NAPS sites was a tapered
element oscillating microbalance (TEOM; Thermo FisherScientific) with an inlet heater temperature of 40 °C usingthe sample equilibrium system (SES) sample dryer. TheSES dryer contains specially designed Nafion tubing inletson the main flow to minimize potential for particle loss.The dryer lowers the RH in the main flow and allows formass transducer operation at 5 °C above the peak airmonitoring station temperature. NO2 was measured byEnvironment Canada using the chemiluminescencemethod (Thermo model 42 NO2 analyzers, Thermo Elec-tron Instruments, Inc. [TEI]). O3 was measured by Envi-ronment Canada using the ultraviolet (UV) photometricmethod (Thermo model 49C, TEI). There were no Envi-ronment Canada NAPS instruments available to measureUFPs, PM10, or EC. All NAPS instruments operated on acontinuous basis and time-averaged values were calcu-lated to correspond directly with the WOEAS instrumentmeasurements.
The WOEAS duplicate passive and active samplersincluded the Chempass PM system and the Ogawabadges. These were set up by technicians at the WindsorNAPS site and timed to correspond with the rest of thestudy’s personal sampling periods, typically 4:00 p.m. to4:00 p.m.39 Duplicate indoor and personal samples werealso deployed for PM10 for five 24-hr periods in winter2006.38 Duplicate personal samples were collected bytechnicians who were located in Windsor and replicatedtypical participant activities.
The WOEAS Chempass filter-based particulate sam-ples were also collected at the Michigan Department ofEnvironmental Quality (MDEQ) site at Allen Park, De-troit, MI. These measurements were undertaken to en-sure the comparability of WOEAS and DEARS methodsand to enable comparison of WOEAS particulate sam-plers with a dichotomous sampler located at this site.18
All samples were collected for 24 hr from 9:00 a.m. to9:00 a.m. for 2 days per week on Tuesday and Wednes-day. Data from this location were used to examinepossible bias between the PEM used in this study andthe dichotomous sampler measuring PM2.5 and PM10-PM2.5, which is an equivalent Federal Reference Method(FRM). This represents the only comparison of the PEMused in this study with a FRM. The filters used in theFRM dichotomous sampler underwent gravimetricanalysis using a Mettler UT20 balance. The filters wereplaced in Petri dishes in a controlled environmentalchamber for a minimum of 24 hr to allow the filters toequilibrate. The temperature remained between 19 and23 °C (� 2 °C) and the humidity was kept between 30and 40% (�5%) for a minimum of 24 hr. The balancewas warmed up for a minimum of 1 hr before use. Afterthe internal balance calibration procedure, a manualaudit of the balance was performed using a 100-mgmass (American Society for Testing and Materials Class1 or National Bureau of Standards Class P weight). Thebalance was viewed as operational if the audit indicatedthe result was within 10 �g of the expected value. Inaddition, a laboratory reference filter was then ana-lyzed. The reference filter mass had to be within 20 �gof the expected value. At the end of every five measure-ments, the precision for the balance had to be less than1 �g, and the precision test was repeated until this was
Wheeler et al.
148 Journal of the Air & Waste Management Association Volume 61 February 2011

achieved. Further tests involved analyzing a laboratoryfilter blank for long- and short-term drift of filterweights. After the analysis of every 25th filter, a randomre-weigh of at least one filter was performed. The orig-inal and re-weigh values had to differ by less than �6�g of the original weight. If not, all of the 25 filters werere-weighed until the required precision was achieved.
Comparison of the personal monitors to a referencemethod is a crucial requirement in determining the reli-ability of the data. Two regression methods were used tocompare the samplers. Ordinary least-squares (OLS) re-gression minimizes the vertical distance between the datapoints and the line of best fit. This type of regression issometimes said to assume no error in the x-axis measure-ments; however, it is also the best estimate of the y-axisvalues given the x-coordinate although the x-coordinateis in error.40 Orthogonal regression recognizes that errormay occur in both measurement methods; therefore, itminimizes the perpendicular distance to the line of bestfit. However, this approach assumes equal variance in thetwo measurement methods, which is seldom the case.Reduced major axis (RMA) regression is a form ofweighted orthogonal regression in which the ratio of thevariances is used to modify the angle between a data pointand the line of best fit. The RMA method results is the bestestimate of the “true” relationship between the two meth-ods. It has been recommended as the best way to deter-mine whether candidate methods can be certified as ref-erence methods for environmental measurements.41
Therefore, OLS and RMA regression methods were carriedout on the PEM2.5 and PEM10 monitors versus the dichot-omous sampler.
AERsA daily assessment of air exchange was undertaken ineach of the homes using perfluorocarbon tracer (PFT)gas.42 Four sources of the tracer gas were set up on themain floor of the home at the beginning of the first day toallow the gas to equilibrate for 2 hr during equipmentsetup. The emitters were deployed for the duration of the5-day sampling period in each season. One receptor (cap-illary adsorption tube [CAT]) was installed daily at a loca-tion away from any potential ventilation or heatingsources. The total amount of the tracer gas absorbed bythe receptors combined with the square footage of eachhome as determined from property tax records and theemission rate of the emitters was used to calculate a dailyaverage AER for each home.
Questionnaires and Time Activity DiariesAdult participants in 2005 and the parents of asthmaticchildren in 2006 completed two different question-naires to assess potential sources of exposure: (1) a base-line questionnaire to obtain information on housingcharacteristics that did not change over time, and (2) adaily questionnaire to obtain information on daily activ-ities such as cooking and cleaning. During the secondseason, the recruitment technician administered a shorterbaseline survey to assess any new renovations andchanges undertaken in the residence since the last seasonof sampling. In both years participants completed a timeactivity diary throughout the day, noting their activities
and their presence in various locations in 15- and 30-minintervals for the adults and children, respectively. Theadult diary included details on whether the individualcooked or cleaned (this was deemed less likely for thechildren and was removed from their diaries). Both diariesincluded information on whether the participants were inclose proximity to any smokers and for how long becausethis was deemed important in terms of increased exposureto air pollutants. Key locations noted on the diaries in-cluded at home, outside at home, in transit, at work/school, outside away from home, and inside away fromhome. Multiple responses could be included if activitiesor locations changed within the time interval. The activ-ities were then coded for all diaries and coding was con-firmed by manually assessing 10% of all diaries to ensureconsistency in interpretation of the descriptions. All sur-veys and diaries were independently entered twice andcompared electronically to each other to identify anydiscrepancies in the data entry.
Health MeasurementsDuring the 2006 sampling period, asthmatic childrenalso conducted respiratory health assessments, includ-ing FEV1, which was estimated using a PiKo-1 electronicpeak expiratory flow/FEV1 meter (Ferraris Medical).These instruments have comparable responsivenesswith pneumotachographs.43 Twice daily (first thing inthe morning, again at bedtime), three consecutive FEVmeasurements were made before taking any asthmamedications. During the technician visit in the eve-nings, an exhaled breath condensate sample was col-lected using an RTube (Respiratory Research, Inc.). Par-ticipants sat and orally breathed at tidal volumes into amouthpiece attached to a cold condenser for 10 min.Approximately 1 mL of breath condensate was col-lected. The condensed breath was then transferred toseveral microtubes and stored at �20 °C and then�80 °C until analyses. The sample was first analyzed foramylase to test for saliva contamination. This was fol-lowed by the measurement of the oxidative stress bio-markers thiobarbituric acid reactive substances and8-isoprostane and the inflammatory cytokine interleu-kin-6. All laboratory methods are described in detail inLiu et al.4 Children’s time activity diaries includedspace to report any symptoms, including cough,wheeze, chest tightness, and difficulty breathing. Thesesymptoms were scored from 0 to 4 where 0 indicated nosymptom and 4 indicated the worst symptoms. Scoringwas explained to the participants at the start of thestudy, and technicians reviewed the diaries each day toassess completeness.
Quality AssuranceLDLs were estimated as 3 times the SD of the laboratoryblanks, with field detection limits (FDLs) being defined as3 times the SD of the field blanks. Field blanks comprisedapproximately 10% of all samples. Duplicate outdoorsamples were collected at the NAPS sites.
The quality assurance program included the calibra-tion of flow rates, leak tests, collection of routine fieldblanks, and determination of precision and accuracy dur-ing sampling as well as for the chemical analyses. Various
Wheeler et al.
Volume 61 February 2011 Journal of the Air & Waste Management Association 149

quality control samples were used to determine accuracyand precision of the chemical analyses and to diagnoseany sources of contamination.36,38
Blank corrections were applied when more than 50%of the field blanks were greater than the LDL. In thesesituations, a FDL was then calculated as being 3 times theSD of the field blanks. Sample data were then adjusted bysubtracting the median of the field blanks. Any resultingvalues that were lower than the LDL were substituted with1⁄2LDL. Samples that were above the LDL but below theFDLs were not changed.
All data were assessed for validity using the followingcriteria. Any samples requiring a specific flow rate weretested at the beginning and end of each 24-hr samplingperiod; if the end flow rate was operating at a flow morethan 20% above or below the target flow rate, they weredeemed invalid. Samples were also deemed invalid if theywere deployed for more than 30 or less than 18 hr. Othercriteria for invalidating samples included presence of in-sects found during assembly, evidence that filters weremishandled in the field or laboratory, or noted sources ofcontamination in the field or the laboratory.
Duplicate comparisons for all methods, where thesedata exist, were used to assess precision estimates. Datafrom standardized methods used at the NAPS and MDEQwere used to yield estimates of bias.
The following bias definition, also frequently referredto as the fractional or percent difference, was utilized:
Bias �A � T
T(3)
where A is the instrument value and T is the true value.This returns a positive or negative number, which can bemultiplied by 100 to produce a “percent bias” normallyreported.
A precision calculation of two identical instrumentsis often defined as the absolute value (Abs) of the differ-ence between one instrument reading and the mean ofthe two, divided by that mean, which works out to be thedifference divided by the sum:
Abs�A � B /�A � B (4)
The idea in this definition is that when the true value isunknown, it can be assumed that it is near the average ofthe two instruments.
In many cases in this study, it was not just the com-parison of two instruments, but rather several, because allcontinuous instruments underwent before and after side-by-side intercomparisons. It was determined that a rea-sonable approach would be to compare the continuousinstruments to the median of their readings for any given3-min sampling period. In this case, the median was as-sumed to be close to the “true” reading. The resultingformula for the bias-corrected precision is
Abs�A� � T
T(5)
where A� is the bias-corrected value for instrument A andT is the median. For each collocation session, the correc-tion factor for each instrument was calculated as the ratioof the mean of all of the instruments’ medians to themean of each instrument. The correction for bias wasthen calculated by multiplying this correction factor inthat particular session by the mean (or median) of eachindividual instrument. This approach was typically ap-plied to the continuous instrument data.
For each pollutant, the laboratory results were com-bined with log-sheet data to calculate concentrations.Several coding flags were included to address any field orsample-specific issues that arose during the sample collec-tion: Each sample was coded as being valid, flagged, orinvalid. All analyses were conducted using SAS version 9.1(SAS Institute, Inc.).
RESULTSParticipant Retention Rates
Forty-eight adults were originally recruited for the win-ter and summer 2005 sampling sessions. However, be-cause five participants withdrew from the study afterthe winter session because of moving, renovatinghomes, or summer travel plans, two new additionalparticipants were recruited for the summer. Therefore,the total sample size was 48 and 45, in winter andsummer, respectively, with 43 of the same homes par-ticipating in both seasons. There were 5 male and 45female adult participants in total.
During the winter and summer of 2006, the totalsample size for the asthmatic children was 48 and 48,respectively, with 45 individuals participating in both
Table 2. Relative bias and precision of collocated samplers at NAPS.
Pollutant Method
Descriptive Statistics Bias Precision
n Mean SD p25 Median p75 p25 Median p75 p25 Median p75
NO2 (ppb) Ogawa 113 20 10 13 18 26 0.01 0.17 0.35 0.03 0.07 0.17EC 113 16 6 12 15 20
O3 (ppb) Ogawa 76 26 9 21 25 34 �0.15 �0.24 �0.39 0.05 0.09 0.17EC 76 36 11 29 36 42
Nitrate (�g/m3) Mini-PEM 56 1.9 1.6 1 1.5 2.1 – – – 0.03 0.07 0.13
Notes: p25, 25th percentile; p75, 75th percentile.
Wheeler et al.
150 Journal of the Air & Waste Management Association Volume 61 February 2011

seasons. In total, 51 asthmatic children were recruited forthis study with one winter and two summer sets of sib-lings being followed. The children were between 10 and13 yr of age with most (n � 31) being male. This age rangewas selected because children of this age are able to par-ticipate in personal monitoring and complete time activ-ity diaries with minimal supervision.
A total of 922 participant days were completed. Thiswas only 4% less than the intended 960 days, and was dueto the small number of participants who were unavailablein the second season. The compliance for the data collec-tion, including wearing the backpack and completing thediaries, was high. Participants reported to the techniciansdaily and highlighted any noncompliance due to restric-tive activities.
NO2
The mean WOEAS NO2 level over 2 yr of sampling at thecentral NAPS site was 20 ppb for the Ogawa badges, com-pared with 16 ppb for the collocated Environment Can-ada chemiluminescence method (Table 2). The Ogawabadges had a median bias compared with the NAPSmethod of 17% and a median precision of 7%.
O3
O3 sampling was only undertaken during the summerperiods. The mean value for both years was 36 ppb for theEnvironment Canada UV photometric method comparedwith 26 ppb for the WOEAS O3 collocated at the NAPS site(Table 2), resulting in a median bias of �24%. The OgawaO3 badges had a median precision of 9%.
VOCsVOC sampler deployment was intended to be 1395 sam-plers in 2005 (total number of indoor, outdoor, and per-sonal samplers for all participants) and 930 samplers in2006 (total number of indoor and outdoor samplers for allparticipants). However, the few participant retention is-sues described previously resulted in slightly lower num-bers of deployed canisters. In addition, a few deployedVOC canisters were deemed invalid and therefore ex-cluded from the analysis because of flow gauge failures,which was determined as a canister sampling time of lessthan 18 hr and/or the canister not being collected within30 hr of deployment. As a result, the total sample size forVOC canisters was 1294 in 2005 and 872 in 2006. AHealth Canada report including the full descriptive statis-tics for the 2005 and 2006 VOC data is available uponrequest.44
Continuous InstrumentsResults from the continuous instruments are presentedin a companion paper.29 Briefly, for both years and bothseasons there were 902 and 834 person days of indoorand outdoor data, respectively, collected for the Dust-Traks, 656 and 657 person days for the Aethalometers,666 and 659 person days for the PTraks, and during2006 personal pDR data resulted in 358 person days ofdata. The DustTrak and pDR had positive biases of afactor of approximately 2.5 and 1.6, respectively, com-pared with the PEM. However, their average bias-corrected precisions were within 10%, indicating that aproper correction for bias would bring them into very
Figure 3. (a) Comparison of the PEM2.5 sampler with the Allen Parkdichotomous sampler. (b) Comparison of the PEM10 sampler withthe Allen Park Dichotomous sampler.
Table 3. Comparison of gravimetric PEM to dichotomous reference sampler at Allen Park location: Bias and precision.
Pollutant (�g/m3) Method
Descriptive Statistics Bias Precision
n Mean SD p25 Median p75 p25 Median p75 p25 Median p75
PM2.5 Dichotomous sampler 38 15.8 8.8 9.0 13 21 1.04 1.11 1.19 0.03 0.07 0.12PEM 38 17.6 10.3 9.8 16 24
PM10 Dichotomous sampler 38 26.6 11.3 17 24 34 1.02 1.10 1.15 0.03 0.06 0.10PEM 38 29.0 12.6 20 27 38
PM10-PM2.5 Dichotomous sampler 38 10.4 3.2 8.2 9 13 0.94 1.09 1.19 0.05 0.12 0.24PEM 38 10.9 3.5 8.9 11 13
Notes: p25, 25th percentile; p75, 75th percentile.
Wheeler et al.
Volume 61 February 2011 Journal of the Air & Waste Management Association 151

good agreement with standard methods. Both instru-ments had LODs of approximately 5 �g/m3. Althoughno standard methods exist to establish the bias of theAethalometer and PTrak, their precision estimates werewithin 20% for the Aethalometer and within 10% forthe PTrak.
Chempass PM2.5 and PM10 PEMAllen Park Site. Intercomparisons between the two dif-ferent size fractions of the PEM PM2.5 and PM10 withthe FRM dichotomous sampler were conducted over thefour seasons. Because of missing data in either of thetwo size fractions of the FRM dichotomous sampler, atotal of 38 days were available for comparison of bothmethods. The slopes and intercepts of the two lines ofbest fit are provided in Figure 3, a and b. As can be seen,because of the excellent agreement of both PEMs withthe two dichotomous fractions, the OLS and RMA linesvirtually overlap. The PEM PM2.5 showed very goodagreement (R2 � 0.98) with the collocated Allen ParkFRM dichotomous sampler (Table 3, Figure 3a), al-though with a small positive median bias of 9%. Thebias was significant (95% confidence interval 1.07–1.15), and only 3 of the 38 paired samples were belowthe 1:1 line. The PM2.5 PEM showed good precision(median 7%). The PM10 PEM sampler also showed ex-cellent agreement (R2 � 0.97) with the reference di-chotomous sampler, with a median positive bias of 9%and a median precision of 6% (Table 3, Figure 3b). ThePEM estimate of coarse particle concentrations (PM10-PM2.5) agreed well with the dichotomous sampler, witha small positive bias of 9% and a slightly worse medianprecision of 12% (Table 3).
Details of the method evaluation for metals in air-borne PM in WOEAS have been described previouslyand outline quality assurance procedures during sam-pling, handling, and analysis; analytical method com-parisons; and collocated duplicates.36,37
NAPS Site. On the basis of its excellent performance incomparison with the FRM dichotomous sampler, the de-cision was made to use the PEM as the standard methodand then compare it with the TEOM at the Windsor NAPSsite. As found in other studies,45 the TEOM displayedstrong losses in the one winter season with collocateddata having a median negative bias of 51% (Table 4). Thesummer median bias was still negative but less so at �26%.
Particulate-Associated NitrateThe mini-PEM samplers for measuring particulate-associated nitrate required the coating of a denuder
Table 4. Comparison of gravimetric PM2.5 PEM with collocated TEOM at NAPS location: TEOM bias.
PM2.5 (�g/m3)
Descriptive Statistics TEOM Bias
n Mean SD p25 Median p75 p25 Median p75
WinterPEM 39 12.0 6.6 6.5 9.8 16.6 �0.59 �0.51 �0.47TEOM 39 6.0 3.8 2.8 5.0 7.4
SummerPEM 77 17.9 10.0 10.1 15.2 22.9 �0.32 �0.26 �0.16TEOM 77 13.7 8.7 6.9 12.0 18.8
Notes: p25, 25th percentile; p75, 75th percentile.
Table 5. Descriptive statistics of the study population by year.
Study Population 2005 2006
Gender (n)Male 5 31Female 45 20
Ethnicity (n), Caucasian (other) NA 48 (3)Age (n), yr
10 NA 2011 NA 2012 NA 1013 NA 1
Baseline housing characteristicsHome type (n)
Detached 50 42Row house 0 4Duplex/triplex 0 2Other 0 1
Home size (m2), mean 207.5 172Stove type (n), gas/electric 41/3 12/36Air cleaning device on furnace (n), yes/no 14 (30) 34 (12)Garage type (n)
No garage 14 21Detached 12 10Attached 23 16Attached no door 1 1
Daily questionnaire variables (number ofsampling days)
Season, summer/winter 229/239 240/240Candles used in the home today, yes (no) 28 (420) 27 (438)Windows open today, yes (no) 134 (315) 123 (338)Cooking, yes (no) 324 (128) 365 (99)Cleaning, yes (no/do not know) 226 (236) 254 (206/2)Presence of smokers, yes (no) 3 (445) 1 (463)Presence of pets, yes (no) 310 (139) 260 (204)
Time activity data, summer/winterPercent of time spent indoors at home 74.6/76.5 77.4/68.7Percent of time spent indoors away from
home3.8/0.5 9.8/5.8
Percent of time spent at work/school 5.6/5.4 0.6/18.5Percent of time spent in the yard or nearby 8.7/10.4 4.8/0.7Percent of time spent outdoors away from
home2.4/10.4 5.6/5.2
Percent of time spent in transit 4.8/6.3 3.4/3.7
Wheeler et al.
152 Journal of the Air & Waste Management Association Volume 61 February 2011

each time the samplers were used. Because of field lab-oratory problems, the consistency of the coating wasunreliable and all data from 2005 and part of winter2006 had to be discarded. The median bias for theNAPS-based WOEAS duplicate samplers was 7%. Therewas no reference method available at the NAPS site forbias calculations.
Settled DustA single dust sample was collected from each of theresidences in 2005 and 2006, resulting in a total of 93samples. Samples from the separated settled dust ofgrain size less than 300 �m were analyzed for dust miteallergens DerP1 and DerF1, cat allergen Feld1, endo-toxin, and (133)-D-glucan. For all of these analyses,only the DerP1 samples were found to have most of thesamples below the LDL, 35 and 23 of all of the samplescollected in 2005 and 2006, respectively, and as such,the replacement of 1⁄2LDL was not applied. For the remain-der of the allergen analyses, 1⁄2LDL was applied when any werebelow the LDL.
AERThe average daily AER for each residence was calculatedusing the calculated house volume and the knownamount of PFT that was emitted and trapped on thecorresponding daily CAT. A total of 30 and 45 homes inthe winter and summer, respectively, of 2005 and 33and 46 homes in winter and summer, respectively, of2006 had valid daily AER calculations. Homes missed inthe winter season of 2005 and 2006 were because ofdifficulties in financial contracting that resulted in thelate start of the AER sampling.
Questionnaire and Time Activity DiaryMost homes were detached, single-family dwellings (n �92) with electric stoves (n � 77). Approximately half ofthe homes had an attached garage. Summary statistics areprovided in Table 5.
Data obtained via the daily questionnaire on activ-ities that occurred in the residence included informa-tion on daily cooking, cleaning, presence of smokers,ventilation use, and candle use. Of all of the homesincluded in the study, only four homes had a smokerpresent at any point in the study, 257 sampling dayshad open windows, and on 55 of the sampling dayscandles were used.
The adults’ activity patterns did not alter signifi-cantly between winter and summer; therefore, bothseasons were combined in Table 5. Adults spent approx-imately 80% of their time indoors at home or indoorsaway from home, 10% of their time at work, 5.5% oftheir time in transit, and approximately 4.5% of theirtime outdoors. The children spent significantly moretime indoors at home in the summer than in the winter(77.4% versus 68.7%) and indoors away from home(9.8% versus 5.8%). In winter, the children spent sig-nificantly more time at school (18.5%) compared withsummer (0.6%). These children were also found tospend significantly more time outdoors in the summer
than during the winter, likely because of more favor-able weather conditions (23.5 °C vs. 0.5 °C mean tem-peratures in each season). The children spent 4.8% oftheir time in the yard at home or close to home in thesummer compared with only 0.7% in winter. No signif-icant differences in the average time spent in transitwere observed (3.7% in winter and 3.4% in summer).
Health MeasurementsDuring 2006, the asthmatic children completed peakflow measures, provided exhaled breath condensatesamples, and noted any symptoms in their diaries. Thebest three FEV1 and forced vital capacity (FVC) trialswere used. A total of 422 morning and 425 eveningFEV1 measurements were made together with 424morning and 428 evening FVC measurements. The ex-haled breath condensate sample was only completedeach evening with technician supervision, resulting in458 samples.
The children used the time activity diary to recordsymptom prevalence, and this indicated that only a smallpercentage of children reported any cough (2.6%), wheeze(1.6%), chest tightness (1.7%), or difficulty breathing (1.3%)at any point during the 10 days of sampling.
DISCUSSIONThere are several personal exposure studies that haveincluded healthy adults and asthmatic children, and ofthese studies the EPA DEARS conducted at the sametime as WOEAS is the most comparable in terms of theadult population and the methods used.18 The maindifference in the study designs was that DEARS in-cluded a randomly selected population. The WOEAS2006 asthmatic children represent a susceptible popu-lation with a similar age group to other personal mon-itoring studies that have been conducted.28,46,47 Thesample size for the 2006 WOEAS health measurementswas determined using a power calculation that wasbased on results obtained from Delfino et al.28 TheDelfino et al.28 study had a population of 19 partici-pants that completed a total of 710 FEV1 maneuvers;this is comparable with the Windsor results in whichthere were a total of 847 FEV1 maneuvers available foranalyses. Children in the age range of 10–13 yr havebeen shown to be capable of carrying out study activi-ties and complying with study requirements. Retentionof participants in both years was high (43 of 48 in 2005and 2006 completed two seasons of data collection); thesmall numbers of losses were due to home renovations andscheduling, with no losses attributed to study fatigue. Spatialrepresentativeness was more difficult to ensure seasonallybecause of participants’ scheduling requirements.
The Ogawa NO2 badge median precision of 7% inthis study is slightly higher than the findings byMukherjee et al.,48 who reported that eight paired du-plicate samples collected at two different locations(four pairs at each site) over 3, 4, and 7 days had percentrelative SD values less than 3.6%. The Quebec Citystudy conducted by Gilbert et al.49 found 7-day Ogawasamples had an average precision of 4.5%.
Similarly, the Ogawa O3 method had a precision of9%, although it underestimated the concentrations in
Wheeler et al.
Volume 61 February 2011 Journal of the Air & Waste Management Association 153

comparison to the NAPS measurements with a medianbias of �24%. Possible reasons for this bias are underinvestigation. Varns et al.50 also used the Ogawa sam-plers for O3 monitoring and conducted duplicate anal-yses as well as an estimate of bias compared with Dasibimodel 1008 continuous monitors. Their duplicate dataindicated that there was a median absolute difference of1.38 parts per billion (ppb) and a negative bias thatranged from 2.7 to 4.7 ppb over the four locations used.Typical O3 concentrations were 20–70 ppb in Texas,which is similar to the values found in Windsor. An-other paper by Gibson et al.51 showed their duplicateanalyses had an overall precision of 5.4%, whereas com-parisons at three locations with TEI model 49C contin-uous O3 analyzers had R2 values ranging from 0.82 to0.95.
The VOC Summa canisters proved to be an accept-able method of obtaining 24-hr indoor and outdoorresidential measurements in both years of sampling.Personal VOC measurements were restricted to the2005 adult population because the combined weight ofthe canister, personal pump, and battery was too heavyfor the children to carry. The total sample size for VOCcanisters was 1294 in 2005 and 872 in 2006, which was93 and 94% of the intended 1395 and 930 samples,respectively, and represents one of the largest VOCdatasets using this method.
The Chempass PM2.5 PEM compared well with theFRM dichotomous sampler over 2 yr of side-by-sidemeasurements at the Allen Park MDEQ site in Detroit.The PEM had an overall bias of �11% compared withthe FRM sampler. A regression of the PEM on the FRMshowed a small intercept and an R2 of 97%. The positivebias of 11% for the Windsor PEM PM2.5 is an improve-ment on the 18% positive bias noted for the MarplePEM2.5 in Ozkaynak et al.15 However, Liu et al.,52 afterinitially using oiled impactors and noting a large posi-tive bias averaging 7.7 �g/m3, switched to greased im-pactors and reported a negligible positive bias of 0.4�g/m3. Williams et al.53 reported that their PEM had a10 –20% higher mass concentration than the FRM,probably as a result of retention of semi-volatile organiccompounds (SVOCs) by the PEMs that are blown off byhigh filter face velocity samplers such as the dichoto-mous sampler.
Winter and summer comparisons for the study pre-sented here found that the PEM was approximately 52and 26% higher, respectively, than the TEOM. Differ-ences between the PEM and the TEOM have been pre-viously attributed to evaporation of PM volatiles in theTEOM measurements.45 The TEOM reads lower thanother filter-based methods because of its elevated inlettemperature, which causes a proportion of the volatilesin the particulates to be vaporized on intake. This biaswill vary depending on the proportion of volatiles inthe particulates.54 During the winter, when the temper-ature difference between ambient air and the filter isgreater, there may be greater volatilization than duringthe summer.45 The DustTrak and pDR PM2.5 agreed wellwith the gravimetric PEM PM2.5 method, (R2 of 87 and
71%, respectively). These continuous data are impor-tant indicators of peak exposures, which can be identi-fied through the location and activity data availablefrom the time activity diaries.
Time activity patterns are similar to those reportedin the Canadian Human Activity Pattern Survey55 andthose reported within the United States56 and otherdeveloped countries.57 Some of the biggest seasonaldifferences were due to the children being in schoolduring the winter sampling period compared with thesummer when school was not taking place; the adultpopulation did not have equivalent differences. Timespent outdoors was also influenced by season and bothpopulations spent more time outdoors in summer(�10% of their total day).
CONCLUSIONSMost WOEAS data can be used with confidence to ex-amine the relationships among personal, indoor, andoutdoor concentrations for the range of pollutantslisted. Predictors of these relationships can be deter-mined using the questionnaires and time activity diarydata, which were reviewed by the technicians on a dailybasis with the participants to ensure accuracy and com-pliance. The study can also be used to understand theimpact that ambient air pollution has on personal andindoor residential exposures. When the data are com-bined with the health effects data collected in 2006, itwill be possible to investigate the effects of personal,indoor, and outdoor air pollution exposures on respi-ratory health. These WOEAS data can be used withconfidence for developing risk management policies toreduce personal and indoor exposures to air pollutants.
ACKNOWLEDGMENTSThe participants and their families are gratefullythanked for their contributions to these 2 yr of datacollection; without them, none of this research wouldhave been possible. The careful field work undertakenby the numerous field technicians from Health Canadaand the University of Windsor is appreciated. The au-thors would like to acknowledge contributions from Dr.Paul Villeneuve (Health Canada) for the power calcula-tion; Alice Grgicak-Mannion (Great Lakes Institute forEnvironmental Research, University of Windsor) forthe map of residential locations; Mark Davey (Univer-sity of Washington), Steve Ferguson, and Dr. MikeWolfson (Harvard School of Public Health) for theirguidance on methods and laboratory analyses; SandyBenetti of Environment Canada for her help in theinitial coordination of the laboratory activities andsample analyses; Don Fugler of the Canadian Mortgageand Housing Corporation and Dr. Russell Dietz ofBrookhaven National Laboratory for their support withAER measurements; Environment Canada and MDEQfor permitting the authors to locate instruments at theCollege Road and Allen Park sites and access to theirdata for the method comparisons; and Dr. MarkeyJohnson and Dr. Scott Weichenthal from Health Can-ada for conducting the internal review. BAQS providedfunding through Health Canada. Although this work
Wheeler et al.
154 Journal of the Air & Waste Management Association Volume 61 February 2011

was reviewed by EPA and approved for publication, itmay not necessarily reflect official agency policy.
REFERENCES1. Sarnat, J.; Wilson, W.; Strand, M.; Brook, J.; Wyzga, R.; Lumley, T.
Panel Discussion review: Session One: Exposure Assessment and Re-lated Errors in Air Pollution Epidemiologic Studies; J. Expo. Sci. Environ.Epidemiol. 2007, 17, S75-S82.
2. Sarnat, S.E.; Klein, M.; Sarnat, J.A.; Flanders, W.D.; Waller, L.A.; Mul-holland, J.A.; Russell, A.G.; Tolbert, P.E. An Examination of ExposureMeasurement Error from Air Pollutant Spatial Variability in Time-Series Studies; J. Expo. Sci. Environ. Epidemiol. 2010, 20, 135-146.
3. Schwartz, J.; Sarnat, J.A.; Coull, B.A.; Wilson, W.E. Effects of ExposureMeasurement Error on Particle Matter Epidemiology: A SimulationUsing Data from a Panel Study in Baltimore, MD; J. Expo. Sci. Environ.Epidemiol. 2007, 17(Suppl 2), S2-S10.
4. Liu L.; Poon, R.; Chen, L.; Frescura, A.; Montuschi, P.; Ciabattoni, G.;Wheeler, A.J.; Dales, R. Acute Effects of Air Pollution on PulmonaryFunction, Airway Inflammation, and Oxidative Stress in AsthmaticChildren; Environ. Health Perspect. 2009, 117, 668-674.
5. Liu, L.; Ruddy, T.; Dalipaj, M.; Szyszkowicz, M.; You, H.; Poon, R.;Wheeler, A.J.; Dales, R. Influence of Personal Exposure to ParticulateAir Pollution on Cardiovascular Physiology and Biomarkers of Inflam-mation and Oxidative Stress in Subjects with Diabetes; J. Occup. Envi-ron. Med. 2007, 49, 258-265.
6. Gauderman, W.J.; McConnell, R.; Gilliland, F.; London, S.; Thomas,D.; Avol, E.; Vora, H.; Berhane, K.; Rappaport, E.B.; Lurmann, F.;Margolis, H.G.; Peters, J. Association between Air Pollution and LungFunction Growth in Southern California Children; Am. J. Respir. Crit.Care Med. 2000, 162, 1383-1390.
7. Dales, R.; Wheeler, A.J.; Mahmud, M.; Frescura, A.-M.; Liu, L. TheInfluence of Neighborhood Roadways on Respiratory Symptomsamong Elementary Schoolchildren; J. Occup. Environ. Med. 2009, 51,654-660.
8. Dales, R.; Wheeler, A.J.; Mahmud, M.; Frescura, A.M.; Smith-Doiron,M.; Nethery, E.; Liu, L. The Influence of Living near Roadways onSpirometry and Exhaled Nitric Oxide in Elementary Schoolchildren;Environ. Health Perspect. 2008, 116, 1423-1427.
9. Delfino, R.J.; Staimer, N.; Tjoa, T.; Gillen, D.; Kleinman, M.T.; Sioutas,C. Personal and Ambient Air Pollution Exposures and Lung FunctionDecrements in Children with Asthma; Environ. Health Perspect. 2008,116, 550-558.
10. McConnell, R.; Berhane, K.; Gilliland, F.; Islam, T.; Gauderman, W.J.;London, S.J.; Avol, E.; Rappaport, E.B.; Margolis, H.G.; Peters, J.M.Indoor Risk Factors for Asthma in a Prospective Study of Adolescents;Epidemiology 2002, 13, 288-295.
11. Allen, R.; Larson, T.; Sheppard, L.; Wallace, L.; Liu, L.J.S. Use ofReal-Time Light Scattering Data to Estimate the Contribution of Infil-trated and Indoor-Generated Particles to Indoor Air; Environ. Sci. Tech-nol. 2003, 37, 3484-3492.
12. Sarnat, J.A.; Long, C.M.; Koutrakis, P.; Coull, B.A.; Schwartz, J.; Suh,H.H. Using Sulfur as a Tracer of Outdoor Fine Particulate Matter;Environ. Sci. Technol. 2002, 36, 5305-5314.
13. Wallace, L.A.; Williams, R. Use of Personal-Indoor-Outdoor SulfurConcentrations to Estimate the Infiltration Factor and Outdoor Expo-sure Factor for Individual Homes and Persons; Environ. Sci. Technol.2005, 39, 1707-1714.
14. Dales, R.; Liu, L.; Wheeler, A.J.; Gilbert, N. Quality of Indoor Residen-tial Air and Health; CMAJ 2008, 179, 147-152.
15. Ozkaynak, H.; Xue, J.; Spengler, J.; Wallace, L.; Pellizzari, E.; Jenkins, P.Personal Exposure to Airborne Particles and Metals: Results from theParticle TEAM Study in Riverside, California; J. Expo. Anal. Environ.Epidemiol. 1996, 6, 57-78.
16. Sarnat, J.A.; Koutrakis, P.; Suh, H.H. Assessing the Relationship be-tween Personal Particulate and Gaseous Exposures of Senior CitizensLiving in Baltimore, MD; J. Air & Waste Manage. Assoc. 2000, 50,1184-1198.
17. Stocco, C.; Macneill, M.; Wang, D.; Xu, X.; Guay, M.; Brook, J.R.;Wheeler, A J. Predicting Personal Exposure of Windsor, Ontario Resi-dents to Volatile Organic Compounds Using Indoor Measurementsand Survey Data; Atmos. Environ. 2008, 42, 5905-5912.
18. Williams, R.; Rea, A.; Vette, A.; Croghan, C.; Whitaker, D.; Stevens, C.;McDow, S.; Fortmann, R.; Sheldon, L.; Wilson, H.; Thornburg, J.;Phillips, M.; Lawless, P.; Rodes, C.; Daughtrey, H. The Design and FieldImplementation of the Detroit Exposure and Aerosol Research Study;J. Expo. Anal. Environ. Epidemiol. 2008, 19, 643-659.
19. McCreanor, J.; Cullinan, P.; Nieuwenhuijsen, M.J.; Stewart-Evans, J.;Malliarou, E.; Jarup, L.; Harrington, R.; Svartengren, M.; Han, I.-K.;Ohman-Strickland, P.; Chung, K.F.; Zhang, J. Respiratory Effects ofExposure to Diesel Traffic in Persons with Asthma; N. Engl. J. Med.2007, 357, 2348-2358.
20. Sabin, L.D.; Behrentz, E.; Winer, A.M.; Jeong, S.; Fitz, D.R.; Pankratz,D.V.; Colome, S.D.; Fruin, S.A. Characterizing the Range of Children’s
Air Pollutant Exposure during School Bus Commutes; J. Expo. Sci.Environ. Epidemiol. 2005, 15, 377-387.
21. Strak, M.; Boogaard, H.; Meliefste, K.; Oldenwening, M.; Zuurbier, M.;Brunekreef, B.; Hoek, G. Respiratory Health Effects of Ultrafine and FineParticle Exposure in Cyclists; Occup. Environ. Med. 2010, 67, 118-124.
22. Rea, A.W.; Zufall, M.J.; Williams, R.W.; Howard-Reed, C.; Sheldon, L.The Influence of Human Activity Patterns on Personal PM Exposure: AComparative Analysis of Filter-Based and Continuous Particle Mea-surements; J. Air & Waste Manage. Assoc. 2001, 51, 1271-1279.
23. Sexton, K.; Mongin, S.J.; Adgate, J.L.; Pratt, G.C.; Ramachandran, G.; Stock,T.H.; Morandi, M.T. Estimating Volatile Organic Compound Concentra-tions in Selected Microenvironments Using Time-Activity and Personal Ex-posure Data; J. Toxicol. Environ. Health 2007, 70, 465-476.
24. Diamond, G.; Parker, M. Preliminary Air Quality Assessment Related toTraffic Congestion at Windsor’s Ambassador Bridge; Ontario Ministry ofEnvironment: Toronto, Ontario, Canada, 2004.
25. Particulate Matter; Ontario Ministry of Environment; available at http://www.ene.gov.on.ca/en/air/info/pm.php (accessed January 2, 2007).
26. Killip, S.; Mahfoud, Z.; Pearce, K. What Is an Intracluster CorrelationCoefficient? Crucial Concepts for Primary Care Researchers; Ann. Fam.Med. 2004, 2, 204-208
27. Sette, L.; Del Col, G.; Comis, A.; Milic-Emili, J.; Rossi, A.; Boner, A.L.Effect of Pattern of Preceding Inspiration on FEV1 in Asthmatic Chil-dren; Eur. Respir. J. 1996, 9, 1902-1906.
28. Delfino, R.J.; Quintana, P.J.E.; Floro, J.; Gastanaga, V.M.; Samini, B.S.;Kleinman, M.T.; Liu, L.-J.S.L.; Bufalino C.; Wu, C.-F.; McLaren C.E.Association of FEV1 in Asthmatic Children with Personal and Mi-croenvironmental Exposure to Airborne Particulate Matter; Environ.Health Perspect. 2004, 8, 932-941.
29. Wallace, L.; Wheeler, A.J.; Kearney, J.; Van Ryswyk, K.; You, H.; Kulka,R.; Rasmussen, P.; Brook, J.R.; Xu, X. Validation of Continuous ParticleMonitors for Personal, Indoor, and Outdoor Exposures; J. Expo. Anal.Environ. Epidemiol. 2010; available at http://www.nature.com/jes/journal/vaop/ncurrent/index.html#05052010 (accessed 2010).
30. Wallace, L.A.; Howard-Reed, C.H. Continuous Monitoring of Ultra-fine, Fine, and Coarse Particles in a Residence for 18 Months in1999–2000; J. Air & Waste Manage. Assoc. 2002, 52, 828-844.
31. Demokritou, P.; Kavouras, I.; Ferguson S.; Koutrakis, P. Developmentand Laboratory Performance Evaluation of a Multipollutant Samplerfor Simultaneous Measurements for Particulate and Gaseous Pollut-ants; Aerosol Sci. Technol. 2001, 35, 741-752.
32. Quality Assurance Guidance Document 2.12: Monitoring PM2.5 in AmbientAir Using Designated Reference or Class 1 Equivalent Methods; U.S. Envi-ronmental Protection Agency; Human Exposure and Atmospheric Sci-ences Division: Research Triangle Park, NC, 1998.
33. Rasmussen, P.E.; MacIntyre, D.J.; Guenette, J. Buoyancy-CorrectedGravimetric Analysis System. U.S. Patent 7357045, 2008.
34. Rasmussen, P.E.; Gardner, H.D.; Niu, J. Buoyancy Corrected Gravimet-ric Analysis of Lightly Loaded Filters; J. Air & Waste Manage. Assoc.2010, 60, 1065-1077; doi: 10.3155/1047-3289.60.9.1065.
35. Development of a High Volume Surface Sampler for Pesticides in Floor Dust;Report No. 600/4-89/036; U.S. Environmental Protection Agency; Na-tional Exposure Research Laboratory: Research Triangle Park, NC,1989.
36. Rasmussen, P.E.; Wheeler, A.J.; Hassan, N.M.; Filiatreault, A.; Lanou-ette, M. Monitoring Personal and Residential Exposures to Metals inAirborne Particulate Matter: Risks of Contamination during Sampling,Handling and Analysis; Atmos. Environ. 2007, 41, 5897-5907.
37. Rasmussen, P.E.; Niu, J.; Chenier, M.; Wheeler, A.; Nugent, M.; Gard-ner, H.D. Refined Analysis and Characterization Methods for Metals inUrban Residential Air. In Proceedings of the Metals in the Human Envi-ronment (NSERC MITHE-SN) Annual Symposium, Aylmer, Quebec, Can-ada, January 20–21, 2009.
38. Niu, J.; Rasmussen, P.E.; Wheeler, A.J.; Williams, R.; Chenier, M.Evaluation of Airborne Particulate Matter and Metals Data in Personal,Indoor and Outdoor Environments Using ED-XRF and ICP-MS andCollocated Duplicate Samples; Atmos. Environ. 2010, 44, 235-245.
39. Kulka, R.; Stocco, C.; Kearney, J.; Van-Ryswyk, K.; Van-Rijswijk, D.;Bellack, N.; You, H.; Xu, X.; Brook, J.; Rasmussen, P.; Wheeler, A.J. AnAnalysis of PM2.5 Sampler Intercomparisons Performed in ExposureAssessment Studies by Health Canada. Presented at the Air & WasteManagement Association Conference, Chapel Hill, NC, 2008.
40. Draper N.R.; Smith H. Applied Regression Analysis, 2nd ed.; Wiley: NewYork, 1981.
41. Ayers, G.P. Comment on Regression Analysis of Air Quality Data;Atmos. Environ. 2001, 35, 2423-2425.
42. Dietz, R.N.; Cote, E.A. Air Infiltration Measurements in a Home Usinga Convenient Perfluorocarbon Tracer Technique; Environ. Int. 1982, 8,419-433.
43. Rodríguez-Pascual, L.; Cordero-Guevara, J.; Viejo-Banuelosa, J.L.Agreement between Pneumotachograph and PiKo-1 Measurements ofPEF and FEV1; Arch Bronconeumol. 2006, 42, 144-147.
44. Windsor Ontario Exposure Assessment Study: VOC Sampling Data Sum-mary (2005, 2006); Draft Report; Health Canada: Ottawa, Ontario,Canada.
Wheeler et al.
Volume 61 February 2011 Journal of the Air & Waste Management Association 155

45. Allen, G.; Sioutas, C.; Koutrakis, P.; Reiss, R.; Lurmann, F.W.; Roberts,P.T. Evaluation of the TEOM Method for Measurement of AmbientParticulate Mass in Urban Areas; J. Air & Waste Manage. Assoc. 1997,47, 682-689.
46. Liu, L.J.; Box, M.; Kalman, D.; Kaufman, J.; Koenig, J.; Larson, T.;Lumley, T.; Sheppard, L.; Wallace, L. Exposure Assessment of Particu-late Matter for Susceptible Populations in Seattle; Environ. Health Per-spect. 2003, 111, 909-918.
47. Janssen, N.A.H.; Hoek, G.; Harssema H.; Brunekreef, B. ChildhoodExposure to PM10: Relation between Personal, Classroom and OutdoorConcentrations; Occup. Environ. Med. 1997, 54, 888-894.
48. Mukerjee, S.; Smith, L.; Norris, G.; Morandi, M.; Gonzales, M.; Noble,C.; Neas, L.; Ozkaynak, H. Field Method Comparison between PassiveAir Samplers and Continuous Monitors for VOCs and NO2 in El Paso,Texas; J. Air & Waste Manage. Assoc. 2004, 54, 307-319.
49. Gilbert, N.L.; Gauvin, D.; Guay, M.; Heroux, M.E.; Dupuis, G.; Legris,M.; Chan, C.C.; Dietz, R.N.; Levesque, B. Housing Characteristics andIndoor Concentrations of Nitrogen Dioxide and Formaldehyde inQuebec City; J. Can. Environ. Res. 2006, 102, 1-8.
50. Varns, J.; Mulik, J.; Sather, M.; Glen, G.; Smith, L.; Stallings, C. PassiveOzone Network of Dallas: A Modeling Opportunity with CommunityInvolvement; Environ. Sci. Technol. 2001, 35, 845-855.
51. Gibson, M.D.; Guernsey, J.R.; Beauchamp, S.; Waugh, D.; Heal, M.R.;Brook, J.R.; Maher, R.; Gagnon, G.A.; McPherson, J.P.; Bryden, B.;Gould, R.; Terashima, M. Quantifying the Spatial and TemporalVariation of Ground-Level Ozone in the Rural Annapolis Valley,Nova Scotia, Canada Using Nitrite-Impregnated Passive Samplers; J.Air & Waste Manage. Assoc. 2009, 59, 310-320; doi: 10.3155/1047-3289.59.3.310.
52. Liu, L.-J.S.; Box, M.; Kalman, D.; Kaufman, J.; Koenig, J.; Larson, T.;Lumley, T.; Sheppard, L.; Wallace, L. Exposure Assessment of Particu-late Matter for Susceptible Populations in Seattle, WA; Environ. HealthPerspect. 2003, 111, 909-918.
53. Williams, R.; Suggs, J.; Zweidinger, R.; Evans, G.; Creason, J.; Kwok, R.;Rodes, C.; Lawless, P.; Sheldon, L. The 1998 Baltimore ParticulateMatter Epidemiology Exposure Study: Part 1. Comparison of Ambient,Residential Outdoor, Indoor and Apartment Particulate Matter Mon-itoring; J. Expo. Anal. Environ. Epidemiol. 2000, 10, 518-532.
54. Meyer, M.B.; Lijek, J.; Ono, D. Continuous PM10 Measurements in aWoodsmoke Environment. In Proceedings of the 1992 PM10 Standardsand Nontraditional Particulate Source Control; A&WMA: Pittsburgh, PA,1992; pp 24-38.
55. Leech, J.A.; Nelson, W.C.; Burnett, R.T.; Aaron, S.; Raizenne, M.E. It’sabout Time: A Comparison of Canadian and American Time-ActivityPatterns; J. Expo. Anal. Environ. Epidemiol. 2002, 12, 427-432.
56. Klepeis, N.E.; Nelson, W.C.; Ott, W.R.; Robinson, J.P.; Tsang, A.M.;Switzer, P.; Behar, J.V.; Hern, S.C.; Engelmann, W.H. The NationalHuman Activity Pattern Survey (NHAPS): A Resource for AssessingExposure to Environmental Pollutants; J. Expo. Anal. Environ. Epide-miol. 2001, 11, 231-252.
57. Schweizer, C.; Edwards, R.D.; Bayer-Oglesby, L.; Gauderman, W.J.;Ilacqua, V.; Jantunen, M.J.; Lai, H.K.; Nieuwenhuijsen, M.; Kunzli, N.
Indoor Time-Microenvironment-Activity Patterns in Seven Regions ofEurope; J. Expo. Sci. Environ. Epidemiol. 2007, 17, 170-181.
About the AuthorsAmanda J. Wheeler is a research scientist, Gary Mallach isan air health scientist, Morgan MacNeill is an epidemiolo-gist, Ryan Kulka and Hongyu You are air pollution research-ers in the Air Health Science Division with Health Canada,Ottawa, Ontario, Canada. Keith Van Ryswyk and Jill Kear-ney are biologists in the Air Health Science Division withHealth Canada, Ottawa, Ontario, Canada. Pat E. Rasmus-sen is a research scientist in the Exposure and Biomonitor-ing Division with Health Canada, Ottawa, Ontario, Canada.Raymond Poon is a research scientist in the Hazard Iden-tification Division, Corinne Stocco is a chemist in the AirHealth Science Division and Robert Dales is a medicalofficer in the Populations Studies Division with Health Can-ada, Ottawa, Ontario, Canada. Xiaohong Xu is an associateprofessor in the Department of Civil and EnvironmentalEngineering with the University of Windsor in Windsor, Can-ada. Lance Wallace is a consultant from Reston, VA. EwaDabek-Zlotorzynska and Daniel Wang are research scien-tists in the Analysis and Air Quality Division with Environ-ment Canada in Ottawa, Ontario, Canada. Jeffrey R. Brookis a research scientist in the Air Quality Research Division inToronto, Ontario, Canada. Ron Williams is a human expo-sure measurements team leader in the Exposure Measure-ments and Analysis Branch with the U.S. EnvironmentalProtection Agency in Research Triangle Park, NC. AngelosAnastassopoulos is a doctoral student in the Department ofCivil and Environmental Engineering and J. David Miller is aprofessor in the Department of Chemistry with CarletonUniversity in Ottawa, Ontario, Canada. Please address cor-respondence to: Amanda Wheeler, Air Health Science Di-vision, 269 Laurier Avenue West, 3-080, Ottawa, Ontario,K1A 0K9 Canada; phone: �1-613-948-3686; fax: �1-613-948-8482; e-mail: [email protected].
Wheeler et al.
156 Journal of the Air & Waste Management Association Volume 61 February 2011