Exposure to air pollutants in hospitals: indoor–outdoor ...
10
Exposure to air pollutants in hospitals: indoor–outdoor correlations A. Chamseddine & M. El-Fadel Department of Civil and Environmental Engineering, American University of Beirut, Lebanon Abstract This study presents an assessment of exposure to air pollutants in a hospital environment using several air quality indicators commonly associated with indoor and outdoor emission sources including carbon monoxide (CO), carbon dioxide (CO 2 ), fine particulate matter (PM 2.5 ), and total volatile organic compounds (TVOC). The distribution and variation of indoor concentrations of CO, CO 2 , PM 2.5 and TVOC were examined in ten working areas of three hospitals randomly selected in an urban and rural setting. Indoor concentrations were then statistically correlated with outdoor sources. The results showed higher levels of CO 2 (690 ± 65 ppm) and TVOC (0.30 ± 0.10 ppm) indoors (p < 0.05) compared to outdoors (471 ± 85 ppm and 0.10 ± 0.07 ppm, respectively). A high correlation (r = 0.69) was recorded between indoor and outdoor PM 2.5 levels suggesting that indoor environments are directly affected by outdoor levels. At most sampling sites, outdoor PM 2.5 and CO concentrations (p < 0.05) were higher than indoor levels. While the PM 2.5 indoor/outdoor (I/O) ratio was less than 1 indicating a cleaner indoor environment and minimal indoor PM 2.5 sources, indoor levels exceeded outdoor concentrations during a dust storm and reached a 2.6 fold higher than the WHO standard. Higher PM 2.5 and CO levels were recorded in urban hospitals (PM 2.5 = 81 ± 12 μg/m 3 and CO = 4.62 ± 0.71 ppm) compared to rural (PM 2.5 = 27 ± 6.5 μg/m 3 and CO = 1.22 ± 0.43 ppm) suggesting the contribution of construction activities and vehicular emissions to urban levels of PM 2.5 and CO in hospitals. Although affected by outdoor levels, most indoor PM 2.5 and CO concentrations in both urban and rural setting remained below standards. Keywords: hospital environment, indoor air quality, CO, CO 2 , PM 2.5 , TVOC. www.witpress.com, ISSN 1743-3509 (on-line) WIT Transactions on The Built Environment, Vol 168, © 2015 WIT Press Sustainable Development, Vol. 2 707 doi:10.2495/SD150622
-
Upload
khangminh22 -
Category
Documents
-
view
1 -
download
0
Transcript of Exposure to air pollutants in hospitals: indoor–outdoor ...

Exposure to air pollutants in hospitals: indoor–outdoor correlations
A. Chamseddine & M. El-Fadel Department of Civil and Environmental Engineering, American University of Beirut, Lebanon
Abstract
This study presents an assessment of exposure to air pollutants in a hospital environment using several air quality indicators commonly associated with indoor and outdoor emission sources including carbon monoxide (CO), carbon dioxide (CO2), fine particulate matter (PM2.5), and total volatile organic compounds (TVOC). The distribution and variation of indoor concentrations of CO, CO2, PM2.5 and TVOC were examined in ten working areas of three hospitals randomly selected in an urban and rural setting. Indoor concentrations were then statistically correlated with outdoor sources. The results showed higher levels of CO2 (690 ± 65 ppm) and TVOC (0.30 ± 0.10 ppm) indoors (p < 0.05) compared to outdoors (471 ± 85 ppm and 0.10 ± 0.07 ppm, respectively). A high correlation (r = 0.69) was recorded between indoor and outdoor PM2.5 levels suggesting that indoor environments are directly affected by outdoor levels. At most sampling sites, outdoor PM2.5 and CO concentrations (p < 0.05) were higher than indoor levels. While the PM2.5 indoor/outdoor (I/O) ratio was less than 1 indicating a cleaner indoor environment and minimal indoor PM2.5 sources, indoor levels exceeded outdoor concentrations during a dust storm and reached a 2.6 fold higher than the WHO standard. Higher PM2.5 and CO levels were recorded in urban hospitals (PM2.5 = 81 ± 12 µg/m3 and CO = 4.62 ± 0.71 ppm) compared to rural (PM2.5 = 27 ± 6.5 µg/m3 and CO = 1.22 ± 0.43 ppm) suggesting the contribution of construction activities and vehicular emissions to urban levels of PM2.5 and CO in hospitals. Although affected by outdoor levels, most indoor PM2.5 and CO concentrations in both urban and rural setting remained below standards. Keywords: hospital environment, indoor air quality, CO, CO2, PM2.5, TVOC.
www.witpress.com, ISSN 1743-3509 (on-line) WIT Transactions on The Built Environment, Vol 168, © 2015 WIT Press
Sustainable Development, Vol. 2 707
doi:10.2495/SD150622

1 Introduction
Most air pollutants are encountered in the troposphere as a result of photochemical reactions, biomass burning, vehicle and industrial emissions that could be of natural or anthropogenic sources [1]. These pollutants are classified as primary (emitted directly into the atmosphere including mineral dust, and gaseous precursors such as SO2, NOx and NH3) or secondary pollutants (formed through chemical reactions). Other pollutants featuring CO, elemental and organic carbon result from automotive, industrial sources and incomplete combustion [2]. Once in the atmosphere, pollutants are subject to dispersion, condensation, coagulation, physicochemical transformations, thus forming secondary pollutants [1, 2]. In addition to their significant impacts on regional and global climate change, pollutants are associated with adverse health and environmental impacts [3–5]. Since people spend most of their times indoors the effect of indoor air quality (IAQ) on health is invariably more pronounced than outdoor air with IAQ in certain sensitive environments such as hospitals being more critical to its occupants negating the purpose of the visit if IAQ deteriorates [5, 6]. Several studies have explored the relation between hospital admissions and atmospheric concentration of fine particulate matter and trace gaseous species [7, 8], and have examined the impacts of haze on hospital admissions [9, 10]. On a normal day in Lebanon, between 40 and 60 patients are received at the outpatient department (OPD) of urban hospitals, 30 % (between 12 and 18) of which are admitted to the appropriate specialty at the inpatient department (IPD) depending on the presenting symptoms. It is also noteworthy that hospital OPD and IPD admissions increase by about 20 % during dust storm events where high levels of fine particulate matter and gaseous species are experienced [9, 10]. Hospitals act as specific indoor environments with highly vulnerable individuals potentially exposed to various air pollutants exacerbating health risks [11]. Therefore, this study targets the assessment of IAQ determinants in hospitals located in congested urban areas and pristine rural areas with emphasis on indoor-outdoor correlations and associated potential exposure.
2 Materials and methods
2.1 Hospital selection
Three hospitals (referred to as hospital A, B and C in the rest of this paper) in Lebanon were randomly selected from urban and rural areas, and 2 to 6 sampling sites within each hospital were chosen for IAQ monitoring during the months of March and April 2013, and November 2014. A total of ten working areas of the three hospitals were sampled and included clinics, clinic waiting areas, lobbies, reception, staff offices, corridors, pediatrics patient rooms, emergency rooms (ER), basement workshops, and meeting rooms. One to two outdoor site of each hospital were selected to represent fresh air intake.
www.witpress.com, ISSN 1743-3509 (on-line) WIT Transactions on The Built Environment, Vol 168, © 2015 WIT Press
708 Sustainable Development, Vol. 2

2.2 Air quality monitoring
Indoor and outdoor levels of carbon monoxide (CO), carbon dioxide (CO2), fine particulate matter (PM2.5), and total volatile organic compounds (TVOC) were monitored during working hours (9:00 am–5:00 pm) at the hospitals. A Langan L76n air quality analyser was used to measure real time CO and CO2 concentrations (ppm), temperature (oC) and relative humidity (%). Two DustTrak™ II Aerosol Monitor (Model 8532, TSI Corporation, Shoreview, USA) equipped with a light-scattering laser photometer to measure real-time concentrations was used for monitoring outdoor and indoor PM2.5 concentrations simultaneously. A real-time PhoCheck Tiger PID instrument (Ion Science Ltd, The Way, Fowlmere, UK) was used to monitor TVOC levels (ppm).
2.3 Statistical analysis
The concentration variation of air pollutants were analysed by one-way analysis of variance (one-way ANOVA) for different sampling sites. Pearson product-moment correlation coefficient (PCC) (r) was also used as a measure of linear correlation to analyse the relation between indoor levels and outdoor pollutants. Statistical significance was set at p < 0.05.
3 Results and discussion
3.1 IAQ in different working areas
Recorded levels of CO, CO2, PM2.5 and TVOC were significantly different (p < 0.05) in different working areas. The average concentrations of indoor CO were 3.24 ± 0.23, 1.08 ± 0.06, 1.58 ± 0.04, 2.62 ± 0.19, 1.55 ± 0.05, 1.39 ± 0.07, 1.65 ± 0.04, 1.90 ± 0.28, 2.13 ± 0.10, and 1.82 ± 0.14 ppm in the clinic, clinic waiting area, lobby, reception, staff office, corridor, pediatrics patient room, emergency room (ER), basement workshop, and meeting room respectively (Table 1). At all sampling sites average indoor levels of CO (p < 0.05) were lower than the NAQQS standards (i.e. 9 ppm for 8 hours and 35 ppm for 1 hour). At most sampling sites, outdoor CO concentrations (p < 0.05) were higher than indoor levels (Table 2) and also below standards indicating that although urban hospitals are exposed to CO sources such as vehicular emissions, both indoor and outdoor levels remained within acceptable limits. Furthermore, at higher elevation (5th and 8th floor) CO exposure becomes minimal [12]. Indoor CO2 concentrations were higher than outdoor levels (Tables 1 and 2) due to human metabolism and breathing in indoor closed environments but remained below the 1000 ppm limit ranging from 371 ± 19.7 ppm to 690 ± 65.2 ppm (Table 1). When CO2 levels exceed 1000 ppm in indoor environments, it is advisable to enhance air exchange / ventilation rates [12, 13]. Indoor PM2.5 concentrations were significantly different among sampling sites (p < 0.05). Critical indoor environments such as pediatrics patient room (12.8 ± 1.01µg/m3) and emergency room (24.0 ± 4.18 µg/m3) exhibited relatively low levels within the WHO standard (25 µg/m3). However, at clinic, reception and
www.witpress.com, ISSN 1743-3509 (on-line) WIT Transactions on The Built Environment, Vol 168, © 2015 WIT Press
Sustainable Development, Vol. 2 709
Table 1: Concentrations of indoor pollutants at sampled working areas.
ID Working area Mean ± Std.
CO (ppm) CO2 (ppm) PM2.5 (µg/m3) TVOC (ppm) 1 Clinic 3.24 ± 0.23 690 ± 65.2 90.1 ± 13.6 a NR b
2 Clinic waiting area 1.05 ± 0.06 571 ± 38.1 22.9 ± 1.90 0.08 ± 0.07 3 Lobby 1.58 ± 0.04 447 ± 8.47 23.7 ± 4.70 NR 4 Reception 2.62 ± 0.19 604 ± 29.8 80.8 ± 15.7 a NR 5 Staff office 1.55 ± 0.05 526 ± 21.4 9.93 ± 1.86 NR 6 Corridor 1.39 ± 0.07 406 ± 19.9 15.2 ± 1.04 0.30 ± 0.10 7 Pediatrics room 1.65 ± 0.04 497 ± 17.6 12.8 ± 1.01 NR 8 Emergency room (ER) 1.90 ± 0.28 371 ± 19.7 24.0 ± 4.18 NR 9 Basement workshop 2.13 ± 0.10 483 ± 10.8 11.8 ± 1.30 NR 10 Meeting room 1.82 ± 0.14 550 ± 12.5 34.1 ± 1.15 0.15 ± 0.11
p – Value c < 0.05 < 0.05 < 0.05 < 0.05 aHigh levels were reported during sampling in April 2013 due to a Dust storm event. bNo TVOC levels were recorded. cOne way ANOVA (95 % CI) for different working areas (statistical significance was set at p < 0.05).
Table 2: Concentrations of outdoor pollutants at fresh air intake sites.
ID Working area a Mean ± Std.
CO(ppm) CO2 (ppm) PM2.5 (µg/m3) TVOC (ppm) 1 1st floor entrance 4.62 ± 1.25 471 ± 84.7 81.1 ± 12.2 b NR c
2 8th Mechanical 1.08 ± 0.16 387 ± 8.36 71.7 ± 6.63 0.05 ± 0.02 3 11th Mechanical 1.93 ± 0.06 397 ± 7.53 20.5 ± 1.03 NR 4 1st floor entrance 3.31 ± 0.74 377 ± 22.4 77.5 ± 12.8 b NR 5 8th Mechanical 2.39 ± 0.12 443 ± 7.66 46.8 ± 6.57 NR 6 8th Mechanical 1.02 ± 0.12 438 ± 7.21 75.3 ± 8.78 0.10 ± 0.07 7 11th Mechanical 2.35 ± 0.44 418 ± 47.8 68.4 ± 6.86 NR 8 ER main entrance 1.22 ± 0.43 288 ± 4.66 26.7 ± 6.46 NR 9 8th Mechanical 1.28 ± 0.05 341 ± 8.15 46.5 ± 4.18 NR 10 11th Mechanical 1.08 ± 0.13 505 ± 13.4 39.8 ± 1.49 0.05 ± 0.01
p – Value d < 0.05 < 0.05 < 0.05 < 0.05 aOutdoor sampling sites were conducted simultaneously with indoor measurements and were chosen to represent fresh air intake into the indoor working areas. bHigh levels were reported during sampling in April 2013 due to a Dust storm event. cNo TVOC levels were recorded. dOne way ANOVA (95 % CI) for different working areas (statistical significance was set at p < 0.05).
meeting rooms, levels exceeded the WHO standard by reaching 90.1 ± 13.6, 80.8 ± 15.7, and 34.1 ± 1.15 µg/m3, respectively (Table 1). These levels may be attributed to human activities in meeting rooms and a dust storm event that took place during sampling at the clinic and reception at an urban hospital (B). Figure 1 shows the backward air trajectory of the sampling day that was conducted at the clinic and reception, revealing a dust storm from the Arabian Desert in Saudi Arabia. High levels of PM2.5 are carried with dust storms and can affect indoor PM2.5 levels [14]. The outdoor PM2.5 concentrations during the dust event (p < 0.05) have also exceeded the WHO standard reaching 81.1 ± 12.2 and 77.5 ± 12.8 µg/m3 at the outdoor site (1st floor entrance) of the clinic and
www.witpress.com, ISSN 1743-3509 (on-line) WIT Transactions on The Built Environment, Vol 168, © 2015 WIT Press
710 Sustainable Development, Vol. 2
reception working areas, respectively (Table 2). The high levels of outdoor PM2.5
may be attributed to the proximity of the sampling sites to on-road vehicular emissions and to dusty weather experienced during sampling. In a similar behavior to CO2, higher TVOC levels (0.30 ± 0.10 ppm) were recorded indoors (p < 0.05) than outdoors (0.10 ± 0.07 ppm). TVOCs were recorded in clinic waiting area, corridor and meeting room which are exposed to frequent floor-cleaning and air refreshers that are sources of TVOC [12].
Figure 1: HYSPLIT model with backward air trajectory of dust storm originating from the Arabian Desert in Saudi Arabia during sampling at clinic and reception working areas of Hospital B.
3.2 Indoor–outdoor correlations
Table 3 presents the average indoor and outdoor concentration ratios for CO, CO2, PM2.5 and TVOC in various working areas. Few areas exhibited CO ratios > 1 (corridor: 1.36, ER 1.56, basement workshop: 1.66, meeting room: 1.69). Combustion is a major contributor of CO in indoor environments [15, 16] and
www.witpress.com, ISSN 1743-3509 (on-line) WIT Transactions on The Built Environment, Vol 168, © 2015 WIT Press
Sustainable Development, Vol. 2 711
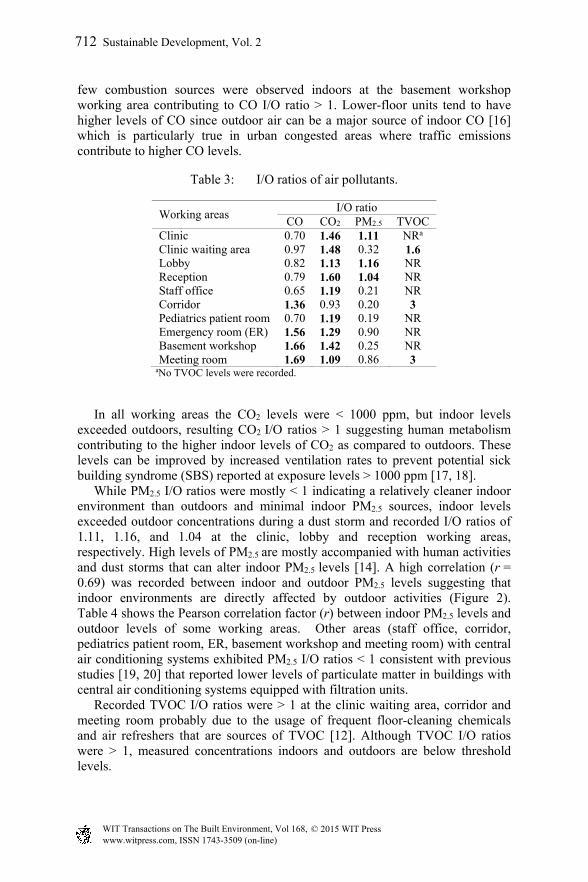
few combustion sources were observed indoors at the basement workshop working area contributing to CO I/O ratio > 1. Lower-floor units tend to have higher levels of CO since outdoor air can be a major source of indoor CO [16] which is particularly true in urban congested areas where traffic emissions contribute to higher CO levels.
Table 3: I/O ratios of air pollutants.
Working areas I/O ratio
CO CO2 PM2.5 TVOC Clinic 0.70 1.46 1.11 NRa
Clinic waiting area 0.97 1.48 0.32 1.6 Lobby 0.82 1.13 1.16 NR Reception 0.79 1.60 1.04 NR Staff office 0.65 1.19 0.21 NR Corridor 1.36 0.93 0.20 3 Pediatrics patient room 0.70 1.19 0.19 NR Emergency room (ER) 1.56 1.29 0.90 NR Basement workshop 1.66 1.42 0.25 NR Meeting room 1.69 1.09 0.86 3
aNo TVOC levels were recorded.
In all working areas the CO2 levels were < 1000 ppm, but indoor levels exceeded outdoors, resulting CO2 I/O ratios > 1 suggesting human metabolism contributing to the higher indoor levels of CO2 as compared to outdoors. These levels can be improved by increased ventilation rates to prevent potential sick building syndrome (SBS) reported at exposure levels > 1000 ppm [17, 18]. While PM2.5 I/O ratios were mostly < 1 indicating a relatively cleaner indoor environment than outdoors and minimal indoor PM2.5 sources, indoor levels exceeded outdoor concentrations during a dust storm and recorded I/O ratios of 1.11, 1.16, and 1.04 at the clinic, lobby and reception working areas, respectively. High levels of PM2.5 are mostly accompanied with human activities and dust storms that can alter indoor PM2.5 levels [14]. A high correlation (r = 0.69) was recorded between indoor and outdoor PM2.5 levels suggesting that indoor environments are directly affected by outdoor activities (Figure 2). Table 4 shows the Pearson correlation factor (r) between indoor PM2.5 levels and outdoor levels of some working areas. Other areas (staff office, corridor, pediatrics patient room, ER, basement workshop and meeting room) with central air conditioning systems exhibited PM2.5 I/O ratios < 1 consistent with previous studies [19, 20] that reported lower levels of particulate matter in buildings with central air conditioning systems equipped with filtration units. Recorded TVOC I/O ratios were > 1 at the clinic waiting area, corridor and meeting room probably due to the usage of frequent floor-cleaning chemicals and air refreshers that are sources of TVOC [12]. Although TVOC I/O ratios were > 1, measured concentrations indoors and outdoors are below threshold levels.
www.witpress.com, ISSN 1743-3509 (on-line) WIT Transactions on The Built Environment, Vol 168, © 2015 WIT Press
712 Sustainable Development, Vol. 2
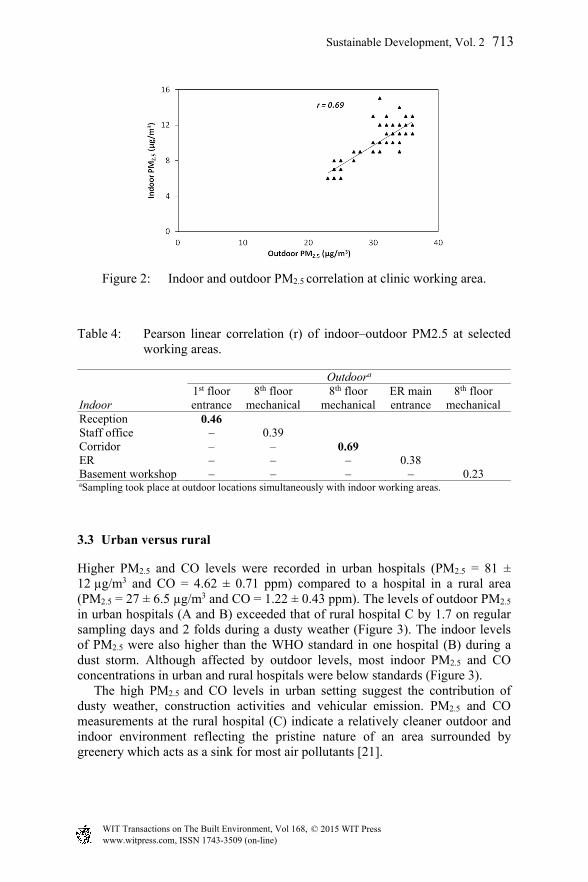
Figure 2: Indoor and outdoor PM2.5 correlation at clinic working area.
Table 4: Pearson linear correlation (r) of indoor–outdoor PM2.5 at selected working areas.
Indoor
Outdoora 1st floorentrance
8th floor mechanical
8th floor mechanical
ER main entrance
8th floor mechanical
Reception 0.46 Staff office – 0.39 Corridor – – 0.69 ER – – – 0.38 Basement workshop – – – – 0.23
aSampling took place at outdoor locations simultaneously with indoor working areas.
3.3 Urban versus rural
Higher PM2.5 and CO levels were recorded in urban hospitals (PM2.5 = 81 ± 12 µg/m3 and CO = 4.62 ± 0.71 ppm) compared to a hospital in a rural area (PM2.5 = 27 ± 6.5 µg/m3 and CO = 1.22 ± 0.43 ppm). The levels of outdoor PM2.5 in urban hospitals (A and B) exceeded that of rural hospital C by 1.7 on regular sampling days and 2 folds during a dusty weather (Figure 3). The indoor levels of PM2.5 were also higher than the WHO standard in one hospital (B) during a dust storm. Although affected by outdoor levels, most indoor PM2.5 and CO concentrations in urban and rural hospitals were below standards (Figure 3). The high PM2.5 and CO levels in urban setting suggest the contribution of dusty weather, construction activities and vehicular emission. PM2.5 and CO measurements at the rural hospital (C) indicate a relatively cleaner outdoor and indoor environment reflecting the pristine nature of an area surrounded by greenery which acts as a sink for most air pollutants [21].
www.witpress.com, ISSN 1743-3509 (on-line) WIT Transactions on The Built Environment, Vol 168, © 2015 WIT Press
Sustainable Development, Vol. 2 713

Figure 3: Outdoor and indoor levels at urban and rural hospitals (A, B and C): (a) PM2.5 (µg/m3) and (b) CO (ppm).
4 Conclusion
Assessing exposure to air pollutants in facilities with high vulnerability (such as hospitals) is imperative for health protection. The results of this study show that:
Higher levels of CO2 (690 ± 65 ppm) and TVOC (0.30 ± 0.10 ppm) indoors (p < 0.05) compared to outdoors (471 ± 85 ppm and 0.10 ± 0.07 ppm).
While PM2.5 indoor/outdoor (I/O) ratios was mostly < 1 indicating a cleaner indoor environment and minimal indoor PM2.5 sources, indoor levels exceeded outdoor concentrations during a dust storm and reached a 2.6 fold higher than the WHO standard.
A high correlation (r = 0.69) was recorded between indoor and outdoor PM2.5 levels suggesting that indoor environments are directly affected by outdoor levels.
Higher PM2.5 and CO levels were recorded in urban hospitals (PM2.5 = 81 ± 12 µg/m3 and CO = 4.62 ± 0.71 ppm) compared to rural (PM2.5 = 27 ± 6.5 µg/m3 and CO = 1.22 ± 0.43 ppm) suggesting the contribution of dusty weather, construction activities and vehicular emission to urban levels of PM2.5 and CO in hospitals.
Future work will explore how different ventilation types, management of human activities and potential sources of indoor pollutants can improve indoor air quality and develop measures for improved control and protection of patients, employees, and visitors alike and alleviate potential health impacts for a most vulnerable segment of a community.
www.witpress.com, ISSN 1743-3509 (on-line) WIT Transactions on The Built Environment, Vol 168, © 2015 WIT Press
714 Sustainable Development, Vol. 2

Acknowledgements
This study is supported through joint funding from the Lebanese National Council for Scientific Research and the American University of Beirut.
References
[1] Finlayson-Pitts, B.J. & Pitts, J.N.J. Chemistry of the Upper and Lower Atmosphere. Academic Press: San Diego, pp. 20–50, 2000.
[2] Ian Colbeck. Environmental Chemistry of Aerosols. Blackwell Publishing Ltd: 9600 Garsington Road, Oxford, UK, 2008.
[3] Wuebbles, J.D., Lei, H., Lin, J., Intercontinental transport of aerosols and photochemical oxidants from Asia and its consequences. Environmental Pollution, 150, pp. 65–84, 2007.
[4] Usher, C.R., Michel, A.E., Grassian, V.H., Reactions on Mineral Dust. Chemical Reviews, 103, pp. 4883–4939, 2003.
[5] Vardoulakis S., Human Exposure: Indoor and Outdoor. Royal Society of Chemistry, 28, pp. 85–107, 2009.
[6] Singer, B.C., Hodgson, A.T., Hotchi, T., and Kim, J.J., Passive measurement of nitrogen oxides to assess traffic-related pollutant exposure for the East Bay Children's Respiratory Health Study. Atmospheric Environment. 38(3): pp. 393–403, 2004.
[7] Pongpiachan, S., and Paowa, T., Hospital out-and-in-patients as functions of trace gaseous species and other meteorological parameters in Chiang-Mai, Thailand. Aerosol and Air Quality Research. 15(2), pp. 479–493, 2015.
[8] Cengiz, M.A., and Terzi, Y., Comparing models of the effect of air pollutants on hospital admissions and symptoms for chronic obstructive pulmonary disease. Cent. Eur. J. Public Health. 20, pp. 282–286, 2012.
[9] Zhang, Z., Wang, J., Chen, L., Chen, X., Sun, G., Zhong, N., Kan, H., and Lu, W., Impact of haze and air pollution-related hazards on hospital admissions in Guangzhou, China. Environ. Sci. Pollut. Res. Int. 21, pp. 4236–4244, 2014.
[10] Xie, Y.B., Chen, J., and Li, W., An assessment of PM2.5 related health risks and impaired values of Beijing residents in a consecutive high-level exposure during heavy haze days. Huan Jing Ke Xue. 35, pp. 1–8, 2014.
[11] Eames, I., Tang, J.W., Li, Y., and Wilson, P., Airborne transmission of disease in hospitals. J. R. Soc. Interface, 6, pp. 697–702, 2009.
[12] Erdogan M.S., Yurtseven E., Erginoz E., Suphi V., Koksal S., Yuceokur, A.A., Total volatile organic compuunds (TVOC), carbon monoxide (CO), carbon dioxide (CO2) concentrations in the hospital building of a medical faculty in Istanbul, Turkey. Nobel Medicus, 18, pp. 66–72, 2009.
[13] Helmis C.G., Tzoutzas J., Flocas H.A., Halios CH., Stathopulou OI., Indoor air quality in a dentistry clinic. Sci Total Environ, 337, pp. 349–365, 2007.
www.witpress.com, ISSN 1743-3509 (on-line) WIT Transactions on The Built Environment, Vol 168, © 2015 WIT Press
Sustainable Development, Vol. 2 715
[14] Dement’eva, A. L., Zhamsueva, G.S., Zayakhnove, A.S., Tsydypov, V.V., Ayurzhanaev, A. A., Azzayaa, D., Oyunchimeg, D., Mass concentration of PM10 and PM2.5 fine-dispersed aerosol fractions in the Eastern Gobi Desert. Russian Meteorology and Hydrology, 38 (2), pp. 80-87, 2013.
[15] Chowdhury Z., Campanella L., Gray C., Al Masud A, Marter-Kenyon J., Pennise D., et al. Measurement and modeling of indoor air pollution in rural households with multiple stove interventions in Yunnan, China. Atmospheric Environment, 67, pp 161–169, 2013.
[16] Jo W.K., Lee J.Y., Indoor and outdoor levels of respirable particulates (PM10) and carbon monoxide (CO) in high-rise apartment buildings. Atmospheric Environment, 40, pp. 6067–6076, 2006.
[17] Erdmann C.A., Apte M.G., Mucous membrane and lower respiratory building related symptoms in relation to indoor carbon dioxide concentrations in the 100-building BASE dataset. Indoor Air, 14, pp. 127–134, 2004.
[18] Norback D., Nordstrom K., Sick building syndrome in relation to air exchange rate, CO(2), room temperature and relative air humidity in university computer classrooms: an experimental study. Int Arch Occ Env Hea, 82, pp. 21–30, 2008.
[19] Zuraimi M.S., T K.W., Chew F.T., Ooi P.L., The effects of ventilation strategies of child care centers on indoor air quality and respiratory health of children in Singapore. Indoor Air, 17, pp. 317–327, 2007.
[20] Lin L.Y., Chen H.W., Su T.L., Hong G.B., Huang L.C., Chuang K.J., The effects of indoor particle exposure on blood pressure and heart rate among young adults: an air filtration-based intervention study. Atmospheric Environment, 45, pp. 5540–5544, 2011.
[21] Hurtt G.C., Pacala S.W., Moorcroft P.R., Caspersen J., et al., Projecting the future of the US carbon sink. Proceedings of the National Academy of Sciences, 99, pp. 1389–1394, 2002.
www.witpress.com, ISSN 1743-3509 (on-line) WIT Transactions on The Built Environment, Vol 168, © 2015 WIT Press
716 Sustainable Development, Vol. 2