Numerical methods for the simulation of the settling of flocculated suspensions
Upload
khangminh22Category
view
1download
0
Simulation & Gaming42(1) 64 –84
© 2011 SAGE PublicationsReprints and permission: http://www. sagepub.com/journalsPermissions.nav
DOI: 10.1177/1046878110376795http://sg.sagepub.com
Improving Transfer of Learning: Relationship to Methods of Using Business Simulation
Brad W. Mayer1, Kathleen M. Dale2,Katherine A. Fraccastoro1, and Gisele Moss1
Abstract
This study investigates whether the processes associated with the use of business simulations can be structured to improve transfer of learning from the classroom environment to the workplace. The answer to this question is explored by investigating teaching methods used to introduce the simulation, the amount of time students spend on decisions, team decision-making characteristics, and student performance levels in the course. The results indicate that students have higher perceived transfer of learning when they learn the simulation by reading the student manual and from peers rather than from the instructor or from hands-on experience. Also, the results indicate that perceptions of time spent on strategic decisions, financial decisions, and student expectations of their final grade were related to perceived transfer of learning.
Keywords
business simulation, learning, transfer of learning
The dynamic business environment of today requires employees who can analyze information from many sources, make decisions, and implement a course of action. Employees must also possess strong communication skills and be able to work well in a team. Preparing students for these types of skills and knowledge has long been con-sidered one of the primary objectives of American colleges and universities (Moses, 1994). As a result, identifying pedagogical tools or methods of education that can have
1Lamar University, Beaumont, TX, USA2Minnesota State University, Mankato, MN, USA
Corresponding Author:Brad W. Mayer, Department of Management and Marketing, Lamar University, P.O. Box 11612, Beaumont, TX 77710, USAEmail: [email protected]
at PENNSYLVANIA STATE UNIV on April 8, 2016sag.sagepub.comDownloaded from
Mayer et al. 65
the greatest and most permanent impact on business students is becoming an increas-ingly important issue. Thus, this article will focus on a popular educational tool, the business simulation, as well as the processes associated with its use and perceived transfer of learning.
Simulations in Management EducationThe use of simulations as a learning tool in management education is popular across business schools (Adobor & Daneshfar, 2006; Faria, 1998; Knotts & Keys, 1997; Wolfe, 1997). Faria (1998) noted that more than 95% of member schools of the Asso-ciation to Advance Collegiate Schools of Business use business simulations in their programs. Although we find several reasons for this widespread use, the most prevalent are: (a) that simulations are valid representations of the practical issues facing manag-ers and (b) that the environments offered by simulations can be among the most realistic in a classroom setting (Cadotte, 1995; Chapman & Sorge, 1999; Doyle & Brown, 2000; Hornaday & Curran, 1996; Wolfe & Luethge, 2003). In addition, simulations offer moti-vation, teamwork variety, and experiential learning and reflect many of the challenging issues which organizations and managers are experiencing (Fripp, 1993, 1997).
Total enterprise business simulations are widely used in capstone policy courses in both undergraduate and graduate business programs as well as in executive develop-ment programs (Faria, 1998; Wolfe, 1993). A total enterprise simulation attempts to integrate the various disciplines of business administration (Goosen, Jensen, & Wells, 2001). The simulation mimics the data provided in accounting statements to help the user understand and practice the task of managing an organization. This practicing is done at a fraction of the cost and time it would take to experiment with a real organiza-tion. Such learning is invaluable; however, are students able to transfer this learning to the workplace?
Transfer of LearningTransfer of learning is defined as the ability to extend what has been learned in one context to new contexts (Byrnes, 1996). Educators hope that students will transfer learning from one problem to another within a course, from one course in school to another, and from school to the workplace. Most formal education aspires to transfer learning (Perkins & Salomon, 1992), and consequently, the ends of education are not achieved unless transfer occurs.
Research suggests that several factors affect transfer. First, some initial acquisi-tion of knowledge is necessary for transfer (Brown, Bransford, Ferrara, & Campione, 1983; Carey & Smith, 1993; Chi, 2000). Although this seems obvious, many fail-ures to produce transfer have resulted from inadequate opportunities for students to learn effectively in the first place. Students who only memorize facts have little basis for approaching problem-solving tasks (Bransford & Stein, 1993; Brown, 1990; Klahr & Carver, 1988; Littlefield et al., 1988). Whereas rote learning does not tend to
at PENNSYLVANIA STATE UNIV on April 8, 2016sag.sagepub.comDownloaded from
66 Simulation & Gaming 42(1)
facilitate transfer, learning with understanding does (Barnett & Ceci, 2002; Mandler & Orlich, 1993).
Second, the amount of time spent practicing influences the transfer of learning. Although many people believe that “talent” plays a role in who becomes an expert in a particular area, even talented individuals require a great deal of practice to develop their expertise. Furthermore, learning is most effective when people engage in “deliberate practice” that includes actively seeking feedback and monitoring one’s learning expe-riences (Ericsson, Krampe, & Tesch-Romer, 1993). Transfer can be improved by help-ing students become more aware of themselves as learners who actively monitor their learning strategies and resources and assess their readiness for particular tests and performances.
Third, context plays a pivotal role in transfer. Simply learning to perform procedures and learning in a single context is less likely to support transfer of learning than knowl-edge that is taught in multiple contexts. With multiple contexts, students are more likely to grasp the relevant features of concepts and develop a more flexible representation of knowledge (Perkins & Salomon, 1992).
Finally, transfer of learning is enhanced by helping students see potential transfer implications of what they are learning (J. R. Anderson, Reder, & Simon, 1996). Students may have knowledge that is relevant to a learning situation that is not activated. By helping activate this knowledge, teachers can build on student strengths.
The use of a business simulation encompasses each of the factors that influence the transfer of learning. Students must learn for understanding to make the best deci-sions in the simulation. They are required to run the simulation over a series of deci-sion periods, and each successive decision is based on feedback they received from monitoring the results of prior decisions. Finally, students are placed in a learning situation that is similar, at least in a decision-making sense, to a workplace situa-tion. Thus, transferability of learning from the educational environment to reality is enhanced (Aldrich, 2005).
HypothesesDespite our rapidly growing knowledge about transfer and factors that facilitate it, we know little about how to construct classroom environments that foster transfer. The question of how to formulate research questions so as to study in-class learning and transfer is still in its infancy (Silva & Kellman, 1999; Stigler & Fernandez, 1995). While it is believed that learning is improved through the use of a simulation, we know little about how to structure the use of the simulation in the classroom in order to enhance transfer. Do better ways exist for structuring our teaching and use of the simulation to improve perceived transfer of learning? We will explore the answer to this question by investigating the teaching method used to introduce the simulation, the students’ level of simulation self-esteem, the amount of time students spend on decisions, team decision-making characteristics, and the importance students place on performance outcomes.
at PENNSYLVANIA STATE UNIV on April 8, 2016sag.sagepub.comDownloaded from
Mayer et al. 67
Teaching Method
Researchers suggest that students learn more effectively when they are able to experi-ence learning through active participation in the learning process (Allen & Young, 1997) rather than acting as passive recipients of information (Kaagan, 1999; Pfeiffer, 1994). Wingfield and Black (2005) found that active course designs result in students perceiv-ing their learning to be more meaningful to their future jobs.
Simulations are a form of active learning, but little research has considered the most effective method for teaching students how to use the simulation for improved transfer of learning. Snow, Gehlen, and Green (2002) found that the way the simula-tion was used in a course did make a difference in how useful students believed the simulation was as an educational experience. While the researchers found that inte-grating the simulation into the course throughout the term rather than using the simu-lation as a stand-alone experience was perceived as being more useful to students, the study did not look at the impact of various teaching methods for introducing the simu-lation. Thus, in an attempt to investigate the impact of teaching method on perceived transfer of learning, we propose the following hypothesis:
Hypothesis 1: A student’s perception of the method in which he or she learned the simulation (manual, hands-on, a professor’s lectures, and/or through peer interaction) will be directly related to his or her perceived transfer of learning.
Simulation Self-EsteemThe way individuals react to life experiences varies based on their level of self-esteem or the extent to which they perceive themselves as competent individuals (Korman, 1976). Theoretically, individuals will develop attitudes and behave in ways that will maintain their level of self-esteem (Korman, 1976). Thus, individuals who perceive themselves as having high levels of self-esteem will develop and maintain favorable work attitudes and behave productively because such attitudes and behaviors are con-sistent with the attitude that they are competent individuals (Pierce, Gardner, Cummings, & Dunham, 1989).
Pierce et al. (1989) suggest that self-esteem may be viewed as a self-evaluation that individuals make and maintain with regard to themselves. These self-evaluations indicate the extent to which individuals believe themselves to be capable, valuable, and effective (Pierce et al., 1989). Individuals who develop beliefs about their own capabilities to perform successfully within and across situations will simultaneously develop a strong sense of self-esteem (Bandura, 1977) or the belief that they will be able to transfer their learning to other situations. Thus, we propose the following hypothesis:
Hypothesis 2: A student’s perception of his or her simulation self-esteem will be directly related to his or her perceived transfer of learning.
at PENNSYLVANIA STATE UNIV on April 8, 2016sag.sagepub.comDownloaded from
68 Simulation & Gaming 42(1)
Teams
Teams and groups have the potential to learn at a higher capacity than individuals (Wenzler & Chartier, 1999). Shared learning experiences provide an opportunity for constructing meaning and circulating ideas and solutions throughout the organization. It is not an accident that in actual companies decisions are made primarily by teams (Glassop, 2002).
For a greater understanding of effective simulation use, researchers have called for the inclusion of more team characteristics in future studies of simulations (Flynn & Klein, 2001; Thompson & Dass, 2000). Most business simulations use teams of par-ticipants who compete against one another. Investigating how decisions are made in these teams and the impact of that decision-making style on the transfer of knowledge may be helpful to our understanding of the team characteristics that influence per-ceived transfer of learning (Adobor & Daneshfar, 2006). While student involvement in the simulation has been found to be correlated with increased learning (Randel, Morris, Wetzel, & Whitehill, 1992; Wolfe & Luethge, 2003), little is known about the influence of involvement on the transfer of learning. Thus, investigating the way deci-sions are made, autocratically or democratically, may help our understanding of team characteristics and the transfer of learning. In an attempt to better understand one par-ticular team characteristic, team decision-making style, and its impact on transfer of learning, we propose the following hypothesis:
Hypothesis 3: A student’s perception of the decision making process (autocratic-democratic) will be related to his or her perceived transfer of learning.
PracticeThe development of expertise occurs only with major investments of time, and the amount of time it takes to learn the material is roughly proportional to the amount of material being learned (Singley & Anderson, 1989). It is clear that different ways of using one’s time have different effects on learning and transfer. Learning is most effec-tive when people engage in “deliberate practice” that includes actively monitoring one’s learning experiences (Ericsson et al., 1993). Monitoring involves attempts to seek and use feedback about one’s progress. When using a total enterprise simulation, students are required to play the simulation over a series of decision periods, and each successive decision is supposed to be based on feedback they received from monitoring the results of prior decisions. Students are involved in making strategic decisions, financial decisions, and various functional decisions. Strategic decisions involve strengthening the long-term competitiveness of the firm by analyzing the competition and making decisions about issues such as quality, image, and customer service. Financial decisions include monitoring the quarterly financial reports and making decisions to improve financial standing on performance indicators such as net profit or earnings per share. Functional decisions involve the areas of production, human resources, and marketing. We propose the following hypothesis:
at PENNSYLVANIA STATE UNIV on April 8, 2016sag.sagepub.comDownloaded from
Mayer et al. 69
Hypothesis 4: A student’s perceived level of involvement (strategic decisions, functional area decisions, and financial decisions) will be directly related to his or her perceived transfer of learning.
PerformanceResearchers caution that a high level of game performance may not necessarily indi-cate that a high level of learning has taken place (Teach & Patel, 2007; Washbush & Gosen, 1998; Wolfe, 1997). Teams can achieve good simulation performance based on luck rather than actual learning (P. H. Anderson & Lawton, 1992). Conversely, other researchers suggest that high game performance is not the result of luck or random guesses and that simulations reward intelligent, planned decision-making practices (Patz, 2001, 2002, 2003, 2006; Teach, 1990; Wolfe & Luethge, 2003). These researchers found that outstanding performance in the simulation is brought about through the careful integration of strategy and tactics. Knowing the impact of perfor-mance on student perceptions of learning and transfer would be helpful in setting grading criteria and areas of emphasis in the simulation. Thus, we propose the follow-ing hypotheses:
Hypothesis 5: A student’s perceived level of importance for performance mea-sures (financial performance, winning the game, and getting a good grade on the simulation project) will be directly related to his or her perceived transfer of learning.
Hypothesis 6: A student’s expectation of their final course grade (A, B, C, D, F) will be directly related to his or her perceived transfer of learning.
MethodSample
We used a 49-item survey instrument to sample undergraduate business students from a university in southeast Texas. The subjects were all competing in the BUSINESS STRATEGY GAME (2002) as part of their capstone course. In the capstone course, rather than present new material, we expect students to integrate prior learning from their core business administration classes. The simulation is one tool used in the class for demonstrating the ability to integrate prior learning. Performance on the simula-tion accounts for 20% of the grade in the course. A total of 98 usable questionnaires out of 100 questionnaires administered serve as the database for this study. The sample consisted of 52% females and 48% males. More than 73% of the respondents were 21 to 24 years old, 15% were 25 to 30 years old, and 11.5% were 31 years and older. Finally, 16.3% of the sample indicated that they were Accounting majors, 9.0% Finance, 13.3% General Business, 17.5% Management, 20.4% Management Informa-tion Systems, and 23.5% were Marketing majors. Teams were self-selected.
at PENNSYLVANIA STATE UNIV on April 8, 2016sag.sagepub.comDownloaded from
70 Simulation & Gaming 42(1)
Measures
Each item in the questionnaire was measured on a 5-point Likert-type scale ranging from 1 (strongly disagree) to 5 (strongly agree). Of the 49 items on the scale, 6 were used to measure the dependent variable (transfer of learning). Twenty-one items were used to measure the five independent variables (simulation self-esteem, decision-making process, involved in strategic decision making, involved in functional areas of decision making, and involved in financial decision making). Five items were used to measure two factors that were not used in this study, cooperation and control of the keyboard. An additional 4 items were used to measure how the simulation was learned (manual, professor, peers, hands-on), 3 items were used to measure the most impor-tant aspect of making a decision (winning, financial, and making a good grade on the simulation project), and 1 question was used to measure the expected course grade. To facilitate substantive comparisons and interpretations, the expected course grade question was converted to a 5-point Likert-type scale where an A = 5, B = 4, C = 3, D = 2, and F = 1. Finally, 9 questions were demographic in nature. Because no demo-graphic effects appeared in this study, we did not include the demographic questions in the analyses.
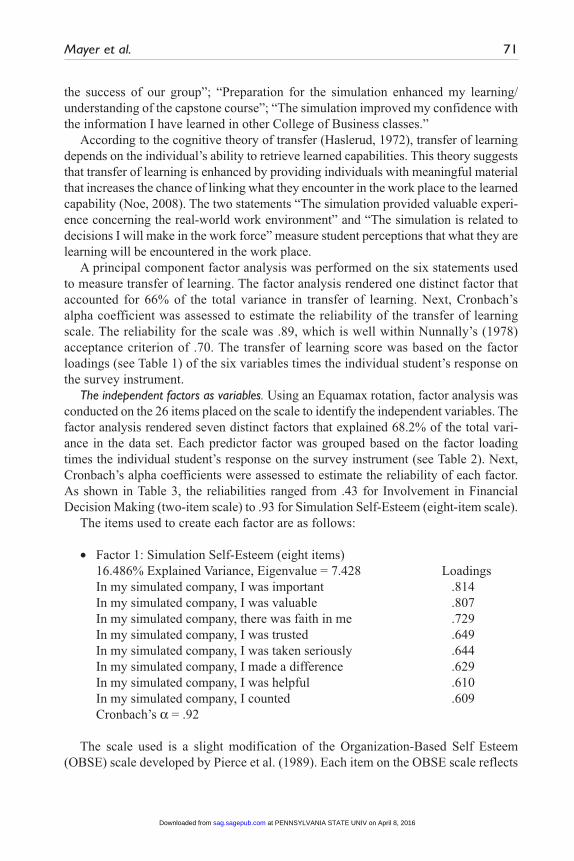
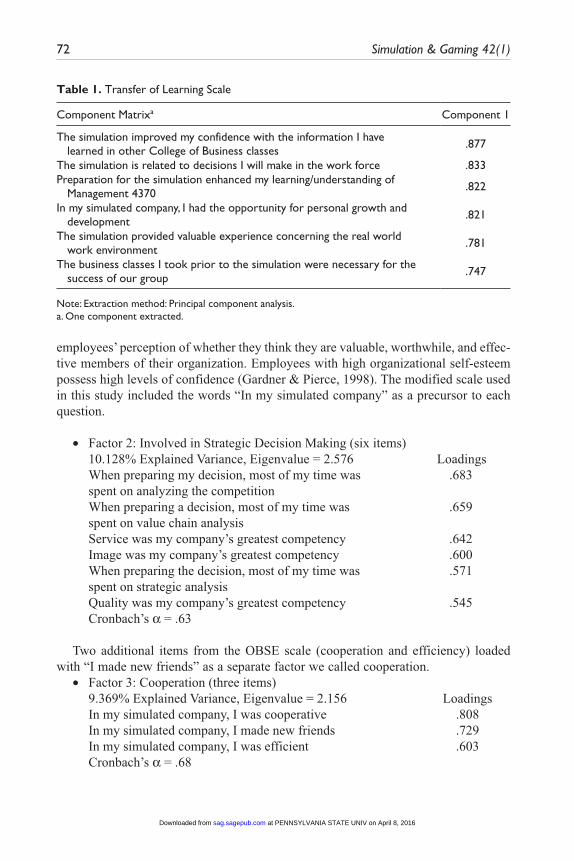
Dependent variable. Perceived transfer of learning is the dependent variable and was measured using a six-item scale. As shown in Table 1, statements used to measure transfer of learning include, “The simulation provided valuable experience concerning the real-world work environment”; “In my simulated company, I had the opportunity for personal growth and development”; “The business classes I took prior to the simula-tion were necessary for the success of our group”; “Preparation for the simulation enhanced my learning/understanding of the capstone course”; “The simulation improved my confidence with the information I have learned in other College of Busi-ness classes”; and “The simulation is related to decisions I will make in the work force.”
The six statements were developed for measuring transfer of learning because they tap self-efficacy levels regarding learned capabilities. Perceptions of self-efficacy are useful in measuring perceived transfer of learning because individuals who have a strong sense of self-efficacy are likely to have strong expectations that they can accomplish the behaviors required for performance. Self-efficacy is “one’s overall estimate of one’s ability to effect requisite performances in achievement situations” (Eden & Zuk, 1995, p. 629). Numerous studies have demonstrated the importance of self-efficacy for improving work performance (Gist & Mitchell, 1992). Bandura (1997) suggests that “efficacy beliefs influence how people think, feel, motivate them-selves, and act” (p. 2). Past experiences will create a general set of expectancies that get carried over into new situations (Bandura, 1977).
Among the determinants that help to increase perceptions of self-efficacy are expe-riences involving personal attainment (Gist & Mitchell, 1992). The following four statements from the transfer of learning measure question perceptions of personal attainment: “In my simulated company, I had the opportunity for personal growth and development”; “The business classes I took prior to the simulation were necessary for
at PENNSYLVANIA STATE UNIV on April 8, 2016sag.sagepub.comDownloaded from
Mayer et al. 71
the success of our group”; “Preparation for the simulation enhanced my learning/understanding of the capstone course”; “The simulation improved my confidence with the information I have learned in other College of Business classes.”
According to the cognitive theory of transfer (Haslerud, 1972), transfer of learning depends on the individual’s ability to retrieve learned capabilities. This theory suggests that transfer of learning is enhanced by providing individuals with meaningful material that increases the chance of linking what they encounter in the work place to the learned capability (Noe, 2008). The two statements “The simulation provided valuable experi-ence concerning the real-world work environment” and “The simulation is related to decisions I will make in the work force” measure student perceptions that what they are learning will be encountered in the work place.
A principal component factor analysis was performed on the six statements used to measure transfer of learning. The factor analysis rendered one distinct factor that accounted for 66% of the total variance in transfer of learning. Next, Cronbach’s alpha coefficient was assessed to estimate the reliability of the transfer of learning scale. The reliability for the scale was .89, which is well within Nunnally’s (1978) acceptance criterion of .70. The transfer of learning score was based on the factor loadings (see Table 1) of the six variables times the individual student’s response on the survey instrument.
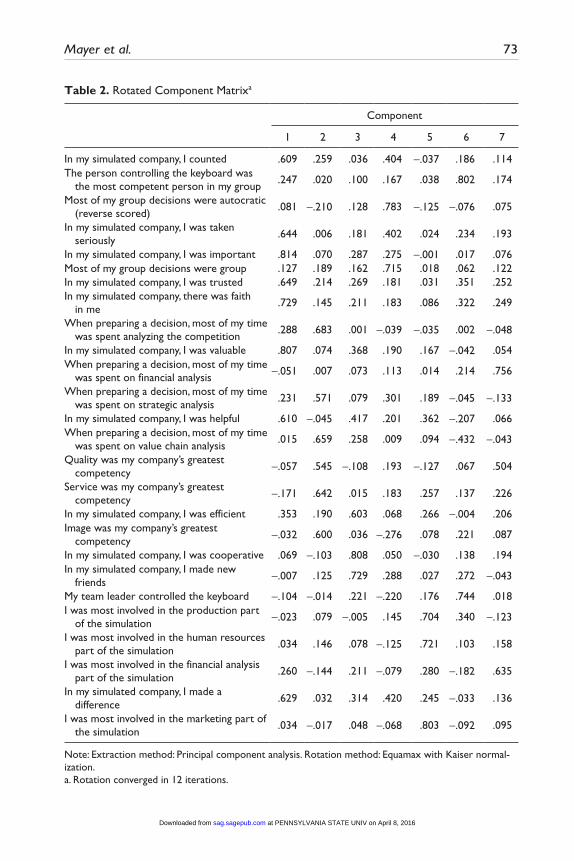
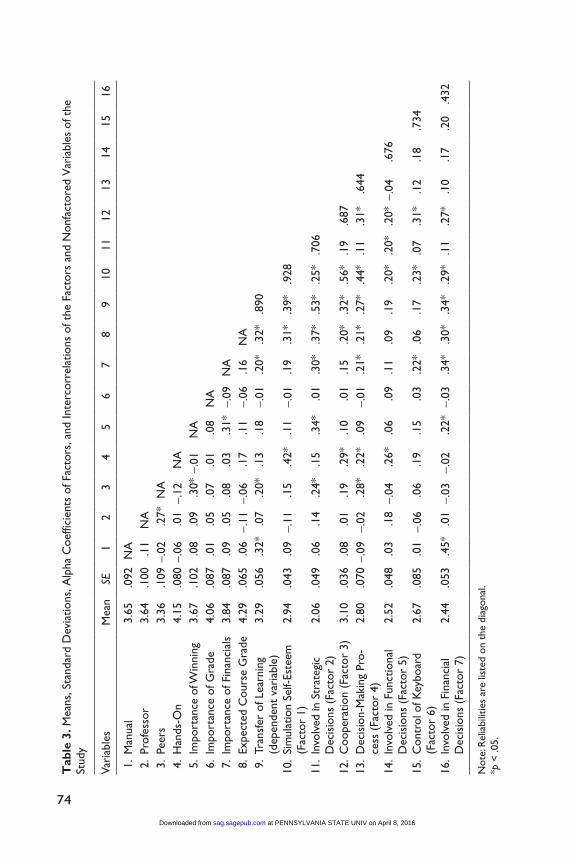
The independent factors as variables. Using an Equamax rotation, factor analysis was conducted on the 26 items placed on the scale to identify the independent variables. The factor analysis rendered seven distinct factors that explained 68.2% of the total vari-ance in the data set. Each predictor factor was grouped based on the factor loading times the individual student’s response on the survey instrument (see Table 2). Next, Cronbach’s alpha coefficients were assessed to estimate the reliability of each factor. As shown in Table 3, the reliabilities ranged from .43 for Involvement in Financial Decision Making (two-item scale) to .93 for Simulation Self-Esteem (eight-item scale).
The items used to create each factor are as follows:
• Factor 1: Simulation Self-Esteem (eight items)16.486% Explained Variance, Eigenvalue = 7.428 LoadingsIn my simulated company, I was important .814In my simulated company, I was valuable .807In my simulated company, there was faith in me .729In my simulated company, I was trusted .649In my simulated company, I was taken seriously .644In my simulated company, I made a difference .629In my simulated company, I was helpful .610In my simulated company, I counted .609Cronbach’s a = .92
The scale used is a slight modification of the Organization-Based Self Esteem (OBSE) scale developed by Pierce et al. (1989). Each item on the OBSE scale reflects
at PENNSYLVANIA STATE UNIV on April 8, 2016sag.sagepub.comDownloaded from
72 Simulation & Gaming 42(1)
employees’ perception of whether they think they are valuable, worthwhile, and effec-tive members of their organization. Employees with high organizational self-esteem possess high levels of confidence (Gardner & Pierce, 1998). The modified scale used in this study included the words “In my simulated company” as a precursor to each question.
• Factor 2: Involved in Strategic Decision Making (six items)10.128% Explained Variance, Eigenvalue = 2.576 LoadingsWhen preparing my decision, most of my time was .683 spent on analyzing the competitionWhen preparing a decision, most of my time was .659 spent on value chain analysisService was my company’s greatest competency .642Image was my company’s greatest competency .600When preparing the decision, most of my time was .571 spent on strategic analysisQuality was my company’s greatest competency .545Cronbach’s a = .63
Two additional items from the OBSE scale (cooperation and efficiency) loaded with “I made new friends” as a separate factor we called cooperation.
• Factor 3: Cooperation (three items)9.369% Explained Variance, Eigenvalue = 2.156 LoadingsIn my simulated company, I was cooperative .808In my simulated company, I made new friends .729In my simulated company, I was efficient .603Cronbach’s a = .68
Table 1. Transfer of Learning Scale
Component Matrixa Component 1
The simulation improved my confidence with the information I have learned in other College of Business classes
.877
The simulation is related to decisions I will make in the work force .833Preparation for the simulation enhanced my learning/understanding of
Management 4370.822
In my simulated company, I had the opportunity for personal growth and development
.821
The simulation provided valuable experience concerning the real world work environment
.781
The business classes I took prior to the simulation were necessary for the success of our group
.747
Note: Extraction method: Principal component analysis.a. One component extracted.
at PENNSYLVANIA STATE UNIV on April 8, 2016sag.sagepub.comDownloaded from
Mayer et al. 73
Table 2. Rotated Component Matrixa
Component
1 2 3 4 5 6 7
In my simulated company, I counted .609 .259 .036 .404 -.037 .186 .114The person controlling the keyboard was
the most competent person in my group.247 .020 .100 .167 .038 .802 .174
Most of my group decisions were autocratic (reverse scored)
.081 -.210 .128 .783 -.125 -.076 .075
In my simulated company, I was taken seriously
.644 .006 .181 .402 .024 .234 .193
In my simulated company, I was important .814 .070 .287 .275 -.001 .017 .076Most of my group decisions were group .127 .189 .162 .715 .018 .062 .122In my simulated company, I was trusted .649 .214 .269 .181 .031 .351 .252In my simulated company, there was faith
in me.729 .145 .211 .183 .086 .322 .249
When preparing a decision, most of my time was spent analyzing the competition
.288 .683 .001 -.039 -.035 .002 -.048
In my simulated company, I was valuable .807 .074 .368 .190 .167 -.042 .054When preparing a decision, most of my time
was spent on financial analysis -.051 .007 .073 .113 .014 .214 .756
When preparing a decision, most of my time was spent on strategic analysis
.231 .571 .079 .301 .189 -.045 -.133
In my simulated company, I was helpful .610 -.045 .417 .201 .362 -.207 .066When preparing a decision, most of my time
was spent on value chain analysis.015 .659 .258 .009 .094 -.432 -.043
Quality was my company’s greatest competency -.057 .545 -.108 .193 -.127 .067 .504
Service was my company’s greatest competency -.171 .642 .015 .183 .257 .137 .226
In my simulated company, I was efficient .353 .190 .603 .068 .266 -.004 .206Image was my company’s greatest
competency -.032 .600 .036 -.276 .078 .221 .087
In my simulated company, I was cooperative .069 -.103 .808 .050 -.030 .138 .194In my simulated company, I made new
friends -.007 .125 .729 .288 .027 .272 -.043
My team leader controlled the keyboard -.104 -.014 .221 -.220 .176 .744 .018I was most involved in the production part
of the simulation -.023 .079 -.005 .145 .704 .340 -.123
I was most involved in the human resources part of the simulation
.034 .146 .078 -.125 .721 .103 .158
I was most involved in the financial analysis part of the simulation
.260 -.144 .211 -.079 .280 -.182 .635
In my simulated company, I made a difference
.629 .032 .314 .420 .245 -.033 .136
I was most involved in the marketing part of the simulation
.034 -.017 .048 -.068 .803 -.092 .095
Note: Extraction method: Principal component analysis. Rotation method: Equamax with Kaiser normal-ization.a. Rotation converged in 12 iterations.
at PENNSYLVANIA STATE UNIV on April 8, 2016sag.sagepub.comDownloaded from
74
Tab
le 3
. Mea
ns, S
tand
ard
Dev
iatio
ns, A
lpha
Coe
ffici
ents
of F
acto
rs, a
nd In
terc
orre
latio
ns o
f the
Fac
tors
and
Non
fact
ored
Var
iabl
es o
f the
St
udy
Vari
able
sM
ean
SE1
23
45
67
89
1011
1213
1415
16
1.
Man
ual
3.65
.092
NA
2.
Prof
esso
r3.
64.1
00.1
1N
A 3
. Pe
ers
3.36
.109
-.0
2.2
7*N
A 4
. H
ands
-On
4.15
.080
-.06
.01
-.12
NA
5.
Impo
rtan
ce o
f Win
ning
3.67
.102
.08
.09
.30*
-.01
NA
6.
Impo
rtan
ce o
f Gra
de4.
06.0
87.0
1.0
5.0
7.0
1.0
8N
A 7
. Im
port
ance
of F
inan
cial
s3.
84.0
87.0
9.0
5.0
8.0
3.3
1*-.
09N
A 8
. Ex
pect
ed C
ours
e G
rade
4.29
.065
.06
-.11
-.06
.17
.11
-.06
.16
NA
9.
Tran
sfer
of L
earn
ing
(dep
ende
nt v
aria
ble)
3.29
.056
.32*
.07
.20*
.13
.18
-.01
.20*
.32*
.890
10.
Sim
ulat
ion
Self-
Este
em
(Fac
tor
1)2.
94.0
43.0
9-.
11.1
5.4
2*.1
1-.
01.1
9.3
1*.3
9*.9
28
11.
Invo
lved
in S
trat
egic
D
ecis
ions
(Fa
ctor
2)
2.06
.049
.06
.14
.24*
.15
.34*
.0
1.3
0*.3
7*.5
3*.2
5*.7
06
12.
Coo
pera
tion
(Fac
tor
3)3.
10.0
36.0
8.0
1.1
9.2
9*.1
0.0
1.1
5.2
0*.3
2*.5
6*.1
9.6
8713
. D
ecis
ion-
Mak
ing
Pro-
cess
(Fa
ctor
4)
2.80
.070
-.09
-.02
.28*
.22*
.09
-.01
.21*
.21*
.27*
.44*
.11
.31*
.6
44
14.
Invo
lved
in F
unct
iona
l D
ecis
ions
(Fa
ctor
5)
2.52
.048
.03
.18
-.04
.26*
.06
.09
.11
.09
.19
.20*
.20*
.20*
-.0
4.6
76
15.
Con
trol
of K
eybo
ard
(Fac
tor
6)2.
67.0
85.0
1-.
06.0
6.1
9.1
5.0
3.2
2*.0
6.1
7.2
3*.0
7.3
1*.1
2.1
8.7
34
16.
Invo
lved
in F
inan
cial
D
ecis
ions
(Fa
ctor
7)
2.44
.053
.45*
.01
-.03
-.02
.22*
-.03
.34*
.30*
.34*
.29*
.11
.27*
.10
.17
.20
.432
Not
e: R
elia
bilit
ies
are
liste
d on
the
dia
gona
l.*p
< .0
5.
at PENNSYLVANIA STATE UNIV on April 8, 2016sag.sagepub.comDownloaded from
Mayer et al. 75
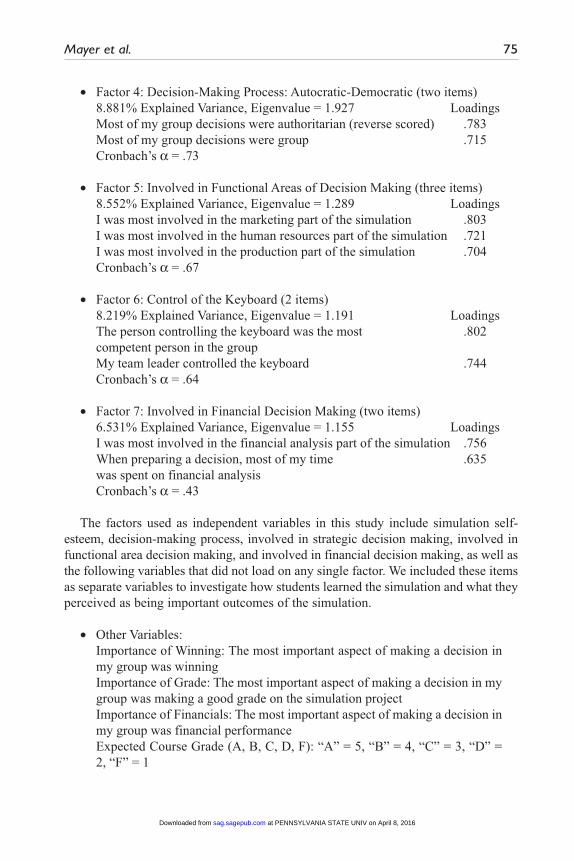
• Factor 4: Decision-Making Process: Autocratic-Democratic (two items)8.881% Explained Variance, Eigenvalue = 1.927 LoadingsMost of my group decisions were authoritarian (reverse scored) .783Most of my group decisions were group .715Cronbach’s a = .73
• Factor 5: Involved in Functional Areas of Decision Making (three items)8.552% Explained Variance, Eigenvalue = 1.289 LoadingsI was most involved in the marketing part of the simulation .803I was most involved in the human resources part of the simulation .721I was most involved in the production part of the simulation .704Cronbach’s a = .67
• Factor 6: Control of the Keyboard (2 items)8.219% Explained Variance, Eigenvalue = 1.191 LoadingsThe person controlling the keyboard was the most .802 competent person in the groupMy team leader controlled the keyboard .744Cronbach’s a = .64
• Factor 7: Involved in Financial Decision Making (two items)6.531% Explained Variance, Eigenvalue = 1.155 LoadingsI was most involved in the financial analysis part of the simulation .756When preparing a decision, most of my time .635 was spent on financial analysisCronbach’s a = .43
The factors used as independent variables in this study include simulation self-esteem, decision-making process, involved in strategic decision making, involved in functional area decision making, and involved in financial decision making, as well as the following variables that did not load on any single factor. We included these items as separate variables to investigate how students learned the simulation and what they perceived as being important outcomes of the simulation.
• Other Variables:Importance of Winning: The most important aspect of making a decision in my group was winningImportance of Grade: The most important aspect of making a decision in my group was making a good grade on the simulation projectImportance of Financials: The most important aspect of making a decision in my group was financial performanceExpected Course Grade (A, B, C, D, F): “A” = 5, “B” = 4, “C” = 3, “D” = 2, “F” = 1
at PENNSYLVANIA STATE UNIV on April 8, 2016sag.sagepub.comDownloaded from
76 Simulation & Gaming 42(1)
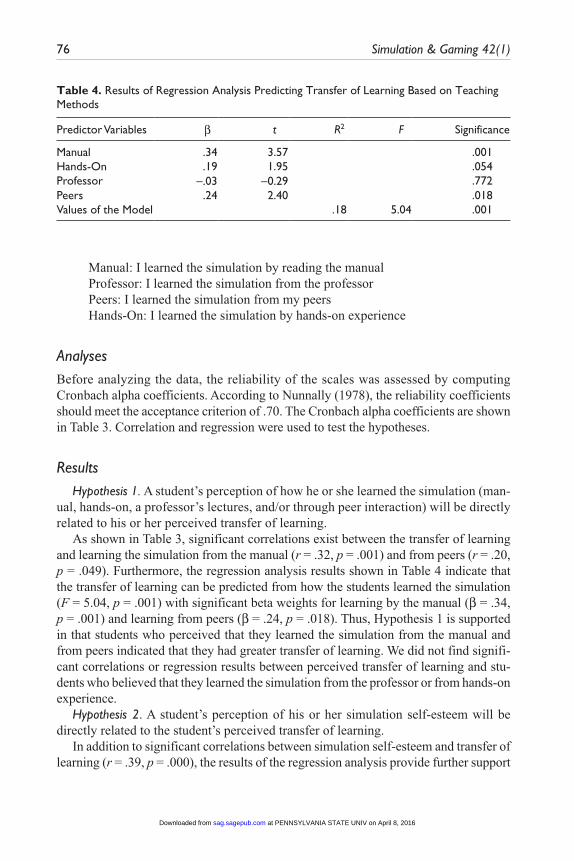
Manual: I learned the simulation by reading the manualProfessor: I learned the simulation from the professorPeers: I learned the simulation from my peersHands-On: I learned the simulation by hands-on experience
AnalysesBefore analyzing the data, the reliability of the scales was assessed by computing Cronbach alpha coefficients. According to Nunnally (1978), the reliability coefficients should meet the acceptance criterion of .70. The Cronbach alpha coefficients are shown in Table 3. Correlation and regression were used to test the hypotheses.
ResultsHypothesis 1. A student’s perception of how he or she learned the simulation (man-
ual, hands-on, a professor’s lectures, and/or through peer interaction) will be directly related to his or her perceived transfer of learning.
As shown in Table 3, significant correlations exist between the transfer of learning and learning the simulation from the manual (r = .32, p = .001) and from peers (r = .20, p = .049). Furthermore, the regression analysis results shown in Table 4 indicate that the transfer of learning can be predicted from how the students learned the simulation (F = 5.04, p = .001) with significant beta weights for learning by the manual (b = .34, p = .001) and learning from peers (b = .24, p = .018). Thus, Hypothesis 1 is supported in that students who perceived that they learned the simulation from the manual and from peers indicated that they had greater transfer of learning. We did not find signifi-cant correlations or regression results between perceived transfer of learning and stu-dents who believed that they learned the simulation from the professor or from hands-on experience.
Hypothesis 2. A student’s perception of his or her simulation self-esteem will be directly related to the student’s perceived transfer of learning.
In addition to significant correlations between simulation self-esteem and transfer of learning (r = .39, p = .000), the results of the regression analysis provide further support
Table 4. Results of Regression Analysis Predicting Transfer of Learning Based on Teaching Methods
Predictor Variables b t R2 F Significance
Manual .34 3.57 .001Hands-On .19 1.95 .054Professor -.03 -0.29 .772Peers .24 2.40 .018Values of the Model .18 5.04 .001
at PENNSYLVANIA STATE UNIV on April 8, 2016sag.sagepub.comDownloaded from
Mayer et al. 77
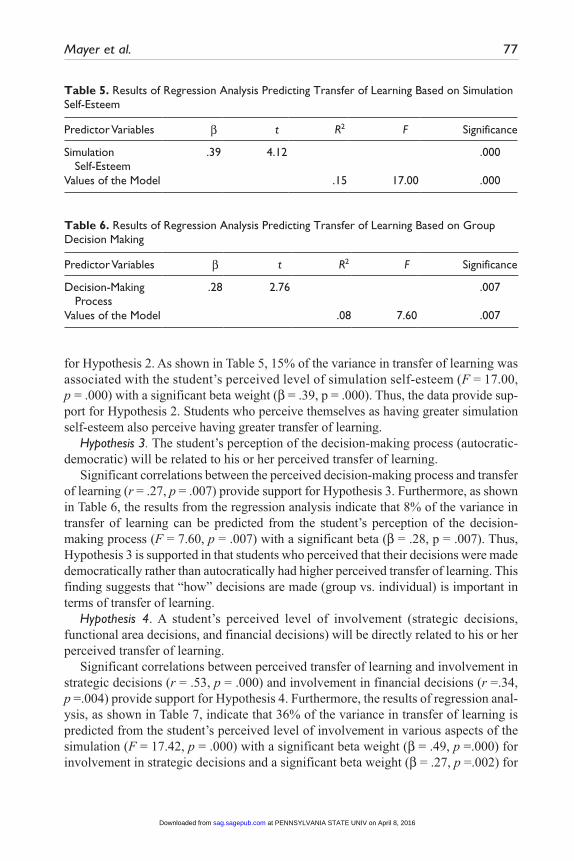
for Hypothesis 2. As shown in Table 5, 15% of the variance in transfer of learning was associated with the student’s perceived level of simulation self-esteem (F = 17.00, p = .000) with a significant beta weight (b = .39, p = .000). Thus, the data provide sup-port for Hypothesis 2. Students who perceive themselves as having greater simulation self-esteem also perceive having greater transfer of learning.
Hypothesis 3. The student’s perception of the decision-making process (autocratic-democratic) will be related to his or her perceived transfer of learning.
Significant correlations between the perceived decision-making process and transfer of learning (r = .27, p = .007) provide support for Hypothesis 3. Furthermore, as shown in Table 6, the results from the regression analysis indicate that 8% of the variance in transfer of learning can be predicted from the student’s perception of the decision-making process (F = 7.60, p = .007) with a significant beta (b = .28, p = .007). Thus, Hypothesis 3 is supported in that students who perceived that their decisions were made democratically rather than autocratically had higher perceived transfer of learning. This finding suggests that “how” decisions are made (group vs. individual) is important in terms of transfer of learning.
Hypothesis 4. A student’s perceived level of involvement (strategic decisions, functional area decisions, and financial decisions) will be directly related to his or her perceived transfer of learning.
Significant correlations between perceived transfer of learning and involvement in strategic decisions (r = .53, p = .000) and involvement in financial decisions (r =.34, p =.004) provide support for Hypothesis 4. Furthermore, the results of regression anal-ysis, as shown in Table 7, indicate that 36% of the variance in transfer of learning is predicted from the student’s perceived level of involvement in various aspects of the simulation (F = 17.42, p = .000) with a significant beta weight (b = .49, p =.000) for involvement in strategic decisions and a significant beta weight (b = .27, p =.002) for
Table 5. Results of Regression Analysis Predicting Transfer of Learning Based on Simulation Self-Esteem
Predictor Variables b t R2 F Significance
Simulation Self-Esteem
.39 4.12 .000
Values of the Model .15 17.00 .000
Table 6. Results of Regression Analysis Predicting Transfer of Learning Based on Group Decision Making
Predictor Variables b t R2 F Significance
Decision-Making Process
.28 2.76 .007
Values of the Model .08 7.60 .007
at PENNSYLVANIA STATE UNIV on April 8, 2016sag.sagepub.comDownloaded from
78 Simulation & Gaming 42(1)
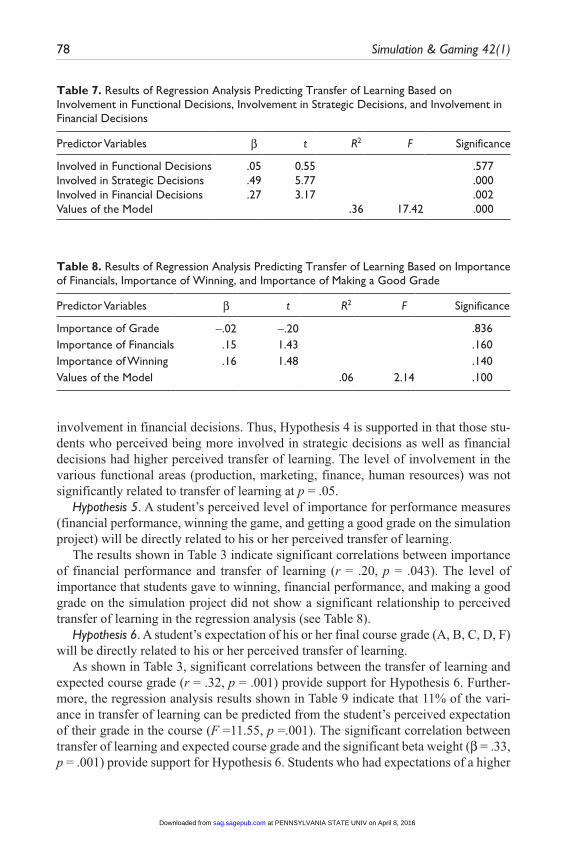
involvement in financial decisions. Thus, Hypothesis 4 is supported in that those stu-dents who perceived being more involved in strategic decisions as well as financial decisions had higher perceived transfer of learning. The level of involvement in the various functional areas (production, marketing, finance, human resources) was not significantly related to transfer of learning at p = .05.
Hypothesis 5. A student’s perceived level of importance for performance measures (financial performance, winning the game, and getting a good grade on the simulation project) will be directly related to his or her perceived transfer of learning.
The results shown in Table 3 indicate significant correlations between importance of financial performance and transfer of learning (r = .20, p = .043). The level of importance that students gave to winning, financial performance, and making a good grade on the simulation project did not show a significant relationship to perceived transfer of learning in the regression analysis (see Table 8).
Hypothesis 6. A student’s expectation of his or her final course grade (A, B, C, D, F) will be directly related to his or her perceived transfer of learning.
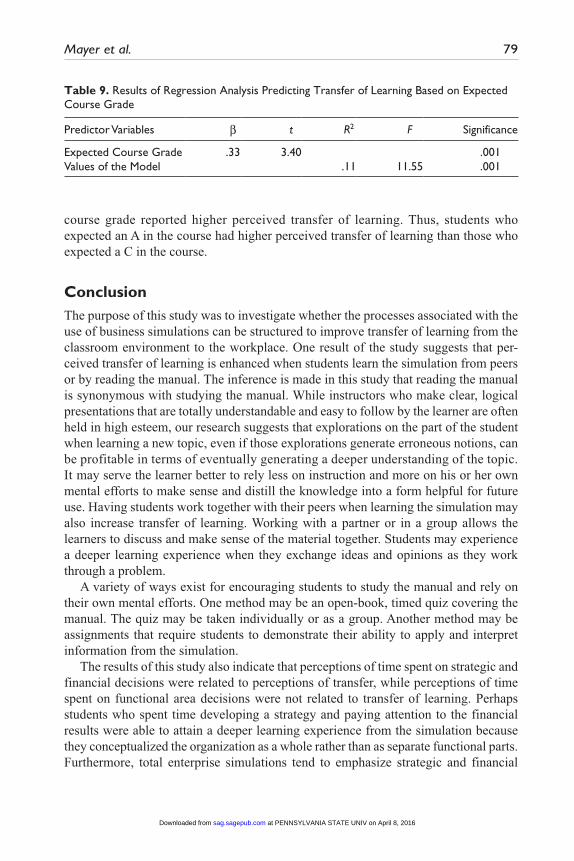
As shown in Table 3, significant correlations between the transfer of learning and expected course grade (r = .32, p = .001) provide support for Hypothesis 6. Further-more, the regression analysis results shown in Table 9 indicate that 11% of the vari-ance in transfer of learning can be predicted from the student’s perceived expectation of their grade in the course (F =11.55, p =.001). The significant correlation between transfer of learning and expected course grade and the significant beta weight (b = .33, p = .001) provide support for Hypothesis 6. Students who had expectations of a higher
Table 8. Results of Regression Analysis Predicting Transfer of Learning Based on Importance of Financials, Importance of Winning, and Importance of Making a Good Grade
Predictor Variables b t R2 F Significance
Importance of Grade -.02 -.20 .836Importance of Financials .15 1.43 .160Importance of Winning .16 1.48 .140Values of the Model .06 2.14 .100
Table 7. Results of Regression Analysis Predicting Transfer of Learning Based on Involvement in Functional Decisions, Involvement in Strategic Decisions, and Involvement in Financial Decisions
Predictor Variables b t R2 F Significance
Involved in Functional Decisions .05 0.55 .577Involved in Strategic Decisions .49 5.77 .000Involved in Financial Decisions .27 3.17 .002Values of the Model .36 17.42 .000
at PENNSYLVANIA STATE UNIV on April 8, 2016sag.sagepub.comDownloaded from
Mayer et al. 79
course grade reported higher perceived transfer of learning. Thus, students who expected an A in the course had higher perceived transfer of learning than those who expected a C in the course.
ConclusionThe purpose of this study was to investigate whether the processes associated with the use of business simulations can be structured to improve transfer of learning from the classroom environment to the workplace. One result of the study suggests that per-ceived transfer of learning is enhanced when students learn the simulation from peers or by reading the manual. The inference is made in this study that reading the manual is synonymous with studying the manual. While instructors who make clear, logical presentations that are totally understandable and easy to follow by the learner are often held in high esteem, our research suggests that explorations on the part of the student when learning a new topic, even if those explorations generate erroneous notions, can be profitable in terms of eventually generating a deeper understanding of the topic. It may serve the learner better to rely less on instruction and more on his or her own mental efforts to make sense and distill the knowledge into a form helpful for future use. Having students work together with their peers when learning the simulation may also increase transfer of learning. Working with a partner or in a group allows the learners to discuss and make sense of the material together. Students may experience a deeper learning experience when they exchange ideas and opinions as they work through a problem.
A variety of ways exist for encouraging students to study the manual and rely on their own mental efforts. One method may be an open-book, timed quiz covering the manual. The quiz may be taken individually or as a group. Another method may be assignments that require students to demonstrate their ability to apply and interpret information from the simulation.
The results of this study also indicate that perceptions of time spent on strategic and financial decisions were related to perceptions of transfer, while perceptions of time spent on functional area decisions were not related to transfer of learning. Perhaps students who spent time developing a strategy and paying attention to the financial results were able to attain a deeper learning experience from the simulation because they conceptualized the organization as a whole rather than as separate functional parts. Furthermore, total enterprise simulations tend to emphasize strategic and financial
Table 9. Results of Regression Analysis Predicting Transfer of Learning Based on Expected Course Grade
Predictor Variables b t R2 F Significance
Expected Course Grade .33 3.40 .001Values of the Model .11 11.55 .001
at PENNSYLVANIA STATE UNIV on April 8, 2016sag.sagepub.comDownloaded from
80 Simulation & Gaming 42(1)
decision making, which supports the notion that “deliberate practice” and spending time working on the decisions affects transfer.
The importance students placed on winning when making decisions was not related to perceived transfer of learning. This finding supports other researchers who found that learning and performance on the simulation were not related (Washburn & Gosen, 1998). Perhaps players who performed poorly for most of the game, but who consci-entiously played the game, learned substantially. It is also possible that those who performed best may have simply found the correct strategy without understanding how to apply what they learned to other settings. While financial performance and making a good grade on the simulation were not related to perceived transfer of learn-ing, expectation of the overall course grade was related to perceptions of transfer. Thus, instructors may want to put less grading emphasis on winning the simulation and more grading emphasis on simulation assignments that reinforce the learning objectives for the course. Potential assignments to reinforce learning objectives may include having students develop a strategic plan, perform an internal and external analysis, identify key problems or issues, and develop recommendations for their simulation company.
Future research on transfer of learning and simulations should build on the current study and further test the finding that transfer of learning is greater for those students who read the manual. A possible research design for testing this finding may be to com-pare two classes. One class would not have a manual, but the professor would attempt to explain how to use the simulation. In another class, students would be required to read the manual and not have the professor explain the simulation. Along with this type of study, it would be helpful to investigate why some students read the manual when assigned to and others do not. Perhaps those who do not read are different from those who do. Secondly, an inventory of transfer of learning opportunities in total enter-prise simulations should be developed. Researchers would need to identify which spe-cific types of prior learning opportunities are able to be demonstrated in various total enterprise simulations. Furthermore, it would be helpful to develop a simple way to measure the prior learning needed in the simulation. Such information will help simula-tion developers and users determine how more learning opportunities can be placed into simulations or what additional enrichment learning techniques may be used in con-nection with simulations. Finally, it may be useful to do research on incentive systems that professors could use to encourage students to read the manual.
Our study, like most, had some limitations. While the reliability of the scale used to measure transfer of learning appears to be acceptable (.89), the construct validity needs to be determined. Furthermore, student perceptions rather than actual transfer of learn-ing were measured. An individual may or may not correctly perceive how he or she will be able to apply the knowledge to future situations. Findings from attribution theory, however, suggest that perceptions of behavior may result in the actual behaviors (Kelly, 1971). Individuals observe their actions at Step 1 and must explain why they did what they did and will probably perform the second related action. Finally, the results apply to observations from one university and one business simulation. Similar analyses of
at PENNSYLVANIA STATE UNIV on April 8, 2016sag.sagepub.comDownloaded from
Mayer et al. 81
different games need to be completed before generalized statements are made, but these results provide some evidence, however small, that transfer of learning may be associated with various methods of teaching the simulation and various aspects of student involvement in the simulation.
Declaration of Conflicting Interests
The author(s) declared no potential conflicts of interest with respect to the authorship and/or publication of this article.
Funding
The author(s) received no financial support for the research and/or authorship of this article.
References
Adobor, H., & Daneshfar, A. (2006). Management simulations: Determining their effectiveness. Journal of Management Development, 25, 151-168.
Aldrich, C. (2005). Learning by doing: A comprehensive guide to simulations, computer games, and pedagogy in e-learning and other educational experiences. New York, NY: Wiley.
Allen, D., & Young, M. (1997). From tour guide to teacher: Deepening cross-cultural compe-tence through international experience-based education. Journal of Management Education, 21, 168-189.
Anderson, J. R., Reder, L. M., & Simon, H. A. (1996). Situated learning and education. Educa-tional Researcher, 25(4), 5-96.
Anderson, P. H., & Lawton, L. (1992). The relationship between financial performance and other measures of learning on a simulation exercise. Simulation & Gaming: An International Journal, 23, 326-340.
Bandura, A. (1977). Self-efficacy: Toward a unifying theory of behavioral change. Psychologi-cal Reviews, 64, 191-216.
Bandura, A. (1997). Exercise of personal and collective efficacy in changing societies. In A. Bandura (Ed.), Self-efficacy in changing societies (pp. 1-45). Cambridge, England: Cam-bridge University Press.
Barnett, S. M., & Ceci, S. J. (2002). When and where do we apply what we learn? A taxonomy for far transfer. Psychological-Bulletin, 128, 612-637.
Bransford, J. D., & Stein, B. S. (1993). The IDEAL problem solver (2nd ed.). New York, NY: Freeman.
Brown, A. L. (1990). Domain-specific principles affect learning and transfer in children. Cogni-tive Science, 14, 107-133.
Brown, A. L., Bransford, J. D., Ferrara, R. A., & Campione, J. (1983). Learning, remembering, and understanding. In J. Flavell & E. M. Markman (Eds.), Cognitive development (Vol. 3, pp. 78-166). New York, NY: John Wiley.
BUSINESS STRATEGY GAME. (2002). [Developed by A. A. Thompson & G. J. Stappen-beck]. New York, NY: McGraw-Hill Irwin.
Byrnes, J. P. (1996). Cognitive development and learning in instructional contexts. Boston, MA: Allyn & Bacon.
at PENNSYLVANIA STATE UNIV on April 8, 2016sag.sagepub.comDownloaded from
82 Simulation & Gaming 42(1)
Cadotte, E. R. (1995). Business simulations: The next step in management training. Selections, 54, 8-16.
Carey, S., & Smith, C. (1993). On understanding the nature of scientific knowledge. Educa-tional Psychologist, 28, 235-251.
Chapman, K. L., & Sorge, C. L. (1999). Can a simulation help achieve course objectives? An exploratory study investigating differences among instructional tools. Journal of Education for Business, 74, 225-230.
Chi, M. T. H. (2000). Self-explaining: The dual processes of generating inference and repair-ing mental models. In R. Glaser (Ed.), Advances in instructional psychology: Educational design and cognitive science (Vol. 5, pp. 161-238). Mahwah, NJ: Lawrence Erlbaum.
Doyle, D., & Brown, F. W. (2000). Using a business simulation to teach applied skills—The benefits and the challenges of using student teams from multiple countries. Journal of Euro-pean Industrial Training, 24, 330-336.
Eden, D., & Zuk, Y. (1995). Seasickness as a self-fulfilling prophecy: Raising self-efficacy to boost performance at sea. Journal of Applied Psychology, 80, 628-635.
Ericsson, K. A., Krampe, R. T., & Tesch-Romer, C. (1993). The role of deliberate practice in the acquisition of expert performance. Psychological Review, 100, 363-406.
Faria, A. J. (1998). Business simulation games: Current usage levels—An update. Simulation & Gaming: An International Journal, 29, 295-308.
Flynn, A. E., & Klein, J. D. (2001). The influence of discussion groups in a case-based learning environment. Educational Technology, Research & Development, 49, 71-87.
Fripp, J. (1993). Learning through simulations. London, England: McGraw-Hill.Fripp, J. (1997). A future for business simulations? Journal of European Industrial Training,
21, 138-142.Gardner, D. G., & Pierce, J. L. (1998). Self-esteem and self-efficacy within the organizational
context: An empirical examination. Group & Organization Management, 23, 48-71.Gist, M., & Mitchell, R. R. (1992). Self-efficacy: A theoretical analysis of its determinants and
malleability. Academy of Management Review, 17, 183-211.Glassop, L. I. (2002). The organizational benefits of teams. Human Relations, 55, 225-250.Goosen, K. R., Jensen, R., & Wells, R. (2001). Purpose and learning benefits of simulations: A
design and development perspective. Simulation & Gaming: An Interdisciplinary Journal, 32, 21-39.
Haslerud, G. M. (1972). Transfer, memory, & creativity: After learning as perceptual process. Menasha, WI: George Banta.
Hornaday, R. W., & Curran, K. E. (1996). Formal planning and the performance of business simulation teams. Simulation & Gaming: An International Journal, 27, 206-222.
Kaagan, S. S. (1999). Leadership games. New Delhi, India: Sage.Kelly, H. H. (1971). Attribution in social interaction. Morristown, NJ: Learning Press.Klahr, D., & Carver, S. M. (1988). Cognitive objectives in a LOGO debugging curriculum:
Instruction, learning, and transfer. Cognitive Psychology, 20, 362-404.Knotts, U. S., Jr., & Keys, J. B. (1997). Teaching strategic management with a business game.
Simulation & Gaming: An International Journal, 28, 377-394.Korman, A. K. (1976). Hypothesis of work behavior revisited and an extension. Academy of
Management Review, 1, 50-63.
at PENNSYLVANIA STATE UNIV on April 8, 2016sag.sagepub.comDownloaded from
Mayer et al. 83
Littlefield, J., Delclos, V., Lever, S., Clayton, K., Bransford, J., & Franks, J. (1988). Learning LOGO: Method of teaching, transfer of general skills, and attitudes toward school and com-puters. In R. E. Mayer (Ed.), Teaching and learning computer programming (pp. 111-136), Hillsdale, NJ: Lawrence Erlbaum.
Mandler, J. M., & Orlich, F. (1993). Analogical transfer: The roles of schema abstraction and awareness. Bulletin of the Psychosonomic Society, 31, 485-487.
Moses, Y. (1994). Quality, excellence, and diversity. New Directions for Institutional Research, 81, 9-20.
Noe, R. A. (2008). Employee training and development. New York, NY: McGraw-Hill.Nunnally, J. (1978). Psychometric theory. New York, NY: McGraw-Hill.Patz, A. L. (2001). Total enterprise simulation winners and losers: A preliminary study. Devel-
opments in Business Simulation and Experiential Learning, 28, 192-195.Patz, A. L. (2002). Strategy learning in a total enterprise simulation. Developments in Business
Simulation and Experiential Learning, 29, 143-148.Patz, A. L. (2003). Revisiting strategy learning in a total enterprise simulation. Developments in
Business Simulation and Experiential Learning, 30, 213-219.Patz, A. L. (2006). The business strategy fame: A performance review of the new online edition.
Developments in Business Simulation and Experiential Learning, 33, 58-64.Perkins, D. N., & Salomon, G. (1992). Transfer of learning. International encyclopedia of edu-
cation (2nd ed.). Oxford, England: Pergamon Press.Pfeiffer, J. W. (1994). Theories and models in applied behavioral science. San Diego, CA:
Pfeiffer.Pierce, J. L., Gardner, D. G., Cummings, L. L., & Dunham, R. B. (1989). Organization-based
self-esteem: Construct definition, measurement, and validation. Academy of Management Journal, 32, 622-648.
Randel, J. M., Morris, B. A., Wetzel, C. D., & Whitehill, B. V., (1992). The effectiveness of games for educational purposes: A review of recent research. Simulation & Gaming: An International Journal, 23, 261-276.
Silva, A. B., & Kellman, P. J. (1999). Perceptual learning in mathematics: The algebra-geometry connection. In M. Han & S. C. Stoness (Eds.), Proceedings of the twenty-first annual confer-ence of the Cognitive Science Society (pp. 683-688). Mahway, NJ: Lawrence Erlbaum.
Singley, K., & Anderson, J. R. (1989). The transfer of cognitive skill. Cambridge, MA: Harvard University Press.
Snow, S. C., Gehlen, F. L., & Green, J. C. (2002). Different ways to introduce a business simula-tion: The effect on student performance. Simulation & Gaming: An Interdisciplinary Jour-nal, 33, 526-532.
Stigler, J. W., & Fernandez, C. (1995). Learning mathematics from classroom instruction: Cross-cultural and experimental perspectives. In C. A Nelson (Ed.), Basic and applied perspectives on learning, cognition, and development (pp. 103-130). Mahwah, NJ: Lawrence Erlbaum.
Teach, R. (1990). Profits: The false prophet in business gaming. Simulation & Gaming: An International Journal, 21, 12-26.
Teach, R., & Patel, V. (2007). Assessing participant learning in a business simulation. Develop-ments in Business Simulation and Experiential Learning, 34, 76-84.
at PENNSYLVANIA STATE UNIV on April 8, 2016sag.sagepub.comDownloaded from
84 Simulation & Gaming 42(1)
Thompson, G. H., & Dass, P. (2000). Improving students’ self-efficacy in strategic manage-ment: The relative impact of cases and simulations. Simulation & Gaming: An Interdisci-plinary Journal, 31, 22-41.
Washbush, J. B., & Gosen, J. (1998). Total enterprise simulation performance and participant learning. Journal of Workplace Learning, 10, 314-322.
Wenzler, I., & Chartier, D. (1999). Why do we bother with games and simulations: An organizational learning perspective. Simulation & Gaming: An International Journal, 30, 375-384.
Wingfield, S. S., & Black, G. S. (2005). Active versus passive course designs: The impact on student outcomes. Journal of Education for Business, 8, 119-123.
Wolfe, J. (1993). A history of business games in English-speaking and post-socialist countries: The origination and diffusion of a management education and development technology. Simulation & Gaming: An International Journal, 24, 446-463.
Wolfe, J. (1997). The effectiveness of business games in strategic management course work. Simulation & Gaming: An International Journal, 28, 360-376.
Wolfe, J., & Luethge, D. (2003). The impact of involvement on performance in business simula-tions: An examination of Goosen’s “know little” decision-making thesis. Journal of Educa-tion for Business, 79, 69-74.
Bios
Brad W. Mayer (BBA, BS Ed, University of North Dakota; MBA, Mankato State University; PhD, University of North Texas) is currently on the management faculty in the College of Busi-ness at Lamar University of the Texas State University System. He is the associate dean and director of the MBA program. His research interests include self-esteem, leadership, strategy, and use of business simulations. Contact: [email protected].
Kathleen M. Dale is an assistant professor of management at Minnesota State University, Mankato. She uses business simulations in a number of management courses. Her current research interests include the use of business simulations, leadership, and issues in small busi-ness management. Contact: [email protected].
Katherine A. Fraccastoro received her PhD from Louisiana State University and is currently an associate professor of marketing at Lamar University, Beaumont, Texas. Her research inter-ests include consumer behavior issues related to product pricing, cultural acceptance issues, entrepreneurship, and marketing education. She has published several refereed papers on these and related issues in conference proceedings and in journals such as the Journal of Consumer Behavior, Marketing Letters, Journal of Higher Education Policy and Management, and Com-munications of the Association for Information Systems. Currently she is the William E. and Katherine F. Fouts Faculty Scholar in Business. Contact: [email protected].
Gisele Moss is an associate professor of accounting at Lamar University. She completed her PhD at Louisiana State University. Research interests include financial accounting, managerial accounting, systems and pedagogy. Contact: [email protected].
at PENNSYLVANIA STATE UNIV on April 8, 2016sag.sagepub.comDownloaded from
Copyright © 2022 FDOKUMEN