Wind farm construction impacts reindeer migration and movement corridors

REINDEER HERDING, WEATHER AND ENVIRONMENTAL CHANGE
ON THE SEWARD PENINSULA, ALASKA
By
Kumi L. Rattenbury
RECOMMENDED: ___________________________________________
___________________________________________
___________________________________________ Advisory Committee Chair
___________________________________________ Assistant Chair, Department of Biology and Wildlife
APPROVED: _________________________________________________ Dean, College of Natural Science and Mathematics _________________________________________________ Dean of the Graduate School _________________________________________________
Date

REINDEER HERDING, WEATHER AND ENVIRONMENTAL CHANGE ON THE SEWARD PENINSULA, ALASKA
A
THESIS
Presented to the Faculty
of the University of Alaska Fairbanks
in Partial Fulfillment of the Requirements
for the Degree of
MASTER OF SCIENCE
By
Kumi L. Rattenbury, B.A.
Fairbanks, Alaska
December 2006

iii
ABSTRACT
Intrinsic to the discussion about climate change is the effect of daily weather and
other environmental conditions on natural resource-based livelihoods. Reindeer herders
on the Seward Peninsula, Alaska have relied on specific conditions to conduct intensive
herding in response to winter range expansion by the Western Arctic Caribou Herd
(WAH). From 1992 to 2005, over 17,000 reindeer (affecting 13 of 15 herds) were lost
due to mixing and emigration with the WAH. An interdisciplinary case study with one
herder provided insights about the role of weather within the social-ecological system of
herding. Inclement conditions disrupted herding plans at the same time that a smaller
herd, diminished antler markets, and rising fuel costs have been disincentives to continue
herding. Travel-limiting conditions, such as reduced visibility, delayed freeze-up, and
early break-up, were implicated in herd loss to caribou or predators by several herders.
However, these conditions have rarely been measured by climate change research, or they
involve combinations of environmental factors that are difficult to quantify. If such
events occur more frequently, as predicted by local residents and climate change models,
herders will have to adapt to shorter and warmer winters, along with the continued
presence of caribou in the region.

iv
TABLE OF CONTENTS
Page
Signature Page …………………………………………………………………………….i
Title Page ………………………………………………………………………………....ii
Abstract …………………………………………………………………………………..iii
Table of Contents ………………………………………………………………………...iv
List of Figures …………………………………………………………………………..viii
List of Tables …………………………………………………………………………......x
List of Appendices …………………………………………………………………….....xi
Acknowledgements ……………………………………………………………………...xii
Chapter 1 - INTRODUCTION ..…………………………...……………………...........1
1.1 Climate change, caribou and reindeer herding ………….……………...…….3
1.2 Climate change and Arctic communities ...…………………………………...5
1.3 Adaptability in social-ecological systems ...…………………………………..6
1.4 Climate change, SES’s and the case for interdisciplinary case studies…..….10
1.5 Study approach .…….………………………………………………………..13
1.6 Thesis structure ………….……………………………………………….….16
Chapter 2 - BACKGROUND INFORMATION ………………...…………………...18
2.1 Reindeer herding on the Seward Peninsula…………………………….……18
2.1.1 History of reindeer herding in Alaska, 1891-1988 …………..........18

v
Page
2.1.2 Modern reindeer herding on the Seward Peninsula..………….….. 19
2.2 Case study: James Noyakuk of Teller, Alaska ………………………………26
2.2.1 Study area: Noyakuk’s range……..……………………….….……26
2.2.2 Noyakuk’s family history and training in herding………….….…..27
2.2.3 Establishment and history of the Noyakuk herd…..….………...….28
2.2.4 Caribou on the Noyakuk range …………………….…………...... 36
Chapter 3 - METHODS ...…..………………………………………………………… 38
3.1 Case study interviews …………………………………………………...…..38
3.1.1 Semi-directed interviews……………………...…………………...38
3.1.2 Structured phone survey about weather limitations….…..………...41
3.1.3 Regular phone conversations about daily herding activities….……42
3.1.4 Organization of interview information……………………….…....42
3.2 Weather stations……………………………………………………………...44
3.2.1 Weather station deployment and data used ……...……………….. 44
3.2.2 Weather data consolidation ………………………………………. 49
3.3 Linking Noyakuk’s activities and observations with weather station data .... 51
3.4 Snow measurements……….....…......………………………………………. 53
3.5 Mapping relationships between herding, reindeer, and caribou...…….……..54
3.5.1 Mapping reindeer locations ……………………………………..... 54
3.5.2 Caribou home range kernels on the Seward Peninsula ……...…… 58

vi
Page
Chapter 4 - RESULTS …………………………………………………………………60
4.1 Herding seasons, daily decisions, and the effects of weather and other
environmental factors ..……...........……………………..……………… 60
4.1.1 Seasonal herding activities ……………..………………………… 60
4.1.2 Factors affecting daily herding decisions …...……..…………….. 64
4.1.3 Weather and other environmental concerns for herding…………...66
a. Freeze-up, mid-winter ice, and break-up…………………...…66
b. Visibility………………………………………………………70
c. Snow and other trail conditions…….………………………….71
d. Wind and air temperature……………………………………...76
4.2. Relating herding decisions to weather observations and weather station
data…………………………………………………………………….…78
4.2.1 February 14 to May 29, 2004
a. Chronological account ……………………………………..…78
b. Ratings results ………………………………………………...85
4.2.2 October 1, 2004 to March 14, 2005
a. Chronological account …………………………………….… 97
b. December 1, 2004 to March 14, 2005: Ratings results..…….105
4.2.3 March 15 to May 31, 2005
a. Chronological account ……..………………………………..111
b. Ratings results ……………………………………………….117

vii
Page
Chapter 5 – DISCUSSION……………………………………………………...…….123
5.1 Weather and other environmental impacts to winter herd management in 2004
and 2005……………………………………......…………....………….123
5.1.1 Timing of freeze-up and break-up ………………...…………..…124
5.1.2 Visibility …….…………………..……………………………….127
5.1.3 Snow and other trail conditions ….……………………………....128
5.1.4 Temperature, wind, and windchill ………………...…………......129
5.2 The rating system…………………………………………………………...129
5.3 Terrain implications ………….…………………………………………….130
5.4 The social-ecological system (SES) of Seward Peninsula herding …..........132
5.4.1 Adaptations in herd management ……………….....……..………133
5.4.2 Technological adaptations: new opportunities …….……………..137
5.4.3 Socioeconomic constraints and opportunities ……………………139
5.5 Climate change and Noyakuk’s herding SES………………………………144
Chapter 6 – CONCLUSION.…………………………………………...…………….148
REFERENCES…………….………………………………………………..................152
APPENDICES…………………………………………………………………………163

viii
LIST OF FIGURES
Page Figure 1. Reindeer ranges and caribou use of the Seward Peninsula, 1989-2000..……..2 Figure 2. James Noyakuk moves his herd by snowmachine……..……………………...3 Figure 3. Weather station locations and Noyakuk’s seasonal range use, 2000-2005….24 Figure 4. Noyakuk’s seasonal range use, 1988-1992…………………………………..32 Figure 5. Number of reindeer at Noyakuk’s summer handlings, 1988-2005....………..33 Figure 6. Noyakuk’s seasonal range use, 1993-1995…………………………………..34 Figure 7. Noyakuk’s seasonal range use, 1995-1999…..…………………………........35 Figure 8. HOBO weather station deployment at Mayuguk…………………………….45 Figure 9. Noyakuk decision pyramid for daily herding activities.……………………..65 Figure 10. Wind-swept hill and HOBO weather station.….………………...…………..72 Figure 11. Sun-glazed snow and HOBO weather station at Teller airport.……………...73 Figure 12. Wind-hardened snow drifts, or sastrugi.…………………………………......74 Figure 13. Soft, deep snow associated with willows (Salix spp.) in a riparian area….....75 Figure 14. Visibility in Nome, February 15 to May 29, 2004………...………………....79 Figure 15. Weather station data, February 15 to May 29, 2004…………………………80 Figure 16. Daily maximum and minimum temperature and snow depth in Nome,
Alaska, winter 2003-04 and 2004-05………………………...…………...….83 Figure 17. Locations of satellite-collared reindeer and caribou, February 15 to May 29,
2004…………………………………………………………………………..84 Figure 18. Workday average (a) wind speed, (b) temperature, and (c) windchill
temperature (WCT) for Noyakuk’s good and poor rated days, February 15 to April 7, 2004....................................................................................................87
ix
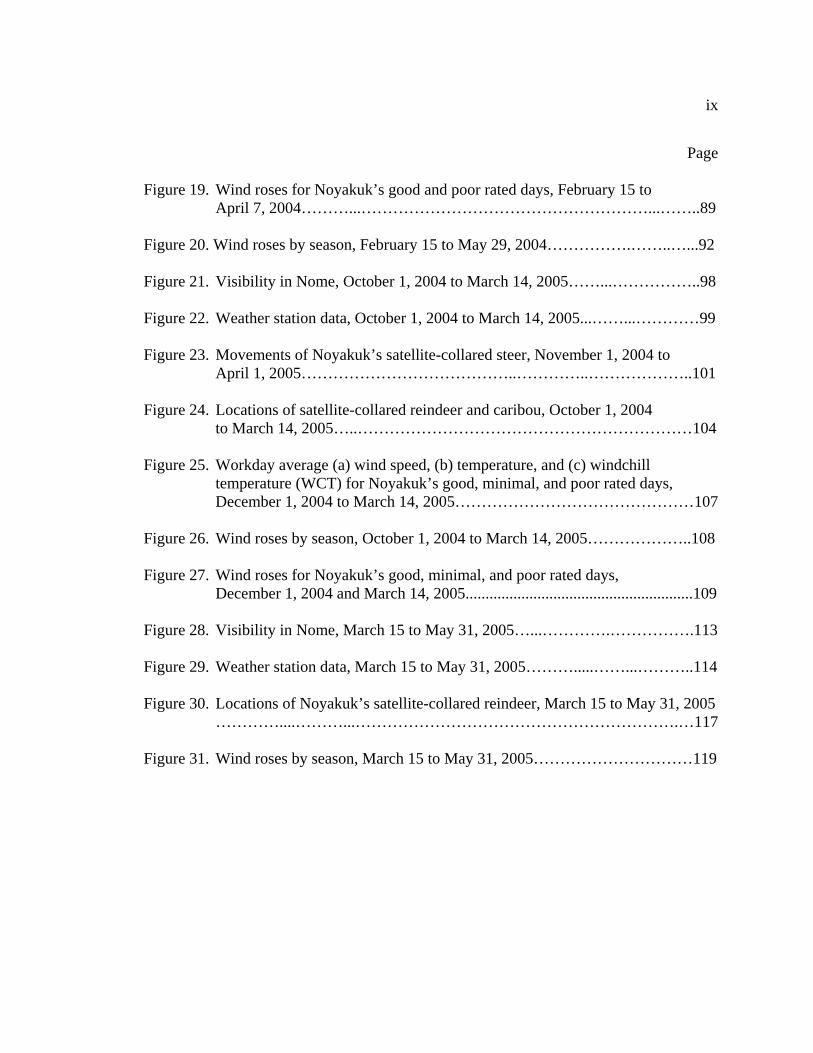
Page Figure 19. Wind roses for Noyakuk’s good and poor rated days, February 15 to
April 7, 2004………...………………………………………………...……..89 Figure 20. Wind roses by season, February 15 to May 29, 2004…………….……..…...92 Figure 21. Visibility in Nome, October 1, 2004 to March 14, 2005……...……………..98 Figure 22. Weather station data, October 1, 2004 to March 14, 2005...……...…………99 Figure 23. Movements of Noyakuk’s satellite-collared steer, November 1, 2004 to
April 1, 2005…………………………………..…………..………………..101 Figure 24. Locations of satellite-collared reindeer and caribou, October 1, 2004
to March 14, 2005…..………………………………………………………104 Figure 25. Workday average (a) wind speed, (b) temperature, and (c) windchill
temperature (WCT) for Noyakuk’s good, minimal, and poor rated days, December 1, 2004 to March 14, 2005………………………………………107
Figure 26. Wind roses by season, October 1, 2004 to March 14, 2005………………..108 Figure 27. Wind roses for Noyakuk’s good, minimal, and poor rated days,
December 1, 2004 and March 14, 2005.........................................................109 Figure 28. Visibility in Nome, March 15 to May 31, 2005…...………….…………….113 Figure 29. Weather station data, March 15 to May 31, 2005……….....……...………..114 Figure 30. Locations of Noyakuk’s satellite-collared reindeer, March 15 to May 31, 2005
…………....………...…………………………………………………….…117 Figure 31. Wind roses by season, March 15 to May 31, 2005…………………………119

x
LIST OF TABLES
Page Table 1. History of Noyakuk’s herd…………………………………………………...31 Table 2. System for rating winter weather and trail conditions…………………….…40 Table 3. Weather stations used for study……………………………………………...46 Table 4. Wind direction and wind speed categories used to make wind roses………..51 Table 5. Noyakuk’s herding seasons…………………………………………………..61 Table 6. Weather and trail conditions that affect Noyakuk’s herding decisions……...67 Table 7. Weather conditions for rated herding trips, February 15 to April 7, 2004…..86 Table 8. Snow depths on Noyakuk’s range in 2004 and 2005………………………...96 Table 9. Weather conditions for rated herding trips, December 1, 2004 to March 14,
2005 ……………………………. ………………………………………….105

xi
LIST OF APPENDICES
Page Appendix A. Definitions of terms and acronyms used in the text…………………….163 Appendix B. Informed consent and release forms …………………..……………….166 Appendix C. Structured survey questions…………………………………………….169
xii
ACKNOWLEDGEMENTS
This project would not have been possible without the support and collaboration
of James Noyakuk. I am indebted to him for teaching me about the Seward Peninsula
environment and about reindeer herding, including how to herd by snowmachine and
how to skin and gut a reindeer. I am eternally grateful to him and his extended family for
their friendship and hospitality.
My advisor, Knut Kielland of the Institute of Arctic Biology, has been a
champion of this cause and of my graduate education from the day that I first visited
UAF. The same is true of the other two members of my graduate committee – Greg
Finstad of the Reindeer Research Program and Bill Schneider of the Oral History
Program. I am grateful for their individual and collective wisdom and advice.
I thank Karl Olson of the Institute of Arctic Biology for his assistance and
guidance in the field. Staff and volunteers with the Reindeer Research Program,
especially Darrell Blodgett, Eva Wiklund, Suzanne Worker, George Aguiar, Randy
Fulweber, Margo Kramer, Mark Tarrant, Heikki Muhonen, and Baerbel Aschauer,
contributed significantly to the research process in Nome and in Fairbanks. I am
extremely thankful for the unflagging support and thoughtful words of wisdom from my
family, friends, and colleagues throughout this experience, and, in particular, for Phil
Joy’s timely assistance and patience.
Funding for this project and my graduate education was made possible by an
NSF-HARC grant, “Reindeer Herding in Transition” (NSF-OPP 9979473) as well as by

xiii
student grants from the Center for Global Change and Arctic System Research, the
Institute of Arctic Biology, and the IGERT Resilience and Adaptation Program at UAF.
Weather data (and valuable advice) were provided by David Atkinson (International
Arctic Research Center, UAF), Bob Busey (Water and Environmental Research Center,
UAF), Ken Irving (Water and Environmental Research Center, UAF), and Martha
Shulski (Alaska Climate Data Center, UAF). Satellite collar data for the Western Arctic
Caribou Herd were provided by Peter Bente of the Alaska Department of Fish and Game.
This project would not have been possible without the support of the Reindeer
Herders Association and Kawerak, Inc. I am especially grateful to Rose Fosdick,
Director of the Reindeer Herders Association, for her insights about herding and her
review of my thesis ideas and drafts. Tom Gray, Larry Davis, Clark Davis, Leonard
Olanna, and many other herders and their families have welcomed this project and
provided me with the opportunity to learn some of the intricacies of herding reindeer. I
hope that herding continues to enrich the communities of the Seward Peninsula.

1
Chapter 1 – INTRODUCTION
Herding of domesticated reindeer (Rangifer tarandus tarandus) has been an
integral part of the cultural, social, and economic identity of many Inupiat, Yupik, and St.
Lawrence Island Yupik communities in the Seward Peninsula region since the
introduction of reindeer to western Alaska in 1891 (Ellanna and Sherrod 2004, Oleson
2005, Schneider 2002a, Schneider et al. 2005, Simon 1998, Stern et al. 1980). The recent
status of reindeer herding on the Seward Peninsula has been tenuous. Herding families
experienced unprecedented and devastating loss of their herds when the winter range of
the Western Arctic Caribou Herd (WAH) expanded into the region beginning in the late
1980s (Carlson 2005, Dau 2000, Finstad et al. 2002, Finstad et al. in press).
Tens of thousands of caribou (Rangifer tarandus granti) wintered on the eastern
Seward Peninsula from 1989 to 2005, although caribou use of the central Seward
Peninsula varied during this time (Dau 2005a, Finstad et al. in press). Reindeer and
caribou readily mix resulting in reindeer that are less manageable for herding. It is
difficult to separate reindeer from groups of caribou, and nearly impossible to recover
reindeer that have emigrated with caribou returning to their North Slope calving grounds
in spring (Finstad et al. 2002, Oleson 2005). Between 1992 and 2005, over 17,000
reindeer from 13 of the region’s herds were lost due to emigration with the WAH (Figure
1) (Finstad et al. 2002, Finstad et al. in press). Greater losses of reindeer are expected if
the winter range of the WAH spreads westward on the Seward Peninsula.

2
Vacant
#
NOME
##TELLER
#
IMURUK BASINGray
Hadley
Sheldon
Karmun
VacantHenry
Goodhope
Davis
Kakaruk
Noyakuk
Weyiouanna
Olanna
Elim
Ongtowasruk
Sagoonick
Menadelook
#
GRANTLEYHARBOR
20 0 20 40 60 Kilometers
N
EW
S
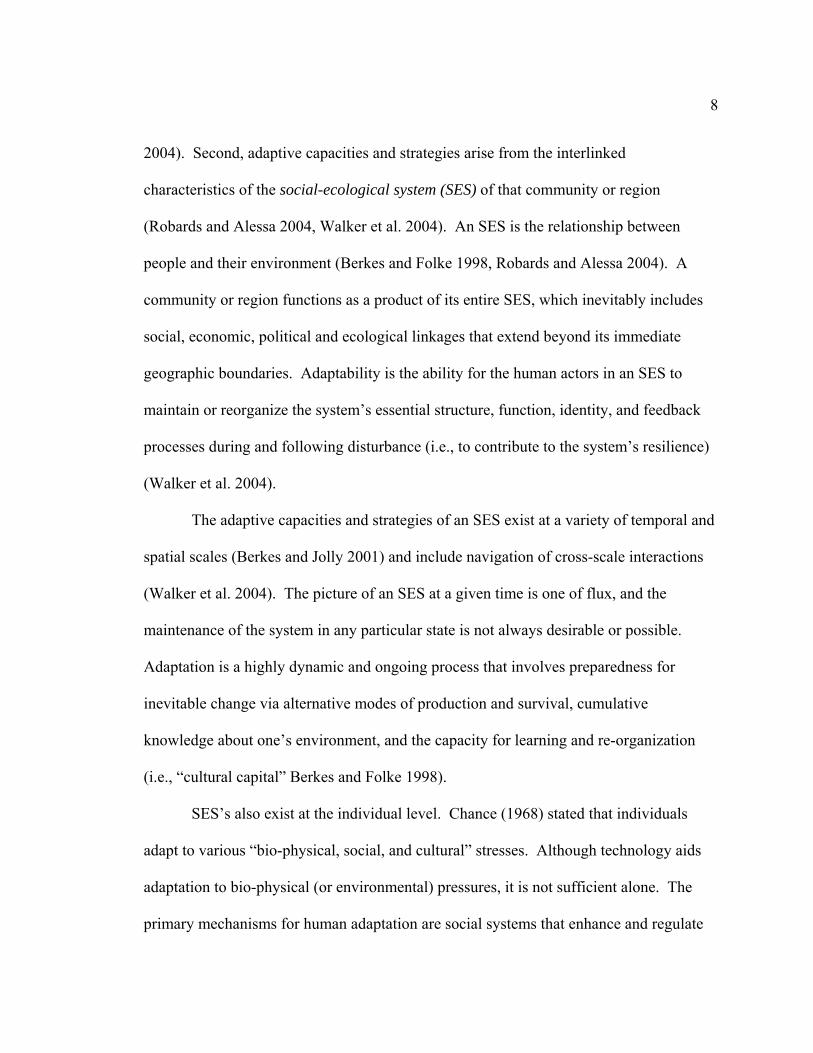
Figure 1. Reindeer ranges and caribou use of the Seward Peninsula, 1989-2000. The western front of observed caribou is shown for different years (colored lines) (Finstad et al. 2002, Oleson 2005). Reindeer ranges are shaded to show percent of herd loss to caribou by 2005.
Seward Peninsula Fairbanks
Anchorage
100% herd loss 50-75% herd loss <20% herd loss
1989 1991 1993 1995 1997 1999 2000
Western extent of caribou
Reindeer ranges

3
1.1 Climate change, caribou and reindeer herding
Reindeer herders on the Seward Peninsula have stressed their dependence upon
certain weather and other environmental conditions to carry out herding activities, and
they have noted that climate change may alter herding capabilities (Schneider 2002a,
Schneider et al. 2005). Weather, snow, and ice conditions in the fall and winter have
become particularly critical with caribou wintering in the region. Moreover, winter is the
primary herding and slaughtering season because of the ease in accessing and moving the
herd by snowmachine (Figure 2), although reindeer are also corralled in June to harvest
velvet antler and mark calves. “Snowmachine" is the more commonly used term for
snowmobile in Alaska and is utilized throughout this thesis. Changes in winter
conditions may reduce opportunities to conduct critical herding activities and may,
thereby, compound losses to caribou or predators (Schneider et al. 2005).
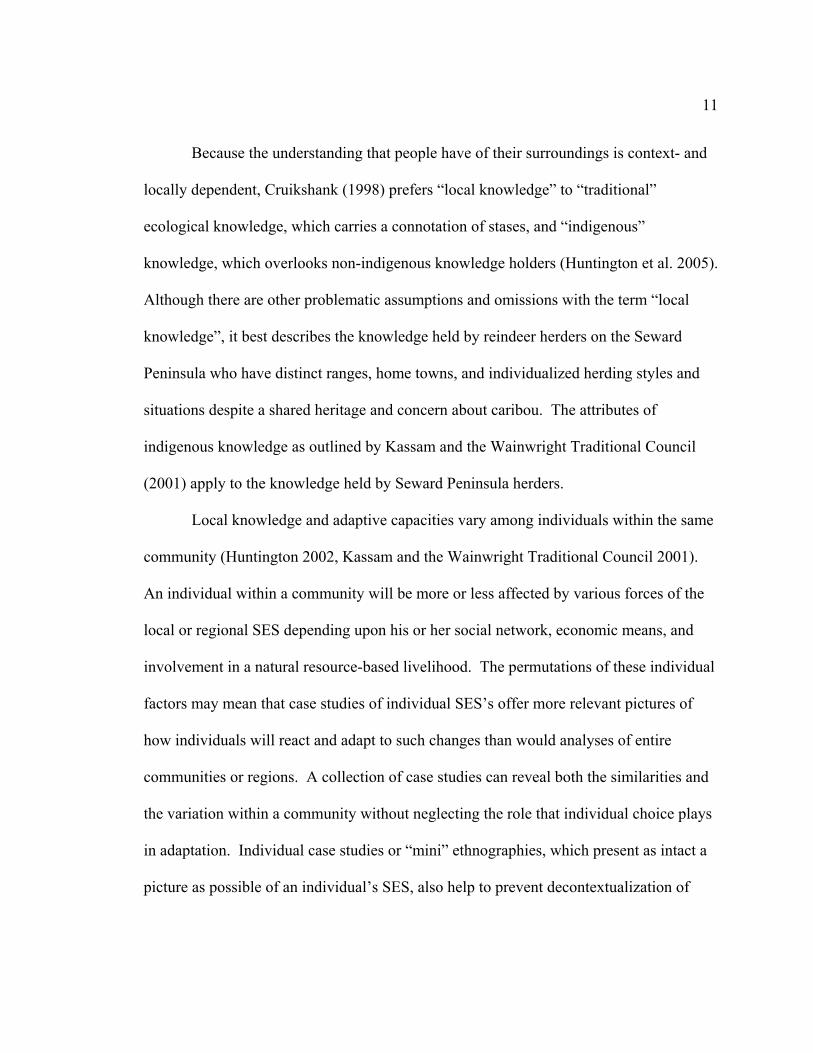
Figure 2. James Noyakuk moves his herd by snowmachine.

4
Oral history interviews with herders indicate observations of delayed and warmer
winters in the past 20 years (Davis 2001, Gray 2002, Hadley 2001, Henry 2002, Stalker
2001), and they highlight how these changes have impeded herd management (Schneider
et al. 2005). Delayed freezing of waterways and low snow cover in the early winter have
limited access to the reindeer when caribou were present (Davis 2001, Gray 2002).
Inclement weather and/or snow conditions (e.g. storms, lack of snow) have prevented
herders from moving, slaughtering, or corralling reindeer (Menadelook 2003,
Weyiouanna 2002). Early melt of snow and ice in spring have left herds unprotected
from predators during the calving season (Sagoonick 2003). Additionally, warm or
severe weather in winter may induce icing of the snow cover, which can prevent reindeer
from accessing winter forage (Davis 2001).
Most of the remaining reindeer graze on areas located some distance from their
owner’s villages. Herders are dependent upon favorable weather and trail conditions to
access their herds. This situation is magnified during fall freeze-up and spring break-up.
Travel conditions are typically unfavorable during these transitional seasons, and these
seasons often coincide with two critical herding activities - prevention of reindeer-
caribou mixing in fall and protection of calves from predators in spring. Climate change
resulting in consistently shorter winters and/or an increase in extreme weather events is
expected to hinder herd protection and management.

5
1.2 Climate change and Arctic communities
There has been a growing awareness about the impacts that climate and other
environmental changes pose for indigenous Arctic communities (ACIA 2004, Helander
and Mustonen 2004, Krupnik and Jolly 2002). At the same time, indigenous knowledge
and participation have been substantial and integral parts of climate change research in
the Arctic, particularly in North America (Berkes 2002, Huntington et al. 2005, Krupnik
and Jolly 2002, Riedlinger and Berkes 2001) and Fennoscandia (Helander and Mustonen
2004). Several studies have focused on weather and environmental monitoring by local
communities in ways that are meaningful to community members (Kofinas et al. 2002,
Krupnik 2002).
Among other observations, Arctic residents and scientists have reported warming
trends and shorter snow and ice seasons in Alaska, northwestern Canada, and northern
Eurasia for at least the last 30 years (ACIA 2004, Bamzai 2003, Hinzman et al. 2005,
Huntington et al. 2005, Serreze et al. 2000). Warming has been magnified in the polar
regions due to the positive feedback between warmer temperatures and the increased loss
of solar-reflecting sea ice and snow (ACIA 2004). However, concerns about climate
change have extended beyond temperature, especially as temperature has not changed or
has cooled in some Arctic areas (ACIA 2004). “Climate change has real and serious
implications for Inuit [and other Arctic indigenous peoples’] life because much of the
traditional knowledge is based on the times of seasons and not traditionally on
temperatures. In other words, one does ‘this’ at ‘this time’ of the year rather then when
the temperature gets ‘like this’” (Kusugak 2002). Throughout the Arctic, changes to

6
expected seasonal conditions have been linked to reduced opportunities to harvest and
manage subsistence resources (Helander and Mustonen 2004, Nuttall et al. 2005).
Climate change has challenged natural resource-based livelihoods and the adaptability of
Arctic residents by altering working conditions and the natural cues that have guided
environmental understanding and activity planning (Jolly et al. 2002, Schneider et al.
2005).
Indigenous peoples in the Arctic have been intimate with change for thousands of
years, but the current rate of climate change (as well as of other social, cultural, and
ecological change) may be accelerated beyond the adaptive capacities of some
communities (Berkes 2002, Nuttall et al. 2005). Not all climate change has been viewed
as negative: for example, delayed freeze-up prolonged the season to hunt caribou by boat
in Kotzebue, Alaska (Whiting 2002). However, more frequently mentioned have been
the detrimental impacts that climate change has had, and may have, on local travel,
subsistence activities, and community infrastructure. Most comments have described
changes to daily or seasonal patterns of weather, which, although distinct from long-term
climate change, nevertheless inform the climate change discussion about the current and
long-term impacts of unexpected weather events (Huntington et al. 2005).
1.3 Adaptability in social-ecological systems
Systems of Rangifer subsistence and production are inherently complex and
diverse throughout the Arctic. Human communities that depend on reindeer or caribou
(or other natural resources) have been variously affected by climate and other

7
environmental, economic, social, and political change (Caulfied 2000, Nuttall et al.
2005). Myers et al. 2005 identified several developments in the last 40 years that have
shaped modern subsistence practices in the Canadian Arctic. These factors have affected
Alaska Natives as well and include centralized settlement versus seasonal mobility,
adoption of mechanized transport, increased individualized hunting, commercialization or
de-commercialization of resources, involvement in wage work and the market economy,
harvesting as part of a mixed economy, accessibility of market foods, concerns about
contaminants in wildlife, the continued desirability of subsistence foods, and the need for
sustainable income sources (see also Caulfield 2000, Kruse 1991, Pelto 1987). Other
drivers of change have been the growth of the extractive and tourism industries (Caulfield
2000, Thomas 1999), political and economic upheaval in Russia (Gray 2000, Gray 2004,
Koskey 2003, Krupnik 2000, Pika 1999), restrictions regarding land access (Bjorkland
2004) and predator protection in Fennoscandia (Beach 2004), conflicting urban and rural
views about land and natural resources in the Arctic (Beach 2000, Caulfield 2000), and
changes in government spending for community development (Kruse et al. 2004). These
factors have been interconnected in regards to their effects on Arctic communities and the
ways in which these communities have coped with and influenced these processes
themselves.
The study of the impacts of climate change requires consideration of two
associated concepts. First, the direction and degree that a community or region may be
altered by climate or other change relates to the resilience of the system (Holling and
Gunderson 2002) and the ability of the system to adapt to that change (Walker et al.
8
2004). Second, adaptive capacities and strategies arise from the interlinked
characteristics of the social-ecological system (SES) of that community or region
(Robards and Alessa 2004, Walker et al. 2004). An SES is the relationship between
people and their environment (Berkes and Folke 1998, Robards and Alessa 2004). A
community or region functions as a product of its entire SES, which inevitably includes
social, economic, political and ecological linkages that extend beyond its immediate
geographic boundaries. Adaptability is the ability for the human actors in an SES to
maintain or reorganize the system’s essential structure, function, identity, and feedback
processes during and following disturbance (i.e., to contribute to the system’s resilience)
(Walker et al. 2004).
The adaptive capacities and strategies of an SES exist at a variety of temporal and
spatial scales (Berkes and Jolly 2001) and include navigation of cross-scale interactions
(Walker et al. 2004). The picture of an SES at a given time is one of flux, and the
maintenance of the system in any particular state is not always desirable or possible.
Adaptation is a highly dynamic and ongoing process that involves preparedness for
inevitable change via alternative modes of production and survival, cumulative
knowledge about one’s environment, and the capacity for learning and re-organization
(i.e., “cultural capital” Berkes and Folke 1998).
SES’s also exist at the individual level. Chance (1968) stated that individuals
adapt to various “bio-physical, social, and cultural” stresses. Although technology aids
adaptation to bio-physical (or environmental) pressures, it is not sufficient alone. The
primary mechanisms for human adaptation are social systems that enhance and regulate

9
social cooperation (and set the stage for the collective innovation needed to develop or
adopt adaptive technology) and cultural systems that explain environmental phenomena
and social obligation (Cruikshank 1998, Johnston 2000). However, social and cultural
systems may also be a source of stress to individuals during times of external or internal
change (Chance 1968).
An individual is subject to situational factors which may or may not be under his
or her control. These can include environmental pressures such as climate change or loss
of livestock and social realities such as family structure or employment. These
situational factors (which may vary greatly between individuals in the same community
and may change rapidly) combine with social and cultural factors (which are expected to
be similar among individuals in a group and to change over longer time periods) and
personal factors (e.g., one’s personality which is entirely individual and may be relatively
consistent throughout one’s lifetime) to determine an individual’s adaptability and his or
her contribution to community adaptability. Individual choice can also have a significant
impact on one’s environmental, social, and cultural realm. Despite constraints imposed
by the Arctic environment and the social mores of a community such as Inupiat villages
in northern and western Alaska, cumulative individual actions can shape societal and,
eventually, cultural change (Kruse 1991), as well as alter human relationships with the
environment and the environment itself.

10
1.4 Climate change, SES’s and the case for interdisciplinary case studies
Collaboration with indigenous and other local residents has been valuable in
understanding climate change because of their intimate experience with the land
throughout time, their dependence on certain weather and environmental conditions for
subsistence and other natural-resource based activities and livelihoods, and the lack of
scientific data for region-wide, climate history (Krupnik and Jolly 2002, Riedlinger and
Berkes 2001). However, climate change has been viewed as one challenge among many
currently affecting Arctic communities (Nuttall et al. 2005). The inherent linkages
between the social and ecological components of communities make an interdisciplinary,
human ecology approach relevant for the study of adaptation to climate change.
Studies that combine scientific research methods and Indigenous (IK), Local
(LK), or Traditional Ecological Knowledge (TEK) are not easy for methodological,
analytical, and political reasons. “IK”, “LK”, and “TEK” label an enormous and very
diverse body of ecological, social, cultural, and spiritual knowledge and not a particular
research method or result. A collaborative study documenting indigenous knowledge and
subsistence practices in Wainwright, Alaska emphasized that indigenous knowledge
cannot be defined but may be better understood by its attributes: it is “context [and thus
locally] specific”, bound to spiritual and moral worldviews, “cumulative” and therefore
adaptive over time, diverse in scope and content among knowledge holders, generated
from relationships with the environment, and transmitted by oral tradition (Kassam and
the Wainwright Traditional Council 2001).
11
Because the understanding that people have of their surroundings is context- and
locally dependent, Cruikshank (1998) prefers “local knowledge” to “traditional”
ecological knowledge, which carries a connotation of stases, and “indigenous”
knowledge, which overlooks non-indigenous knowledge holders (Huntington et al. 2005).
Although there are other problematic assumptions and omissions with the term “local
knowledge”, it best describes the knowledge held by reindeer herders on the Seward
Peninsula who have distinct ranges, home towns, and individualized herding styles and
situations despite a shared heritage and concern about caribou. The attributes of
indigenous knowledge as outlined by Kassam and the Wainwright Traditional Council
(2001) apply to the knowledge held by Seward Peninsula herders.
Local knowledge and adaptive capacities vary among individuals within the same
community (Huntington 2002, Kassam and the Wainwright Traditional Council 2001).
An individual within a community will be more or less affected by various forces of the
local or regional SES depending upon his or her social network, economic means, and
involvement in a natural resource-based livelihood. The permutations of these individual
factors may mean that case studies of individual SES’s offer more relevant pictures of
how individuals will react and adapt to such changes than would analyses of entire
communities or regions. A collection of case studies can reveal both the similarities and
the variation within a community without neglecting the role that individual choice plays
in adaptation. Individual case studies or “mini” ethnographies, which present as intact a
picture as possible of an individual’s SES, also help to prevent decontextualization of

12
local knowledge as may occur if the local knowledge is presented categorically with
scientific data (Cruikshank 1998, Huntington et al. 2005).
The SES of reindeer herding on the Seward Peninsula offers a unique opportunity
to understand the impacts of climate change on an indigenous and land-based livelihood
in the Arctic. The presence of wintering caribou has limited recent prospects for herding,
but there have been additional factors affecting herding decisions. Some herders have
increased the time spent monitoring and moving reindeer from the path of migrating
caribou at the same time that they have suffered large economic losses, and gasoline and
equipment costs have risen. This combination of factors has increased the dependency of
herders on consistently favorable travel conditions (Schneider et al. 2005).
Each herder on the Seward Peninsula has been able to or has been forced to make
a variety of technological, socioeconomic, and management adaptations in response to
caribou use of the region, and these adaptations exist within the interconnected web of
factors that is modern herding. Each herder’s decisions have been influenced by weather,
herd size, caribou use of their range, season, terrain, the distance from village to reindeer,
economic returns for reindeer products, family experience, oral tradition, and available
technology, among other factors (Schneider et al. 2005). The interplay among these
factors has been different for each herder and can be unpredictable over time as this
interplay exhibits a “pinball” effect. “When one of the factors changes, it impacts the
others and the herder is forced to reconsider his options” (Schneider et al. 2005). The
impacts of climate change may be better assessed within the context of the individual

13
SES. Individual case studies can then be compared to understand impacts at the
community or regional level where greater variability is expected.
1.5 Study approach
An interdisciplinary case study was conducted with one herder to understand the
adaptation of winter herding to climate and other environmental change. The case study
approach was chosen because herding decisions depend not only on weather, but
incorporate the full socioeconomic situation specific to each herder. There has been
considerable variation among herders for several factors, including extent of loss to
caribou. Herd ranges are large, remote, and ecologically diverse. There are only one to
three herders in each village and each has experienced a distinct combination of social,
economic, and environmental situations affecting his or her ability and decisions to
continue herding. Furthermore, each herder has perceived his or her situation in a
personal way such that responses to caribou, weather, and other environmental change
cannot be easily generalized among herders. The case study approach is perhaps then the
best way to understand how environmental factors have interacted with various social and
economic realities to shape herding decisions.
James Noyakuk of Teller, Alaska was asked to be the primary consultant for this
project because he was still actively herding at the start of this study in 2003, despite
severe losses to migrating caribou. Moreover caribou remained a major consideration in
the management of his herd. He once had approximately 1500 reindeer. However, after
large-scale emigration with caribou in the late 1990s and in fall 2000, his herd numbered

14
between 150 and 300 reindeer from 2003 to 2005 (Noyakuk pers. comm. March 2006).
Because caribou continued to winter on the northeastern half of his range, and several
had been observed year-round just east of his range, Noyakuk’s goals at the time of this
study were to prevent further loss and increase herd size.
I worked with Noyakuk from February 2004 to June 2005. Interviews and field
work were concentrated in the winter when most herding activities occurred. It was also
anticipated that caribou might winter on the northeastern half of Noyakuk’s range during
the study period because they had used the area intermittently since 1996. I also spent
time at summer handlings and maintained an ongoing phone dialog with Noyakuk
throughout the study. He reviewed drafts and presentations of the thesis.
This thesis addresses a human ecology question about adaptation to climate and
other environmental change. However, it was first necessary to understand general
weather implications for herd management as a baseline for discussing observations of
and adaptations to climate change. Thus, a few research objectives were developed:
1) Define the specific weather and environmental conditions that have facilitated, or
hindered, travel and herd management in winter (i.e., what has been considered
“good” or “poor” conditions for herding);
2) Investigate various methods to document winter conditions, including the
occurrence of unexpected conditions and the consequent effects to herding (e.g.,
have recent conditions exacerbated reindeer losses to caribou, and what do data
from weather stations contribute to the study of the impacts of climate change?).

15
3) Describe adaptations of the herding social-ecological system to weather and other
environmental change, including range expansion by caribou.
The case study involved mostly exploratory and descriptive, but also analytical,
methods to address the research objectives. Interviews documented Noyakuk’s
definitions of “good”, “minimal”, and “poor” weather, snow, and ice conditions in
regards to their effect on travel and herd management (Objective 1). The interviews also
focused on in-depth descriptions of past and current herding practices within the context
of Noyakuk’s SES. Weather station and snow depth data were analyzed alongside
Noyakuk’s observations and daily ratings of weather and snow conditions for the winters
of 2003-04 and 2004-05. These comparisons showed how various conditions influenced
herding activities, and how different weather and environmental information related or
did not relate to Noyakuk’s perceptions and decisions (Objective 2). It was hypothesized
that (1) inclement weather would be a limiting factor for herding practices, and (2) the
weather station data (in addition to Noyakuk’s observations) would reflect this (i.e., after
freeze-up and before break-up, there would be lower air temperatures, lower windchill
temperatures, and/or higher wind speeds on days when Noyakuk rated conditions as
“poor” versus those days given a “good” rating).
The extent that “good” and “poor” conditions affected herding activities in the
winter of 2003-04 and 2004-05 were then examined as components of Noyakuk’s herding
SES as a whole (Objective 3). His observations of change were related to the occurrence
of unusual weather, snow, and ice conditions as they occurred during the study years and

16
to past herding experiences. GIS maps were produced showing travel routes, past and
current range use, and the satellite collar locations of reindeer and caribou to illustrate the
significance of Noyakuk’s geographic situation.
1.6 Thesis structure
The thesis begins with this chapter: a general introduction to the constraints that
caribou and climate warming pose for herding on the Seward Peninsula. Chapter 2
(Background Information) provides a brief history of reindeer herding in Alaska and a
description of the interrelated ecological, social, and economic circumstances affecting
modern herding practices. Chapter 2 also describes Noyakuk’s range and his history as a
herder. Chapter 3 (Methods) explains the interview and weather monitoring methods
used to address the research objectives and hypotheses.
Chapter 4 (Results) provides interview information from Noyakuk regarding his
weather considerations for herd management. It also provides an analysis of his
observations and weather and snow data collected on his range during the winters of
2003-04 and 2004-05. Chapter 5 (Discussion) places weather within the context of the
social, economic, and ecological factors that have also affected Noyakuk. Research
findings were also considered within the current academic discourse about adaptation to
climate change. The concluding chapter (Chapter 6) ties the major findings to
suggestions for future research. Appendix A contains definitions for terms and acronyms
used in the thesis text. This may aid in understanding terms from different disciplines.

17
I write primarily about one herder’s perspective on weather, climate, caribou, and
reindeer, and I relate this to measured weather and snow data. However, I also
emphasize the larger picture that herding decisions have involved more than just concerns
about weather and accessibility. A changing climate will impact herding, but it will do so
in conjunction with the changing lifestyles and economic objectives of the herder and his
or her family.

18
Chapter 2 - BACKGROUND INFORMATION
2.1 Reindeer herding on the Seward Peninsula
2.1.1 History of reindeer herding in Alaska, 1891-1988
The history of reindeer herding in Alaska has been documented extensively (see
Finstad et al. in press, Oleson 2005, Schneider 2002a, Schneider et al. 2005, Simon 1998,
Stern et al. 1980 for more detailed considerations). Since the introduction of reindeer to
Alaska in 1891, the human-reindeer relationship has transitioned from subsistence to
commercial livestock production, field- to village-based, Native and non-Native owned to
entirely Native-owned, locally-contained to mechanized and globally-linked (Finstad et
al. in press, Oleson 2005). This progression reflects the changing role of reindeer in the
region as well as the continually changing ecological, social, political, economic, and
technological opportunities and constraints that have affected herding in Alaska (Carlson
2005, Ellanna and Sherrod 2004, Finstad et al. 2002, Finstad et al. in press, Koskey 2003,
Oleson 2005, Schneider 2002a, Schneider et al. 2005, Simon 1998, Stern et al. 1980).
Reindeer were introduced from Chukotka, Russia to western Alaska in 1891 as
part of a government plan to bring a source of meat and income to Alaska Natives in the
region. Herd management between 1891 and 1915 involved intensive (constant, on the
land) herd supervision. As the herds grew, several commercial enterprises and collective
herds developed and less intensive forms of herding arose. The largest private herd
owners between 1915 and the mid-1930s were non-Native, but joint stock herds within
Native communities were also established. By the mid-1930s, when reindeer numbers

19
were reported at a historic high of 600,000 (Stern et al. 1980), range and ownership
disputes were widespread, reindeer meat markets in the Lower 48 states had collapsed,
and Native herders actively sought to reclaim the reindeer industry from non-Native
owners. The Reindeer Act of 1937 abolished non-Native ownership. However, reindeer
populations in western Alaska declined sharply in the 1940s, and most reindeer
companies were dissolved as a result (Stern et al. 1980). This decline has been attributed
to a number of causes, including caribou, predation, mismanagement, improper census,
and extreme weather events (Stern et al. 1980).
Private herds were re-established on the Seward Peninsula via a Bureau of Indian
Affairs (BIA) loan program during the 1950s and 1960s (Stern et al. 1980). During this
time “loose” or “extensive” herd management (management based out of villages with
periodic herd access, rather than constant supervision) became the norm. Herders, like
most area residents, had settled year-round into fewer villages, and they began to use
snow machines to make day trips to their herds (Finstad et al. 2002, Schneider 2005,
Simon 1998, Stern et al. 1980). The reindeer industry grew considerably in the 1970s
and 1980s in response to profitable demand overseas for velvet antler. The reindeer
industry was one of the major cash economies in the region before caribou began
wintering on the Seward Peninsula in the late 1980s (Carlson 2005).
2.1.2 Modern reindeer herding on the Seward Peninsula
Reindeer populations on the Seward Peninsula are again in decline, which may
increase the vulnerability of herding to climate change (Finstad et al. in press, Koskey

20
2003, Schneider et al. 2005). The system remains village-based and Native-owned, but
the industry has become smaller, more intensive and more “high tech” in response to the
return of wild caribou to the region after a 125-year absence (Finstad et al. in press,
Oleson 2005, Schneider et al. 2005).
The Western Arctic Caribou Herd (WAH) grew from an estimated 75,000 animals
in 1976 to 463,000 in 1996 (Dau 2000). The winter range of the WAH extended
westward onto the Seward Peninsula during the 1990s (Figure 1), causing enormous, if
not entire, herd losses for most herders in the region. The only way to prevent reindeer
loss was to move reindeer from the path of the caribou, but this task was severely
hampered by several factors (Finstad et al. in press, Oleson 2005). First, the large
numbers and widespread distribution of migrating caribou were overwhelming in some
years (especially fall 1996 and 2000). Second, in some years of high caribou influx, lack
of snow and unfrozen rivers in the early winter limited the herders’ ability to move their
reindeer to safer areas (e.g., winter 2001-2002, Gray 2002). Finally, helicopters have
been the most effective, and often the only, means to locate, move, and separate reindeer
from caribou. However, chartering a helicopter became considerably less affordable as
reindeer numbers declined, and velvet antler markets collapsed due to a recession in
eastern Asia in the mid-1990s (Carlson 2005, Finstad et al. in press, Oleson 2005).
There are currently 15 reindeer herds and ranges on the Seward Peninsula and
overlapping Norton Sound region. Most are privately-owned, but one is a combined herd
of privately- and village-owned reindeer (Katcheak-Stebbins-St. Michael herds). Of the
13 herders with ranges impacted by caribou, seven lost their entire herds and six lost up

21
to 90% of their reindeer for an overall loss of more than 17,000 reindeer by 2005 (Finstad
et al. in press). Twelve herds have been eliminated or are too small to be economically
viable. This has meant an estimated annual economic loss of $1.4 million (year 2000
dollars) for the region (Carlson 2005). However, herders on the western Seward
Peninsula have experienced relatively less caribou impact thus far, and there were still
three herds with more than 1000 reindeer in 2005.
Herders are hopeful for a day when caribou no longer use the Seward Peninsula,
as occurred throughout most of the 20th century. The continuation of caribou presence in
the region is not well understood. Caribou use of the Seward Peninsula in the last two
decades has been mostly restricted to winter, the season of greatest annual variability for
WAH distribution (Dau 2005a). Use of the central Seward Peninsula has varied between
years, with the most notable influxes of tens of thousands to hundreds of thousands of
caribou occurring in fall 1996 and 2000 (Finstad et al. in press). Local residents have
reported seeing several thousand caribou in the summer between 2002 and 2005, and two
radio-collared bulls were located in separate groups of about 150 caribou, each, near
Kougarok Mountain in June 2005 (Dau 2005a). Herders frequently quote their elders
who said that the caribou would one day return as they did in the late 1980s (Schneider et
al. 2005), but the full impact of their return on the modern reindeer industry was not
predictable. Caribou presence on reindeer ranges has also meant competition for forage,
range depletion, and increased predators, disease, and parasites (Cebrian 2005, Dau and
Bente 1999, Dau 2000, Machida et al. 1993, Robinson and Leykom 1991).

22
Investigators with the Reindeer Research Program (RRP) at the University of
Alaska Fairbanks and with a current NSF-HARC project, “Reindeer Herding in
Transition: Feedbacks between Climate, Caribou, and Local Communities in Northwest
Alaska” (NSF-OPP 9979473) have assessed factors contributing to high reindeer loss.
They are working closely with Seward Peninsula herders and the administrative officers
of the Reindeer Herders Association (RHA) based in Nome to develop mitigation
strategies. State and federal land and agricultural agencies are also involved in the
mitigation effort.
RRP, RHA, and the Alaska Department of Fish and Game (ADF&G) conduct
aerial surveys and use radio and satellite collars to track reindeer and caribou (Dau and
Bente 1999, Dau 2000, Dau 2003, Dau 2005a, Machida et al. 1993). Collars with
satellite platform terminal transmitters (PTTs: Telonics, Inc., Mesa, Arizona) have been
deployed on reindeer in several herds since 1999. Collared animals are tracked by
satellite (Service Argos, Largo, Maryland) by the USDA-Natural Resource Conservation
Service (USDA-NRCS), the RRP, and RHA (Oleson 2005). Recently there have been
one to eight collars per herd or one collar per 100 to 1000 non-collared reindeer,
depending on the herd. The number of collared reindeer has varied by season and year
depending upon collar availability.
The RRP maps collar locations using Generic Mapping Tools 2.0 (public domain
UNIX software developed and maintained by Paul Wessel and Walter H. F. Smith,
Honolulu, Hawaii, USA, available at http://gmt.soest.hawaii.edu/). The automated
product can be accessed by herders via a protected, interactive website (Oleson 2005).

23
Herders use computers at home or at the local school to track movements of their
individual animals. They can also access WAH satellite collar locations via a protected
ADF&G website in order to monitor caribou proximity to their herd. The reindeer and
caribou collars may add some peace of mind and efficiency to herd management, but they
may also give a false sense of security if the herders are not concurrently traveling out to
monitor their reindeer (Menadelook 2003).
Herders have also designated refugia where reindeer can be kept when caribou
move onto their ranges (Oleson 2005, Finstad et al. in press). Noyakuk and Leonard
Olanna, whose range is adjacent to Noyakuk’s, established specific refugia on each of
their ranges that can be used by either herder (Figure 3). Tom Gray has designated
refugia on his own range and has maintained his reindeer there for several years as
caribou have frequently used the rest of his range in winter (Finstad et al. 2002, Oleson
2005). Additionally, RHA has procured “disaster” aid for its member herders,
specifically helicopter time to monitor both reindeer and caribou movements and gas
money to move the herd by snow machine when caribou are present. However, some
herders have expressed frustration over inadequate or unequal distribution of these funds
while other herders are reluctant to request assistance until very dire emergencies arise
(G. Finstad, pers. comm., R. Fosdick pers. comm., C. Davis pers. comm., J. Noyakuk
pers. comm.).

24
##
#
#
$$
$
$
$
%
%
%
%
Teller
New Igloo
Brevig Mission KOUGAROK-2
TELLERAIRPORT
KOUGAROK-3
Mary's Igloo
NORTH OF CORRAL
Imuruk Basin
Agiap
uk R
iver
Kuzitrin River
Kakaruk Range
Noyakuk RangeOlanna Range
Menadelook Range
#
MAYUGUK
#
AGIAPUK-WILLOWS
#
CORRAL
#
KOUGAROK-1
#
GrantleyHarbor
MAP LEGEND
5 0 5 10 15 20 25 30 Kilometers
N
EW
S
Reindeer range boundariesNoyakuk-Olanna refugiaNoyakuk's comfort zoneSummer rangePre-breakup relocation site
Late summer migration
Winter rangeJanuary 2003 driveFreeze-up range 2004Fall migration 2004
Freeze-up range 2002 & 2003Fall migration 2002 & 2003Late summer / early fall range
Ice bridge, November 2004Alternate Mayuguk-Corral TrailTeller-Corral Trail
# Villages$ Permanent weather stations% HOBO weather stations
Figure 3. Weather station locations and Noyakuk’s seasonal range use, 2000-2005.
25
Keeping reindeer from the path of migrating caribou requires vigilance, both
through use of the satellite collars and increased visual monitoring of the herd (Oleson
2005). Most herders who now have very small herds (fewer than 300 reindeer) can no
longer afford to monitor their animals as closely as they would like, and they have been
forced to supplement or replace herding with other income sources. A variety of
management styles has emerged, but some common themes persist. Herders are based
out of the village to be near their families and other jobs. Whereas living with the herd
had been the norm until the 1960s, the snow machine has allowed Seward Peninsula
herding to occur as a continual series of day trips. It is difficult or unfeasible for most
herders to spend multiple days in the field without returning to the village each night to
be with their families. Herding day trips may be restricted for a variety of reasons,
including obligations to family or other employment, gas prices and availability, the
mechanical reliability of one’s snowmachine, the skills of one’s crew, the distance to be
traveled, the tasks at hand, and the weather.
The decision for a herder to travel to and/or move his or her reindeer is made from
a complex mix of variables, but herding is impossible in poor weather conditions. An
understanding of one herder’s requirements to maintain his herd sheds considerable light
on the interplay of the factors affecting modern herding possibilities.

26
2.2 Case study: James Noyakuk of Teller, Alaska
2.2.1 Study area: Noyakuk’s range
Noyakuk resides in Teller, Alaska. His range is approximately 30 kilometers east
of Teller on the central Seward Peninsula (Figure 1). The range is approximately 3083
km2. It is bordered on the west by the Agiapuk River (approximately 165.75° west); on
the east by the Kougarok Road and its associated trails (approximately 164.50° west); on
the north by Budd Creek, Kougarok Mountain, and Washington Creek (approximately
65.75° north); and on the south by the Imuruk Basin (approximately 65.20° north).
Noyakuk boats to his range in summer via Grantley Harbor, Tuksuk Channel, and the
Imuruk Basin. In winter, he travels by snowmachine across the ice on Grantley Harbor
and then takes one of two overland trails over the “Mayuguk” hills (elevation 210m) to
the Agiapuk River or Imuruk Basin, depending on trail conditions (Figure 3).
Noyakuk’s corral is located on the north shore of the Imuruk Basin. There is a
cabin at the corral where he and his crew can spend the night during handlings or multi-
day herding trips. Flat topography, numerous sloughs and ponds, and wet tussock tundra
characterize the land surrounding the corral. Noyakuk’s range is relatively treeless, but
the willows (Salix spp.) that dominate the riparian areas can grow large and dense. The
hills in the northern half of Noyakuk’s range rise to 875 m at Kougarok Mountain. The
hills are vegetated with tussock tundra species thinning to dry heath at higher elevations.
Grantley Harbor, Imuruk Basin, and the inland rivers are usually frozen between late
November and May. The snow season is slightly shorter, but snow depth can be highly
variable across the range.

27
Moose (Alces alces) and muskox (Ovibos moschatus) are the only other large
herbivores in the area, but are much fewer in number and do not typically compete for the
same forage as reindeer or caribou (Dau 2000, Ihl and Klein 2001). Wolves (Canis
lupus), and, to a lesser extent, wolverines (Gulo gulo) are the major wintertime predators,
with brown bears (Ursus arctos) being another major predator during calving season
(Chetkiewicz 1993, Dau 2000, Oleson 2005).
Since caribou began wintering on the central Seward Peninsula in 1996, Noyakuk
has kept his herd on the flat terrain and low hills near his corral (to 65.50° north). His
reindeer have also used the southeastern portion of Leonard Olanna’s range, including the
Mayuguk hills (Figure 3). Except for Tom Gray, all other herders having ranges to the
east of Noyakuk have lost 100% of their reindeer to migrating caribou (Figure 1).
2.2.2 Noyakuk’s family history and training in herding
The following information about Noyakuk’s family and personal history in
herding was provided during interviews that took place at the University of Alaska
Fairbanks, Reindeer Research Program (RRP) bunkhouse in Nome on June 15, 2005, at
Noyakuk’s house in Teller on June 23, 2005, and by phone on August 19, 2005.
Noyakuk’s heritage in reindeer herding began with his grandparents and parents who
lived in the herding communities of Brevig Mission, New Igloo, Shishmaref, and Teller
(Figure 3). His parents, Agnes and Frank Noyakuk, were both raised in New Igloo,
where his father and maternal grandmother were both employed with the local collective
herd. When the residents of New Igloo and nearby Mary’s Igloo moved to Teller in the

28
early 1950s following closure of the schools and post office (Koutsky 1981, Orth 1967,
Rennick 1987), reindeer herding remained a part of their heritage and identity. There
were three herding families in Teller in 2005 who continued to maintain their range
permits with or without reindeer (Kakaruk, Menadelook, and Noyakuk). Furthermore,
many Teller residents have worked seasonally to assist in the management of these herds.
Noyakuk began working for Nome-based herder Lawrence Davis in 1971, when
he was sixteen. Davis, who is Noyakuk’s uncle, recruited help in Teller each spring for
the summer roundup and handlings. For the roundup, assistant herders gathered and
walked Davis’ reindeer up to 40 kilometers to the corral, during 12-hour shifts for three
days. After several years of assisting the Davis family and observing the lucrative antler
sales for several years, Noyakuk began to take on more work responsibilities as practice
towards obtaining his own herd (e.g., castrating, butchering, cutting antler).
2.2.3 Establishment and history of the Noyakuk herd
Most of the following information about the establishment and history of
Noyakuk’s herd was provided by Noyakuk during an interview on June 15, 2005 at the
RRP bunkhouse in Nome. Additional interview sources are referenced as such. In
December 1985 Noyakuk and his uncle Arthur Tocktoo of Brevig Mission signed a joint
venture agreement to reestablish a herd on the existing Tocktoo range (approximately the
same boundaries as the current Noyakuk range). The agreement called for equal sharing
in expenses and profits, and established a plan for reindeer to be loaned via a Bureau of
Indian Affairs (BIA) loan program. The first loan of 290 reindeer involved a handling at

29
the Davis corral in January 1988 to segregate and mark the new Tocktoo-Noyakuk
reindeer out of the Davis herd. These reindeer were then driven 120 kilometers to the
new Tocktoo-Noyakuk range. A second loan of 290 reindeer was received and moved
from the Davis corral to the Tocktoo-Noyakuk range in April 1989.
In the early years, Noyakuk had to become familiar with the terrain of his range as
well as the details of operating and maintaining a snowmachine (Noyakuk, pers. comm.
February 5, 2005). Although he was familiar with the area from Mayuguk east to
Davidson’s Landing and from the Imuruk Basin to the hills just north of the corral (a self-
designated “comfort zone”, see Figure 3), the steeper terrain beyond this comfort zone
provided valuable winter range for the herd. Noyakuk borrowed a snowmachine to make
the first reindeer drive, but he used his dog team to herd the first year. The dog team was
a reliable mode of transportation to the herd, but the dogs often chased the reindeer
(Noyakuk, pers. comm. August 19, 2005). Eventually it became too costly and time
consuming to care for the dogs (e.g., feeding, cutting and gathering firewood to cook dog
food, training dogs) in addition to caring for the reindeer, so he sold the dogs to buy a
snowmachine. Noyakuk went through a few snowmachines as he learned how to use and
maintain them. Noyakuk hired assistants during the winter and for summer handlings
and purchased one to three new snowmachines every year until the antler market declined
in the mid-1990s (Noyakuk, pers. comm. August 19, 2005).
During these early years (First Herding Period, 1988-1993), Noyakuk spent
considerable time with the herd especially during the winter and spring (Table 1, Figure
4). Until 1996, Noyakuk camped near the mouth of the Kuzitrin River before, during and

30
after break-up to prevent the reindeer from returning to the Davis range. Despite these
efforts, over 200 loaned reindeer returned to the Davis range, most likely because
reindeer have a strong instinct to return to their traditional calving grounds (Skjenneberg
and Slagsvold 1979, Stern et al. 1980). Velvet antler was cut each summer, but
slaughtering, primarily for family consumption, was kept to a minimum when the herd
was small and mostly composed of loaned animals. In the early years Noyakuk did most
of the herding but split profits with his uncle who lived in Brevig Mission. This uneven
work arrangement prompted Noyakuk to request full ownership of the herd in 1991. The
transfer of the entire herd and the range permits to Noyakuk’s name proceeded in April
1993 following negotiations with the BIA, RHA, and Tocktoo.
The herd continued to grow during the “Second Herding Period” (1993-1995),
and Noyakuk harvested greater amounts of velvet antler and meat (Figure 5). Figure 6
shows typical range use areas between 1993 and 1995. Herd size peaked (approximately
1500 reindeer) between 1995 and 1998 (Third Herding Period). The large and growing
herd afforded Noyakuk a larger crew and greater economic opportunity both for herding
purposes (e.g., use of helicopter for roundup) and for Noyakuk’s extended family (e.g.,
cash payment for assistance at handlings, gifts, home improvement projects).

31
Table 1. History of Noyakuk's herd
Herding Period Years Herd Size Management style 1st - Early Years
1988-1992 290-500 Partnership with Arthur Tocktoo. Close herding style, after freeze-up through break-up. Camped with reindeer during break-up to prevent their return to Davis range but >200 reindeer were still lost. Only times away from reindeer were when waiting for snow machine parts. Started using helicopter to roundup reindeer in 1991 when antler were $50/lb, but did not use helicopter every year. Could afford a new snow machine every year and often corralled by snow machine for summer handlings.
2nd - Growing Years
1993-1995 500-800 Partnership ended; Noyakuk became sole herd owner. Close herding after freeze-up through break-up every year until 1996. Started having two summer handlings to keep marking calves and cut calf antlers (2nd handling smaller in late June or early July. See above for helicopter use.
3rd - Peak Years
1996-1999 800-1500 Looser herding style (less monitoring than in previous herding periods). Bought three new snow machines each year from antler sales. Butchered 75-125 reindeer in late February, early March. Sold meat to Anchorage grocery stores. Spent break-up every other year with reindeer. Two summer handlings and one winter handling for veterinary care and marking mavericks. For summer handlings, used airplane to spot reindeer and helicopter ($275/hr) to drive reindeer located far from the corral. Used snow machine for roundup of reindeer near corral. Began losing some reindeer.
4th - Largest losses to caribou
2000-2001 Reduced to 0, then 150-200 reindeer return
Monitored herd more regularly. Lost remaining herd in November 2000 after missed opportunities to move the reindeer away from caribou (due to poor weather during freeze-up and disbelief that reindeer and caribou movements would cross). 150-200 reindeer returned or were recovered by helicopter in June 2001.
5th - Current
2002-2005 150-300 Closer herding style like in the early years, except no camping during break-up. Used satellite collars and the internet to track reindeer locations and movement. Low economic returns due to small herd and depressed antler prices. Relied on older snow machine, boat and 4-wheeler for herding; charter helicopter no longer affordable. Butchered about 12 reindeer per winter for family use and sale to local stores.

32
Figure 4. Noyakuk’s seasonal range use, 1988-1992.
%
%
%
%
Fall and winter range 1990-1992
Route to drag boat over ice in spring (harborand channel already open). From here, thecrew traveled to the corral on open sloughsto watch the herd until the summer handlings.
Summer (and occasional calving) range, 1988-2005.
Fall and winter range, 1988-1990. This areahas more summer forage species than lichen.
Route used to drive reindeer to winter handlings, 1990-1995.
Migratory route used by reindeer in late summer/fall,1990-1995. Following winter handlings, the reindeerreturned or were driven north via the same route.
#
Corral
N
EW
S5 0 5 10 Kilometers Noyakuk's comfort zone
Alternate Mayuguk-corral trailTeller-corral trail
% HOBO weather stations (2004, 2005)Legend for unlabeled map features

33
0
100
200
300
400
500
600
700
800
900
1000
1988 1990 1992 1994 1996 1998 2000 2002 2004
Year
Num
ber
of r
eind
eer
Figure 5. Number of reindeer at Noyakuk’s summer handlings, 1988-2005. Data courtesy of the RRP. These numbers are based on individual ear tag identification recorded by the RRP at handlings, but are lower than Noyakuk’s estimates of herd size. The entire herd may not be located prior to the handling, and reindeer escape prior to and during the handling. Reindeer not held for their ear tag to be read are not recorded or counted by the RRP (e.g., if allowed to pass through the final chute because antlers were not cut). Also the RRP organizes records by herd owner although most herds include some reindeer from other owners. The RRP estimates that only 80-85% of the herd is handled at a time based on mark-recapture records. This number may be even lower for some years as Noyakuk estimated that he had 1500 reindeer during the peak years, 1995-1997.

34
%
%
%
%
Fall and early winter range
SummerRange
Route used for midwinter drive to winter range
Winter range, 1993-1995. Currently reserved as an emergency winter range due to abundant lichen.
Route used to drive reindeer to winter handlings.
Migratory route used by reindeerin fall and early winter, 1990-1995.
Route to drag boat over ice in spring (harbor and channel already open).
Noyakuk's comfort zoneAlternate Mayuguk-corral trailTeller-corral trail
% HOBO weather stations (2004, 2005)Legend for unlabeled map featuresN
EW
S2 0 2 4 6 8 10 12 Kilometers
#
Corral
Figure 6. Noyakuk’s seasonal range use, 1993-1995.
During the latter half of the second and the third herding periods, Noyakuk
slaughtered reindeer nearly every two weeks in winter. Up to 35 reindeer were
slaughtered at a time (approximately 125 total per winter), which often required driving
the reindeer closer to the corral. Noyakuk sold the meat as quarter or half carcasses to
grocers in Nome and Anchorage, but demand was consistently higher than supply
because weather conditions often precluded planned slaughter trips. The herd was also
corralled once or twice each winter for veterinary care, demographic data collection, and

35
slaughter. Noyakuk moved the herd among different areas each season to prevent
overgrazing and to establish calving sites closer to the corral, but his herding effort was
less intensive from 1996 to 1999. Although he did not move the herd over his entire
range during this time (Figure 7), the reindeer utilized parts of the range much farther
from Teller than in the early years (Figures 4 and 6), or more recently (2000 to 2005,
Figure 3).
$$
$
%
%
%
%
Reindeer range boundariesBoat drag route over spring iceTeller-corral trailAlternate Mayuguk-corral trailNoyakuk's comfort zoneBull migration during rutSummer rangePre-breakup relocation sitePre-breakup driveSpring rangePost-calving driveCalving areaMigration route pre-calvingPre-calving driveWinter rangeWinter migration routePost winter handlings driveDrive for winter handlingsEarly winter rangeFall rangeFall migration route
$ Kougarok stations (1999-2005)% HOBO stations (2004, 2005)
5 0 5 10 15 20 Kilometers
N
EW
S
Map Legend
#
Corral
Figure 7. Noyakuk’s seasonal range use, 1995-1999.

36
2.2.4 Caribou on the Noyakuk range
Between 1987 and 1995, groups of caribou from the WAH migrated each winter
onto several reindeer ranges east of Noyakuk’s range (Henry, Hadley, and Sheldon,
Figure 1) (Finstad et al. in press). In October of 1996, 90,000 to 100,000 caribou moved
onto the Seward Peninsula toward the eastern border of Noyakuk’s range (Bente 1997, as
referenced in Finstad et al. in press). Herders Gray, Karmun, and Menadelook lost 50-
75% of their herds, with open water and lack of snow preventing access to their reindeer
that had mixed with caribou (Finstad et al. in press). Caribou continued to winter on the
eastern and central Seward Peninsula in 1997, 1998, and 1999. By 1999 herders
Menadelook, Karmun, Weyiouanna and Sagoonick had lost 90-100% of their reindeer.
Herders who retained a few hundred reindeer could not afford to continue corralling and
managing their remaining animals (Finstad et al. in press).
Handling records show that Noyakuk began losing reindeer as early as fall 1997
(Figure 5). Both Noyakuk and Davis experienced their largest losses in the winter of
2000-2001 when 225,000 to 250,000 caribou occupied the central Seward Peninsula
(Finstad et al. in press; Oleson 2005; K. Persons, unpublished report as referenced in
Finstad et al. in press). Although most of the missing reindeer were never recovered, 130
reindeer returned to an area east of Noyakuk’s range in June 2001. This group included
nearly 70 reindeer from other herds and one (previously) radio-collared animal that RRP
staff located near the Pilgrim Hot Springs. Noyakuk used a charter helicopter service to
move this group to his corral. The following December (2001), one satellite-collared
reindeer was tracked moving swiftly northeast from the range, indicating that it, and

37
possibly others, were traveling with, or following, caribou. Noyakuk used RHA funds
for caribou mitigation to charter another helicopter to return these reindeer to his range.
Between 2001 and 2005, Noyakuk kept his herd within the southwestern corner of
his range and on the adjacent southeastern corner of Olanna’s range in the refugia (Figure
3) (Oleson 2005). Although he has traveled to and checked on the herd more frequently
than in the years pre-caribou, Noyakuk has to balance the desire to increase herd size
with the economic limitations of having a smaller herd and the possibility of continued
caribou presence in the region.

38
Chapter 3 – METHODS
3.1 Case study interviews
I conducted the following types of interviews with Noyakuk: 1) semi-directed
interviews including field interviews and participatory mapping; 2) a structured phone
survey about weather limitations that was also conducted with other herders; and 3)
regular (weekly or biweekly) phone conversations to discuss ongoing herding activities
and Noyakuk’s weather observations. The interviews were not recorded per Noyakuk’s
request but I took extensive notes during and after each interview. Appendix B contains
blank copies of the Informed Consent and Release forms that all participants signed prior
to giving interviews. Noyakuk reviewed interview summaries throughout the study as
well as two thesis drafts.
3.1.1 Semi-directed interviews
I conducted semi-directed interviews with an initial set of questions or topics, but
the conversation was allowed to diverge from the initial questions or topics so that
Noyakuk could share details and context about his herding knowledge and experiences
that may not have been approached or elicited using a structured set of questions
(Huntington 1998, Schneider 2002b). Interview topics, questions, and the resulting
discussion reflected the particular setting and purpose of each interview. Noyakuk
received honoraria of $50 per “indoor” interview and 20 gallons of gas for field
interviews. He refused the $50 honoraria for additional interviews after the initial one.

39
I conducted semi-directed, field interviews with Noyakuk while traveling on his
range. The discourse of these field interviews depended on the sites visited and the tasks
at hand. Field interviews took place February 14-15, 2004 to discuss critical herding sites
and to set up the weather stations; March 19-20, 2004 to describe and rate on-site weather
and snow conditions; and March 29-30, 2005 to rate on-site conditions, download the
weather stations, and move and slaughter reindeer. Noyakuk and I also conducted snow
depth transects during these trips.
Noyakuk and I established a rating system for weather and trail conditions during
the initial field interviews, and we refined the system during subsequent discussions.
Noyakuk rated weather conditions separately from trail, or on-the-ground snow and ice,
conditions. The rating system was designed with three categories: “good”, “minimal”,
and “poor”. Noyakuk defined “good” weather and trail conditions as those when it was
possible to travel at preferred speeds. A “minimal” rating was given when conditions had
deteriorated enough to slow, but not prevent safe travel. “Poor” conditions usually
precluded travel or, if such conditions developed en route, they made Noyakuk feel
unsafe or as if he should not be traveling. Over the course of many interviews Noyakuk
described specific weather and trail conditions that characterized the rating categories.
Table 2 summarizes the rating definitions and gives examples of weather and trail
conditions for each rating. Chapter 4, section 4.1.3 details the relationship between the
rating system and specific weather and trail conditions.

40
Table 2. System for rating winter weather and trail conditions
Rating Category Definition Conditions contributing to the rating* Good Travel** possible at preferred speeds
(e.g. 25 minutes for the 30 km route from Teller to the nearest range border at the Agiapuk River).
Solidly frozen harbor and river ice; Visibility >3 miles (5 km); >23cm packed and smooth snow cover
Minimal Safe travel possible but slowed by weather or trail conditions (e.g. those listed as "poor" conditions)
Milder cases of conditions listed for the "poor" rating
Poor Travel prevented by weather and/or trail conditions, or, if such conditions developed en route, travel slowed significantly and conditions considered unsafe.
Combination or severe cases of the following: Poor visibility (blowing snow, blizzard, fog); Open, overflow, or glare harbor or river ice; Low snow cover; Low windchill temperature (WCT)
* These conditions were described by Noyakuk during the interviews but are listed here so that the reader can make connections between the rating system and the reasons for ratings given by Noyakuk during the regular phone conversations about weekly herding trips.
** Usually for herding purposes including driving reindeer, but including trips to the range for non-herding purposes
I also conducted interviews at Noyakuk’s house in Teller, at the RRP bunkhouse
in Nome, and during several phone conversations between February 2004 and December
2005. These interviews centered on the effects of weather and other environmental
conditions on planned herding activities and reindeer behavior. Other topics included
Noyakuk’s heritage and training, the history of his herd, as well as technological and
socioeconomic adjustments to manage a smaller herd in recent years with caribou
present. Many of the later interviews included follow-up or clarification questions.

41
I conducted participatory mapping interviews with Noyakuk on March 30, 31 and
June 23, 2005. These interviews involved semi-directed discussions over laminated,
topographic maps. Noyakuk and I drew the following items onto the lamination using
permanent marker: typical routes to access and move his herd, areas used seasonally by
the herd during different periods of his herding history, and areas of ecological
significance including places where caribou were observed. ArcView 3.3 (ESRI,
Redlands, California, USA) shapefiles were created from these routes and designated
sites, and these were combined into maps illustrating range use for each of Noyakuk’s
herding eras (Table 1). These maps are referenced in the background information chapter
(Figures 3, 4, 6, and 7).
3.1.2 Structured phone survey about weather limitations
In March 2005 I conducted phone surveys with 13 reindeer herders (or members
of herding families). The surveys lasted approximately 45 minutes and followed a
structured set of questions with time allocated for each herder to expand on particular
topics as he or she felt necessary. Most questions focused on limits that individual
herders have for various weather and travel conditions when making decisions about
traveling to, or moving, reindeer. I also asked herders to comment on hazardous areas on
their range and seasonal considerations for travel, as well as to compare current and past
weather and trail conditions. See Appendix C for a list of survey questions. Noyakuk’s
answers are included with information from his other interviews in Chapter 4.

42
3.1.3 Regular phone conversations about daily herding activities
Beginning in February 2004, I called Noyakuk on a biweekly (and often weekly)
basis to ask for updates about recent herding activities and the concurrent weather
conditions. Our conversations focused on winter herding events from February 2004
until break-up in April 2004, and from freeze-up in November 2004 until break-up in
May 2005. I called less frequently between the summer handlings and the early fall when
herding was limited due to reduced access to the herd, the general absence of caribou
during the summer, and Noyakuk’s involvement in other employment then.
The following information was discussed and recorded: dates of travel or
attempted travel, location and purpose of each trip, herd condition, observed weather and
trail conditions, and ratings for these weather and trail conditions. During March and
April 2005, Noyakuk kept daily notes on a calendar of his trip activity and weather
observations. These logs added detail to the phone conversations and confirmed trip
dates.
3.1.4 Organization of interview information
Each interview type contributes different information to each of the two sections
of the results chapter. The first section (4.1) gives an overview of the general effects of
weather and trail conditions for Noyakuk’s herding practices. This section was gleaned
primarily from the semi-directed interviews and the phone survey with Noyakuk.
However, general weather and trail considerations were also discussed during the regular

43
phone conversations because those considerations explained Noyakuk’s ratings of
specific conditions on herding trips.
Section 4.1 is organized into topics that frame Noyakuk’s perception of weather
impacts to herding. This structure reflects both Noyakuk’s hierarchy with which he
regards weather and trail conditions when planning herding activities, and the most
repeated answers to questions about weather or trail conditions. In general weather and
trail conditions impact herding on two temporal scales – seasonal and daily. Thus,
section 4.1 begins with a discussion of seasonal herding activities, and it relates these to
reindeer and caribou behavior and to various weather and environmental conditions
typical of those seasons (subsection 4.1.1). It continues by describing Noyakuk’s process
of making daily decisions and the role of weather and other environmental conditions in
those decisions (subsection 4.1.2). Finally, subsection 4.1.3 details how specific weather
and environmental parameters have affected Noyakuk’s herding activities. The
information contributing to this section was obtained in an exploratory manner via a
variety of interview types. The results are descriptive and serve as a framework for
understanding the second results section.
The second results section (4.2) links Noyakuk’s herding activities to his weather
observations and to weather station data during the winters of 2003-04 and 2004-05. The
regular phone conversations were the major interview input for this section. Methods for
this integration of information sources (interview data and weather station data) are
described in section 3.4.

44
3.2 Weather stations
3.2.1 Weather station deployment and data used
I established weather stations (HOBO Microstations, Onset Computer
Corporation, Bourne, Massachusetts) at four sites on Noyakuk’s range from February 14
to May 29, 2004 (Figure 3). Temporary, steel posts were driven into the ground. I
situated the station instruments at the top of the post, so that the temperature logger was
approximately 1.5 meters above the snow surface (the approximate height of a herder
standing at the site), and the wind vane and anemometer were two meters above the snow
surface. These weather stations logged hourly average temperature, wind speed and wind
direction data.
HOBO station locations were determined with Noyakuk while traveling on his
range on February 14, 2004 (Figure 8). One station was located at his corral (“Corral”
site 65.18ºN, 165.58ºW, elevation 3m) (Figure 3). Two stations were set up at vantage
points used to locate and monitor reindeer and to observe distant weather conditions
along major travel routes (“Mayuguk” site 65.19ºN, -165.91ºW, elevation 181m; and
“North of the Corral” site 65.25ºN, -165.56ºW, elevation 39m). The fourth site was
chosen in a no-travel zone to be compared with Mayuguk for microclimate variation
(“Agiapuk-Willows” site 65.24ºN, 165.79ºW, elevation 19m). It was located in a
drainage having thick willows (Salix spp.) where Noyakuk and the reindeer were unlikely
to travel. We removed the stations on May 29, 2004 to prevent damage by brown bears
(Ursos arctos) during the summer. The station sites, dates of deployment, and locations
are shown in Table 3.

45
Figure 8. HOBO weather station deployment at Mayuguk.

46
Table 3. Weather stations used for study
Station Name
Dates of deployment/ data use Location Recorded and used data
Agiapuk-Willows* 2/15/04 - 5/29/04 65.24°N
165.79°W Hourly average temperature, wind speed, wind direction
Corral* 2/15/04 - 5/29/04 3/15/05 - 5/31/05 65.18°N
165.58°W Hourly average temperature, wind speed, wind direction
Mayuguk* 2/15/04 - 5/29/04 3/15/05 - 5/31/05 65.19°N
165.91°W Hourly average temperature, wind speed, wind direction
North of Corral* 2/15/04 - 5/29/04 65.25°N
165.56°W Hourly average temperature, wind speed, wind direction
Teller Airport* 3/15/05 - 5/31/05 65.24°N 166.34°W
Hourly average temperature, wind speed, wind direction
UAF-Teller Airport station 2/15/04 - 5/29/04 65.24°N
166.34°W
Hourly instant temperature; hourly average wind speed, wind direction
Kougarok-1 2/15/04 - 5/29/04 10/1/04 - 5/31/05 65.44°N
164.58°W Hourly average temperature, wind speed, wind direction
Kougarok-2 2/15/04 - 5/29/04 10/1/04 - 5/31/05 65.43°N
164.64°W Hourly average temperature, wind speed, wind direction
Nome airport 2/15/04 - 5/29/04 10/1/04 - 5/31/05 64.51°N
164.45°W
Hourly instant temperature, wind speed, wind direction, visibility
* HOBO weather stations deployed specifically for this study. All other stations were permanent stations from which the listed data were obtained for this study.
I attempted to re-establish the HOBO stations in September 2004, but weather
conditions prevented travel to Noyakuk’s range. The loss of a significant portion of his
herd in December 2004 caused Noyakuk to reconsider the amount of time that he would
dedicate to herding that winter. Thus, fewer stations were eventually installed and the
locations varied slightly from the previous winter. Three HOBO stations were deployed

47
from March 13, 2005 until June 12, 2005 (Table 3). The Mayuguk and Corral stations
were reestablished for this period. A third station was set up at the Teller airport
(65.24°N, 166.34°W) to log weather that Noyakuk would have observed while making
decisions to travel from his home in Teller.
I also acquired weather data from a National Weather Service (NWS) station at
the Nome airport and from UAF-established stations at the Teller airport and in the
Kougarok area (Figure 3, Table 3). These data were compared with HOBO station data
during their deployment but also provided regional weather data when the HOBO stations
were not operating (October 1, 2004 to March 14, 2005). The NWS maintains a
permanent, manned station at the Nome airport (64.51°N, 164.45°W, elevation 4m).
Instant, hourly data (recorded once at the top of the hour) for temperature, wind speed,
and wind direction (recorded 10m above ground) from this station were obtained from
Martha Shulski with the Alaska Climate Data Center at UAF. I also examined visibility
and snow depth data that were observed and recorded manually once daily by NWS
personnel at the Nome station; these data were also provided by Shulski. This was the
only station in the region with data for visibility and snow depth.
The Alaska Department of Transportation Airport Design Group and UAF’s
Water and Environmental Research Center (WERC) maintained a weather station from
May 21, 2002 to July 23, 2004 and from March 23, 2005 to May 31, 2005 at the Teller
airport (65.24°N, 166.34°W, elevation 89m). Data from this station for instant, hourly
(recorded once at the top of the hour) temperature and for average hourly (average of data
recorded every minute during the previous hour) wind speed and wind direction were

48
provided by Ken Irving of WERC. The data that I used were recorded by instruments
situated 10-meters above ground.
In 1999, three weather stations were installed near the Kougarok River for an
Arctic Transitions in the Land-Atmosphere System (ATLAS) project conducted by
WERC. The Kougarok stations are located on the eastern side of Noyakuk’s range, 85
kilometers northeast of Teller and 52 kilometers from the corral (Figure 3, Table 3). This
area has been used by caribou in recent winters. I obtained 1999-2004 meteorological
data for the Kougarok stations online at:
(http://www.uaf.edu/water/projects/atlas/kougarok/kougarok.html, last accessed
September 2005). Bob Busey of WERC provided me with 2005 data from the Kougarok-
1 (K1) and Kougarok-2 (K2) stations. K1 is a three-meter tower within the burned area
of Niagara Creek (65.44°N, 164.58°W, elevation 290m). K2 is a ten-meter tower
between Niagara Creek and Mauze Gulch (65.43°N, 164.64°W, elevation 110m). I used
average hourly data for temperature, wind speed and wind direction from K1
(temperature recorded at 1m height above ground, wind speed and direction at 3m) and
K2 (temperature and wind speed recorded at 1m height above ground, wind direction at
10m). The Kougarok-3 station was not operational during much of this study, and its
data were not used.

49
3.2.2 Weather data consolidation
I calculated workday average, windchill [equivalent] temperatures (WCT) from
workday average air temperature and wind speed data using the following formula
updated by the NWS in 2001 (NWS 2006, URL: http://www.weather.gov/om/windchill/):
WCT (°F) = 35.74 + 0.6215T – 35.75 (V0.16) + 0.4275 T (V0.16)
T = air temperature (°F) and V = wind speed (mph)
WCT is considered to be the same as air temperature above 50°F (10°C) or when wind
speed is less than three mph (1.34 m/s) (NWS 2006). Although WCT can be higher in
direct sunlight (NWS 2006), I did not account for cloud cover due to lack of this data for
most stations. Furthermore, the formula uses temperature and wind speed recordings at
33 feet (10m) above ground, which is the typical anemometer height. Meteorological
data were recorded at different heights among my stations, but I calculated WCT from
temperature and wind speed data recorded at the same height per station. For example,
although K1 workday average temperatures were used from the 1m datalogger, WCT was
calculated from 3m temperature and 3m wind speed data because of the lack of wind
speed data at 1m.
Hourly data from 9:00 AM to 8:00 PM ADT (12 readings) were averaged
together per day for each weather variable (temperature, wind speed, WCT, and visibility
in Nome) at each station. These “workday averages” covered the full workday schedule
that Noyakuk may have spent conducting winter herding activities. Workdays were
possibly shorter than twelve hours in December when daylight is limited and longer in

50
April, but I used a twelve-hour workday average for consistency throughout the study
period.
Measurements of wind direction in degrees are circular data and cannot be easily
or definitively averaged. However wind roses composed from wind speed and wind
direction, can show directional trends. A wind rose is a circular or polar plot where
stacked bars pointing from the center of the plot in one or more of sixteen directions
show the percentage of data recorded for each combination of wind speed and wind
direction category. I divided each station’s wind direction data, which were recorded in
compass degrees from true north, into one of sixteen categories (Table 4). I also divided
the wind speed data from each station into six categories (Table 4). I then used
WRPLOT View Version 5.2.1 (free downloadable software from Lakes Environmental,
Ontario, Canada, http://www.weblakes.com/lakewrpl.html) to produce wind roses for
each station, weather rating category, and herding season. See section 4.2.1.b for
examples of wind roses as they pertain to the wind speed and wind direction data
recorded between February 15 and May 29, 2004.

51
Table 4. Wind direction and wind speed categories used to make wind roses. Wind direction categories Degrees from true north North 348.75-360° and 0-11.25° North-northeast 11.25-33.75° Northeast 33.75-56.25° East-northeast 56.25-78.75° East 78.75-101.25° East-southeast 101.25-123.75° Southeast 123.75-146.25° South-southeast 146.25-168.75° South 168.75-191.25° South-southwest 191.25-213.75° Southwest 213.75-236.25° West-southwest 236.25-258.75° West 258.75-281.25° West-northwest 281.25-303.75° Northwest 303.75-326.25° North-northwest 326.25-348.75° Wind speed categories Calm (<0.5 m/s) 0.5 - 2.5 m/s 2.5 - 4.5 m/s 4.5 - 6.5 m/s 6.5 - 8.5 m/s 8.5 – 10.5 m/s >/= 10.5 m/s
3.3 Linking Noyakuk’s activities and observations with weather station data
I compared workday averages of weather station data with comments that
Noyakuk made regarding weather conditions on corresponding days. I organized these
comparisons within the time periods of HOBO station availability:
• February 14 to May 29, 2004 (HOBO, UAF-Teller airport, Kougarok, and
Nome data used);

52
• October 1, 2004 to March 14, 2005 (Kougarok and Nome data used;
HOBO and UAF-Teller airport data unavailable);
• March 15 to May 31, 2005 (HOBO, Kougarok, and Nome data used) (see
also Table 3).
During each of these time periods, I asked Noyakuk to describe and rate (“good”,
“minimal”, or “poor”) the weather and trail conditions on days that he traveled to his
range. Most “poor” rated days were days when Noyakuk decided to not travel due to
weather or trail conditions and are noted as such. I added three additional categories:
“unrated” days when Noyakuk traveled but no rating was given; “mixed” days when
conditions changed temporally or geographically during one day; and “not discussed”
days when it was not definitively known if Noyakuk did or did not travel.
Workday averages for each weather variable were grouped by rating category for
each station. For example, workday average temperatures from the Corral station on
“good” rated days between February 15 and May 29, 2004 comprised one group. I used
SAS 9.1 (SAS Institute, Inc., Cary, North Carolina, USA) to compare rating categories
for each weather variable (temperature, wind speed, WCT, and visibility) recorded at
each station. For the first study period (February 15 to May 29, 2004), I used Wilcoxon
ranked sum tests to compare “good” rated days (n=5) with “poor” rated days (n=5) at
significance p < 0.05 for each variable at each station. This pair-wise comparison was
done because “minimal” rated days were not included due to the small sample size (n=2),
and station data were not combined. For the second study period (December 1, 2004 to

53
March 14, 2005), I used Kruskal-Wallis tests at significance p < 0.05 to compare data
among “good” (n=11), “minimal” (n=4), and “poor” (n=10) rated days for each weather
variable at each station. Comparisons were not made among rating categories for the
third study period (March 15 to May 31, 2005) because there were no days rated
“minimal” and only one day rated “poor”.
Section 4.2 of the results is organized by the three study periods outlined above
(February 15-May 29, 2004; October 1, 2004-March 14, 2005; and March 15-May 31,
2005). For each study period, Noyakuk’s herding activities, major weather trends or
events, and the satellite collar data are first described together in a chronological fashion
within the study period. Following this are results from the Wilcoxon and Kruskal-
Wallis comparisons between rating categories for temperature, wind speed, and WCT at
each station and for visibility in Nome. Wind direction trends are described and
illustrated by the wind roses. This portion of the study was designed to test the
hypotheses that (1) inclement weather reduces herding ability, and (2) recorded weather
data corresponds with herding ability (i.e., that temperature and/or WCT would be lower,
and/or wind speed, higher on “poor” rated days versus “good” rated days).
3.4 Snow measurements
I asked Noyakuk to rate and give observations about the snow and ice cover that
he encountered when traveling to his reindeer or when moving the herd. I took snow
depth measurements at the HOBO stations on the same dates as the field interviews:
February 15, 2004; March 19 and 20, 2004; and March 29 and 30, 2005. Snow depth

54
was measured using a steel one-meter probe; depths greater than one meter were recorded
as >100 cm. From each station post, I conducted line transects in two randomly chosen
cardinal directions from true north (north, east, south, or west). I took ten measurements
along each of these two transects at random points between 30 and 80 meters from the
station post, for a total of 20 measurements per station. I then averaged these 20
measurements for each station by date. Repeat transects (in March 2004 and March
2005) were conducted at each station along the same two cardinal directions as the initial
transects, but at a different set of random points along those lines. I used SAS 9.1 (SAS
Institute, Inc., Cary, North Carolina, USA) to conduct ANOVA with Scheffé multiple
comparisons tests to compare average snow depth among transect dates (February 2004,
March 2004, and March 2005) at each station, and among stations for each transect date.
3.5 Mapping relationships between herding, reindeer, and caribou
I mapped reindeer and caribou use of Noyakuk’s range and the surrounding area
using a Geographic Information System (GIS). These maps were produced to illustrate
the joint effects of herd management, season, and caribou presence on reindeer locations
during the study period.
3.5.1 Mapping reindeer locations
Location data from satellite-collared reindeer in Noyakuk’s herd were provided
by the RRP. At least two to three satellite collars have been deployed on reindeer in
Noyakuk’s herd since 2000 (Oleson 2005); exact numbers for the study periods are

55
reported below. Additionally there were one to two satellite-collared reindeer from
Leonard Olanna’s herd that mixed with Noyakuk’s herd during two of the study periods.
The locations from these reindeer were also mapped for the time they were mixed with
Noyakuk’s herd. Noyakuk estimated that his herd contained 170 to 250 reindeer between
fall 2003 and summer 2005. RRP (and RHA) data indicated that 164 (195) reindeer were
handled on December 18, 2003 at Noyakuk’s corral, 224 (272) reindeer were handled on
June 16, 2004, and 161 (181) reindeer were handled on July 6, 2005. RRP data only
include Noyakuk-marked reindeer, although several reindeer from other herd owners
have mixed into Noyakuk’s herd, as has been common for all herds in the region.
Moreover handling numbers may only report 80-85% of the total herd (G. Finstad, pers.
comm.).
Collaring methods and the procedure by which satellite-transmitted information
was processed by Argos (Largo, Maryland, USA) and the RRP are given in detail in
Oleson (2005). Each of the satellite collars was scheduled to transmit signals every five
days to minimize autocorrelation with previous locations. Satellite signals included the
collar identification number, latitude and longitude in decimal degrees (WGS 1984), date,
time of day, and location quality (accuracy). Decoded signal data were sent by Argos to
the RRP, which consolidated the data to show only the most recent location of the highest
location quality class given on a particular signal day (Oleson 2005). RRP satellite
collars were tested by Oleson (2005) before deployment on reindeer in 2000: location
accuracy was 281m (MSE=20, n=32) for the highest location class (LC-3), and 400m
(MSE=39, n=32) for LC-2. I removed locations with LC less than two. I grouped the

56
remaining location data by date into seven “seasons” that were a further subdivision of
the three study periods listed in section 3.3. These seven seasons were based on
Noyakuk’s ability to access the herd and the herding activities that he conducted during
the study periods. Noyakuk was only able to access his herd during seasons 1, 4, 5, and
6. These seven seasons are explained in section 4.2 of the results.
(1) February 15-April 7, 2004 (late winter, moved reindeer to calving grounds)
(2) April 8-May 29, 2005 (break-up)
(3) October 1-November 30, 2004 (freeze-up)
(4) December 1, 2004-January 8, 2005 (early winter, attempted reindeer roundup)
(5) January 9-March 14, 2005 (mid-winter slaughter and handling)
(6) March 15-May 1, 2005 (late winter, moved reindeer to calving grounds)
(7) May 2-May 31, 2005 (break-up).
Home range has been defined as “the extent of area with a defined probability of
occurrence [e.g., 95%] of an animal during a specified time period [e.g., one of
Noyakuk’s herding seasons]” (Kernohan et al. 2001). I used ArcView’s Animal
Movement SA v2.04 beta extension (Hooge and Eichenlaub 1997) to produce fixed
kernels representing 95% home ranges (or use areas) from the satellite collar locations of
Noyakuk’s reindeer for each of the seven seasons. I used the program’s Least Squares
Cross Validation (LSCV) selection function to determine the smoothing, or h-factor, for
each of the kernels.

57
Fixed kernel techniques using LSCV smoothing parameters have been shown to
produce the lowest error and least-biased estimates (Seaman and Powell 1996, Seaman et
al. 1999), even for small data sets (30 < n < 50) (Seaman et al. 1999). There were
between 16 and 43 locations of satellite-collared reindeer per season. Although home
range extent may be overestimated when produced from fewer than 50 locations (Seaman
et al. 1999), the kernels for this study were solely for illustrative purposes (e.g., to show
general location of the herd and distribution shifts among seasons) and not for spatial
analysis, such as habitat selection.
I produced home range kernels for herding seasons 1 and 2 using the locations of
two satellite-collared female reindeer in Noyakuk’s herd and two satellite-collared female
reindeer from Leonard Olanna’s herd that had mixed with Noyakuk’s herd. For season 1,
n=32 locations from four collars, with kernel smoothing factor h=987, and for season 2,
n=43 locations from four collars, and h=1684. Season 3 (n=18 locations, smoothing
factor h=2004), season 4 (n=16, h=730), and season 5 (n=21, h=3314) kernels were
produced from the locations of two satellite-collared reindeer in Noyakuk’s herd. Season
6 (n=26 locations, smoothing factor h=2078) and season 7 (n=19, h=1544) kernels were
produced from the locations of two of Noyakuk’s collared reindeer plus one of Olanna’s
collared reindeer that had mixed with Noyakuk’s herd. I used ArcView 3.3 (ESRI,
Redlands, California, USA) to map individual locations of the satellite-collared reindeer
and the 95% home range kernels produced from those locations.
One of Noyakuk’s steers was fitted with a satellite collar from June 23, 2004 until
it died in March 2005. This collar transmitted on a daily schedule. I mapped the path of

58
the steer from daily locations of LC-2 and LC-3 using ArcView Animal Movement’s
polyline function (Animal Movement SA v2.04 beta extension, Hooge and Eichenlaub
1997). The steer was mapped separately from the satellite-collared females because it
traveled off-range in December 2004.
3.5.2 Caribou home range kernels on the Seward Peninsula
The Alaska Department of Fish and Game (ADF&G) office in Nome, Alaska
provided me with location data of satellite-collared caribou from the WAH. These data
were locations found within the area north of 64°N, south of 66.75°N, and west of 160°W
(encompassing the entire Seward Peninsula) through February 28, 2005. Most of these
satellite collars transmitted signals on a 6-day schedule. When they did not (e.g., a two or
three-day schedule), location data were reduced randomly to a 6-day schedule per collar
to maintain a similar number of locations per collared animal. I produced 95% home
range kernels from the locations of satellite-collared caribou for the same seasons as the
reindeer kernels until February 28, 2005, after which caribou data were not available.
The caribou home range kernels were produced in the same manner as those for the
reindeer. Overlap of caribou kernels with reindeer kernels and the path of Noyakuk’s
collared steer can be seen on the maps, but overlap was not calculated or analyzed
statistically.
The WAH was estimated at 490,000 caribou in 2003 (Dau 2003). Census and
collar deployment methods for the WAH have been described in the biannual Caribou
Management Reports produced by the ADF&G (see Dau 2003, 2005a). Most satellite-
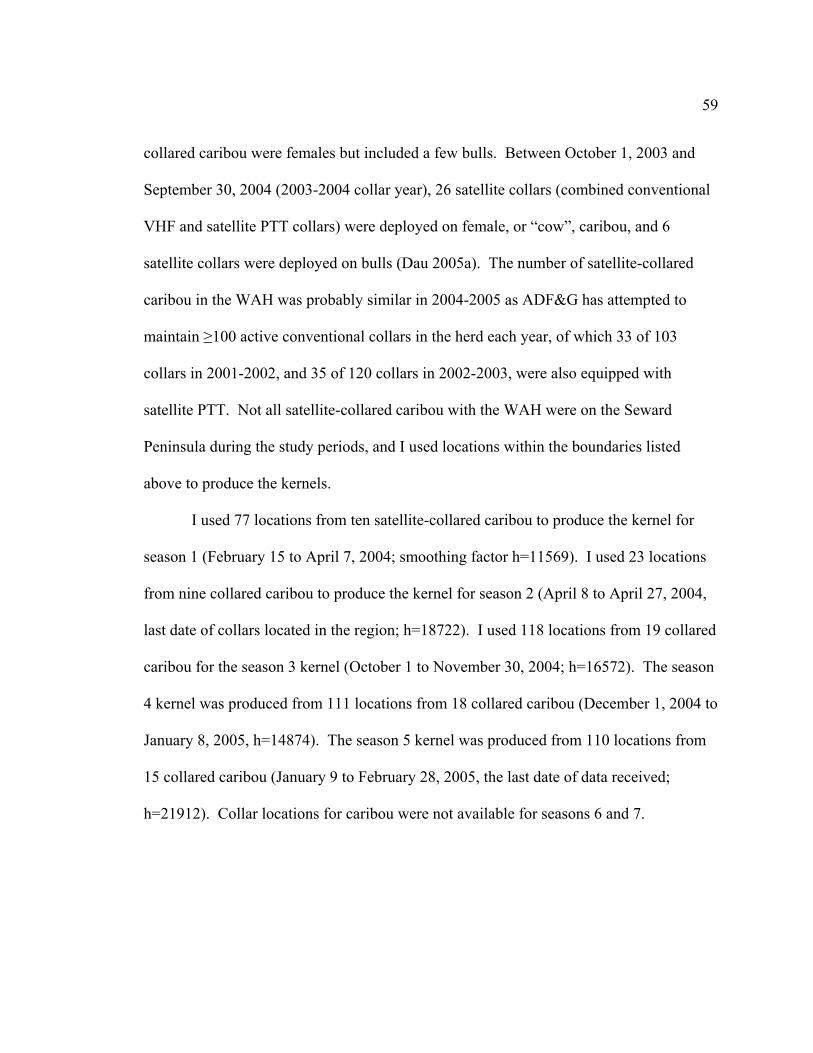
59
collared caribou were females but included a few bulls. Between October 1, 2003 and
September 30, 2004 (2003-2004 collar year), 26 satellite collars (combined conventional
VHF and satellite PTT collars) were deployed on female, or “cow”, caribou, and 6
satellite collars were deployed on bulls (Dau 2005a). The number of satellite-collared
caribou in the WAH was probably similar in 2004-2005 as ADF&G has attempted to
maintain ≥100 active conventional collars in the herd each year, of which 33 of 103
collars in 2001-2002, and 35 of 120 collars in 2002-2003, were also equipped with
satellite PTT. Not all satellite-collared caribou with the WAH were on the Seward
Peninsula during the study periods, and I used locations within the boundaries listed
above to produce the kernels.
I used 77 locations from ten satellite-collared caribou to produce the kernel for
season 1 (February 15 to April 7, 2004; smoothing factor h=11569). I used 23 locations
from nine collared caribou to produce the kernel for season 2 (April 8 to April 27, 2004,
last date of collars located in the region; h=18722). I used 118 locations from 19 collared
caribou for the season 3 kernel (October 1 to November 30, 2004; h=16572). The season
4 kernel was produced from 111 locations from 18 collared caribou (December 1, 2004 to
January 8, 2005, h=14874). The season 5 kernel was produced from 110 locations from
15 collared caribou (January 9 to February 28, 2005, the last date of data received;
h=21912). Collar locations for caribou were not available for seasons 6 and 7.

60
Chapter 4 - RESULTS
4.1 Herding seasons, daily decisions, and the effects of weather and other
environmental factors
This section contains interview information organized and presented by the
following topics: 1) the seasonal and 2) daily scales by which weather and other
environmental conditions have shaped Noyakuk’s herding decisions and 3) the specific
weather and environmental parameters that have affected his herding activities. These
sections are a framework for interpreting the following results section (4.2) where
Noyakuk’s herding activities and his weather observations were matched with weather
station data for the winters of 2003-04 and 2004-05.
4.1.1 Seasonal herding activities
Noyakuk’s herding strategy changed following the arrival of caribou onto the
central Seward Peninsula in fall 1996. Since that time he has employed a more intensive
herding style in order to maintain and increase herd size. Satellite collars have aided in
locating the herd and in indicating the possibility of nearby caribou or predators when the
distance between collar locations increased rapidly. Seasonal herding activities have
largely depended on weather and environmental conditions, herd accessibility, and
planned herding activities. A typical year for Noyakuk has involved seven herding
seasons since 1996 (Table 5). Freeze-up and break-up were included as separate seasons
as access has usually been restricted during these events.

61
Table 5. Noyakuk's herding seasons
Season Typical Year* 2003-04 2004-05 Reindeer Herding Activity
Late summer/Fall
mid Jul-mid Oct Jul 10-Oct 14 Jul 1-Oct 14 Limited herding; Reindeer rut;
Caribou arrive
Freeze-up mid Oct-mid Nov Oct 15-Nov 30 Oct 1-Nov 30 Limited access to herds
Early winter late Nov-Dec Dec 1-Dec 31 (handled Dec
19) Dec 1-Jan 8 Round-up, slaughter
Mid-winter Jan and Feb Jan 1-Apr 7 Jan 9-Mar 14 (handled Mar 13) Slaughter, winter handlings
Late winter Mar-early May Mar 15-May 1 Move reindeer to calving site; Calving begins mid-April
Break-up May-early June Apr 8-May 29 May 2-May 31
Limited access to herds; Calving concludes; Caribou
leave region
Summer early June-mid July May 30-Jun 30 Jun 1-Jul 14 Summer handlings
*The "typical year" reflects herding seasons between 1996 and 2005 for Jim Noyakuk. The approximate dates are based on information from interviews and conversations held on March 21, July 7, and August 16, 2004. Season dates varied between years as shown in the 2003-04 and 2004-05 columns.
Between 1996 and 2005, Noyakuk traveled infrequently to the herd from mid-
summer through freeze-up because access was limited to boat and 4-wheeler in summer,
and access was impossible during freeze-up. However, Noyakuk monitored the location
of the herd during summer by following satellite collar locations on the internet. During
rut (approximately mid-August through September) the reindeer were scattered in small
harem groups. The herd usually regrouped closer to the corral after rut, but some
reindeer may have wandered off-range with caribou during the fall and early winter of
some years. Noyakuk’s hope has been that the caribou would not arrive onto his range

62
until after freeze-up when snowmachine travel is possible. Freeze-up typically occurred
in October and November for most of Noyakuk’s herding history.
Following freeze-up, Noyakuk gathered and moved the herd to his designated
“comfort zone” (Figure 3) because of the area’s proximity to Teller and the corral, and
the less rugged and more familiar terrain there. There were also several cabins available
in the area if weather or herding plans kept him out for the night (Noyakuk pers. comm.
March 30, 2005). The snowmachine trip from Teller to the western edge of the comfort
zone typically required 25 minutes in optimal weather and trail conditions (Noyakuk
pers. comm. June 15, 2005). Most winter trips were to monitor or move the herd away
from caribou and predators while keeping the reindeer where there was adequate winter
forage.
Noyakuk slaughtered an average of twelve reindeer each winter between 2000
and 2005 for personal and family consumption and to sell to local grocers (Noyakuk pers.
comm. April 2, 2004). He usually slaughtered older steers as well as “wilder” females
that were viewed as disruptive for herd cohesion (Noyakuk pers. comm. March 30,
2005). However, these animals have been fewer in number in the smaller herd, and this
has increased the time and effort required to cull these animals. The preferred time to
slaughter has been December and January when the reindeer were earliest accessible by
snowmachine and still in good physical condition (Noyakuk pers. comm. August 16,
2004). Any plans to move, slaughter, or handle reindeer in December and January were
limited not only by the freeze-up process and storms, but also by the short day length.

63
Noyakuk held a winter handling in some years depending upon his financial
capabilities and the number of reindeer available for sale of meat. Winter handlings were
conducted occasionally from 2000 to 2005 to harvest meat, administer veterinary care,
and count animals, but these handlings also served to keep the reindeer habituated to the
handling process (Noyakuk pers. comm. March 1, 2005, June 15, 2005, August 19,
2005). Winter handlings were usually held before March and the final stage of gestation
for pregnant females. Moreover herders were recommended to not administer the
antiparasitic treatment Ivermectin after February (Dieterich and Morton 1990).
In spring, Noyakuk usually moved the herd as close to the corral as possible prior
to, or just after, calving depending upon travel conditions and the timing of break-up
(Noyakuk pers. comm. March 21, 2004). The calving season has typically been between
mid-April and mid-May, with break-up overlapping calving in May (Noyakuk pers.
comm. March 16, 2004, July 7, 2004). Unless break-up or other weather conditions
prevented it, Noyakuk monitored the herd during the calves’ first few weeks of life until
they were more able to outrun predators (Noyakuk pers. comm. March 21, 2004).
Noyakuk preferred that the reindeer spend the calving season near the corral, where they
would be naturally “fenced in” once rivers and sloughs opened (Noyakuk pers. comm.
July 7, 2004). Noyakuk assumed that the reindeer were better protected from predators in
this area, and the reindeer were also then closer to the corral for the summer handling
(Noyakuk pers. comm. July 7, 2004).
Following break-up each year, Noyakuk began gathering and driving the reindeer
to the corral for the summer handling. He has used a 4-wheeler to corral rather than

64
hiring a helicopter to keep operational costs low after losing reindeer, and antler prices
declined in the 1990s. However, herding by 4-wheeler has been an arduous task because
of the difficulty in maneuvering over cottongrass tussocks (Eriophorum vaginatum) and
around open rivers and sloughs when chasing small, swift groups of reindeer (Noyakuk
pers. comm. June 15, 2005). Summer handling activities have included harvesting velvet
antler, counting reindeer, ear tagging new calves and previously unmarked adults (or
mavericks), and veterinary care. Noyakuk has recently employed smaller crews to assist
with these activities than when the herd was large (1993-2000) (Noyakuk pers. comm.
June 15, 2005). The summer handling season was usually over by mid-July when the
antlers begin to harden and are no longer desired by antler buyers (Noyakuk pers. comm.
July 7, 2004).
4.1.2 Factors affecting daily herding decisions
Noyakuk explained how he has made daily herding decisions during an
interview on March 21, 2004. This section is a synthesis of the interview but includes
information from later conversations, which are cited as such. Noyakuk’s daily herding
decisions have been based upon a number of factors considered in a hierarchical fashion.
I developed a pyramid decision model to illustrate this process (Figure 9). Factors at the
bottom of the pyramid were usually considered before those in the upper tiers when
deciding whether to travel to the herd. First, waterways (Grantley Harbor, Imuruk Basin,
and rivers and creeks on the range) must be passable either by boat or snowmachine.
Second, the status of the herd (i.e., caribou or predator threat, herd size, and herd

65
location) has determined the need and plan for a trip to the range. Abrupt, erratic
movements of satellite-collared reindeer and/or reports about caribou or predators near
the herd have often initiated travel. Noyakuk has often traveled to his herd in inclement
weather when there was an imminent caribou or predator threat, or when the herd was
within his comfort zone (Noyakuk pers. comm. March 21, 2004, March 15, 2005).
(Not freeze-up or break-up conditions) HARBOR & RIVERS FROZEN (OR
BOATABLE)
Herd location Herd size
Caribou/Predator threat HERD STATUS
Experienced crew Fuel available/affordable Working snowmachine
EQUIPMENT & CREW
Warmer than -30°F Adequate snow cover
Good visibility WEATHER & TRAVEL CONDITIONS
Figure 9. Noyakuk decision pyramid for daily herding activities. Factors at the bottom of the pyramid are considered before those in the upper tiers when deciding to travel to the herd.
Third, reliable mechanized transport, affordable fuel, and (if needed) an
experienced crew have been critical for successful herding activities. Noyakuk has
borrowed a snowmachine or fuel when necessary (Noyakuk pers. comm. March 30, 2005,

66
June 15, 2005). He usually traveled alone to monitor or drive the herd short distances,
but he received assistance for longer reindeer drives or when traveling to less familiar
territory (Noyakuk pers. comm. June 15, 2005). Finally, mid-winter weather and trail
conditions have severely impeded many herding plans. This chapter focuses on the
effects of weather and travel conditions for Noyakuk’s herd management, but other
factors affecting herding will be considered in the discussion as well.
4.1.3 Weather and other environmental concerns for herding
4.1.3.a Freeze-up, mid-winter ice, and break-up
Noyakuk’s comments about freeze-up, mid-winter ice, break-up conditions, and
other weather variables are summarized in Table 6. Noyakuk stated that the harbor and
river ice has usually been stable from late November until early May, but the freeze-up
process was delayed by warm spells in 2003 and prolonged by severe storms in 2004
(Noyakuk pers. comm. November 24, 2004, February 5, 2005). Each fall, there were
usually several rounds of freezing and thawing before final winter freeze-up of Grantley
Harbor and Imuruk Basin (Noyakuk pers. comm. November 11, 2004). Noyakuk usually
waited until the harbor ice was at least six to eight inches (15-20 cm) thick, in addition to
at least five consecutive days of below freezing temperatures, before he would
snowmachine onto the harbor (Noyakuk pers. comm. August 19, 2005). He often made
early winter trips onto Grantley Harbor solely for the purpose of checking ice thickness
and stability (Noyakuk pers. comm. November 11, 2004).

67
Table 6. Weather and trail conditions that affect Noyakuk's herding decisions
Weather or Trail Variable
Index for "good" conditions
Factors contributing to "minimal" or "poor" conditions
Seasonal Considerations
Freezing of waterways (Grantley Harbor, Imuruk Basin, inland rivers)
Completely frozen; no open water or water on top of ice; no "hollow ice"; snow covering ice if driving reindeer
Ice forms and breaks multiple times before final freeze-up. More than 12" overflow makes it difficult to see open cracks, holes in ice. Hollow ice forms when warm spells raise water levels below river ice, and an air pocket remains when the water recedes. Reindeer balk when crossing ice without a snow cover (glare ice).
Ice usually well-formed by late November (early December in recent years), and lasts until May. Poor ice conditions typical during freeze-up, early winter, and break-up.
Visibility Visibility greater than 3 miles (5 km)
Visibility can be reduced by: 1) white-out conditions during snow storms; 2) blowing snow/ground blizzards when wind drives loose snow off the ground; 3) flat-light conditions when cloud cover and lighting combinations prevent one from seeing contrast and vertical relief on the landscape; 4) fog; 5) short day length in December and January. "Poor" conditions require a GPS.
Storms are expected in January but occurred with greater frequency than expected throughout the winters of 2003-04 and 2004-05. Fog is common in fall and in spring and an issue for approaching the herd.
Snow cover Well-packed snow that covers tussucks (between 9-15" total); smooth, soft surface layer.
The following conditions slow travel and may damage the snow machine: 1) inadequate snow cover with tussucks or rocks exposed; 2) snow surface hardened by wind or sun (glazing); 3) "wind waves", or sastrugi; 4) soft snow > 3' deep.
An adequate snow surface is usually not well established until mid-December. Wind-hardened drifts may be common throughout the winter.
Wind Effects of wind depend on the presence of loose snow on ground and/or wind chill.
With loose snow on the ground, 20 mph winds significantly reduce visibility; with well-packed snow, 20 mph winds are a minor consideration. Windchill limit is -30°F. Winds are strongest in the Mayuguk hills.
Cold, north winds are more typical in winter, shifting to warmer, south winds in March and April.
Temperature Ideal working conditions are between -20°F and 10°F
Cold limit is -30°F for traveling on the land, -20°F for moving reindeer, -10°F for field slaughter. Above freezing temperatures mid-winter contribute to thaw-freeze events that may ice the snow surface making it difficult for reindeer to dig for forage.
Winters are colder and summers hotter at the corral than in Teller. Heat is a concern for the summer handlings, and Noyakuk often waits until night to drive the reindeer.

68
Variations in freeze-up conditions often caused irregularities in the ice that were
unsafe for travel later in the winter. Once ice formed on inland sloughs and rivers, warm
temperatures occasionally caused water levels to rise, pushing the ice upward. When the
water receded, the ice often remained raised, with large pockets of air between the ice
and the lowered water surface. Noyakuk called this phenomenon “hollow ice” (Noyakuk
pers. comm. February 5, 2005), and its formation can be common on smaller rivers and
streams, such as those on Noyakuk’s range. The ice is stiff enough to form a bridge that
holds to both banks even when water levels recede, but the ice cannot thicken after losing
contact with the water surface (Larry Rundquist, Alaska River Forecast Center, email
January 12, 2006). There are some localized areas on Noyakuk’s range where “hollow
ice” forms annually. In other areas it has been difficult to detect where this potentially
dangerous condition exists.
Open water and glare ice have also been problematic. When necessary,
Noyakuk has driven the snow machine across open water on rivers and across narrow
leads (less than two meters wide) that have opened in the harbor ice (Noyakuk pers.
comm. August 19, 2005). The reindeer typically balk at exposed ice, and Noyakuk has
had to look for areas where river, slough, or lake ice was covered by snow when driving
reindeer (Noyakuk pers. comm. February 5, 2005).
Break-up, or the degradation of harbor and river ice each spring, has generally
been a faster process than freeze-up in fall (Noyakuk pers. comm. April 9, 2004). The
break-up process has been prolonged with cloudy weather, and hastened by rain
(Noyakuk pers. comm. May 10, 2004). Inland river ice has typically melted before

69
Grantley Harbor, and Noyakuk’s winter herding season usually ended once these rivers
and streams opened. Noyakuk stated that break-up typically began after the start of the
calving season and continued into early June. In most years he was able to travel to the
herd and monitor for the presence of bears or wolves during calving (Noyakuk pers.
comm. July 7, 2004). Overflow (or water that has flowed from upstream or melted on the
ice surface) has been typical on most ice surfaces in spring. Noyakuk has limited
traveling over overflow water more than four inches (~10 cm) deep on Grantley Harbor
and twelve inches (~30 cm) deep on the rivers, but he has skimmed his snowmachine
over short stretches of open water (Noyakuk pers. comm. February 5, 2005).
“Good” harbor and river ice conditions have usually indicated that waterways
were solidly frozen, with a minimal incidence of hollow or glare ice where reindeer were
driven. Noyakuk considered the ice conditions to be “minimal” to “poor” where the ice
was not fully formed or was partly deteriorated, and/or where there was extensive amount
of overflow, open water, or glare ice.
4.1.3.b Visibility
Once the waterways were frozen, visibility became the most important factor
when evaluating daily conditions for travel. Several weather conditions have reduced
visibility to the point of being life-threatening (Noyakuk pers. comm. March 21 2004,
February 5, 2005, March 1, 2005):
• “White-out” conditions due to a snowstorm, blizzard, or blowing snow
conditions (i.e., when high speed winds lift loose snow into the air, as in a
ground blizzard);

70
• “Flat light” conditions due to certain cloud and lighting combinations that
preclude the ability to accurately perceive contrast and vertical relief on
the landscape; and
• Fog (especially prevalent in the fall and spring).
Reduced visibility has been a serious concern of Noyakuk’s, especially when traveling in
steep or unfamiliar terrain. Poor visibility has frequently been a cause in the region for
missing persons’ incidents, accidental injuries, and fatalities (Noyakuk pers. comm.
February 17, 2005). In his early years of herding, Noyakuk injured his neck when he
drove his snowmachine over an eight-foot precipice in poor visibility (Noyakuk pers.
comm. February 17, 2005). He has since increased his personal visibility threshold to
three miles (~5 km). He stated that he has rarely traveled when there were four or more
morning hours of less than three miles visibility (Noyakuk pers. comm. February 5, 2005,
March 3, 2005, December 15, 2005). Noyakuk lowered this limit to two or more hours of
poor visibility in the morning in December and January when day length is short. On the
other hand, he has traveled where there was less than one-quarter mile visibility when he
was in the comfort zone with sufficient daylight, when caribou or predators were known
to be near the reindeer, when visibility became reduced on the trip home, and/or when the
visibility was forecasted to improve later in the day (Noyakuk pers. comm. February 5,
2005, March 15, 2005, December 15, 2005).
Noyakuk considered visibility of less than three miles as “minimal”, or even
“poor”, depending upon where he was traveling and the tasks at hand (Noyakuk pers.
comm. February 5, 2005). He stated that extremely poor visibility may also be defined as

71
situations when a GPS was needed to travel a familiar route (Noyakuk pers. comm.
February 5, 2005, March 30, 2005) such as one occasion when blowing snow conditions
forced him to use his GPS to cross Grantley Harbor to Teller (Noyakuk, pers. comm.
April 23, 2004). Noyakuk has regularly listened to visibility warnings issued on the
radio, but the presence of fog on the Mayuguk hills (Figure 3) was also noted as an
indicator for reduced visibility on the range (Noyakuk pers. comm. March 15, 2005).
4.1.3.c Snow and other trail conditions
Snow conditions were discussed at length during a February 5, 2005 interview;
information from other conversations is cited as well. Inadequate snow conditions have
slowed travel and occasionally caused damage to the snowmachine. Noyakuk has
preferred at least three inches (~8 cm) of packed snow covering the cottongrass
(Eriophorum vaginatum) tussocks (about 23 to 38 cm total snow depth depending on
tussock height and density). This amount of snow was usually not well-established until
mid-December, and for some areas of the range, such as wind-swept ridge tops, snow
was occasionally not established all winter (Figure 10). Noyakuk has traveled by
snowmachine on bare tundra, including in the summer for the handlings, or when he has
an expendable snowmachine (Noyakuk pers. comm. March 30, 2005).

72
Figure 10. Wind-swept hill and HOBO weather station.
Travel has also been slowed by loose, soft snow; by sun- or wind-glazed snow
surfaces; or by snow drifts that were severely wind-hardened. Sun- or wind-glazed snow
with a hard, slick surface has been problematic for snowmachine travel and for reindeer
mobility alike (Figure 11). High winds (as well as rain, uneven evaporation, or uneven
melting) have often caused the formation of hardened snow drifts, furrows, or waves in
many areas of Noyakuk’s range and on the trails between Teller and the range. Noyakuk
labeled these conditions “wind waves”; the technical name is sastrugi (Ryan and
Crissman 1990). He described the slow and uncomfortable sensation of traveling by
snowmachine over “wind waves” as “rodeo riding” (Figure 12).

73
Figure 11. Sun-glazed snow and HOBO weather station at Teller airport.

74
Figure 12. Wind-hardened snow drifts, or sastrugi. Noyakuk refers to this snow formation as “wind waves”.
Hard snow surfaces have been known to damage the snowmachine as the track
lining must be continuously lubricated by loose snow. Without this lubrication, the lining
can melt from overheating, which prevents the track from turning smoothly. When
Noyakuk has driven reindeer on a hardened snow surface, the reindeer could often outrun
the snowmachine that had to be driven slowly over sastrugi and/or stopped to cool down
(Noyakuk pers. comm. March 21, 2004).
Very deep and soft snow (greater than three feet or ~91 cm in depth) has also
presented a challenge, especially when towing a sled. Deep, soft snow has typically
accumulated in riparian areas and where there are large thickets of willows (Salix spp.)

75
on Noyakuk’s range (Figure 13). Noyakuk has often had the snowmachine become stuck
in the snow or entangled in low-lying branches in these areas. Moreover, reindeer, like
other ungulates, usually avoid areas of deep snow (Ihl and Klein 2001, Pruitt 1959),
because of the increase in energy expenditure required for movement and digging for
forage (Fancy and White 1985). Snow conditions typically have been softer and heavier
with greater water content in April (Noyakuk pers. comm. February 5, 2005). Soft snow
conditions in spring typically increased the likelihood of getting the snowmachine stuck,
required greater gas consumption, and compounded the process of driving the herd,
especially once neonate calves were born.
Figure 13. Soft, deep snow associated with willows (Salix spp.) in a riparian area.

76
Noyakuk described packed snow, with a thin surface of loose snow to cushion
tussocks, as constituting “good” snow conditions. “Minimal” snow conditions were
conditions where hard, drifted, or very deep and soft snow was interspersed with patches
of more favorable snow conditions. Travel was generally slower on these conditions but,
did not usually result in damage to the snowmachine. “Poor” snow conditions existed
where hard, drifted, or very soft and deep snow was not mixed with patches of more
favorable snow conditions. These conditions tended to create especially tiring travel
conditions for the rider, with a risk for damage to the snowmachine. Poorer trail and
snow conditions were less of a concern when Noyakuk had a larger herd; antler prices
were high; and he could buy a new snowmachine every year. He has not bought a new
snowmachine since his largest losses to caribou in 2000.
4.1.3.d Wind and air temperature
Wind speed, wind direction, and temperature have had less influence on herding
decisions than the weather and environmental conditions described above. However,
when in combination with other inclement weather or trail conditions, high wind speed
and low air temperature have hampered herding activities. Noyakuk has been more
affected by high wind speed if there was also loose snow on the ground; if the wind was
associated with blizzard conditions; or if the windchill temperature (WCT) was below -
30°F (~ -34°C) (Noyakuk pers. comm. March 3, 2005). For example, if there were 20
mph (~9 m/s) winds and loose snow on the ground, Noyakuk would be less likely to
travel due to the high potential for blowing snow, but, 20 mph winds were a minor
consideration when the snow surface was well-packed (Noyakuk pers. comm. November

77
11, 2004, March 3, 2005). Noyakuk usually listened to the radio for blizzard or windchill
warnings, especially because he expected winter temperatures to be much colder on his
range than in Teller (Noyakuk pers. comm. November 24, 2004).
Local differences in wind direction and wind speed may have affected travel
between Noyakuk’s home and his range. Noyakuk reported that north winds were
usually strongest in Teller and the Mayuguk hills. North winds at the corral tended to be
milder, but south and east winds could be fierce at the corral because these winds were
funneled through the Kigluaik Mountains (Noyakuk pers. comm. February 23, 2004).
South winds were usually prevalent in March and April with the coming of spring
(Noyakuk pers. comm. February 23, 2004). Noyakuk stated that wind direction and
speed affected reindeer behavior in the summer as reindeer tended to move upwind to
avoid insect harassment. Wind speed and direction seemed to affect reindeer less in
winter than in summer unless the visibility was poor, at which point reindeer have been
observed to move upwind if frightened (Noyakuk pers. comm. February 5, 2005).
Noyakuk’s ideal working temperatures in the winter have been between -20°F (-
28°C) and 10°F (-12°C) (Noyakuk pers. comm. February 23, 2004, March 3, 2005).
When asked in the structured phone survey, he said he had a minimum temperature (or
WCT) threshold at -30°F (-34°C) for traveling by snowmachine, -20°F (-28°C) for
moving reindeer, and -10°F (-23°C) for slaughtering in the field (Noyakuk pers. comm.
March 3, 2005). However, he has traveled, moved reindeer, and slaughtered at
temperatures lower than these when he was already on the range and the temperatures
dropped, or in urgent circumstances, such as when caribou or predators were close to the

78
reindeer. Noyakuk more closely heeded windchill warnings than forecasts for low
temperatures (Noyakuk pers. comm. March 3, 2005). Prolonged spells of warm
temperatures mid-winter have been a concern because these conditions have frequently
resulted in glazed and hardened snow, overflow, open water, and early snowmelt
(Noyakuk pers. comm. February 5, 2005). Although the effects of air temperature on
herding have been indirect in winter, temperature has been a concern when corralling for
summer handlings. Noyakuk has often driven the reindeer to the corral in the evening so
they would not overheat during the warm summer afternoons typical on his inland range
(Noyakuk pers. comm. February 5, 2005).
4.2 Relating herding decisions to weather observations and weather station data
4.2.1.a February 14 to May 29, 2004: Chronological account
This period covered several herding seasons in 2004: slaughter/handlings, moving
of the herd to the calving grounds and calving, and break-up (Table 5). The HOBO
stations were deployed on February 14, and snow depth transects were conducted at each
station on February 15. Figure 14 shows workday average visibility in Nome from
February 15 to May 29, 2004. Figure 15 shows workday average data for (a) wind speed,
(b) temperature, and (c) windchill temperature (WCT) at the HOBO, Kougarok, Teller
airport and Nome weather stations between February 15 and May 29, 2004. Noyakuk’s
travel dates are also indicated on each graph. Between February 15 and April 7,
Noyakuk traveled on his range at least twelve days. There may have been other herding
trips during this time period that were not discussed during the phone interviews.

79 79
Figure 14. Visibility in Nome, February 15 to May 29, 2004. Workday averages are shown. These averages were produced from hourly observations recorded by personnel at the NWS station in Nome and provided by the Alaska Climate Data Center. Visibility greater than 16 km was recorded as 16 km. Dates when it was known that Noyakuk traveled onto his range or when he could not travel due to poor weather or trail conditions are indicated by the triangles.

80
Figure 15. Weather station data, February 15 to May 29, 2004. Average workday data for (a) wind speed, (b) air temperature, and (c) windchill temperature (WCT) are plotted by station (Mayuguk, Agiapuk-Willows, Corral, and North of Corral data until May 4 only; and WCT at Kougarok-1 until April 29 only). Dates when it was known that Noyakuk traveled onto his range or when he could not travel due to poor weather or trail conditions are indicated by the triangles.
Mayuguk Agiapuk-Willows Corral North of Corral
Teller Airport Kougarok-1 Kougarok-2 Nome
Travel on range (good or minimal conditions) No travel (poor conditions)
WEATHER STATIONS
Key for all graphs
TRAVEL / NO TRAVEL DAYS
WC
T (°
C)

81
Above-freezing temperatures April 8-19, 2004 (Figure 15b) resulted in an earlier
than expected break-up. This temperature trend was recorded at all stations except
Kougarok-2, and it corresponded with the rapid decrease of snow depth measured by the
NWS in Nome (Figure 16a). Noyakuk traveled to his range two times after April 8, but
stated that travel was “very difficult” due to deteriorating snow conditions and open
creeks on his range. He considered this the start of break-up, and I did not include trip
dates after April 8 when analyzing weather data for winter 2004. Noyakuk was not able
to travel to his range during the 2004 calving season, which he predicted started in mid-
April. He did not travel onto his range again until May 29 when he, his nephew Eli
Dickson, Karl Olson, and I took boats to his corral. There was still ice on the basin: we
waited several hours for a channel to open and then had to pull the boat over the ice in
some places. We removed the weather stations on May 30.
The locations of the satellite-collared reindeer differed between late winter
(February 15-April 7, 2004 kernel, n=32 locations), when Noyakuk maintained his herd
in the Mayuguk hills west of the Agiapuk River, and break-up (April 8-May 29, 2004
kernel, n=43 locations), when he was not able to access his range (Figure 17a). The
greater distribution of collar locations during break-up may have been due to more
extensive movement by the reindeer seeking emerging forage (Kuropat 1984, Skogland
1984) or avoiding predators (Bergerud et al. 1990) during calving, but it may also be a
result of the lack of herding.
Noyakuk did not consider caribou to be a threat during the winter of 2003-2004.
95% home range kernels produced from the locations of satellite-collared caribou were

82
on the eastern edge of the Seward Peninsula between February 15 and April 27, 2004
(n=77 locations for the February 15-April 7, 2004 kernel; n=23 locations for the April 8-
27, 2004 kernel) (Figure 17b). Satellite caribou moved off the Seward Peninsula after
April 27, 2004.

83
Key for both graphs
First ice observed, Snake River, Nome Snake River ice safe for vehicles (2003-04) Snake River ice unsafe for vehicles
Nome snow depth Nome daily maximum temperature Nome daily minimum temperature Freezing (0°C)
Figure 16. Daily maximum and minimum temperature and snow depth in Nome, Alaska, winter 2003-04 and 2004-05. (a) October 1, 2003 to May 31, 2004. (b) October 1, 2004 to May 31, 2005. Data were recorded by the National Weather Service (NWS) in Nome and provided by the Alaska Climate Data Center. Dates when NWS personnel first observed ice on the Snake River (Oct 20, 2003 and Oct 31, 2004), and when the ice became safe for vehicle (snowmachine) travel (Dec 2, 2003, not recorded in 2004), are shown to mark the freeze-up process. Dates when ice on the Snake River were observed to be unsafe for vehicle travel (Apr 19, 2004 and Apr 27, 2005) are shown as an approximate date when break-up may have affected herding by snowmachine. These dates were provided by the NWS in Nome and the Alaska River Forecast Center.

84
Figure 17. Locations of satellite-collared reindeer and caribou, February 15 to May 29, 2004. Map (a) shows individual locations and 95% home range kernels of satellite-collared reindeer in Noyakuk’s herd by season (late winter February 15-April 7, 2004 and break-up, April 8-May 29, 2004). Map (b) also shows these reindeer kernels and 95% home range kernels of satellite-collared caribou from the WAH for the same seasons until April 27, when all satellite-collared caribou moved out of the region.
%
%
%
%
#
#
#
#
# ##
##
# #
#
##
##
#
#
#
#
#
#
##
##
##
#
#
#
#
#
#
#
#
#
#
#
#
#
##
##
#
#
#
#
#
##
#
#
###
###
##
##
#
#
#
#
#
#
##
# #
Agiapuk-Willows North of Corral
Corral
Mayuguk
AGIAPU
K RIVER
IMURUK BASIN
KEY FOR BOTH MAPS
Reindeer range boundaries
95% home range kernel for caribou April 8 to April 27, 2004
95% Home range kernel for caribou February 15 to April 7, 2004
Alternate Mayuguk-corral trail
Teller-corral Trail
% HOBO weather stations
95% home range kernel for reindeer April 8 to May 29, 2004
95% home range kernel for reindeer February 15 to April 7, 2004
# Satellite-collared reindeer locations April 8 to May 29, 2004
# Satellite-collared reindeer locations February 15 to April 7, 2004
50 0 50 100 Kilometers
2 0 2 4 6 8 10 Kilometers
N
EW
S
(a)
(b)

85
4.2.1.b February 14 to May 29, 2004: Ratings results
Noyakuk rated the weather conditions as “good” for five of the twelve known
days that he traveled on the range between February 15 and April 7, 2004. He rated two
trip days with “minimal” weather conditions due to falling snow and high wind speed.
He rated five days as “poor” due to blizzard, blowing snow, and/or severe windchill, or
forecasts for such conditions. Another two trip days were not rated. There were 39 other
days when Noyakuk may have traveled but which were not discussed during the phone
interviews. Included by default in the “not discussed” category were three trip days when
the exact dates of travel could not be confirmed. Table 7 summarizes Noyakuk’s
observations and station data between February 15 and April 7, 2004 for each of these
rating categories.
Noyakuk cited reduced visibility with falling or blowing snow as the most
common reason for “minimal” or “poor” ratings of weather. However, there were no
significant differences for workday average visibility in Nome between his “good” and
“poor” rated days. I did not have records that Noyakuk traveled on any of the seven days
between February 15 and April 7 when Nome had less than three miles visibility for four
or more “morning” hours (between 8:00 am and 1:00 pm). On March 20, the visibility
decreased due to blowing snow during the afternoon. This corresponded with reduced
visibility in Nome from March 20 to March 22 (Figure 14).

86
Table 7. Weather conditions for rated herding trips, February 15 to April 7, 2004.
Noyakuk's Rating of Weather
Conditions n* Noyakuk's Reason for
Rating Temperature
Range
Wind Speed Range
Windchill Temperature
(WCT) Range
Visibility Range (in
Nome)
Good 5
"Comfortable temperature"; Clear skies; Little wind
-27°C to -5°C 0-6m/s
-35°C to -9°C 8-16 km
Minimal 2
Snowing; Windy in Teller & at winter camp
(i.e., certain parts of range)
-21°C to -17°C 1-7m/s
-30°C to -20°C 15-16 km
Poor 5
Blizzard warning or advisory; Blowing snow; Low WCT
-22°C to -15°C 0-6m/s
-34°C to -15°C 13-16 km
Unrated 2
Weather conditions not discussed for those
dates. -22°C to
-7°C 1-2m/s -23°C to
-7°C 10-16 km
All other days** 39 N/A
-29°C to -1°C 0-9m/s
-43°C to -1°C 3-16 km
Temperature, wind speed, and WCT ranges are the minimum and maximum workday averages for each rating category recorded at the HOBO stations on Noyakuk’s range. Visibility ranges are the minimum and maximum workday averages for each rating category recorded by the NWS office in Nome. *n=number of days between February 15 and April 7, 2004 that Noyakuk gave the weather rating specified by the row heading. ** This category includes all days not discussed with Noyakuk (whether or not he traveled), and it includes three days when Noyakuk traveled but the date of travel could not be confirmed.
Workday averages for wind speed varied little between Noyakuk’s “good” and
“poor” rated days (p<.05), except at the Agiapuk-Willows station where wind speed was
higher on “poor” versus “good” rated days (p=.008), and at Kougarok-1, where wind
speed was higher on “good” versus “poor” rated days (p=.03) (Table 7 and Figure 18a).
March 24 was the only trip when Noyakuk stated that high wind speed was the sole
reason for a “minimal” or “poor” weather rating.

87
-30 -25 -20 -15 -10
-5 0
Mayuguk Agiapuk-Willows
Corral North ofCorral
TellerAirport
Kougarok-1
Kougarok- 2
Nome
TEM
PER
ATU
RE
(°C
)
0
2
4
6
8
10
12
Mayuguk Agiapuk-Willows
Corral North ofCorral
TellerAirport
Kougarok-1
Kougarok-2
Nome
WIN
D S
PEED
(m/s
)(a)
(b)
-40
-35
-30
-25
-20
-15
-10
-5
0
Mayuguk Agiapuk-Willows
Corral North ofCorral
TellerAirport
Kougarok-1
Kougarok- 2
Nome
WC
T (°
C)
(c)
Good Poor
Good Poor
Good Poor
Figure 18. Workday average (a) wind speed, (b) temperature, and (c) windchill temperature (WCT) for Noyakuk's good and poor rated days, February 15 to April 7, 2004. Error bars are ± 1 S.D. Good n=5, poor n=5.

88
Daytime wind direction trends were more unidirectional and northerly on
“poor” versus “good” rated days at the Mayuguk, Agiapuk-Willows, North of the
Corral, and Kougarok-2 stations (Figure 19). There were also trends at most stations
for a higher proportion of northerly daytime winds in late winter (February 15 to April
7) than during break-up (April 8 to May 29), when wind direction tended to more
southerly or southeasterly, and/or more variable (Figure 20). However, I only
constructed wind roses for the HOBO stations for April 8-May 4, 2004 because at least
one of those stations fell due to ground thawing after that time.
Workday averages for temperature and windchill temperature (WCT) did not
differ significantly between the “good” and “poor” rating categories for each station
(Figures 18b and 18c). Workday average WCT dropped below Noyakuk’s threshold of -
30°F (-34°C) for trip days in both rating categories as well as on several days that we did
not discuss (Table 7). Noyakuk traveled to his range February 19 when the workday
average WCT was below -34°C at the Mayuguk, Teller airport, and Kougarok-1 stations
(Figure 15c), but he rated the weather conditions that day as “good” with “comfortable
working temperatures”.

89
Figure 19. Wind roses for Noyakuk’s good and poor rated days, February 15 to April 7, 2004. Note 60% wind rose boundary for poor days at Agiapuk. Calms are <0.5 m/s.
Calms 3.33%
Calms 1.67%
Calms 1.67%
Calms 31.67%
Calms 18.33%
Calms 21.67%
Corral - Good Corral - Poor
Agiapuk - Poor Agiapuk - Good
Mayuguk - Good Mayuguk - Poor
>= 10.5 8.5-10.5 6.5-8.5 4.5-6.5 2.5-4.5 0.5-2.5
Wind Speed Classes

90
North of Corral - Poor North of Corral - Good
Calms 25.00%
Calms 1.67%
Calms 10.00%
Calms 6.67%
Calms 0%
Calms 0%
Teller Airport - Good Teller Airport - Poor
Kougarok-1 - Good Kougarok-1 - Poor
Figure 19 (cont.). Wind roses for Noyakuk’s good and poor rated days, February 15 to April 7, 2004. Note 60% wind rose boundary for poor days at Agiapuk. Calms are <0.5 m/s.
>= 10.5 8.5-10.5 6.5-8.5 4.5-6.5 2.5-4.5 0.5-2.5
Wind Speed Classes

91
Nome - Good Nome - Poor
Calms 0%
Calms 0%
Calms 16.67%
Calms 35.71%
Kougarok-2 - Good Kougarok-2 - Poor
Figure 19 (cont.). Wind roses for Noyakuk’s good and poor rated days, February 15 to April 7, 2004. Note 60% wind rose boundary for poor days at Agiapuk. Calms are <0.5 m/s.
>= 10.5 8.5-10.5 6.5-8.5 4.5-6.5 2.5-4.5 0.5-2.5
Wind Speed Classes

92
Mayuguk 2/15-4/7/04
Agiapuk 2/15-4/7/04
Corral 2/15-4/7/04
Calms 4.25%
Calms 14.78%
Calms 16.19%
Calms 0.31%
Calms 1.58%
Mayuguk 4/8-5/4/04
Calms 3.09%
Agiapuk 4/8-5/4/04
Figure 20. Wind roses by season, February 15 to May 29, 2004. Hourly, daytime wind speed and wind direction data are shown for late winter (2/15-4/7/04, left column) and break-up (4/8-5/4/04, right column). Calm winds (calms) are <0.5 m/s.
Corral 4/8-5/4/04
>= 10.5 8.5-10.5 6.5-8.5 4.5-6.5 2.5-4.5 0.5-2.5
Wind Speed Classes

93
Calms 13.05%
North of Corral 2/15-4/7/04 North of Corral 4/8-5/4/04
Calms 0.31%
Calms 10.69%
Calms 10.62%
Calms 0% Calms
0%
Kougarok-1 2/15-4/7/2004 Kougarok-1 4/8-5/29/2004
Teller Airport 2/15-4/7/2004 Teller Airport 4/8-5/29/2004
Figure 20 (cont.). Wind roses by season, February 15 to May 29, 2004. Hourly, daytime wind speed and wind direction data are shown for late winter (2/15-4/7/04, left column) and break-up (4/8-5/4/04 for North of Corral and 4/8-5/29/04 for Teller and Kougarok-1, right column). Calm winds (calms) are <0.5 m/s.
>= 10.5 8.5-10.5 6.5-8.5 4.5-6.5 2.5-4.5 0.5-2.5
Wind Speed Classes (m/s)

94
Calms 0.31%
Calms 0.48%
Calms 21.09% Calms
1.62% Nome 2/15-4/7/2004 Nome 4/8-5/29/2004
Kougarok-2 4/8-5/29/2004 Kougarok-2 2/15-4/7/2004
Figure 20 (cont.). Wind roses by season, February 15 to May 29, 2004. Hourly, daytime wind speed and wind direction data are shown for late winter (2/15-4/7/04, left column) and break-up (4/8-5/29/04, right column). Calm winds (calms) are <0.5 m/s.
>= 10.5 8.5-10.5 6.5-8.5 4.5-6.5 2.5-4.5 0.5-2.5
Wind Speed Classes
Noyakuk did not rate the snow conditions as frequently as the weather between February
15 and April 7, 2004, but he mentioned the following trends. Frequent strong winds
throughout the 2003-04 winter created a snow surface that was as hard and drifted as the
previous winter (2002-03), when there was markedly lower snowfall (Noyakuk pers.
comm. March 20, 2004). A late February storm temporarily softened the snow

95
cover, but high winds in March recreated the “wind waves” or sastrugi characteristic of
that winter. The snow melted quickly when workday average air temperature was above
freezing April 8-19, 2004. The creeks on Noyakuk’s range were open with substantial
flow by April 15.
I conducted transects for snow depth at each station on February 15, 2004 and
repeated the transects on March 19-20, 2004, except at Agiapuk-Willows and an
abbreviated transect set of only 10 points at the station north of the corral. There were no
significant differences for mean snow depth between February and March at each station
(ANOVA, Scheffé, p < 0.05). The station north of the corral, which is on a small wind-
swept hill, had significantly less snow (10.3 cm ± 15.5 S.D., p < 0.05 for ANOVA,
Scheffé tests) than at the other stations on February 15 (Table 8). Snow depth recorded
in Nome by the NWS was 56 cm and 66 cm on February 15 and March 20, respectively.
The reduction of the snow base at Nome corresponded with the time (second week of
April) that Noyakuk noted for melt on his range (Figure 16a).
While conducting the snow transects March 19-20, 2004, Noyakuk rated the local
snow conditions at Mayuguk as “minimal” because the sastrugi slowed travel. However,
he stated that he considered the same conditions as “good” for driving reindeer because
he drives reindeer at slower speeds (10-15 mph or 16-24 km/hr) than he would normally
travel by snowmachine (~40 mph or 64 km/hr) (Noyakuk pers. comm. March 30, 2005).
He also rated snow conditions at an area near the Mayuguk station where he had driven
the reindeer on March 18. He considered the snow conditions “good” for driving
reindeer as the snow was soft enough to slow and control the reindeer but not deep
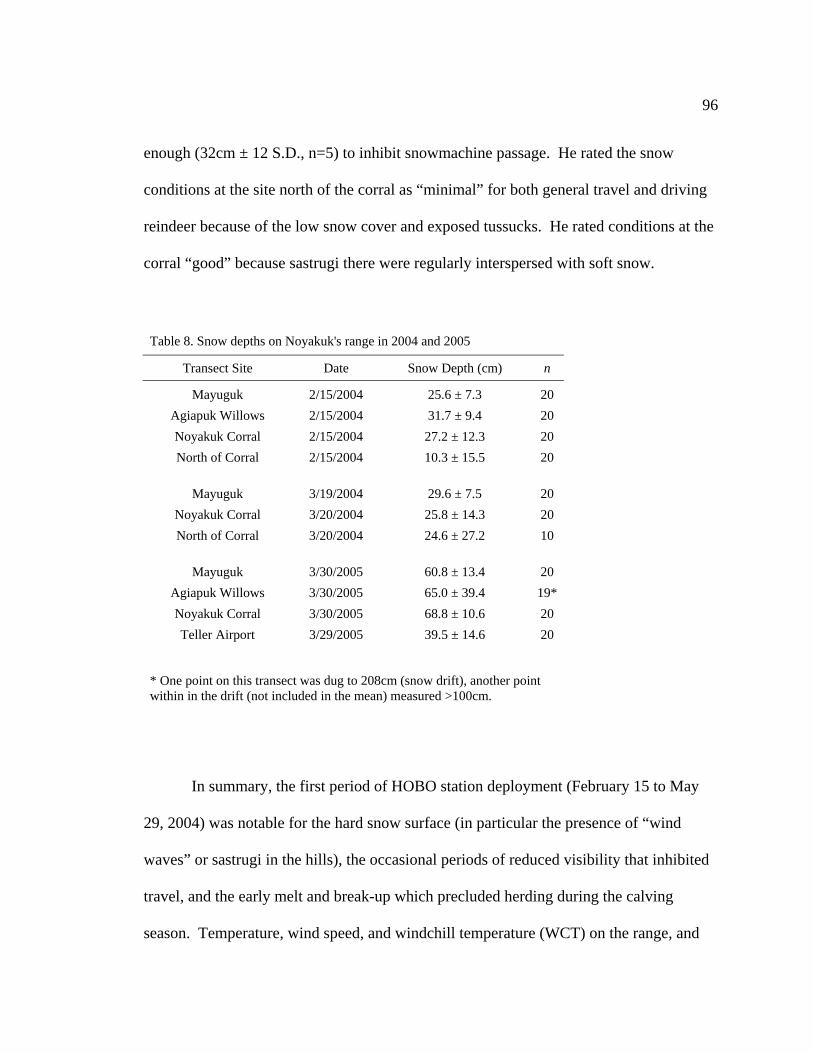
96
enough (32cm ± 12 S.D., n=5) to inhibit snowmachine passage. He rated the snow
conditions at the site north of the corral as “minimal” for both general travel and driving
reindeer because of the low snow cover and exposed tussucks. He rated conditions at the
corral “good” because sastrugi there were regularly interspersed with soft snow.
Table 8. Snow depths on Noyakuk's range in 2004 and 2005
Transect Site Date Snow Depth (cm) n
Mayuguk 2/15/2004 25.6 ± 7.3 20 Agiapuk Willows 2/15/2004 31.7 ± 9.4 20 Noyakuk Corral 2/15/2004 27.2 ± 12.3 20 North of Corral 2/15/2004 10.3 ± 15.5 20
Mayuguk 3/19/2004 29.6 ± 7.5 20
Noyakuk Corral 3/20/2004 25.8 ± 14.3 20 North of Corral 3/20/2004 24.6 ± 27.2 10
Mayuguk 3/30/2005 60.8 ± 13.4 20
Agiapuk Willows 3/30/2005 65.0 ± 39.4 19* Noyakuk Corral 3/30/2005 68.8 ± 10.6 20 Teller Airport 3/29/2005 39.5 ± 14.6 20
* One point on this transect was dug to 208cm (snow drift), another point within in the drift (not included in the mean) measured >100cm.
In summary, the first period of HOBO station deployment (February 15 to May
29, 2004) was notable for the hard snow surface (in particular the presence of “wind
waves” or sastrugi in the hills), the occasional periods of reduced visibility that inhibited
travel, and the early melt and break-up which precluded herding during the calving
season. Temperature, wind speed, and windchill temperature (WCT) on the range, and

97
visibility in Nome, indicated little to no difference between days rated by Noyakuk for
good or poor weather conditions. However, other variables, such as snow sastrugi and
the early break-up, more prominently affected herding decisions and Noyakuk’s rating of
travel conditions. The satellite-collared reindeer collar moved eastward and dispersed
more widely after break-up. The majority of WAH caribou did not winter on the Seward
Peninsula and were not a major consideration during this period for Noyakuk.
4.2.2.a October 1, 2004 to March 14, 2005: Chronological account
This period included freeze-up, early winter round-up, slaughter, and a handling
which occurred on March 13, 2005 (Table 5). There were no HOBO stations on
Noyakuk’s range during this period, but I analyzed weather data from the Nome and
Kougarok stations (Figures 21 and 22). On August 16, 2004 Noyakuk noted that
seasonal rains were earlier than in other years, and he predicted an early freeze-up for fall
2004. On a flight from Nome to Teller in early October, he observed that inland rivers,
sloughs and lakes were frozen. However, storms in mid- and late October broke up the
initial ice and caused flooding in Teller. It was not until November that there was at least
thin harbor ice again.
On November 7, 2004 Noyakuk traveled by snowmachine across Grantley Harbor
to check the ice thickness. On November 8 and 10 he traveled to the reindeer, which
were located between Mayuguk and the Agiapuk River. Harbor ice conditions were
extremely unstable November 12-24 due to warm and stormy weather. Although most of
Grantley Harbor was unfrozen and several local residents were still seal hunting by boat

98
in late November, Noyakuk was able to snowmachine on an ice bridge that had formed
between Four-mile Point and the north shore of Grantley Harbor (Noyakuk pers. comm.
November 24, 2004) (Figure 3). The bridge broke not long after, and Noyakuk delayed
all herding trips until early December. By this time, the satellite-collared reindeer were
scattered over 30 kilometers. When Noyakuk traveled to his range in December, the lack
of daylight and snow prevented him from reaching all groups of his reindeer.
Figure 21. Visibility in Nome, October 1, 2004 to March 14, 2005. Workday averages are shown. These averages were produced from hourly observations recorded by personnel at the NWS station in Nome and provided by the Alaska Climate Data Center. Visibility greater than 16 km was recorded as 16 km. Dates when it was known that Noyakuk traveled onto his range or when he could not travel due to poor weather or trail conditions are indicated by the triangles.

99
Key for all graphs
WC
T (°
C)
Figure 22. Weather station data, October 1, 2004 to March 14, 2005. Average workday data for (a) wind speed, (b) temperature, and (c) windchill temperature (WCT) are plotted by station. Dates when it was known that Noyakuk traveled onto his range, or when he could not travel due to poor weather or trail conditions, are indicated by the triangles.

100
Noyakuk worked construction in Teller for most of December 2004, and herding
was restricted to the weekends when it was frequently foggy. Noyakuk felt that the fog,
and the fact that there had been little human contact with the reindeer since June, caused
the reindeer to scatter away from the snowmachine. Noyakuk attempted to move the
reindeer in more inclement weather than he usually would because he was trying to corral
the reindeer for a meat study to be conducted by the Reindeer Research Program (RRP).
The slaughter planned in December 2004 for the meat study was ultimately cancelled due
to blizzard conditions. By mid-December, Noyakuk’s steer that was satellite-collared
began traveling northeast from Noyakuk’s range. The steer was presumed to be traveling
with about 50 other reindeer (mostly steers) following caribou that had been observed
north of Brevig Mission (Figure 23). Frequent storms in December and Noyakuk’s work
schedule limited opportunities to recover these reindeer.
Noyakuk’s construction job ended in January 2005, and he was able to access
what remained of his herd on January 9. By this time there was deeper snow than in most
preceding years. Noyakuk made multiple trips to the range in January, but he was not
able to find the satellite-collared steer. He became discouraged that there were not
adequate numbers of bulls and steers for the RRP meat study planned for March. He
considered discontinuing active herding and recommended in late January that I not re-
establish the HOBO weather stations on his range. In mid-February, however, both his
brother, Robert, and cousin, Simon Jack, confirmed that there were adequate animals for
the meat study. Noyakuk spent the remainder of February and early March moving the
herd closer to the corral and preparing the corral for the meat study. The herd was

101
handled, and 14 bulls and steers were slaughtered on March 12, 2005. I reestablished the
HOBO stations at the corral, Mayuguk, and the Teller airport March 12-14, 2005.
%U
#
#
#
#
#
#
#
# ## ##
##
#
###
#
#
#
##
##
#
##
#
# #
#
###
#
#
#
#
#
#
#
#
#
#
#
#
#
#
##
#
#
#
#
#
#
#
#
#
#
#
#
#
#
#
#
#
#
#
#
#
#
#
#
#
#
#
#
#
#
##
#
# #
#
##
#
#
#
#
##
#
#
#
#
##
#
##
#
##
#
##
#
##
#
#####
#
##
#
#
#
###
#
##
#
###
#
##
#
###
#
##
#
###
#
#
#
####
#
#
#
##
##
#
#
## #
####
###
###
### #
####
###
#
##
###
##
#
#
#
#
#
#
#
#
#
#
#
#
#
#
#
#### #
####
#
#############################################
11/11/04
11/5/04
11/27/05
12/14/04
12/24/04
12/26/04
12/30/04
1/9/05
1/4/05
1/2/05
1/16/05
12/6/04
2/11-4/1/04. Collar considereda mortality in March
Reindeer range boundariesNoyakuk's comfort zone95% home range kernel for collared caribou Jan 9-Feb 2895% home range kernel for collared caribou Dec 1-Jan 895% home range kernel for collared caribou Oct 1-Nov 30Caribou group observed here in December 2004
%U Noyakuk's corral# Satellite-collared female locations Nov 1, 2004-Apr 1, 2005
GIS polyline connecting steer locations by date# Satellite-collared steer locations Nov 1, 2004-Apr 1, 2005
MAP LEGEND
N
EW
S5 0 5 10 15 20 Kilometers
Figure 23. Movements of Noyakuk’s satellite-collared steer, November 1, 2004 to April 1, 2005. The steer traveled off-range in December 2004, presumably with caribou. Satellite collar locations for two female reindeer show greater fidelity to Noyakuk’s comfort zone. The locations of two satellite-collared caribou are reflected in the caribou kernels shown here, but these kernels were produced from the total 15 to 19 collared caribou spread across the Seward Peninsula (n=110-118 locations depending on the season). Satellite collar locations for caribou were not available after February 28, 2005.

102
Noyakuk’s satellite-collared, female reindeer (n=2 collars) moved extensively but
remained within his comfort zone from October 1, 2004 to March 14, 2005, despite little
herding contact until mid-February (Figure 24a). This illustrated the higher range fidelity
of reindeer that had not mixed with caribou in contrast to the movements of Noyakuk’s
satellite-collared steer (Figure 23). The locations of the satellite-collared females were
concentrated from December 1, 2004 to January 8, 2005 (n=16 locations), when there
were frequent storms (Figure 24a). Between January 9 and March 14, 2005, the collar
locations (n=21), and the 95% home range kernel produced from those locations, were
split geographically by date, coinciding with a change in Noyakuk’s herding effort.
Collar locations were on the eastern side of Imuruk Basin from January to early February
when Noyakuk infrequently visited the herd (Figure 24a). However, after he began to
more regularly move and work with the herd in mid-February, satellite-collared reindeer
locations became situated west of the Agiapuk River and closer to Teller (Figure 24a).
Kernels produced from the locations of satellite-collared caribou show use of the
northeastern portion of Noyakuk’s range between November 2004 and February 28, 2005
(Figures 23 and 24b). The caribou kernel for January 9 to February 28 overlapped with
the path taken by Noyakuk’s satellite-collared steer for the corresponding time (Figure
23). The locations of two satellite-collared caribou are reflected in the caribou kernels
shown in Figure 23, but these kernels were produced from a total 15 to 19 collared
caribou spread across the Seward Peninsula (n=110-118 locations depending on the
season, see section 3.5.2). In February 2005, there were a minimum of 75,000 caribou
reported west of the Buckland-Koyuk line (and thus, on the central Seward Peninsula)

103
and a minimum of 200,000 caribou reported in the Nulato Hills on the eastern edge of the
Seward Peninsula (Gorn and Dau unpublished report for RHA annual meeting 2005).
Caribou location data were not available after February 28, 2005.

104
Figure 24. Locations of satellite-collared reindeer and caribou, October 1, 2004 to March 14, 2005. Map (a) shows individual locations and 95% home range kernels of two satellite-collared females in Noyakuk’s herd, by herding season. Locations of the satellite-collared steer are not shown. Map (b) shows the reindeer kernels and 95% home range kernels of satellite-collared caribou from the WAH for the same seasons until February 28, 2005, after which location data were not available.
%
%
%
%
## ##
#
#
##
#
##
##
##
#
##
#
#
##
#
#
# #
##
### ##
#
##
#
#
#
#
#
#
#
#
#
#
## ## #
#
#
#
#Corral
Mayuguk
North of CorralAgiapuk-Willows
IMURUK BASIN
AGIAPU
K RIV
ER
%
#
#
#
HOBO weather stations95% Home range kernel for reindeer Jan 9-Mar 14, 200595% Home range kernel for reindeer Dec 1-Jan 8, 200595% Home range kernel for reindeer Oct 1-Nov 30, 2005Satellite-collared reindeer locations Jan 9-Mar 14, 2005Satellite-collared reindeer locations Dec 1-Jan 8, 2005Satellite-collared reindeer locations Oct 1-Nov 30, 2004 N
EW
S2 0 2 4 6 8 10 Kilometers
50 0 50 100 kmReindeer range boundaries
95% Home range kernel for caribou Jan 9-Feb 28, 2005
95% Home range kernel for caribou Dec 1, 2004-Jan 8, 2005
95% Home range kernel for caribou Oct 1-Nov 30, 2004
95% Home range kernel for reindeer Jan 9-Mar 14, 2005
95% Home range kernel for reindeer Dec 1, 2004-Jan 8, 2005
95% Home range kernel for reindeer Oct 1-Nov 30, 2004
(a)
(b)

105
4.2.2.b. December 1, 2004 to March 14, 2005: Ratings results
Few herding trips were conducted in October and November 2004 because of the
freeze-up process, and these trips were not rated for weather conditions. Between
December 1, 2004 and March 14, 2005, Noyakuk rated 11 trip days with “good” weather
conditions, four with “minimal” conditions, and 10 with “poor” conditions. Two days
were unrated, and four days had mixed ratings based on time of day. There were 73 days
“not discussed”. Table 9 summarizes Noyakuk’s observations and Kougorak and Nome
station data for each of these rating categories.
Table 9. Weather conditions for rated herding trips, December 1, 2004 to March 14, 2005. Noyakuk's Rating of Weather
Conditions n* Noyakuk's Reason
for Rating
Kougarok Temperature
Range
Kougarok Wind Speed
Range Kougarok
WCT Range
Nome Visibility
Range
Good 11
Good visibility, calm winds, comfortable
temperatures -25 to -13°C 1-10 m/s -37 to -20°C 7-16 km
Minimal 4
Visibility limited but travel not drastically
hindered -21 to -13°C 2-7 m/s -31 to -20°C 10-16 km
Poor 10
Poor visibility; cold temperatures, high
winds -34 to -6°C 1-14 m/s -42 to -14°C 5-16 km
Unrated 2
Weather conditions not discussed for
those dates. -18 to -13°C 2-7 m/s -29 to -17°C 15-16 km
Mixed rating 4
Visibility minimal for part of the day,
good otherwise -13 to -3°C 3-9 m/s -24 to -8°C 8-13 km Dates not discussed, including
unclear dates of travel** 73 N/A -36 to 0°C 0-14 m/s -48 to -6°C 1-16 km
*n=number of days that Noyakuk gave the general weather conditions rating in the row heading. ** This category includes all days not discussed with Noyakuk (whether or not he traveled) and includes days when Noyakuk traveled but the date of travel could not be confirmed.

106
All but four of the “minimal” and “poor” rated days were rated as such due to
reduced visibility. However, there were no significant differences for visibility in Nome
between days of “good”, “minimal” or “poor” ratings based on Kruskal-Wallis. Noyakuk
stated that visibility was consistently diminished on his range between December 1, 2004
and January 8, 2005; and his limited herding schedule increased the chances for “poor”
weather conditions on herding trips. Three of at least four planned herding trips were
shortened or cancelled due to poor visibility. In Nome, there were two or more daytime
hours of less than three miles (5 km) visibility for 19 days during this same period
(Figure 21). Visibility improved in Nome in late January, but diminished frequently in
mid-February and mid-March (Figure 21). These trends were similar to Noyakuk’s
observations for visibility on his range.
Although high wind speed was implicated with blowing snow, blizzard, and/or
low WCT for many “poor” rated days between December 1, 2004 and March 14, 2005,
average workday wind speeds did not differ between rating categories (Figure 25a).
Higher wind speeds at Nome, Kougarok-1, and Kougarok-2 during most of December
and the latter half of February corresponded with reduced visibility and increased
storminess in Nome and Noyakuk’s observations of generally poor weather conditions
(Figures 21 and 22). Between December 1, 2004 and March 14, 2005, daytime winds at
Kougarok-1 tended to be from the northwest, while winds at Kougarok-2 winds were
more northerly (Figure 26). Daytime wind direction varied little between the rating
categories but tended to be more variable on “poor” versus “good” or “minimal” rated
days at Kougarok-1 and Kougarok-2 (Figure 27).

107
(b)
-40-35-30-25-20-15-10
-50
Nome Kougarok-1 Kougarok-2
TEM
PER
ATU
RE
(°C
)
Good
M in
Poor
(a)
0
2
4
6
8
10
12
Nome Kougarok-1 Kougarok-2
WIN
D S
PEED
(m/s)
Good
M in
Poor
(c)
-40-35-30-25-20-15-10
-50
Nome Kougarok-1 Kougarok-2
WIN
DCH
ILL
(°C)
Good
M in
PoorWC
T (°
C)
Figure 25. Workday average (a) wind speed, (b) temperature, and (c) windchill temperature (WCT) for Noyakuk's good, minimal, and poor rated days, December 1, 2004 to March 14, 2005. Error bars are
± 1 S.D. Good n=11, minimal n=4, poor n=10.

108
Kougarok-1 10/1-11/30/04 Kougarok-1 12/1/04-1/8/05 Kougarok-1 1/9-3/14/05
Kougarok-2 12/1/04-1/8/05 Kougarok-2 1/9-3/14/05
Figure 26. Wind roses by season, October 15, 2004 to March 14, 2005. Hourly, daytime wind speed and direction data are shown for freeze-up (10/15-11/30/04, left column), early winter (12/1/04-1/8/05, middle column), and mid-winter (1/9-3/14/05, right column). Note 50% wind rose boundaries for Kougarok-1 1/9-3/14/05 and 35% boundaries for Kougarok-2 1/9-3/14/05. Calms are <0.5 m/s.
Calms 0.96%
Calms 5.13%
Calms 0.13%
Calms 0.38%
Calms 6.87%
Calms 7.10%
Kougarok-2 10/1-11/30/04
Calms 28.14%
Calms 9.87%
Calms 8.50%
Nome 10/15-11/30/04 Nome 12/1/04-1/8/05 Nome 1/9-3/14/05
>= 10.58.5-10.5 6.5-8.54.5-6.52.5-4.5 0.5-2.5 Wind Speed Classes (m/s)

109
Kougarok-1 - Good
Kougarok-2 - Good Kougarok-2 - Minimal Kougarok-2 - Poor
Nome - Good Nome - Minimal Nome - Poor
Calms 0%
Calms 0%
Calms 0%
Calms 0%
Calms 0%
Calms 0%
Calms 20.51%
Calms 34.78%
Calms 55.91%
Kougarok-1 - Minimal Kougarok-1 - Poor
>= 10.58.5-10.5 6.5-8.54.5-6.52.5-4.5 0.5-2.5 Wind Speed Classes (m/s)
Figure 27. Wind roses for Noyakuk’s good, minimal, and poor rated days, December 1, 2004 to March 14, 2005. Note 60% wind rose boundaries for Kougarok-1 and 2 “minimal” rated days. Calm winds (calms) are <0.5 m/s.

110
Workday average temperature and WCT approached or dropped below
Noyakuk’s threshold of -34°C several times between December 1, 2004 and March 14,
2005 (Figure 22b, c). Average workday temperature and WCT did not differ between
rating categories (Figure 25b, c). However, Noyakuk gave low WCT in Teller as the
reason for “poor” ratings for four days in February. Although Noyakuk did not report
any above-freezing events during this time period, elevated temperatures at Kougarok
and at Nome tended to correspond with periods of increased storminess and decreased
visibility (Figure 21).
Snow transects were not conducted during this period, but Noyakuk commented
on a generally deeper snow cover compared with previous winters. This is evident when
one compares the snow depth profile in Nome between 2003-04 and 2004-05 (Figure 16).
Early winter trips to the range were often hampered by unstable ice on Grantley Harbor,
or low snow on the range, but an “unusually” high amount of snow fell during several
storms in early December (Noyakuk pers. comm. January 8, 2005). “Wind waves” or
sastrugi developed on some areas of the range throughout the winter, and the harbor and
basin ice were snow-free due to high winds by late January. Frequent snowstorms
throughout the winter meant that Noyakuk’s travel was more commonly impeded in
2004-05 by getting the snowmachine stuck in deep, soft snow, than by the presence of
rough, windblown snow as in 2003-04.

111
In summary, the period from October 1, 2004 to March 14, 2005 was marked by a
prolonged freeze-up process into late November, as well as frequent storms in December
and February, and deeper snow overall than in winter 2003-04. During the first part of
this period, herding opportunities were reduced due to poor visibility, low windchill
temperature (WCT), and deep snow, as well as Noyakuk’s work schedule in December.
The late freeze-up and storms in December contributed to the loss of some reindeer
including one satellite-collared steer. He made few herding trips in January and early
February after losing the satellite-collared steer and presumably 50 additional reindeer.
By mid-February, Noyakuk had regained confidence about the number of steers and bulls
he had available for a meat study with the RRP, and he spent more time on the range
preparing for the study’s slaughter, which was conducted on March 12. Wind speed,
temperature, and WCT did not differ significantly between rating categories for herding
trips between December 1, 2004 and March 14, 2005. Two satellite-collared females in
the herd remained in Noyakuk’s comfort zone between October 2004 and March 2005.
Meanwhile, the satellite-collared steer moved off range in December to the area
encompassed by 95% home range kernels for collared caribou.
4.2.3.a March 15 to May 31, 2005: Chronological account
This period included moving the herd to the calving area, calving season, and
break-up (Table 5). HOBO stations were deployed March 12-14, 2005 at Noyakuk’s
corral, Mayuguk, and the Teller airport. A low pressure system with warm south winds
brought above-freezing temperatures and a snowstorm into the area and created whiteout

112
conditions and soft trails March 14 to 16. When RRP crew members traveled to Nome
on March 15 after the meat study slaughter, they required constant use of the GPS to
remain on the trail.
Noyakuk traveled at least 27 days between March 15 and May 1, 2005.
Visibility, wind speed, temperature, and windchill temperature (WCT) were variable
throughout this time (Figures 28 and 29). Weather and trail conditions improved after the
meat study slaughter, although blowing snow conditions March 20-21 made tracking the
reindeer more difficult. On March 21, a statewide, high wind warning was in effect, but
average workday winds were northeasterly at 3.6 m/s, 4.5 m/s, and 6.7 m/s at the corral,
Mayuguk, and Teller airport stations, respectively. Noyakuk and I traveled onto his
range on March 30 and 31 despite -27°C workday average temperatures to check on the
weather stations, conduct snow depth transects, and move the reindeer. Sastrugi were
pervasive from Mayuguk to the corral, although the snow surface was still soft and
smooth over Grantley Harbor, the Imuruk Basin and in riparian areas. Sastrugi were
widespread on Noyakuk’s range until the snow began to melt during the last week of
April.

113 113
Figure 28. Visibility in Nome, March 15 to May 31, 2005. Workday averages are shown. These averages were produced from hourly observations recorded by personnel at the NWS station in Nome and provided by the Alaska Climate Data Center. Visibility greater than 16 km was recorded as 16 km. Dates when it was known that Noyakuk traveled onto his range or when he could not travel due to poor weather or trail conditions are indicated by the triangles.
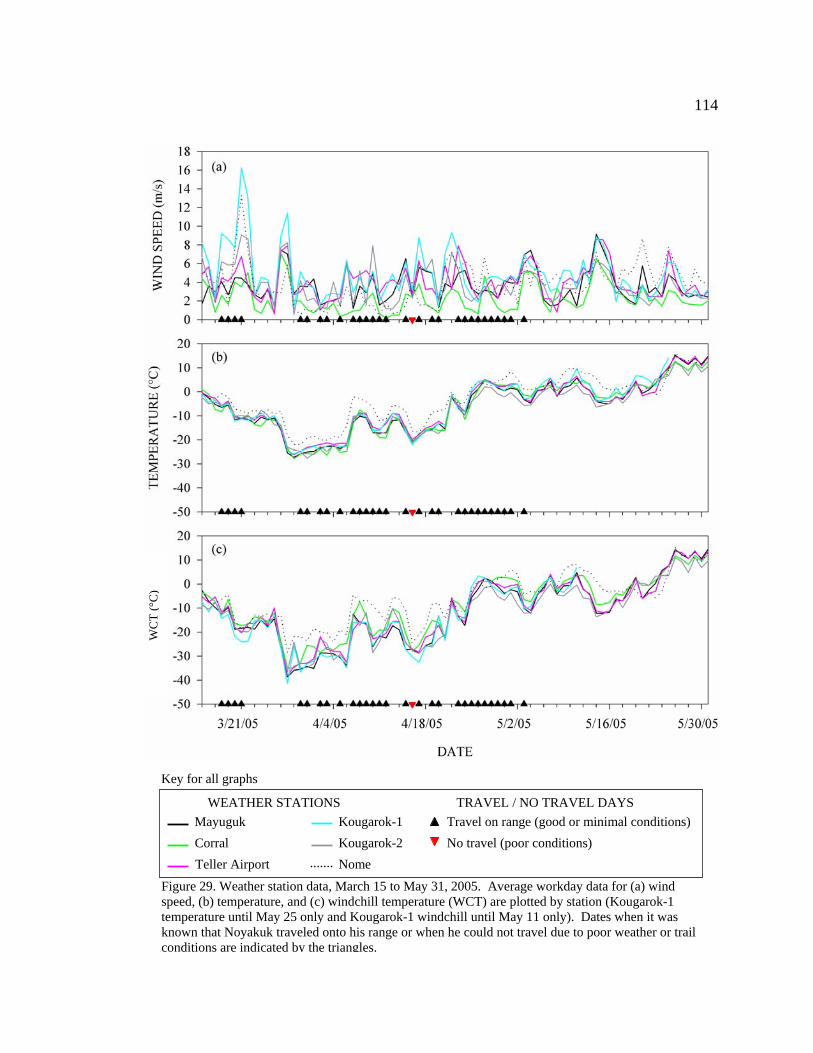
114
Mayuguk Corral Teller Airport
Kougarok-1 Kougarok-2 Nome
Travel on range (good or minimal conditions)No travel (poor conditions)
WEATHER STATIONS
Key for all graphs
TRAVEL / NO TRAVEL DAYS
WC
T (°
C)
Figure 29. Weather station data, March 15 to May 31, 2005. Average workday data for (a) wind speed, (b) temperature, and (c) windchill temperature (WCT) are plotted by station (Kougarok-1 temperature until May 25 only and Kougarok-1 windchill until May 11 only). Dates when it was known that Noyakuk traveled onto his range or when he could not travel due to poor weather or trail conditions are indicated by the triangles.

115
During April 2005, Noyakuk made trips to his range to check on new calves,
move the reindeer closer to the corral, survey for bears, and continue repairs to the corral
house. Noyakuk maintained a daily log of herding activities and his weather observations
during April. The log included temperature readings from a small thermometer at the
corral cabin, his estimates for wind speed and direction, and his observations about
visibility. However, the log did not include daily ratings for weather or snow conditions.
Noyakuk saw the first reindeer calf on April 15, 2005 and four more by April 24.
He estimated that there were approximately 50 calves on May 1 and predicted that more
would be born later in May. Noyakuk had a handling on July 6, 2005, and 121 females,
44 calves, and 181 total reindeer were included in the RHA tally. The calf:cow ratio was
37%. The July tally number for calves did not reflect the number of calves that Noyakuk
observed in April 2005 plus what he predicted would be born after May 1. However,
handling numbers have been shown to represent only 80-85% of the total herd size,
according to mark and recapture studies conducted by the Reindeer Research Program
(G. Finstad, pers. comm.). The entire herd may not have been located prior to the
handling, and some reindeer escape prior to and during most handlings.
Noyakuk reported the start of a “spring-like” warming trend on April 19, 2005.
After April 24, melting snow and ice on inland creeks, as well as the presence of less-
mobile newborn calves, noticeably slowed travel when he tried to move the reindeer.
After several instances on May 1 when the snowmachine got stuck in soft snow and open
creeks, Noyakuk decided to discontinue snowmachine travel and wait for boating season.

116
The harbor was fully open for boat travel by June 1. I removed the HOBO stations by
boat and by foot on June 11.
The locations of satellite-collared reindeer between March 15 and May 31, 2005
are shown in Figure 30. As in 2004, the locations of Noyakuk’s satellite-collared
reindeer shifted from the Mayuguk hills during late winter/spring (March 15- May 1) to
the flat areas north of the corral during break-up (May 1-31). This shift may have been a
reflection of Noyakuk’s repeated attempts in late April to bring the herd to the area north
of the corral. This shift may also reflect natural tendency by the reindeer to calve in this
area, as in 2004, when Noyakuk could not move them there himself following the early
break-up. Caribou location data were not available for this time period.

117
#
##
#
#
#
#
#
#
#
#
#
#
#
# #
#
#
#
#
####
#
#
#
#
#
#
##
#
#
#
##
##
#
# ##
%
%
%
%Corral
Mayuguk
North of CorralAgiapuk-Willows
AGIAPUK RIV
ER
IMURUK BASIN N
EW
S
95% Home range kernel for reindeer May 2-May 31, 2005
95% Home range kernel for reindeer Mar 15-May 1, 2005
Satellite-collared reindeer locations# March 15 - May 1, 2005# May 2 - May 31, 2005
2 0 2 4 6 8 10 Kilometers
% HOBO weather stations
Figure 30. Locations of Noyakuk’s satellite-collared reindeer, March 15 to May 31, 2005. Outlying points date to the beginning or end of the specified time periods. Caribou collar location data were not available.
4.2.3.b March 15 to May 31, 2005: Ratings results
Comparisons between rating categories are spurious for the period between March
15 and May 31, 2005 because the “good” rated days were concentrated in March, there
were no “minimal” and one “poor” rated day, and the 19 unrated days were all in April,

118
as the weather warmed for break-up. I only conducted two phone interviews in April and
was not able to ask for ratings of all trips in April. Additionally Noyakuk did not record
ratings for trip weather conditions in his herding log.
Despite the inability to compare weather data between trip dates for March 15 to
May 31, 2005, some details are worth noting for this period. April 16 was the only
“poor” rated day, and Noyakuk did not travel, citing low air temperature as the reason.
However, this rating was complicated by the fact that the trip was intended to be a family
trip, and Noyakuk did not want to expose his 5-year-old niece to the cold. Average
workday temperatures were -20°C ± 1°C and average workday WCT was -27°C at all
HOBO stations, and there was ice fog over Grantley Harbor. For a trip on April 17
Noyakuk rated the weather “minimal” in the morning due to ice fog between Teller and
Mayuguk, “good” in the afternoon for driving reindeer north of Imuruk Basin, but “poor”
on the return trip to Teller due to blowing snow. The average workday WCT at the
HOBO stations was -28°C on April 17, and Noyakuk reported receiving frostbite on the
trip home. The wide range of air temperatures in April preceded break-up in early May.
Noyakuk noted drifting or blowing snow for the three windiest days in April, but he did
not indicate that visibility was severely reduced by these conditions.
Daytime wind direction shifted between the late winter (March 15 to May 1) and
break-up (May 2 to May 31) at the Teller Airport, corral and Nome stations, but these
shifts were not similar among stations (Figure 31). Daytime wind direction at the
Mayuguk and Kougarok stations varied little between the late winter and break-up.

119
Teller Airport 3/15-5/1/05 Teller Airport 5/2-5/31/05
Mayuguk 3/15-5/1/05 Mayuguk 5/2-5/31/05
Corral 3/15-5/1/05 Corral 5/2-5/31/05
Figure 31. Wind roses by season, March 15 to May 31, 2005. Hourly, daytime wind speed and wind direction data are shown for late winter (3/15-5/1/05, left column) and break-up (5/2-5/31/05, right column). Note 35% wind rose boundaries for Mayuguk, both time periods. Calm winds (calms) are <0.5 m/s.
Calms 3.06%
Calms 3.99%
Calms 2.60%
Calms 4.79%
Calms 15.45%
Calms 0.56%
>= 10.5 8.5-10.5 6.5-8.5 4.5-6.5 2.5-4.5 0.5-2.5 Wind Speed Classes (m/s)

120
Kougarok-1 3/15-5/1/05 Kougarok-1 5/2-5/31/05
Calms 0%
Calms 0.17%
Kougarok-2 3/15-5/1/05 Kougarok-2 5/2-5/31/05
Calms 2.95%
Calms 1.11%
Nome 3/15-5/1/05 Nome 5/2-5/31/05
Calms 22.52%
Calms 3.07%
>= 10.5 8.5-10.5 6.5-8.5 4.5-6.5 2.5-4.5 0.5-2.5 Wind Speed Classes (m/s)
Figure 31 (cont.). Wind roses by season between March 15 and May 31, 2005. Hourly, daytime wind speed and wind direction data are shown for late winter (3/15-5/1/05, left column) and break-up (5/2-5/31/05, right column). Note 35% wind rose boundaries for Mayuguk, both time periods. Calm winds (calms) are <0.5 m/s.

121
Snow depth transects were conducted on March 29, 2005 at the Teller airport and
on March 30, 2005 at Mayuguk, Noyakuk’s corral, and the 2004 Agiapuk-Willows site.
Results from ANOVA with Scheffé multiple comparison tests showed that average snow
depth was significantly greater (p < 0.05) in March 2005 than in March 2004 at
Mayuguk, the corral, and Agiapuk-Willows (Table 8). Average snow depth at the Teller
airport was significantly less (ANOVA, Scheffé, p < 0.05) than at the other stations, but
this was not due to snowfall between March 29 and 30. One transect point fell on a large
drift at Agiapuk-Willows where snow depth was 208 cm, but the removal of this transect
point did not alter the ANOVA with Scheffé test results for comparisons between years
or among stations.
While conducting transects at the Agiapuk-Willows site, Noyakuk’s
snowmachine and sled became stuck. This was an area that herders and reindeer would
typically both avoid due to the presence of thick willows and deep snow. Noyakuk
detached the sled, rolled the snowmachine onto its side, packed the snow down beneath
the snowmachine, righted and restarted it, and approached and reattached the sled from
another angle (with the snowmachine facing downhill). Deep, soft snow is not always
avoidable, and sled use, while adding to the likelihood of becoming stuck in any snow
conditions, is common for hauling fuel, gear and firewood to and from the corral, and for
transporting reindeer carcasses from the range to Teller. Whereas the deeper snow in
2005 provided better trail conditions during mid-winter, by April, the deep snow became
soft and wet with spring warming. The snowmachine was often stuck while Noyakuk
waited on neonate calves to move the herd to the corral.

122
In summary, the period from March 15 to May 31, 2005 was marked by warming
temperatures and deteriorating snow conditions as break-up progressed in May. Noyakuk
traveled to his range and herd at least 28 days prior to break-up, but comparisons between
weather rating categories are dubious due to the concentration of “good” rated days in
March, the high number of unrated days in April, and the lack of “poor” and “minimal”
rated days. Noyakuk made many trips to monitor the herd during the first few weeks of
the calving season unlike the previous spring. The locations of satellite-collared reindeer
shifted from the west to the eastern side of the Agiapuk River between the late
winter/spring (March 15-May 1) and break-up (May 2-May 31).
123
Chapter 5 – DISCUSSION
5.1 Weather and other environmental impacts to winter herd management in 2004
and 2005
The case study involved interdisciplinary methods conducted concurrently. I
interviewed Noyakuk about general weather implications for herding and asked for his
weekly observations and ratings of weather and trail conditions in late winter and spring
2004 and throughout the winter of 2004-05. At the same time, I collected temperature,
wind speed, and wind direction data at weather stations on his range. Prior to the
interviews, I hypothesized that inclement weather would limit herding activities, and that
the weather station data would reflect this (i.e., days given a “poor” weather conditions
rating would have lower air temperature, lower windchill temperature [WCT], and/or
higher wind speed than on “good” days). However, temperature, wind speed, WCT, and
wind direction did not differ significantly among good, minimal, or poor rated days.
Moreover, Noyakuk discussed other weather variables in the interviews that he
considered to be more critical for herding than temperature and wind alone.
The most limiting weather or environmental condition for winter herding has been
the absence of stable ice on Grantley Harbor, Imuruk Basin, and the rivers and creeks on
Noyakuk’s range. Reduced visibility and certain snow conditions (to a lesser degree)
have been generally inhibitive as well. Noyakuk has traveled when there was reduced
visibility or difficult snow conditions, depending upon the location of the herd, the work
to be done, the terrain to be traveled, and the concurrent weather conditions. The impacts

124
of specific weather and environmental conditions have been summarized below in regard
to the study period and Noyakuk’s past herding experiences.
5.1.1 Timing of freeze-up and break-up
The timing and duration of the freeze-up and break-up processes has strongly
affected Noyakuk’s ability to access his herd and implement planned herding activities.
Noyakuk stated that, since at least fall 2000, the ice on Grantley Harbor has not been safe
for snowmachine travel until December versus mid-November in previous years
(Noyakuk pers. comm. March 3, 2005). Moreover the freeze-up process corresponded
with or followed the influx of migrating caribou in 2000, 2001 and 2004 rather than
preceding it, as preferred by herders. Caribou reached Noyakuk’s range as early as the
first week of October in 1996 and 2000 (Dau 2003; Bente 1997 and K. Persons 2001
reports, as referenced in Finstad et al. in press). In recent years, Noyakuk has used
refugia shared with herder Leonard Olanna of Brevig Mission to keep his reindeer away
from the path of caribou. This system has aided in herd retention (Oleson 2005), but
weather and other environmental conditions may limit Noyakuk’s ability to move his
reindeer to this area following the fall dispersal of reindeer for rut.
The timing of break-up and melt has varied each spring, but there has been some
evidence for earlier trends since 1970 throughout the Arctic (Bamzai 2003, Myneni et al.
1997, Stone et al. 2002, Walsh et al. 2005a). Rick Thoman of the Fairbanks National
Weather Service found that the onset in Nome of 100 thawing-degree-days (a proxy for
break-up conditions) occurred on average at least one week earlier between 1977 and

125
2004, than between 1947 and 1977 (unpublished data). On the other hand, break-up has
occasionally occurred “later than expected” in recent years, as in 2001. There has been
little directional change in the date of observed break-up of the Snake River in Nome
between 1949 and 2005 (Alaska River Forecast Center), but the record is incomplete.
There is little doubt, however, that break-up was exceptionally early in the region in
spring 2004. Noyakuk was not able to travel to his range from April 15 (last
snowmachine trip that winter) to May 29 (first boat trip that summer). He did not see that
year’s calves until after May 29, nearly six weeks after calving started. The 2004 break-
up was two weeks earlier than the 50-year average based on the advent of 100 thawing-
degree-days in Nome and break-up observations of the Snake River (data provided by
Rick Thoman, the Nome NWS office, and the Alaska River Forecast Center).
In 2005, Noyakuk’s last trip to the range by snowmachine was on May 1, and
boating on Grantley Harbor began June 1. Noyakuk traveled to the herd on all but four
days between April 15 (the first calf sighting) and May 1, 2005, when there were an
estimated 50 calves with more yet to be born. At this point, he felt that many of the first
50 calves were mobile enough to stay with the herd and avoid predators. Noyakuk’s calf-
monitoring schedule in 2005 showed that considerable effort was made to monitor and
protect neonates from predation before break-up prevented travel. One might thus expect
that calf survival was higher in 2005 than in 2004 when break-up occurred prior to
calving. However, the calf to cow ratio was 57% at Noyakuk’s handling on June 16,
2004 and 37% at the handling on July 7, 2005 (RHA tally data). This difference between
years was most likely due to bear or wolf predation according to Noyakuk. Brown bears

126
emerge from hibernation in April, and they have often targeted neonate reindeer
(Chetkiewicz 1993). Wolves have been observed to kill several calves within minutes,
leaving the carcasses partially or mostly unconsumed (i.e., “excessive” or “surplus”
killing, Miller et al. 1985), despite a daily herd monitoring schedule. Noyakuk has noted
an increase in local wolf and bear populations and in the number of predator-killed
reindeer since caribou began wintering on the central Seward Peninsula in 1996.
Differences in calf numbers among years could be due to a number of other
factors in addition to predation. These include weather and river ice conditions soon after
calving and break-up, the previous year’s forage availability for pregnant females
(Finstad et al. in prep.), date of handling during the summer (July 6, 2005 versus June 16,
2004), and varying success during roundup and the treatment of reindeer during
handlings (which has affected both tally and survival numbers). Noyakuk recalled seeing
many more calves on his range in early May and June 2005 than were counted at the
handling in July. Additionally, the early break-up in 2004 may have meant earlier
emergence of and higher quality forage in spring and early summer for nursing cows and
calves than in 2005 (e.g., early emergence of Eriophorum vaginatum flowers, Cebrian
2005). Although the ability to monitor the herd during calving season did not equate with
higher calf survival in 2005 versus 2004, Noyakuk maintained that active herding reduces
predation opportunities and maintains herd cohesion.

127
5.1.2 Visibility
Noyakuk ranked visibility as the most important weather consideration after
freeze-up and break-up. Reduced visibility due to falling or blowing snow, flat-light,
and/or foggy conditions were implicated for most “poor” rated days in all three study
periods. Snow storms in December 2004 and in early January and February 2005
reduced opportunities for travel between Teller and Noyakuk’s range. Fog caused the
reindeer to scatter widely when Noyakuk tried to gather and move the reindeer closer to
the corral in December 2004. A satellite-collared steer, which was presumed to be
traveling with other, economically valuable steers and caribou, moved off range in during
December. In January 2005, its path overlapped with 95% home range kernels produced
from the locations of satellite-collared caribou in the WAH.
There were no significant differences for workday averages of visibility in Nome
among the weather rating categories. However, Noyakuk’s cited reduced visibility in
Teller and on his range as the reason for most of his “poor” and “minimal” weather
ratings. Nome is about 95 km southeast of Teller and 75 km south of Noyakuk’s corral.
Nome is the nearest location to Noyakuk’s range where visibility is recorded on a regular
basis, but the coastal and topographical features of Nome are known to influence storms
and fog differently than at Teller or the interior of the Seward Peninsula (Tim Shy, pers.
comm. National Weather Service, November 2005). On April 17, 2005, when Noyakuk
reported ice fog in the morning and extreme blowing snow conditions in the afternoon,
the sky was cloudless in Nome with visibility at 16 km or higher throughout the day.
Furthermore I do not know if Noyakuk traveled on days when visibility in Nome reached

128
Noyakuk’s threshold of less than three miles (5 km) visibility for four or more morning
(or daylight) hours. Additional comparisons between Noyakuk’s observations and Nome
visibility data may help to determine the extent that Teller and Nome are similar for
winter visibility, but evidence thus far has shown a poor correlation except in during
major storm events. Microclimate variation and local weather differences throughout the
Seward Peninsula may be just as, or even more critical, than large scale climatic events in
determining each herder’s adaptability to climate change.
5.1.3 Snow and other trail conditions
Snow depth and surface conditions varied greatly between the two winters, with
widespread sastrugi in 2003-2004 but markedly softer and deeper snow in 2004-2005.
Noyakuk also noted variable snow conditions between November 2004 and May 2005.
Low snow cover hindered travel on the few trips made in November 2004. Deep snow
thereafter made for faster and more comfortable travel but an increased chance of getting
the snowmachine stuck.
The influence of visibility on regular herding activities has also depended upon
interactions with snow conditions. Noyakuk was more reluctant to travel when multiple
poor weather and trail conditions combined. For example, he often traveled when the
snow conditions were poor, as with widespread sastrugi, as long as the visibility was
good, but he rarely traveled when both snow conditions and visibility were poor. On
occasions when Noyakuk has moved reindeer in this combination of conditions, the
reindeer usually scattered and outran the snowmachine. On the other hand, once the deep

129
snow of winter 2004-05 was packed by wind and sun exposure, the relatively smooth and
cushioned travel surface allowed Noyakuk to travel in situations of lesser visibility than
in 2003-04. In general, travel has been slower when the area of poor snow conditions
increased, but Noyakuk usually disregarded unfavorable snow conditions when traveling
within the comfort zone, when there was a great urgency to move the herd, or when he
had expendable snowmachines, as in the past.
5.1.4 Temperature, wind, and windchill
Comparisons between Noyakuk’s weather ratings, his observations, and station
data did not support my initial hypotheses. There were almost no significant differences
for temperature, wind speed, wind direction, or WCT between any of the rating
categories in 2004 or 2005. These variables influenced Noyakuk’s herding decisions
indirectly and in combination with other weather variables. In fact Noyakuk stated that
he does not have a wind speed threshold. Wind speed has affected his decisions to travel
to the herd only in combination with other factors such as the presence of loose snow on
the ground. Furthermore, temperature, wind speed, wind direction and windchill were
rarely mentioned as the reason for a herding trip being cancelled.
5.2 The rating system
The rating system is problematic because comparisons between rating categories
neglect the full context for a particular day’s rating. Noyakuk usually rated weather (or
snow) conditions based on a combination of factors that may have changed throughout

130
the day or based on location. There were several unrated travel days (as in spring 2005)
and potentially many travel days that were not discussed during the weekly or biweekly
phone conversations (as in spring 2004). Nevertheless the use of the rating system and
the comparisons between rating categories showed that wind speed, temperature, and
WCT varied considerably within each rating category, whereas other weather conditions
(in particular visibility) were more important for how Noyakuk rated any day’s weather
conditions. Unfortunately, those weather conditions were more difficult to measure for
quantitative comparisons.
5.3 Terrain implications
The location and terrain of each herder’s range have had a significantly impact on
how weather has affected daily herding decisions. The distance and terrain involved in
accessing the range from one’s home village, and the reindeer once on the range, are
different for each herder on the Seward Peninsula. Noyakuk cannot access his reindeer
because of unsafe travel conditions across Grantley Harbor and Imuruk Basin during the
transitional seasons of freeze-up and break-up. In contrast, the Davis family in Nome has
been able to access its herd during freeze-up and break-up by using the road system. The
Davis family has not needed to cross major water bodies to reach the typical fall and
spring ranges of their reindeer (C. Davis, pers. comm. March 27, 2005).
Noyakuk stated that variable weather conditions on his range, and between Teller
and his range, have also influenced his perceptions of travel conditions. His range is
inland, where it has been typically colder in winter and warmer in summer than in coastal

131
Teller. During the study period, variability in wind speed across the range may have
caused localized, deteriorated weather conditions that I could not record at the stations.
There were trends for high variability among most stations for workday average wind
speed, in contrast with little variation for temperature and WCT among stations (Figures
15, 22, and 29). From February 15 to May 29, 2004, there were trends for greater wind
speed at the Teller airport, Kougarok, and Mayuguk stations than at the stations at lower
elevations and inland (Agiapuk-Willows, Corral, North of the Corral) (Figures 15 and
18). This mirrors Noyakuk’s observations of stronger winds in Teller and on the hills on
his range than in the flat, low-lying area surrounding the corral.
Noyakuk stated that the visibility has tended to be lower in the hillier areas of his
range compared with Grantley Harbor or the flat areas around the corral. The steeper
terrain north and east of Noyakuk’s comfort zone is an area less familiar for Noyakuk.
He has avoided traveling in these areas when there were blowing snow, blizzard, or other
poor visibility conditions. Noyakuk has traveled outside of the comfort zone when
tracking wolves or looking for lost reindeer, but he traveled to these areas with at least
one other companion such as cousin, Simon Jack, who worked for herder Roger
Menadelook and is more familiar with the area. Keeping the reindeer in the comfort zone
has allowed Noyakuk to access the herd even in reduced visibility. If he planned to move
the reindeer, he chose a new area close to or within the comfort zone, where there was
adequate lichen (he has dug under the snow to assess lichen availability, especially during
calving season), and where the reindeer could be observed from a distance. Noyakuk has

132
preferred to keep the reindeer on flatter terrain because they are difficult to control when
driving them up or down steep hills.
5.4 The social-ecological system (SES) of Seward Peninsula reindeer herding
Some of the research and documented observations about Arctic climate change
have considered the interplay between climate change and the complicated social-
ecological systems (SES’s) that exist in the Arctic (ACIA 2004). There have been
several accounts of the role of climate and other change within various reindeer herding
systems (see Helander and Mustonen 2004). The largest problem recently faced by
reindeer herders on the Seward Peninsula, Alaska has been loss of stock to migrating
caribou. Current economic limitations have also restricted the re-establishment of large
herds there. Chukchi herders in Chukotka, Russia have likewise lost domesticated
animals to caribou (or “wild reindeer”), but the highly unstable political and economic
situation in the post-Soviet era has been the main cause for reindeer loss there (Gray
2000, Schweitzer and Gray 2000). Consequently, climate change, although still of
concern, has been regarded as a considerably lower priority by Chukchi herders to the
extent that they have only reacted to it passively (Krupnik 2000). The recent situation
and future prospect of herding in either Alaska or Chukotka, will depend largely on the
interplay of components within the social-ecological systems of each community within
the region.
Noyakuk, like other herders on the Seward Peninsula, Alaska, has managed his
herd according to the available opportunities and existing constraints within his ever-

133
changing SES. The discussion is expanded upon here to describe changes in herd
management, new technology, and the social and economic influences that affect
Noyakuk’s adaptability to the presence of caribou. Climate change considerations are
then integrated into this presentation of the herding SES.
5.4.1 Adaptations in herd management
In order to manage a smaller reindeer herd under the threat of loss to caribou,
Noyakuk has attempted to increase herd monitoring time, and he has had to reconsider
herd demographics. The presence of any caribou or “wild” reindeer (i.e., reindeer not
habituated to herding) within the main herd has tended to make the herd less manageable
(Oleson 2005, Paine 1988). Noyakuk has said that the “wild” reindeer run farther and
faster than the other animals. This has been beneficial for long drives when these
reindeer help to move the rest of the herd, but it has been a significant hindrance when
trying to maintain group cohesion or when corralling. Herders have typically culled any
caribou or wild reindeer out of their herd. When Noyakuk used a “wilder” individual to
maintain a fast-paced drive, he slaughtered that individual once at the final destination
and especially prior to approaching the corral.
The possibility that the remaining managed herds will attract stray caribou or wild
reindeer has been greater recently for several reasons. The caribou have been widespread
each winter, and a few groups of caribou have remained year-round on the Seward
Peninsula in recent years (Dau 2005a). Some lost reindeer from various herds have
returned to the region in a scattered fashion, but most have not been managed for many

134
years and may thus disrupt the manageability of an established herd (Oleson 2005).
Several herders have been unable to manage their remnant herds on a regular basis for
economic and practical reasons (Carlson 2005, Finstad et al. in press, Schneider et al.
2005). This situation has increased the local population of “wilder” reindeer. Reindeer
and caribou are naturally gregarious, such that groups attract individuals and larger
groups attract smaller groups. The behavior of any less managed animals prevails within
the group when herded. Efficient herd management will continue to depend on the
elimination or control of “wilder” individuals within the group.
According to Noyakuk, the ability to control reindeer movement has been more
problematic when driving smaller groups of reindeer, particularly for groups of 50 or
fewer reindeer (Noyakuk pers. comm. August 19, 2005). The presence of a caribou or a
less socialized individual reindeer is more likely to influence the behavior of a small
group than a large herd (G. Finstad pers. comm.). I witnessed this myself after assisting
Noyakuk in driving his herd of 150 reindeer, and then assisting Clark Davis to move
groups of more than 1000 reindeer. Splinter groups from the 150 reindeer were more
likely to cause the rest of the herd to change direction or scatter. In contrast, splinter
groups from a mass of 1000 reindeer became isolated and were easily driven back to the
rest of the herd, which had not changed course or speed. According to Noyakuk, smaller
herds require more frequent supervision and socialization to humans and snowmachines
prior to corralling. A small herd that has not been regularly herded will readily balk at
the corral gate and in the presence of humans. Conversely, equally unmanaged but large

135
herds have been observed to exhibit greater “centripetal pull” (Ingold 1980, Pelto 1987),
with the reindeer entering the corral almost “blindly”, en masse.
Reindeer that have mixed with large groups of caribou have been mostly
impossible to segregate or recover. Reindeer have been shown to naturally use small
ranges in comparison to the barren-ground caribou of northern Alaska, but many reindeer
have become highly migratory in the presence of caribou (Finstad et al. in press, Oleson
2005). When 225,000-250,000 caribou were on the Seward Peninsula in the winter of
2000-2001, satellite-collared reindeer from the Noyakuk herd traveled as far east as the
Gray, Elim, and Henry ranges (Figure 1), with one reaching the Brooks Range in fall
2002 (Oleson 2005). The satellite-collared steer that traveled off Noyakuk’s range in
December 2004 likely traveled with caribou that had been observed north of Brevig
Mission around the same time (Figure 23).
The ability to access and drive reindeer has also depended upon the seasonal
behavior and body condition of the reindeer. During rut in September and early October,
the reindeer tend to scatter into small harems, which have been difficult to locate and
gather into larger groups (Paine 1988). Bulls and steers castrated as adults tend to
wander over large areas, especially in the fall and winter, and young females, even those
with calves, have often followed (Finstad, pers. comm. March 22, 2005). These animals
may be particularly vulnerable to outmigration with caribou (Finstad, pers. comm. March
22, 2005). Males castrated at a later age will continue to exhibit the wandering behavior
of bulls, whereas younger castrated males are less likely to continue this behavior
(Finstad, pers. comm. March 22, 2005). Noyakuk castrated several male calves at the

136
2004 and 2005 summer handlings in order to examine the effects of early castration on
herd dispersal and on meat quality, however the satellite-collared steer that was lost in
December 2004 was castrated in 2004 as a 4-year-old.
Reindeer fat and protein reserves diminish each winter to be replenished in the
summer (Gerhart et al. 1996, Parker et al. 2005), but overall body condition and the
ability to retain more winter fat and protein improves with age (G. Finstad, pers. comm.).
Noyakuk’s surviving herd has recently been composed of younger (2-4 year old) females,
along with some young bulls and steers. His herd has been comparatively leaner and in
poorer health mid-winter than when he had a larger herd with greater age stratification
(Noyakuk pers. comm. June 15, 2005). Two-year-old steers and bulls that were
harvested for a meat study conducted by the RRP in March 2005 had considerably lower
carcass weight and little to no fat compared with older bulls and steers harvested from
Tom Gray’s herd at the same time (Wiklund et al. 2005). Noyakuk’s herd was corralled
for the meat study, and there were very few older bulls or steers in the herd. Noyakuk’s
younger animals may become more stressed than older animals would with more
intensive management, particularly if they are kept on smaller sections of the range (e.g.,
refugia), where there may be lower quality forage and/or risks of overgrazing (Oleson
2005). Furthermore, he has had to consider the added stress to pregnant females and any
neonate calves when driving reindeer to prime calving areas in the spring.
Predator levels have been higher with the presence of caribou on the Seward
Peninsula (Dau 2000). Noyakuk has combined his own observations with reports from
family or community members regarding caribou or predator sightings, and/or reports of

137
wolf- or bear-killed reindeer. Throughout his herd’s history, he has typically moved
reindeer from areas where predators or predator sign were reported. However, he has
also hunted or enlisted help to hunt wolves, and he has actively pushed bears away from
the reindeer (Noyakuk pers. comm. April 9, 2004). When Noyakuk has moved the
reindeer to a new site, and especially during calving season, he usually has made a five to
ten mile (8-16 km) circle around the new area to check for wolves or bears and to
possibly deter predators from coming into the area (Noyakuk pers. comm. April 9, 2004).
5.4.2 Technological adaptations: new opportunities
Whereas the eastern half of the Seward Peninsula has been deemed part of the
WAH’s winter range since the 1990s, the timing of caribou arrival in fall, and the extent
of caribou use of the region, has varied in the last ten years (Dau 2005a). Satellite
collars, both on reindeer and caribou, have been valuable in the effort to prevent mixing
of reindeer and caribou. Noyakuk made most recent decisions to travel to the herd based
on the satellite collar locations. The satellite collar locations have typically been updated
on the internet every five days. Noyakuk’s niece, Tanya Ablowaluk, was working at the
Teller school during the study period, and she provided him with updates and printed
maps showing the locations of his satellite-collared reindeer. Locations that scatter
rapidly or move great distances have indicated that caribou or wolves were likely to be in
close proximity to the reindeer and causing the erratic movements. Caribou collar
location maps have also been available to Seward Peninsula herders via a restricted
website from the ADF&G.
138
The RHA received a grant in 2003 to procure laptops for five herders so that they
could monitor satellite collar locations for reindeer and caribou from their homes.
Noyakuk was one of the recipients because he continued to have and manage reindeer in
2003. Additionally, caribou wintered on or near his range between 2000 and 2003, and
he frequently contacted the RHA and RRP offices for updates on reindeer and caribou
collar locations. The laptop was Noyakuk’s first experience using a computer. Internet
service for the first year was covered by the same grant, and Noyakuk enlisted the help of
his nieces and nephews to check collar location maps.
Noyakuk has used different aged snowmachines over the years, and he has spent
many poor weather days repairing or rebuilding older machines. It has often been the
combination of marginal weather and a poorly functioning machine that prevented him
from traveling. In the past when Noyakuk had newer snowmachines, he traveled more
frequently in unfavorable weather conditions than in recent years when he has not been
able to afford the upkeep of more than one, older snowmachine. Noyakuk’s reindeer
have become accustomed to the noise and presence of his snowmachine, and have been
easily approached and moved except when visibility was reduced. On longer drives, the
tameness of the reindeer has been frustrating because the reindeer often would not move
without the snowmachine driving nearly into them (see also Paine 1988). However,
reindeer that have been habituated to herding by snowmachine have been less
approachable on foot, unlike the days prior to snowmachine use (see also Pelto 1987).
Noyakuk’s reindeer have been frequently “skittish” when moved through the corral by
several people walking or running to contain them.

139
Noyakuk has been more selective when slaughtering reindeer since the herd was
reduced to less than 300 reindeer in 2000. Selective slaughtering has involved the time-
consuming process of approaching the herd multiple times on foot, with trips back and
forth to advance the snowmachine, to get close enough to shoot a particular animal.
Noyakuk resumed corralling by 4-wheeler or snowmachine for the summer handlings
because charter helicopters have become unaffordable with fewer reindeer and low antler
prices. Round-up thus requires more time and, usually, the help of several assistants to
move the reindeer on foot, or ferry the snowmachine or 4-wheeler across rivers and
sloughs by boat. However, the satellite collars have allowed for more efficient and cost-
effective locating of reindeer prior to the round-up, compared with spotting by fixed-
wing aircraft, which were used before 2000 (Noyakuk as quoted in Oleson 2005).
5.4.3 Socioeconomic constraints and opportunities
Noyakuk’s economic situation (and that of any herder with a reduced herd size)
has often precluded his ability to more frequently monitor the herd on the range. In fact,
he has been the only herder of four having fewer than 400 reindeer to continue regular
monitoring and handling of his reindeer. Unlike the other three herders, Noyakuk is
single and does not have children. He has contributed considerably to his extended
family (e.g. hauling ice and fresh water and construction on family homes and fish
camps), but he has stated that he would not be able to make as many lengthy or overnight
trips to work with the reindeer if he also had children to care for (Noyakuk pers. comm.
June 23, 2005).

140
Noyakuk has had fewer animals from which to harvest velvet antler at the same
time that antler prices have been depressed. In the early 1990s, Noyakuk and other
herders sold female antlers for $25 per pound and bull antlers for $50 per pound (Carlson
2005). He estimated that he may have sold up to 1600 pounds of antler per summer
during that time (Noyakuk pers. comm. August 19, 2005). He still sold antler for as low
as $5 per pound in the late 1990s after the market crashed (Noyakuk pers. comm. August
19, 2005). Antler prices have since rebounded but not to the level once enjoyed by
herders. In July 2005 he corralled 161 of his reindeer and sold 210 pounds of antler
(including that from calves) at $15 per pound ($3150 gross income).
Noyakuk slaughtered an average of 12 reindeer per winter in recent years, but he
had fewer large steers available for slaughter. Although many people in the region have
enjoyed the fatter meat of female reindeer in the winter, Noyakuk has recently
slaughtered a lower proportion of female reindeer than in the past to maintain and
increase the breeding population. At least half of the meat was distributed among family
members. He has not sold meat to Nome or Anchorage stores in recent years and but has
supplied meat to grocers in Teller and Brevig Mission, although this has not been
sufficient to meet the local demand. Noyakuk considered raising his prices for meat, but
he has not done so to keep meat affordable for fellow community members. In 2005 he
sold quarter carcasses to the store in Brevig Mission at $2.10 per pound (Noyakuk, pers.
comm. August 19, 2005). This price was similar to the $2-2.50 per pound that he sold to
Hanson’s grocery in Nome and Alaska Commercial (AC) in Anchorage between 1995

141
and 1999, except that over 125 reindeer of higher age and weight classes were sold at that
time compared to an average of six younger and smaller animals in recent years.
Alaskan reindeer herders have mixed reindeer herding with other wage jobs and
subsistence activities throughout the history of the reindeer industry on the Seward
Peninsula (Ellanna and Sherrod 2004, Simon 1998, Schneider et al. 2005). Herding was
Noyakuk’s main source of income until 90% of his herd disappeared with the caribou in
2000. Since that time his reindeer have been more of a source of subsistence meat for his
extended family. Any sales of meat or antler have mostly been used to pay for fuel or the
upkeep of equipment used in herding. Although Noyakuk had often worked seasonally
or part-time with local construction projects and sometimes at the Teller store, in more
recent years, non-herding jobs have begun to comprise 60% of his income, versus 10%
before his largest losses of reindeer (Noyakuk pers. comm. June 15, 2005). These non-
herding income sources have become critical so that Noyakuk could continue to afford
gas, snowmachine parts, and wages for assistant herders. Rising gas costs and gas
shortages in Teller each spring have necessitated trips to Brevig Mission or Nome to buy
gas. Moreover, many expenses that were incurred when the herd was large have become
less manageable in recent years. Noyakuk has had to forego construction on his new
house and many needed repairs at the corral, which was built in 1975. Until winter 2004-
05, he had not bought a new snowmachine since 2000. Many trips in recent years were
delayed due to repair time needed for the older machines.
Construction employment has paid well, but Noyakuk has mostly limited his
construction schedule to the off-seasons for reindeer herding (e.g. late July through

142
November or December depending upon freeze-up, and spring break-up until the summer
handlings start). Noyakuk worked construction from break-up in May 2005 until the
summer handling on July 6, 2005. The construction income at that time was too critical
to forego quitting before the handling, but Noyakuk was able to make preparations for the
handling on the weekends and with the help of family members. If his herd is reduced to
less than 120 reindeer, Noyakuk may increase the time spent working construction to
compensate for the lack of revenue from his reindeer business (Noyakuk pers. comm.
August 19, 2005).
Reindeer herders both in Alaska (Schneider et al. 2005, Weyiouanna 2000), and
in Chukotka, Russia (Kerttula 2000), have argued that 200 reindeer are too few to be
economically sustainable as a sole or even primary source of income. Herder Clifford
Weyiouanna of Shishmaref, Alaska stated that the cost of managing 155 reindeer is
equivalent to managing 1500 reindeer (Weyiouanna 2000). Although there have been
ways to reduce some financial costs of herding, the fact has persisted that regular
monitoring and handling are required to keep a manageable herd. The return to using 4-
wheeler, snowmachine, or walking (versus helicopter) to gather reindeer for summer
handlings has reduced financial costs, but has increased time costs considerably.
Employment in construction and the use of refugia have been other adjustments that
Noyakuk has made, but these options may result in decreased time available for herding
and risks of overgrazing, respectively.
Recently, Noyakuk has not been able to hire assistants for herding or for
handlings, and the handlings have been much smaller and family-only affairs. When the

143
herd was approximately 1500 reindeer in 1995 and 1996, Noyakuk spent about $1680 for
labor at each summer handling. This was distributed as cash payments among family and
community members for a variety of jobs. Noyakuk did not have employee records for
recent years, but few community members have attended the handlings recently, and
Noyakuk has spent more time herding on his own. The costs of continuing to herd have
not been offset by recent antler and meat sales, but they have been met via non-herding
cash employment and increased personal time on the range.
Government and RHA financial aid, as well as research conducted by the RRP,
have helped Noyakuk to continue active management of his herd. In 1999 he received
some federal aid via the Livestock Assistance Program with the USDA Farm Services
Agency. Over $100,000 total was distributed among most Seward Peninsula herders
based on individual losses. Additionally, RHA, in conjunction with the BIA and
Kawerak’s compact, has set aside funds for caribou and reindeer monitoring efforts.
Kawerak is the regional nonprofit corporation established after the passage of the 1971
Alaska Native Claims Settlement Act (ANCSA) by the Bering Straits Native Association
to provide services to the communities in the Norton Sound and Bering Straits region.
RHA is administered by Kawerak.
Noyakuk’s return to intensive herding in mid-February 2005 was due to both the
promise of payment by RRP for carcasses used in the meat study, and the return in
February of some missing steers and bulls needed for the study. Noyakuk used a
relatively new snowmachine loaned to him by his brother to round-up reindeer for the
meat study. His intended to use the carcass sales to buy the snowmachine. The meat

144
study also involved RRP financial assistance and manpower at the July 2005 handling.
Noyakuk proposed a study with the RRP to alter the design of his corral wing in an effort
to improve the corralling process. RRP bought supplies and helped with the construction
effort in June 2005. Noyakuk’s relationship with RRP has been mutually beneficial.
Noyakuk has been able to continue financing his herding activities, and he stands to gain
from research findings on meat quality. Meanwhile the RRP has been able to continue
research on free-grazing reindeer.
Noyakuk’s herding operation has continued to provide a subsistence meat source
and an important social activity for his extended family (especially at handlings). He has
been able to continue herding through his own persistence, paid employment in
construction, volunteer assistance from his family (and in exchange for meat), financial
assistance from the RHA and other governmental agencies, and research collaboration
with the RRP. The loss of revenue from reindeer has translated into significant
reductions in economic activity in Seward Peninsula communities (Carlson 2005), but
herding has remained socially and culturally important for many families.
.
5.5 Climate change and Noyakuk’s herding SES
Events during the spring of 2004 and fall-winter of 2004-2005 illustrate the ways
that climate change may affect Seward Peninsula reindeer herding. First, break-up in
spring 2004 preceded the calving season, and Noyakuk was unable to monitor his herd
during the critical early weeks of calving when predation can be high (Chetkiewicz 1993,
Paine 1988, Whitten et al. 1992). The ability for herders to maintain or increase herd size

145
has relied on the survival of calves during their first year of life when forage access and
quality may also be impacted by changing weather and other environmental conditions
(Finstad et al. in prep.). If break-up and melt occur earlier, the ability to protect neonates
from predators will be compromised even if nursing females and calves benefit from the
earlier spring emergence of nutritious vascular forage such as tussock cottongrass,
Eriophorum vaginatum (Cebrian 2005). Whereas Noyakuk may choose to resume
camping with his reindeer or staying at the corral through break-up, as he did in his early
herding years, that practice has been less attractive or possible recently because of the
low economic returns from herding. Moreover, summer construction projects have often
been hiring in spring.
Freeze-up was delayed in fall 2004 due to storms that broke up the harbor ice.
The late freeze-up and frequently stormy and foggy weather in December made it
impossible for Noyakuk to gather and move the herd to the refugia before a satellite-
collared steer traveled off-range and was not recovered. The timing of waterway freeze-
up and the buildup of snow cover in early winter are not readily quantifiable because
these are slower and more erratic processes compared with break-up (M. Sturm, Cold
Regions Research and Engineering Laboratory, pers. comm. December 2003). However,
many Arctic residents have noted an increase in the occurrence of later-than-usual freeze-
up (see Krupnik and Jolly 2002). Eight of ten herders surveyed for this study reported
that freeze-up in 2004 was considerably later than in years past, and several recorded
delayed winters for several years recently.

146
It is important to note that, although “the herders have always known
unpredictable freeze-ups, variable snow conditions, winter rain, and icing, and these
conditions have been devastating in the past, . . . the present adaptation of herders (village
centered, motorized access), and the overwhelming rush of caribou [as in 1996 and 2000]
makes the timing of freeze-up and adequate snow cover even more critical [now]”
(Schneider et al. 2005). Increased occurrence of late freeze-up and early break-up has
been predicted by climate change models for western Alaska (ACIA 2004), and this is
expected to exacerbate reindeer losses via lost herding opportunities.
Snow depth differed greatly between winter 2003-04 and 2004-05 as evidenced
by snow depth measurements taken on Noyakuk’s range during March in both 2004 and
2005 (Table 8). Snow conditions were also vastly different between years as sastrugi or
“wind waves” were nearly ubiquitous on Noyakuk’s range in 2004, whereas the snow
pack was deeper with a smoother surface in 2005. Increased weather variability has
altered opportunities for herding trips and has obliged Noyakuk and other herders and
subsistence users to be prepared for an array of circumstances. Preparations for a greater
range of travel conditions has become less possible now as Noyakuk cannot afford to
purchase or maintain additional snowmachines to be used on “poorer” snow conditions or
bare tundra.
Events associated with climate change, such as delayed ground freezing and snow
buildup in the early winter, have impacted reindeer health in addition to altering the
ability to conduct herding activities (Hiltunen et al. 2004; Paine 1988; Salin et al. 2004a).
Mid-winter storms (Dau 2005b), thaw-freeze cycles (Koskey 2003), high snowfall

147
(Finstad et al. in prep., Heggberget et al. 2002), or freezing rain (Salin et al. 2004b) have
restricted reindeer access to available lichen. Moreover, there have been predictions for
reductions in lichen biomass due to increased vascular shrub growth (Cornelissen et al.
2001), as seen on the North Slope (Tape et al. 2006).
The incidence of mid-winter thaw-freeze events, rain-on-snow events, and travel-
inhibiting storms has increased according to many Arctic residents (ACIA 2004,
Helander and Mustonen 2004, Koskey 2003, Krupnik and Jolly 2002). Several climate
data studies have been initiated and conducted in response to the concerns of Arctic
residents about increased weather variability and increased incidence of extreme events
such as destructive fall storms. Some climate data analyses have concurred with local
observations in some certain regions (e.g., an increase in fall freezing rain events in
northern Canada: Hanesiak and Wang 2005), but others have shown that there has not
been a change in variability over time for other weather factors (e.g., storm frequency:
Atkinson 2005; seasonal temperature variability: Walsh et al. 2005b).
The dichotomy that can exist between local observations and scientific climate
research regarding climate change evidence seems to be due at least partially to issues of
geographic and temporal coverage by weather station and satellite data (Atkinson 2005;
Walsh et al. 2005b; Serreze et al. 2000), and an inability to quantitatively measure many
weather and climate variables, such as visibility, that are critical to land and natural
resource based livelihoods. Evidence of climate change as well as general climate
patterns vary considerably geographically but the impacts of weather and climate change
are borne locally.

148
Chapter 6 – CONCLUSION
Interviews with James Noyakuk of Teller, Alaska sought to define and describe
the weather and environmental conditions that contributed to or that hindered winter
herding. The attempt to relate Noyakuk’s herding activities and his weather observations
to station data illustrated that data recorded at the stations did not reflect Noyakuk’s
rating of weather conditions while herding. Noyakuk’s recent herding situation,
including the effects of weather and environmental change, is presented in this thesis as
important, interlinked components of his herding social-ecological system (SES).
Weather has played a decisive role in reindeer management on the Seward
Peninsula, and it has been especially critical for herding decisions since winter range
expansion by the Western Arctic Caribou Herd (WAH). For Noyakuk, as well as for
other herders, the most critical weather and environmental issues for winter herding have
been the timing and duration of the freeze-up and break-up processes, visibility, and
snow cover. However, the limitations that these conditions presented for Noyakuk were
registered within a semi-flexible set of priorities (decision pyramid, Figure 9). Under
very urgent situations, such as the immediate threat of loss to caribou or predators,
Noyakuk has traveled to the herd in what he would normally consider “poor” conditions,
with the exception of incomplete freeze-up or break-up of Grantley Harbor and the inland
rivers and creeks.
The role of weather and other environmental conditions within the herding-
caribou dynamic has been inseparable from the social and economic reality of each
herder’s life. Unpredictable or frequently inclement weather, snow, or ice conditions can

149
limit a herder’s options as he balances the need to increase herd monitoring with fewer
economic means to do so. Although temperature, wind speed and wind direction have
been critical at least indirectly and in some instances directly, factors contributing to
inclement weather for herding have more typically been those conditions that are less
measured or measurable (e.g., visibility), or that involve a combination of several weather
and other environmental factors (e.g., timing and duration of freeze-up and break-up
processes). An understanding of the weather and environmental parameters most
important to people involved with land and natural resource based livelihoods, in addition
to understanding the social and economic factors that affect such livelihoods, seems to be
critical to the discussion of climate change resilience and adaptation.
This approach of the interdisciplinary, collaborative case study addressed some
fundamental concerns of SES, adaptability, and climate change research. Policy
regarding mitigation of the effects of climate change relies on quantifiable scientific data,
but it also requires a comprehensive analysis of the impacts of climate change to social-
ecological systems. Adaptability to climate change is linked to other local and global
changes as well as to the social, cultural, personal, and ecological capacity present in an
SES. Narratives from members of local SES’s can provide contextualized reports about
the impacts of climate change, and help to elucidate those factors, linkages, and
feedbacks most critical to the SES, which can, in turn, inform modeling of the impacts of
climate change. Case studies with individuals can illustrate the diversity of adaptive
capacity within a community as well as the effects of individual choice on ecological,
social, and cultural change.

150
Situational, social, and even cultural differences among herders on the Seward
Peninsula combine with personal differences to make the case study approach valuable in
understanding the future role of herding in the region. This thesis details James
Noyakuk’s herding situation in light of current and past drivers of change. The focus was
on situational aspects that affected his herding SES: weather and environmental
conditions, potential climate change impacts, the intermittent presence of caribou,
reduced herd size, depressed meat and antler markets. However, some social, economic,
and personal motivations were also considered in the Discussion. The combination of
these variables influenced Noyakuk’s regard for the weather as he made decisions for
herd management.
This thesis describes the Seward Peninsula herding SES at the turn of the Twenty-
First Century, but SES’s are constantly changing to some degree. Some of Noyakuk’s
short-term adaptations to caribou and weather challenges (e.g., borrowing a snow
machine) may not be available tomorrow, whereas more long-term adaptations (e.g.,
income diversity like seasonal construction work; social ties within the extended family)
may help in maintaining his herd, despite the presence of caribou and low economic
returns in recent years. On the other hand, sudden surprises to this system such as an
early fall influx of caribou could be devastating. The case study approach also allowed
for exploration of the exceptions to the decision pyramids of an individual’s SES. In the
near future, Noyakuk may choose to reorganize his system based on the combination of
adaptive opportunities available at that time or he may not. Case studies with other
herders may reveal other adaptive strategies and new combinations of how such strategies

151
are considered. An in-depth examination of factors critical to a local SES as a linked
entity offers a sound starting point for collaborative work that aims to illustrate the effects
of global changes on people and their environment.

152
REFERENCES
ACIA. 2004. Impacts of a warming Arctic: Arctic climate impact assessment. Cambridge
University Press, New York, New York, USA. Atkinson, D. E. 2005. Observed storminess patterns and trends in the circum-Arctic
coastal regime. Geo-marine Letters 25:98-109. Bamzai, A. S. 2003. Relationship between snow cover variability and Arctic Oscillation
index on a hierarchy of time scales. International Journal of Climatology 23:131-142.
Beach, H. 2000. The Saami. Pages 223-245 in M. M. R. Freeman, editor. Endangered
peoples of the Arctic: struggles to survive. Greenwood Press, Westport, Connecticut, USA.
Beach, H. 2004. Political ecology in Swedish Saamiland. Pages 110-123 in D. G.
Anderson and M. Nuttall, editors. Cultivating Arctic landscapes: knowing and managing animals in the circumpolar north. Berghahn Books, New York, USA.
Bergerud, A. T., R. Ferguson, and H. E. Butler. 1990. Spring migration and dispersion
of woodland caribou at calving. Animal Behavior 39:360-368. Berkes, F. 2002. Making sense of Arctic environmental change? Pages 335-349 in I.
Krupnik and D. Jolly, editors. The earth is faster now: indigenous observation of Arctic environmental change. Arctic Research Consortium of the United States, Fairbanks, Alaska, USA.
Berkes, F. and C. Folke. 1998. Linking social and ecological systems for resilience and
sustainability. Pages 1-26 in F. Berkes and C. Folke, editors. Linking social and ecological systems: management practices and social mechanisms for building resilience. Cambridge University Press, Cambridge, UK.
Berkes, F. and D. Jolly. 2001. Adapting to climate change: social-ecological resilience
in a Canadian western Arctic community. Conservation Ecology 5(2):18. [online] URL: http://www.consecol.org/vol5/iss2/art18.
Bjorkland, I. 2004. Saami pastoral society in northern Norway: the national integration
of an indigenous management system. Pages 124-135 in D. G. Anderson and M. Nuttall, editors. Cultivating Arctic landscapes: knowing and managing animals in the circumpolar north. Berghahn Books, New York, USA.

153
Carlson, S. M. 2005. Economic impact of reindeer-caribou interactions on the Seward Peninsula. Thesis. University of Alaska, Fairbanks, Alaska, USA.
Caulfield, R. 2000. Political economy of renewable resources in the Arctic. Pages 485-
513 in M. Nuttall and T. V. Callaghan, editors. The Arctic: environment, people, policy. Harwood Academic Press, Amsterdam, Netherlands.
Cebrian, M. 2005. Effects of simulated climate change on the reproductive phenology of
tussock cottongrass: Implications for growth and reproduction of reindeer on the Seward Peninsula, Alaska. Thesis. University of Alaska, Fairbanks, Alaska, USA.
Chance, N. A. 1968. Implications of environmental stress for strategies of developmental change among the Cree. Pages 11-32 in N. A. Chance, editor. Conflict in culture: problems of developmental change among the Cree. Canadian Research Centre for Anthropology, Ottawa, Canada.
Chetkiewicz, C. B. 1993. Reindeer (Rangifer tarandus) calf productivity and survival on the Seward Peninsula, Alaska. Thesis. University of Alaska, Fairbanks, Alaska, USA.
Cornelissen, J. H. C., T. V. Callaghan, J. M. Alatalo, A. Michelsen, E. Graglia, A. E.
Hartley, D. S. Hik, S. E. Hobbie, M. C. Press, and C. H. Robinson. (2001). Global change and arctic ecosystems: is lichen decline a function of increases in vascular plant biomass? Journal of Ecology 89:984-994.
Cruikshank, J. 1998. The social life of stories: narrative and knowledge in the Yukon
Territory. University of Nebraska Press, Lincoln, Nebraska, USA. Dau, J. 2000. Managing reindeer and wildlife on Alaska’s Seward Peninsula. Polar
Research 19:57-62. Dau, J. 2003. Caribou management report, units 21D, 22A, 22B, 23, 24, 26A. Pages 204-
251 in M. V. Hicks, editor. Caribou management report of survey-inventory activities, 1 July 2000-30 June 2002. Alaska Department of Fish and Game, Federal Aid in Wildlife Restoration Project W-27-4 and W-27-5, Juneau, Alaska, USA. [online] URL: http://wc.adfg.state.ak.us/pubs/techpubs/mgt_rpts/ca03mt-wah.pdf.
Dau, J. 2005a. Caribou management report, units 21D, 22A, 22B, 23, 24, 26A. Pages
177-218 in M. V. Hicks, editor. Caribou management report of survey-inventory activities, 1 July 2002-30 June 2004. Alaska Department of Fish and Game, Federal Aid in Wildlife Restoration Project W-27-4 and W-27-5, Juneau, Alaska, USA. [online] URL: http://www.wildlifeviewing.alaska.gov/pubs/techpubs/mgt_rpts/ca05_wah.pdf.

154
Dau, J. 2005b. Two caribou mortality events in Northwest Alaska: possible causes and
management implications. Rangifer Special Issue No. 16:37-50. Dau, J. and P. Bente. 1999. Caribou management report, units 21D, 22A, 22B, 23, 24,
26A. Pages 160-185 in M. V. Hicks, editor. Management report of survey-inventory activities 1 July 1996 - 30 June 1998. Alaska Department of Fish and Game, Federal Aid in Wildlife Restoration Project W-24-5 and W-27-1, Study, 3.0, Juneau, Alaska, USA.
Davis, L. 2001. Oral history interview, January 24, 2001. William Schneider,
interviewer. University of Alaska Fairbanks, Oral History Collection H2000-102-03.
Dieterich, R. A., and J. K. Morton. 1990. Reindeer health aide manual. Second edition. Agricultural and Forestry Experiment Station Miscellaneous Publication 90-4, University of Alaska, Fairbanks, Alaska, USA. [online] URL: http://reindeer.salrm.uaf.edu/documents/MP90-4.pdf.
Ellanna, L. J. and G. K. Sherrod. 2004. From hunters to herders: the transformation of
earth, society and heaven among the Inupiat of Beringia. U.S. Dept. of the Interior, National Park Service, Alaska Regional Office, Anchorage, Alaska, USA.
Fancy, S. G. and R. G. White. 1985. Energy expenditure by caribou while cratering in
snow. Journal of Wildlife Management 49:987-993.
Finstad, G., H. Bader, and A. Prichard. 2002. Conflicts between reindeer herding and an expanding caribou herd in Alaska. Rangifer Special Issue No. 13:33-37.
Finstad, G., A. K. Pritchard, and K. Kielland. In prep. Climatic drivers of interannual
variation of reproduction in reindeer. Finstad, G. L., K. Kielland, and W. S. Schneider. In press. Reindeer herding in
transition: historical and modern day challenges for Alaskan reindeer herders. In H. Beach and F. Stammler, editors. People and Reindeer on the Move. International Union of Anthropological and Ethnological Scientists.
Gerhart, K. L., R. G. White, R. D. Cameron, and D. E. Russell. 1996. Body
composition and nutrient reserves of arctic caribou. Canadian Journal of Zoology 74:136-146.

155
Gray, P. A. 2000. Chukotkan reindeer husbandry in the post-socialist transition. Polar Research 19:31-38.
Gray, P. A. 2004. Chukotkan reindeer husbandry in the twentieth century: in the image
of the Soviet economy. Pages 136-153 in D. G. Anderson and M. Nuttall, editors. Cultivating Arctic landscapes: knowing and managing animals in the circumpolar north. Berghahn Books, New York, USA.
Gray, T. 2002. Oral history interview, March 19, 2002. William Schneider, interviewer.
University of Alaska Fairbanks, Oral History Collection H2000-102-17. Hadley, N. 2001. Oral history interview, January 26, 2001. William Schneider,
interviewer. University of Alaska Fairbanks, Oral History Collection H2000-102-10.
Hanesiak, J. M. and X. L. L. Wang. 2005. Adverse-weather trends in the Canadian
Arctic. Journal of Climate 18:3140-3156. Heggberget, T. M., E. Gaare, and J. P. Ball. 2002. Reindeer (Rangifer tarandus) and
climate change: importance of winter forage. Rangifer 22:13-32. Helander, E. and T. Mustonen, editors. 2004. Snowscapes, dreamscapes: snowchange
book on community voices of change. Tampere Polytechnic Publications, Fram Oy, Vaasa, Finland.
Henry, M. 2002. Oral history interview, March 18, 2002. William Schneider,
interviewer. University of Alaska Fairbanks, Oral History Collection H2000-102-14.
Hiltunen, A., N. Huovari, with the representatives of the Sámi Community in
Jokkmokk region. 2004. ‘In my childhood when we would watch the Northern Lights start to move this meant that you had to stay inside and you couldn’t shout or run’: Community Voices of Jokkmokk Region of Sápmi. Pages 261-271 in E. Helander and T. Mustonen, editors. Snowscapes, dreamscapes: snowchange book on community voices of change. Tampere Polytechnic Publications, Fram Oy, Vaasa, Finland.
Hinzman, L. D., N. D. Bettez, W. R. Bolton, F. S. Chapin, M. B. Dyurgerov, C. L.
Fastie, B. Griffith, R. D. Hollister, A. Hope, H. P. Huntington, A. M. Jensen, G. J. Jia, T. Jorgenson, D. L. Kane, D. R. Klein, G. Kofinas, A. H. Lynch, A. H. Lloyd, A. D. McGuire, F. E. Nelson, W. C. Oechel, T. E. Osterkamp, C. H. Racine, V. E. Romanovsky, R. S. Stone, D. A. Stow, M. Sturm, C. E. Tweedie, G. L. Vourlitis, M. D. Walker, D. A. Walker, P. J. Webber, J. M. Welker, K.

156
Winker, K. Yoshikawa. 2005. Evidence and implications of recent climate change in northern Alaska and other arctic regions. Climatic Change 72:251-298.
Holling, C. S., and L. H. Gunderson. 2002. Resilience and adaptive cycles. Pages 25-62
in L. H. Gunderson and C. S. Holling, editors. Panarchy: understanding transformations in human and natural systems. Island Press, Washington D.C.
Hooge, P. N. and B. Eichenlaub. 1997. Animal movement extension to ArcView. Ver.
1.1. Alaska Science Center - Biological Science Office, U.S. Geological Survey, Anchorage, AK, USA
Huntington, H. P. 1998. Observation on the utility of the semi-directive interview for
documenting traditional ecological knowledge. Arctic 51:237-242. Huntington, H. P. 2002. Human understanding and understanding humans in the Arctic
system. Pages xxi-xxvii in I. Krupnik and D. Jolly, editors. The earth is faster now: indigenous observation of Arctic environmental change. Arctic Research Consortium of the United States, Fairbanks, Alaska, USA.
Huntington, H., S. Fox, F. Berkes, I. Krupnik, A. Whiting, M. Zacharof, G.
McGlashan, M. Brubaker, V. Gofman, C. Dickson, C. Paci, S. Tsetta, S. Gargan, R. Fabian, J. Paulette, M. Cazon, D. Giroux, P. King, M. Boucher, L. Able, J. Norin, A. Laboucan, P. Cheezie, J. Poitras, F. Abraham, B. T’selie, J. Pierrot, P. Cotchilly, G. Lafferty, J. Rabesca, E. Camille, J. Edwards, J. Carmichael, W. Elias, A. de Palham, L. Pitkanen, L. Norwegian, U. Qujaukitsoq, N. Moller, T. Mustonen, M. Nieminem, H. Eklund, E. Helander, S. Zavalko, J. Terva, and A. Cherenkov. 2005. The changing Arctic: indigenous perspectives. Pages 61-98 in ACIA. Impacts of a warming Arctic: Arctic climate impact assessment. Cambridge University Press, New York, New York, USA.
Ihl, C. and D. R. Klein. 2001. Habitat and diet selection by muskoxen and reindeer in
western Alaska. Journal of Wildlife Management 65:964-972. Ingold, T. 1980. Hunters, pastoralists, and ranchers: reindeer economies and their
transformations. Cambridge University Press, Cambridge, UK. Johnston, B. R. 2000. Series forward. Pages vii-x in M. M. R. Freeman, editor.
Endangered peoples of the Arctic: struggles to survive. Greenwood Press, Westport, Connecticut, USA.
Jolly, D., F. Berkes, J. Castelden, T. Nichols, and Sachs Harbor. 2002. We can’t
predict the weather like we used to. Pages 92-125 in I. Krupnik and D. Jolly, editors. The earth is faster now: indigenous observation of Arctic environmental

157
change. Arctic Research Consortium of the United States, Fairbanks, Alaska, USA.
Kassam, K. S. and the Wainwright Traditional Council. 2001. Passing on the
knowledge: mapping human ecology in Wainwright, Alaska. The Arctic Institute of North America, University of Calgary, Calgary, Canada.
Kernohan, B. J., R. A. Gitzen, and J. J. Millspaugh. 2001. Analysis of animal space
use and movements. Pages 126– 166 in J. J. Millspaugh and J. M. Marzluff, editors. Radio tracking and animal populations. Academic Press, San Diego, California, USA.
Kerttula, A. M. 2000. Antler on the sea: the Yup’ik and Chukchi of the Russian Far
East. Cornell University Press, Ithaca, New York, USA. Kofinas, G. with the communities of Aklavik, Arctic Village, Old Crow, and Fort
McPherson. 2002. Community contributions to ecological monitoring: Knowledge co-production in the US-Canada Arctic Borderlands. Pages 54-91 in I. Krupnik and D. Jolly, editors. The earth is faster now: indigenous observation of Arctic environmental change. Arctic Research Consortium of the United States, Fairbanks, Alaska, USA.
Koskey, M. S. 2003. Cultural activity and market enterprise: a circumpolar comparison
of reindeer herding communities at the end of the 20th Century. Dissertation. University of Alaska, Fairbanks, Alaska, USA.
Koutsky, K. 1981. Early Days on Norton Sound and Bering Strait: an overview of
historic sites in the BSNC Region. Volume III: The Port Clarence and Kauwerak Areas. Anthropology and Historic Preservation Cooperative Park Studies Unit, University of Alaska, Fairbanks, Alaska, USA.
Krupnik, I. 2000. Reindeer pastoralism in modern Siberia: research and survival during
the time of crash. Polar Research 19:49-56. Krupnik, I. 2002. Watching ice and weather our way. Pages 156-197 in I. Krupnik and
D. Jolly, editors. The earth is faster now: indigenous observation of Arctic environmental change. Arctic Research Consortium of the United States, Fairbanks, Alaska, USA.
Krupnik, I. and D. Jolly, editors. 2002. The earth is faster now: indigenous observation
of Arctic environmental change. Arctic Research Consortium of the United States, Fairbanks, Alaska, USA.

158
Kruse, J. A. 1991. Alaska Inupiat subsistence and wage employment patterns: understanding individual choice. Human Organization 50:317-326.
Kruse, J. A., R. G. White, H. E. Epstein, B. Archie, M. Berman, S. R. Braund, F. S.
Chapin, J. Charlie, C. J. Daniel, J. Eamer, N. Flanders, B. Griffith, S. Haley, L. Huskey, B. Joseph, D. R. Klein, G. P. Kofinas, S. M. Martin, S. M. Murphy, W. Nebesky, C. Nicolson, D. E. Russell, J. Tetlichi, A. Tussing, M. D. Walker, O. R. Young. 2004. Modeling sustainability of arctic communities: an interdisciplinary collaboration of researchers and local knowledge holders. Ecosystems 7:815-828.
Kuropat, P. J. 1984. Foraging behavior of caribou on a calving ground in Northwestern
Alaska. Thesis. University of Alaska, Fairbanks, Alaska, USA. Kusugak, J. A. 2002. Where a storm is a symphony and land and ice are one. Pages v-vii
in I. Krupnik and D. Jolly, editors. The earth is faster now: indigenous observation of Arctic environmental change. Arctic Research Consortium of the United States, Fairbanks, Alaska, USA.
Machida, S., J. Dau, and G. Carroll. 1993. Caribou. Pages 174-189 in S. M. Abbott,
editor. Management report of survey-inventory activities 1 July 1990 - 30 June 1992. Alaska Department of Fish and Game, Federal Aid in Wildlife Restoration Project W-23-5 and W-24-1, Study, 3.0, Juneau, Alaska, USA.
Menadelook, R. 2003. Oral history interview, March 24, 2003. William Schneider,
interviewer. University of Alaska Fairbanks, Oral History Collection H2000-102-26.
Miller, F. L., A. Gunn, and E. Broughton. 1985. Surplus killing as exemplified by wolf
predation on newborn caribou. Canadian Journal of Zoology 63:295-300. Myers, H., H. Fast, M. Kislalioglu Berkes, and F. Berkes. 2005. Feeding the family in
times of change. Pages 23-45 in F. Berkes, R. Huebert, H. Fast, M. Manseau, and A. Diduck, editors. Breaking ice: renewable resource and ocean management in the Canadian north. University of Calgary Press, Calgary, Canada.
Myneni, R. B., C. D. Keeling, C. J. Tucker, G. Asrar, and R. R. Nemani. 1997.
Increased plant growth in the northern high latitudes from 1981 to 1991. Nature 386:698-702.
National Oceanographic and Atmospheric Administration National Weather
Service (NWS). 2006. NWS windchill temperature index. [online] URL: http://www.weather.gov/om/windchill/

159
Nuttall, M., F. Berkes, B. Forbes, G. Kofinas, T. Vlassova, and G. Wenzel. 2005. Hunting, herding, fishing, and gathering: indigenous peoples and renewable resource use in the Arctic. Pages 649-690 in ACIA. Impacts of a warming Arctic: Arctic climate impact assessment. Cambridge University Press, New York, New York, USA.
Oleson, H. 2005. Changing strategies in Seward Peninsula reindeer (Rangifer tarandus
tarandus) management. Thesis. University of Alaska, Fairbanks, Alaska, USA. Orth, D. J. 1967. Dictionary of Alaska place names. Geological Survey Professional
Paper 567. U.S. Government Printing Office, Washington, D.C., USA. Paine, R. 1988. Reindeer and caribou Rangifer tarandus in the wild and under
pastoralism. Polar Record 24:31-42. Parker, K. L., P. S. Barboza, and T. R. Stephenson. 2005. Protein conservation in
female caribou (Rangifer tarandus): effects of decreasing diet quality during winter. Journal of Mammalogy 86:610-622.
Pelto, P. J. 1987. The snowmobile revolution: technology and social change in the
Arctic. Reissued with changes of 1973 edition. Waveland Press, Inc., Prospect Heights, Illinois, USA.
Pika, A. 1999. Neotraditionalism in the Russian north. University of Washington Press,
Seattle, USA. Pruitt, W. O. Jr. 1959. Snow as a factor in the winter ecology of the barren ground
caribou (Rangifer arcticus). Arctic 12:159-179. Rennick, P. 1987. Alaska’s Seward Peninsula: Ancient men, missionaries, and miners.
Alaska Geographic 14:21-31. Riedlinger, D. and F. Berkes. 2001. Contributions of traditional knowledge to
understanding climate change in the Canadian Arctic. Polar Record 37:315-328. Robards, M. and L. Alessa. 2004. Timescapes of community resilience and
vulnerability in the circumpolar north. Arctic 57:415-427. Robinson, S. R. and M. Leykom. 1991. Movements and distribution of radio-collared
caribou in the Buckland Valley and Nulato Hills, Winter of 1989-90. BLM-Alaska Open File Report 33, Anchorage, Alaska, USA.
Ryan, W. L. and R. D. Crissman, editors. 1990. Cold regions hydrology and
hydraulics. American Society of Civil Engineers, New York, NY, USA.

160
Sagoonick, P. 2003. Oral history interview, August 7, 2003. William Schneider,
interviewer. University of Alaska Fairbanks, Oral History Collection H2000-102-32.
Salin, T., E. Helander, and T. Mustonen. 2004a. Sámi nation environmental concerns
from the Kaldoaivi reindeer herding region [Communities of Ohcejohka (Utsjoki) and Nuorgam]. Pages 288-301 in E. Helander and T. Mustonen, editors. Snowscapes, dreamscapes: snowchange book on community voices of change. Tampere Polytechnic Publications, Fram Oy, Vaasa, Finland.
Salin, T., M. Nieminem, and T. Mustonen. 2004b. Sámi nation environmental concerns
from the community of Purnumukka and the Vuotso region. Pages 273-282 in E. Helander and T. Mustonen, editors. Snowscapes, dreamscapes: snowchange book on community voices of change. Tampere Polytechnic Publications, Fram Oy, Vaasa, Finland.
Schneider, W. S. 2002a. Les éleveurs de rennes contemporarains de la Péninsule de
Seward: des réalistes qui ont le sens de l'histoire (Contemporary reindeer herders on the Seward Peninsula: realists with a sense of history). Anthropologie et Sociétés 26:161-177.
Schneider, W. S. 2002b. So they understand: cultural issues in oral history. Utah State
University Press, Logan, Utah, USA. Schneider, W. S., K. Kielland, and G. Finstad. 2005. Factors in the adaptation of
reindeer herders to caribou on the Seward Peninsula, Alaska. Arctic Anthropology, 42:36-49.
Schweitzer, P. P. and P. A. Gray. 2000. The Chukchi and Siberian Yupiit of the
Russian Far East. Pages 17-37 in M. M. R. Freeman, editor. Endangered peoples of the Arctic: struggles to survive and thrive. Greenwood Press, Westport, Connecticut, USA.
Seaman, D. E., and R. A. Powell. 1996. An evaluation of the accuracy of kernel density
estimators for home range analysis. Ecology 77:2075-2085. Seaman, D. E., J. J. Millspaugh, B. J. Kernohan, G. C. Brundige, K. J. Raedeke, and
R. A. Gitzen. 1999. Effects of sample size on kernel home range estimates. Journal of Wildlife Management 63:739-747.
Serreze, M. C., J. E. Walsh, F. S. Chapin, T. Osterkamp, M. Dyurgerov, V.
Romanovsky, W. C. Oechel, J. Morison, T. Zhange, and R. G. Barry. 2000.

161
Observational evidence of recent change in the northern high-latitude environment. Climate Change 46:159-207.
Simon, J. J. K. 1998. Twentieth century Inupiaq Eskimo reindeer herding on northern
Seward Peninsula, Alaska. Dissertation, University of Alaska, Fairbanks, Alaska, USA.
Skjenneberg, S. and L. Slagsvold. 1979. Reindeer husbandry and its ecological
principles (Reindriften og dens naturgrunnlag). T. T. Deehr, translator. C. M. Anderson and J. R. Luick, editors. Bureau of Indian Affairs, Juneau, Alaska, USA.
Skogland, T. 1984. Wild reindeer foraging-niche organization. Holarctic Ecology 7:345-
379.
Stalker, J. 2001. Oral history interview, January 25, 2001. William Schneider, interviewer. University of Alaska Fairbanks, Oral History Collection H2000-102-08.
Stern, R., E. Arobio, L. Naylor, and W. Thomas. 1980. Eskimos, reindeer, and land.
Agriculture Experiment Station, School of Agriculture and Land Resources Management, University of Alaska Fairbanks Bulletin 59.
Stone, R. S., E. G. Dutton, J. M. Harris, and D. Longenecker. 2002. Earlier spring
snowmelt in northern Alaska as an indicator of climate change. Journal of Geophysical Research 107:1-27.
Tape, K., M. Sturm, and C. Racine. 2006. The evidence for shrub expansion in northern Alaska and the Pan-Arctic. Global Change Biology 12:686-702.
Thomas, C. S. 1999. Understanding and evaluating Alaska issues and public policies.
Pages 1-16 in C. S. Thomas, editor. Alaska Public Policy Issues: Background and Perspectives. Denali Press, Juneau, Alaska, USA.
Walker, B., C. S. Holling, S. R. Carpenter, and R. Kinzig. 2004. Resilience,
adaptability, and transformability in social-ecological systems. Ecology and Society 9(2):5. [online] URL: http:www.ecologyandsociety.org/vol9/iss2/art5.
Walsh, J. E., with O. Anisimov, J. O. M. Hagen, T. Jakobsson, J. Oerlemans, T. D.
Prowse, V. Romanovsky, N. Savelieva, M. Serreze, A. Shiklomanov, I. Shiklomanov, and S. Solomon. 2005a. Cryosphere and Hydrology. Pages 183-
162
242 in ACIA. Impacts of a warming Arctic: Arctic climate impact assessment. Cambridge University Press, New York, New York, USA.
Walsh, J. E., I. Shapiro, and T. L. Shy. 2005b. On the variability and predictability of
daily temperatures in the Arctic. Atmosphere-Ocean. 43:213-230. Weyiouanna, C. 2002. Oral history interview, April 5, 2002. William Schneider,
interviewer. University of Alaska Fairbanks, Oral History Collection H2000-102-22.
Whiting, A. 2002. Documenting Qikiktagrugmiut knowledge of environmental change.
Report, Native Village of Kotzebue, Alaska, USA. Whitten, K. R., G. W. Garner, F. J. Mauer, and R. B. Harris. 1992. Productivity and
early calf survival in the Porcupine Caribou Herd. Journal of Wildlife Management. 56:201-212.
Wiklund, E., G. Finstad, and P. J. Bechtel. 2005. Seasonal variation in carcass quality
of reindeer (Rangifer tarandus tarandus) from the Seward Peninsula, Alaska. Proceedings: 51st International Congress of Meat Science and Technology, 7-12 August, 2005, Baltimore, Maryland, USA.

163
APPENDIX A Definitions of terms and acronyms used in the text
Term Definition Adaptation "The capacity of actors in a system to influence resilience" (Walker et al. 2004).
ADF&G Alaska Department of Fish and Game
BIA Bureau of Indian Affairs
Break-up Transitional season and process by which waterway (sea, harbor, river, lake) ice and snow degrades in spring. This can coincide with reindeer calving.
Calf/calves Reindeer under one year of age. Herders more often use "fawn(s)", but the terms are used synonymously. "Calf" is used here as the term is used both by herders and in biological literature.
Comfort zone Area on the southern portion of Noyakuk's range where he is familiar enough with the terrain to travel even with reduced visibility; also where he prefers to keep his reindeer.
Calf:cow ratio Percent of calves to cows at a reindeer handling. This ratio is an estimate for the number of calves per possible births that spring, but not all females become pregnant each fall or maintain the pregnancy until spring. "Female reindeer" is used instead of "cows" elsewhere in the text.
Freeze-up Transitional season and process by which winter ice forms on waterways (sea, harbor, rivers, lakes) and snow cover accumulates in early winter.
Handling(s) Herding activity for which the reindeer are corralled. For summer handlings, calves are eartagged, Brucellosis is tested for or vaccinated against (if the herd has a history of the disease), and velvet antler is harvested. For winter handlings, mavericks are eartagged, antiparasitic treatment is administered, and slaughter may occur. Demographic data are also collected and a few reindeer may be satellite collared.
HOBO weather station
Micro weather station from Onset Computer Corporation that logged temperature, wind speed, and wind direction at critical herding sites on Noyakuk's range from February 15-May 29, 2004 and March 15-May 31, 2005.
Hollow ice Noyakuk's term for the phenomena whereby river ice is lifted by rising water levels (either due to rising temperatures or shifts in Imuruk basin currents) and remains elevated when the water recedes leaving a pocket of air between the water surface and the ice.
Neonate Newborn reindeer (or caribou) calf. Although a term not used by herders, it is used here to distinguish newborn calves from calves that are more than one week old and are thus more mobile and better able to avoid predators according to Noyakuk.
NWS National Weather Service
Participatory mapping
Interview format during which open-ended questions are asked while looking over a map and the consultant is asked to draw or indicate spatial information on the map.

164
Parturient Pregnant. "Parturient" is the term used in biological literature, but "pregnant" is used in the text as "parturient" is not used by herders.
PTT Platform Terminal Transmitter: satellite transmitting components of reindeer or wildlife radio collars
Refugia Area designated by a herder on his/her range, or that is shared by joint agreement with a neighboring herder, for the purpose of segregating reindeer from incoming caribou.
Resilience "The potential of a social-ecological system to remain in a particular configuration, maintaining its feedbacks and functions following disturbance and stresses, or involves the ability of that system to reorganize into an alternative but functional state following profound, disturbance-driven change." (Robards and Alessa, 2004)
RHA Reindeer Herders Association
Sastrugi Scientific term for Noyakuk's "wind waves" (see below). “Irrregular rides up to 2 meters high formed on a relatively flat snow surface by wind erosion, aligned parallel to the wind direction with steep, concave or overhanging windward faces” (Ryan and Crissman 1990).
Snowmachine "Snowmachine" is the more commonly used term for snowmobile in Alaska. In particular, reindeer herders use "snowmachine" or "snowgo". A "sled", in this case, refers to a large wooden or plastic sled on runners that is towed by the snowmachine to haul gear or meat.
Social-ecological system (SES)
Complex system describing the relationship between people and their environment. SES's can be defined at varying spatial and temporal scales (Robards and Alessa 2004).
Steer Castrated male reindeer
TEK/LK Traditional Ecological Knowledge / Local Knowledge. Basically, "the system of experiential knowledge gained by continual observation and transmitted among members of a community" (Huntington 1998). See pages 10-11 for a more extensive discussion of the attributes of TEK and LK.
RRP University of Alaska Fairbanks - Reindeer Research Program
USDA NRCS U.S. Department of Agriculture - Natural Resources Conservation Service
Velvet antler(s)
Antlers during the first growth phase that are covered with "fur" (velvet) and are vascular and innervated. Later, antlers become "hardened" when the velvet is shed and the vasculature dries prior to antler loss. This cycle is repeated annually but the seasonal timing of growth and loss varies by sex and age among reindeer. Herders use "horns" and "horn buyers" synonymously with "antlers" and "antler buyers", but antlers are the technical biological term because of the annual cycle of growth and loss.
WAH Western Arctic (caribou) Herd
WERC University of Alaska Fairbanks - Water and Environmental Research Center

165
Wild reindeer In Alaska, herders use this term to describe an individual reindeer or group of reindeer (Rangifer tarandus tarandus) that has lower range fidelity than its counterparts and that may not have been managed (moved or corralled) for several years. Thus, when reintegrated with a managed herd, this individual may disrupt the herding process by splintering from the main group. In Russia, "wild reindeer" refers to caribou.
WCT Windchill temperature, or windchill equivalent temperature. Windchill temperature is “a measure of the combined cooling effect of wind and air temperature" on humans and animals via increased heat loss (NWS 2006). Windchill affects inanimate objects only by hastening the cooling of objects (e.g., vehicle radiator) to the air temperature (NWS 2006).
Wind waves Noyakuk's term for wind-hardened snow drifts that form wave-like patterns on the snow surface. The scientific term is "sastrugi".
Wind roses Circular or polar plot where stacked bars point from the center of the plot in one or more directions to show the percentage of wind recordings per combination of wind speed and wind direction category.

166
APPENDIX B Informed consent and release forms
Reindeer Herding and Climate Change on the Seward Peninsula, Alaska
IRB # 03-65 Date Approved : March 22, 2004
Field and Mapping Work - Informed Consent I am asking for your help with my graduate project. I would like to work with you to understand winter reindeer herding and how it may be affected by climate change. If you decide to help, I will ask to interview you out on your range and another time indoors where we can look at maps. For the field interview, you and I will travel to one of the weather stations and talk about weather and snow conditions that are important for herding. For the indoor interview, we will look at maps and talk about local weather, travel routes, and important places for reindeer herding. I will also call you on a regular basis during the winter to ask about conditions that you experience while traveling on the land and working with your reindeer. This study will produce reports and maps showing how winter herding relates to reindeer and caribou locations, the weather, environment, and vegetation. As we work together, you can tell me what I can include in my thesis paper, publications and presentations about this project. You will receive 20 gallons of gas for the time that we spend talking on your range and $50 for the indoor, mapping interview. I will give you copies of my thesis paper, maps, and any publications. Copies of my thesis paper, maps, and any publications will be given to the University of Alaska Fairbanks and to RHA in Nome. Your decision to take part in the study is voluntary and you are free to choose not to take part in the study or to stop taking part at any time. If you have questions now, please feel free to ask me. If you have questions later, you may contact me or any of my advisors, Rose Fosdick, or the Research Coordinator in the Office of Research Integrity at UAF. Please see the next page for our contact information. Statement of Consent: I ___________________________ understand the procedures described above. My questions have been answered to my satisfaction, and I agree to participate in this study. I have been provided a copy of this form. _______________________________________________________ Signature & Date _______________________________________________________ Print Name _______________________________________________________ Signature of Person Obtaining Consent & Date (Kumi Rattenbury)

167
_______________________________________________________ Signature of Advisor & Date Contact Information: Kumi Rattenbury, UAF-Biology Daytime phone: (907) 474-7568 Home phone: (907) 451-0727 Fax (907) 474-6967 PO Box 757000, Fairbanks, Alaska 99775 Email: [email protected] Knut Kielland, UAF-Biology Phone: (907) 474-7164 Fax: (907) 474-6967 Institute of Arctic Biology UAF, Fairbanks, AK 99775 Email: [email protected] Greg Finstad UAF-Reindeer Research Program Phone: (907) 474-6055 Fax: (907) 474-7175 P.O. Box 757200, Fairbanks, AK 99775 Email: [email protected] Bill Schneider, UAF-Oral History Program Phone: (907) 474-5355 219 Rasmuson Library Fairbanks, AK 99775 Email: [email protected] Rose Fosdick Director, Reindeer Herders Assoc. Phone: (907) 443-4377 Fax: (907) 443-5488 PO Box 948, Nome, Alaska 99762 Email: [email protected] If you have any questions or concerns about your rights as a study participant, please contact the Research Coordinator in the Office of Research Integrity at 474-7800 (Fairbanks area) or 1-866-876-7800 (outside the Fairbanks area) or e-mail [email protected]. Please identify the research study number of 03-65.

168
Reindeer Herding and Climate Change on the Seward Peninsula, Alaska IRB # _03-65_ Date Approved _Mar 22, 2004
Release Form
Thank you for taking the time to interview with me. This Release Form will allow me to use the interview recording for my graduate research project. When this project is finished, I agree to give you all copies of the recording and a copy of my thesis paper, maps and any publications. Any further uses of the recording, including storing it in an archive, will need your permission on a new form. Please sign below if you agree to this Release Form. Signature & Date Signature of Person Obtaining Consent & Date (Kumi Rattenbury) Signature of Advisor & Date

169
APPENDIX C Structured survey questions
Survey – Weather and snow effects on winter reindeer herding My study about weather and climate is a continuation of research conducted by Greg Finstad, Knut Kielland, and Bill Schneider. Weather and travel conditions can make a difference in how you care for your reindeer herd. This survey will help me to understand what you consider to be satisfactory conditions for herding. 1) How many years have you been herding reindeer? 2) What weather conditions do you need to travel to your reindeer? 3) What travel conditions (snow, ice) do you need to travel to your reindeer? 4) What weather conditions do you need to drive your reindeer? 5) What travel conditions do you need to drive your reindeer? 6) What weather and travel conditions would you NOT herd reindeer in? Cold Temperatures 7) What is the coldest temperature you would travel in to get to your reindeer?
8) How about for slaughtering? 9) How about for moving reindeer?
Wind 10) What maximum wind speeds would you travel in to get to your reindeer? 11) What is the lowest WCT you would travel in? Visibility 12) What is the minimum visibility that you would travel in? 13) How about for moving reindeer? Snow conditions 14) What is the minimum amount of snow needed to travel to your reindeer? 15) How about for moving reindeer? 16) If the snow is soft and deep, how deep is too deep for traveling to your reindeer?

170
17) How about for moving reindeer? 18) What is the maximum distance you are willing to travel when the snow is rough? 19) What is the maximum distance you are willing to drive reindeer when the snow is rough? Terrain 20) Are there any problem areas (e.g. steep terrain, water bodies that need to freeze-up) on your range that you have to consider before traveling to your reindeer? 21) How about for driving reindeer (e.g. such as to the fawning site)? Break-up and Freeze-up 22) When does freeze-up usually happen for your range? 23) When are you (normally) first able to get out to your reindeer in the early winter? 24) Are you able to get to your reindeer during fawning season?
25) When do you expect break-up to happen on your range? Weather expectations 26) What kind of weather and travel conditions do you expect in the early winter? 27) What kind of weather and travel conditions do you expect in mid-winter? 28) What kind of weather and travel conditions do you expect during fawning season? Current Conditions 29) How would you rate travel conditions for this winter? Please circle one:
(1) Travel is easier than in most years. (2) Travel is more difficult than in most years. (3) There is no difference between this year and most years past.
30) How would you rate weather conditions for this winter? Please circle one:
(1) The weather made travel easier than in most years. (2) The weather made travel more difficult than in most years. (3) No difference.
31) Have you noticed any changes in your usual winter travel routes? If so, what?

171
32) Have you noticed any changes in the timing that you can use these routes? If so, what? 33) Is there anything more that you think I should know about how weather and travel conditions affect reindeer herding? If you are interested, I would like to have a more in-depth interview with you to discuss the details about weather and travel conditions on your range, and about the ways that weather affects management of your herd. Would you be interested in talking with me?
Copyright © 2022 FDOKUMEN