Actin up: regulation of podocyte structure and function by components of the actin cytoskeleton
Upload
keiopublichealthCategory
view
0download
0
ARTICLE
Received 8 Dec 2013 | Accepted 31 Jan 2014 | Published 26 Feb 2014
Regulation of MKL1 via actin cytoskeleton dynamicsdrives adipocyte differentiationHiroyuki Nobusue1,2, Nobuyuki Onishi2, Takatsune Shimizu2,3, Eiji Sugihara2,3, Yoshinao Oki1, Yuko Sumikawa1,
Tatsuyuki Chiyoda2, Koichi Akashi4, Hideyuki Saya2,3 & Koichiro Kano1
Cellular differentiation is regulated through activation and repression of defined transcription
factors. A hallmark of differentiation is a pronounced change in cell shape, which is
determined by dynamics of the actin cytoskeleton. Here we show that regulation of the
transcriptional coactivator MKL1 (megakaryoblastic leukemia 1) by actin cytoskeleton
dynamics drives adipocyte differentiation mediated by peroxisome proliferator–activated
receptor g (PPARg), a master transcriptional regulator of adipogenesis. Induction of adipocyte
differentiation results in disruption of actin stress fibres through downregulation of
RhoA-ROCK signalling. The consequent rapid increase in monomeric G-actin leads to the
interaction of G-actin with MKL1, which prevents nuclear translocation of MKL1 and allows
expression of PPARg followed by adipogenic differentiation. Moreover, we found that MKL1
and PPARg act in a mutually antagonistic manner in the adipocytic differentiation programme.
Our findings thus provide new mechanistic insight into the relation between the dynamics of
cell shape and transcriptional regulation during cellular differentiation.
DOI: 10.1038/ncomms4368
1 Laboratory of Cell and Tissue Biology, College of Bioresource Sciences, Nihon University, Fujisawa, Kanagawa 252-0880, Japan. 2 Division of GeneRegulation, Institute for Advanced Medical Research, Keio University School of Medicine, Tokyo 160-8582, Japan. 3 Japan Science and Technology Agency,Core Research for Evolutional Science and Technology (CREST), Tokyo 102-0076, Japan. 4 Department of Medicine and Biosystemic Science, KyushuUniversity Graduate School of Medical Science, Fukuoka 812-8582, Japan. Correspondence and requests for materials should be addressed to H.S.(email: [email protected]) or to K.K. (email: [email protected]).
NATURE COMMUNICATIONS | 5:3368 | DOI: 10.1038/ncomms4368 | www.nature.com/naturecommunications 1
& 2014 Macmillan Publishers Limited. All rights reserved.

Activation and repression of defined transcription factorsare essential for the commitment of progenitors to aspecific differentiation lineage, setting the stage for a gene
expression pattern characteristic of each mature cell type1–3.Adipocyte differentiation is regulated by multiple transcriptionfactors, with PPARg and members of the CCAAT/enhancer-binding protein (C/EBP) family having central roles. Cooperativeinteractions among these transcription factors drive theexpression of downstream target genes that are necessary forthe generation and maintenance of adipocyte characteristics suchas lipid accumulation and insulin sensitivity4. The key roleof PPARg in the commitment of mesenchymal precursors tothe adipocytic differentiation programme is evident from theobservation that forced expression of this protein stimulatesadipogenesis in nonadipogenic fibroblastic cell lines, such as NIH3T3 and 3T3-C2 (refs 5,6). PPARg is thus thought to functionas an adipocyte-specific master switch in acquisition of theadipocytic phenotype7.
The adipocytic differentiation of fibroblastic preadipocytes isaccompanied by the adoption of a rounded morphology that ischaracteristic of mature adipocytes and allows for maximal lipidstorage8. Cell morphology is determined primarily by the actincytoskeleton9. Adipocyte differentiation is thus associated witha shift in the structures formed by filamentous (F) actin fromstress fibres to cortical fibres10,11. The relation between suchreorganization of the actin cytoskeleton and the PPARg-mediatedadipocytic differentiation programme has remained unclear,however.
We have previously established a preadipocyte cell linederived from mouse dedifferentiated fat (DFAT) cells andwhich possesses a higher potential to differentiate intoadipocytes compared with the mouse preadipocyte cell line3T3-L1 (ref. 12). Unlike 3T3-L1 cells, these DFAT cells do notundergo spontaneous adipogenesis, with the adipocyticdifferentiation of DFAT cells thus being more tightlycontrolled than that of 3T3-L1 cells12,13. Here, we examine theroles of actin cytoskeleton remodelling in adipocyticdifferentiation by using DFAT cells. We show that the rapiddisruption of actin stress fibres through downregulation ofRhoA-ROCK signalling and the consequent increase inmonomeric G-actin levels are observed before adipocytedifferentiation. We also found that interaction of monomericG-actin with the transcriptional coactivator MKL1 is the keyevent for initiating PPARg expression. Moreover, MKL1and PPARg were shown to act in a mutually antagonisticmanner in the adipocytic differentiation programme. Ourfindings provide a new insight into the regulatory mechanismof adipocyte differentiation.
ResultsAdipogenesis requires disruption of actin stress fibres. Wefirst examined the changes in the actin cytoskeleton and PPARgexpression during adipogenesis with the use of an establishedDFAT cell line. Before induction of adipogenesis, DFAT cellsmanifest a fibroblastic morphology with well-developed actinstress fibres (Fig. 1a). At 24 h after the induction of adipocyticdifferentiation with the combination of 3-isobutyl-1-methyl-xanthine (IBMX), dexamethasone and insulin, the cells exhibit awell-spread morphology associated with the disruption of moststress fibres (Fig. 1a,c; Supplementary Movie 1). The upregulationof PPARg expression at both mRNA and protein levels is evidentat 48 h (Fig. 1a,b), at which time the cell morphology has becomestellate and the cortical actin structures characteristic of adipo-cytes are evident (Fig. 1a). The expression of perilipin (a markerof terminal adipocyte differentiation) and the accumulation oflipid droplets are observed from 60 h, at which time the cellmorphology has become more rounded (Fig. 1a). Together, theseresults thus suggested that disruption of actin stress fibres pre-cedes the induction of PPARg expression during adipocytedifferentiation.
Previous studies have shown that actin cytoskeleton dynamicsassociated with cell rounding in response to mechanical orphysical stimuli (such as matrix stiffness and cytoskeletal tension)result in adipogenic differentiation of 3T3-F442A preadipocytesor mesenchymal stem cells by a mechanism that involvesRhoA-ROCK (Rho-kinase) signalling14–18, which regulates theformation of actin stress fibres and focal adhesions19,20. On theother hand, ectopic expression of PPARg in mesenchymal stemcells or NIH 3T3 fibroblasts has been found to induce not onlyexpression of adipose-specific genes but also morphologicaldifferentiation, including the accumulation of triglyceridedroplets5,21–24. It has remained unknown, however, whether thepathways underlying the induction of adipogenesis either byPPARg or by changes in cell shape operate independently of eachother or in an interdependent manner. To address this question,we tested the effects both of RNA interference (RNAi)-mediateddepletion of cofilin1, a protein that promotes the disassemblyof actin filaments25, and of phalloidin (a cytoskeletal fixative)on PPARg expression during adipocyte differentiation. Eitherknockdown of cofilin1 with specific small interfering RNAs(siRNAs) or treatment with phalloidin blocked the disruptionof actin stress fibres as well as markedly inhibited both theupregulation of PPARg and PPARg target gene expression andthe accumulation of lipid droplets elicited by inducers ofadipocyte differentiation in DFAT cells and 3T3-L1 pre-adipocytes (Fig. 1d,e; Supplementary Fig. 1). These data thusindicated that the disruption of actin stress fibres is required
Figure 1 | Disruption of actin stress fibres is required for adipocyte differentiation. (a) Fluorescence microscopy of the actin cytoskeleton (stained with
phalloidin) as well as of PPARg or perilipin expression during adipogenesis in DFAT cells. Nuclei were stained with Hoechst 33342 (blue fluorescence).
Scale bars, 20mm. (b) Relative abundance of Pparg mRNA during adipocytic differentiation in DFAT cells (left panel). (a–f) Po0.05, Tukey’s honest
significant difference test. A nuclear fraction prepared from the cells was also subjected to immunoblot analysis of PPARg and lamin C (loading control)
(right panel). (c) Time-lapse imaging of DFATcells expressing red fluorescent protein (RFP)–tagged actin at the indicated times (hours:minutes). Scale bars,
50mm. (d) 3T3-L1 preadipocytes transfected with cofilin1 (siCfl1-a) or control (siControl) siRNAs were exposed to inducers of differentiation for 96 h.
They were then subjected to fluorescence microscopic analysis of the actin cytoskeleton and PPARg expression. Nuclei were stained with Hoechst 33342.
Scale bars, 50mm. Relative abundance of Pparg, Cebpa, Fabp4, Slc2a4 and Plin1 mRNAs. *Po0.05, Student’s t-test. (e) Oil red O (ORO) staining of cells
treated as in d. Bars, 100mm. The absorbance at 510 nm (A510) of dye extracted from the stained cells was also determined. *Po0.05, Student’s t-test.
(f) Immunoblot analysis of active and total forms of Rho proteins during adipocyte differentiation in DFAT cells (left panels). GAPDH was examined as
a loading control. Quantification of the immunoblotting data was performed using densitometry. Data were normalized to the amount of total Rho
(right panel). *Po0.05, Student’s t-test. n.s., not significant. (g) Fluorescence microscopy of the actin cytoskeleton as well as of PPARg or perilipin
expression in DFAT cells expressing HA-tagged RhoAV14 or RhoAN19 and exposed for 96 h to inducers of differentiation in the absence or presence
of Y-27632 (30mM) or CytD (0.2mM). Nuclei were stained with Hoechst 33342. Scale bars, 20mm. At least 50 HA-positive cells were scored for
determination of the percentage of those expressing PPARg. *Po0.05, Student’s t-test. All quantitative data are means±s.d. (n¼ 3 experiments fibres).
ARTICLE NATURE COMMUNICATIONS | DOI: 10.1038/ncomms4368
2 NATURE COMMUNICATIONS | 5:3368 | DOI: 10.1038/ncomms4368 | www.nature.com/naturecommunications
& 2014 Macmillan Publishers Limited. All rights reserved.

for the induction of PPARg expression during adipocytedifferentiation.
RhoA-ROCK signalling regulates adipogenesis. We nextinvestigated whether RhoA-ROCK signalling plays a role in
adipogenic differentiation dependent on the disruption of actinstress fibres in DFAT cells. The GTP-bound (active) form of Rhoproteins was detected at a high level before adipogenic inductionand was markedly reduced in abundance within 24 h afterexposure of the cells to inducers of adipocyte differentiation
0 h 0 h
24 h
48 h
48 h
siControl
siControl
siCfl1
siCfl1
60 h 96 h15:30
03:00 05:00
16:00
10:00
16:30
14:30
18:30
48 h
24 h
F-actin/nucleus
Per
ilipi
n/F
-act
in
HA
/Per
ilipi
nH
A/P
PAR
γ
F-a
ctin
F-actin/nucleus PPARγ
1.2
PPARγ
Lamin C
RF
P-a
ctin
Act
ive/
tota
l Rho
A r
atio
0 h 24 h 48 h
0 h
0 h
Active Rho
Total Rho
GAPDH
24 h
24 h
48 h
1.2
1.0
0.8
0.6
0.4
0.2
0
1.2
1.0
0.8
0.6
0.4
0.2
0siControl siCfl1
siControl siCfl1siControl siCfl1
siControl siCfl1
siControl siCfl1
siControl
siControl
siCfl1
siCfl1
1.2
100
80
60
40
20
0RhoAV14
HA-RhoAV14 HA-RhoAN19HA-RhoAV14
+ CytDHA-RhoAV14
+ Y-27632
RhoAV19 RhoAV14+ Y-27632
RhoAV14+ CytD
1.0
0.8
0.6
0.4
0.2
0
1.2
1.0
0.8
0.6
0.4
0.2
0
0
0.02
0.04
0.06
0.08
0.10
0.12
A51
0
1.2
1.0
0.8
0.6
0.4
0.2
0
1.2
1.0
0.8
0.6
0.4
0.2
0
n.s.
*
*
*
**
*
*
*n.s. n.s.
48 h
20 kDa
20 kDa
40 kDa
96 h60 kDa
60 kDa
50 kDa
1.0
0.8
0.6
0.4
Ppa
rg/G
apdh
mR
NA
rat
io
Ppa
rg/G
apdh
mR
NA
rat
io
PPA
Rγ-
expr
essi
ng c
ells
(%
)
Ceb
pa/G
apdh
mR
NA
rat
io
Slc
2a4/
Gap
dh m
RN
A r
atio
Fabp
4/G
apdh
mR
NA
rat
io
Plin
1/G
apdh
mR
NA
rat
io
0.2
00 12 24 36 48 60 72 96
a a ab
c
de
f
Time of differentiation (h)
PPARγ
60 h 60 h
96 h 96 h
PPA
Rγ
OR
O
HA
/F-a
ctin
NATURE COMMUNICATIONS | DOI: 10.1038/ncomms4368 ARTICLE
NATURE COMMUNICATIONS | 5:3368 | DOI: 10.1038/ncomms4368 | www.nature.com/naturecommunications 3
& 2014 Macmillan Publishers Limited. All rights reserved.

(Fig. 1f). We transiently transfected DFAT cells with plasmidsencoding hemagglutinin epitope (HA)–tagged dominant active(RhoAV14) or dominant negative (RhoAN19) mutants of RhoAand then exposed the cells to inducers of adipocytic differentia-tion for 96 h. Expression of RhoAV14 inhibited both remodellingof the actin cytoskeleton as well as the induction of PPARg andperilipin expression, and these inhibitory effects were preventedby treatment with the ROCK inhibitor Y-27632 (Fig. 1g). We alsodetermined whether the effects of ROCK inhibition in RhoAV14-expressing cells were mimicked by the actin-depolymerizingagent cytochalasin D (CytD). The addition of CytD indeedrestored remodelling of the actin cytoskeleton as well as theexpression of PPARg and perilipin in RhoAV14-expressing cellsto levels similar to those apparent in RhoAV14-expressing cellstreated with Y-27632 or in cells expressing RhoAN19 (Fig. 1g).These results thus indicated that RhoA-ROCK signalling reg-ulates adipocyte differentiation through control of remodelling ofthe actin cytoskeleton.
G-actin induces adipogenesis by controling MKL1 localization.Recent studies have identified mechanisms by which actindynamics directly affect gene transcription26. Monomeric G-actinbinds to the transcriptional coactivator MKL1 (also known asMAL or MRTF-A) and prevents it from translocating to thenucleus and activating transcription27,28. Furthermore, inmultipotent mesenchymal stem cells, Med23 functions as amolecular switch between ELK1 and MKL1 that controlsdifferentiation into adipocytes or smooth muscle cells29,suggesting links between MKL1 and adipogenesis. To explorewhether the control of MKL1 translocation by cellular G-actincontributes to the regulation of PPARg expression and adipocytedifferentiation, we established DFAT cells expressing mCherryfused to MKL1 (mCherry-MKL1; Supplementary Fig. 2a) andinvestigated G-actin levels and mCherry-MKL1 localizationbefore and after the induction of adipocyte differentiation.F-actin was rapidly depolymerized to monomeric G-actin afterthe induction of adipocyte differentiation, with the increase incellular G-actin concentration (Fig. 2a). mCherry-MKL1 wasdetected exclusively in the nucleus before adipogenic inductionbut was predominantly pancellular and/or cytoplasmic after theinduction of adipogenesis (Fig. 2a). PPARg expression wasdetected in cells having the cytoplasmic localization of mCherry-MKL1 (Supplementary Fig. 2b).
We next tested whether actin-depolymerizing agents latrun-culin A (LatA), which increases monomeric G-actin27,30, orswinholide A (SwinA), which increases dimeric actin that doesnot interact with MKL1 (refs 27,30,31), might mimic the effectsof inducers of adipogenesis on dynamics of the actincytoskeleton and MKL1 localization in DFAT cells expressingmCherry-MKL1. Indeed, LatA or SwinA induced disruption ofactin stress fibres and increased the cellular abundance of G-actinmonomers or dimers, respectively (Fig. 2b; Supplementary
Fig. 2c). LatA treatment caused the cytoplasmic sequestrationof mCherry-MKL1, whereas SwinA treatment resulted in thenuclear localization (Fig. 2b). Furthermore, LatA alone induceda significant increase in the expression of PPARg andPPARg target genes unlike SwinA (Fig. 2c,d). These resultssuggested that monomeric G-actin formation leads to adipocytedifferentiation by blocking the nuclear import of MKL1, butnot by other consequences of disruption of actin stressfibres. Similarly to LatA, treatment with Y-27632, eliciteddisruption of actin stress fibres and the cytoplasmicsequestration of MKL1, resulting in a marked increase in theexpression of PPARg and PPARg-target genes as well as in theaccumulation of lipid droplets in DFAT cells and 3T3-L1preadipocytes (Supplementary Fig. 3).
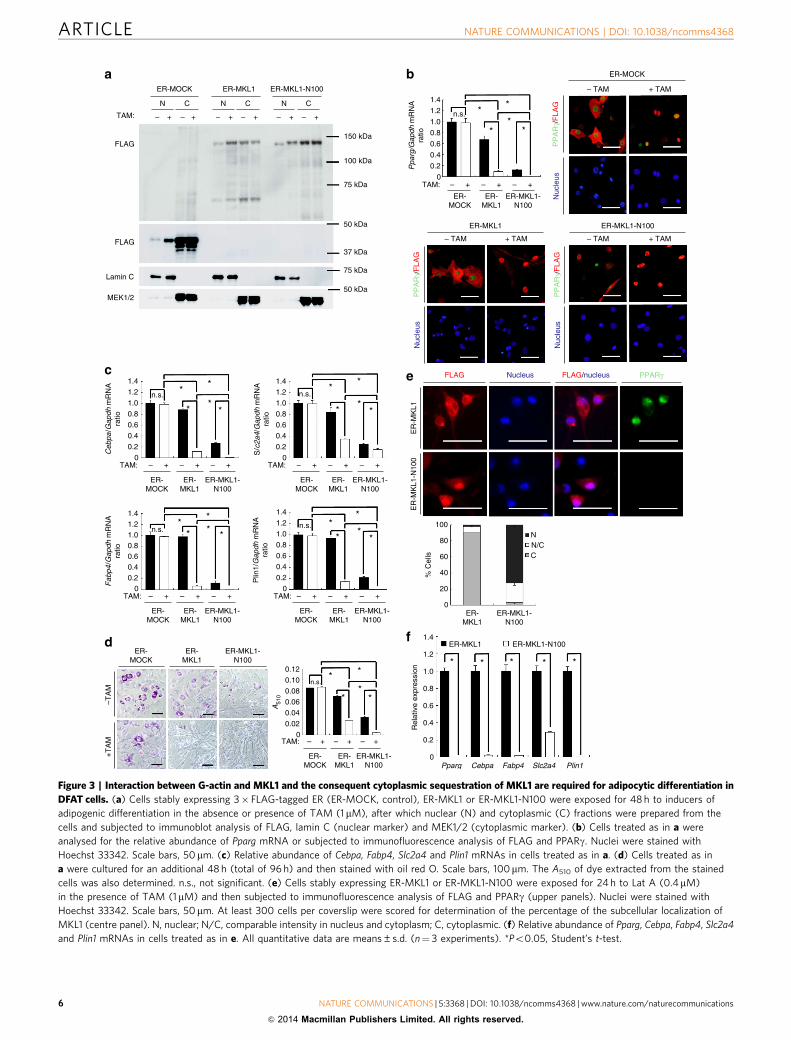
Adipogenesis requires interaction between G-actin and MKL1.We also asked whether the interaction between G-actin andMKL1 and the consequent cytoplasmic sequestration of MKL1contribute to adipocyte differentiation. To address this issue,we established DFAT cells and 3T3-L1 preadipocytes that expressa FLAG epitope–tagged fusion protein of the oestrogen receptor(ER) and either MKL1 or a deletion mutant of MKL1 (MKL1-N100) that lacks the 100 NH2-terminal amino acids of thefull-length protein and therefore does not contain the RPELactin-binding domain32,33 (Supplementary Fig. 4a). Exposure ofthese cells to the ER agonist 4-hydroxytamoxifen (TAM) inducedthe nuclear translocation of each fusion protein (Fig. 3a). Thenuclear translocation of ER-MKL1 was accompanied by a markeddecrease in the expression of PPARg and PPARg target genesas well as in the accumulation of lipid droplets in cells alsoexposed to inducers of adipocytic differentiation (Fig. 3b–d;Supplementary Fig. 4b–d). Moreover, expression of ER-MKL1-N100, which fails to bind G-actin and a substantial proportion ofwhich was localized to the nucleus even in the absence of TAM(Fig. 3b; Supplementary Fig. 4b), resulted in marked suppressionof adipogenesis in the absence or presence of TAM comparedwith that apparent in cells expressing ER-MKL1 (Fig. 3b–d;Supplementary Fig. 4b–d). We also tested if ER-MKL1-N100reverts the effects elicited by treatment with LatA in DFAT cellsand 3T3-L1 preadipocytes. The expression of ER-MKL1-N100,which was predominantly localized to the nucleus even aftertreatment with LatA and remarkably impaired the expression ofPPARg and PPARg target genes compared with that of ER-MKL1(Fig. 3e,f; Supplementary Fig. 4e,f). These findings significantlystrengthen our conclusion that the increase in the cytoplasmicabundance of G-actin triggers adipocyte differentiation viaregulation of the subcellular localization of MKL1.
Loss of MKL1 drives adipocyte differentiation. We furtherassessed whether RNAi-mediated depletion of MKL1 alone mightinduce PPARg expression and adipocyte differentiation in theabsence of an adipogenic cocktail. In both DFAT cells and 3T3-L1
Figure 2 | The increase of G-actin accumulation resulting from disruption of actin stress fibres is involved in the cytoplasmic sequestration of
MKL1 and adipocyte differentiation in DFAT cells. (a) Immunofluorescence analysis of mCherry and G-actin (stained with DNase I) in cells stably
expressing mCherry-MKL1 at 0 or 48 h after the induction of adipogenesis(upper panels). Nuclei were stained with Hoechst 33342. Scale bars, 100mm.
At least 300 cells per coverslip were scored for determination of the percentage of the subcellular localization of MKL1 (lower panel). N, nuclear;
N/C, comparable intensity in nucleus and cytoplasm; C, cytoplasmic. (b) Immunofluorescence analysis of mCherry and G-actin in mCherry-MKL1-
expressing cells exposed to Lat A (0.4 mM), Swin A (0.1mM) or dimethyl sulfoxide (DMSO, control) for 6 h in growth medium without an adipogenic
cocktail (upper panels). Nuclei were stained with Hoechst 33342. Scale bars, 50mm. Quantitation of immunofluorescence microscopy; localization
of the indicated mCherry-MKL1 was scored in 300 cells as in panel a (lower panel). (c) Relative abundance of Pparg, Cebpa, Fabp4, Slc2a4, and Plin1
mRNAs in cells treated as in b. ND, not detected. (d) Cells treated as in b were cultured for an additional 18 h (total of 24 h) and then subjected to
immunofluorescence analysis of mCherry and PPARg expression. Nuclei were stained with Hoechst 33342. Scale bars, 50mm. All quantitative data
are means±s.d. (n¼ 3 experiments). *Po0.05, Student’s t-test.
ARTICLE NATURE COMMUNICATIONS | DOI: 10.1038/ncomms4368
4 NATURE COMMUNICATIONS | 5:3368 | DOI: 10.1038/ncomms4368 | www.nature.com/naturecommunications
& 2014 Macmillan Publishers Limited. All rights reserved.

preadipocytes, knockdown of Mkl1 expression (SupplementaryFig. 5a) resulted in a marked increase both in the expressionof PPARg and PPARg target genes as well as in the extent oflipid droplet accumulation (Fig. 4a; Supplementary Fig. 5b,c).Moreover, we found that depletion of MKL1 alone resulted in a
marked increase in the expression of PPARg and PPARg targetgenes even in NIH 3T3 nonadipogenic fibroblasts (Fig. 4b;Supplementary Fig. 5a). These findings indicated that loss ofMKL1 function elicits PPARg expression and adipocyte differ-entiation in vitro.
G-actin
0 h
48 h
100
1.4
* *
*
**
*
ND
*
* *1.2
1.0
0.8
0.6
0.4
Ppa
rg/G
apdh
mR
NA
rat
io
0.2
0
1.4
1.2
1.0
0.8
0.6
0.4
Slc
2a4/
Gap
dh m
RN
A r
atio
0.2
0
1.4
1.2
1.0
0.8
0.6
0.4
Plin
1/G
apdh
mR
NA
rat
io
0.2
0
DMSO LatA
1.4
1.2
1.0
0.6
0.4
0.2
1.4
1.2
1.0
0.8
0.6
0.4
0.2
0
0
0.8
Ceb
pal/G
apdh
mR
NA
rat
ioFa
bp4/
Gap
dh m
RN
A r
atio
SwinA
DMSO LatA SwinA DMSO LatA SwinA
DMSO LatA SwinA
DMSO LatA SwinA
DMSO LatA SwinA
80
60
40
N
N/C
20
100N
N/C
C80
60
% C
ells
40
20
0
C
00 h
DM
SO
0.4
μM L
atA
0.1
μM S
win
A
DM
SO
0.4
μM L
atA
0.1
μM S
win
A
48 h
% C
ells
mCherry mCherry/nucleus
G-actin mCherry mCherry/nucleus mCherry mCherry/PPARγmCherry/nucleus
NATURE COMMUNICATIONS | DOI: 10.1038/ncomms4368 ARTICLE
NATURE COMMUNICATIONS | 5:3368 | DOI: 10.1038/ncomms4368 | www.nature.com/naturecommunications 5
& 2014 Macmillan Publishers Limited. All rights reserved.
ER-MOCK
N
TAM:
a
c
d
b
e
f
150 kDa
100 kDa
TAM: –
ER-MOCK
ER-MKL1
ER-MKL1
ER-MOCK
– TAM + TAM
ER
-MK
L1E
R-M
KL1
-N10
0
ER-MOCK
TAM:
0.2
0
0.4
0.6
S/c
2a4/
Gap
dh m
RN
Ara
tio 0.8
1.0
1.2
1.4
n.s.*
**
*
*
– + – + – +
ER-MKL1
ER-MKL1-N100
ER-MOCK
TAM:
0.2
0
0.4
0.6
Ceb
pa/G
apdh
mR
NA
ratio 0.8
1.0
1.2
1.4
n.s. *
**
*
*
– + – + – +
ER-MKL1
ER-MKL1-N100
ER-MOCK
TAM:
0.2
0
0.4
0.6
Plin
1/G
apdh
mR
NA
ratio 0.8
1.0
1.2
1.4
n.s. **
**
*
– + – + – +
ER-MKL1
ER-MKL1-N100
ER-MOCK
ER-MOCK
–TA
M+
TA
M
ER-MKL1
ER-MKL1-N100
0.12*
n.s.
**
*
*0.10
0.08
0.06
A51
0
0.04
0.02
0TAM: – + – + – +
0Pparg Cebpa Fabp4 Slc2a4 Plin1
0.2
0.4
Rel
ativ
e ex
pres
sion
0.6
0.8
1.0
1.2* * * * *
ER-MKL1
ER-MKL1
0
20
40
60
% C
ells
80
100NN/CC
ER-MKL1-N100
ER-MKL1-N100
1.4
ER-MOCK
ER-MKL1
ER-MKL1-N100
TAM:
0.20
0.40.6
Fab
p4/G
apdh
mR
NA
ratio 0.8
1.01.21.4
n.s.*
* * *
*
– + – + – +
ER-MKL1
ER-MKL1-N100
– TAM
PP
AR
γ/F
LAG
Nuc
leus
PP
AR
γ/F
LAG
PPARγFLAG/nucleusNucleusFLAG
Nuc
leus
PP
AR
γ/F
LAG
Nuc
leus
+ TAM
ER-MKL1-N100
– TAM + TAM
ER-MKL1-N100
0
0.2
0.4
0.6
n.s. **
***0.8
1.0
1.2
1.4
– + – ++75 kDa
50 kDa
37 kDa
75 kDa
50 kDa
FLAG
FLAG
Lamin C
MEK1/2
C
ER-MKL1 ER-MKL1-N100
+–+–
Ppa
rg/G
apdh
mR
NA
ratio
N C
+–+–
N C
+–+–
Figure 3 | Interaction between G-actin and MKL1 and the consequent cytoplasmic sequestration of MKL1 are required for adipocytic differentiation in
DFAT cells. (a) Cells stably expressing 3� FLAG-tagged ER (ER-MOCK, control), ER-MKL1 or ER-MKL1-N100 were exposed for 48 h to inducers of
adipogenic differentiation in the absence or presence of TAM (1 mM), after which nuclear (N) and cytoplasmic (C) fractions were prepared from the
cells and subjected to immunoblot analysis of FLAG, lamin C (nuclear marker) and MEK1/2 (cytoplasmic marker). (b) Cells treated as in a were
analysed for the relative abundance of Pparg mRNA or subjected to immunofluorescence analysis of FLAG and PPARg. Nuclei were stained with
Hoechst 33342. Scale bars, 50mm. (c) Relative abundance of Cebpa, Fabp4, Slc2a4 and Plin1 mRNAs in cells treated as in a. (d) Cells treated as in
a were cultured for an additional 48 h (total of 96 h) and then stained with oil red O. Scale bars, 100mm. The A510 of dye extracted from the stained
cells was also determined. n.s., not significant. (e) Cells stably expressing ER-MKL1 or ER-MKL1-N100 were exposed for 24 h to Lat A (0.4mM)
in the presence of TAM (1mM) and then subjected to immunofluorescence analysis of FLAG and PPARg (upper panels). Nuclei were stained with
Hoechst 33342. Scale bars, 50mm. At least 300 cells per coverslip were scored for determination of the percentage of the subcellular localization of
MKL1 (centre panel). N, nuclear; N/C, comparable intensity in nucleus and cytoplasm; C, cytoplasmic. (f) Relative abundance of Pparg, Cebpa, Fabp4, Slc2a4
and Plin1 mRNAs in cells treated as in e. All quantitative data are means±s.d. (n¼ 3 experiments). *Po0.05, Student’s t-test.
ARTICLE NATURE COMMUNICATIONS | DOI: 10.1038/ncomms4368
6 NATURE COMMUNICATIONS | 5:3368 | DOI: 10.1038/ncomms4368 | www.nature.com/naturecommunications
& 2014 Macmillan Publishers Limited. All rights reserved.
Ppa
rg/G
apdh
mR
NA
rat
ioP
PAR
γ
PPA
Rγ
OR
O
Ppa
rg/G
apdh
mR
NA
rat
io
Fabp
4/G
apdh
mR
NA
rat
io
Fabp
4/G
apdh
mR
NA
rat
io
Slc
2a4/
Gap
dh m
RN
A r
atio
Slc
2a4/
Gap
dh m
RN
A r
atio
Plin
1/G
apdh
mR
NA
rat
io
A51
0
Plin
1/G
apdh
mR
NA
rat
io
30 * * * *25
20
15
10
5
0
3.0
2.5
2.0
1.5
1.0
0.5
0
*
* *
*
0123456789
0123456789
NIH 3T3
GFP FABP4 Perilipin
3.0
2.5
3.5
2.0
1.5
1.0
0.5
0
300
250
200
150
100
50
0
30
40
50
20
10
0
300
400
500
600
200
100
0
0
0.02
0.04
0.06
0.08
0.10
0.12*
siControl siMkl1-a siMkl1-b
siControlsiControl
siControl
siMkl1siMkl1
siControl
siMkl1
siMkl1
siControl siMkl1 siControl siMkl1
siControl siMkl1
siControl siMkl1-a siMkl1-b siControl siMkl1-a siMkl1-b siControl siMkl1-a siMkl1-b
siControl siMkl1-a siMkl1-b
siC
ontr
olsi
Mkl
1
a
b
c
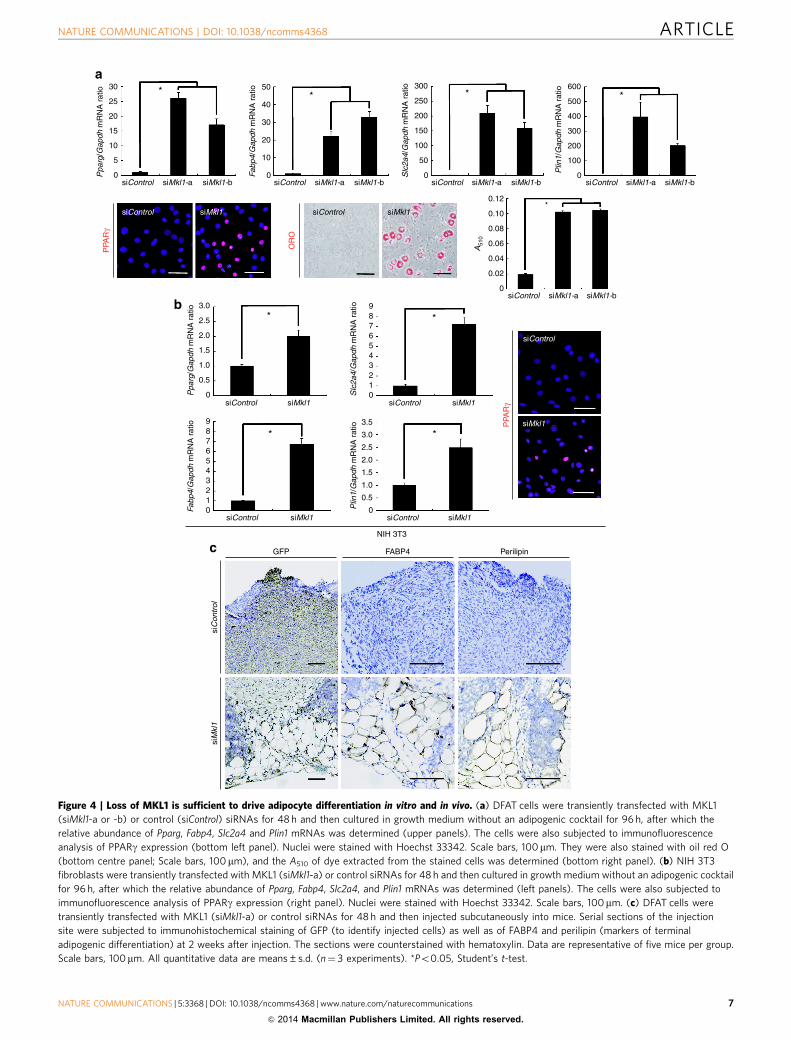
Figure 4 | Loss of MKL1 is sufficient to drive adipocyte differentiation in vitro and in vivo. (a) DFAT cells were transiently transfected with MKL1
(siMkl1-a or -b) or control (siControl) siRNAs for 48 h and then cultured in growth medium without an adipogenic cocktail for 96 h, after which the
relative abundance of Pparg, Fabp4, Slc2a4 and Plin1 mRNAs was determined (upper panels). The cells were also subjected to immunofluorescence
analysis of PPARg expression (bottom left panel). Nuclei were stained with Hoechst 33342. Scale bars, 100mm. They were also stained with oil red O
(bottom centre panel; Scale bars, 100 mm), and the A510 of dye extracted from the stained cells was determined (bottom right panel). (b) NIH 3T3
fibroblasts were transiently transfected with MKL1 (siMkl1-a) or control siRNAs for 48 h and then cultured in growth medium without an adipogenic cocktail
for 96 h, after which the relative abundance of Pparg, Fabp4, Slc2a4, and Plin1 mRNAs was determined (left panels). The cells were also subjected to
immunofluorescence analysis of PPARg expression (right panel). Nuclei were stained with Hoechst 33342. Scale bars, 100mm. (c) DFAT cells were
transiently transfected with MKL1 (siMkl1-a) or control siRNAs for 48 h and then injected subcutaneously into mice. Serial sections of the injection
site were subjected to immunohistochemical staining of GFP (to identify injected cells) as well as of FABP4 and perilipin (markers of terminal
adipogenic differentiation) at 2 weeks after injection. The sections were counterstained with hematoxylin. Data are representative of five mice per group.
Scale bars, 100mm. All quantitative data are means±s.d. (n¼ 3 experiments). *Po0.05, Student’s t-test.
NATURE COMMUNICATIONS | DOI: 10.1038/ncomms4368 ARTICLE
NATURE COMMUNICATIONS | 5:3368 | DOI: 10.1038/ncomms4368 | www.nature.com/naturecommunications 7
& 2014 Macmillan Publishers Limited. All rights reserved.
To investigate the function of MKL1 in adipocyte differentia-tion in vivo, we transfected DFAT cells (which are derived fromgreen fluorescent protein (GFP) transgenic mice)12 with MKL1siRNA for 48 h (resulting in a significant decrease in Mkl1expression but no change in Pparg expression at this time(Supplementary Fig. 5d)) and then injected the cells sub-cutaneously into mice. At 2 weeks after injection, many fullydifferentiated adipocytes were observed at the injection site in theanimals that received cells transfected with MKL1 siRNA but notin those that received cells transfected with a control siRNA(Fig. 4c). The transplanted MKL1-depleted cells were thusstrongly positive for markers of terminal adipogenic differen-tiation (FABP4 and perilipin) as well as for GFP (Fig. 4c).Together, these data revealed that MKL1 functions as agatekeeper that controls adipocyte differentiation both in vitroand in vivo. It was previously reported that the postpartummammary glands of Mkl1 knockout female mouse showpremature involution and markedly increased white adiposetissue34. This phenotype of Mkl1 knockout mouse is concordantwith our finding that loss of Mkl1 promotes adipocytedifferentiation programme.
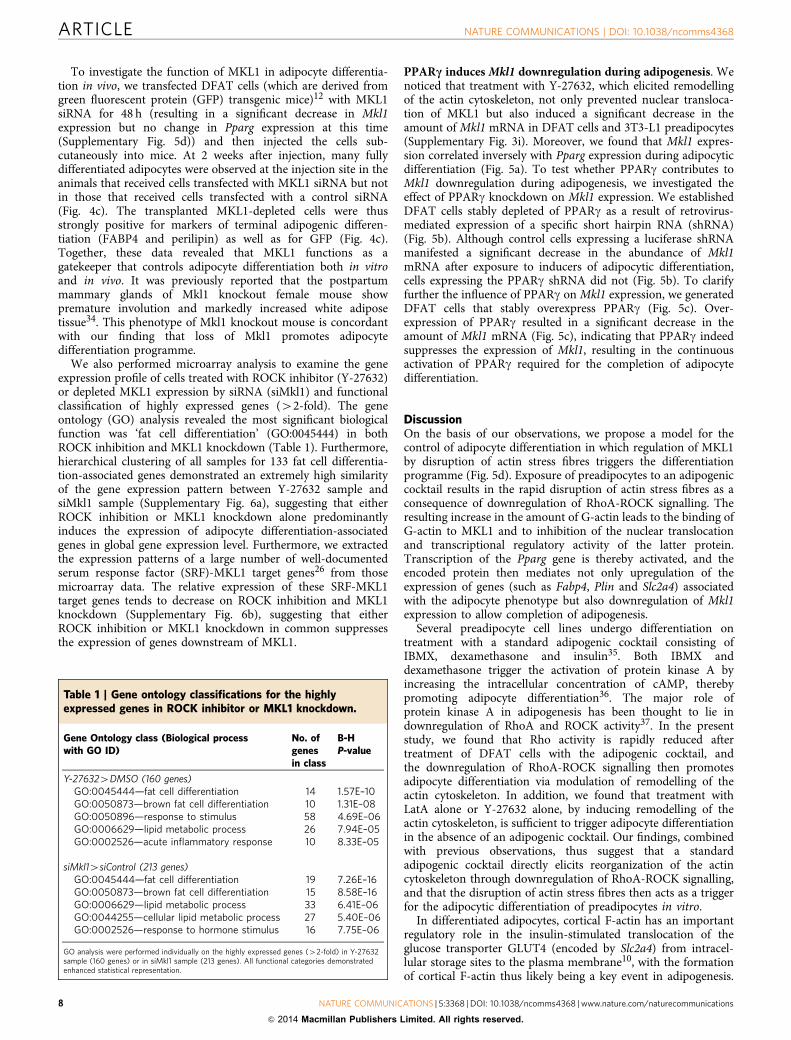
We also performed microarray analysis to examine the geneexpression profile of cells treated with ROCK inhibitor (Y-27632)or depleted MKL1 expression by siRNA (siMkl1) and functionalclassification of highly expressed genes (42-fold). The geneontology (GO) analysis revealed the most significant biologicalfunction was ‘fat cell differentiation’ (GO:0045444) in bothROCK inhibition and MKL1 knockdown (Table 1). Furthermore,hierarchical clustering of all samples for 133 fat cell differentia-tion-associated genes demonstrated an extremely high similarityof the gene expression pattern between Y-27632 sample andsiMkl1 sample (Supplementary Fig. 6a), suggesting that eitherROCK inhibition or MKL1 knockdown alone predominantlyinduces the expression of adipocyte differentiation-associatedgenes in global gene expression level. Furthermore, we extractedthe expression patterns of a large number of well-documentedserum response factor (SRF)-MKL1 target genes26 from thosemicroarray data. The relative expression of these SRF-MKL1target genes tends to decrease on ROCK inhibition and MKL1knockdown (Supplementary Fig. 6b), suggesting that eitherROCK inhibition or MKL1 knockdown in common suppressesthe expression of genes downstream of MKL1.
PPARc induces Mkl1 downregulation during adipogenesis. Wenoticed that treatment with Y-27632, which elicited remodellingof the actin cytoskeleton, not only prevented nuclear transloca-tion of MKL1 but also induced a significant decrease in theamount of Mkl1 mRNA in DFAT cells and 3T3-L1 preadipocytes(Supplementary Fig. 3i). Moreover, we found that Mkl1 expres-sion correlated inversely with Pparg expression during adipocyticdifferentiation (Fig. 5a). To test whether PPARg contributes toMkl1 downregulation during adipogenesis, we investigated theeffect of PPARg knockdown on Mkl1 expression. We establishedDFAT cells stably depleted of PPARg as a result of retrovirus-mediated expression of a specific short hairpin RNA (shRNA)(Fig. 5b). Although control cells expressing a luciferase shRNAmanifested a significant decrease in the abundance of Mkl1mRNA after exposure to inducers of adipocytic differentiation,cells expressing the PPARg shRNA did not (Fig. 5b). To clarifyfurther the influence of PPARg on Mkl1 expression, we generatedDFAT cells that stably overexpress PPARg (Fig. 5c). Over-expression of PPARg resulted in a significant decrease in theamount of Mkl1 mRNA (Fig. 5c), indicating that PPARg indeedsuppresses the expression of Mkl1, resulting in the continuousactivation of PPARg required for the completion of adipocytedifferentiation.
DiscussionOn the basis of our observations, we propose a model for thecontrol of adipocyte differentiation in which regulation of MKL1by disruption of actin stress fibres triggers the differentiationprogramme (Fig. 5d). Exposure of preadipocytes to an adipogeniccocktail results in the rapid disruption of actin stress fibres as aconsequence of downregulation of RhoA-ROCK signalling. Theresulting increase in the amount of G-actin leads to the binding ofG-actin to MKL1 and to inhibition of the nuclear translocationand transcriptional regulatory activity of the latter protein.Transcription of the Pparg gene is thereby activated, and theencoded protein then mediates not only upregulation of theexpression of genes (such as Fabp4, Plin and Slc2a4) associatedwith the adipocyte phenotype but also downregulation of Mkl1expression to allow completion of adipogenesis.
Several preadipocyte cell lines undergo differentiation ontreatment with a standard adipogenic cocktail consisting ofIBMX, dexamethasone and insulin35. Both IBMX anddexamethasone trigger the activation of protein kinase A byincreasing the intracellular concentration of cAMP, therebypromoting adipocyte differentiation36. The major role ofprotein kinase A in adipogenesis has been thought to lie indownregulation of RhoA and ROCK activity37. In the presentstudy, we found that Rho activity is rapidly reduced aftertreatment of DFAT cells with the adipogenic cocktail, andthe downregulation of RhoA-ROCK signalling then promotesadipocyte differentiation via modulation of remodelling of theactin cytoskeleton. In addition, we found that treatment withLatA alone or Y-27632 alone, by inducing remodelling of theactin cytoskeleton, is sufficient to trigger adipocyte differentiationin the absence of an adipogenic cocktail. Our findings, combinedwith previous observations, thus suggest that a standardadipogenic cocktail directly elicits reorganization of the actincytoskeleton through downregulation of RhoA-ROCK signalling,and that the disruption of actin stress fibres then acts as a triggerfor the adipocytic differentiation of preadipocytes in vitro.
In differentiated adipocytes, cortical F-actin has an importantregulatory role in the insulin-stimulated translocation of theglucose transporter GLUT4 (encoded by Slc2a4) from intracel-lular storage sites to the plasma membrane10, with the formationof cortical F-actin thus likely being a key event in adipogenesis.
Table 1 | Gene ontology classifications for the highlyexpressed genes in ROCK inhibitor or MKL1 knockdown.
Gene Ontology class (Biological processwith GO ID)
No. ofgenesin class
B-HP-value
Y-276324DMSO (160 genes)GO:0045444—fat cell differentiation 14 1.57E–10GO:0050873—brown fat cell differentiation 10 1.31E–08GO:0050896—response to stimulus 58 4.69E–06GO:0006629—lipid metabolic process 26 7.94E–05GO:0002526—acute inflammatory response 10 8.33E–05
siMkl14siControl (213 genes)GO:0045444—fat cell differentiation 19 7.26E–16GO:0050873—brown fat cell differentiation 15 8.58E–16GO:0006629—lipid metabolic process 33 6.41E–06GO:0044255—cellular lipid metabolic process 27 5.40E–06GO:0002526—response to hormone stimulus 16 7.75E–06
GO analysis were performed individually on the highly expressed genes (42-fold) in Y-27632sample (160 genes) or in siMkl1 sample (213 genes). All functional categories demonstratedenhanced statistical representation.
ARTICLE NATURE COMMUNICATIONS | DOI: 10.1038/ncomms4368
8 NATURE COMMUNICATIONS | 5:3368 | DOI: 10.1038/ncomms4368 | www.nature.com/naturecommunications
& 2014 Macmillan Publishers Limited. All rights reserved.

In the present study, F-actin stress fibres were depolymerizedto G-actin within 24 h after the induction of adipocytedifferentiation, and the actin cytoskeleton was subsequentlyreorganized to form cortical F-actin structures within 48 h. Theabundance of transcripts for MKL1, which binds to G-actin,began to decline within 48 h after induction of adipocytedifferentiation, and this downregulation of Mkl1 was controlledby PPARg. We also found that cells depleted of PPARgmaintained a high level of Mkl1 expression even after inductionof adipocyte differentiation, and that these cells manifesteddisruption of actin stress fibres at 24 h but not the formation ofcortical F-actin structures even at 96 h (Supplementary Fig. 4e).Together, these observations suggest that the downregulation ofMkl1 expression not only contributes to the continued activationof PPARg but also promotes the organization of adipocyte-specific cortical F-actin structures as a result of the release ofG-actin from MKL1–G-actin complexes.
Our findings provide new insight into the regulatory mechan-ism of adipocyte differentiation, which is shown to be triggeredthrough regulation of MKL1 resulting from disruption of actin
stress fibres. They also identify MKL1 as a novel gatekeeper in theregulation of adipogenesis as well as provide a basis for furtherstudies of the relation between the dynamics of cell shape andtranscription factor function during cellular differentiation.Lastly, given that activating mutations of RAC protein, whichbelongs to the RHO family of small GTPases and orchestratesactin polymerization, were found in a wide variety of humancancers and given their marked transforming ability38, we assumethat aberrant differentiation associated with actin cytoskeletondynamics can be a critical factor of tumorigenesis, and ourworks thus would potentially contribute to understanding cancerbiology.
MethodsCell culture. The mouse preadipocyte cell line DFAT was established fromdedifferentiated mature adipocytes of GFP transgenic mice by ceiling culture(a method to culture lipid-containing adipocytes based on their lipid buoyancy)12.The mouse embryonic preadipocyte cell line 3T3-L1 and the mouse embryonicfibroblast cell line NIH 3T3 were obtained from the Japanese Collection ofResearch Bioresources (Tokyo, Japan). DFAT, 3T3-L1, or NIH 3T3 cells werecultured under a humidified atmosphere of 5% CO2 and 95% air at 37 �C on glass
1.6
1.4
1.2
1.0
0.8
0.6
0.4
0.2
0
1.61.41.21.00.80.60.40.2
0
1.41.21.00.80.60.40.2
0Mock
Mock
Mock
PPARγ-OE
PPARγ-OE
*
*
PPA
Rγ
PPARγ-OE
1.41.21.00.80.60.40.2
0
1.2
1.0
0.8
0.6
0.4
0.2
0
Time of differentiation (h)0 24 48 72 96
Ppa
rg/G
apdh
mR
NA
rat
io
Ppa
rg/G
apdh
mR
NA
ratio
Ppa
rg m
RN
A/1
8SrR
NA
rat
io
Mkl
1 m
RN
A/1
8SrR
NA
rat
io
MkI
1/G
apdh
mR
NA
rat
io
MkI
1/G
apdh
mR
NA
ratio
1.6
1.4
1.2
1.0
0.8
0.6
0.4
0.2
0
a aND
b
0 h 96 hshLuc
shLuc
shPPARγ
shPPARγ
0 h 96 h
0 h 96 h
a
c
bab
shLuc shPPARγ Adipocyte differentiation
PPARγ target genes(Fabp4, Slc2a4, Plin1 etc)
0 h 96 h
PPA
Rγ
PPARγ PPARγ
MKL1MKL1
RhoA-ROCKsignalling
RhoA-ROCKsignalling
G-actin
Adipogeniccocktail
Mkl1Pparg
b
aa
c
ca
a
b
c
d
Figure 5 | PPARc contributes to Mkl1 downregulation during adipocyte differentiation. (a) The relative abundance of Mkl1 and Pparg mRNAs at the
indicated times after exposure of DFAT cells to inducers of adipocytic differentiation was also determined. (a–c) Po0.05, (a–d) Po0.05, Tukey’s honest
significant difference test. (b) DFAT cells stably expressing PPARg (shPPARg) or luciferase (shLuc, control) shRNAs were exposed to inducers of
adipogenesis for 0 or 96 h and then assayed for the relative abundance of Pparg and Mkl1 mRNAs. The cells were also subjected to immunofluorescence
analysis of PPARg after 96 h. Nuclei were stained with Hoechst 33342. Scale bars, 100 mm. ND, not detected. (c) DFAT cells stably overexpressing PPARg(PPARg-OE) or infected with the corresponding empty vector (Mock) were assayed for the relative abundance of Pparg and Mkl1 mRNAs. *Po0.05,
Student’s t-test. They were also subjected to immunofluorescence analysis of PPARg expression. Nuclei were stained with Hoechst 33342. Scale bars,
100mm. All quantitative data are means±s.d. (n¼ 3 experiments). (d) Model for the regulation of adipocyte differentiation. Regulation of MKL1 by
disruption of actin stress fibres drives adipocyte differentiation.
NATURE COMMUNICATIONS | DOI: 10.1038/ncomms4368 ARTICLE
NATURE COMMUNICATIONS | 5:3368 | DOI: 10.1038/ncomms4368 | www.nature.com/naturecommunications 9
& 2014 Macmillan Publishers Limited. All rights reserved.
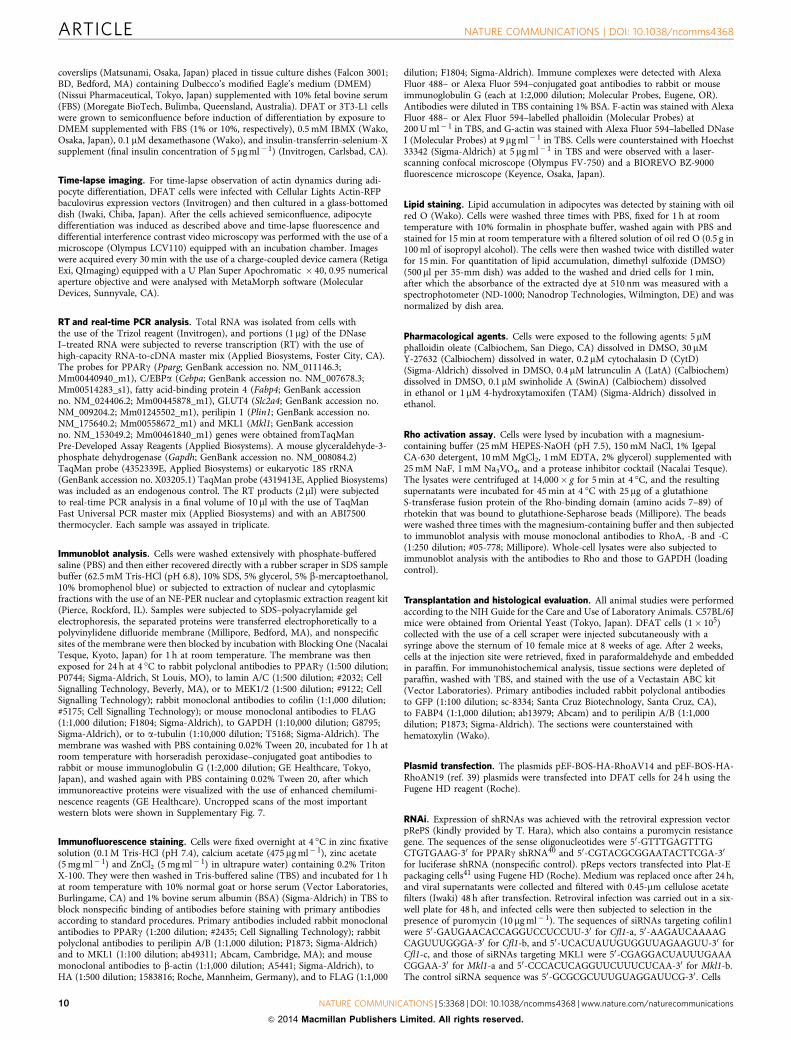
coverslips (Matsunami, Osaka, Japan) placed in tissue culture dishes (Falcon 3001;BD, Bedford, MA) containing Dulbecco’s modified Eagle’s medium (DMEM)(Nissui Pharmaceutical, Tokyo, Japan) supplemented with 10% fetal bovine serum(FBS) (Moregate BioTech, Bulimba, Queensland, Australia). DFAT or 3T3-L1 cellswere grown to semiconfluence before induction of differentiation by exposure toDMEM supplemented with FBS (1% or 10%, respectively), 0.5 mM IBMX (Wako,Osaka, Japan), 0.1 mM dexamethasone (Wako), and insulin-transferrin-selenium-Xsupplement (final insulin concentration of 5 mg ml� 1) (Invitrogen, Carlsbad, CA).
Time-lapse imaging. For time-lapse observation of actin dynamics during adi-pocyte differentiation, DFAT cells were infected with Cellular Lights Actin-RFPbaculovirus expression vectors (Invitrogen) and then cultured in a glass-bottomeddish (Iwaki, Chiba, Japan). After the cells achieved semiconfluence, adipocytedifferentiation was induced as described above and time-lapse fluorescence anddifferential interference contrast video microscopy was performed with the use of amicroscope (Olympus LCV110) equipped with an incubation chamber. Imageswere acquired every 30 min with the use of a charge-coupled device camera (RetigaExi, QImaging) equipped with a U Plan Super Apochromatic � 40, 0.95 numericalaperture objective and were analysed with MetaMorph software (MolecularDevices, Sunnyvale, CA).
RT and real-time PCR analysis. Total RNA was isolated from cells withthe use of the Trizol reagent (Invitrogen), and portions (1 mg) of the DNaseI–treated RNA were subjected to reverse transcription (RT) with the use ofhigh-capacity RNA-to-cDNA master mix (Applied Biosystems, Foster City, CA).The probes for PPARg (Pparg; GenBank accession no. NM_011146.3;Mm00440940_m1), C/EBPa (Cebpa; GenBank accession no. NM_007678.3;Mm00514283_s1), fatty acid-binding protein 4 (Fabp4; GenBank accessionno. NM_024406.2; Mm00445878_m1), GLUT4 (Slc2a4; GenBank accession no.NM_009204.2; Mm01245502_m1), perilipin 1 (Plin1; GenBank accession no.NM_175640.2; Mm00558672_m1) and MKL1 (Mkl1; GenBank accessionno. NM_153049.2; Mm00461840_m1) genes were obtained fromTaqManPre-Developed Assay Reagents (Applied Biosystems). A mouse glyceraldehyde-3-phosphate dehydrogenase (Gapdh; GenBank accession no. NM_008084.2)TaqMan probe (4352339E, Applied Biosystems) or eukaryotic 18S rRNA(GenBank accession no. X03205.1) TaqMan probe (4319413E, Applied Biosystems)was included as an endogenous control. The RT products (2 ml) were subjectedto real-time PCR analysis in a final volume of 10 ml with the use of TaqManFast Universal PCR master mix (Applied Biosystems) and with an ABI7500thermocycler. Each sample was assayed in triplicate.
Immunoblot analysis. Cells were washed extensively with phosphate-bufferedsaline (PBS) and then either recovered directly with a rubber scraper in SDS samplebuffer (62.5 mM Tris-HCl (pH 6.8), 10% SDS, 5% glycerol, 5% b-mercaptoethanol,10% bromophenol blue) or subjected to extraction of nuclear and cytoplasmicfractions with the use of an NE-PER nuclear and cytoplasmic extraction reagent kit(Pierce, Rockford, IL). Samples were subjected to SDS–polyacrylamide gelelectrophoresis, the separated proteins were transferred electrophoretically to apolyvinylidene difluoride membrane (Millipore, Bedford, MA), and nonspecificsites of the membrane were then blocked by incubation with Blocking One (NacalaiTesque, Kyoto, Japan) for 1 h at room temperature. The membrane was thenexposed for 24 h at 4 �C to rabbit polyclonal antibodies to PPARg (1:500 dilution;P0744; Sigma-Aldrich, St Louis, MO), to lamin A/C (1:500 dilution; #2032; CellSignalling Technology, Beverly, MA), or to MEK1/2 (1:500 dilution; #9122; CellSignalling Technology); rabbit monoclonal antibodies to cofilin (1:1,000 dilution;#5175; Cell Signalling Technology); or mouse monoclonal antibodies to FLAG(1:1,000 dilution; F1804; Sigma-Aldrich), to GAPDH (1:10,000 dilution; G8795;Sigma-Aldrich), or to a-tubulin (1:10,000 dilution; T5168; Sigma-Aldrich). Themembrane was washed with PBS containing 0.02% Tween 20, incubated for 1 h atroom temperature with horseradish peroxidase–conjugated goat antibodies torabbit or mouse immunoglobulin G (1:2,000 dilution; GE Healthcare, Tokyo,Japan), and washed again with PBS containing 0.02% Tween 20, after whichimmunoreactive proteins were visualized with the use of enhanced chemilumi-nescence reagents (GE Healthcare). Uncropped scans of the most importantwestern blots were shown in Supplementary Fig. 7.
Immunofluorescence staining. Cells were fixed overnight at 4 �C in zinc fixativesolution (0.1 M Tris-HCl (pH 7.4), calcium acetate (475 mg ml� 1), zinc acetate(5 mg ml� 1) and ZnCl2 (5 mg ml� 1) in ultrapure water) containing 0.2% TritonX-100. They were then washed in Tris-buffered saline (TBS) and incubated for 1 hat room temperature with 10% normal goat or horse serum (Vector Laboratories,Burlingame, CA) and 1% bovine serum albumin (BSA) (Sigma-Aldrich) in TBS toblock nonspecific binding of antibodies before staining with primary antibodiesaccording to standard procedures. Primary antibodies included rabbit monoclonalantibodies to PPARg (1:200 dilution; #2435; Cell Signalling Technology); rabbitpolyclonal antibodies to perilipin A/B (1:1,000 dilution; P1873; Sigma-Aldrich)and to MKL1 (1:100 dilution; ab49311; Abcam, Cambridge, MA); and mousemonoclonal antibodies to b-actin (1:1,000 dilution; A5441; Sigma-Aldrich), toHA (1:500 dilution; 1583816; Roche, Mannheim, Germany), and to FLAG (1:1,000
dilution; F1804; Sigma-Aldrich). Immune complexes were detected with AlexaFluor 488– or Alexa Fluor 594–conjugated goat antibodies to rabbit or mouseimmunoglobulin G (each at 1:2,000 dilution; Molecular Probes, Eugene, OR).Antibodies were diluted in TBS containing 1% BSA. F-actin was stained with AlexaFluor 488– or Alex Fluor 594–labelled phalloidin (Molecular Probes) at200 U ml� 1 in TBS, and G-actin was stained with Alexa Fluor 594–labelled DNaseI (Molecular Probes) at 9 mg ml� 1 in TBS. Cells were counterstained with Hoechst33342 (Sigma-Aldrich) at 5 mg ml� 1 in TBS and were observed with a laser-scanning confocal microscope (Olympus FV-750) and a BIOREVO BZ-9000fluorescence microscope (Keyence, Osaka, Japan).
Lipid staining. Lipid accumulation in adipocytes was detected by staining with oilred O (Wako). Cells were washed three times with PBS, fixed for 1 h at roomtemperature with 10% formalin in phosphate buffer, washed again with PBS andstained for 15 min at room temperature with a filtered solution of oil red O (0.5 g in100 ml of isopropyl alcohol). The cells were then washed twice with distilled waterfor 15 min. For quantitation of lipid accumulation, dimethyl sulfoxide (DMSO)(500 ml per 35-mm dish) was added to the washed and dried cells for 1 min,after which the absorbance of the extracted dye at 510 nm was measured with aspectrophotometer (ND-1000; Nanodrop Technologies, Wilmington, DE) and wasnormalized by dish area.
Pharmacological agents. Cells were exposed to the following agents: 5 mMphalloidin oleate (Calbiochem, San Diego, CA) dissolved in DMSO, 30 mMY-27632 (Calbiochem) dissolved in water, 0.2 mM cytochalasin D (CytD)(Sigma-Aldrich) dissolved in DMSO, 0.4 mM latrunculin A (LatA) (Calbiochem)dissolved in DMSO, 0.1 mM swinholide A (SwinA) (Calbiochem) dissolvedin ethanol or 1 mM 4-hydroxytamoxifen (TAM) (Sigma-Aldrich) dissolved inethanol.
Rho activation assay. Cells were lysed by incubation with a magnesium-containing buffer (25 mM HEPES-NaOH (pH 7.5), 150 mM NaCl, 1% IgepalCA-630 detergent, 10 mM MgCl2, 1 mM EDTA, 2% glycerol) supplemented with25 mM NaF, 1 mM Na3VO4, and a protease inhibitor cocktail (Nacalai Tesque).The lysates were centrifuged at 14,000� g for 5 min at 4 �C, and the resultingsupernatants were incubated for 45 min at 4 �C with 25mg of a glutathioneS-transferase fusion protein of the Rho-binding domain (amino acids 7–89) ofrhotekin that was bound to glutathione-Sepharose beads (Millipore). The beadswere washed three times with the magnesium-containing buffer and then subjectedto immunoblot analysis with mouse monoclonal antibodies to RhoA, -B and -C(1:250 dilution; #05-778; Millipore). Whole-cell lysates were also subjected toimmunoblot analysis with the antibodies to Rho and those to GAPDH (loadingcontrol).
Transplantation and histological evaluation. All animal studies were performedaccording to the NIH Guide for the Care and Use of Laboratory Animals. C57BL/6Jmice were obtained from Oriental Yeast (Tokyo, Japan). DFAT cells (1� 105)collected with the use of a cell scraper were injected subcutaneously with asyringe above the sternum of 10 female mice at 8 weeks of age. After 2 weeks,cells at the injection site were retrieved, fixed in paraformaldehyde and embeddedin paraffin. For immunohistochemical analysis, tissue sections were depleted ofparaffin, washed with TBS, and stained with the use of a Vectastain ABC kit(Vector Laboratories). Primary antibodies included rabbit polyclonal antibodiesto GFP (1:100 dilution; sc-8334; Santa Cruz Biotechnology, Santa Cruz, CA),to FABP4 (1:1,000 dilution; ab13979; Abcam) and to perilipin A/B (1:1,000dilution; P1873; Sigma-Aldrich). The sections were counterstained withhematoxylin (Wako).
Plasmid transfection. The plasmids pEF-BOS-HA-RhoAV14 and pEF-BOS-HA-RhoAN19 (ref. 39) plasmids were transfected into DFAT cells for 24 h using theFugene HD reagent (Roche).
RNAi. Expression of shRNAs was achieved with the retroviral expression vectorpRePS (kindly provided by T. Hara), which also contains a puromycin resistancegene. The sequences of the sense oligonucleotides were 50-GTTTGAGTTTGCTGTGAAG-30 for PPARg shRNA40 and 50-CGTACGCGGAATACTTCGA-30
for luciferase shRNA (nonspecific control). pReps vectors transfected into Plat-Epackaging cells41 using Fugene HD (Roche). Medium was replaced once after 24 h,and viral supernatants were collected and filtered with 0.45-mm cellulose acetatefilters (Iwaki) 48 h after transfection. Retroviral infection was carried out in a six-well plate for 48 h, and infected cells were then subjected to selection in thepresence of puromycin (10 mg ml� 1). The sequences of siRNAs targeting cofilin1were 50-GAUGAACACCAGGUCCUCCUU-30 for Cfl1-a, 50-AAGAUCAAAAGCAGUUUGGGA-30 for Cfl1-b, and 50-UCACUAUUGUGGUUAGAAGUU-30 forCfl1-c, and those of siRNAs targeting MKL1 were 50-CGAGGACUAUUUGAAACGGAA-30 for Mkl1-a and 50-CCCACUCAGGUUCUUUCUCAA-30 for Mkl1-b.The control siRNA sequence was 50-GCGCGCUUUGUAGGAUUCG-30. Cells
ARTICLE NATURE COMMUNICATIONS | DOI: 10.1038/ncomms4368
10 NATURE COMMUNICATIONS | 5:3368 | DOI: 10.1038/ncomms4368 | www.nature.com/naturecommunications
& 2014 Macmillan Publishers Limited. All rights reserved.

were transfected with siRNA duplexes for 48 h with the use of LipofectamineRNAiMAX (Invitrogen).
Retroviral gene transfer. The coding region for mCherry cDNA was amplifiedfrom the vector containing mCherry-MKlp2 (ref. 42) by PCR with the primers50-CCGCTCGAGATGGTGAGCAAGGGCGAGGAGGATAACATG-30
(XhoI_mCherry forward primer) and 50-CGGAATTCTTCTTGTACAGCTCGTCCATGCCGCCGGTGG-30 (mCherry_EcoRI reverse primer), and the codingregion for human ER was amplified from the pMV7-MycER plasmid43 by PCRwith the primers 50-CCGCTCGAGTCTGCTGGAGACATGAGAGCTGCCAACCTT-30 (XhoI_ER forward primer) and 50-CGGAATTCTTGACCGTGGCAGGGAAACCCTCTGCCTCCCC-30 (ER_EcoRI reverse primer), digested with XhoIand EcoRI, and ligated into the XhoI and EcoRI sites of pMXs-3� FLAG-IP42.Human cDNAs for full-length MKL1 and MKL1-N100 were obtained by digestionof Addgene Plasmids (#11978, #27176)32 with EcoRI and BamHI, and the resultingfragments were cloned into the EcoRI and BamHI sites of pMXs-3� FLAG-mCherry-IP and/or pMXs-3� FLAG-ER-IP. The resulting vectors were designatedpMXs-3� FLAG-mCherry-MKL1-IP, pMXs-3� FLAG-ER-MKL1-IP, orpMXs-3� FLAG-ER-MKL1-N100-IP, and pMXs-3� FLAG-mCherry-IP orpMXs-3� FLAG-ER-IP was used as a control. Mouse PPARg cDNA (ImaGenes,Berlin, Germany) was cloned into the retroviral plasmid pMXs-puro (kindlyprovided by T. Kitamura). pMXs vectors were transfected into Plat-E packagingcells44 using FugeneHD (Roche). Medium was replaced once after 24 h, and viralsupernatants were collected and filtered with 0.45-mm cellulose acetate filters(Iwaki) 48 h after transfection. Retroviral infection was carried out in a six-wellplate for 48 h, and infected cells were subjected to selection in the presence ofpuromycin (10mg ml� 1).
Microarray analysis. The quality of RNA was assessed using the Agilent 2100Bioanalyzer (Agilent Technologies, Waldbronn, Germany). The RNA samples werelabelled using the GeneChip One-Cycle Target Labeling and Control Reagentpakage (Affymetrix, Santa Clara, CA) and then hybridized to the AffymetrixGeneChip mouse genome 430 2.0 array according to the manufacturer’s instruc-tion. Fluorescent images were visualized using a GeneChip Scanner 3000(Affymetrix). Expression and raw expression data (CEL files) were summarized andnormalized using the Robust Multi-array Average algorithm and the Bioconductorpackage affy (http://www.bioconductor.org/packages/2.0/bioc/html/affy.html).The Spotfire DecisionSite for Functional Genomics software package (TIBCOSoftware, Palo Alto, CA) was used for visualization of microarray data. Functionalanalyses were performed using DAVID Bioinformatics Resources 6.7 (http://david.abcc.ncifcrf.gov/). Functional analysis identified the biological functions thatwere most significant to the data set.
Statistical analysis. Data are presented as means±s.d. and were analysed withTukey’s honest significant difference test or Student’s t-test for comparisonsbetween two or among three or more groups, respectively. A P-value of o0.05 wasconsidered statistically significant.
References1. Braun, T. & Gautel, M. Transcriptional mechanisms regulating skeletal muscle
differentiation, growth and homeostasis. Nat. Rev. Mol. Cell Biol. 12, 349–361(2011).
2. de Crombrugghe, B., Lefebvre, V. & Nakashima, K. Regulatory mechanismsin the pathways of cartilage and bone formation. Curr. Opin. Cell Biol. 13,721–727 (2001).
3. Farmer, S. R. Transcriptional control of adipocyte formation. Cell Metab. 4,263–273 (2006).
4. Wu, Z. et al. Cross-regulation of C/EBPa and PPARg controls thetranscriptional pathway of adipogenesis and insulin sensitivity. Mol. Cell 3,151–158 (1999).
5. Tontonoz, P., Hu, E. & Spiegelman, B. M. Stimulation of adipogenesis infibroblasts by PPARg2, a lipid-activated transcription factor. Cell 79,1147–1156 (1994).
6. Okuno, M., Arimoto, E., Nishizuka, M., Nishihara, T. & Imagawa, M.Isolation of up- or down-regulated genes in PPARg-expressing NIH3T3 cellsduring differentiation into adipocytes. FEBS Lett. 519, 108–112 (2002).
7. Rosen, E. D. & MacDougald, O. A. Adipocyte differentiation from the insideout. Nat. Rev. Mol. Cell Biol. 7, 885–896 (2006).
8. Smas, C. M. & Sul, H. S. Control of adipocyte differentiation. Biochem. J. 309,697–710 (1995).
9. Jaffe, A. B. & Hall, A. Rho GTPases: biochemistry and biology. Annu. Rev. CellDev. Biol. 21, 247–269 (2005).
10. Kanzaki, M. & Pessin, J. E. Insulin-stimulated GLUT4 translocation inadipocytes is dependent upon cortical actin remodeling. J. Biol. Chem. 276,42436–42444 (2001).
11. Noguchi, M. et al. Genetic and pharmacological inhibition ofRho-associated kinase II enhances adipogenesis. J. Biol. Chem. 282,29574–29583 (2007).
12. Nobusue, H., Endo, T. & Kano, K. Establishment of a preadipocyte cell linederived from mature adipocytes of GFP transgenic mice and formation ofadipose tissue. Cell Tissue Res. 332, 435–446 (2008).
13. Yagi, K., Kondo, D., Okazaki, Y. & Kano, K. A novel preadipocyte cell lineestablished from mouse adult mature adipocytes. Biochem. Biophys. Res.Commun. 321, 967–974 (2004).
14. Spiegelman, B. M. & Ginty, C. A. Fibronectin modulation of cell shape andlipogenic gene expression in 3T3-adipocytes. Cell 35, 657–666 (1983).
15. McBeath, R., Pirone, D. M., Nelson, C. M., Bhadriraju, K. & Chen, C. S. Cellshape, cytoskeletal tension, and RhoA regulate stem cell lineage commitment.Dev. Cell 6, 483–495 (2004).
16. Kilian, K. A., Bugarija, B., Lahn, B. T. & Mrksich, M. Geometric cues fordirecting the differentiation of mesenchymal stem cells. Proc. Natl Acad. Sci.USA 107, 4872–4877 (2010).
17. Dupont, S. et al. Role of YAP/TAZ in mechanotransduction. Nature 474,179–183 (2011).
18. Cristancho, A. G. & Lazar, M. A. Forming functional fat: a growingunderstanding of adipocyte differentiation. Nat. Rev. Mol. Cell Biol. 12,722–734 (2011).
19. Ridley, A. J. & Hall, A. The small GTP-binding protein Rho regulates theassembly of focal adhesions and actin stress fibres in response to growth factors.Cell 70, 389–399 (1992).
20. Riento, K. & Ridley, A. J. Rocks: multifunctional kinases in cell behaviour.Nat. Rev. Mol. Cell Biol. 4, 446–456 (2003).
21. Hamm, J. K., El Jack, A. K., Pilch, P. F. & Farmer, S. R. Role of PPARg inregulating adipocyte differentiation and insulin-responsive glucose uptake.Ann. NY Acad. Sci. 18, 134–145 (1999).
22. Tashiro, K. et al. Efficient adenovirus vector-mediated PPARg gene transferinto mouse embryoid bodies promotes adipocyte differentiation. J. Gene Med.10, 498–507 (2008).
23. Tontonoz, P. & Spiegelman, B. M. Fat and beyond: the diverse biology ofPPARg. Annu. Rev. Biochem. 77, 289–312 (2008).
24. Qian, S. W. et al. Characterization of adipocyte differentiation from humanmesenchymal stem cells in bone marrow. BMC Dev. Biol. 10, 47 (2010).
25. Bamburg, J. R. Proteins of the ADF/cofilin family: essential regulators of actindynamics. Annu. Rev. Cell Dev. Biol. 15, 185–230 (1999).
26. Olson, E. N. & Nordheim, A. Linking actin dynamics and gene transcriptionto drive cellular motile functions. Nat. Rev. Mol. Cell Biol. 11, 353–365(2010).
27. Miralles, F., Posem, G., Zaromytidou, A. I. & Treisman, R. Actin dynamicscontrol SRF activity by regulation of its coactivator MAL. Cell 113, 329–342(2003).
28. Vartiainen, M. K., Guettler, S., Larijiani, B. & Treisman, R. Nuclear actinregulates dynamic subcellular localization and activity of the SRF cofactorMAL. Science 316, 1749–1752 (2007).
29. Yin, J. W. et al. Mediator MED23 plays opposing roles in directingsmooth muscle cell and adipocyte differentiation. Genes Dev. 26, 2192–2205(2012).
30. Lyubimova, A., Bershadsky, A. D. & Ben-Ze’ev, A. Autoregulation of actinsynthesis responds to monomeric actin levels. J. Cell Biochem. 65, 469–478(1997).
31. Bubb, M. R., Spector, I., Bershadsky, A. D. & Korn, E. D. Swinholide A is amicrofilament disrupting marine toxin that stabilizes actin dimmers and seversactin filaments. J. Biol. Chem. 270, 3463–3466 (1995).
32. Cen, B. et al. Megakaryoblastic leukemia 1, a potent transcriptional coactivatorfor serum response factor (SRF), is required for serum induction of SRF targetgenes. Mol. Cell Biol. 23, 6597–6608 (2003).
33. Guettler, S., Vartiainen, M. K., Miralles, F., Larijani, B. & Treisman, R. RPELmotifs link the serum response factor cofactor MAL but not myocardin to Rhosignaling via actin binding. Mol. Cell Biol. 28, 732–742 (2008).
34. Sun, Y. et al. Acute myeloid leukemia-associated Mkl1 (Mrtf-a) is akey regulator of mammary gland function. Mol. Cell Biol. 26, 5809–5826(2006).
35. Liu, J. et al. Changes in integrin expression during adipocyte differentiation.Cell Metab. 2, 165–177 (2005).
36. Vassaux, G., Gaillard, D., Ailhaud, G. & Negrel, R. Prostacyclin is a specificeffector of adipose cell differentiation. Its dual role as a cAMP- and Ca2þ -elevating agent. J. Biol. Chem. 267, 11092–11097 (1992).
37. Petersen, R. K. et al. Cyclic AMP (cAMP)-mediated stimulation ofadipocyte differentiation requires the synergistic action of Epac- and cAMP-dependent protein kinase-dependent processes. Mol. Cell Biol. 28, 3804–3816(2008).
38. Kawazu, M. et al. Transforming mutations of RAC guanosine triphosphatasesin human cancers. Proc. Natl Acad. Sci. USA 110, 3029–3034 (2013).
39. Amano, M. et al. Identification of a putative target for Rho as theserine-threonine kinase protein kinase N. Science 271, 648–650 (1996).
40. Shimizu, T. et al. c-MYC overexpression with loss of Ink4a/Arf transformsbone marrow stromal cells into osteosarcoma accompanied by loss ofadipogenesis. Oncogene 29, 5687–5699 (2010).
NATURE COMMUNICATIONS | DOI: 10.1038/ncomms4368 ARTICLE
NATURE COMMUNICATIONS | 5:3368 | DOI: 10.1038/ncomms4368 | www.nature.com/naturecommunications 11
& 2014 Macmillan Publishers Limited. All rights reserved.

41. Fujino, R. S. et al. Spermatogonial cell-mediated activation of an IkBz-independent nuclear factor-kB pathway in Sertoli cells induces transcription ofthe lipocalin-2 gene. Mol. Endocrinol. 20, 904–915 (2006).
42. Kitagawa, M., Fung, S. Y., Onishi, N., Saya, H. & Lee, S. H. Targeting Aurora Bto the equatorial cortex by MKlp2 is required for cytokinesis. PLoS One 8,e64826 (2013).
43. Eilers, M., Picard, D., Yamamoto, K. R. & Bishop, J. M. Chimaeras of Myconcoprotein and steroid receptors cause hormone-dependent transformation ofcells. Nature 340, 66–68 (1989).
44. Morita, T., Kojima, T. & Kitamura, T. Plat-E: an efficient and stable system fortransient packaging of retroviruses. Gene Ther. 7, 1063–1066 (2000).
AcknowledgementsWe thank T. Hara for the retroviral expression vector pRePS; T. Kitamura for theretroviral expression vector pMXs-puro; O. Sampetrean, S. Kuninaka, and H. Naoe fordiscussion; RM. Yonamine, X. Wang, H. Ito, N. Yanagihara, and N. Hirose for technicalassistance; and K. Arai for secretarial assistance. We are grateful to the CollaborativeResearch Resources, School of Medicine, Keio University for technical support andreagents. This work was partly supported by a grant from the Ministry of Education,Science, Sports, and Culture of Japan (HS) and a grant from Okinawa Research andIndustrialization for the Forefront Medical Care (KK).
Author contributionsH.N. performed most of the experimental works and wrote the manuscript. N.O. helpedexperimental design and contributed to the writing of the manuscript. T.S., E.S., Y.O.,Y.S., T.C and K.A. helped with the experiments and to review the manuscript prior tosubmission. H.S. and K.K. supervised the project and manuscript editing, and preparedthe manuscript.
Additional informationAccession codes: The raw and processed microarray data have been deposited in theGene Expression Omnibus under the accession code GSE52334.
Supplementary Information accompanies this paper at http://www.nature.com/naturecommunications
Competing financial interests: The authors declare no competing financial interests.
Reprints and permission information is available online at http://npg.nature.com/reprintsandpermissions/
How to cite this article: Nobusue, H. et al. Regulation of MKL1 via actin cytoskeletondynamics drives adipocyte differentiation. Nat. Commun. 5:3368 doi: 10.1038/ncomms4368 (2014).
ARTICLE NATURE COMMUNICATIONS | DOI: 10.1038/ncomms4368
12 NATURE COMMUNICATIONS | 5:3368 | DOI: 10.1038/ncomms4368 | www.nature.com/naturecommunications
& 2014 Macmillan Publishers Limited. All rights reserved.
Copyright © 2022 FDOKUMEN