Regional Strategic Transportation Safety Plan - Central ...
228
Regional Strategic Transportation Safety Plan May 2018 Engineers n Planners BURGESS & NIPLE
-
Upload
khangminh22 -
Category
Documents
-
view
3 -
download
0
Transcript of Regional Strategic Transportation Safety Plan - Central ...
Regional Strategic Transportation Safety Plan
May 2018
Engineers n PlannersBURGESS & NIPLE

Regional Strategic Transportation Safety Plan
Prepared by:
In association with: Works Consulting, Inc. Gunn Communications, Inc.
May 2018
Regional Strategic Transportation Safety Plan
Page i of v May 2018
Project Leadership Northern Arizona Council of Governments 119 East Aspen Avenue Flagstaff, AZ 86001
Jason James, Transportation Planner Email: [email protected] Telephone: 928.775.9993 x4271 Central Yavapai Metropolitan Planning Organization 1971 Commerce Center Circle, Suite E Prescott Valley, AZ 86301
Christopher Bridges, CYMPO Administrator Email: [email protected] Telephone: 928.442.5730 Flagstaff Metropolitan Planning Organization 211 West Aspen Avenue Flagstaff, Arizona 86001
David Wessel, FMPO Manager Email: [email protected] Telephone: 928.213.2650 Study Consultant Burgess & Niple, Inc. 1500 N. Priest Drive, Suite 102 Tempe, AZ 85281 Dana Biscan, PE Email: [email protected] Telephone: 602.244.8100 This report was funded in part through grant(s) from the Federal Highway Administration and/or Federal Transit Administration, U.S. Department of Transportation. The contents of this report reflect the views of the author(s), who is responsible for the facts and the accuracy of the data presented herein. The contents do not necessarily reflect the official views or policies of the U.S. Department of Transportation, Arizona Department of Transportation, or any other State or Federal Agency. This report does not constitute a standard, specification, or regulation.
Regional Strategic Transportation Safety Plan
Page ii of v May 2018
Table of Contents
Executive Summary ....................................................................................................................................................... E‐1
Introduction ............................................................................................................................................................... 1
Stakeholder Engagement ........................................................................................................................................... 6
Vision and Goals ......................................................................................................................................................... 7
Safety Tools ................................................................................................................................................................ 8 4.1 ArcGIS Online Mapping Tool ............................................................................................................................. 8 4.2 Crash Analysis Tool (CAT) .................................................................................................................................. 9 4.3 Predictive Analysis Tool – Existing (PATe) ........................................................................................................ 9 4.4 Economic Analysis and Project Justification Tool (eJUST) ................................................................................ 9
Emphasis Areas ........................................................................................................................................................ 10 5.1 Emphasis Area Evaluation by Municipality ..................................................................................................... 11
Crash Analysis .......................................................................................................................................................... 12 6.1 Data Processing ............................................................................................................................................... 12 6.2 Statewide and Local Crash Analysis ................................................................................................................ 12 6.3 Emphasis Area Crash Analysis ......................................................................................................................... 22
6.3.1 Speeding and Aggressive Driving ........................................................................................................ 22 6.3.2 Occupant Protection ........................................................................................................................... 26 6.3.3 Motorcycles ........................................................................................................................................ 30 6.3.4 Distracted Driving ............................................................................................................................... 34 6.3.5 Roadway Infrastructure and Operations: Lane/Roadway Departure ................................................. 38 6.3.6 Roadway Infrastructure and Operations: Intersections/Railroad Crossings ...................................... 43 6.3.7 Age Related: Young Drivers and Older Drivers ................................................................................... 47 6.3.8 Traffic Incident Management (Work Zone) ........................................................................................ 54
6.4 Temporal Trends ............................................................................................................................................. 58 6.5 Environmental Trends ..................................................................................................................................... 60 6.6 Functional Classification Trends ..................................................................................................................... 61
6.6.1 Functional Classification: Arterial and Collector Roads ...................................................................... 61 6.6.2 Functional Classification: Interstate and Freeways ............................................................................ 61
6.7 Person‐Level Trends ........................................................................................................................................ 63 6.7.1 Impaired Driving ................................................................................................................................. 63
6.8 Crash Summary ............................................................................................................................................... 64
National Performance Management Measures ...................................................................................................... 65 7.1 State Performance Measures ......................................................................................................................... 65 7.2 CYMPO Performance Measures ..................................................................................................................... 65 7.3 CYMPO Performance Measure Goals ............................................................................................................. 68
Network Screening ................................................................................................................................................... 71 8.1 Intersection Screening Process ....................................................................................................................... 71
Regional Strategic Transportation Safety Plan
Page iii of v May 2018
8.2 Intersection Rankings...................................................................................................................................... 71 8.3 Segment Screening Process ............................................................................................................................ 72 8.4 Segment Screening Results ............................................................................................................................. 77
Funding Resources ................................................................................................................................................... 81 9.1 Highway Safety Improvement Program (HSIP) ............................................................................................... 81 9.2 Arizona Highway User Revenue Fund (HURF) ................................................................................................ 81 9.3 Railway‐Highway Crossings (Section 130) Program ........................................................................................ 81 9.4 High Risk Rural Roads (HRRR) ......................................................................................................................... 81 9.5 Infrastructure for Rebuilding America (INFRA) Grant Program ...................................................................... 82 9.6 Surface Transportation System Funding Alternatives (STSFA) Program ........................................................ 82 9.7 Surface Transportation Block Grant (STBG) Program ..................................................................................... 82 9.8 STBG Transportation Alternatives .................................................................................................................. 82 9.9 NHTSA Assessment Program .......................................................................................................................... 82 9.10 Congestion Mitigation and Air Quality Improvement (CMAQ) Program ........................................................ 83 9.11 Intelligent Transportation Systems (ITS) Program .......................................................................................... 83 9.12 Governor’s Office of Highway Safety .............................................................................................................. 83 9.13 Other Funding Sources ................................................................................................................................... 83
Implementation Plan ...................................................................................................................................... 84 10.1 Leadership ....................................................................................................................................................... 85 10.2 The HSIP Process ............................................................................................................................................. 85 10.3 Potential HSIP Projects ................................................................................................................................... 85 10.4 Performance Evaluation Plan.......................................................................................................................... 86
Figures Figure 1.1 – Study Area .................................................................................................................................................... 2 Figure 1.2 – Prescott Area ................................................................................................................................................ 3 Figure 1.3 – Prescott Valley Area...................................................................................................................................... 4 Figure 1.4 – RSTSP Process Flow Chart ............................................................................................................................. 5 Figure 4.1 – ArcGIS Online RSTSP Safety Map .................................................................................................................. 8 Figure 4.2 – CAT Data Import Interface ............................................................................................................................ 9 Figure 6.1 – Statewide Crash Trends .............................................................................................................................. 12 Figure 6.2 – Crash Summary by Year .............................................................................................................................. 13 Figure 6.3 – Fatal Crash Locations .................................................................................................................................. 14 Figure 6.4 – Prescott Fatal Crash Locations .................................................................................................................... 15 Figure 6.5 – Prescott Valley Fatal Crash Locations ......................................................................................................... 16 Figure 6.6 – Incapacitating Crash Locations ................................................................................................................... 17 Figure 6.7 – Prescott Incapacitating Crash Locations ..................................................................................................... 18 Figure 6.8 – Prescott Valley Incapacitating Crash Locations .......................................................................................... 19 Figure 6.9 – Speeding and Aggressive Driving Crash Locations ...................................................................................... 23 Figure 6.10 – Prescott Speeding and Aggressive Driving Crash Locations ..................................................................... 24 Figure 6.11 – Prescott Valley Speeding and Aggressive Driving Crash Locations .......................................................... 25 Figure 6.12 – Unrestrained Occupant Crash Locations .................................................................................................. 27 Figure 6.13 – Prescott Unrestrained Occupant Crash Locations .................................................................................... 28 Figure 6.14 – Prescott Valley Unrestrained Occupant Crash Locations ......................................................................... 29
Regional Strategic Transportation Safety Plan
Page iv of v May 2018
Figure 6.15 – Motorcycle Crash Locations ..................................................................................................................... 31 Figure 6.16 – Prescott Motorcycle Crash Locations ....................................................................................................... 32 Figure 6.17 – Prescott Valley Motorcycle Crash Locations ............................................................................................ 33 Figure 6.18 – Distracted Driving ..................................................................................................................................... 34 Figure 6.19 – Distracted Driving Crash Locations ........................................................................................................... 35 Figure 6.20 – Prescott Distracted Driving Crash Locations............................................................................................. 36 Figure 6.21 – Prescott Valley Distracted Driving Crash Locations .................................................................................. 37 Figure 6.22 – Distracted Driving by Type (2014‐2016) ................................................................................................... 38 Figure 6.23 – At‐Fault Unit Action: Lane/Roadway Departure Crashes ......................................................................... 39 Figure 6.24 – Lane/Roadway Departure Crash Locations .............................................................................................. 40 Figure 6.25 – Prescott Lane/Roadway Departure Crash Locations ................................................................................ 41 Figure 6.26 – Prescott Valley Lane/Roadway Departure Crash Locations ..................................................................... 42 Figure 6.27 – Intersection‐Related Crash Locations ....................................................................................................... 44 Figure 6.28 – Prescott Intersection‐Related Crash Locations ........................................................................................ 45 Figure 6.29 – Prescott Valley Intersection‐Related Crash Locations .............................................................................. 46 Figure 6.30 – Older Driver Crash Locations .................................................................................................................... 48 Figure 6.31 – Younger Driver Crash Locations ................................................................................................................ 49 Figure 6.32 – Prescott Older Driver Crash Locations ...................................................................................................... 50 Figure 6.33 – Prescott Younger Driver Crash Locations ................................................................................................. 51 Figure 6.34 – Prescott Valley Older Driver Crash Locations ........................................................................................... 52 Figure 6.35 – Prescott Valley Younger Driver Crash Locations ...................................................................................... 53 Figure 6.36 – Traffic Incident Management (Work Zone) Crash Locations .................................................................... 55 Figure 6.37 – Prescott Traffic Incident Management (Work Zone) Crash Locations ..................................................... 56 Figure 6.38 – Prescott Valley Traffic Incident Management (Work Zone) Crash Locations ........................................... 57 Figure 6.39 – Crash Distribution by Month .................................................................................................................... 58 Figure 6.40 – Crash Summary by Day of Week .............................................................................................................. 59 Figure 6.41 – Crash Summary by Hour of Day ................................................................................................................ 59 Figure 6.42 – Crashes by Collision Manner on Arterial and Collector Roadways........................................................... 61 Figure 6.43 – Crashes by Collision Manner on Interstates and Freeways ...................................................................... 62 Figure 6.44 – At‐Fault Behavior ...................................................................................................................................... 63 Figure 7.1 – Rolling Average for Number of Fatalities ................................................................................................... 66 Figure 7.2 – Rolling Average for Fatality Rate ................................................................................................................ 66 Figure 7.3 – Rolling Average for Serious Injuries ............................................................................................................ 67 Figure 7.4 – Rolling Average for Serious Injury Rate ...................................................................................................... 67 Figure 7.5 – Rolling Average for Non‐Motorized Fatal and Serious Injury Crashes ....................................................... 68 Figure 7.6 – CYMPO Goal for Number of Fatalities Rolling Average .............................................................................. 68 Figure 7.7 – CYMPO Goal for Fatality Rate Rolling Averages ......................................................................................... 69 Figure 7.8 – CYMPO Goal for Number of Serious Injuries Rolling Average .................................................................... 69 Figure 7.9 – CYMPO Goal for Serious Injury Rate Rolling Average ................................................................................. 70 Figure 7.10 – CYMPO Goal for Non‐Motorized Fatal and Serious Injury Rolling Average ............................................. 70 Figure 8.1 – Crash Risk Map ........................................................................................................................................... 74 Figure 8.2 – Prescott Crash Risk Map ............................................................................................................................. 75 Figure 8.3 – Prescott Valley Crash Risk Map .................................................................................................................. 76 Figure 8.4 –Segment Screening Results ......................................................................................................................... 78 Figure 8.5 – Prescott Segment Screening Results .......................................................................................................... 79 Figure 8.6 – Prescott Valley Segment Screening Results ................................................................................................ 80 Figure 10.1 – FHWA Implementation Process Model Elements .................................................................................... 84

Regional Strategic Transportation Safety Plan
Page v of v May 2018
Tables Table E‐1 – Potential HSIP Spot Improvements ............................................................................................................ E‐3 Table 1 – Emphasis Area Evaluation ............................................................................................................................... 10 Table 2 – Emphasis Area Evaluation by Municipality ..................................................................................................... 11 Table 3 – Crash Summary by Year and Severity ............................................................................................................. 13 Table 4 – Crash Distribution by First Harmful Event (All Severities) .............................................................................. 20 Table 5 – Crash Distribution by First Harmful Event in Fatal and Incapacitating Crashes ............................................. 21 Table 6 – Summary By Collision Manner in Multi‐Vehicle Crashes (All Severities) ........................................................ 21 Table 7 – Summary By Collision Manner in Fatal and Incapacitating Multi‐Vehicle Crashes ........................................ 22 Table 8 – Motorcycle Crashes ........................................................................................................................................ 30 Table 9 – Lane/Roadway Departure Crash Characteristics ............................................................................................ 38 Table 10 – Crashes by Driver Age and Contributing Factor ............................................................................................ 47 Table 11 – Weather Conditions ...................................................................................................................................... 60 Table 12 – Lighting Condition ......................................................................................................................................... 60 Table 13 – Drug and Alcohol Involvement ..................................................................................................................... 63 Table 14 – Intersection Screening Summary .................................................................................................................. 71 Table 15 – Segment Screening Summary ....................................................................................................................... 77 Table 16 – Potential HSIP Spot Improvements ............................................................................................................... 86
Appendices Appendix A Stakeholder and Public Engagement Summaries Appendix B Implementation Plan: Sites and Countermeasures

Regional Strategic Transportation Safety Plan
Page E‐1 of E‐3 May 2018
Executive Summary The Northern Arizona Council of Governments (NACOG) is leading the development of a Regional Strategic Transportation Safety Plan (RSTSP) in partnership with the Central Yavapai Metropolitan Planning Organization (CYMPO) and Flagstaff Metropolitan Planning Organization (FMPO). The purpose of the RSTSP is to address safety from a holistic, regional perspective to reduce the risk of death and serious injury to all transportation users. These plans are prepared in support of the 2014 Arizona State Highway Safety Plan (SHSP). The RSTSP utilized a data‐driven approach to assess crash trends in each region. Area‐specific analysis and implementation plans were developed for each agency. Safety priorities, funding strategies, and future safety analysis tools were reviewed and developed for the three regions. This RSTSP establishes a framework for reducing fatal and serious injury crashes on public roads in the CYMPO region by identifying crash trends, emphasis areas, performance measures, high‐risk crash locations, funding resources, and potential projects. Safety analysis tools were developed in tandem with the RSTSP to facilitate future safety‐related project identification and development. These tools include an ArcGIS Online Mapping tool for viewing and exporting data, the Crash Analysis Tool (CAT), the Predictive Analysis Tool – Existing (PATe) for performing predictive analyses, and the Economic Analysis and Project Justification Tool (eJUST) for assisting the Highway Safety Improvement Program (HSIP) application process. To identify crash trends and emphasis areas, a crash analysis was performed for the CYMPO region based on the most recent five years of available crash data: January 1, 2012, to December 31, 2016. Over this period, 7,788 crashes were reported in nontribal areas (44 fatal) and 7,953 crashes were reported in all areas of the CYMPO region. A summary of key crash trends includes: 69.5% of fatal crashes involved a lane or roadway departure. Nearly half of all fatal crashes involved a lack of restraint use (47.7%). Nearly one third of fatal crashes involved a motorcycle (29.5%). The most common collision manner in fatal and incapacitating crashes were rear end, angle, and same
direction sideswipe. The most common collision manner in crashes of all severities were rear end, angle, and left turn. The most cited driver violations in fatal crashes include lack of restraint use, failing to yield right of way,
speeding, and impaired driving. The most cited driver violations for crashes of all severities including failing to yield right of way and
speeding. The CYMPO RSTSP Vision is, “The number of fatal and serious injury crashes significantly decrease for all travel modes every year.” Goals and Strategies were developed in support of this Vision; champions were identified for individual strategies. RSTSP goals include: Reduce fatalities and the occurrence and severity of serious injuries on all public roadways in Arizona. Improve community and agency partnerships in support of safety improvement projects. Standardize local agency crash reporting to be consistent with Department of Public Safety (DPS) formats to
allow for quicker and more accurate high crash location identification and safety analysis. Reduce crashes involving younger drivers. Reduce crashes caused by unsafe driver behaviors prevalent in the CYMPO region, such as distracted driving,
speeding and aggressive driving, and lack of seat belt and helmet use.

Regional Strategic Transportation Safety Plan
Page E‐2 of E‐3 May 2018
Emphasis areas were identified for the CYMPO region in support of the SHSP. Of these 12 areas, CYMPO experienced a higher rate than the statewide rate for fatal crashes in the following areas: Speeding and Aggressive Driving; Occupant Protection; Motorcycles; Distracted Driving; Roadway Infrastructure and Operations: Lane/Roadway Departure; Roadway Infrastructure and Operations: Intersections/Railroad Crossings; Age Related: Young Drivers; Age Related: Older Drivers; and Traffic Incident Management.
This RSTSP addresses performance measures in accordance with the National Performance Management Measures Final Rule (23 CFR Part 490), which established five metrics used to guide HSIP implementation for state and local agencies. Performance targets based on five‐year rolling averages must be established and reported annually for these five metrics:
1. Number of fatalities; 2. Rate of fatalities per 100 million Vehicle Miles Traveled (VMT); 3. Number of serious Injuries; 4. Rate of serious injuries per 100 million VMT; and 5. Number of combined non‐motorized fatalities and serious injuries.
The CYMPO region has been proactive in addressing safety and congestion needs. Planned and recently completed improvements include: Roundabouts SR 89 intersections with Road 4N and Perkinsville Road; Fain Road widening and improvements to convergence with SR 89A; Two‐way left‐turn lane and lighting along SR 89 through Paulden; Pending widening along SR 69; Ongoing improvements to Williamson Valley Road; and Pending intersection improvement at Spring Valley Road.
The recently completed SR 89A State Route 89 to Robert Road Transportation Study identified improvements along SR 89A. Both this RSTSP and the SR 89A Study recommend eastbound and westbound advanced warning beacons at the Robert Road intersection with SR 89A. The SR 89 Chino Valley to Forest Boundary Transportation Study recommended multiple safety improvements. Of these, an HSIP application was previously submitted for turn lanes at Little Ranch Road. The five‐year crash history was reviewed at recommended project locations. None currently have B/C ratios over 1.5. Other HSIP projects identified through Plan preparation and included in the last application cycle include: SR 69 raised median associated with widening.

Regional Strategic Transportation Safety Plan
Page E‐3 of E‐3 May 2018
Yavapai County recently completed the Williamson Valley Road; Pioneer Parkway to Nancy Drive Study. Prioritized recommendations include: Outer Loop Road and Williamson Valley Drive roundabout; Two‐way left‐turn lane from Buena Vista Trail/Longview Drive; and Rainmaker/Single Tree Street improvements.
The five‐year crash history was reviewed at recommended project locations. None currently have Benefit to Cost (B/C) ratios over 1.5. In addition to these projects, the CYMPO region has been conducting educational campaigns targeting driver behaviors such as distracted and aggressive driving. The RSTSP identified potential HSIP projects for the CYMPO region. Potential HSIP projects are listed in Table E‐1.
Table E‐1 – Potential HSIP Spot Improvements
Location Project Preliminary B/C Ratio
State Route 89: State Route 89A to
Rock Formations Shoulder widening 12.4
Williamson Valley Road: Pioneer
Parkway to Kelly Drive Shoulder widening 3.0
Outer Loop Road: Williamson Valley
Road to South Reed Road* Rumble Strips 2.6
Combined Project – Intersection Flashing Warning Signs**
SB Fain Road at State Route 69 Flashing warning signs (2) 30.0
NB Fain Road/State Route 89A at
Robert Road Flashing warning signs (2) 15.2
State Route 69 at Spring Valley
Road Flashing warning signs (2) N/A
*Project must be combined with another to meet minimum HSIP project cost. **Flashing warning sign projects must be combined to meet minimum HSIP project cost. The B/C ratios presented here were calculated individually and do not represent the combined project.
The crash history at some locations was not conducive to HSIP project funding, either due to the benefits associated with very low‐cost countermeasures or the approved Crash Modification Factors (CMF)s may not best address the safety issue. Safety improvements were identified at many of these locations and are included in Appendix B. Project recommendations should be considered as part of City, Town, Yavapai County, and ADOT capital improvement and maintenance programs. Additionally, they should be incorporated into future plans and studies in the region. In accordance with ADOT requirements, this plan should be updated at least every five years. Crash history should be monitored on an ongoing basis; in particular, segments and intersections identified through network screening in should be reviewed annually. These locations should be considered for inclusion in future HSIP applications if the crash history worsens, an appropriate CMF is identified, or other circumstances are present. These locations represent probable candidates for future HSIP applications if current crash patterns persist.

Regional Strategic Transportation Safety Plan
Page 1 of 86 May 2018
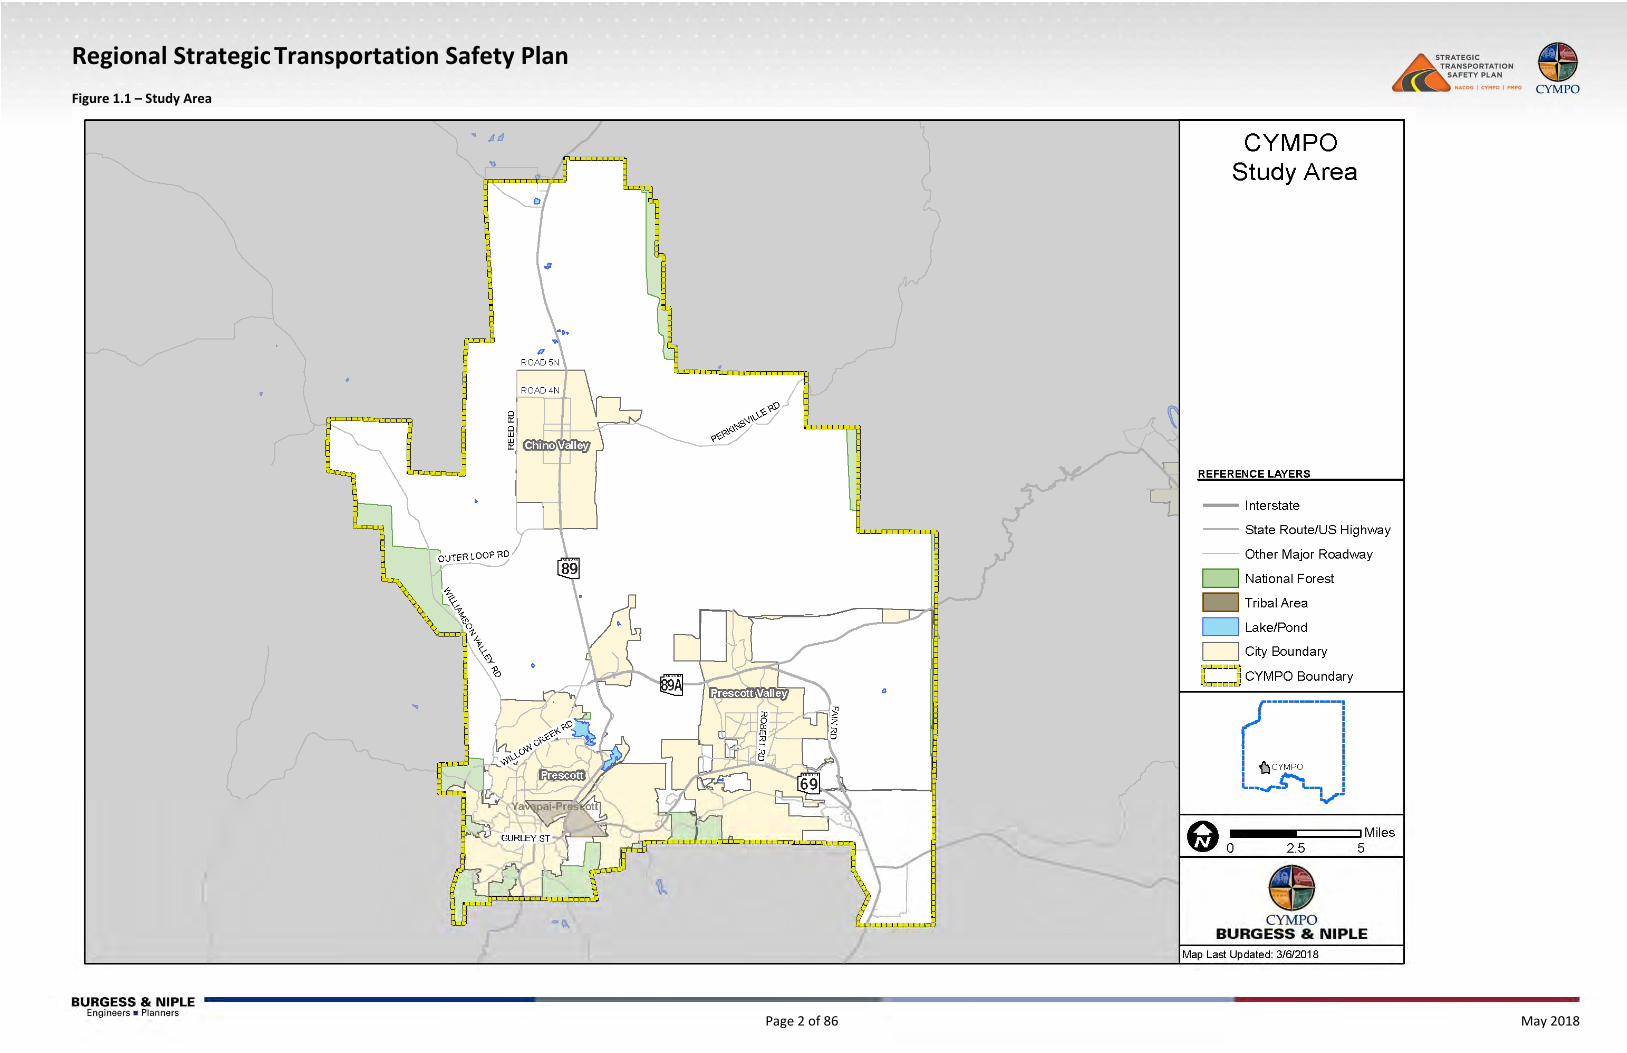
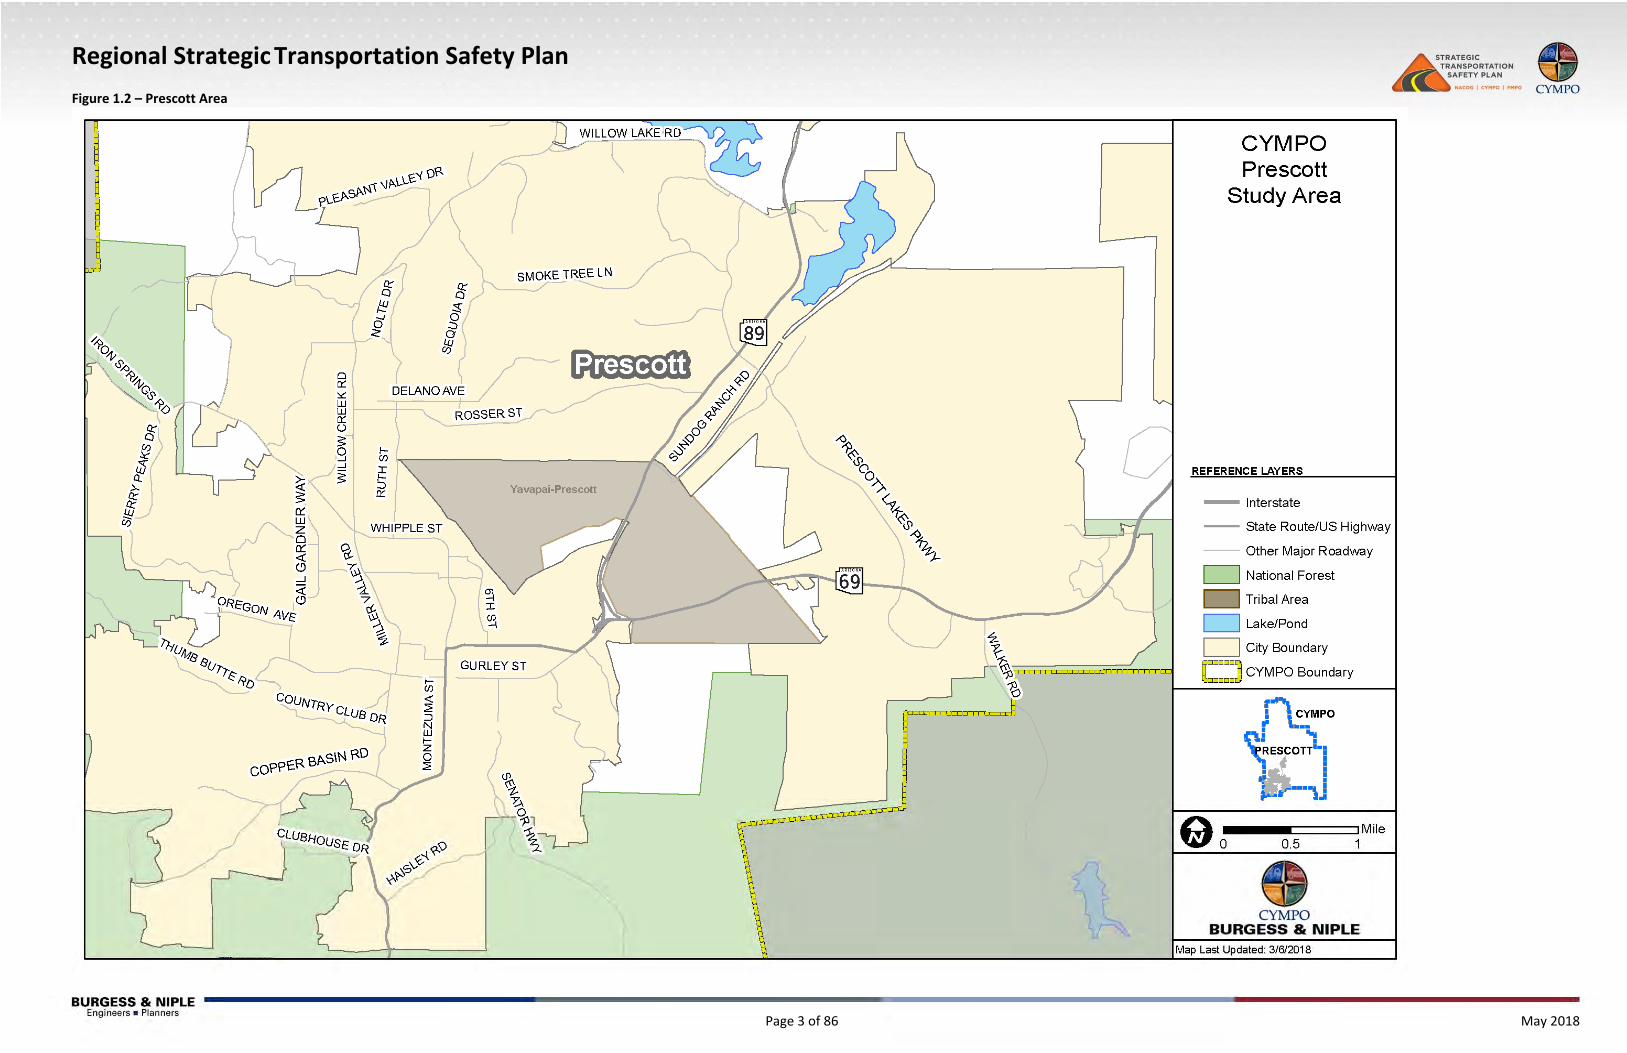
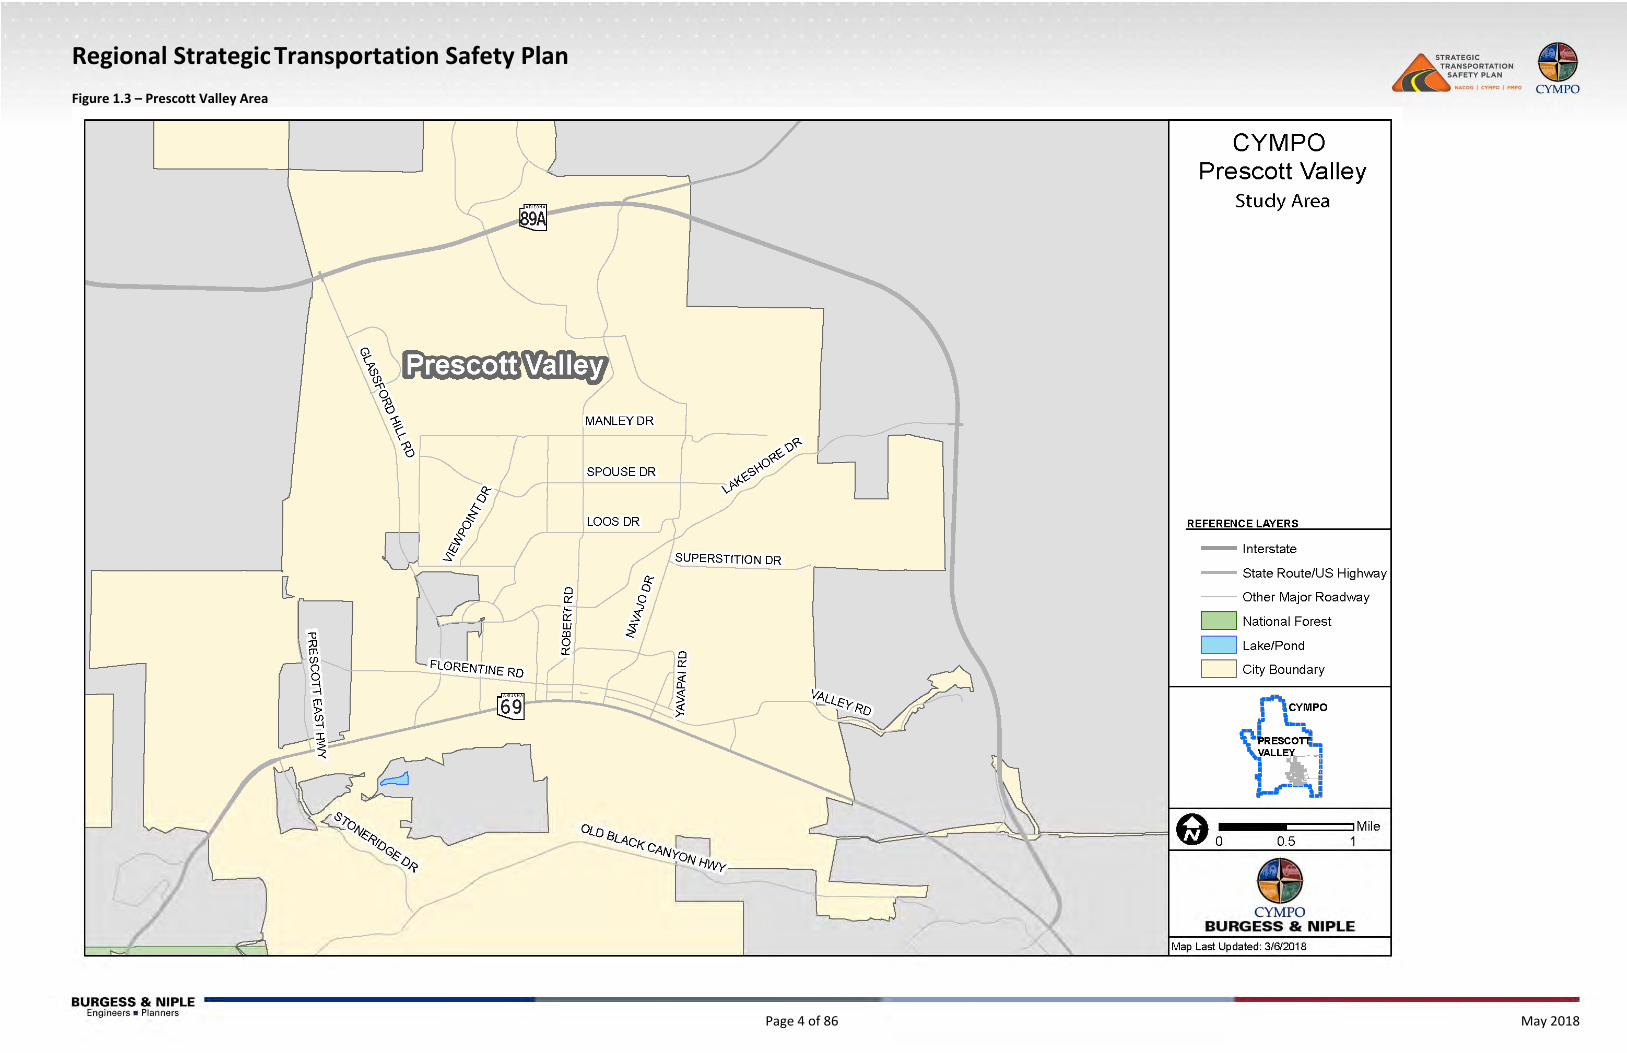
Introduction The Northern Arizona Council of Governments (NACOG) led the development of a Regional Strategic Transportation Safety Plan (RSTSP) in partnership with the Central Yavapai Metropolitan Planning Organization (CYMPO) and Flagstaff Metropolitan Planning Organization (FMPO). The purpose of the RSTSP is to address safety from a holistic, regional perspective to reduce the risk of death and serious injury to all transportation users. The RSTSP establishes a framework identifying objectives, strategies, and performance measures for transportation safety that are consistent with the Arizona Strategic Highway Safety Plan (SHSP). The RSTSP included crash data analysis, safety emphasis area identification, and implementation plan development. The plan was developed with coordination and input from NACOG, CYMPO, FMPO, stakeholders, and the general public. Collaborative meetings were held with NACOG, CYMPO, and FMPO during RSTSP development. Individual plans were developed for each agency. A shared set of safety analysis tools was developed incorporating input from each agency. This plan addresses the CYMPO region, shown in Figure 1.1. Larger scale maps were developed for the more densely‐developed areas of the City of Prescott (Prescott) and Town of Prescott Valley (Prescott Valley). These are shown in Figure 1.2 and Figure 1.3. The RSTSP is a data‐driven plan with clear goals for overall crash reduction. These goals will focus on reducing fatal and serious injury crashes. In addition, Excel‐based tools which complement the RSTSP were developed to mine insights buried in large crash data sets and automatically calculate data required for Highway Safety Improvement Program (HSIP) funding applications. After RSTSP development, NACOG, CYMPO, and FMPO will be able to use the tools for future safety analysis and HSIP funding applications. The data presented in this report analyzes crashes which occurred in the CYMPO region from January 1, 2012, through December 31, 2016, the five‐year analysis period for this study. A study process flow chart is shown in Figure 1.4.
Regional Strategic Transportation Safety Plan
Page 2 of 86 May 2018
Figure 1.1 – Study Area
Regional Strategic Transportation Safety Plan
Page 3 of 86 May 2018
Figure 1.2 – Prescott Area
Regional Strategic Transportation Safety Plan
Page 4 of 86 May 2018
Figure 1.3 – Prescott Valley Area

Regional Strategic Transportation Safety Plan
Page 5 of 86 May 2018
Figure 1.4 – RSTSP Process Flow Chart
Regional Strategic Transportation Safety Plan
Page 6 of 86 May 2018
Stakeholder Engagement Community outreach and stakeholder engagement are an important part of understanding and addressing local safety concerns, as well as opportunities for safety improvement. Multiple meetings, workshops, and community surveys were conducted throughout the development of the RSTSP to ensure it best meets community needs. A facilitated Workshop was conducted August 10, 2017 to discuss crash trends and Vision and Goals, summarized in Section 3.0 . Online public and stakeholder engagement was available August 3, 2017 through November 17, 2017. A summary of the Stakeholder Engagement Workshop and the online engagement is provided in Appendix A. 108 responses were received from stakeholder engagement efforts and recorded in the GIS Online Tool for future consideration during capital improvement project and maintenance program development. Themes from public and stakeholder engagement include:
Concerns regarding bicyclist safety and the need for more bicycle facilities. Concerns regarding congestion. Concerns related to driver behaviors, including speeding and aggressive driving, distracted driving, and
impaired driving. Desire for increased traffic control via signage, signals, and stop signs. Support for additional roundabouts.
Regional Strategic Transportation Safety Plan
Page 7 of 86 May 2018
Vision and Goals This RSTSP supports the Federal Highway Administration’s (FHWA) Vision, “Towards zero deaths and serious injuries on the Nation’s roadways”, and the 2014 Arizona State Highway Safety Plan (SHSP) Vision, “Toward Zero Deaths by Reducing Crashes for a Safer Arizona.” This RSTSP established a framework identifying objectives, strategies, and performance measures for transportation safety that are consistent with the SHSP. A facilitated workshop was held to seek stakeholder input for regional Vision, Goals, and Strategies. Strategies were developed to help realize Goals. The Vision, Goals, and Strategies were refined during the March 1, 2018 CYMPO Technical Advisory Committee (TAC) meeting. At this time, staff volunteered to champion Goals. The CYMPO Vision is:
Vision: The number of fatal and serious injury crashes significantly decrease for all travel modes every year.
Goal: Reduce fatalities and the occurrence and severity of serious injuries on all public roadways in CYMPO.
Strategy: Reduce the total number of fatalities and serious injuries in CYMPO by three to seven percent during the next five years.
Champion(s): CYMPO. Initial lead: Chris Bridges. Goal: Improve community and agency partnerships in support of safety improvement projects.
Strategy: Foster relationships, lead collaboration, educate, and provide data and information. Champion(s): CYMPO and member agencies. Initial lead: Chris Bridges.
Goal: Standardize local agency crash reporting to be consistent with Department of Public Safety (DPS) formats to
allow for quicker and more accurate high crash location identification and safety analysis. Strategy: Work with local law enforcement agencies to facilitate the crash reporting format changes.
Champion(s): CYMPO and Town of Chino Valley. Initial lead: Frank Marbury.
Goal: Reduce crashes involving younger drivers.
Strategy: Conduct educational campaigns targeting future and younger drivers. Champion(s): CYMPO. Initial lead: Chris Bridges.
Goal: Reduce crashes caused by unsafe driver behaviors prevalent in the CYMPO region, such as distracted driving,
speeding and aggressive driving, and lack of seat belt and helmet use.
Strategy: Lead an effort to expand public educational campaign targeting unsafe driver behaviors. Champion(s): CYMPO. Initial lead: Chris Bridges.
Regional Strategic Transportation Safety Plan
Page 8 of 86 May 2018
Safety Tools A suite of online and Excel‐based tools was developed to facilitate the safety analysis process. The tools, as well as a Safety System Analysis Tools User Guide, are available to NACOG, CYMPO, and FMPO for future use. They include: ArcGIS Online Mapping Tool; Crash Analysis Tool (CAT); Predictive Analysis Tool – Existing (PATe); and Economic Analysis and Project Justification Tool (eJUST).
These tools support typical safety analysis tasks, including viewing and exporting site‐specific data, analysis of system and site‐specific crash data for crash trends, network screening, countermeasure selection, alternatives analysis, and HSIP application preparation. Brief descriptions of each tool are contained in the following sections. More detailed information regarding tool use is available in the associated Safety System Analysis Tools User Guide.
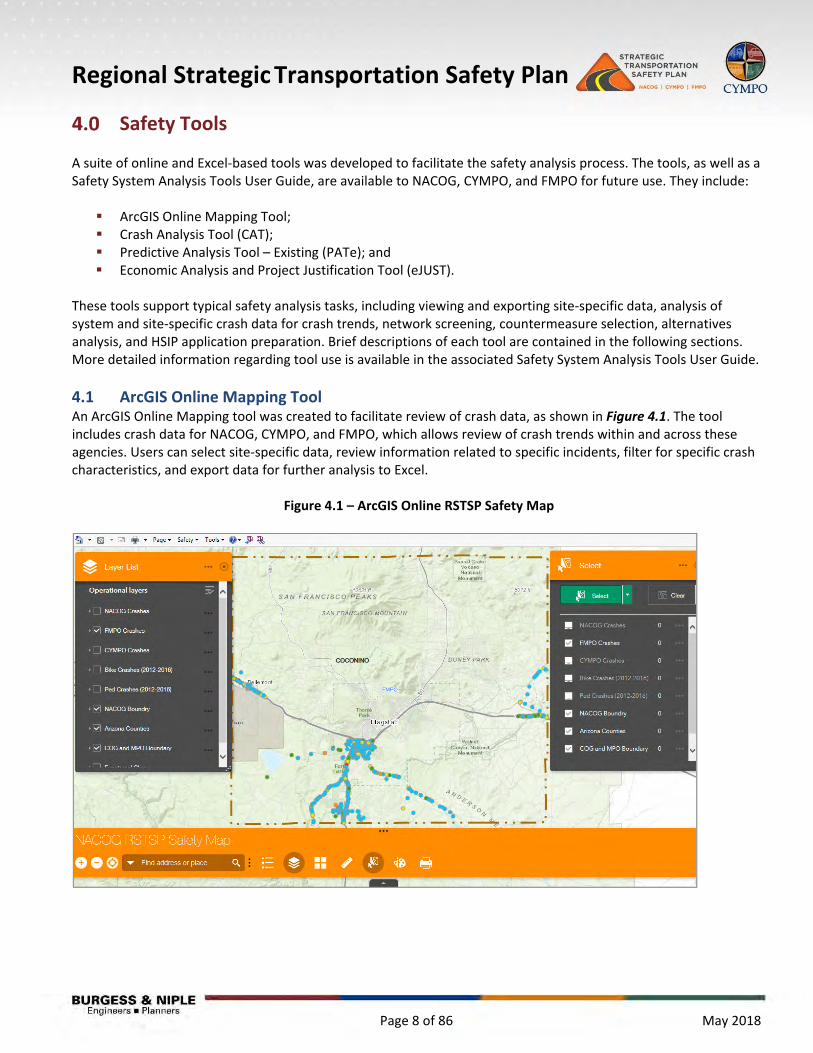
4.1 ArcGIS Online Mapping Tool An ArcGIS Online Mapping tool was created to facilitate review of crash data, as shown in Figure 4.1. The tool includes crash data for NACOG, CYMPO, and FMPO, which allows review of crash trends within and across these agencies. Users can select site‐specific data, review information related to specific incidents, filter for specific crash characteristics, and export data for further analysis to Excel.
Figure 4.1 – ArcGIS Online RSTSP Safety Map
Regional Strategic Transportation Safety Plan
Page 9 of 86 May 2018
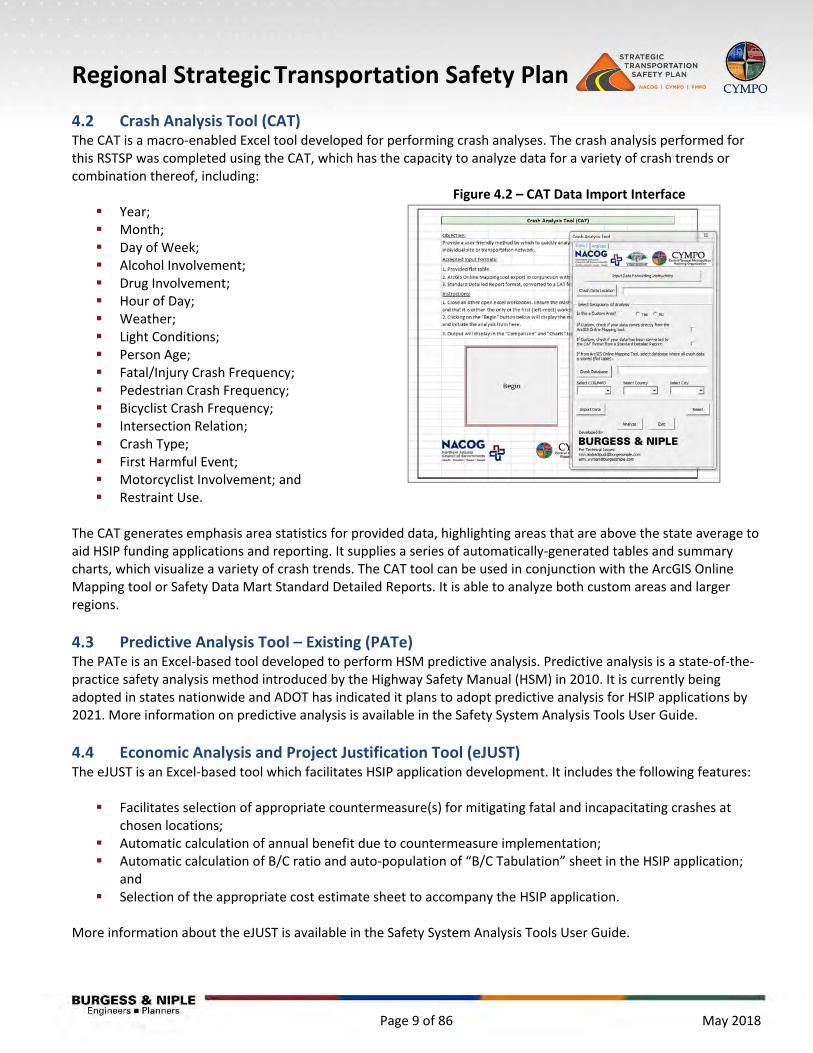
4.2 Crash Analysis Tool (CAT) The CAT is a macro‐enabled Excel tool developed for performing crash analyses. The crash analysis performed for this RSTSP was completed using the CAT, which has the capacity to analyze data for a variety of crash trends or combination thereof, including: Year; Month; Day of Week; Alcohol Involvement; Drug Involvement; Hour of Day; Weather; Light Conditions; Person Age; Fatal/Injury Crash Frequency; Pedestrian Crash Frequency; Bicyclist Crash Frequency; Intersection Relation; Crash Type; First Harmful Event; Motorcyclist Involvement; and Restraint Use.
The CAT generates emphasis area statistics for provided data, highlighting areas that are above the state average to aid HSIP funding applications and reporting. It supplies a series of automatically‐generated tables and summary charts, which visualize a variety of crash trends. The CAT tool can be used in conjunction with the ArcGIS Online Mapping tool or Safety Data Mart Standard Detailed Reports. It is able to analyze both custom areas and larger regions.
4.3 Predictive Analysis Tool – Existing (PATe) The PATe is an Excel‐based tool developed to perform HSM predictive analysis. Predictive analysis is a state‐of‐the‐practice safety analysis method introduced by the Highway Safety Manual (HSM) in 2010. It is currently being adopted in states nationwide and ADOT has indicated it plans to adopt predictive analysis for HSIP applications by 2021. More information on predictive analysis is available in the Safety System Analysis Tools User Guide.
4.4 Economic Analysis and Project Justification Tool (eJUST) The eJUST is an Excel‐based tool which facilitates HSIP application development. It includes the following features: Facilitates selection of appropriate countermeasure(s) for mitigating fatal and incapacitating crashes at
chosen locations; Automatic calculation of annual benefit due to countermeasure implementation; Automatic calculation of B/C ratio and auto‐population of “B/C Tabulation” sheet in the HSIP application;
and Selection of the appropriate cost estimate sheet to accompany the HSIP application.
More information about the eJUST is available in the Safety System Analysis Tools User Guide.
Figure 4.2 – CAT Data Import Interface

Regional Strategic Transportation Safety Plan
Page 10 of 86 May 2018
Emphasis Areas The Arizona Strategic Highway Safety Plan (SHSP) identifies 12 emphasis areas, including five top focus emphasis areas, for analyzing crash trends throughout the state. The top five focus areas are: Speeding and Aggressive Driving; Impaired Driving; Occupant Protection; Motorcycles; and Distracted Driving.
The remaining emphasis areas are:
Roadway Infrastructure and Operations; Age Related; Heavy Vehicles/ Buses/ Transit; Non‐Motorized Users; Natural Risks; Traffic Incident Management; and Interjurisdictional.
Emphasis areas were developed based on fatal crashes experienced during the 2012 to 2016 analysis period. Crash rates are compared to data in both the SHSP (2014) and 2012 to 2016 statewide incident reports. Table 1 summarizes these emphasis areas. Red, bold text indicates the crash rate for this emphasis area was higher than 2012 to 2016 statewide incident reports.
Table 1 – Emphasis Area Evaluation
CYMPO Fatal State Fatal SHSP Fatal
Speeding and Aggressive Driving 34.1% 32.0% 36.7%
Impaired Driving 31.8% 35.4% 34.1%
Occupant Protection 47.7% 40.9% 46.8%
Motorcycles 29.5% 17.5% 16.1%
Distracted Driving 43.2% 39.0% 14.3%
Roadway Infrastructure and Operations: Lane/Roadway Departure 65.9% 47.4% 51.1%
Roadway Infrastructure and Operations: Intersections/Railroad Crossings
34.1% 27.2% 23.8%
Age Related: Young Drivers 27.3% 26.0% 29.7%
Age Related: Older Drivers 29.5% 22.0% 18.2%
Non‐motorized Users: Pedestrians 13.6% 20.4% 17.1%
Non‐motorized Users: Bicyclists 2.3% 3.4% 2.8%
Heavy Vehicles/Buses/Transit 9.1% 12.9% 12.4%
Natural Risks: Weather 2.3% 2.9% 3.7%
Natural Risks: Animal 0.0% 0.2% 0.3%
Traffic Incident Management (Work Zones) 2.3% 1.3% 1.4%
Interjurisdictional Does not represent a particular crash type
Regional Strategic Transportation Safety Plan
Page 11 of 86 May 2018
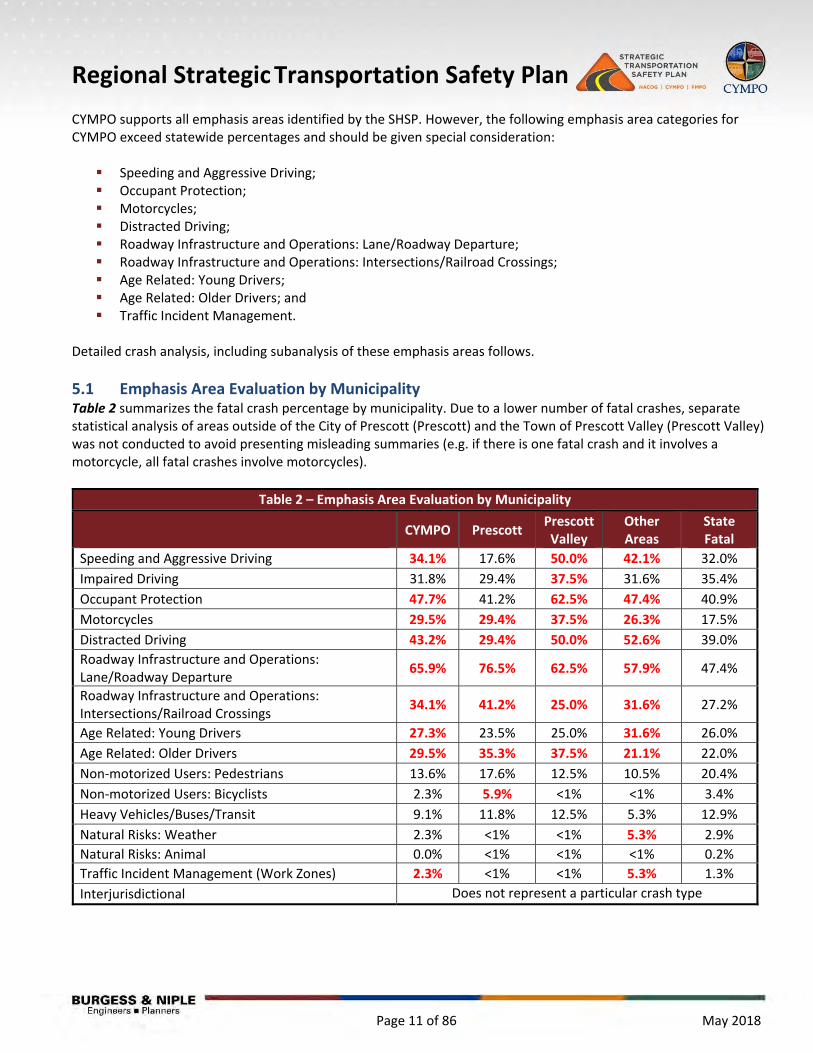
CYMPO supports all emphasis areas identified by the SHSP. However, the following emphasis area categories for CYMPO exceed statewide percentages and should be given special consideration: Speeding and Aggressive Driving; Occupant Protection; Motorcycles; Distracted Driving; Roadway Infrastructure and Operations: Lane/Roadway Departure; Roadway Infrastructure and Operations: Intersections/Railroad Crossings; Age Related: Young Drivers; Age Related: Older Drivers; and Traffic Incident Management.
Detailed crash analysis, including subanalysis of these emphasis areas follows.
5.1 Emphasis Area Evaluation by Municipality Table 2 summarizes the fatal crash percentage by municipality. Due to a lower number of fatal crashes, separate statistical analysis of areas outside of the City of Prescott (Prescott) and the Town of Prescott Valley (Prescott Valley) was not conducted to avoid presenting misleading summaries (e.g. if there is one fatal crash and it involves a motorcycle, all fatal crashes involve motorcycles).
Table 2 – Emphasis Area Evaluation by Municipality
CYMPO Prescott Prescott Valley
Other Areas
State Fatal
Speeding and Aggressive Driving 34.1% 17.6% 50.0% 42.1% 32.0%
Impaired Driving 31.8% 29.4% 37.5% 31.6% 35.4%
Occupant Protection 47.7% 41.2% 62.5% 47.4% 40.9%
Motorcycles 29.5% 29.4% 37.5% 26.3% 17.5%
Distracted Driving 43.2% 29.4% 50.0% 52.6% 39.0%
Roadway Infrastructure and Operations: Lane/Roadway Departure
65.9% 76.5% 62.5% 57.9% 47.4%
Roadway Infrastructure and Operations: Intersections/Railroad Crossings
34.1% 41.2% 25.0% 31.6% 27.2%
Age Related: Young Drivers 27.3% 23.5% 25.0% 31.6% 26.0%
Age Related: Older Drivers 29.5% 35.3% 37.5% 21.1% 22.0%
Non‐motorized Users: Pedestrians 13.6% 17.6% 12.5% 10.5% 20.4%
Non‐motorized Users: Bicyclists 2.3% 5.9% <1% <1% 3.4%
Heavy Vehicles/Buses/Transit 9.1% 11.8% 12.5% 5.3% 12.9%
Natural Risks: Weather 2.3% <1% <1% 5.3% 2.9%
Natural Risks: Animal 0.0% <1% <1% <1% 0.2%
Traffic Incident Management (Work Zones) 2.3% <1% <1% 5.3% 1.3%
Interjurisdictional Does not represent a particular crash type
Regional Strategic Transportation Safety Plan
Page 12 of 86 May 2018
Crash Analysis The most recent five years of crash data, January 1, 2012 to December 31, 2016, for the CYMPO region was obtained from state crash records in the Safety Data Mart (SDM) database and processed to improve data quality. Crash data was extracted on June 29, 2017 to include the most comprehensive account of incidents possible and filtered to include only those crashes which occurred in the CYMPO region on non‐tribal lands. This data was analyzed with the CAT, discussed in Section 4.2.
6.1 Data Processing Crash data was processed for use as part of this RSTSP to consolidate data by crash, combine data from multiple queries in SDM, calculating values for fields that are missing or unavailable in SDM, and removing extraneous data not pertinent to crash analysis. Raw data downloaded from the SDM was “flattened” in a table so that there is one row per crash. Data was simplified by deleting non‐critical fields (i.e. photographer) and was augmented by adding and/or calculating values from separate tables. Existing, dropped, added, and calculated fields are available for review in the Safety System Analysis Tools User Guide, which includes a detailed description of data processing.
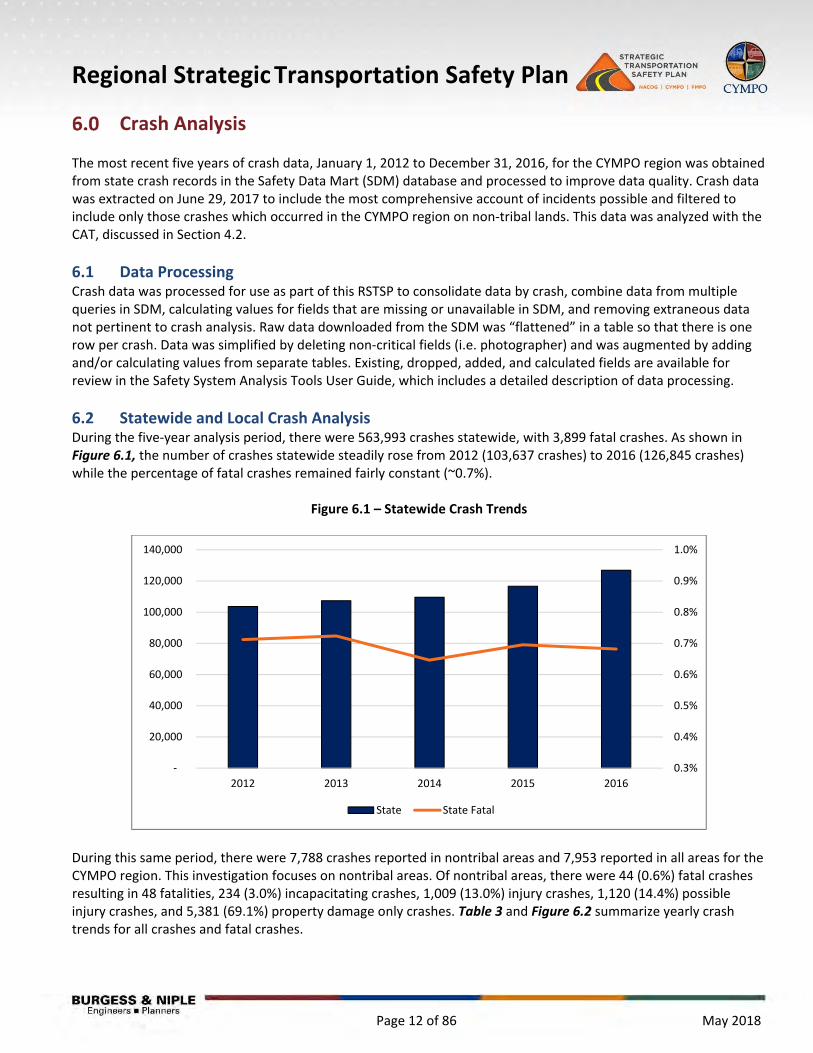
6.2 Statewide and Local Crash Analysis During the five‐year analysis period, there were 563,993 crashes statewide, with 3,899 fatal crashes. As shown in Figure 6.1, the number of crashes statewide steadily rose from 2012 (103,637 crashes) to 2016 (126,845 crashes) while the percentage of fatal crashes remained fairly constant (~0.7%).
Figure 6.1 – Statewide Crash Trends
During this same period, there were 7,788 crashes reported in nontribal areas and 7,953 reported in all areas for the CYMPO region. This investigation focuses on nontribal areas. Of nontribal areas, there were 44 (0.6%) fatal crashes resulting in 48 fatalities, 234 (3.0%) incapacitating crashes, 1,009 (13.0%) injury crashes, 1,120 (14.4%) possible injury crashes, and 5,381 (69.1%) property damage only crashes. Table 3 and Figure 6.2 summarize yearly crash trends for all crashes and fatal crashes.
0.3%
0.4%
0.5%
0.6%
0.7%
0.8%
0.9%
1.0%
‐
20,000
40,000
60,000
80,000
100,000
120,000
140,000
2012 2013 2014 2015 2016
State State Fatal
Regional Strategic Transportation Safety Plan
Page 13 of 86 May 2018
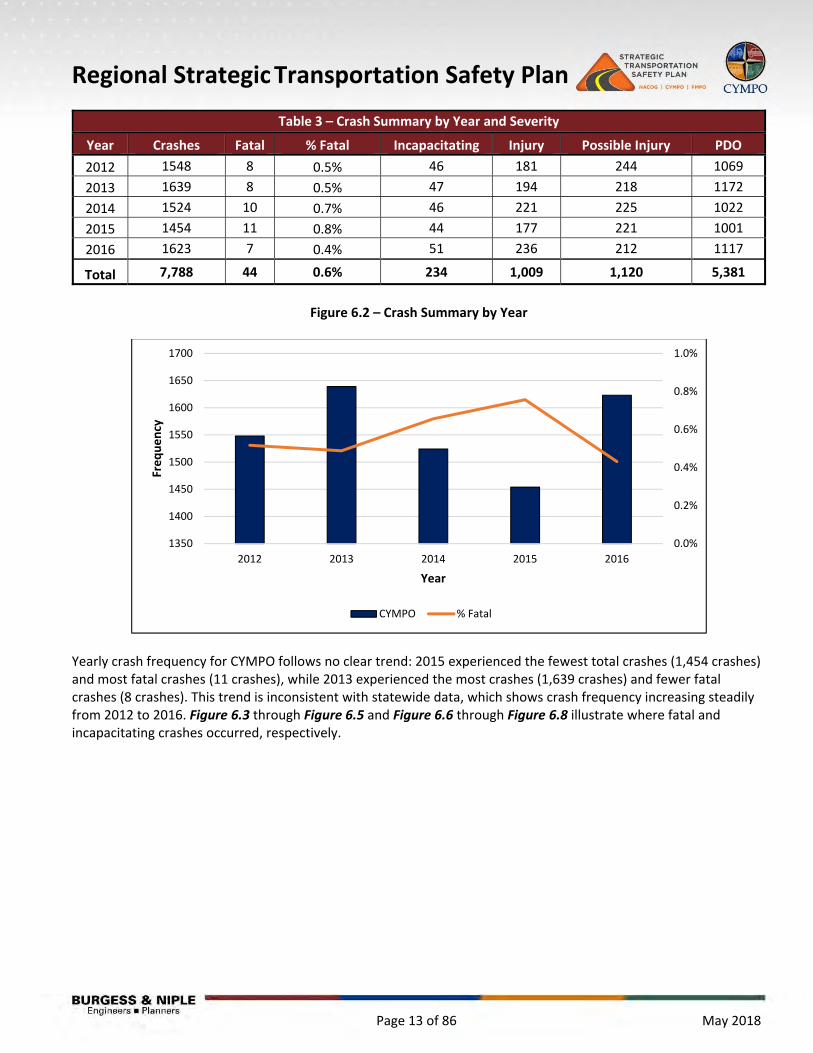
Table 3 – Crash Summary by Year and Severity
Year Crashes Fatal % Fatal Incapacitating Injury Possible Injury PDO
2012 1548 8 0.5% 46 181 244 1069
2013 1639 8 0.5% 47 194 218 1172
2014 1524 10 0.7% 46 221 225 1022
2015 1454 11 0.8% 44 177 221 1001
2016 1623 7 0.4% 51 236 212 1117
Total 7,788 44 0.6% 234 1,009 1,120 5,381
Figure 6.2 – Crash Summary by Year
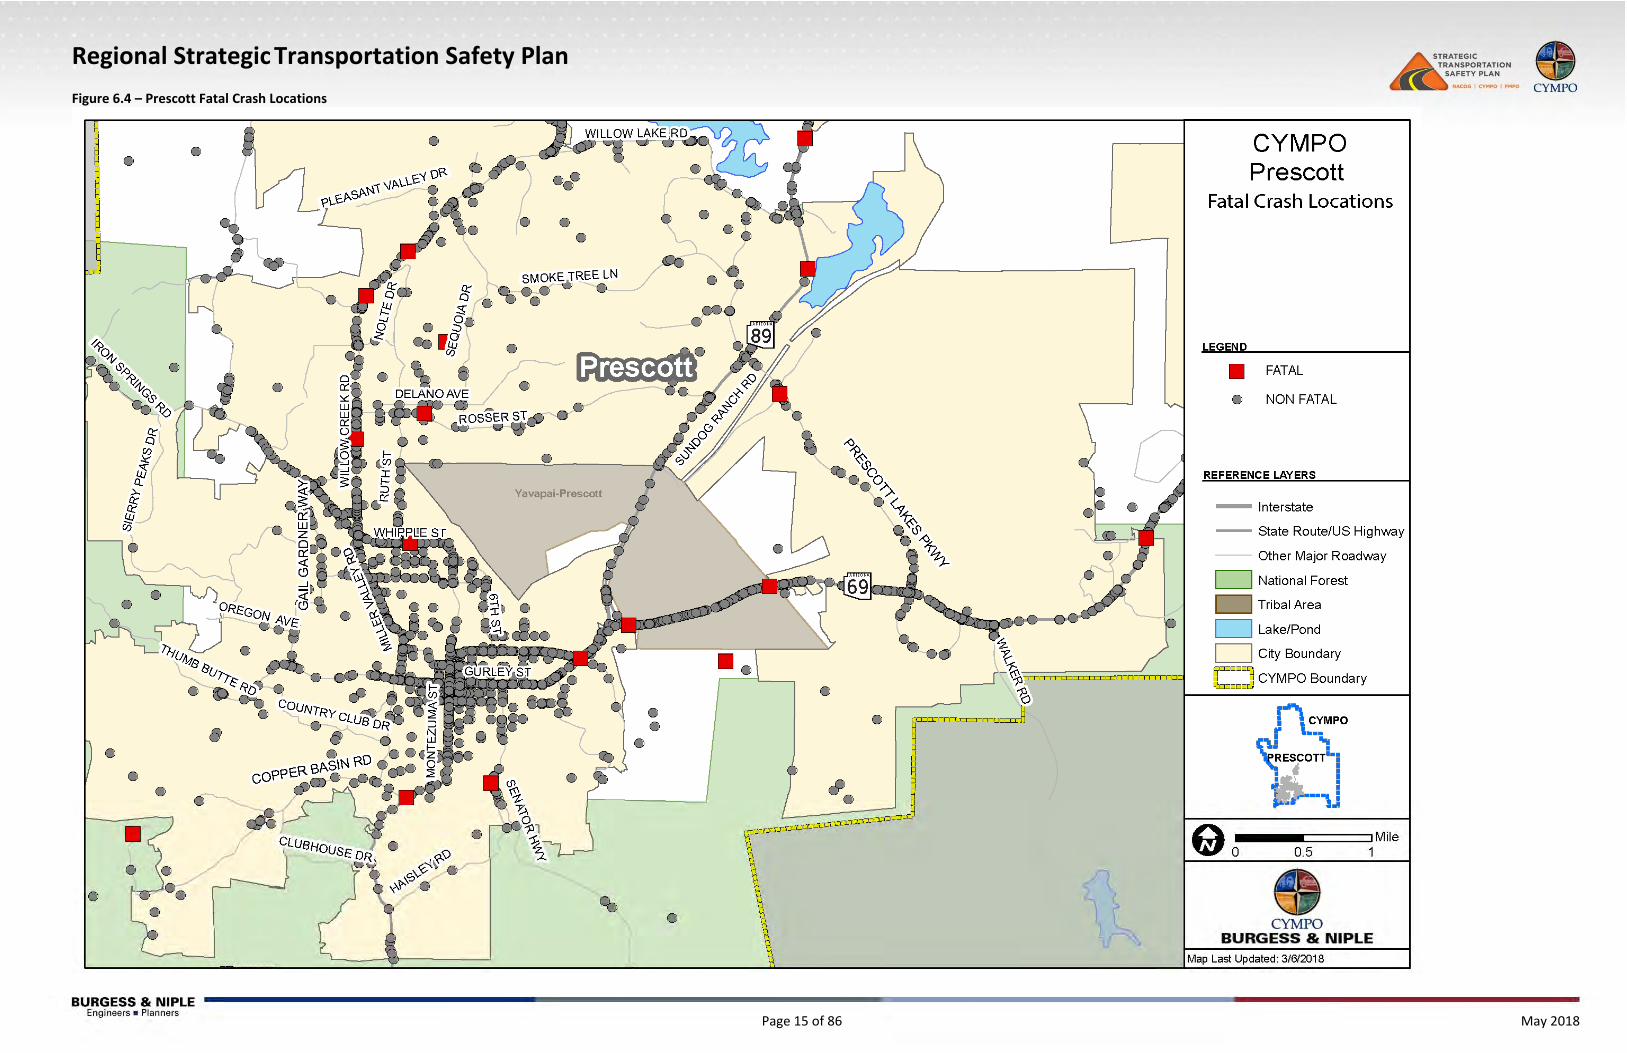
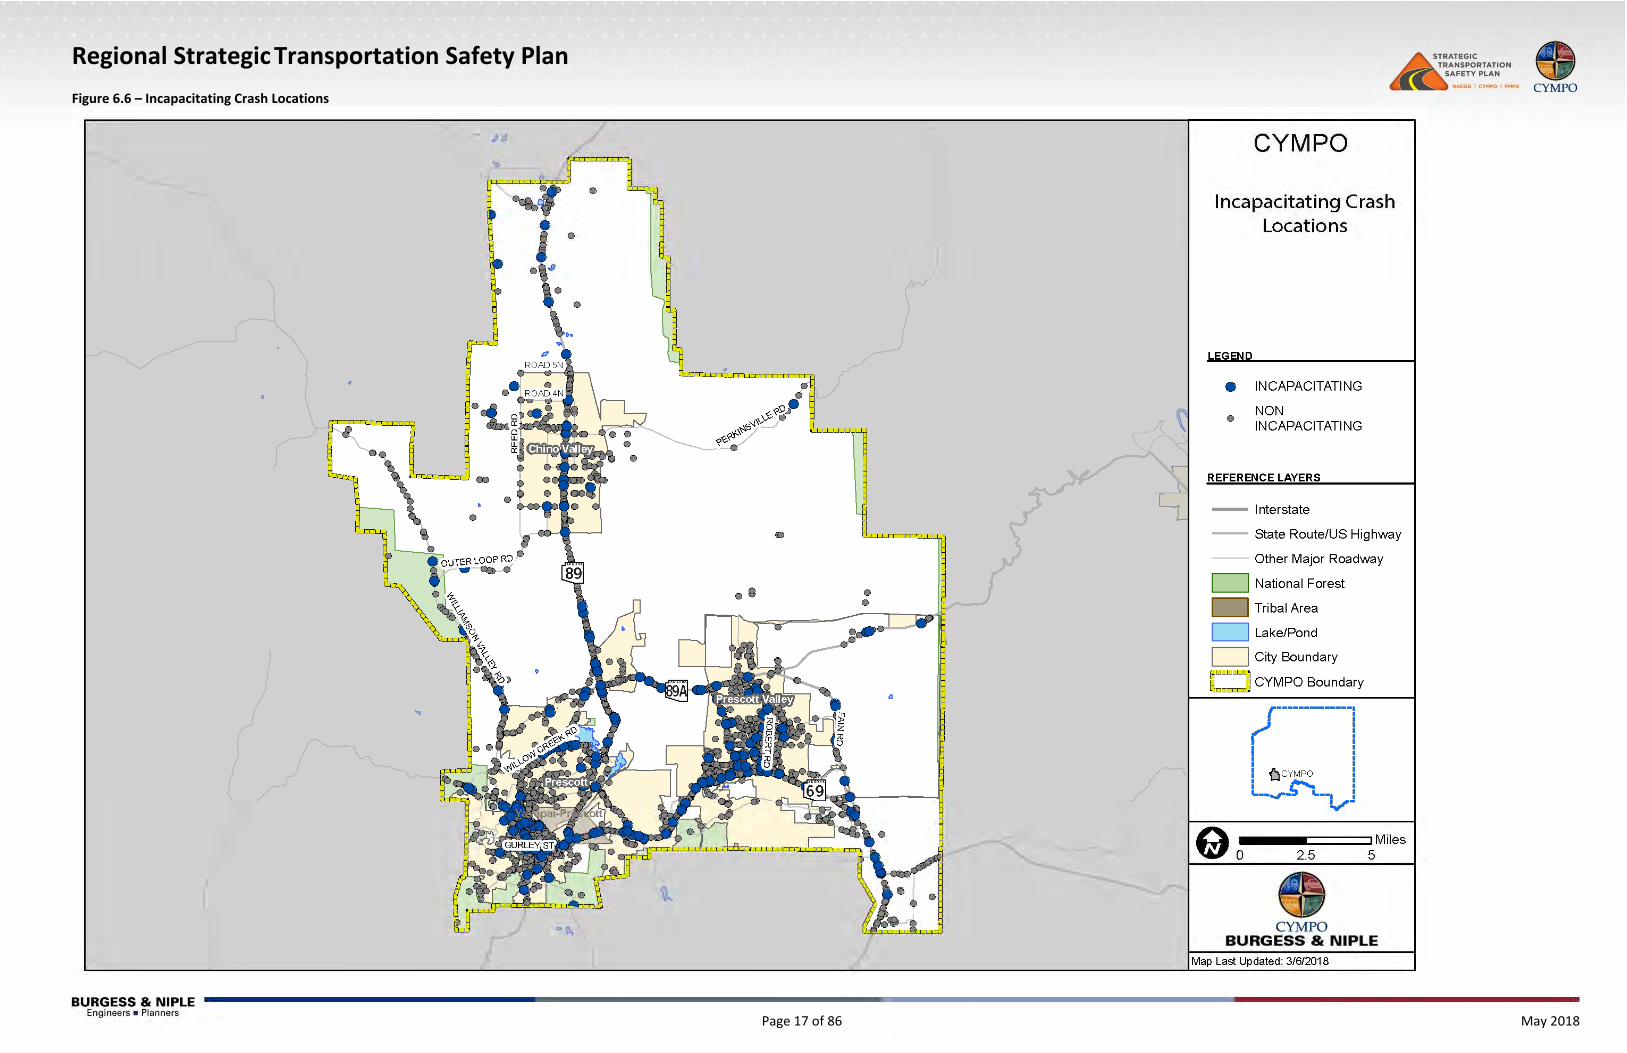
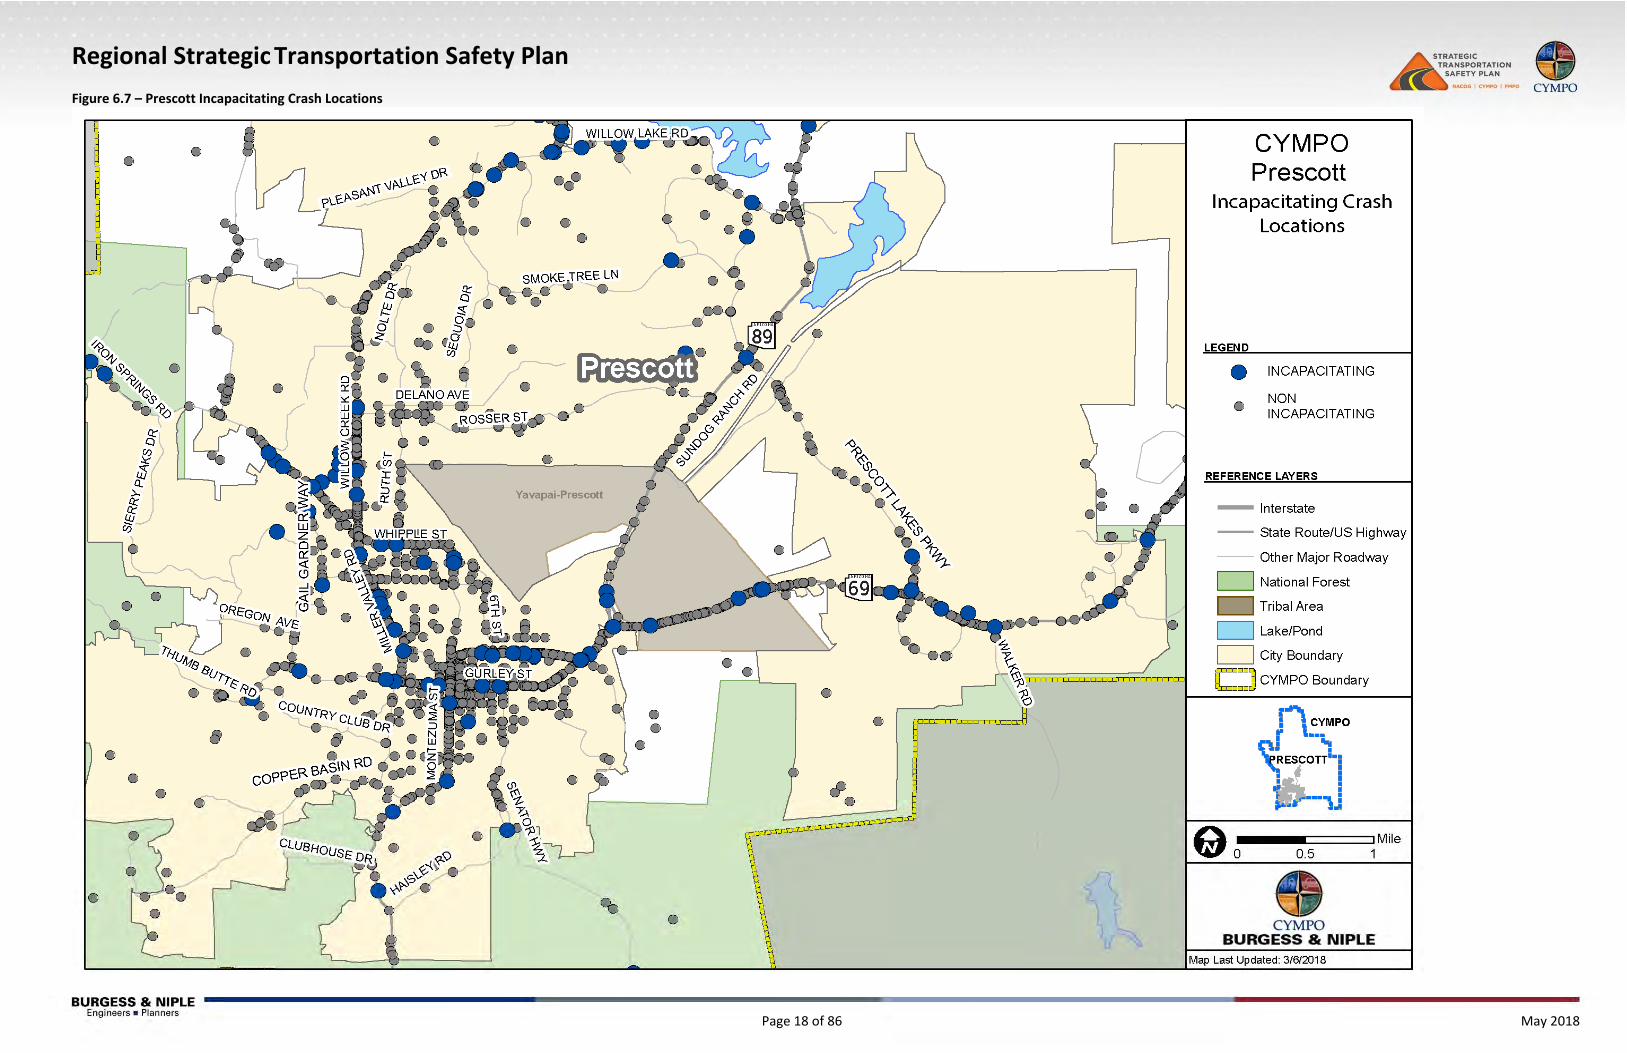
Yearly crash frequency for CYMPO follows no clear trend: 2015 experienced the fewest total crashes (1,454 crashes) and most fatal crashes (11 crashes), while 2013 experienced the most crashes (1,639 crashes) and fewer fatal crashes (8 crashes). This trend is inconsistent with statewide data, which shows crash frequency increasing steadily from 2012 to 2016. Figure 6.3 through Figure 6.5 and Figure 6.6 through Figure 6.8 illustrate where fatal and incapacitating crashes occurred, respectively.
0.0%
0.2%
0.4%
0.6%
0.8%
1.0%
1350
1400
1450
1500
1550
1600
1650
1700
2012 2013 2014 2015 2016
Frequency
Year
CYMPO % Fatal

Regional Strategic Transportation Safety Plan
Page 14 of 86 May 2018
Figure 6.3 – Fatal Crash Locations
Regional Strategic Transportation Safety Plan
Page 15 of 86 May 2018
Figure 6.4 – Prescott Fatal Crash Locations

Regional Strategic Transportation Safety Plan
Page 16 of 86 May 2018
Figure 6.5 – Prescott Valley Fatal Crash Locations
Regional Strategic Transportation Safety Plan
Page 17 of 86 May 2018
Figure 6.6 – Incapacitating Crash Locations
Regional Strategic Transportation Safety Plan
Page 18 of 86 May 2018
Figure 6.7 – Prescott Incapacitating Crash Locations

Regional Strategic Transportation Safety Plan
Page 19 of 86 May 2018
Figure 6.8 – Prescott Valley Incapacitating Crash Locations

Regional Strategic Transportation Safety Plan
Page 20 of 86 May 2018
A summary of crashes by the first causal factor (first harmful event) for the region is provided in Table 4, as well as a comparison to statewide statistics. The comparison numbers are based on the five‐year averages published by ADOT in the Arizona Motor Vehicle Crash Facts for the same time period. Crash patterns reflect both urban and rural characteristics; as such, comparisons to rural and urban areas are provided. Bold, red text denotes values above the statewide percentage.
Table 4 – Crash Distribution by First Harmful Event (All Severities)
First Harmful Event CYMPO
% Prescott
% Prescott Valley
% All Other Areas
% State‐wide
% Urban Areas
% Rural Areas Total %
Collision with Motor Vehicle in Transport
5,491 70.5% 70.7% 78.8% 59.1% 64.3% 67.3% 51.4%
Overturning 159 2.0% 1.3% 1.4% 4.6% 2.2% 0.8% 8.2%
Collision with Pedestrian 74 1.0% 1.1% 0.9% 0.8% 1.0% 1.1% 0.7%
Collision with Pedalcyclist 84 1.1% 1.4% 0.8% 0.8% 1.2% 1.4% 0.6%
Collision with Animal 299 3.8% 3.9% 1.2% 7.2% 1.6% 0.3% 7.2%
Collision with Fixed Object 1,011 13.0% 11.0% 9.6% 21.8% 10.0% 8.0% 19%
Collision with Non‐fixed Object*
412 5.3% 6.7% 4.3% 3.5% 4.0% 3.7% 5.0%
Vehicle Fire or Explosion 4 0.1% 0.0% 0.0% 0.2% 0.3% 0.1% 1.0%
Other Non‐collision** 60 0.8% 0.6% 0.6% 1.5% 0.8% 0.5% 2.0%
Unknown 194 2.5% 3.3% 2.6% 0.7% 14.6% 16.8% 5.0% *Includes Collision with Parked Vehicles, Trains, Railway Vehicles, and Work Zone Equipment
**Includes Vehicle Immersion, Jackknife, and Cargo Loss or Shift
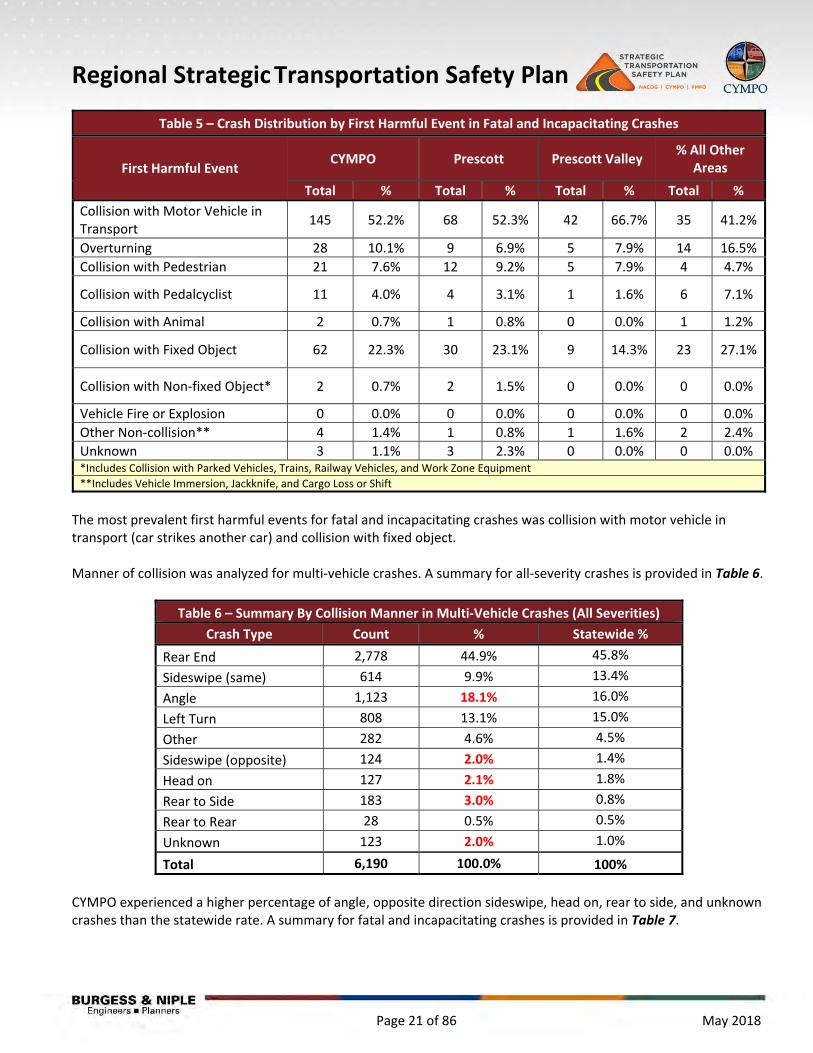
CYMPO experienced a higher percentage of collision with motor vehicle in transport crashes, meaning a car strikes another car, than experienced statewide. This trend was pronounced in both Prescott and Prescott Valley, but not other areas. CYMPO, especially areas outside of Prescott and Prescott Valley, experienced a higher percentage of collisions with animals and fixed objects than the statewide average; these crash types are more prevalent in rural areas statewide. It is important to note that the first harmful event may differ from the most harmful event and/or may be incomplete without examining secondary events. For example, Table 4 indicates that 70.5% of crashes originate with one vehicle striking another; however, 6,190 (79.4%) of crashes involved more than one vehicle. This indicates a second event after the first harmful event that contributed to the crash. Crash distribution by first harmful event was analyzed for fatal and incapacitating crashes. Table 5 summarizes these statistics.
Regional Strategic Transportation Safety Plan
Page 21 of 86 May 2018
Table 5 – Crash Distribution by First Harmful Event in Fatal and Incapacitating Crashes
First Harmful Event CYMPO Prescott Prescott Valley
% All Other Areas
Total % Total % Total % Total %
Collision with Motor Vehicle in Transport
145 52.2% 68 52.3% 42 66.7% 35 41.2%
Overturning 28 10.1% 9 6.9% 5 7.9% 14 16.5%
Collision with Pedestrian 21 7.6% 12 9.2% 5 7.9% 4 4.7%
Collision with Pedalcyclist 11 4.0% 4 3.1% 1 1.6% 6 7.1%
Collision with Animal 2 0.7% 1 0.8% 0 0.0% 1 1.2%
Collision with Fixed Object 62 22.3% 30 23.1% 9 14.3% 23 27.1%
Collision with Non‐fixed Object* 2 0.7% 2 1.5% 0 0.0% 0 0.0%
Vehicle Fire or Explosion 0 0.0% 0 0.0% 0 0.0% 0 0.0%
Other Non‐collision** 4 1.4% 1 0.8% 1 1.6% 2 2.4%
Unknown 3 1.1% 3 2.3% 0 0.0% 0 0.0% *Includes Collision with Parked Vehicles, Trains, Railway Vehicles, and Work Zone Equipment
**Includes Vehicle Immersion, Jackknife, and Cargo Loss or Shift
The most prevalent first harmful events for fatal and incapacitating crashes was collision with motor vehicle in transport (car strikes another car) and collision with fixed object. Manner of collision was analyzed for multi‐vehicle crashes. A summary for all‐severity crashes is provided in Table 6.
Table 6 – Summary By Collision Manner in Multi‐Vehicle Crashes (All Severities)
Crash Type Count % Statewide %
Rear End 2,778 44.9% 45.8%
Sideswipe (same) 614 9.9% 13.4%
Angle 1,123 18.1% 16.0%
Left Turn 808 13.1% 15.0%
Other 282 4.6% 4.5%
Sideswipe (opposite) 124 2.0% 1.4%
Head on 127 2.1% 1.8%
Rear to Side 183 3.0% 0.8%
Rear to Rear 28 0.5% 0.5%
Unknown 123 2.0% 1.0%
Total 6,190 100.0% 100%
CYMPO experienced a higher percentage of angle, opposite direction sideswipe, head on, rear to side, and unknown crashes than the statewide rate. A summary for fatal and incapacitating crashes is provided in Table 7.

Regional Strategic Transportation Safety Plan
Page 22 of 86 May 2018
Table 7 – Summary By Collision Manner in Fatal and Incapacitating Multi‐Vehicle Crashes
Crash Type Fatal and
Incapacitating % of Fatal and Incapacitating
Rear End 95 43.8%
Sideswipe (same) 28 12.9%
Angle 37 17.1%
Left Turn 21 9.7%
Other 14 6.5%
Sideswipe (opposite) 2 0.9%
Head on 4 1.8%
Rear to Side 11 5.1%
Rear to Rear 0 0.0%
Unknown 5 2.3%
Total 217 100.0%
Rear end, angle, and sideswipe crashes comprised the highest proportion of fatal and incapacitating multi‐vehicle crashes. Note that of the 278 total fatal and incapacitating crashes, 61 (21.9%) were single vehicle crashes.
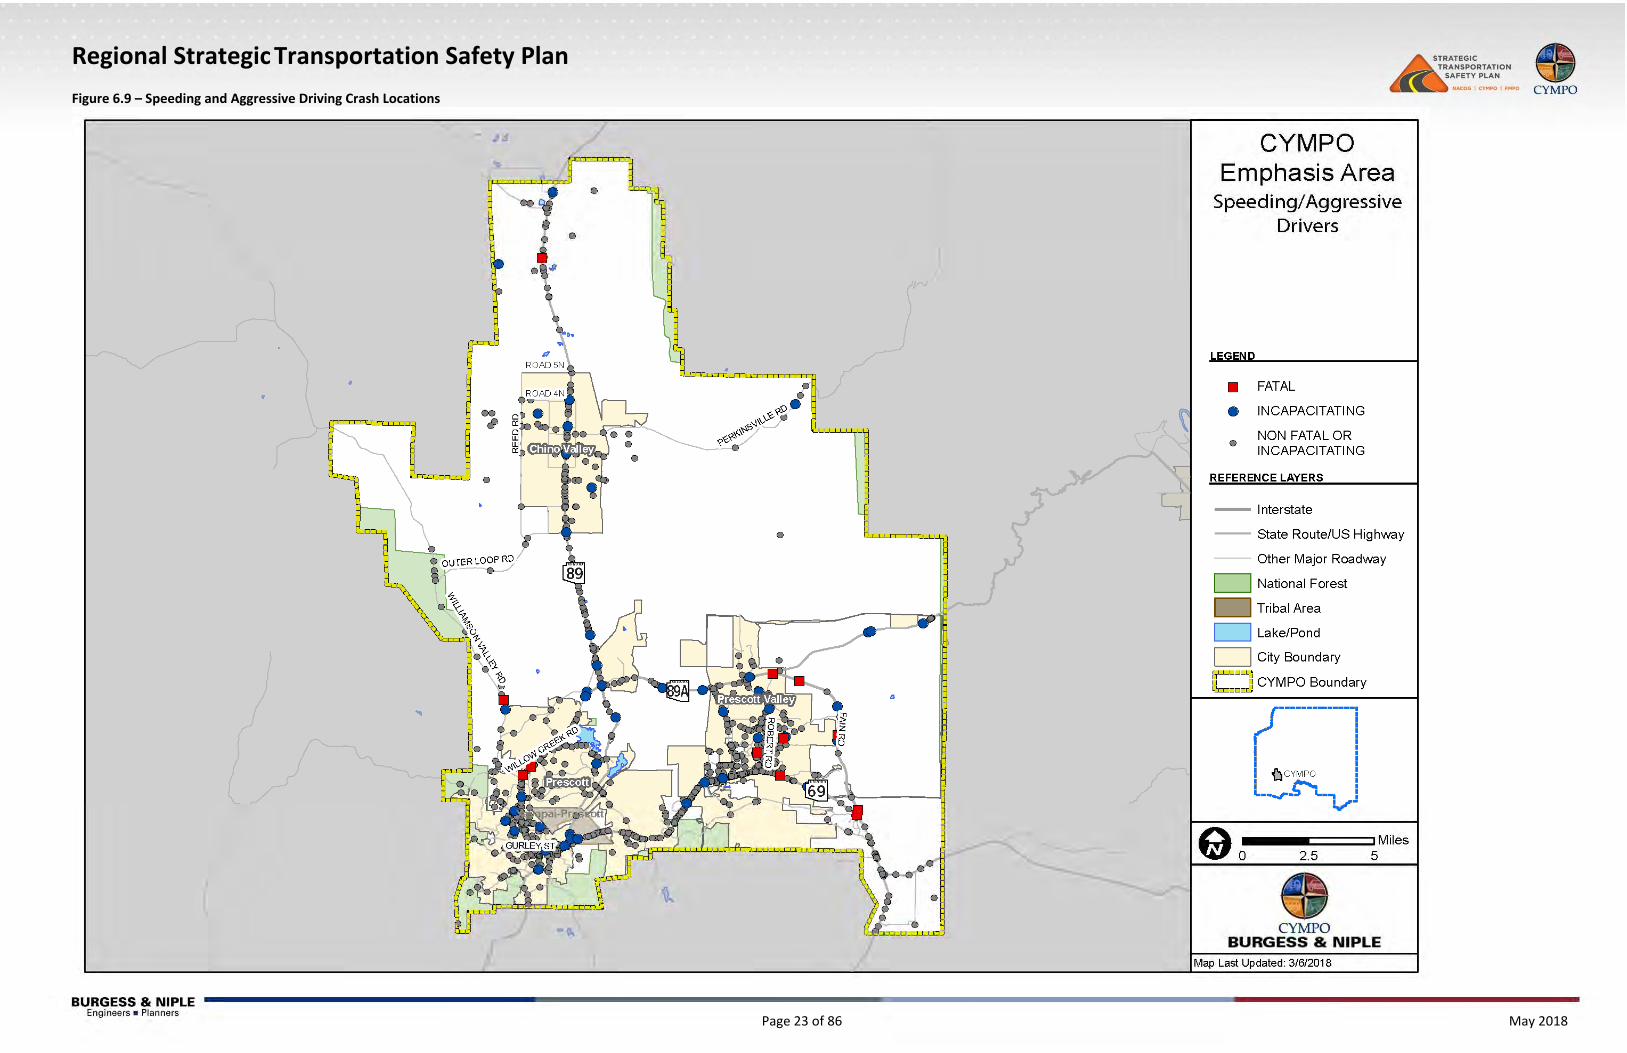
6.3 Emphasis Area Crash Analysis Emphasis area crash trends were reviewed in detail in support of the SHSP. The following emphasis areas are emphasis areas identified in the Arizona SHSP for which CYMPO exceeded the statewide percentage. Other crash trends are reviewed in subsequent sections. 6.3.1 Speeding and Aggressive Driving There were 2,144 crashes, including 15 fatal crashes, which involved speeding. Among these 15:
9 were single vehicle crashes; 4 were rear end crashes; 3 were dark‐lighted and 5 were dark‐not lighted; and 6 involved alcohol or drug use.
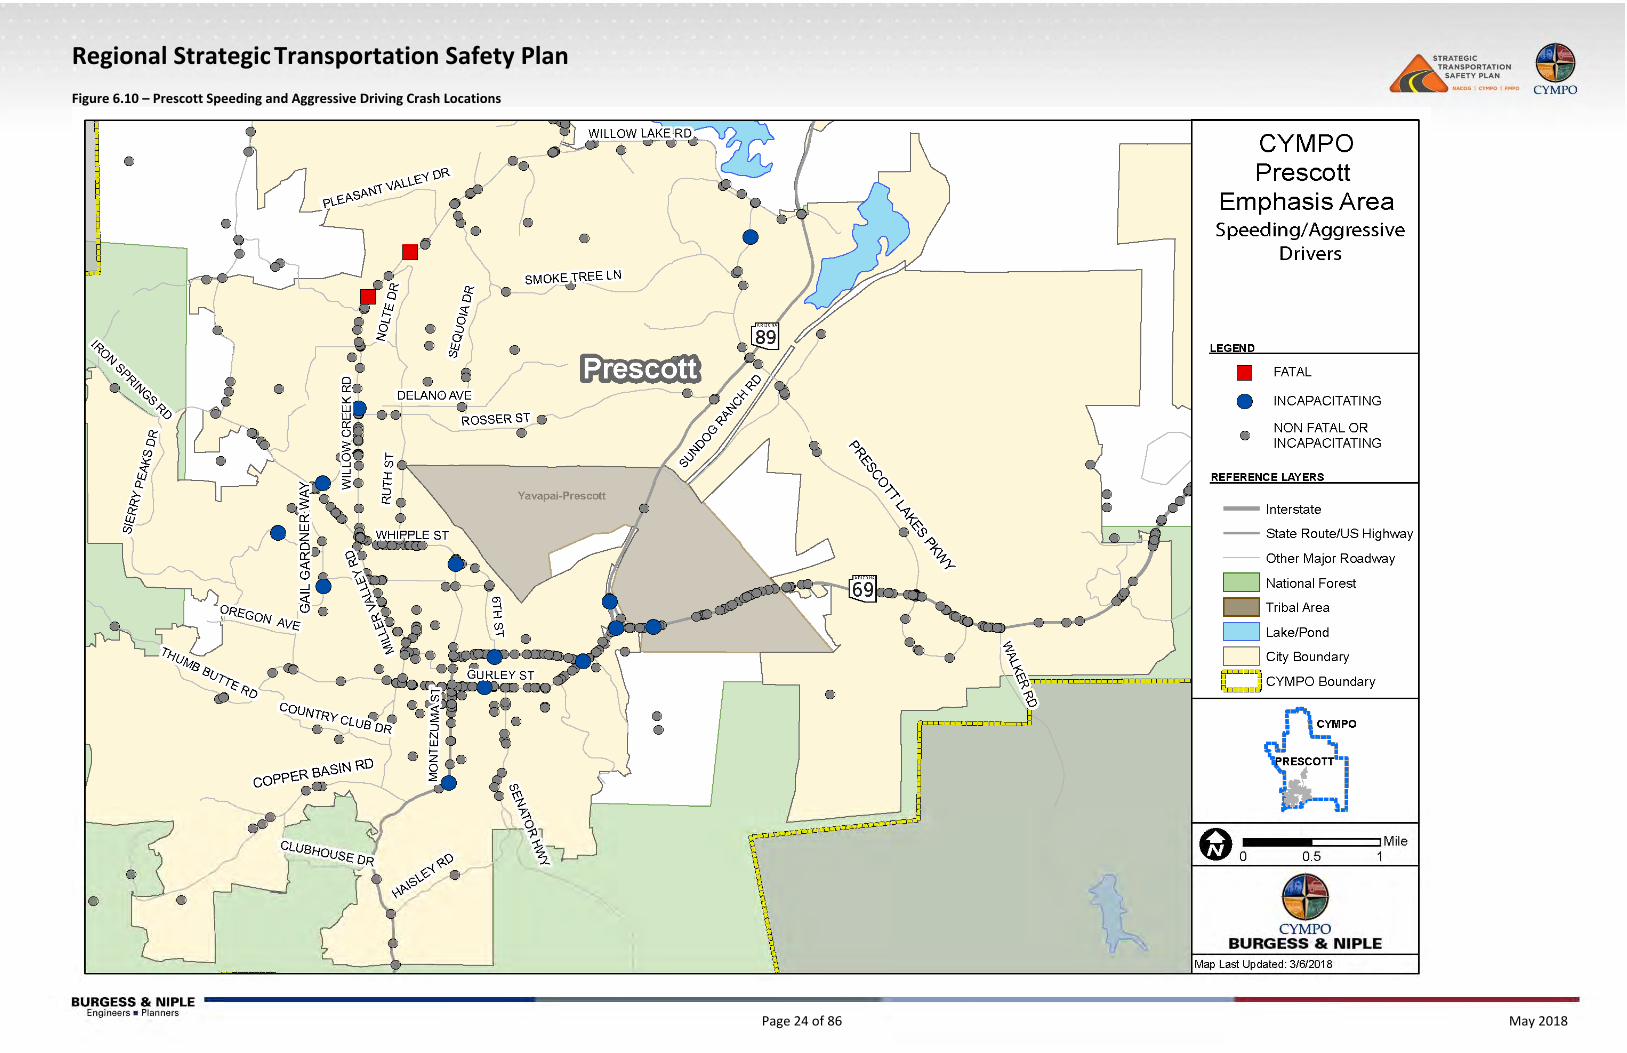
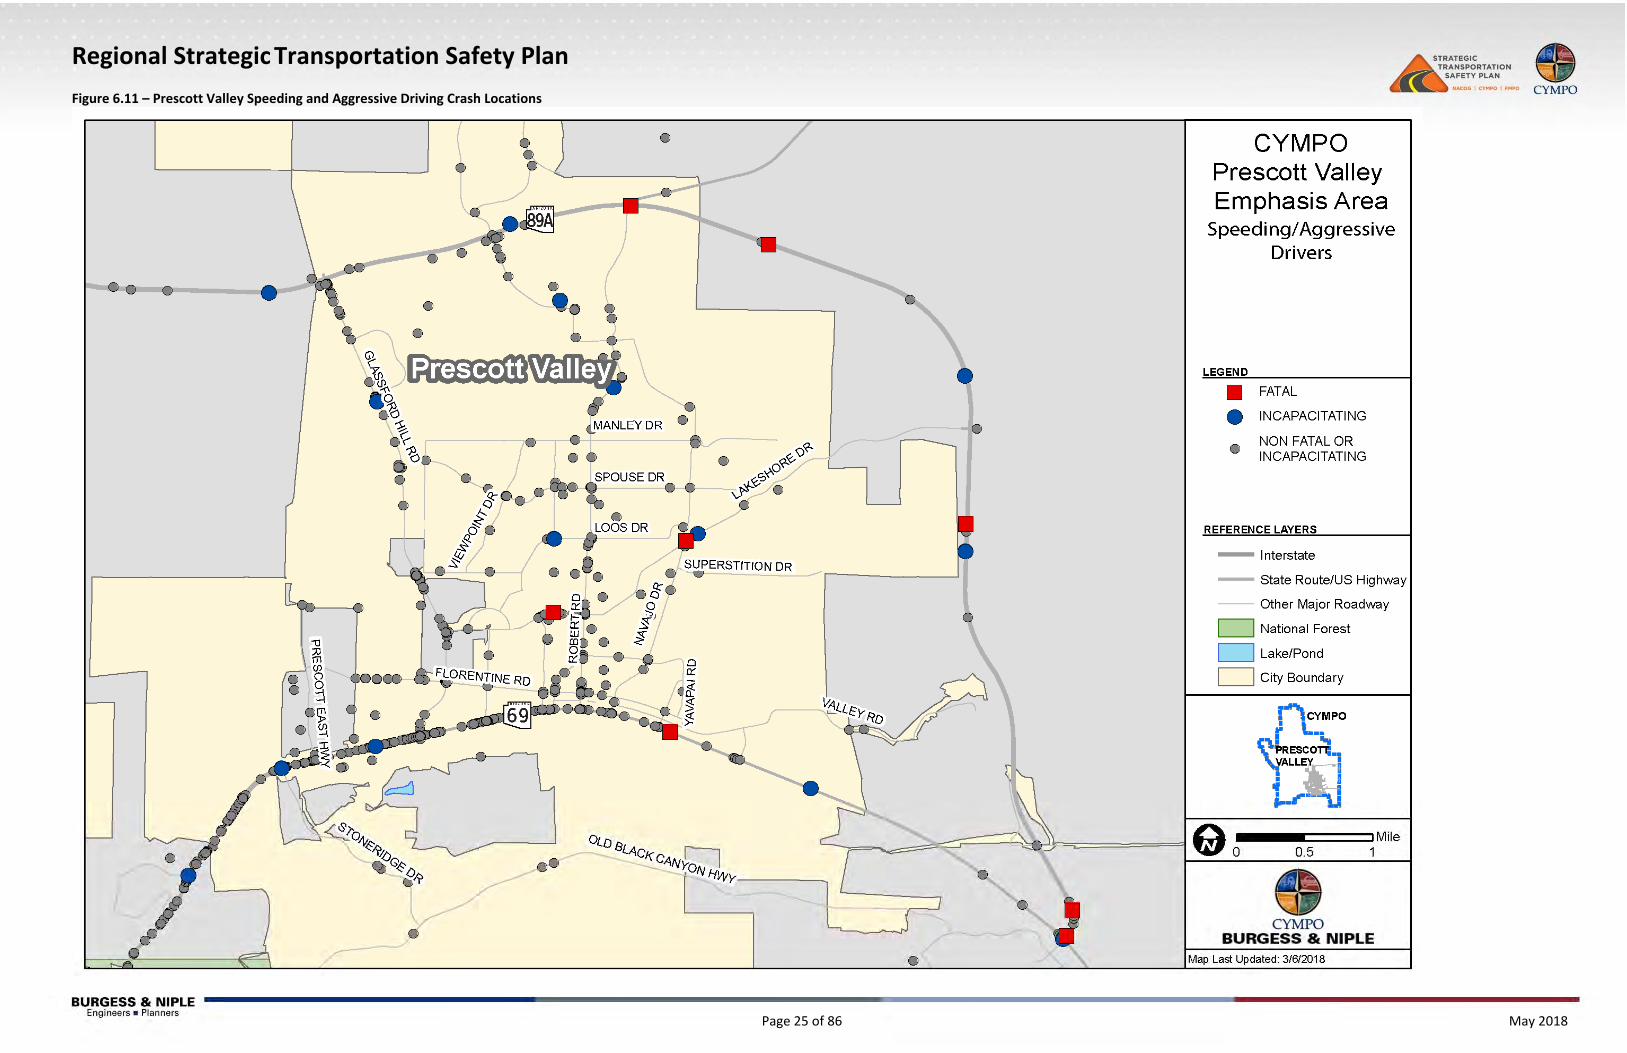
Figure 6.9 through Figure 6.11 provide a graphical representation of where fatal and other severity speeding and aggressive driving crashes occurred.
Regional Strategic Transportation Safety Plan
Page 23 of 86 May 2018
Figure 6.9 – Speeding and Aggressive Driving Crash Locations
Regional Strategic Transportation Safety Plan
Page 24 of 86 May 2018
Figure 6.10 – Prescott Speeding and Aggressive Driving Crash Locations
Regional Strategic Transportation Safety Plan
Page 25 of 86 May 2018
Figure 6.11 – Prescott Valley Speeding and Aggressive Driving Crash Locations
Regional Strategic Transportation Safety Plan
Page 26 of 86 May 2018
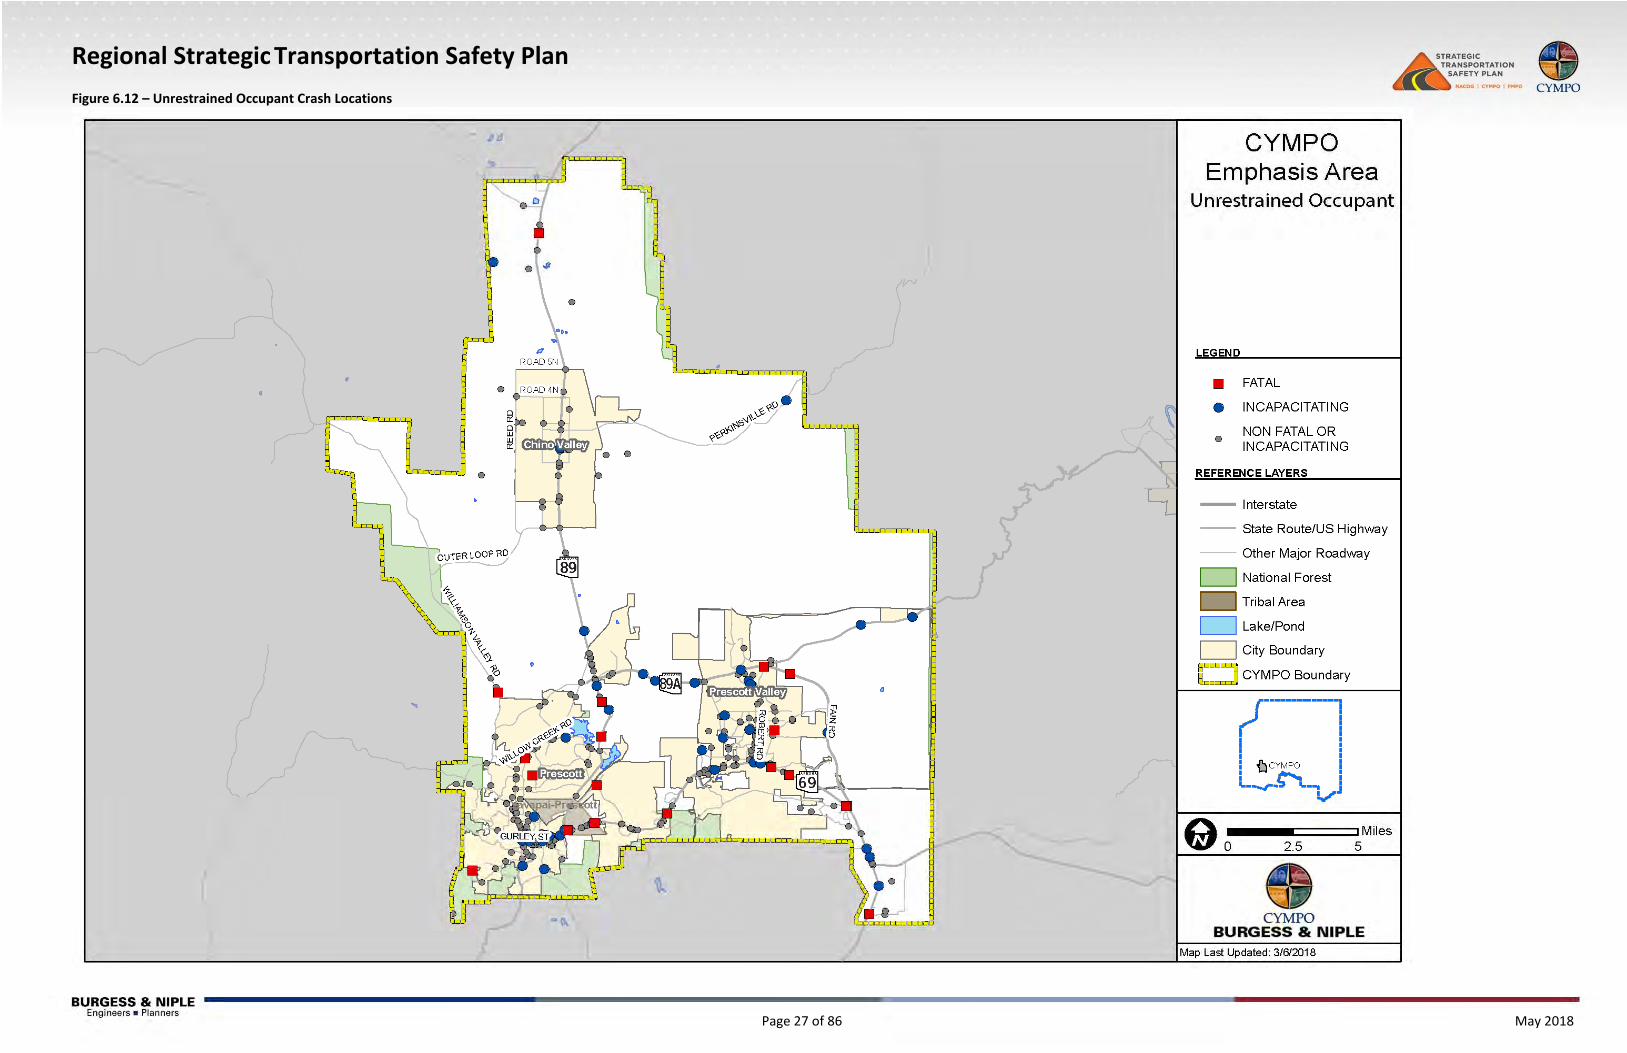
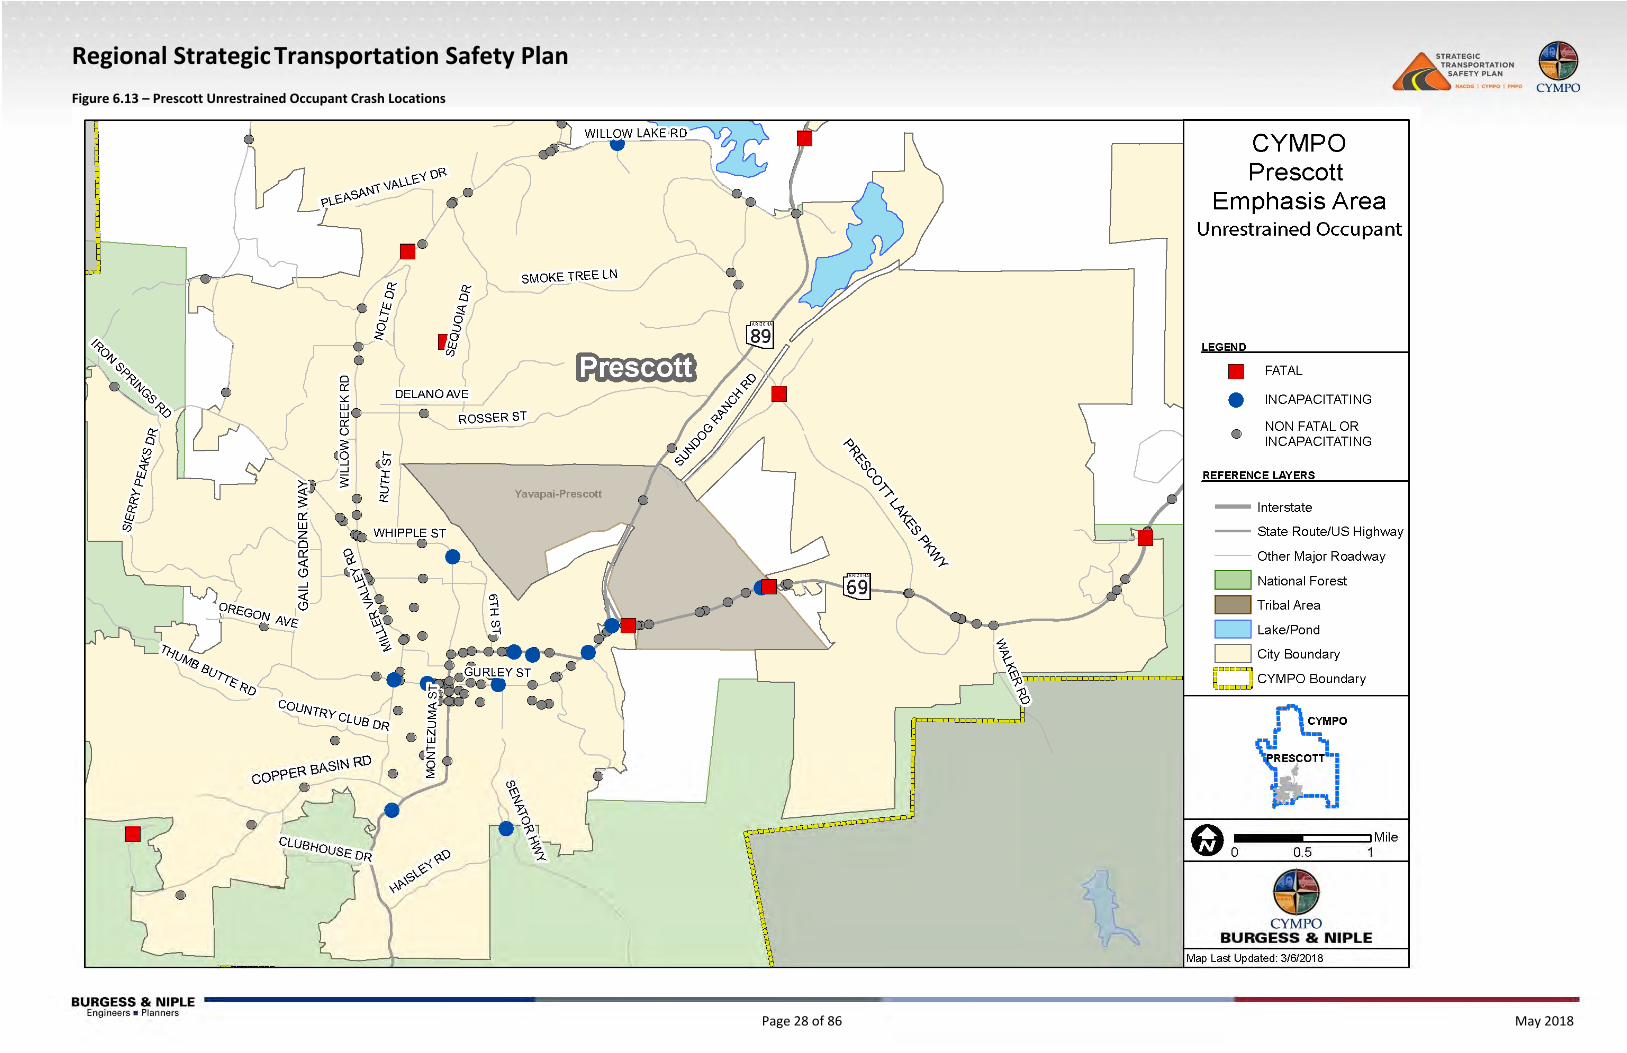
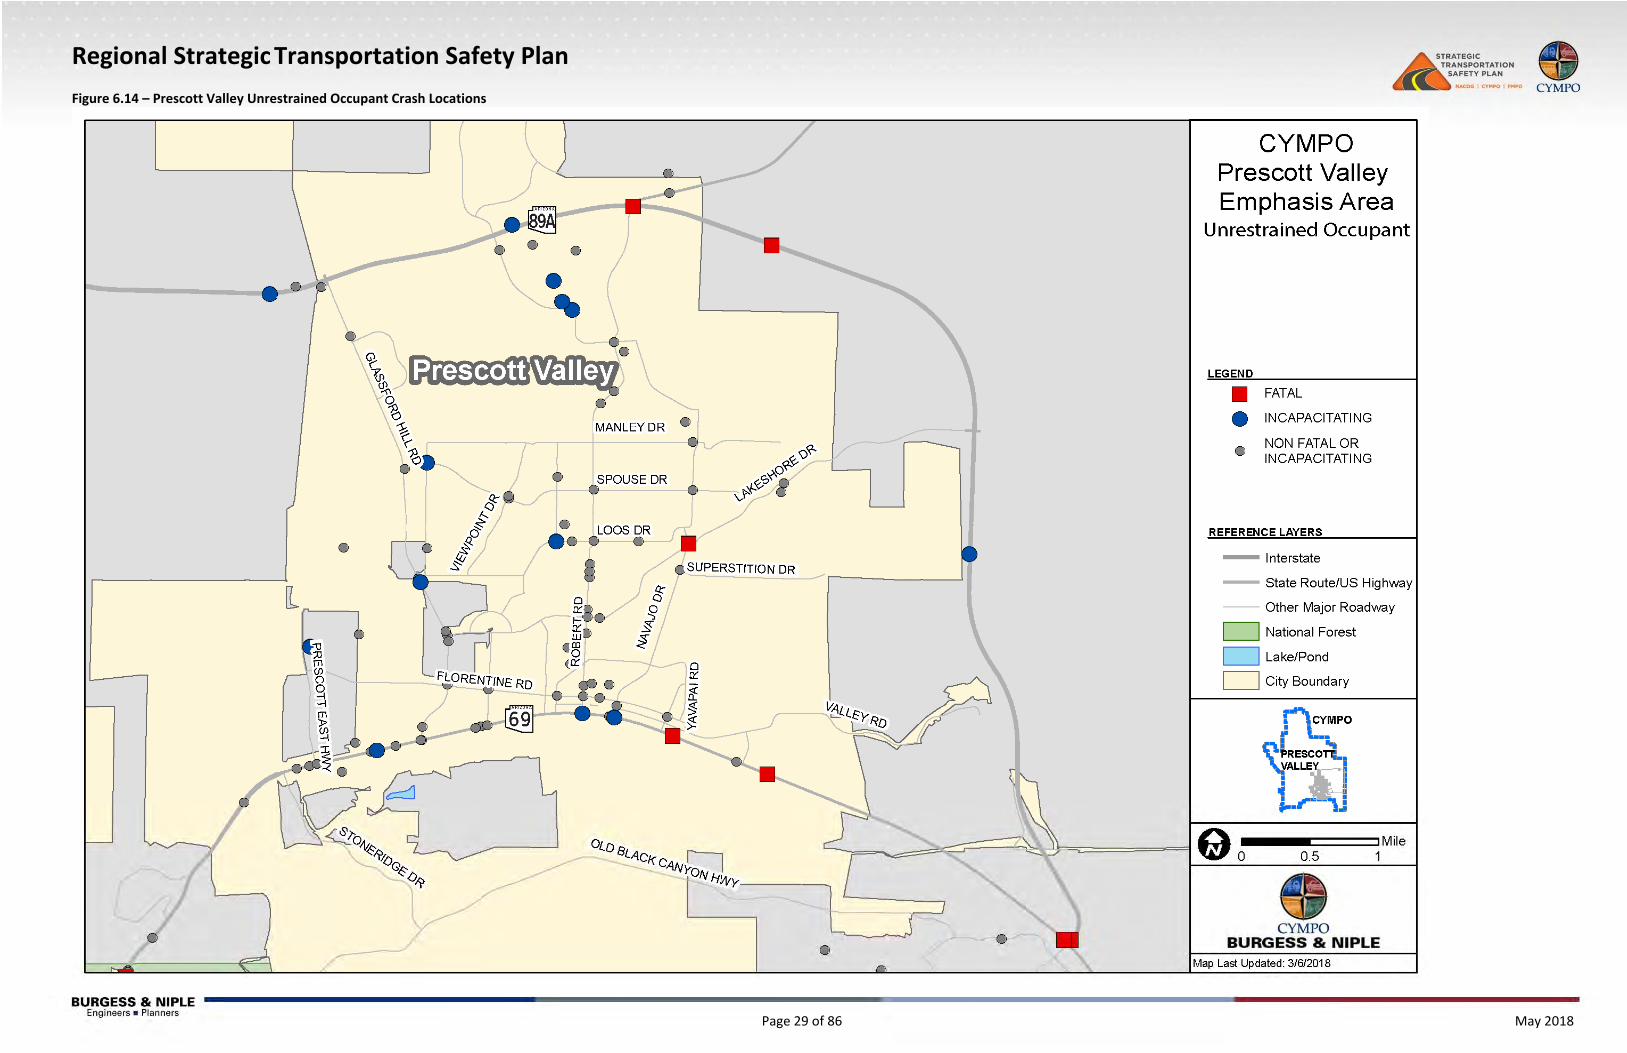
6.3.2 Occupant Protection Of 44 fatal crashes in CYMPO, 21 involved an unrestrained occupant. Of these crashes: 16 were lane/roadway departure crashes; 7 involved an unhelmeted motorcyclist; 9 involved alcohol or drugs; 4 involved a younger driver; and 5 involved an older person.
Figure 6.12 through Figure 6.14 provide a graphical representation of where fatal and other severity unrestrained occupant crashes occurred.
Regional Strategic Transportation Safety Plan
Page 27 of 86 May 2018
Figure 6.12 – Unrestrained Occupant Crash Locations
Regional Strategic Transportation Safety Plan
Page 28 of 86 May 2018
Figure 6.13 – Prescott Unrestrained Occupant Crash Locations
Regional Strategic Transportation Safety Plan
Page 29 of 86 May 2018
Figure 6.14 – Prescott Valley Unrestrained Occupant Crash Locations
Regional Strategic Transportation Safety Plan
Page 30 of 86 May 2018
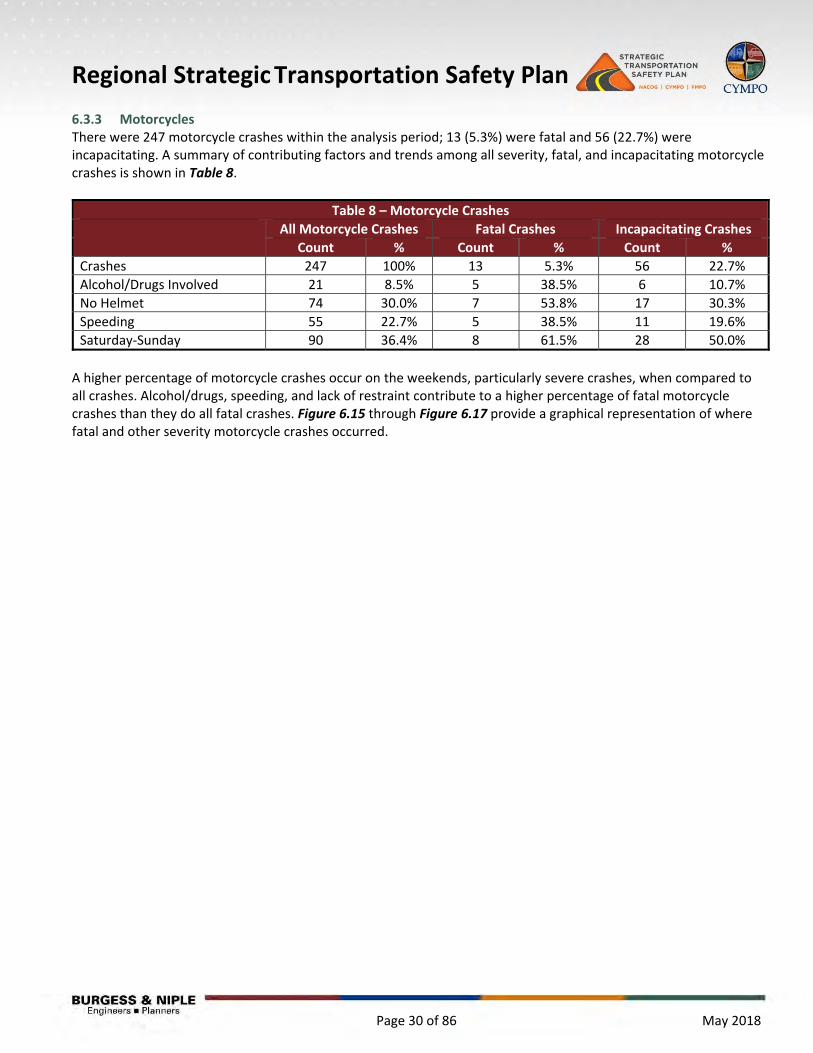
6.3.3 Motorcycles There were 247 motorcycle crashes within the analysis period; 13 (5.3%) were fatal and 56 (22.7%) were incapacitating. A summary of contributing factors and trends among all severity, fatal, and incapacitating motorcycle crashes is shown in Table 8.
Table 8 – Motorcycle Crashes
All Motorcycle Crashes Fatal Crashes Incapacitating Crashes
Count % Count % Count %
Crashes 247 100% 13 5.3% 56 22.7%
Alcohol/Drugs Involved 21 8.5% 5 38.5% 6 10.7%
No Helmet 74 30.0% 7 53.8% 17 30.3%
Speeding 55 22.7% 5 38.5% 11 19.6%
Saturday‐Sunday 90 36.4% 8 61.5% 28 50.0%
A higher percentage of motorcycle crashes occur on the weekends, particularly severe crashes, when compared to all crashes. Alcohol/drugs, speeding, and lack of restraint contribute to a higher percentage of fatal motorcycle crashes than they do all fatal crashes. Figure 6.15 through Figure 6.17 provide a graphical representation of where fatal and other severity motorcycle crashes occurred.

Regional Strategic Transportation Safety Plan
Page 31 of 86 May 2018
Figure 6.15 – Motorcycle Crash Locations
Regional Strategic Transportation Safety Plan
Page 32 of 86 May 2018
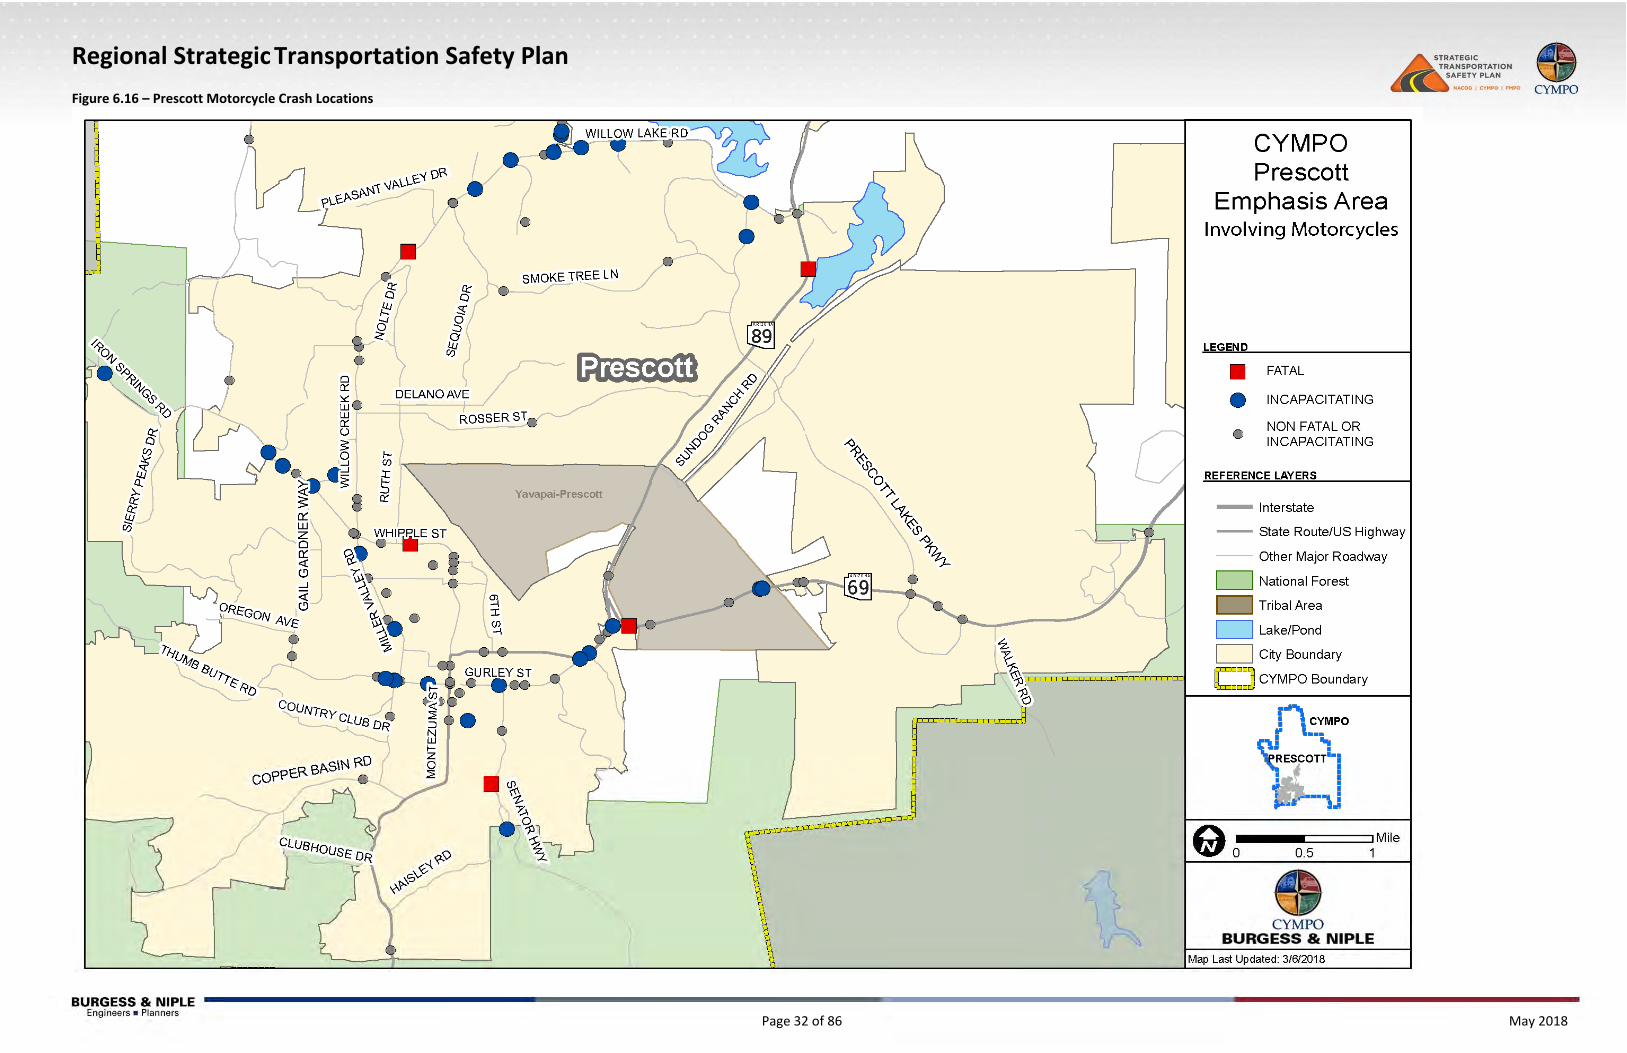
Figure 6.16 – Prescott Motorcycle Crash Locations

Regional Strategic Transportation Safety Plan
Page 33 of 86 May 2018
Figure 6.17 – Prescott Valley Motorcycle Crash Locations
Regional Strategic Transportation Safety Plan
Page 34 of 86 May 2018
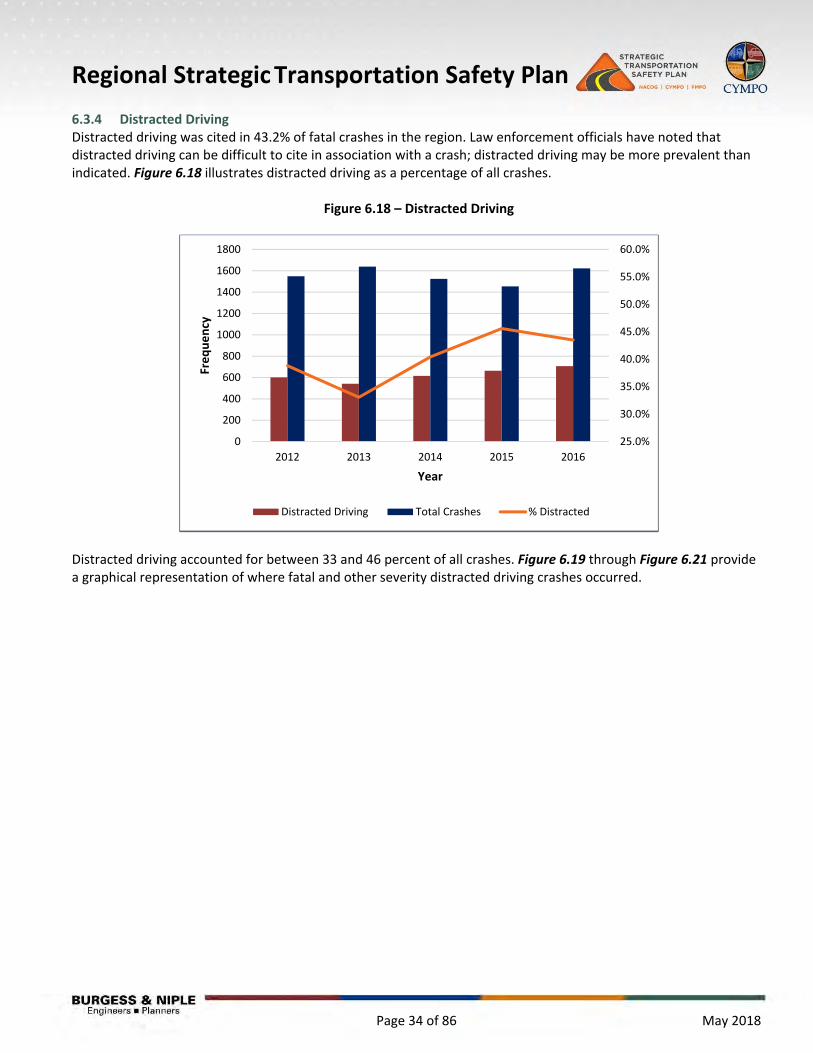
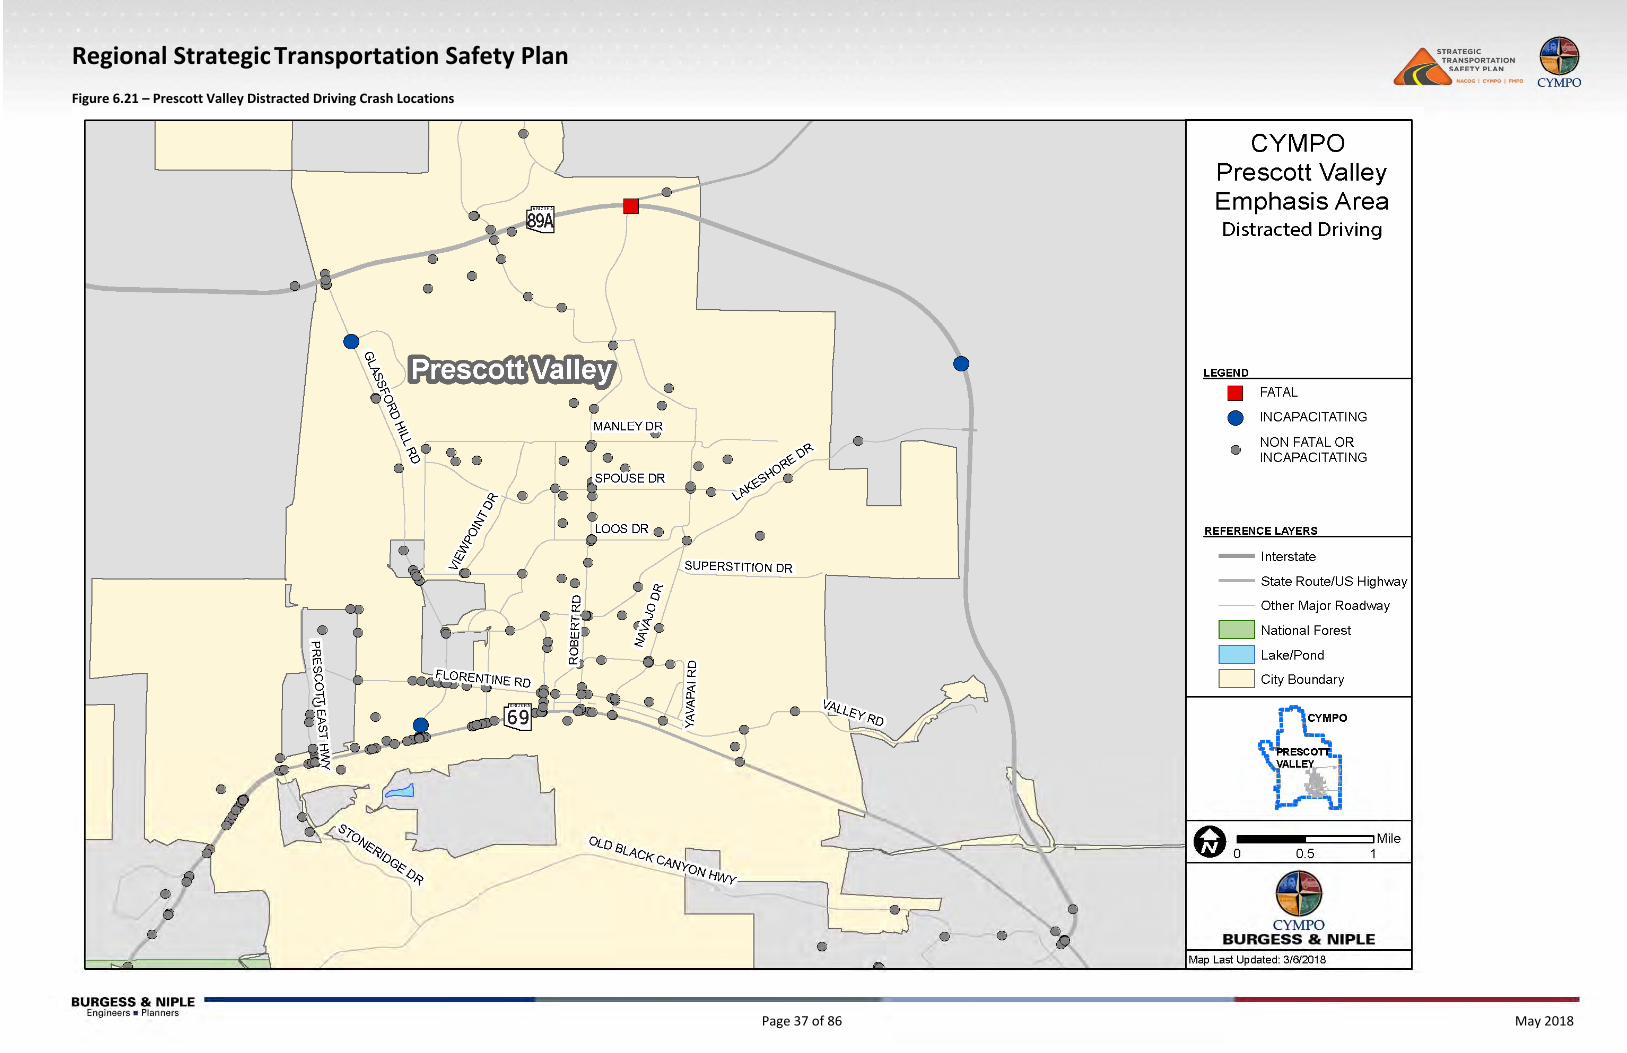
6.3.4 Distracted Driving Distracted driving was cited in 43.2% of fatal crashes in the region. Law enforcement officials have noted that distracted driving can be difficult to cite in association with a crash; distracted driving may be more prevalent than indicated. Figure 6.18 illustrates distracted driving as a percentage of all crashes.
Figure 6.18 – Distracted Driving
Distracted driving accounted for between 33 and 46 percent of all crashes. Figure 6.19 through Figure 6.21 provide a graphical representation of where fatal and other severity distracted driving crashes occurred.
25.0%
30.0%
35.0%
40.0%
45.0%
50.0%
55.0%
60.0%
0
200
400
600
800
1000
1200
1400
1600
1800
2012 2013 2014 2015 2016
Frequency
Year
Distracted Driving Total Crashes % Distracted

Regional Strategic Transportation Safety Plan
Page 35 of 86 May 2018
Figure 6.19 – Distracted Driving Crash Locations
Regional Strategic Transportation Safety Plan
Page 36 of 86 May 2018
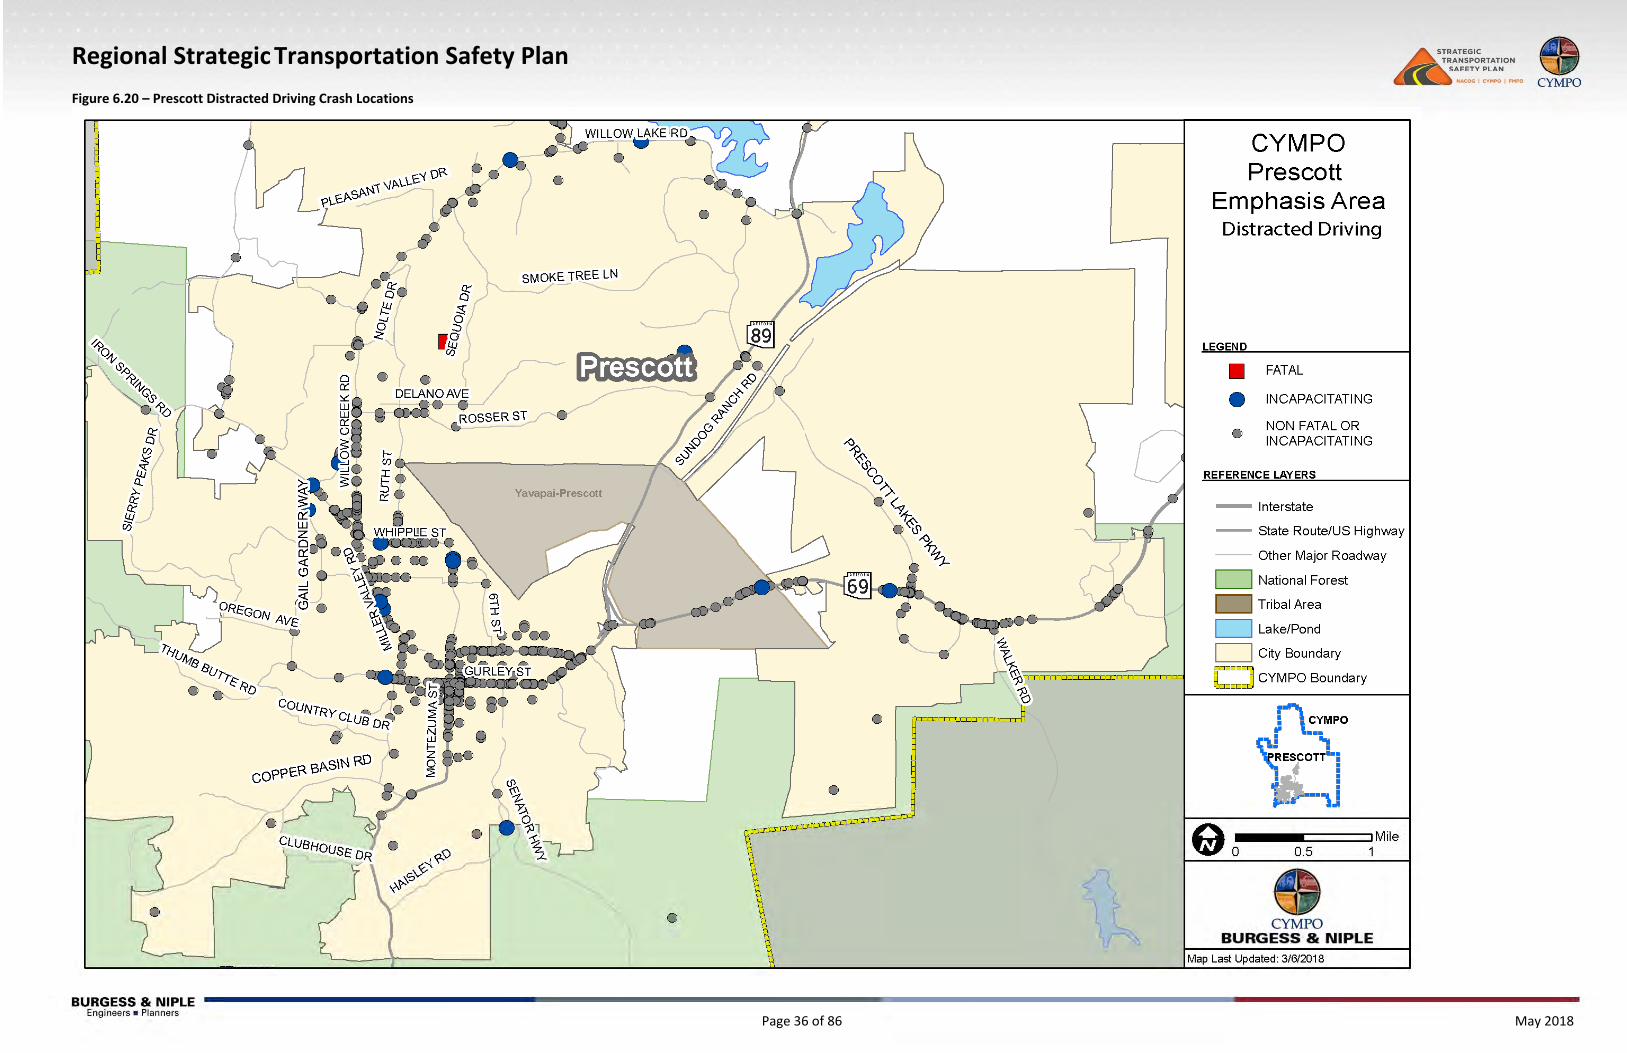
Figure 6.20 – Prescott Distracted Driving Crash Locations
Regional Strategic Transportation Safety Plan
Page 37 of 86 May 2018
Figure 6.21 – Prescott Valley Distracted Driving Crash Locations
Regional Strategic Transportation Safety Plan
Page 38 of 86 May 2018
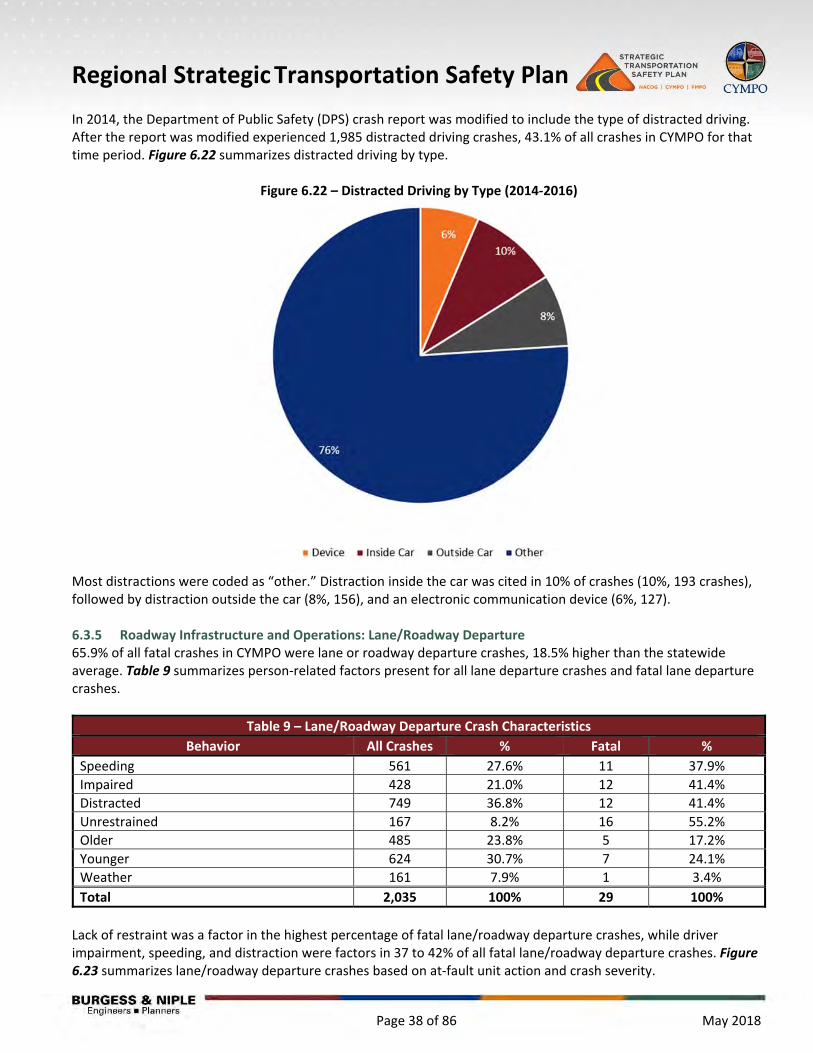
In 2014, the Department of Public Safety (DPS) crash report was modified to include the type of distracted driving. After the report was modified experienced 1,985 distracted driving crashes, 43.1% of all crashes in CYMPO for that time period. Figure 6.22 summarizes distracted driving by type.
Figure 6.22 – Distracted Driving by Type (2014‐2016)
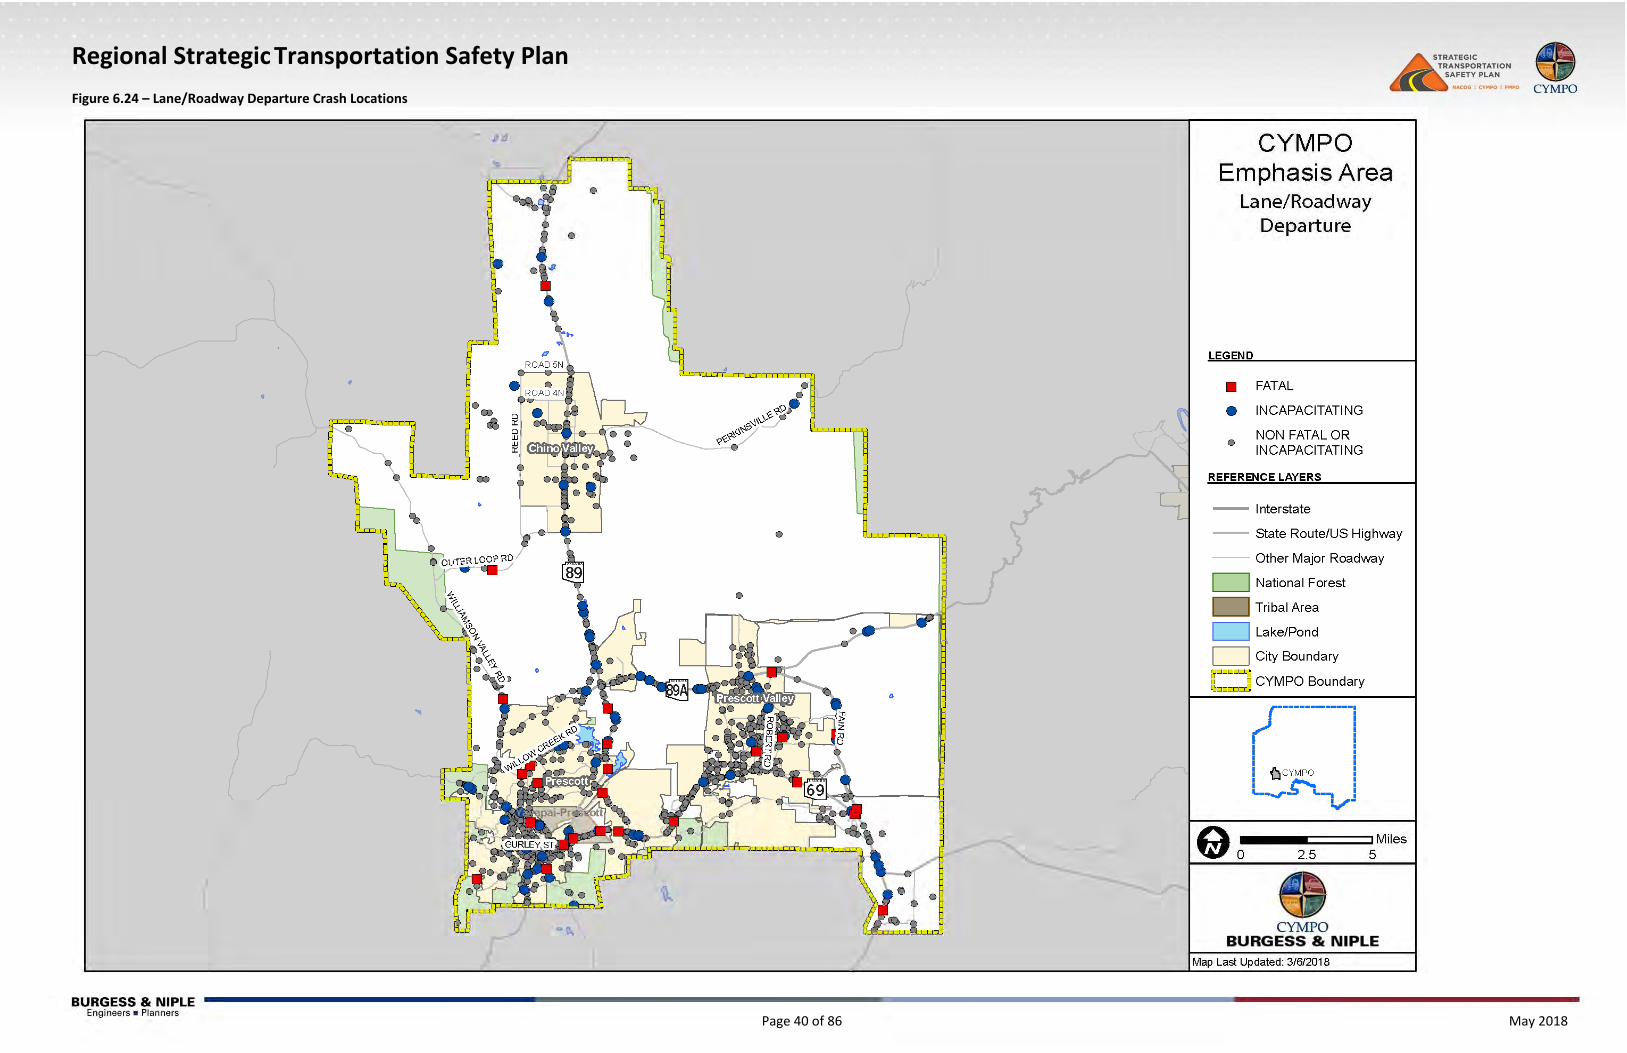
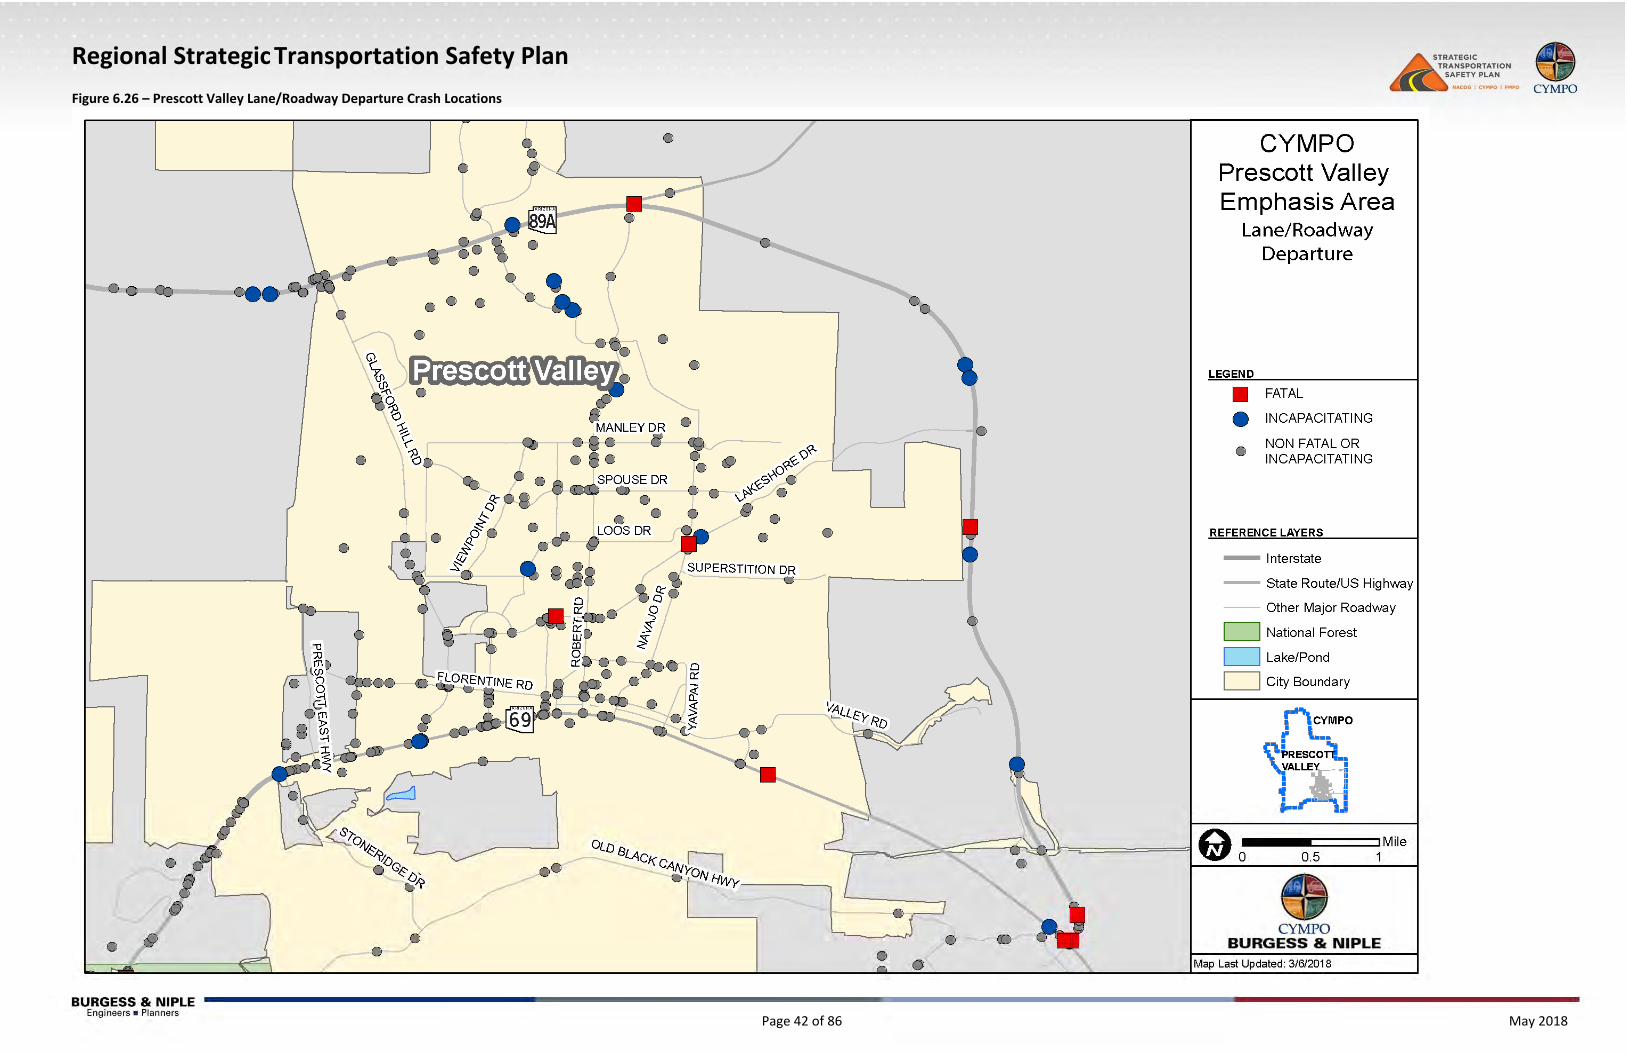
Most distractions were coded as “other.” Distraction inside the car was cited in 10% of crashes (10%, 193 crashes), followed by distraction outside the car (8%, 156), and an electronic communication device (6%, 127). 6.3.5 Roadway Infrastructure and Operations: Lane/Roadway Departure 65.9% of all fatal crashes in CYMPO were lane or roadway departure crashes, 18.5% higher than the statewide average. Table 9 summarizes person‐related factors present for all lane departure crashes and fatal lane departure crashes.
Table 9 – Lane/Roadway Departure Crash Characteristics
Behavior All Crashes % Fatal %
Speeding 561 27.6% 11 37.9%
Impaired 428 21.0% 12 41.4%
Distracted 749 36.8% 12 41.4%
Unrestrained 167 8.2% 16 55.2%
Older 485 23.8% 5 17.2%
Younger 624 30.7% 7 24.1%
Weather 161 7.9% 1 3.4%
Total 2,035 100% 29 100%
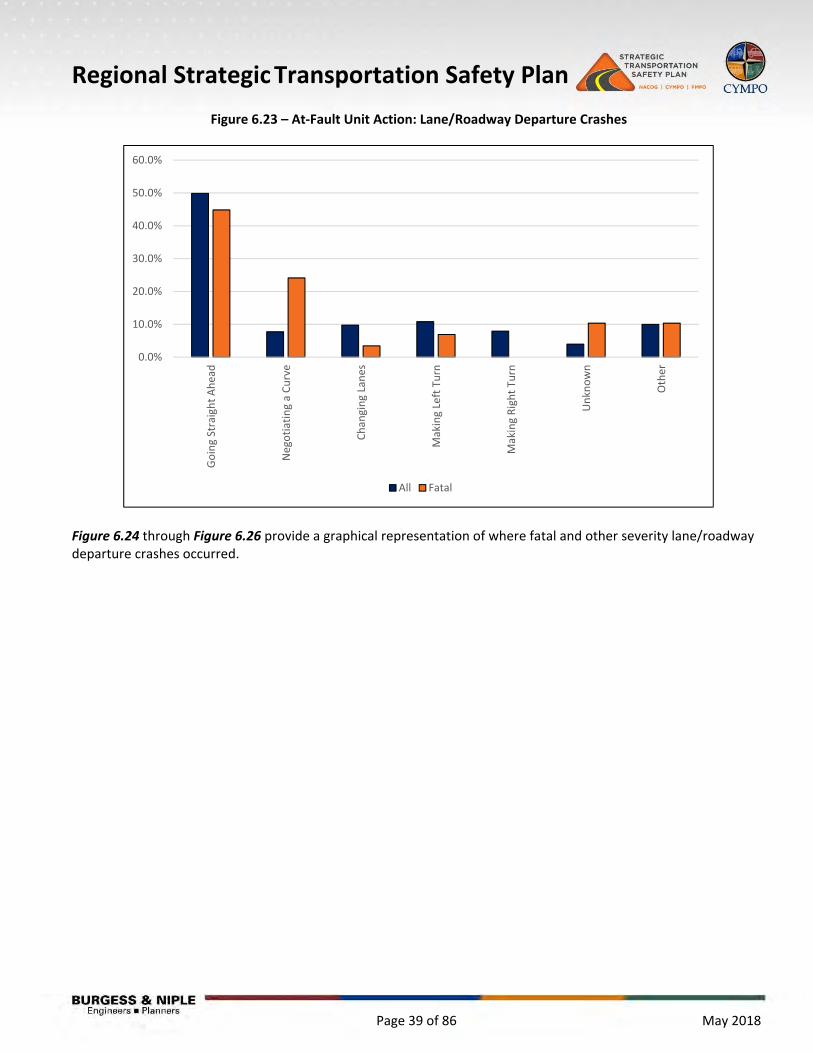
Lack of restraint was a factor in the highest percentage of fatal lane/roadway departure crashes, while driver impairment, speeding, and distraction were factors in 37 to 42% of all fatal lane/roadway departure crashes. Figure 6.23 summarizes lane/roadway departure crashes based on at‐fault unit action and crash severity.
Regional Strategic Transportation Safety Plan
Page 39 of 86 May 2018
Figure 6.23 – At‐Fault Unit Action: Lane/Roadway Departure Crashes
Figure 6.24 through Figure 6.26 provide a graphical representation of where fatal and other severity lane/roadway departure crashes occurred.
0.0%
10.0%
20.0%
30.0%
40.0%
50.0%
60.0%
Going Straight Ahead
Negotiating a Curve
Changing Lanes
Making Left Turn
Making Right Turn
Unknown
Other
All Fatal
Regional Strategic Transportation Safety Plan
Page 40 of 86 May 2018
Figure 6.24 – Lane/Roadway Departure Crash Locations

Regional Strategic Transportation Safety Plan
Page 41 of 86 May 2018
Figure 6.25 – Prescott Lane/Roadway Departure Crash Locations
Regional Strategic Transportation Safety Plan
Page 42 of 86 May 2018
Figure 6.26 – Prescott Valley Lane/Roadway Departure Crash Locations
Regional Strategic Transportation Safety Plan
Page 43 of 86 May 2018
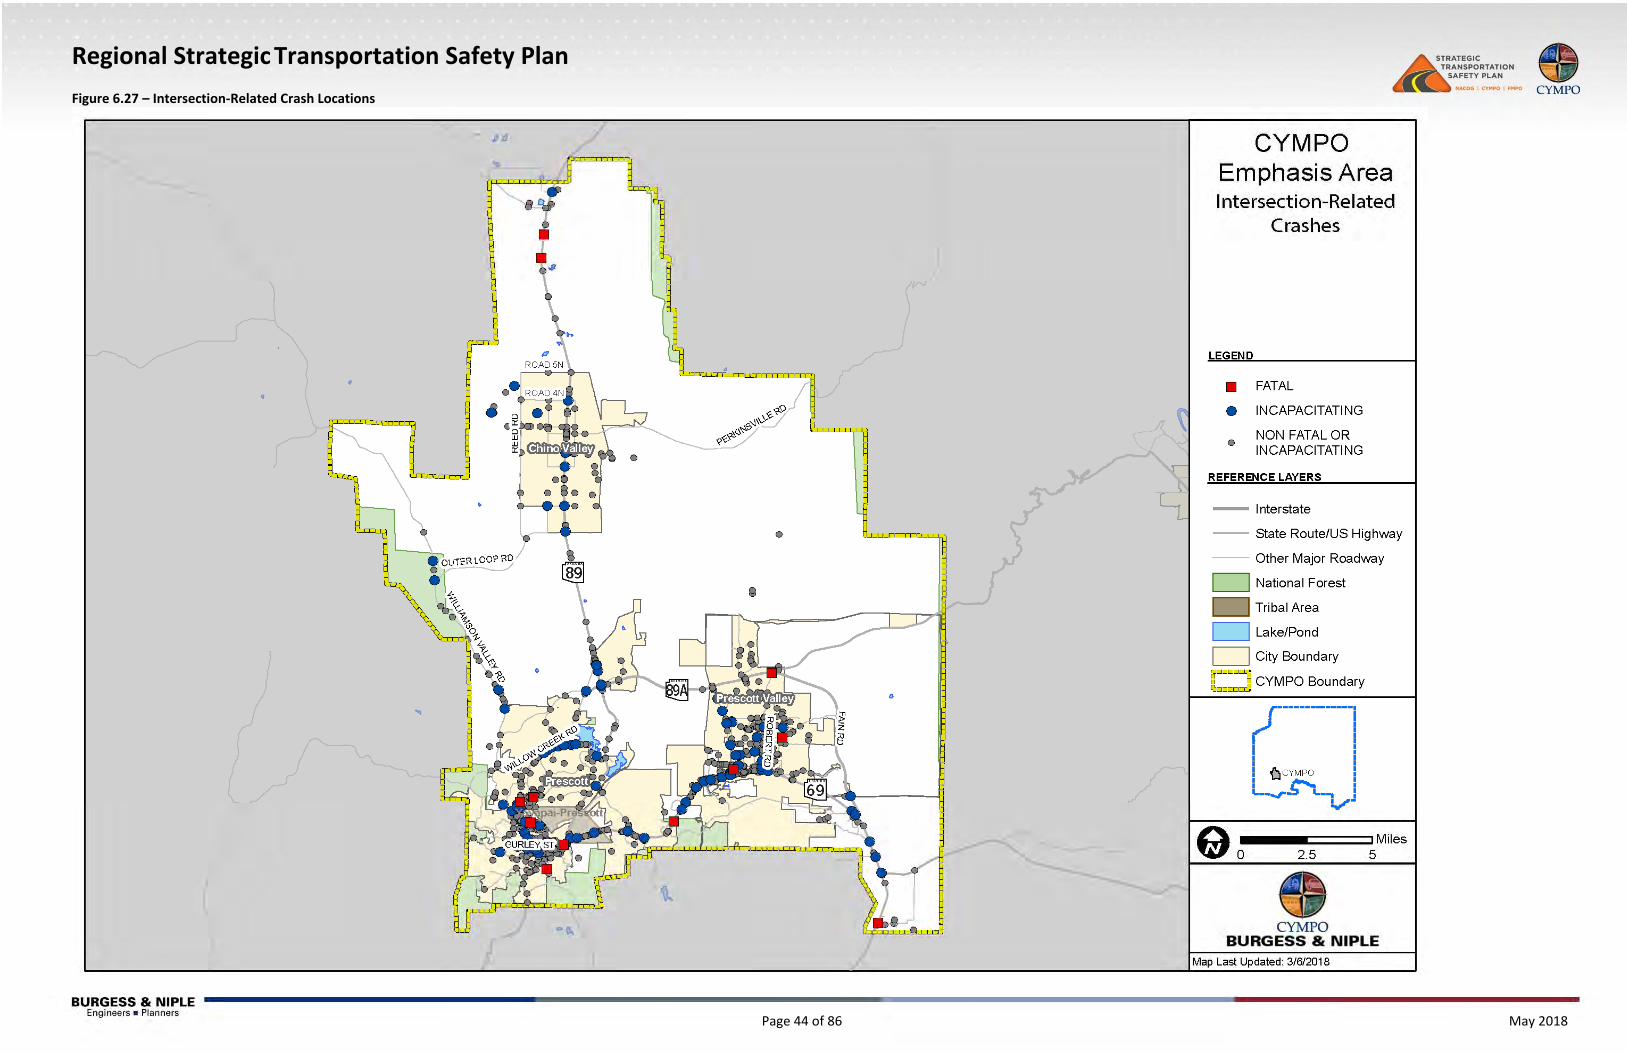
6.3.6 Roadway Infrastructure and Operations: Intersections/Railroad Crossings There were 15 fatal intersection‐related crashes during the analysis period. Intersection crash locations are shown in Figure 6.27 through Figure 6.29. Most fatal intersection‐related crashes (60%) occurred between 3pm and 5pm. 46.7% were single vehicle crashes; the most prevalent fatal crash types were pedestrians (20% of intersection crashes) and overturning/rollover (20% of intersection crashes). Some contributing factors include distracted driving (46.7%) and impaired driving (33.3%). All fatal intersection crashes occurred at 4‐way or T‐intersections. The majority occurred on roadways functionally classified as arterial or collector roadways; 3 fatal intersection crashes occurred on freeways or interstates. Within the region, State Route (SR) 89A and a portion of SR 69 are the only roadways federally classified as interstate or freeway. See Section 0 for more information.
Regional Strategic Transportation Safety Plan
Page 44 of 86 May 2018
Figure 6.27 – Intersection‐Related Crash Locations

Regional Strategic Transportation Safety Plan
Page 45 of 86 May 2018
Figure 6.28 – Prescott Intersection‐Related Crash Locations

Regional Strategic Transportation Safety Plan
Page 46 of 86 May 2018
Figure 6.29 – Prescott Valley Intersection‐Related Crash Locations
Regional Strategic Transportation Safety Plan
Page 47 of 86 May 2018
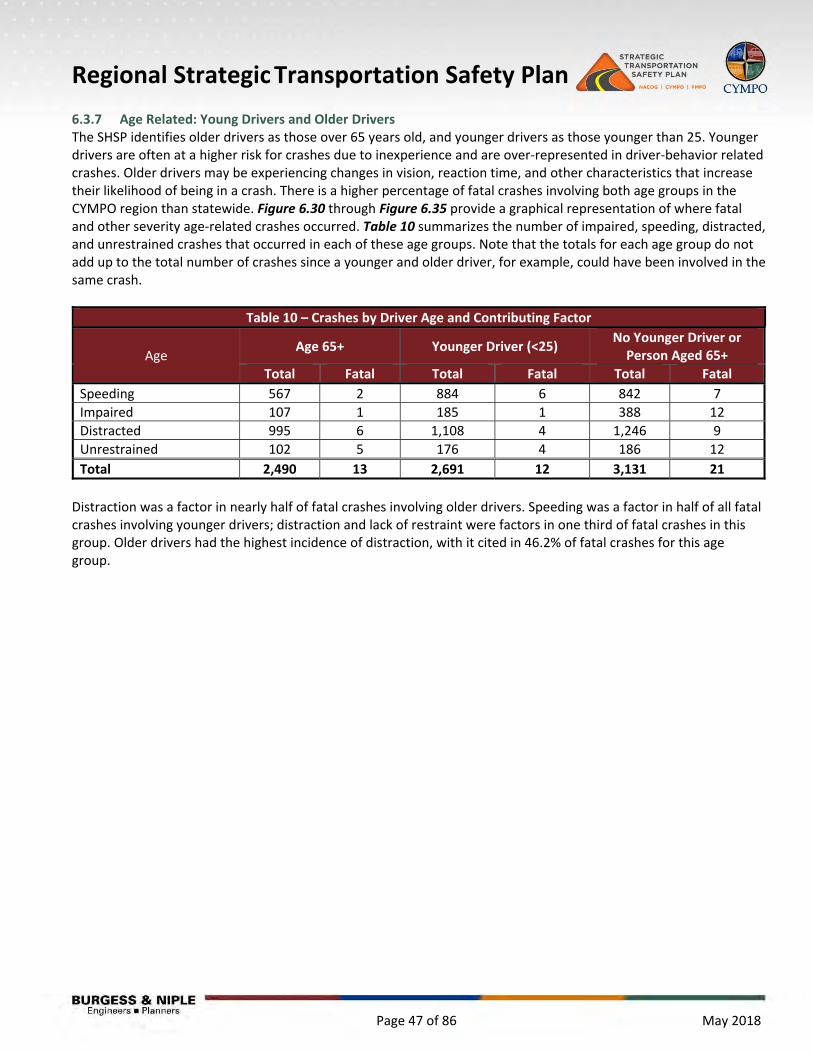
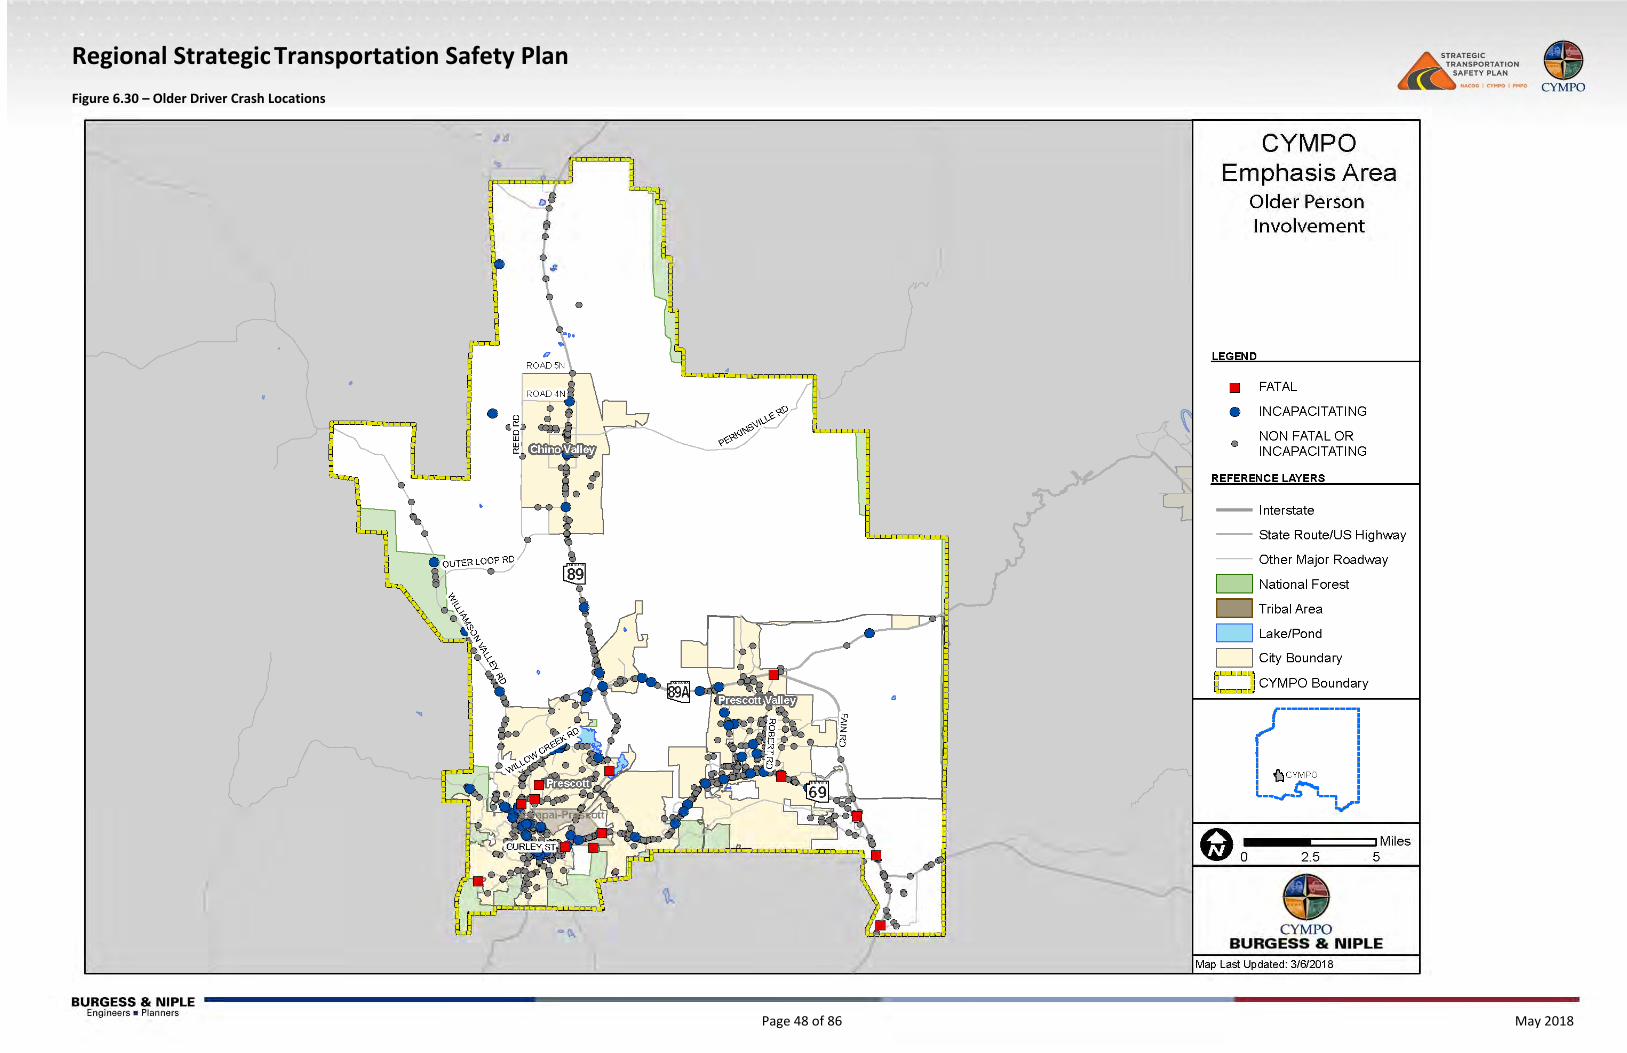
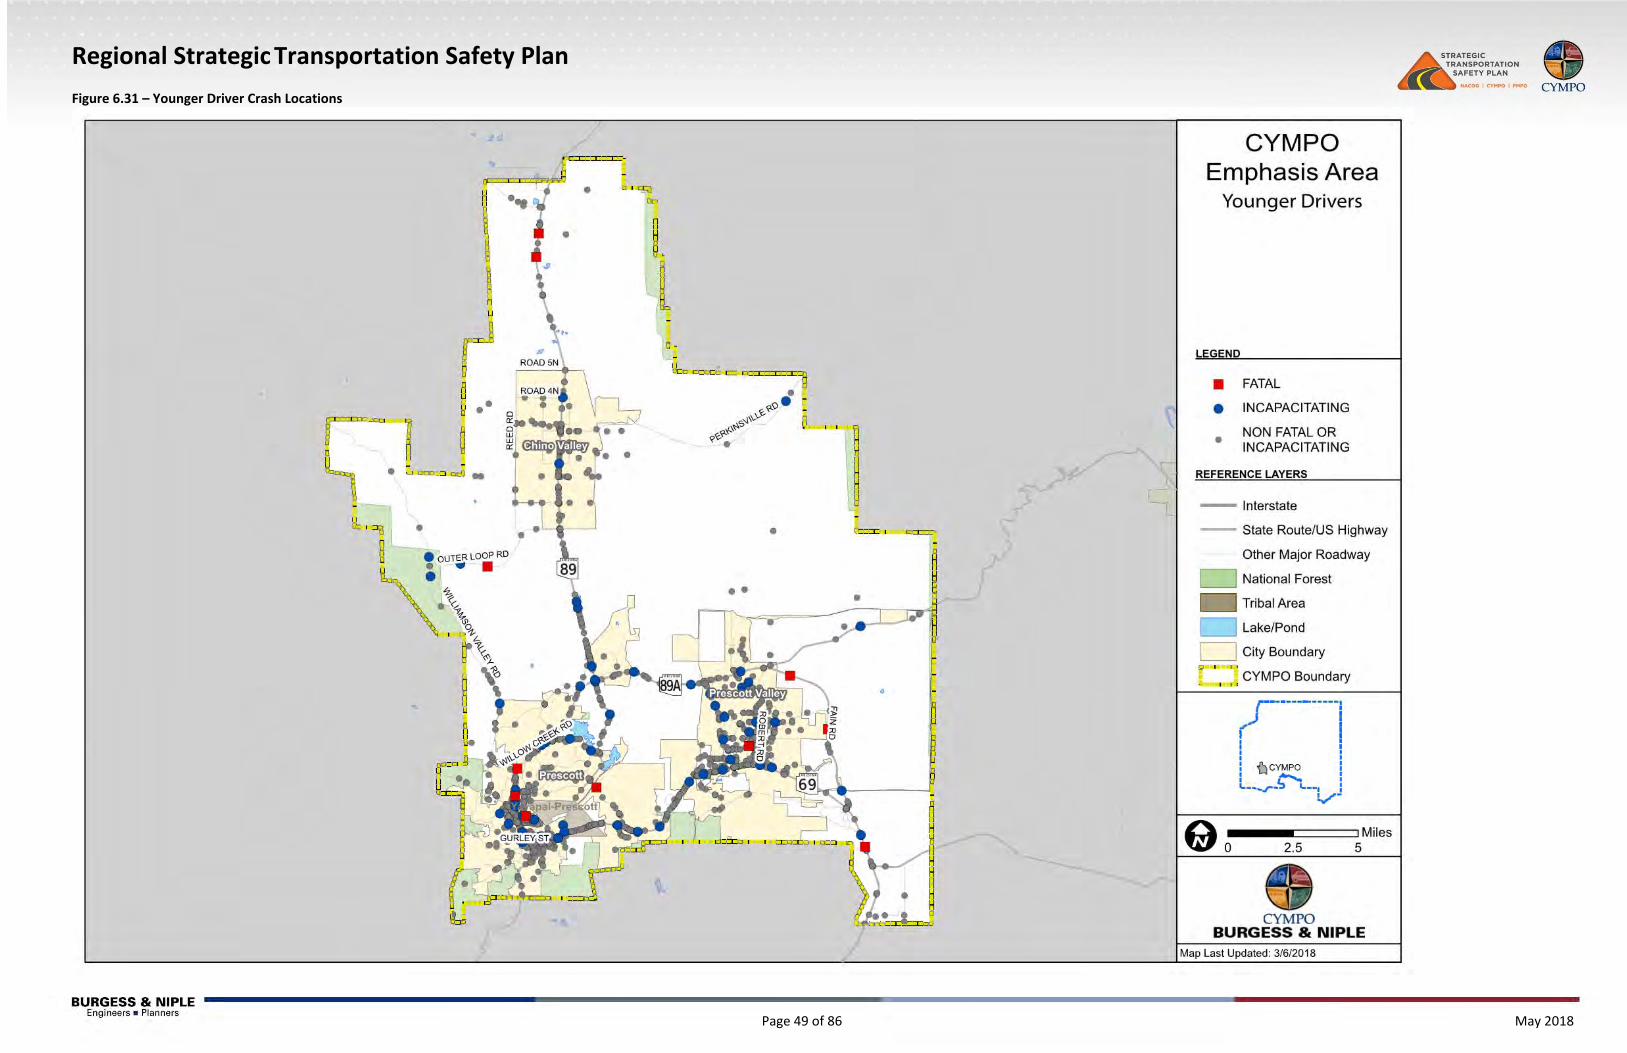
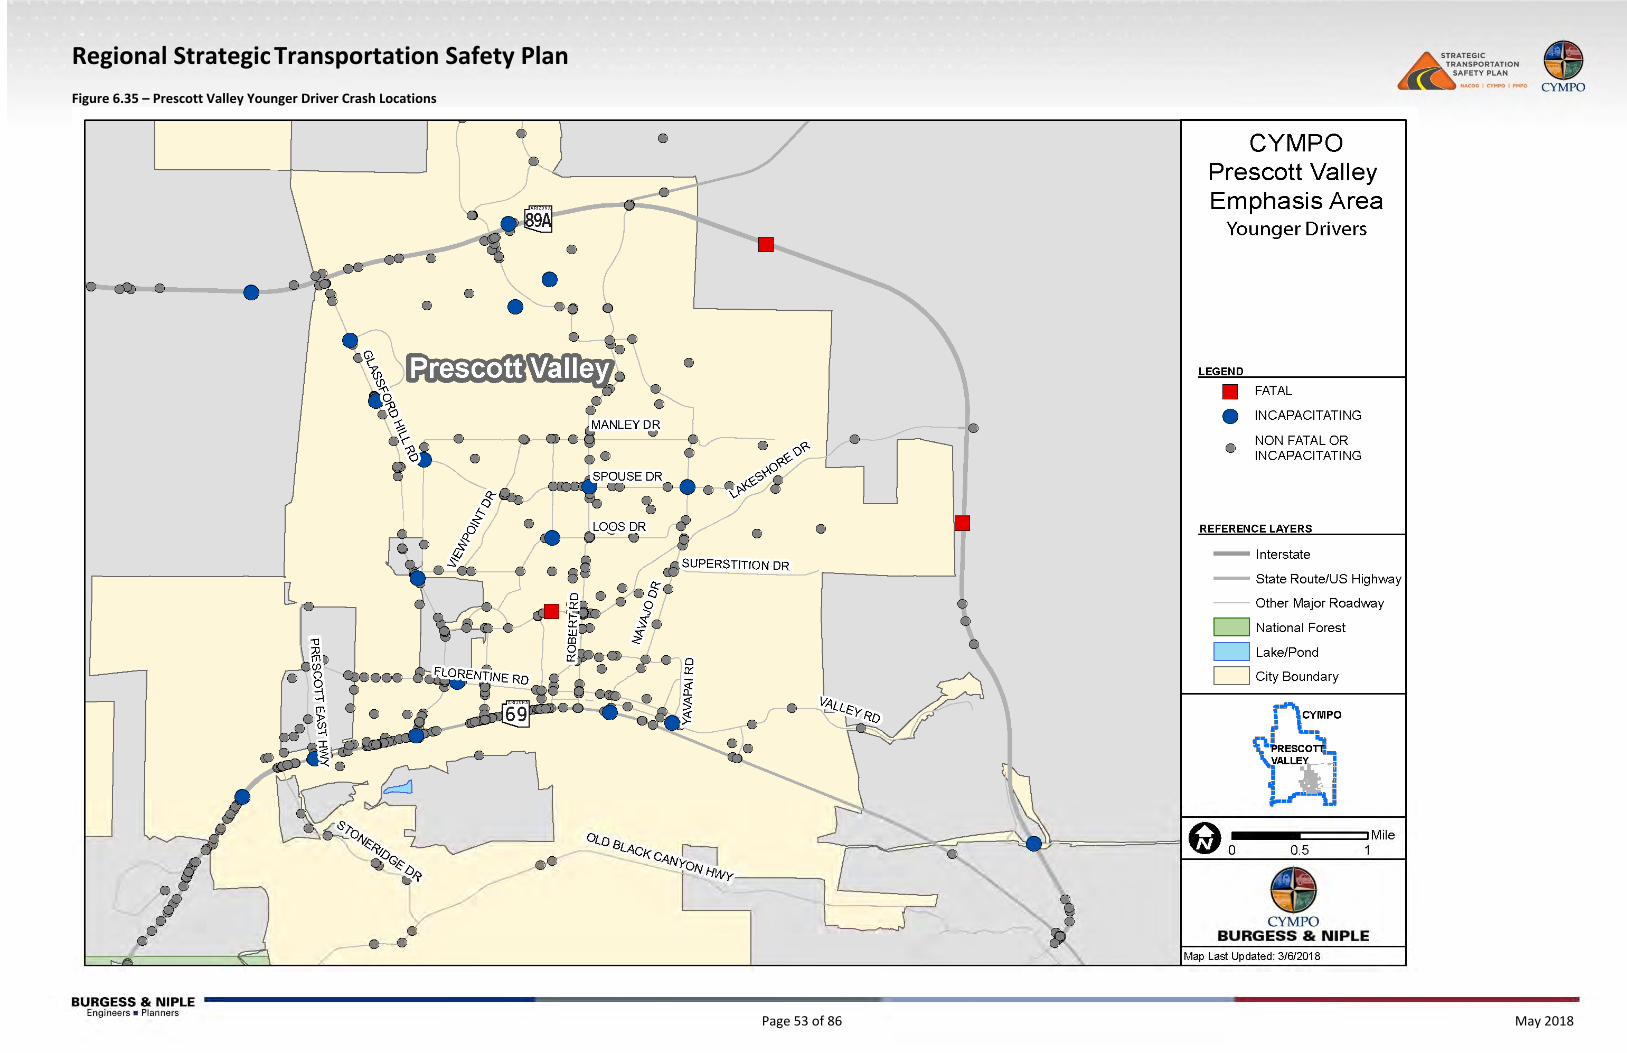
6.3.7 Age Related: Young Drivers and Older Drivers The SHSP identifies older drivers as those over 65 years old, and younger drivers as those younger than 25. Younger drivers are often at a higher risk for crashes due to inexperience and are over‐represented in driver‐behavior related crashes. Older drivers may be experiencing changes in vision, reaction time, and other characteristics that increase their likelihood of being in a crash. There is a higher percentage of fatal crashes involving both age groups in the CYMPO region than statewide. Figure 6.30 through Figure 6.35 provide a graphical representation of where fatal and other severity age‐related crashes occurred. Table 10 summarizes the number of impaired, speeding, distracted, and unrestrained crashes that occurred in each of these age groups. Note that the totals for each age group do not add up to the total number of crashes since a younger and older driver, for example, could have been involved in the same crash.
Table 10 – Crashes by Driver Age and Contributing Factor
Age Age 65+ Younger Driver (<25)
No Younger Driver or Person Aged 65+
Total Fatal Total Fatal Total Fatal
Speeding 567 2 884 6 842 7
Impaired 107 1 185 1 388 12
Distracted 995 6 1,108 4 1,246 9
Unrestrained 102 5 176 4 186 12
Total 2,490 13 2,691 12 3,131 21
Distraction was a factor in nearly half of fatal crashes involving older drivers. Speeding was a factor in half of all fatal crashes involving younger drivers; distraction and lack of restraint were factors in one third of fatal crashes in this group. Older drivers had the highest incidence of distraction, with it cited in 46.2% of fatal crashes for this age group.
Regional Strategic Transportation Safety Plan
Page 48 of 86 May 2018
Figure 6.30 – Older Driver Crash Locations
Regional Strategic Transportation Safety Plan
Page 49 of 86 May 2018
Figure 6.31 – Younger Driver Crash Locations

Regional Strategic Transportation Safety Plan
Page 50 of 86 May 2018
Figure 6.32 – Prescott Older Driver Crash Locations

Regional Strategic Transportation Safety Plan
Page 51 of 86 May 2018
Figure 6.33 – Prescott Younger Driver Crash Locations

Regional Strategic Transportation Safety Plan
Page 52 of 86 May 2018
Figure 6.34 – Prescott Valley Older Driver Crash Locations
Regional Strategic Transportation Safety Plan
Page 53 of 86 May 2018
Figure 6.35 – Prescott Valley Younger Driver Crash Locations

Regional Strategic Transportation Safety Plan
Page 54 of 86 May 2018
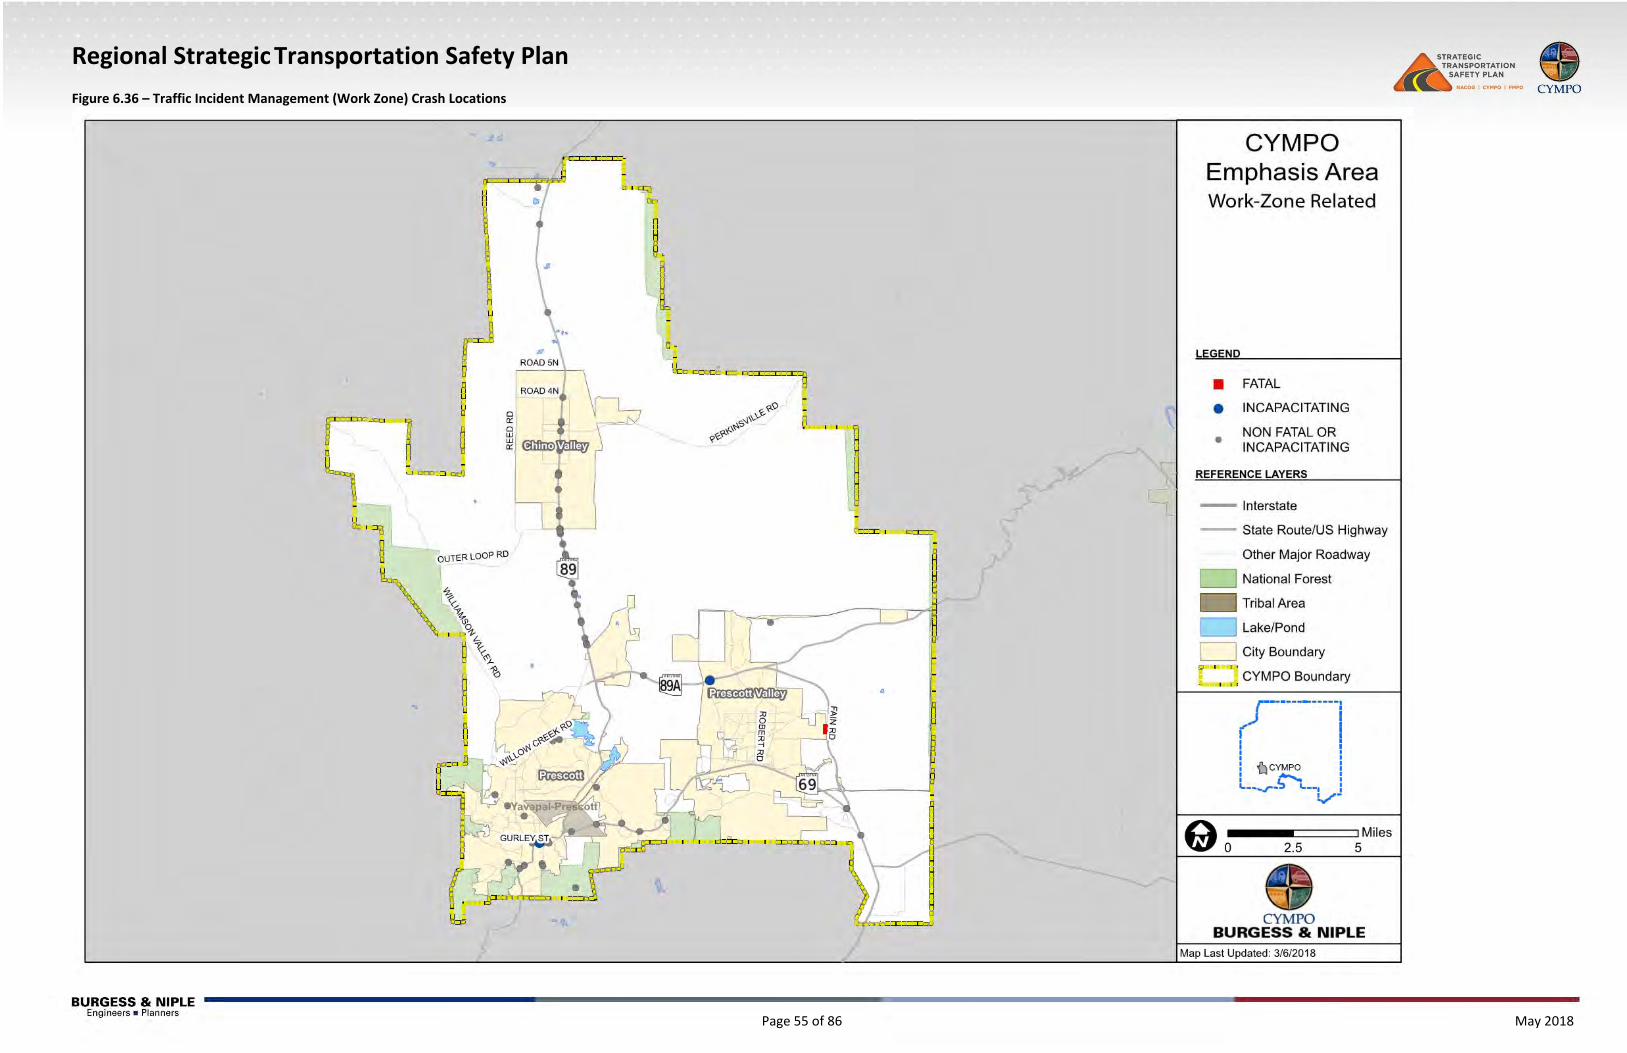
6.3.8 Traffic Incident Management (Work Zone) There were 75 work zone‐related crashes, including one fatal crash during the analysis period. Figure 6.36 through Figure 6.38 provide a graphical representation of where fatal and other severity age‐related crashes occurred.
Regional Strategic Transportation Safety Plan
Page 55 of 86 May 2018
Figure 6.36 – Traffic Incident Management (Work Zone) Crash Locations

Regional Strategic Transportation Safety Plan
Page 56 of 86 May 2018
Figure 6.37 – Prescott Traffic Incident Management (Work Zone) Crash Locations

Regional Strategic Transportation Safety Plan
Page 57 of 86 May 2018
Figure 6.38 – Prescott Valley Traffic Incident Management (Work Zone) Crash Locations
Regional Strategic Transportation Safety Plan
Page 58 of 86 May 2018
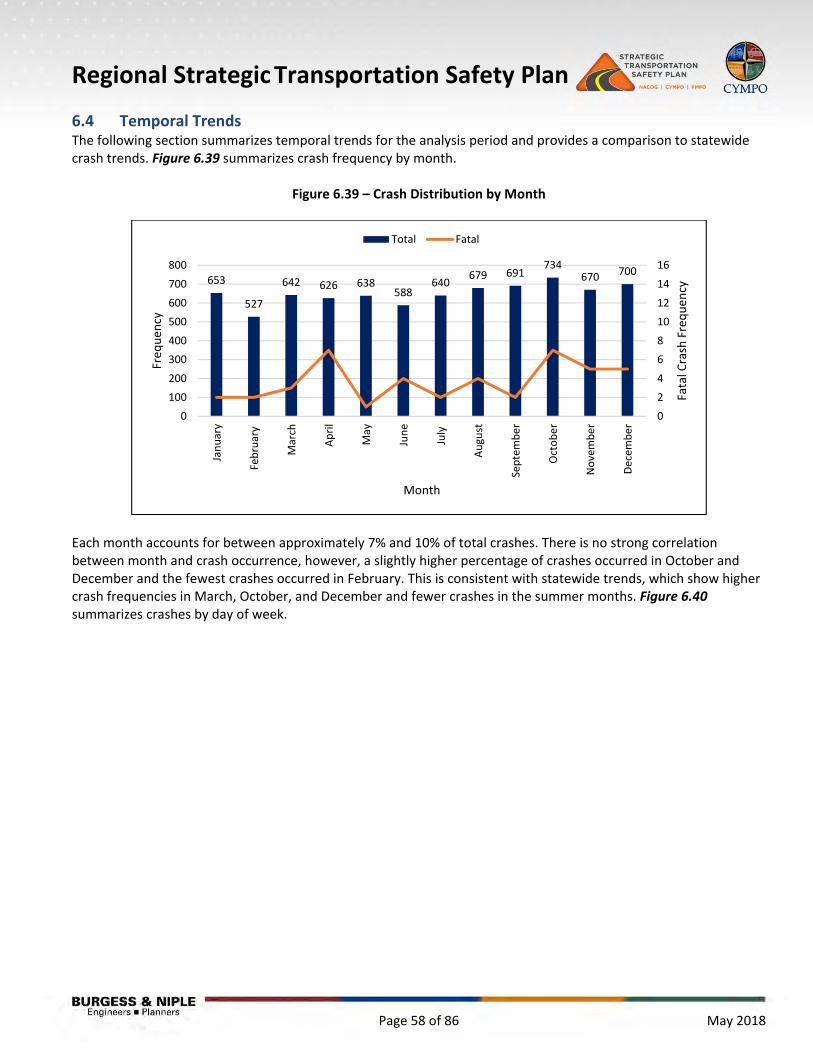
6.4 Temporal Trends The following section summarizes temporal trends for the analysis period and provides a comparison to statewide crash trends. Figure 6.39 summarizes crash frequency by month.
Figure 6.39 – Crash Distribution by Month
Each month accounts for between approximately 7% and 10% of total crashes. There is no strong correlation between month and crash occurrence, however, a slightly higher percentage of crashes occurred in October and December and the fewest crashes occurred in February. This is consistent with statewide trends, which show higher crash frequencies in March, October, and December and fewer crashes in the summer months. Figure 6.40 summarizes crashes by day of week.
653
527
642 626 638588
640679 691
734670 700
0
2
4
6
8
10
12
14
16
0
100
200
300
400
500
600
700
800
January
February
March
April
May
June
July
August
September
October
November
Decem
ber
Fatal Crash Frequen
cy
Freq
uen
cy
Month
Total Fatal

Regional Strategic Transportation Safety Plan
Page 59 of 86 May 2018
Figure 6.40 – Crash Summary by Day of Week
A relatively low number of crashes occurred on Sunday, but the most fatal crashes occurred on Sunday. The percentage of crashes that are fatal is double compared to any other day of the week. Figure 6.41 summarizes crashes by hour of day.
Figure 6.41 – Crash Summary by Hour of Day
There are local peaks in crash frequency between 6 and 8 am, at noon, and between 2 and 4 pm, corresponding with commute hours as well as statewide trends. The highest number of fatal crashes occurred at 4 pm (6 crashes).
629
1176 1229 1227 12501398
879
0
2
4
6
8
10
12
14
16
18
0
200
400
600
800
1000
1200
1400
1600
Monday
Tuesday
Wed
nesday
Thursday
Friday
Saturday
Sunday
Fatal Crash Frequen
cy
Freq
uen
cy
Day of Week
Total Fatal
72
59
57
34 39 60
154
443
398
338 404
542 606
592 645
748
683
576
393
299
229
210
126
81
0
1
2
3
4
5
6
7
8
9
10
0
100
200
300
400
500
600
700
800
0 1 2 3 4 5 6 7 8 9 10 11 12 13 14 15 16 17 18 19 20 21 22 23
Fatal Crash Frequen
cy
Freq
uen
cy
Hour of Day
Total Fatal
Regional Strategic Transportation Safety Plan
Page 60 of 86 May 2018
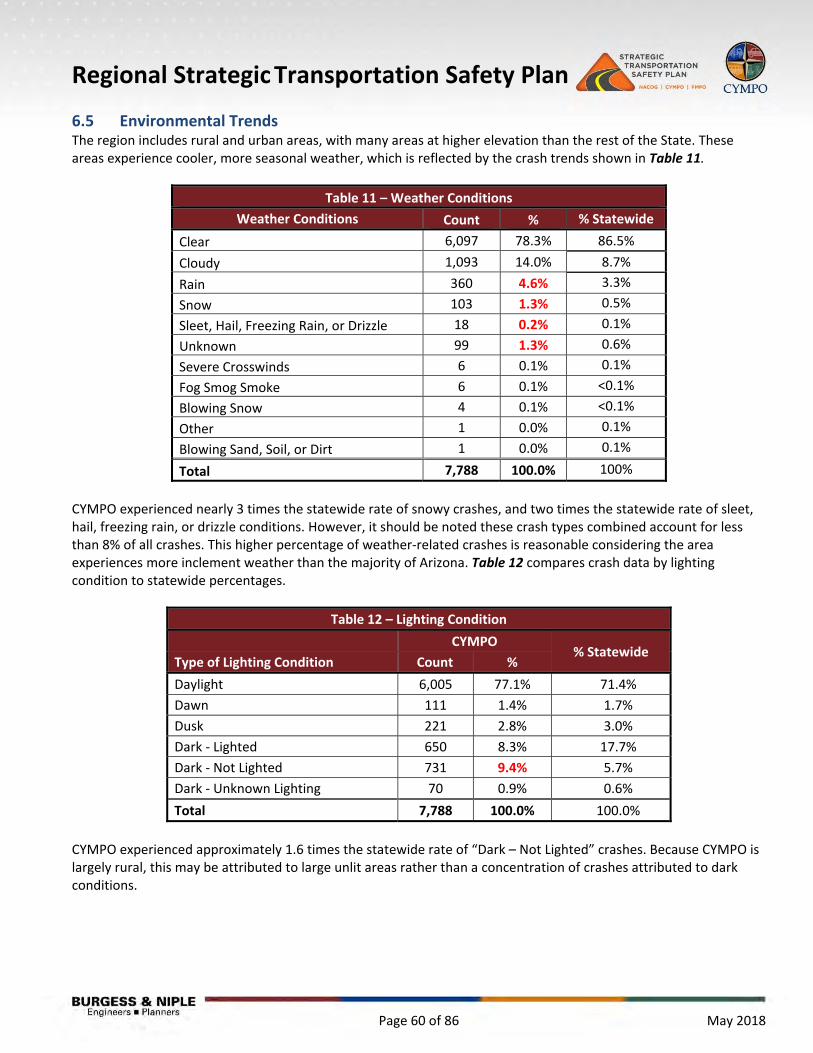
6.5 Environmental Trends The region includes rural and urban areas, with many areas at higher elevation than the rest of the State. These areas experience cooler, more seasonal weather, which is reflected by the crash trends shown in Table 11.
Table 11 – Weather Conditions
Weather Conditions Count % % Statewide
Clear 6,097 78.3% 86.5%
Cloudy 1,093 14.0% 8.7%
Rain 360 4.6% 3.3%
Snow 103 1.3% 0.5%
Sleet, Hail, Freezing Rain, or Drizzle 18 0.2% 0.1%
Unknown 99 1.3% 0.6%
Severe Crosswinds 6 0.1% 0.1%
Fog Smog Smoke 6 0.1% <0.1%
Blowing Snow 4 0.1% <0.1%
Other 1 0.0% 0.1%
Blowing Sand, Soil, or Dirt 1 0.0% 0.1%
Total 7,788 100.0% 100%
CYMPO experienced nearly 3 times the statewide rate of snowy crashes, and two times the statewide rate of sleet, hail, freezing rain, or drizzle conditions. However, it should be noted these crash types combined account for less than 8% of all crashes. This higher percentage of weather‐related crashes is reasonable considering the area experiences more inclement weather than the majority of Arizona. Table 12 compares crash data by lighting condition to statewide percentages.
Table 12 – Lighting Condition
CYMPO % Statewide
Type of Lighting Condition Count %
Daylight 6,005 77.1% 71.4%
Dawn 111 1.4% 1.7%
Dusk 221 2.8% 3.0%
Dark ‐ Lighted 650 8.3% 17.7%
Dark ‐ Not Lighted 731 9.4% 5.7%
Dark ‐ Unknown Lighting 70 0.9% 0.6%
Total 7,788 100.0% 100.0%
CYMPO experienced approximately 1.6 times the statewide rate of “Dark – Not Lighted” crashes. Because CYMPO is largely rural, this may be attributed to large unlit areas rather than a concentration of crashes attributed to dark conditions.
Regional Strategic Transportation Safety Plan
Page 61 of 86 May 2018
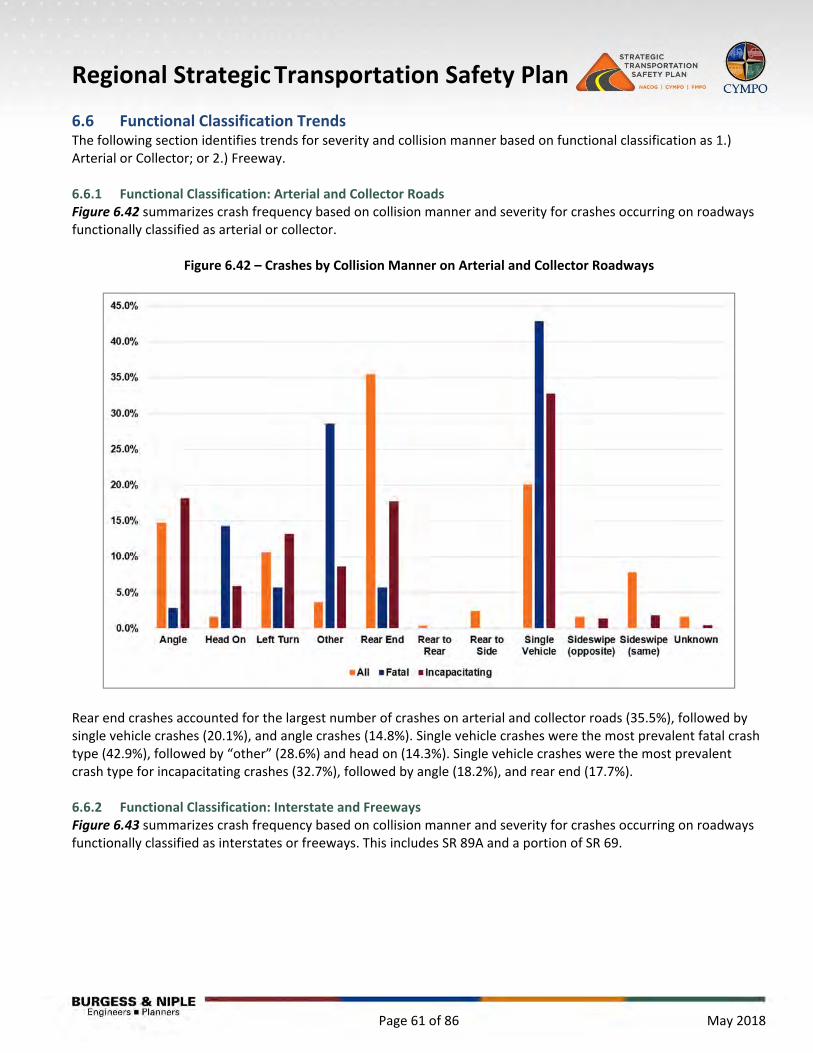
6.6 Functional Classification Trends The following section identifies trends for severity and collision manner based on functional classification as 1.) Arterial or Collector; or 2.) Freeway. 6.6.1 Functional Classification: Arterial and Collector Roads Figure 6.42 summarizes crash frequency based on collision manner and severity for crashes occurring on roadways functionally classified as arterial or collector.
Figure 6.42 – Crashes by Collision Manner on Arterial and Collector Roadways
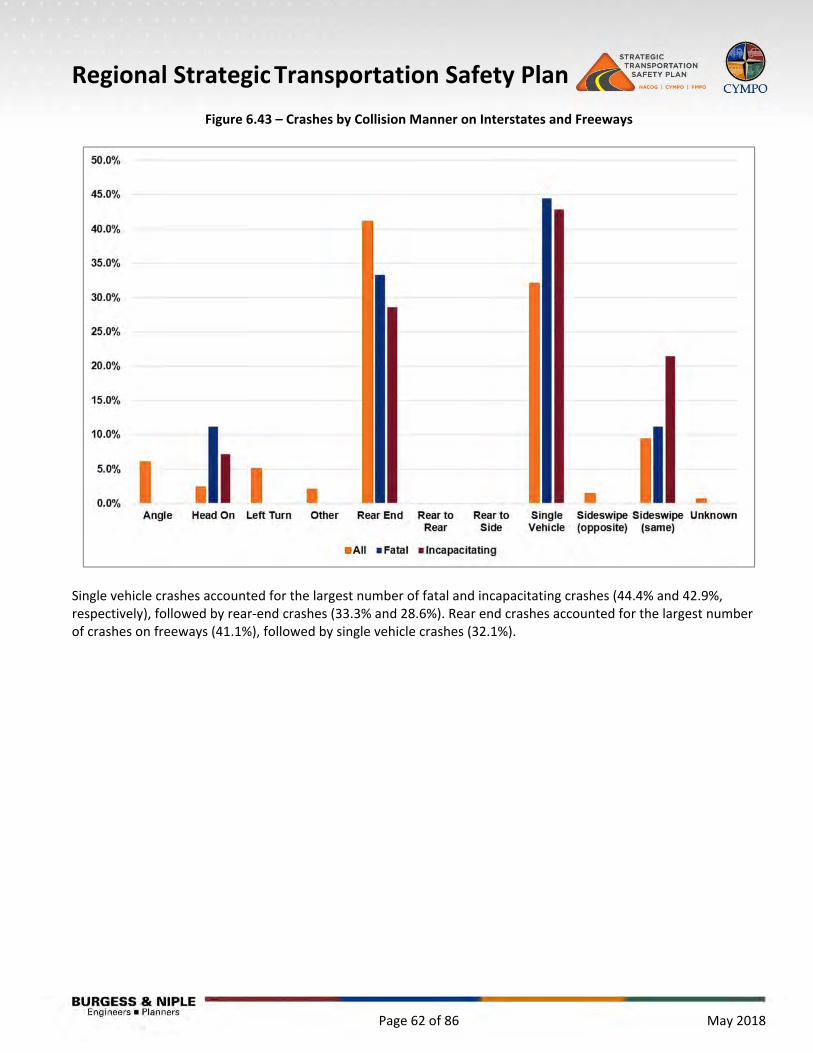
Rear end crashes accounted for the largest number of crashes on arterial and collector roads (35.5%), followed by single vehicle crashes (20.1%), and angle crashes (14.8%). Single vehicle crashes were the most prevalent fatal crash type (42.9%), followed by “other” (28.6%) and head on (14.3%). Single vehicle crashes were the most prevalent crash type for incapacitating crashes (32.7%), followed by angle (18.2%), and rear end (17.7%). 6.6.2 Functional Classification: Interstate and Freeways Figure 6.43 summarizes crash frequency based on collision manner and severity for crashes occurring on roadways functionally classified as interstates or freeways. This includes SR 89A and a portion of SR 69.
Regional Strategic Transportation Safety Plan
Page 62 of 86 May 2018
Figure 6.43 – Crashes by Collision Manner on Interstates and Freeways
Single vehicle crashes accounted for the largest number of fatal and incapacitating crashes (44.4% and 42.9%, respectively), followed by rear‐end crashes (33.3% and 28.6%). Rear end crashes accounted for the largest number of crashes on freeways (41.1%), followed by single vehicle crashes (32.1%).
Regional Strategic Transportation Safety Plan
Page 63 of 86 May 2018
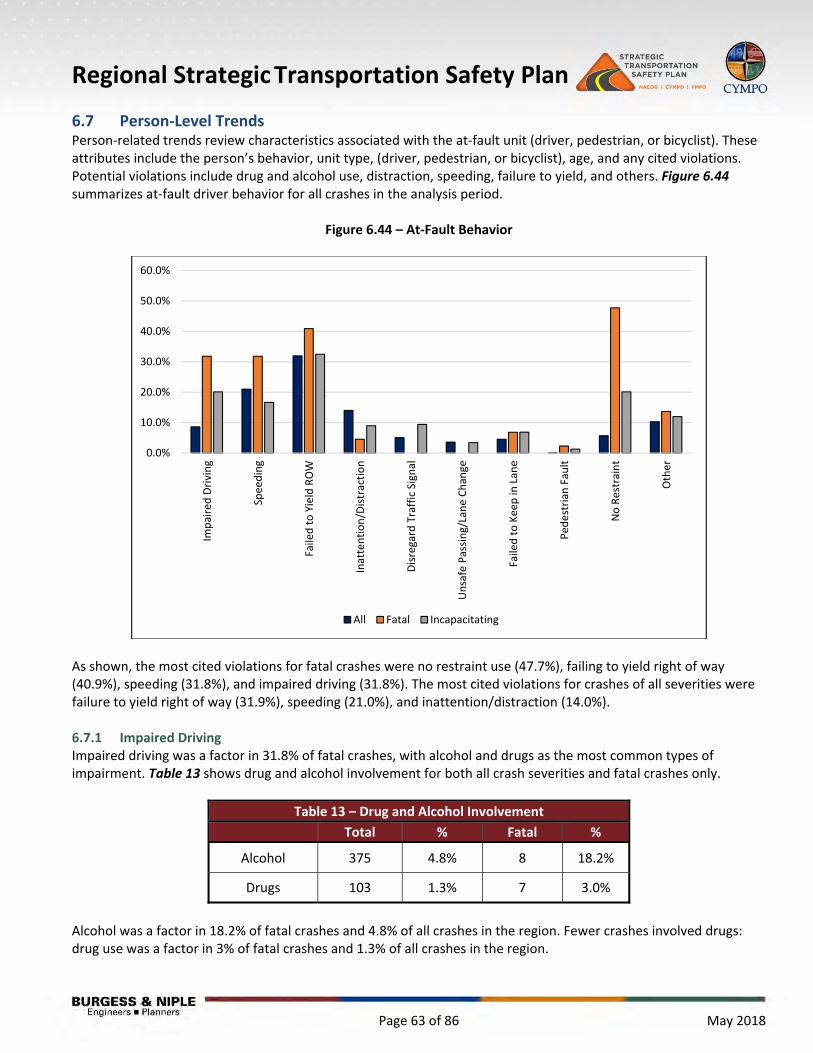
6.7 Person‐Level Trends Person‐related trends review characteristics associated with the at‐fault unit (driver, pedestrian, or bicyclist). These attributes include the person’s behavior, unit type, (driver, pedestrian, or bicyclist), age, and any cited violations. Potential violations include drug and alcohol use, distraction, speeding, failure to yield, and others. Figure 6.44 summarizes at‐fault driver behavior for all crashes in the analysis period.
Figure 6.44 – At‐Fault Behavior
As shown, the most cited violations for fatal crashes were no restraint use (47.7%), failing to yield right of way (40.9%), speeding (31.8%), and impaired driving (31.8%). The most cited violations for crashes of all severities were failure to yield right of way (31.9%), speeding (21.0%), and inattention/distraction (14.0%). 6.7.1 Impaired Driving Impaired driving was a factor in 31.8% of fatal crashes, with alcohol and drugs as the most common types of impairment. Table 13 shows drug and alcohol involvement for both all crash severities and fatal crashes only.
Table 13 – Drug and Alcohol Involvement
Total % Fatal %
Alcohol 375 4.8% 8 18.2%
Drugs 103 1.3% 7 3.0%
Alcohol was a factor in 18.2% of fatal crashes and 4.8% of all crashes in the region. Fewer crashes involved drugs: drug use was a factor in 3% of fatal crashes and 1.3% of all crashes in the region.
0.0%
10.0%
20.0%
30.0%
40.0%
50.0%
60.0%
Impaired Driving
Speeding
Failed to Yield ROW
Inattention/Distraction
Disregard Traffic Signal
Unsafe Passing/Lane Change
Failed to Keep in
Lane
Ped
estrian
Fault
No Restraint
Other
All Fatal Incapacitating
Regional Strategic Transportation Safety Plan
Page 64 of 86 May 2018
6.8 Crash Summary Key crash trends for the region are as follows: Emphasis areas include speeding and aggressive driving, occupant protection, motorcycles, distracted
driving, lane/roadway departure, intersections, younger drivers, older drivers, and traffic incident management (work zones).
69.5% of fatal crashes involved a lane or roadway departure. Nearly half of all fatal crashes involved a lack of restraint use (47.7%). Nearly one third of fatal crashes involved a motorcycle (29.5%). The most common collision manner in fatal and incapacitating crashes were rear end, angle, and same
direction sideswipe. The most common collision manner in crashes of all severities were rear end, angle, and left turn. The most cited driver violations in fatal crashes include lack of restraint use, failing to yield right of way,
speeding, and impaired driving. The most cited driver violations for crashes of all severities including failing to yield right of way and
speeding.
Regional Strategic Transportation Safety Plan
Page 65 of 86 May 2018
National Performance Management Measures This plan evaluates crash data in accordance with the National Performance Management Measures Final Rule (23 CFR Part 490), effective April 14, 2016. The Rule establishes procedures, performance measures, data, reporting requirements, and potential consequences for safety performance at the State Department of Transportation (DOT) and Metropolitan Planning Organization (MPO) level. Its goal is to reduce fatalities and serious injuries by promoting the use of data to inform transportation planning and programming. The Final Rule establishes five important performance measures to guide HSIP implementation for State DOTs. These performance measures are based on five‐year rolling averages and must assess the following:
1. Number of fatalities. 2. Rate of fatalities per 100 million Vehicle Miles Traveled (VMT). 3. Number of serious Injuries. 4. Rate of serious injuries per 100 million VMT. 5. Number of combined non‐motorized fatalities and serious injuries.
The performance measures apply to all public roads and must be updated annually. State DOTs must report on performance measure targets beginning with the first HSIP annual report, due one year from the effective date of the Final Rule and in each subsequent HSIP annual report. Targets are assessed and progress noted as satisfactory if four of the five performance measures either meet targets or exceed baseline averages. Baseline averages are based off the most recent five years of crash data, ending prior to the year in which targets were established; e.g. if the targets are established in 2017, the five‐year analysis period must analyze years 2012 to 2016. All MPOs must establish performance targets for each performance measure within 180 days of when the State DOT establishes and reports its targets in its HSIP annual report. MPOs can establish either targets specific to their MPO, or targets which encourage project planning and programming towards achieving a statewide target. If the MPO establishes quantifiable targets specific to the MPO, it must report the VMT estimate and methodology used to estimate the target. This methodology must be consistent with other Federal reporting systems.
7.1 State Performance Measures On August 31, 2017, ADOT established safety targets, or projections, for 2018. State targets for 2018 are as follows: State fatality projection/target is a 4% increase (2018 target 1,040 fatalities, 5‐year rolling average 934.6
fatalities). State fatality rate projection/target is a 2% increase (2018 target fatality rate 1.53 fatalities/100 million VMT,
5 year rolling average 1.41 fatalities/100 million VMT). State serious injuries projection/target is neutral (2018 target 4,515 serious injuries, 5‐year rolling average
4,330 serious injuries). State serious injury rate projection/target is a 1% decrease (2018 target 6.62 serious injuries/100 million
VMT, 5‐year rolling average 6.55 serious injuries/100 million VMT). State non‐motorized fatal and serious injuries projection/target is a 2% increase (2018 target 889 non‐
motorized fatalities and serious injuries, 5‐year rolling average 790 fatalities and serious injuries).
7.2 CYMPO Performance Measures Figure 7.1 through Figure 7.5 display performance measure data for CYMPO corresponding to the 2018 State targets. VMT was assumed to increase 1% per year to align with ADOT assumptions.
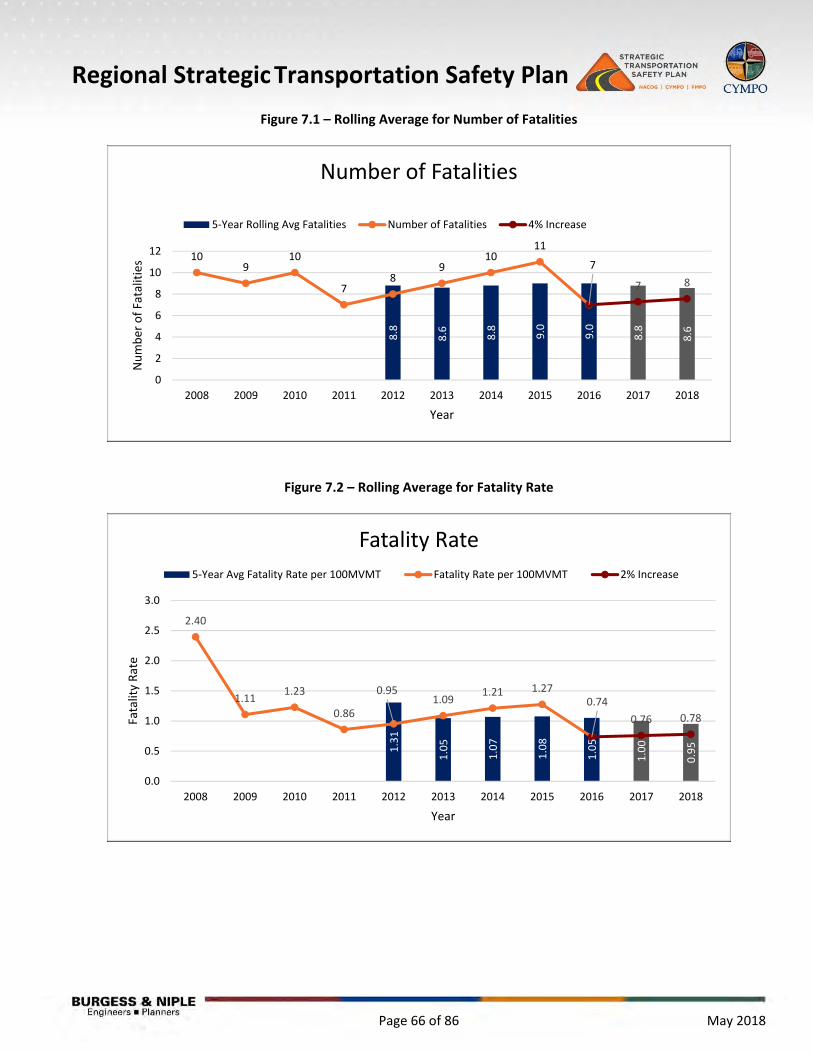
Regional Strategic Transportation Safety Plan
Page 66 of 86 May 2018
Figure 7.1 – Rolling Average for Number of Fatalities
Figure 7.2 – Rolling Average for Fatality Rate
8.8
8.6 8.8 9.0
9.0
8.8
8.6
109
10
78
910
11
7
7 8
0
2
4
6
8
10
12
2008 2009 2010 2011 2012 2013 2014 2015 2016 2017 2018
Number of Fatalities
Year
Number of Fatalities
5‐Year Rolling Avg Fatalities Number of Fatalities 4% Increase
1.31
1.05
1.07
1.08
1.05
1.00
0.95
2.40
1.111.23
0.86
0.951.09
1.21 1.270.74
0.76 0.78
0.0
0.5
1.0
1.5
2.0
2.5
3.0
2008 2009 2010 2011 2012 2013 2014 2015 2016 2017 2018
Fatality Rate
Year
Fatality Rate
5‐Year Avg Fatality Rate per 100MVMT Fatality Rate per 100MVMT 2% Increase
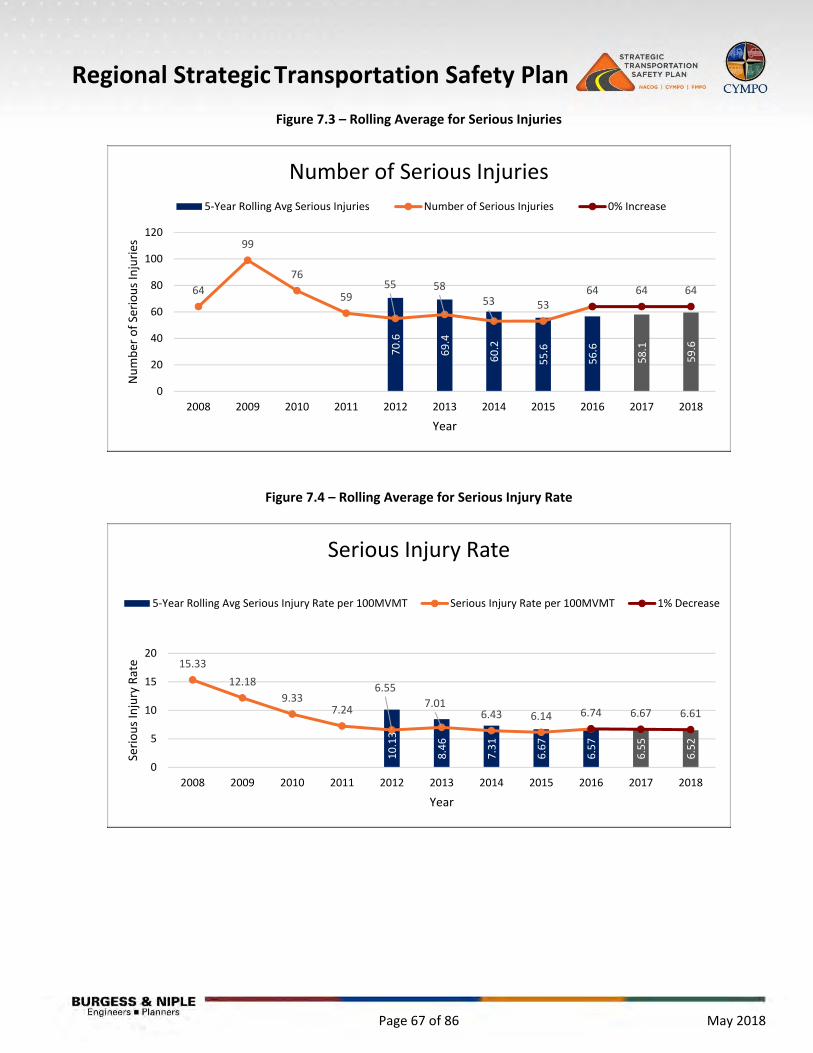
Regional Strategic Transportation Safety Plan
Page 67 of 86 May 2018
Figure 7.3 – Rolling Average for Serious Injuries
Figure 7.4 – Rolling Average for Serious Injury Rate
70.6
69.4
60.2
55.6
56.6
58.1
59.6
64
99
76
5955 58
53 5364 64 64
0
20
40
60
80
100
120
2008 2009 2010 2011 2012 2013 2014 2015 2016 2017 2018
Number of Serious Injuries
Year
Number of Serious Injuries
5‐Year Rolling Avg Serious Injuries Number of Serious Injuries 0% Increase
10.13
8.46
7.31
6.67
6.57
6.55
6.52
15.33
12.18
9.337.24
6.55
7.016.43 6.14 6.74 6.67 6.61
0
5
10
15
20
2008 2009 2010 2011 2012 2013 2014 2015 2016 2017 2018
Serious Injury Rate
Year
Serious Injury Rate
5‐Year Rolling Avg Serious Injury Rate per 100MVMT Serious Injury Rate per 100MVMT 1% Decrease
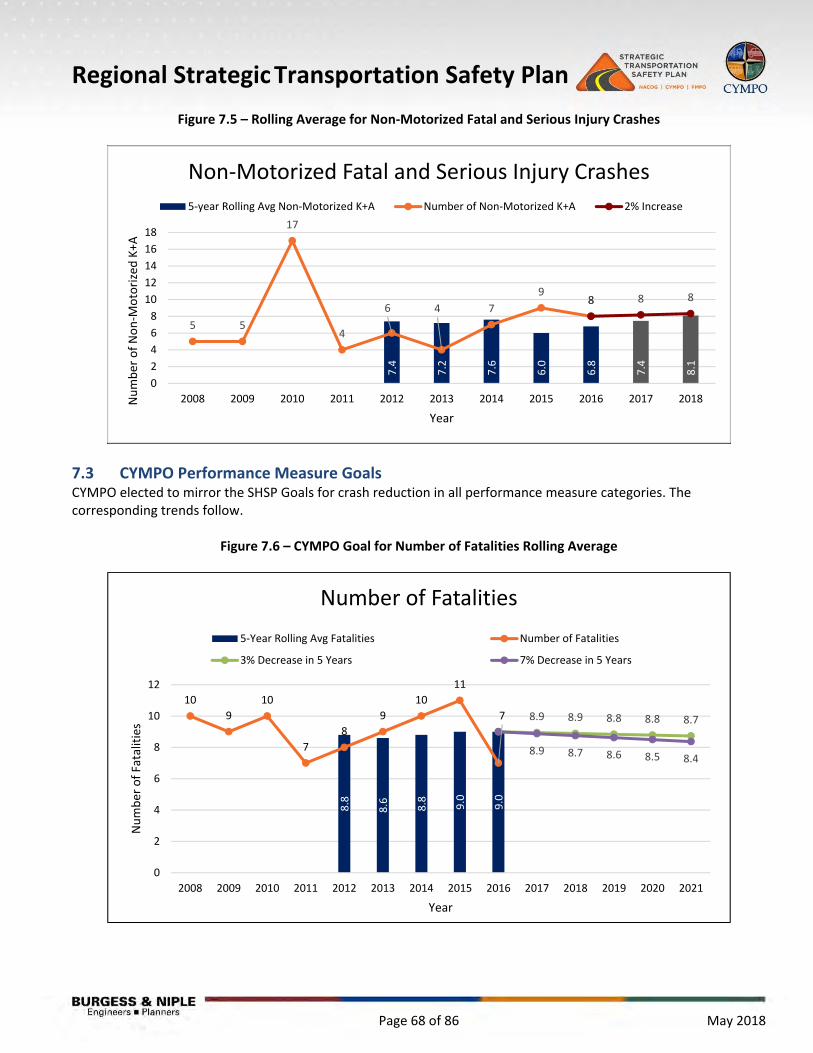
Regional Strategic Transportation Safety Plan
Page 68 of 86 May 2018
Figure 7.5 – Rolling Average for Non‐Motorized Fatal and Serious Injury Crashes
7.3 CYMPO Performance Measure Goals CYMPO elected to mirror the SHSP Goals for crash reduction in all performance measure categories. The corresponding trends follow.
Figure 7.6 – CYMPO Goal for Number of Fatalities Rolling Average
7.4
7.2
7.6
6.0
6.8
7.4
8.1
5 5
17
4
6 4 7
988 8 8
0
2
4
6
8
10
12
14
16
18
2008 2009 2010 2011 2012 2013 2014 2015 2016 2017 2018Number of Non‐M
otorized K+A
Year
Non‐Motorized Fatal and Serious Injury Crashes
5‐year Rolling Avg Non‐Motorized K+A Number of Non‐Motorized K+A 2% Increase
8.8
8.6 8.8 9.0
9.0
10
9
10
7
8
9
10
11
7 8.9 8.9 8.8 8.8 8.7
8.9 8.7 8.6 8.5 8.4
0
2
4
6
8
10
12
2008 2009 2010 2011 2012 2013 2014 2015 2016 2017 2018 2019 2020 2021
Number of Fatalities
Year
Number of Fatalities
5‐Year Rolling Avg Fatalities Number of Fatalities
3% Decrease in 5 Years 7% Decrease in 5 Years

Regional Strategic Transportation Safety Plan
Page 69 of 86 May 2018
Figure 7.7 – CYMPO Goal for Fatality Rate Rolling Averages
Figure 7.8 – CYMPO Goal for Number of Serious Injuries Rolling Average
1.31
1.05
1.07
1.08
1.05
2.40
1.111.23
0.86
0.951.09
1.21 1.27
0.74
1.0 1.0 1.0 1.0 1.0
1.0 1.0 1.0 1.0 1.0
0.0
0.5
1.0
1.5
2.0
2.5
3.0
2008 2009 2010 2011 2012 2013 2014 2015 2016 2017 2018 2019 2020 2021
Fatality Rate
Year
Fatality Rate
5‐Year Avg Fatality Rate per 100MVMT Fatality Rate per 100MVMT
3% Decrease in 5 Years 7% Decrease in 5 Years
70.6
69.4
60.2
55.6
56.6
64
99
76
59
55 58
5353
6456.3 55.9 55.6 55.2 54.9
55.8 55.0 54.2 53.4 52.6
0
20
40
60
80
100
120
2008 2009 2010 2011 2012 2013 2014 2015 2016 2017 2018 2019 2020 2021
Number of Serious Injuries
Year
Number of Serious Injuries
5‐Year Rolling Avg Serious Injuries Number of Serious Injuries
3% Decrease in 5 Years 7% Decrease in 5 Years
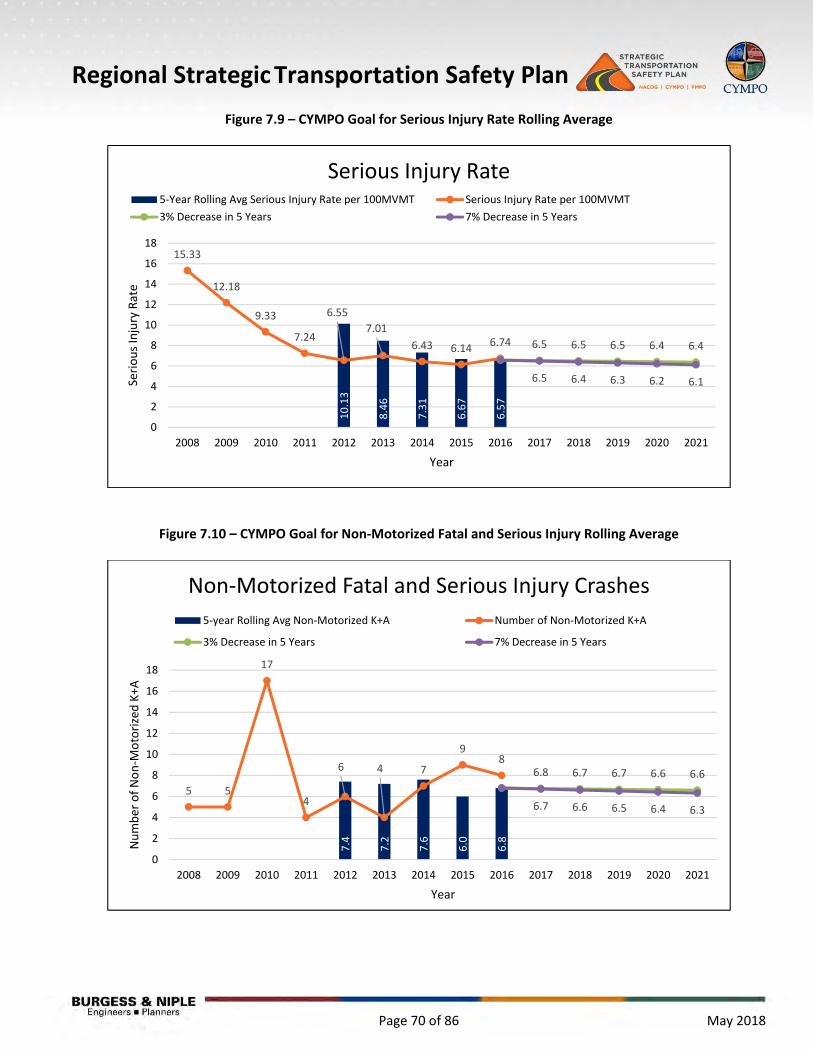
Regional Strategic Transportation Safety Plan
Page 70 of 86 May 2018
Figure 7.9 – CYMPO Goal for Serious Injury Rate Rolling Average
Figure 7.10 – CYMPO Goal for Non‐Motorized Fatal and Serious Injury Rolling Average
10.13
8.46
7.31
6.67
6.57
15.33
12.18
9.33
7.24
6.55
7.01
6.43 6.146.74 6.5 6.5 6.5 6.4 6.4
6.5 6.4 6.3 6.2 6.1
0
2
4
6
8
10
12
14
16
18
2008 2009 2010 2011 2012 2013 2014 2015 2016 2017 2018 2019 2020 2021
Serious Injury Rate
Year
Serious Injury Rate5‐Year Rolling Avg Serious Injury Rate per 100MVMT Serious Injury Rate per 100MVMT
3% Decrease in 5 Years 7% Decrease in 5 Years
7.4
7.2
7.6
6.0
6.8
5 5
17
4
6 4 7
98
6.8 6.7 6.7 6.6 6.6
6.7 6.6 6.5 6.4 6.3
0
2
4
6
8
10
12
14
16
18
2008 2009 2010 2011 2012 2013 2014 2015 2016 2017 2018 2019 2020 2021
Number of Non‐M
otorized K+A
Year
Non‐Motorized Fatal and Serious Injury Crashes
5‐year Rolling Avg Non‐Motorized K+A Number of Non‐Motorized K+A
3% Decrease in 5 Years 7% Decrease in 5 Years
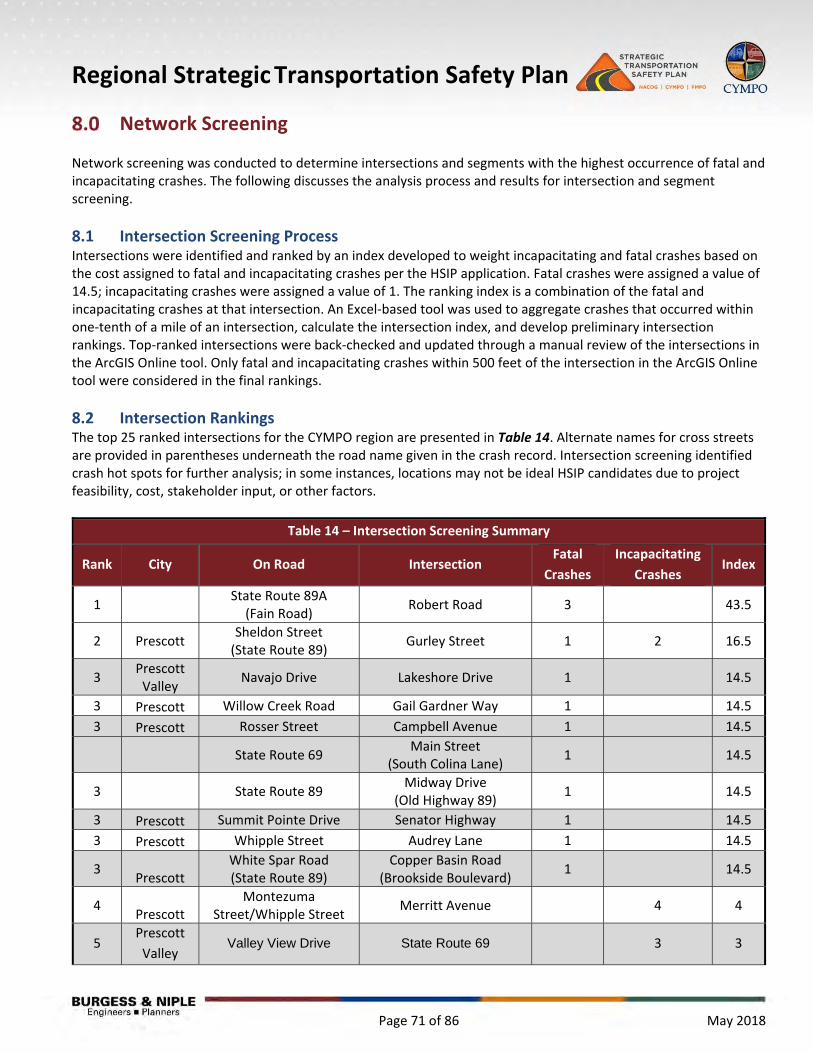
Regional Strategic Transportation Safety Plan
Page 71 of 86 May 2018
Network Screening Network screening was conducted to determine intersections and segments with the highest occurrence of fatal and incapacitating crashes. The following discusses the analysis process and results for intersection and segment screening.
8.1 Intersection Screening Process Intersections were identified and ranked by an index developed to weight incapacitating and fatal crashes based on the cost assigned to fatal and incapacitating crashes per the HSIP application. Fatal crashes were assigned a value of 14.5; incapacitating crashes were assigned a value of 1. The ranking index is a combination of the fatal and incapacitating crashes at that intersection. An Excel‐based tool was used to aggregate crashes that occurred within one‐tenth of a mile of an intersection, calculate the intersection index, and develop preliminary intersection rankings. Top‐ranked intersections were back‐checked and updated through a manual review of the intersections in the ArcGIS Online tool. Only fatal and incapacitating crashes within 500 feet of the intersection in the ArcGIS Online tool were considered in the final rankings.
8.2 Intersection Rankings The top 25 ranked intersections for the CYMPO region are presented in Table 14. Alternate names for cross streets are provided in parentheses underneath the road name given in the crash record. Intersection screening identified crash hot spots for further analysis; in some instances, locations may not be ideal HSIP candidates due to project feasibility, cost, stakeholder input, or other factors.
Table 14 – Intersection Screening Summary
Rank City On Road Intersection Fatal
Crashes
Incapacitating
Crashes Index
1
State Route 89A (Fain Road)
Robert Road 3 43.5
2 Prescott Sheldon Street (State Route 89)
Gurley Street 1 2 16.5
3 Prescott Valley
Navajo Drive Lakeshore Drive 1 14.5
3 Prescott Willow Creek Road Gail Gardner Way 1 14.5
3 Prescott Rosser Street Campbell Avenue 1 14.5
State Route 69 Main Street
(South Colina Lane) 1 14.5
3
State Route 89 Midway Drive
(Old Highway 89) 1 14.5
3 Prescott Summit Pointe Drive Senator Highway 1 14.5
3 Prescott Whipple Street Audrey Lane 1 14.5
3 Prescott
White Spar Road (State Route 89)
Copper Basin Road (Brookside Boulevard)
1 14.5
4 Prescott
Montezuma Street/Whipple Street
Merritt Avenue 4 4
5 Prescott
Valley Valley View Drive State Route 69 3 3
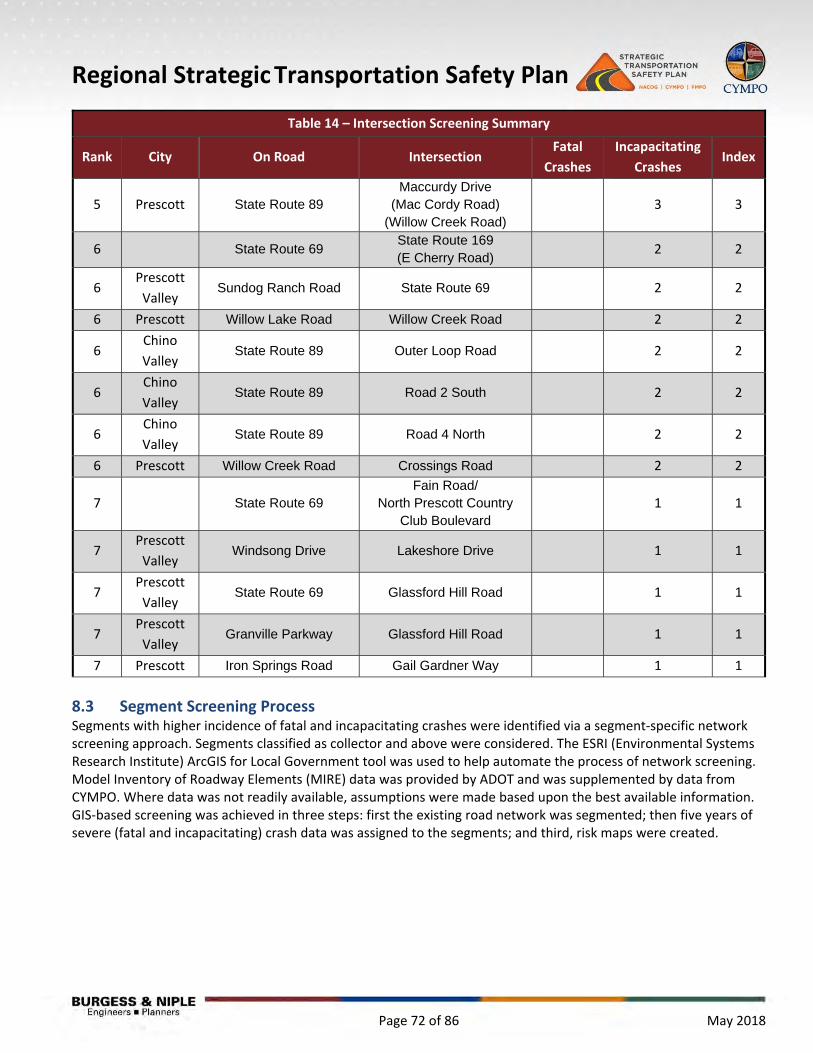
Regional Strategic Transportation Safety Plan
Page 72 of 86 May 2018
Table 14 – Intersection Screening Summary
Rank City On Road Intersection Fatal
Crashes
Incapacitating
Crashes Index
5 Prescott State Route 89 Maccurdy Drive
(Mac Cordy Road) (Willow Creek Road)
3 3
6
State Route 69 State Route 169 (E Cherry Road)
2 2
6 Prescott
Valley Sundog Ranch Road State Route 69 2 2
6 Prescott Willow Lake Road Willow Creek Road 2 2
6 Chino
Valley State Route 89 Outer Loop Road 2 2
6 Chino
Valley State Route 89 Road 2 South 2 2
6 Chino
Valley State Route 89 Road 4 North 2 2
6 Prescott Willow Creek Road Crossings Road 2 2
7
State Route 69 Fain Road/
North Prescott Country Club Boulevard
1 1
7 Prescott
Valley Windsong Drive Lakeshore Drive 1 1
7 Prescott
Valley State Route 69 Glassford Hill Road 1 1
7 Prescott
Valley Granville Parkway Glassford Hill Road 1 1
7 Prescott Iron Springs Road Gail Gardner Way 1 1
8.3 Segment Screening Process Segments with higher incidence of fatal and incapacitating crashes were identified via a segment‐specific network screening approach. Segments classified as collector and above were considered. The ESRI (Environmental Systems Research Institute) ArcGIS for Local Government tool was used to help automate the process of network screening. Model Inventory of Roadway Elements (MIRE) data was provided by ADOT and was supplemented by data from CYMPO. Where data was not readily available, assumptions were made based upon the best available information. GIS‐based screening was achieved in three steps: first the existing road network was segmented; then five years of severe (fatal and incapacitating) crash data was assigned to the segments; and third, risk maps were created.
Regional Strategic Transportation Safety Plan
Page 73 of 86 May 2018
Roadway segmentation was based upon the United States Road Assessment Program (usRAP) Protocol, which segments the network when the following changes in a roadway occur: A route begins or ends. A county name changes. There is a discontinuity in the route. The roadway type changes (including functional classification, division type, area type). The annual average daily traffic (AADT) changes by 20% or more. The speed limit category changes.
Based on segmentation and crash assignation, segments were identified as “highest risk,” “medium‐high risk,” “medium risk,” “medium‐low risk,” and “lowest risk.” Only fatal and incapacitating crashes were considered for screening to help identify HSIP‐eligible sites. Roadway characteristics that influence risk assignment include: Speed; Number of lanes; Annual Average Daily Traffic (AADT); Roadway division type (undivided/divided); Area type (rural/urban); and Access control.
Network screening was completed by assessing crash risk, crash frequency, crash trends, and characteristics of the existing roadway. Segments identified as “medium‐low risk” or above were manually examined in conjunction with fatal and incapacitating crash history to determine whether the segment should be targeted. Note that not all segments within these risk categories were identified for improvement. For example, a segment might be identified as a “highest” risk segment because of roadway characteristics, but may not have experienced any severe crashes during the analysis period. Likewise, a “medium” risk segment might have several severe crashes attributed to it, but its roadway characteristics identify the segment as lower risk. Manual review adjusted for these phenomena and included segments that might benefit from systemic improvements. Additionally, locations known to have received safety improvements within the past five years that may have addressed crash risk were removed. Crash risk maps are shown in Figure 8.1 through Figure 8.3

Regional Strategic Transportation Safety Plan
Page 74 of 86 May 2018
Figure 8.1 – Crash Risk Map
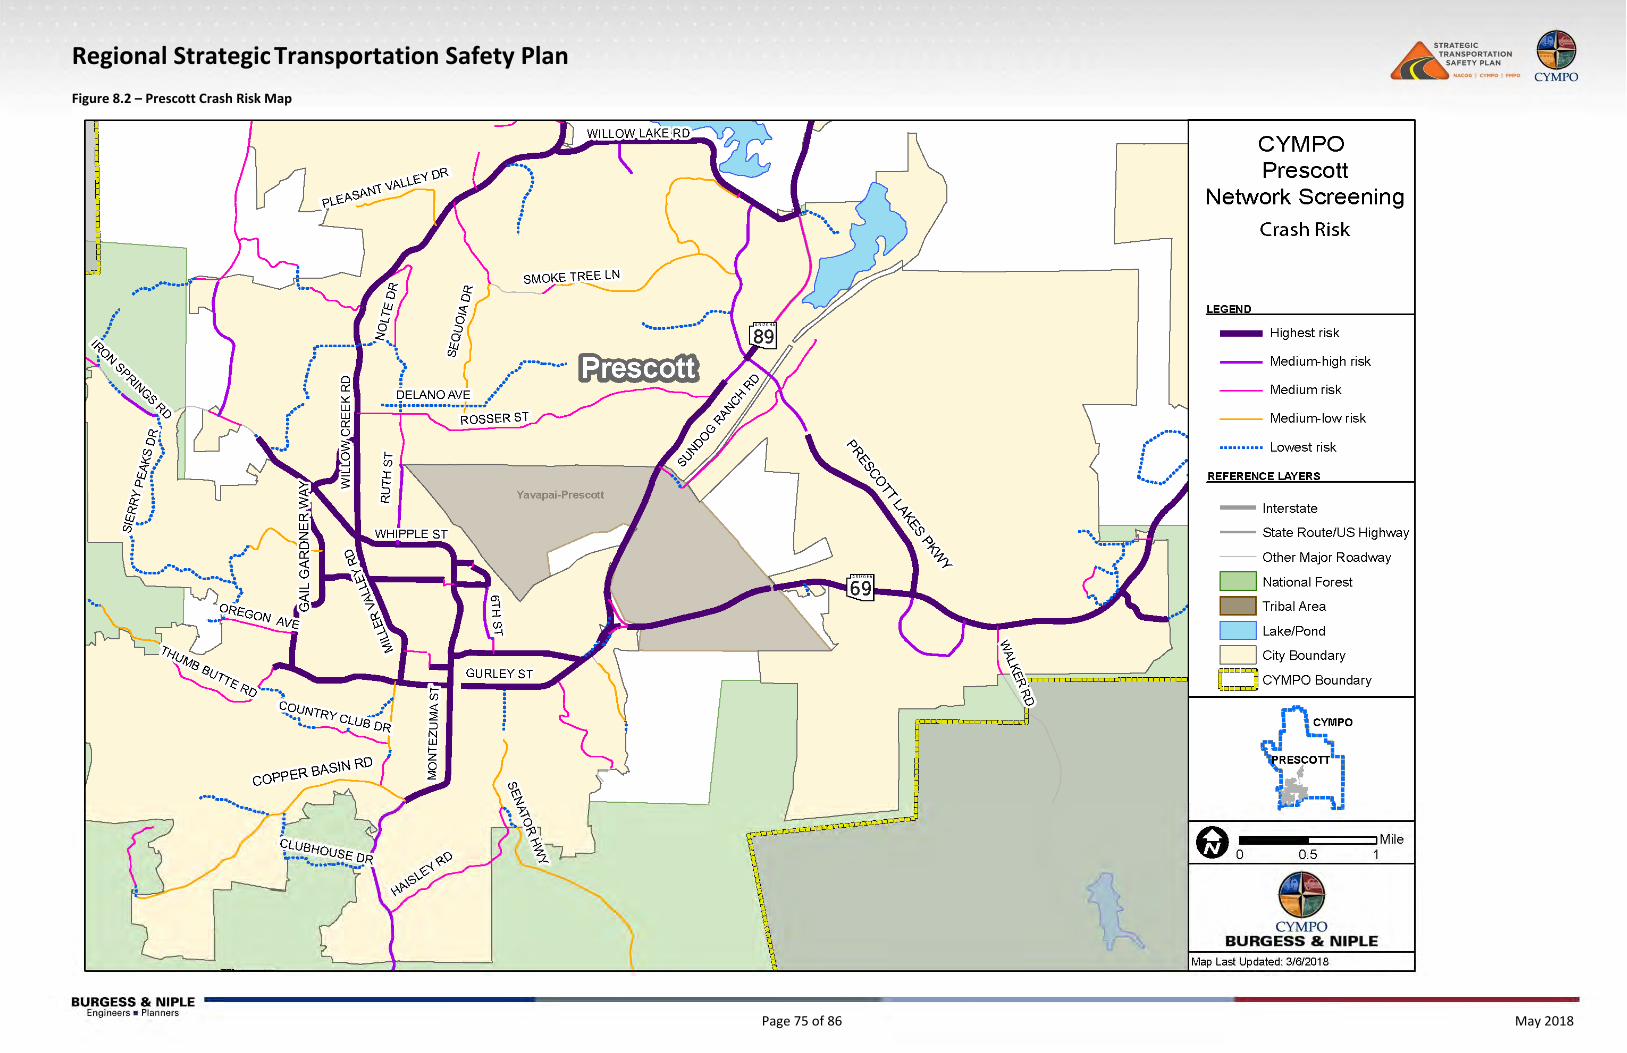
Regional Strategic Transportation Safety Plan
Page 75 of 86 May 2018
Figure 8.2 – Prescott Crash Risk Map
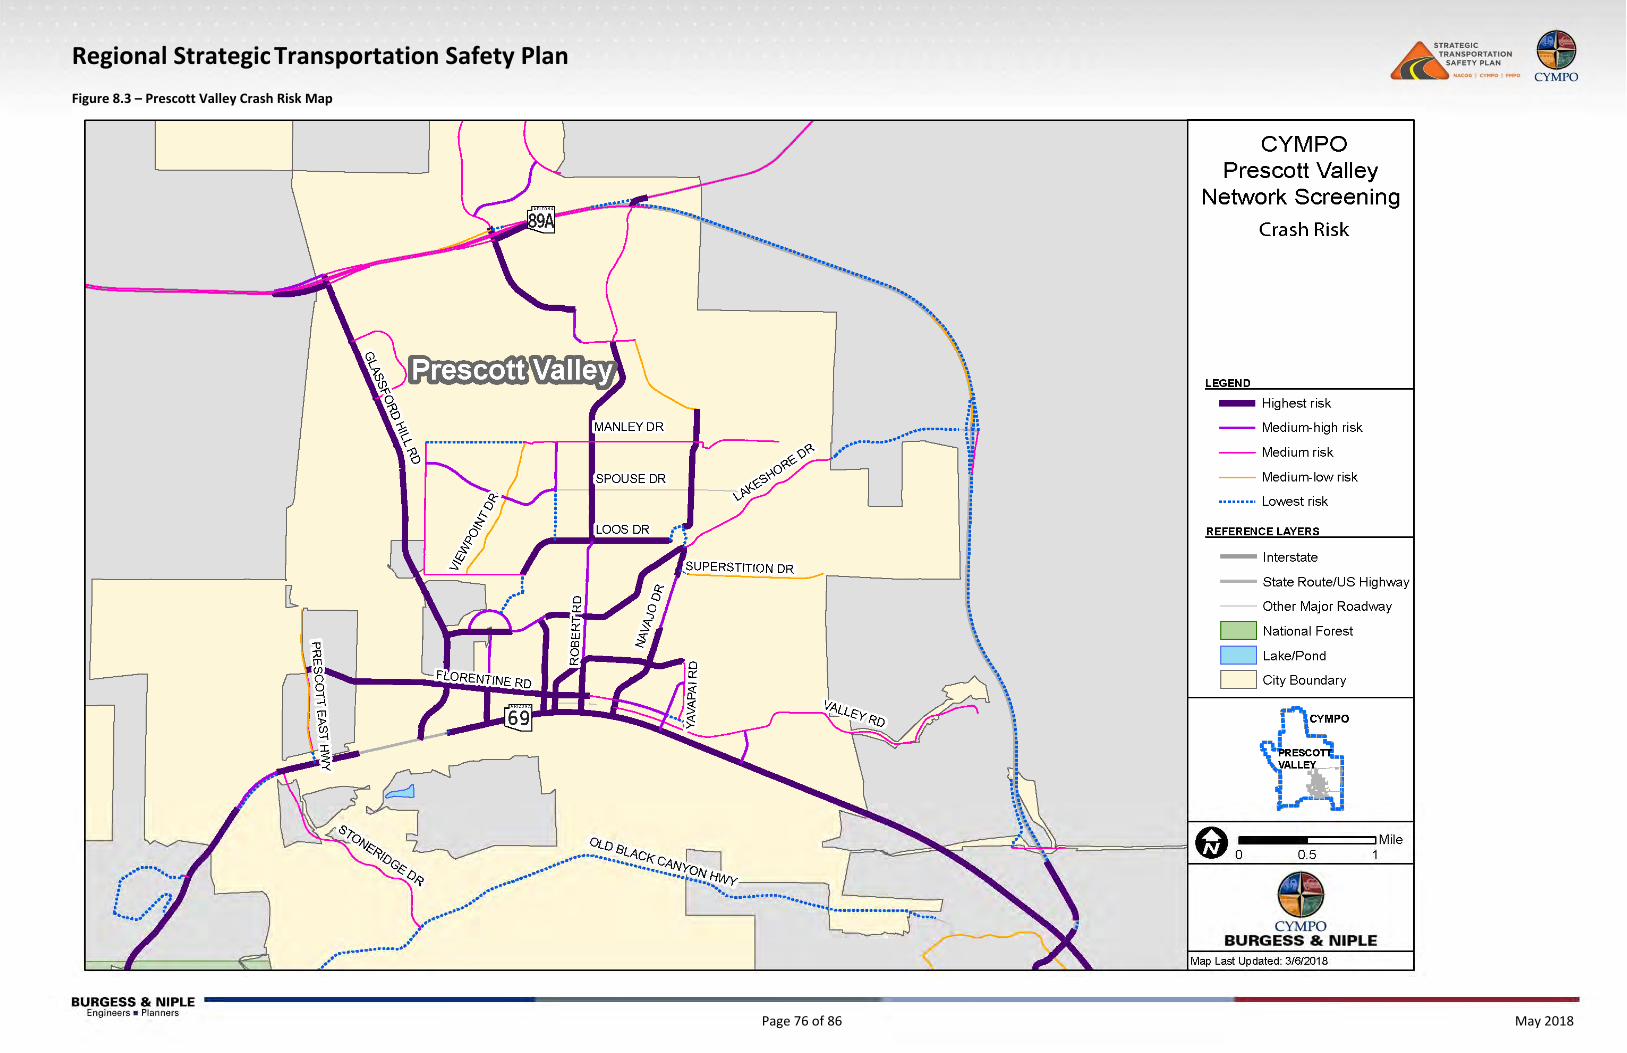
Regional Strategic Transportation Safety Plan
Page 76 of 86 May 2018
Figure 8.3 – Prescott Valley Crash Risk Map

Regional Strategic Transportation Safety Plan
Page 77 of 86 May 2018
8.4 Segment Screening Results Network screening revealed the following list of segments for further review. Note that Table 15 does not represent segment rankings.
Table 15 – Segment Screening Summary
Segment Begin End
State Route 89 Clayton Road Road 5N
State Route 89 State Route 89A State Route 69
Outer Loop Road Williamson Valley Road Reed Road
Williamson Valley Road Outer Loop Road Iron Springs Road
State Route 89A State Route 89 Forest Service Road 151
Lakeshore Drive Glassford Hill Road Papago Lane
Fain Road State Route 89A Prescott Country Club Boulevard
State Route 69 Old Black Canyon Highway Iron King Road
Willow Creek Road/Miller Valley Road/Grove Avenue
Commerce Drive Copper Basin Road
Whipple Street Walnut Street Merritt Street
Sheldon Street Montezuma Street Gurley Street
Mount Vernon Avenue/Senator Highway
Summit Point Drive Gurley Street
Montezuma Street/White Spar Road
Haisley Road Gurley Street
State Route 69 State Route 89 Walker Road
Segments are shown Figure 8.4 through Figure 8.6
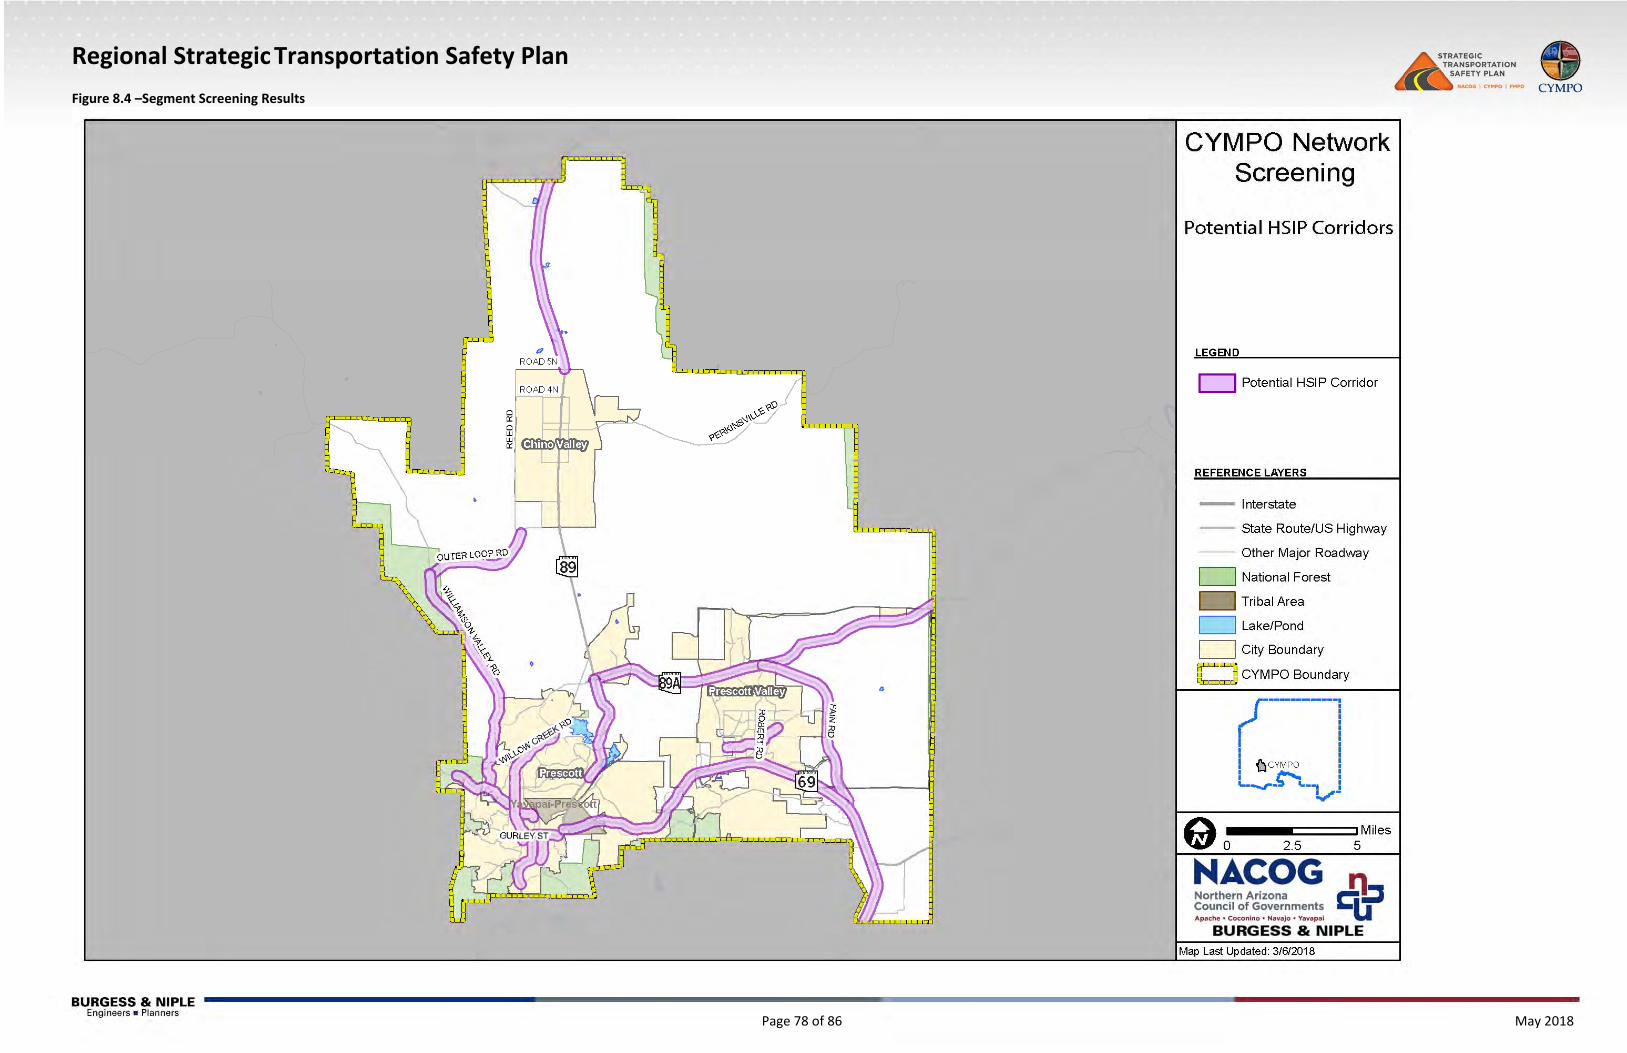
Regional Strategic Transportation Safety Plan
Page 78 of 86 May 2018
Figure 8.4 –Segment Screening Results
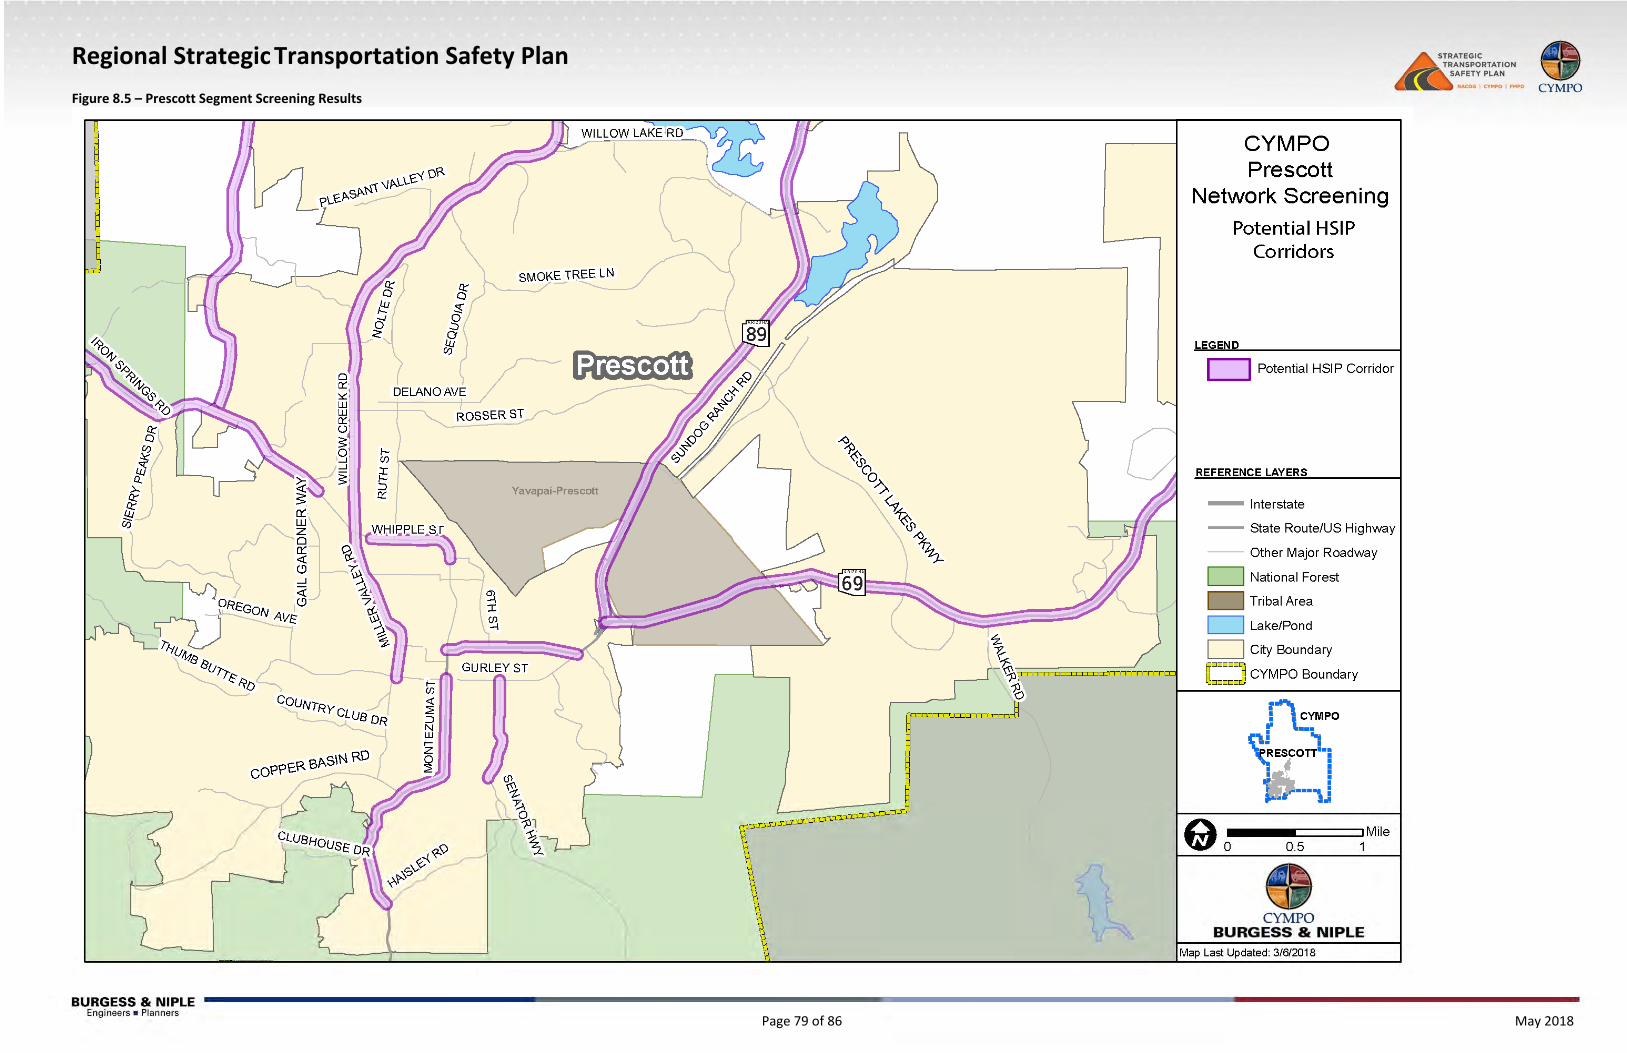
Regional Strategic Transportation Safety Plan
Page 79 of 86 May 2018
Figure 8.5 – Prescott Segment Screening Results

Regional Strategic Transportation Safety Plan
Page 80 of 86 May 2018
Figure 8.6 – Prescott Valley Segment Screening Results
Regional Strategic Transportation Safety Plan
Page 81 of 86 May 2018
Funding Resources State and local transportation systems are primarily funded by two programs: the Federal Aid Highway Program and Arizona Highway User Revenue Fund (HURF). Both programs generate revenue from system users, who pay a variety of transportation‐related taxes. These taxes include a gas tax, vehicle license fees, and auto registration fees. However, a variety of programs at the federal level also provide funds for state and local transportation projects. The largest of these is the Highway Safety Improvement Program, which incorporates programs such as the Railway‐Highway Crossings and High Risk Rural Roads programs. The following sections describe these funding opportunities in more detail and presents further funding opportunities below.
9.1 Highway Safety Improvement Program (HSIP) The Highway Safety Improvement Program (HSIP) provides federal funds for projects which aim to reduce traffic fatalities and serious injuries on public roads, including tribal lands and roads owned by non‐state entities. Projects considered must be consistent with United States Code Section 148 of Title 23 (23 U.S.C. 148) and must support a “data‐driven, strategic approach to improving safety.” Each project must address five performance measures, established by the Safety Performance Management Final Rule to guide the implementation, assessment, and safety target reporting for HSIP projects. For more information, see Section 7.0 Following the establishment of the FAST Act in 2015, HSIP no longer supports non‐infrastructure projects, such as education and law enforcement. More information is available at https://safety.fhwa.dot.gov/hsip/
9.2 Arizona Highway User Revenue Fund (HURF) HURF provides funding to cities, towns, counties, and to the State Highway Fund for highway construction, improvements, and other related expenses.
9.3 Railway‐Highway Crossings (Section 130) Program The Railway‐Highway Crossings (Section 130) program provides federal funds for safety improvement projects at public railway crossings. Projects are funded at a 90% federal share, allocated through the HSIP and set aside annually, through fiscal year 2020. Half of these funds must go towards the installation of safety devices at crossings, while the remainder may be designated toward any safety improvement project. States may use a maximum of 2 percent of these federal funds for data compilation and analysis in support of program reporting requirements. States are required to conduct and maintain a survey of all highways to identify railroad crossings in need of safety improvements. More information is available at https://safety.fhwa.dot.gov/hsip/xings/
9.4 High Risk Rural Roads (HRRR) Local rural roads and rural major or minor collector roads with “significant safety risks”, identified as such in an updated SHSP, may receive funding through the High Risk Rural Roads (HRRR) program. The program is supported by a Special Rule in 23 USC 148, which maintains that the State must designate funds to the HRRR in an amount equal to 200 percent its FY 2009 HRRR set‐aside if fatalities increase on these high risk rural roads. The increase must be observed “over the most recent 2‐year period for which data are available,” which the FHWA calculates using data from the Highway Performance Monitoring System (HPMS) and the NHTSA Fatality Analysis Reporting System (FARS). The $90 million set‐aside which previously supported the HRRR program was simultaneously eliminated by the Moving Ahead for Progress in the 21st Century Act (MAP‐21) Act and replaced by the current Special Rule, continued in the Fixing America’s Surface Transportation (FAST) Act. More information is available at https://safety.fhwa.dot.gov/hsip/hrrr/
Regional Strategic Transportation Safety Plan
Page 82 of 86 May 2018
9.5 Infrastructure for Rebuilding America (INFRA) Grant Program The US Department of Transportation recently launched the Infrastructure for Rebuilding America (INFRA) Grant Program, which will allocate $1.5 billion in federal funds towards transportation infrastructure. The program builds from an existing program under the FAST Act using new evaluation criteria. Among other projects, the program will support safety projects which employ innovative design solutions or technologies “to improve the detection, mitigation, and documentation of safety risks.” Safety projects are competitive under the “Economic Vitality” and “Innovation” evaluation criteria. Of note, at least 25% of funds will be designated towards rural areas. All project applications must include a benefit‐cost analysis. Funds awarded to a project must be designated within three years of the fiscal year for which they were authorized. More information is available at https://www.transportation.gov/sites/dot.gov/files/docs/policy‐initiatives/buildamerica/283311/fy17‐18‐infra‐grant‐program‐faqs.pdf
9.6 Surface Transportation System Funding Alternatives (STSFA) Program The Surface Transportation System Funding Alternatives (STSFA) program provides federal funds to States for projects which support “user‐based alternative revenue mechanisms” which generate income for the Federal Highway Trust Fund from infrastructure users. The program will provide $20 million each year, starting with fiscal year 2017 and ending with fiscal year 2020, for demonstration projects through the Highway Research and Development Program. More information is available at https://www.grants.gov/custom/viewOppDetails.jsp?oppId=293213
9.7 Surface Transportation Block Grant (STBG) Program Previously known as the Surface Transportation Program (STP), the Surface Transportation Block Grant (STBG) Program is the most flexible of all federal transportation funding programs. Funds are designated to each state as a lump sum calculated using a legal percentage, then subdivided among the State’s programs. A set‐aside amount of 2 percent of provided funds is reserved for planning and research and Transportation Alternatives. Of the remaining funds, a percent of funds established by the FAST Act must be sub‐allocated between the following in an amount corresponding to their proportion of the State population: urban areas of population greater than 200,000; areas with populations between 5,000 and 200,000; and, areas with less than 5,000 people. The balance may be divided among the State freely. More information is available at https://www.fhwa.dot.gov/fastact/factsheets/transportationalternativesfs.cfm
9.8 STBG Transportation Alternatives STBG transportation alternatives (TA) funding replaces the MAP‐21 Transportation Alternatives Program (TAP). The MAP‐21 TAP replaced the Transportation Enhancement (TE) Activities Program. The STBG program continues to support all programs and projects supported by the TAP, including smaller‐scale transportation projects like safe routes to school projects and pedestrian and bicycle facilities. $850 million will be made available annually for fiscal years 2018 to 2020 specifically for STBG transportation alternatives. Funds are awarded on a competitive basis and awarded projects and project applications must report annually to the Department of Transportation. More information is available at https://www.fhwa.dot.gov/fastact/factsheets/transportationalternativesfs.cfm
9.9 NHTSA Assessment Program The National Highway Traffic Safety Administration (NHTSA) offers technical support to State agencies that request an assessment of the State highway safety program. The assessment can identify program strengths and weaknesses and recommend improvements to assist in long‐range planning and resource allocation. The assessment is not punitive; it is meant to be constructive and encourage open dialogue. Assessments can be conducted for pedestrian safety, motorcycle safety, traffic records, occupant protection, impaired driving, and emergency medical services.
Regional Strategic Transportation Safety Plan
Page 83 of 86 May 2018
More information is available at https://www.nhtsa.gov/pedestrian‐safety/pedestrian‐program‐assessment
9.10 Congestion Mitigation and Air Quality Improvement (CMAQ) Program CMAQ, funded through MAP‐21, provides a flexible funding source to state and local governments for transportation projects and programs to help reduce congestion and improve air quality for nonattainment and maintenance areas. Eligible activities include, but are not limited to: projects that improve traffic flow, such as improving signalization, constructing high‐occupancy vehicle (HOV) lanes, improving intersections, and adding turning lanes. Other approved activities include projects to improve incident and emergency response or improve mobility. Funds may be used for projects that shift traffic demand to nonpeak hours or other transportation modes, increase vehicle occupancy rates, or otherwise reduce demand. There is some expanded authority to use funds for transit operations. Funds may not be used for projects that increase the number of single occupant vehicles in the network.
9.11 Intelligent Transportation Systems (ITS) Program FHWA’s Intelligent Transportation Systems (ITS) Program provides federal funds for up to 80 percent of a project to support the research and development of ITS for a variety of purposes, including road safety improvement. The Program requires a five‐year ITS Strategic Plan and is currently focused on improving road safety through safety systems which support wireless communications between surface transportation modes and transportation infrastructure. More information is available at https://www.fhwa.dot.gov/fastact/factsheets/itsprogramfs.cfm
9.12 Governor’s Office of Highway Safety The Governor’s Office of Highway Safety allocated funding through the NHTSA for grant projects under the Highway Safety Act. These federal funds are meant to supplement ongoing state or local expenditures and can be used for programs including law enforcement, education, and crash data collection. Funded programs include Accident Investigation and the Impaired Driving program. More information is available at https://www.azgohs.gov/grant‐opportunities/FFY%202018%20GOHS%20Proposal%20Guide_final1.pdf
9.13 Other Funding Sources Numerous funding sources are used for transportation projects and could be utilized for safety projects. These include development impact fees, revenue bonds, and public‐private partnerships. In addition, ADOT’s RSA program is a valuable project development resource.
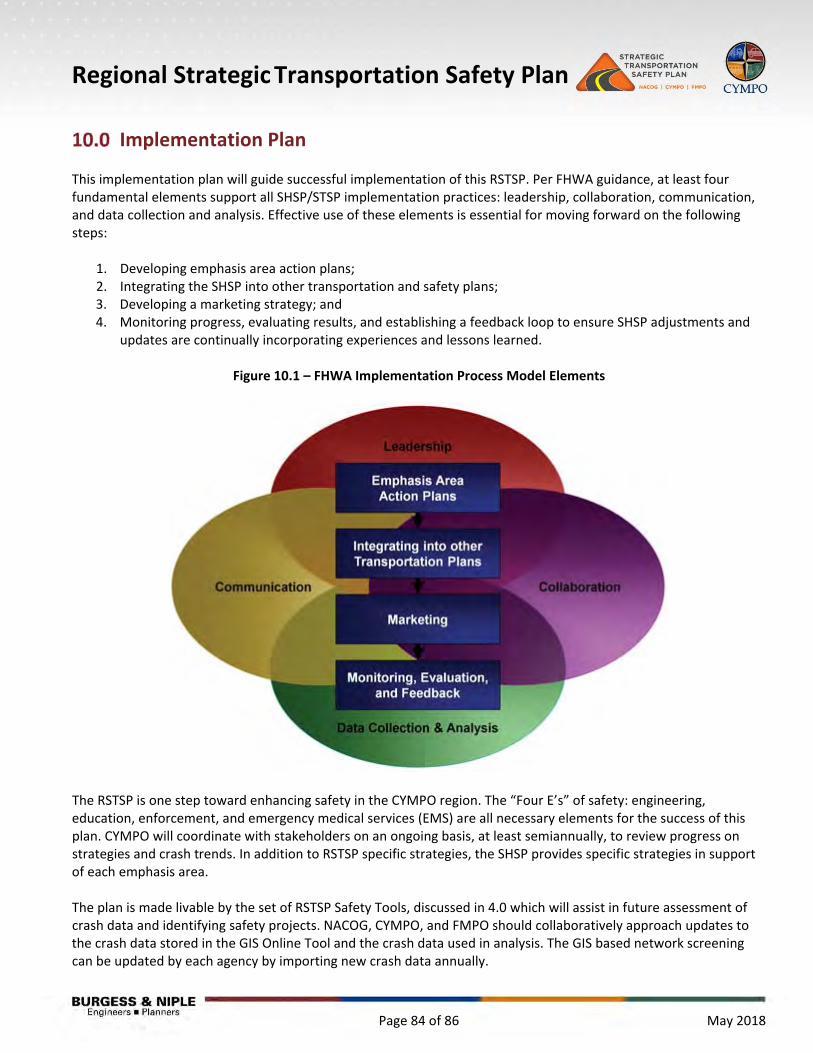
Regional Strategic Transportation Safety Plan
Page 84 of 86 May 2018
Implementation Plan This implementation plan will guide successful implementation of this RSTSP. Per FHWA guidance, at least four fundamental elements support all SHSP/STSP implementation practices: leadership, collaboration, communication, and data collection and analysis. Effective use of these elements is essential for moving forward on the following steps:
1. Developing emphasis area action plans; 2. Integrating the SHSP into other transportation and safety plans; 3. Developing a marketing strategy; and 4. Monitoring progress, evaluating results, and establishing a feedback loop to ensure SHSP adjustments and
updates are continually incorporating experiences and lessons learned.
Figure 10.1 – FHWA Implementation Process Model Elements
The RSTSP is one step toward enhancing safety in the CYMPO region. The “Four E’s” of safety: engineering, education, enforcement, and emergency medical services (EMS) are all necessary elements for the success of this plan. CYMPO will coordinate with stakeholders on an ongoing basis, at least semiannually, to review progress on strategies and crash trends. In addition to RSTSP specific strategies, the SHSP provides specific strategies in support of each emphasis area. The plan is made livable by the set of RSTSP Safety Tools, discussed in 4.0 which will assist in future assessment of crash data and identifying safety projects. NACOG, CYMPO, and FMPO should collaboratively approach updates to the crash data stored in the GIS Online Tool and the crash data used in analysis. The GIS based network screening can be updated by each agency by importing new crash data annually.
Regional Strategic Transportation Safety Plan
Page 85 of 86 May 2018
10.1 Leadership The CYMPO Manager is the leader and main point of contact for this STSP. Based upon strategies in the SHSP and in this Plan, staff from member agencies, ADOT, and law enforcement should be involved in strategy implementation. Based on the strategies developed with this plan, the group could easily expand to include other groups.
10.2 The HSIP Process Every year, the federal government apportions a set amount of funds to each state for its HSIP. ADOT oversees the HSIP process in Arizona and accepts and reviews applications. State and local agencies must compete for project funding based on the B/C ratios of their proposed projects. The HSIP funds up to 100 percent of the costs associated with safety improvement projects at sites with a demonstrated high number of fatal and incapacitating crashes. Projects must meet the basic requirements outlined below:
Minimum B/C ratio of 1.5. Benefit calculated using only most recent 5 years of fatal and incapacitating crashes. Minimum project cost $250,000. Maximum project cost $5 million, allow exceptions may be made through coordination with ADOT. Use of 4 and 5 star countermeasures from online CMF Clearinghouse, although lower star countermeasures
have been accepted through coordination with ADOT.
10.3 Potential HSIP Projects Potential HSIP projects were identified following a largely data‐driven approach, incorporating network screening, crash analysis, and local stakeholder coordination. As part of project development, review of crash reports and coordination with local law enforcement is encouraged to provide a broader understanding of crash causal factors to ensure the effectiveness of a proposed project. Potential projects are identified and included in Appendix B. Countermeasures from both the ADOT HSIP application and the Crash Modification Clearinghouse were utilized. Planning‐level cost were used to determine preliminary B/C ratios for potential HSIP projects. A summary list of potential spot improvement projects is provided in Table 16. Stakeholder coordination is necessary prior to application and project development.
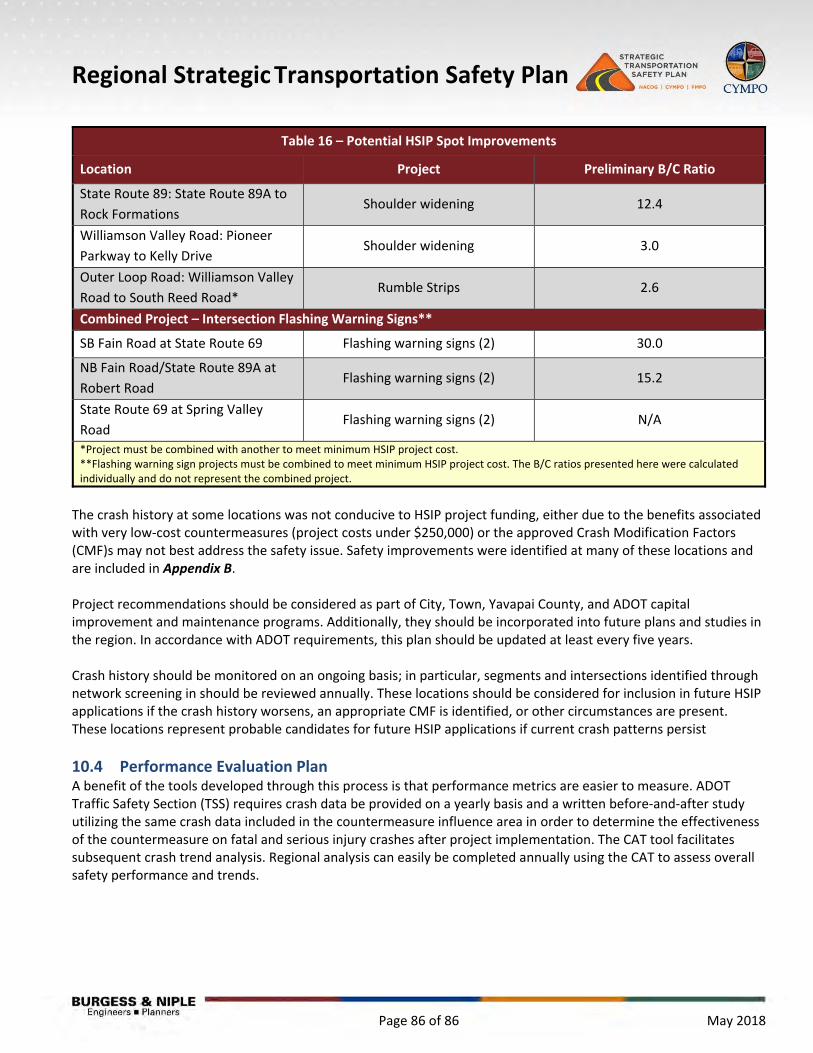
Regional Strategic Transportation Safety Plan
Page 86 of 86 May 2018
Table 16 – Potential HSIP Spot Improvements
Location Project Preliminary B/C Ratio
State Route 89: State Route 89A to
Rock Formations Shoulder widening 12.4
Williamson Valley Road: Pioneer
Parkway to Kelly Drive Shoulder widening 3.0
Outer Loop Road: Williamson Valley
Road to South Reed Road* Rumble Strips 2.6
Combined Project – Intersection Flashing Warning Signs**
SB Fain Road at State Route 69 Flashing warning signs (2) 30.0
NB Fain Road/State Route 89A at
Robert Road Flashing warning signs (2) 15.2
State Route 69 at Spring Valley
Road Flashing warning signs (2) N/A
*Project must be combined with another to meet minimum HSIP project cost. **Flashing warning sign projects must be combined to meet minimum HSIP project cost. The B/C ratios presented here were calculated individually and do not represent the combined project.
The crash history at some locations was not conducive to HSIP project funding, either due to the benefits associated with very low‐cost countermeasures (project costs under $250,000) or the approved Crash Modification Factors (CMF)s may not best address the safety issue. Safety improvements were identified at many of these locations and are included in Appendix B. Project recommendations should be considered as part of City, Town, Yavapai County, and ADOT capital improvement and maintenance programs. Additionally, they should be incorporated into future plans and studies in the region. In accordance with ADOT requirements, this plan should be updated at least every five years. Crash history should be monitored on an ongoing basis; in particular, segments and intersections identified through network screening in should be reviewed annually. These locations should be considered for inclusion in future HSIP applications if the crash history worsens, an appropriate CMF is identified, or other circumstances are present. These locations represent probable candidates for future HSIP applications if current crash patterns persist
10.4 Performance Evaluation Plan A benefit of the tools developed through this process is that performance metrics are easier to measure. ADOT Traffic Safety Section (TSS) requires crash data be provided on a yearly basis and a written before‐and‐after study utilizing the same crash data included in the countermeasure influence area in order to determine the effectiveness of the countermeasure on fatal and serious injury crashes after project implementation. The CAT tool facilitates subsequent crash trend analysis. Regional analysis can easily be completed annually using the CAT to assess overall safety performance and trends.
Regional Strategic Transportation Safety Plan
APPENDIX A Stakeholder and Public Engagement Summaries
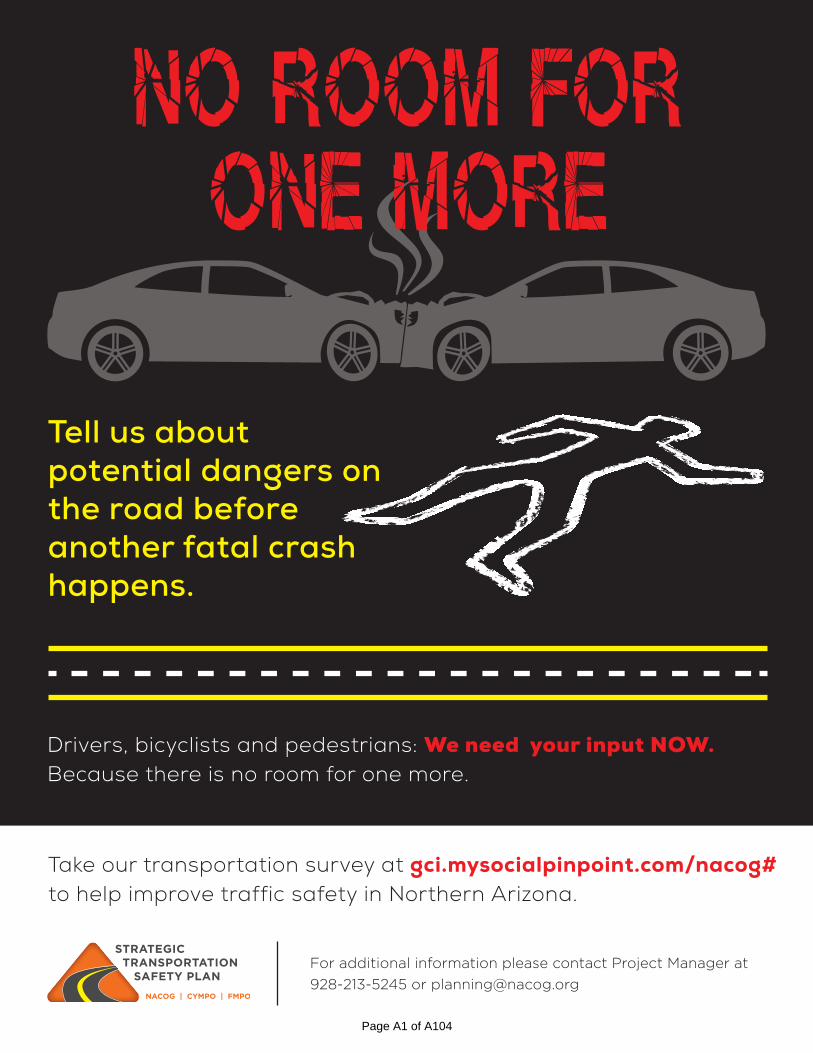
NO ROOM FOR ONE MORE
Tell us about potential dangers on the road before another fatal crash happens.
Drivers, bicyclists and pedestrians: We need your input NOW. Because there is no room for one more.
Take our transportation survey at gci.mysocialpinpoint.com/nacog# to help improve traffic safety in Northern Arizona.
For additional information please contact Project Manager at
928-213-5245 or [email protected]
Page A1 of A104
CYMPO Stakeholder Workshop Agenda
Date: August 10, 2017 Time: 8:00 am – 9:30 am Location: Prescott Valley Public Library, Crystal Room (3rd Floor)
7401 E. Civic Circle, Prescott Valley, AZ
Time Task Lead
8:00am Welcome
Workshop Purpose
Introductions
Chris Bridges, CYMPO
8:10am RSTSP Overview
Bahram Dariush, ADOT
8:20am Data Analysis
Crash data summary
Crash locations
Dana Biscan, Burgess & Niple
8:35am Survey/Polling/Mapping Tool
Unsafe driving behaviors observed
Opinion of causes
Jaye Allen, GCI Brock Barnhart, GCI
8:50am RSTSP Vision and Goal
Video
Building on the National, State and Regional Vision
What is the future to which we aspire?
Group discussion and selection of a vision and goals
Jaye/Brock, GCI
Group Exercise
9:25am Next Steps/Adjourn
Online Survey/Mapping: https://www.surveymonkey.com/r/CYMPO
Schedule
Chris Bridges, CYMPO
Page A2 of A104
VISION: Identify a broad vision to be accomplished for the safety plan.
_____________________________________________________________________________________
_____________________________________________________________________________________
_____________________________________________________________________________________
_____________________________________________________________________________________
_____________________________________________________________________________________
_____________________________________________________________________________________
_____________________________________________________________________________________
_____________________________________________________________________________________
_____________________________________________________________________________________
_____________________________________________________________________________________
_____________________________________________________________________________________
GOALS: Create measurable goals that lead to achieving the vision of the project. These are commonly a
percentage of fatality/injury reductions that are set to a timeline.
_____________________________________________________________________________________
_____________________________________________________________________________________
_____________________________________________________________________________________
_____________________________________________________________________________________
_____________________________________________________________________________________
_____________________________________________________________________________________
_____________________________________________________________________________________
_____________________________________________________________________________________
_____________________________________________________________________________________
_____________________________________________________________________________________
_____________________________________________________________________________________
_____________________________________________________________________________________
_____________________________________________________________________________________
_____________________________________________________________________________________
_____________________________________________________________________________________
_____________________________________________________________________________________
_____________________________________________________________________________________
_____________________________________________________________________________________
_____________________________________________________________________________________
Page A3 of A104
1
Welcome!
Please prepare your phone to participate in our interactive polling activity
• Send text
– TO: 22333
– MESSAGE: gciaz
• Will receive a reply “you’ve joined”
Please let us know if you need assistance
WELCOME
Paul Lopez, City of Avondale
Page A4 of A104
2
Meeting Purpose
1. Review and discuss crash data
2. Identify unsafe driver behaviors
3. Analysis of crash locations
4. Create a Vision and GOAL
5. Select Action Areas
INTRODUCTIONS
Chris Bridges
Page A5 of A104
3
Tips for a Good Meeting
• Listen constructively
• Respect other’s opinions
• Think “outside of the box”
• Stay focused – avoid side conversations
• Phones on vibrate but keep handy!
• HAVE FUN!
WHAT IS AN STSP?
Bahram Dariush
Page A6 of A104

4
PROJECT PROCESS AND DATA ANALYSIS
Dana Biscan
Page A7 of A104
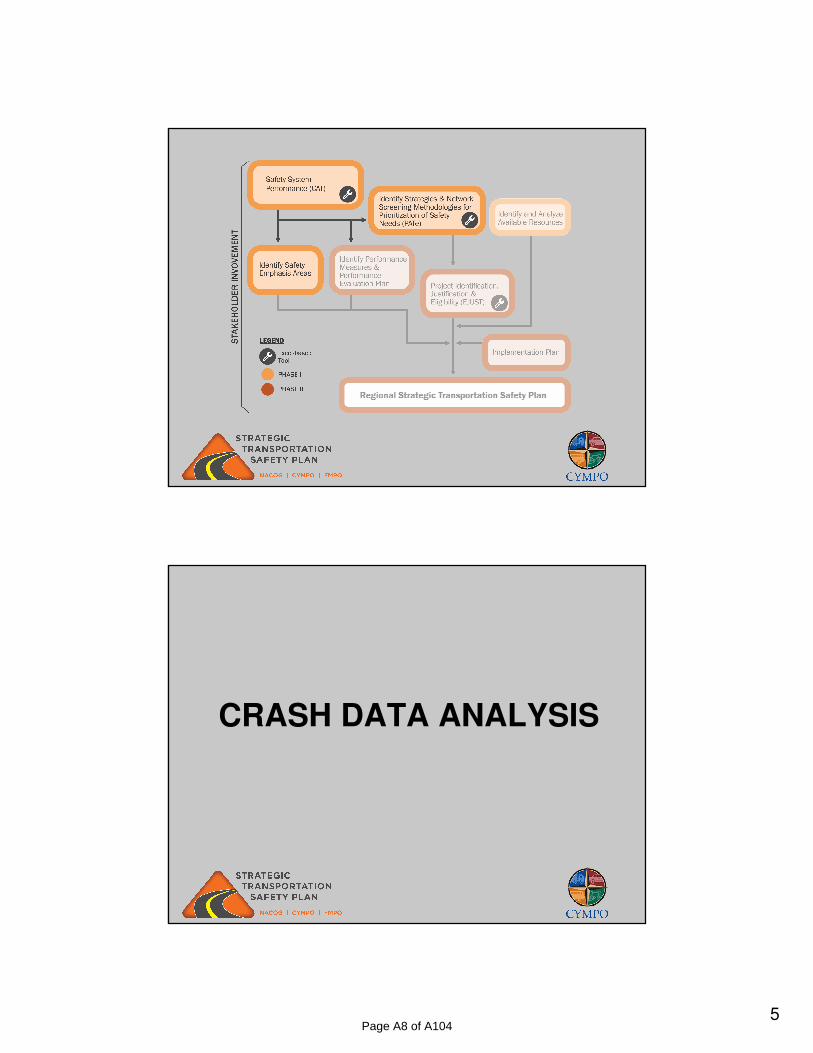
5
CRASH DATA ANALYSIS
Page A8 of A104

6
Statewide Crash Trends
CYMPO Crash Trends
Page A9 of A104
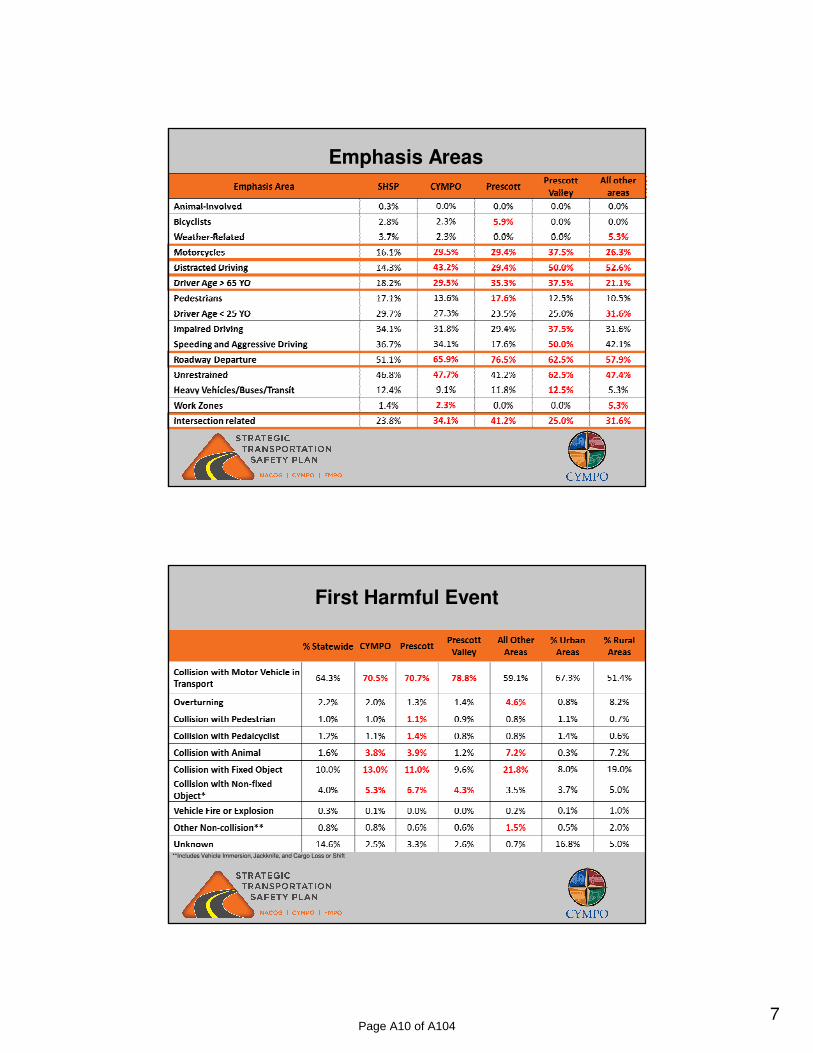
7
Emphasis Areas
First Harmful Event
*Includes Collision with Parked Vehicles, Trains, Railway Vehicles, and Work Zone Equipment**Includes Vehicle Immersion, Jackknife, and Cargo Loss or Shift
Page A10 of A104
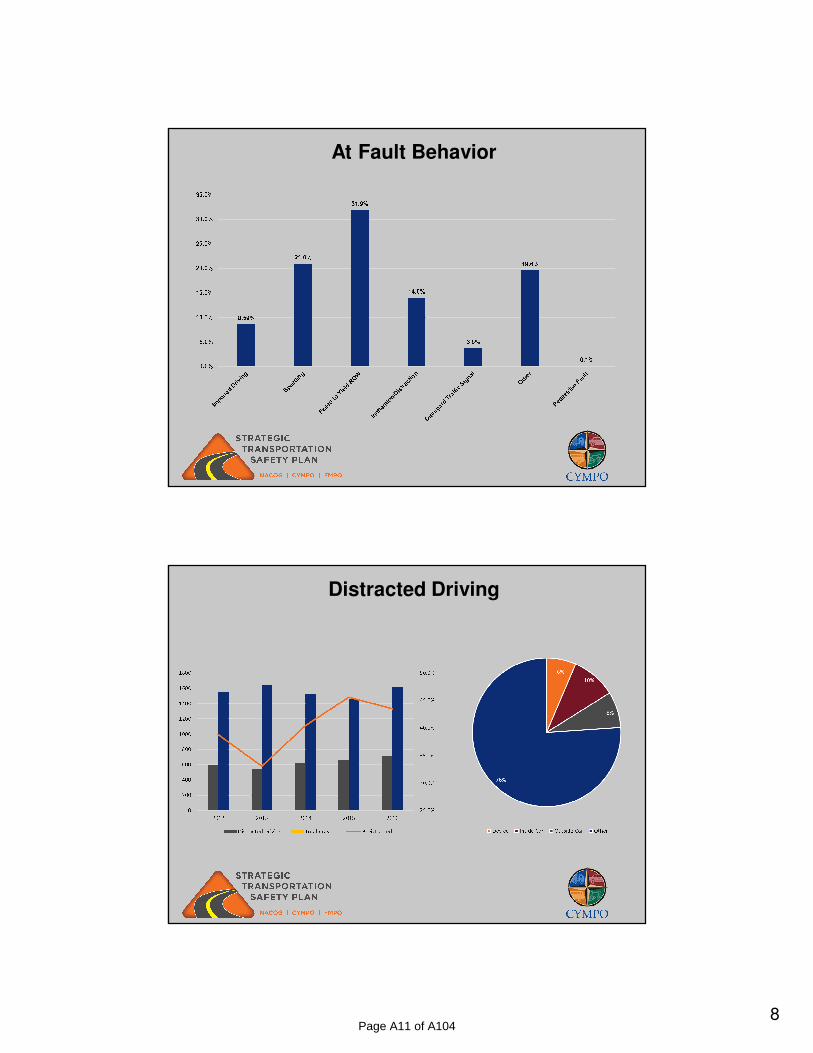
8
At Fault Behavior
Distracted Driving
Page A11 of A104
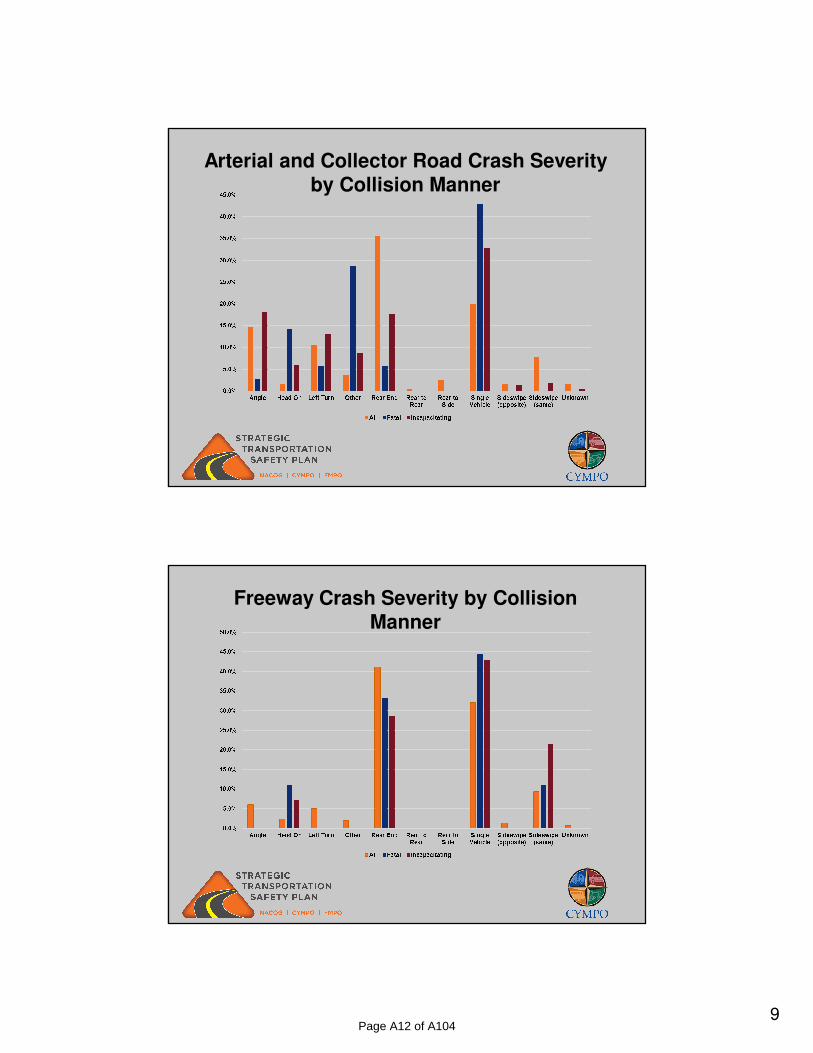
9
Arterial and Collector Road Crash Severity by Collision Manner
Freeway Crash Severity by Collision Manner
Page A12 of A104
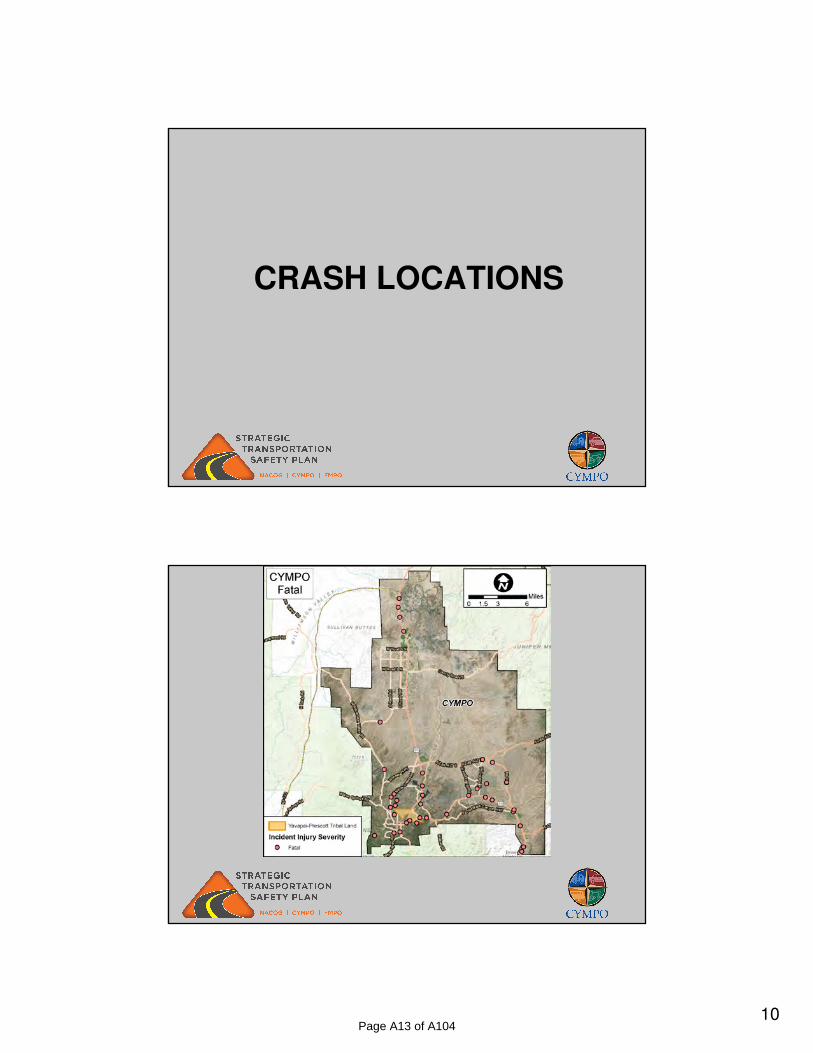
10
CRASH LOCATIONS
Page A13 of A104
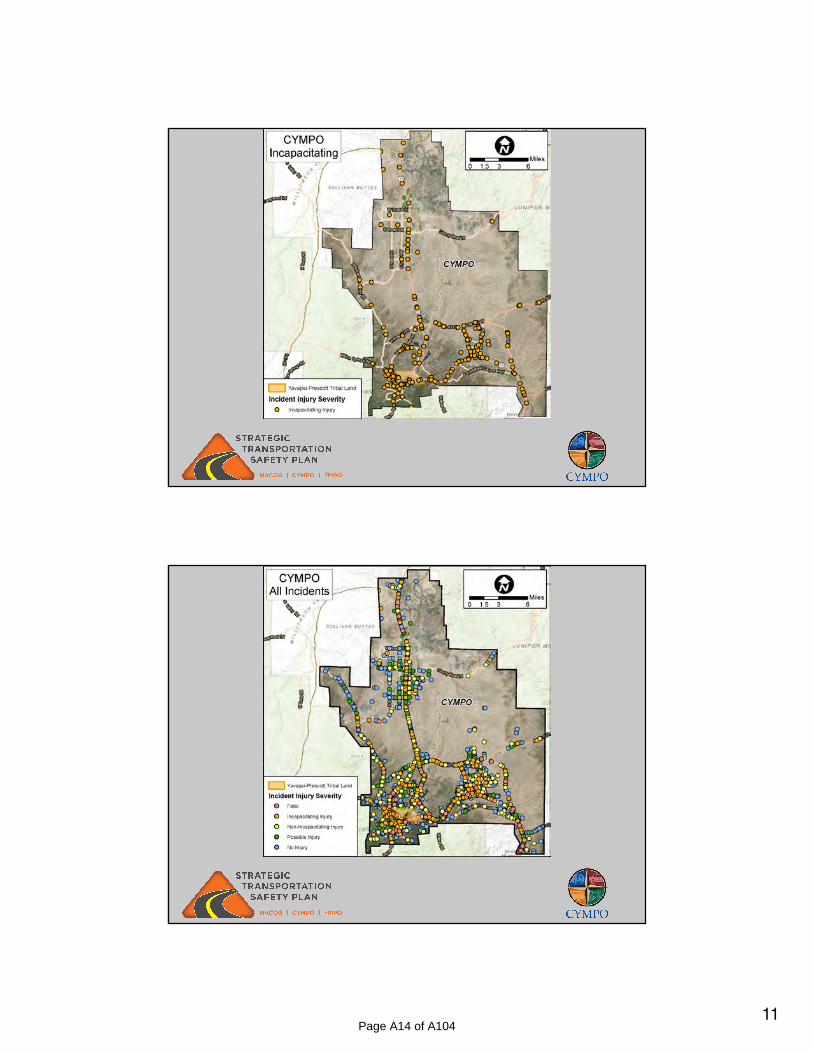
11Page A14 of A104

12Page A15 of A104
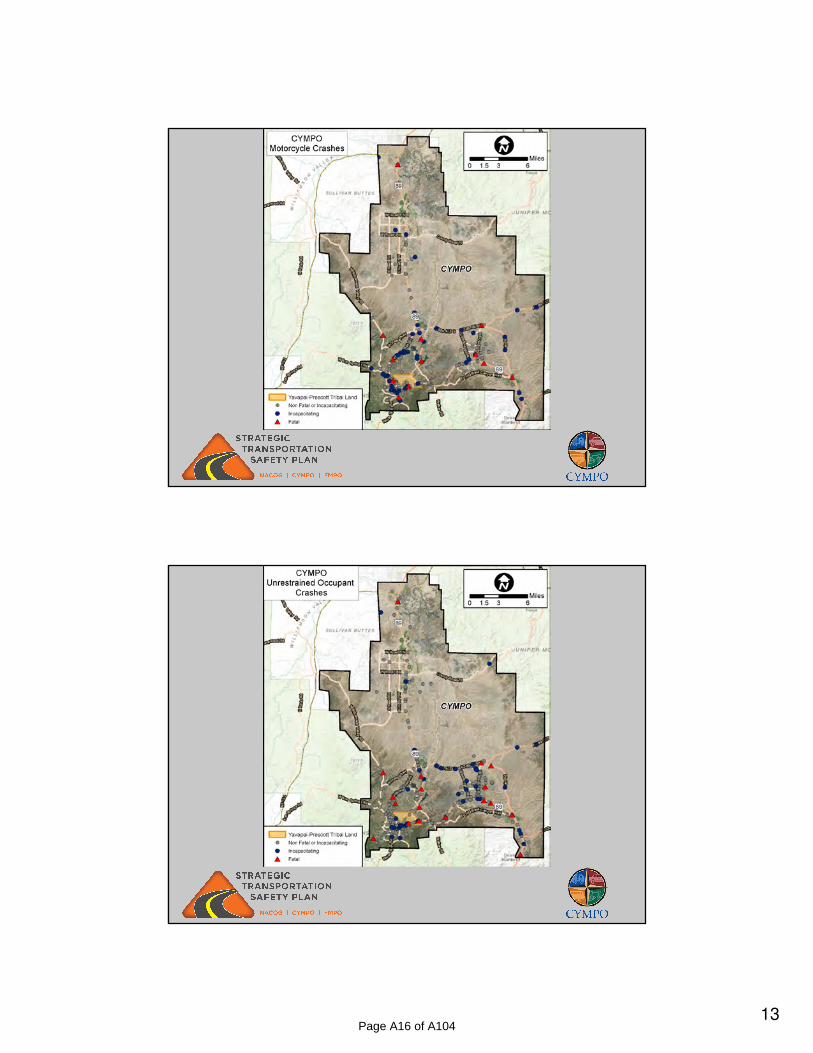
13Page A16 of A104
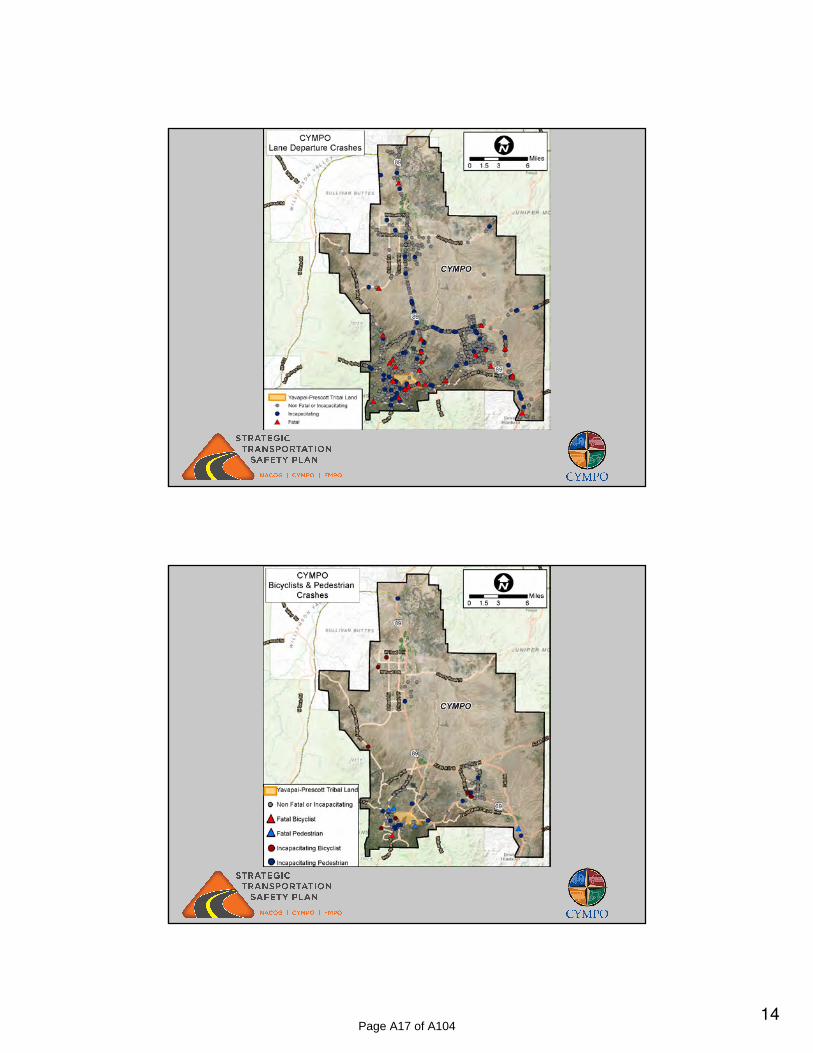
14Page A17 of A104
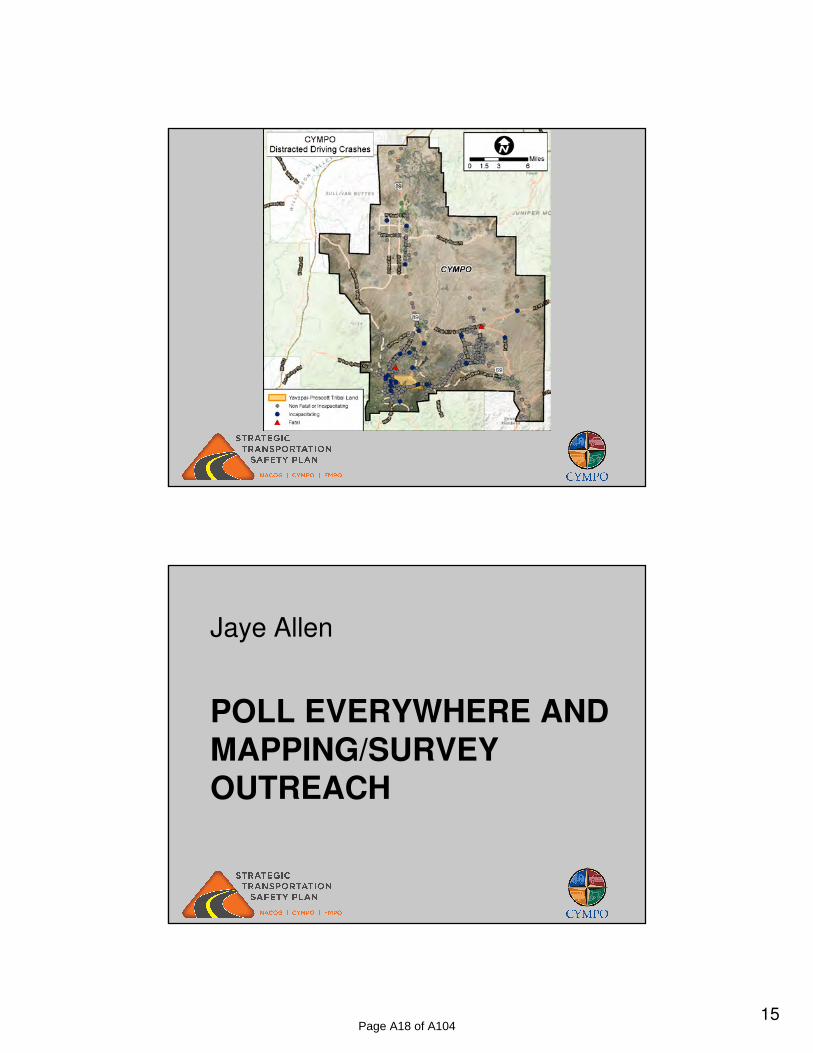
15
POLL EVERYWHERE ANDMAPPING/SURVEY OUTREACH
Jaye Allen
Page A18 of A104
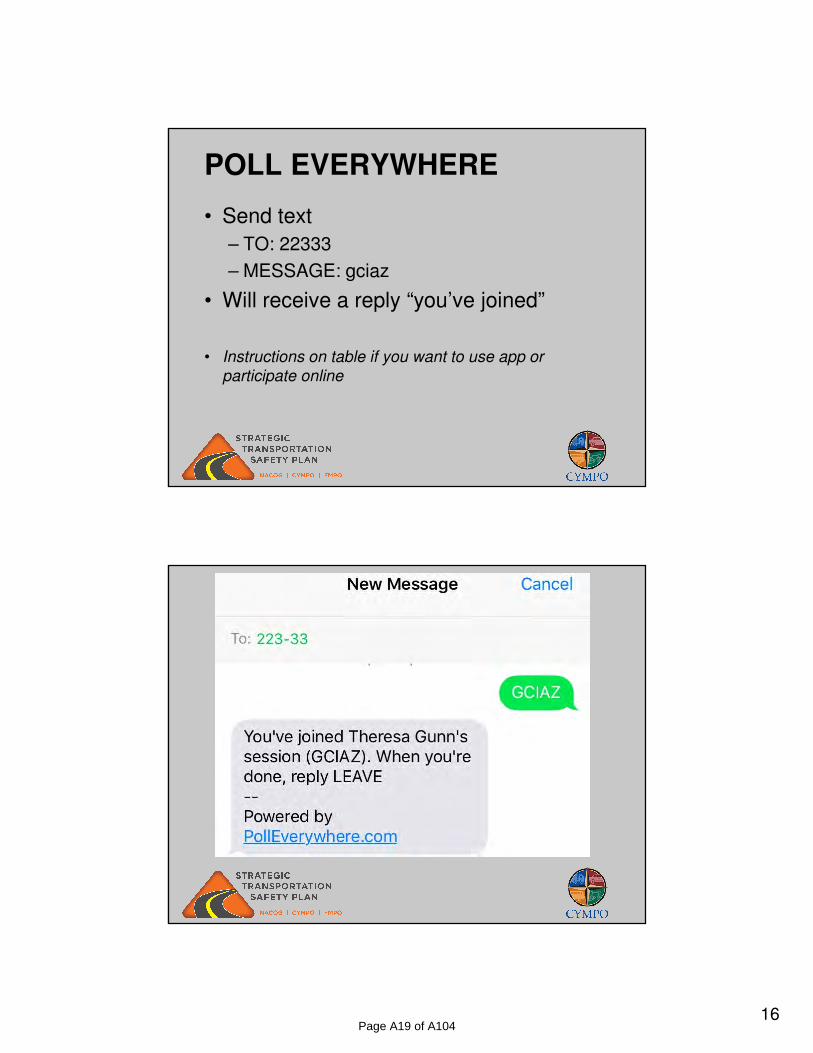
16
POLL EVERYWHERE
• Send text
– TO: 22333
– MESSAGE: gciaz
• Will receive a reply “you’ve joined”
• Instructions on table if you want to use app or
participate online
Page A19 of A104
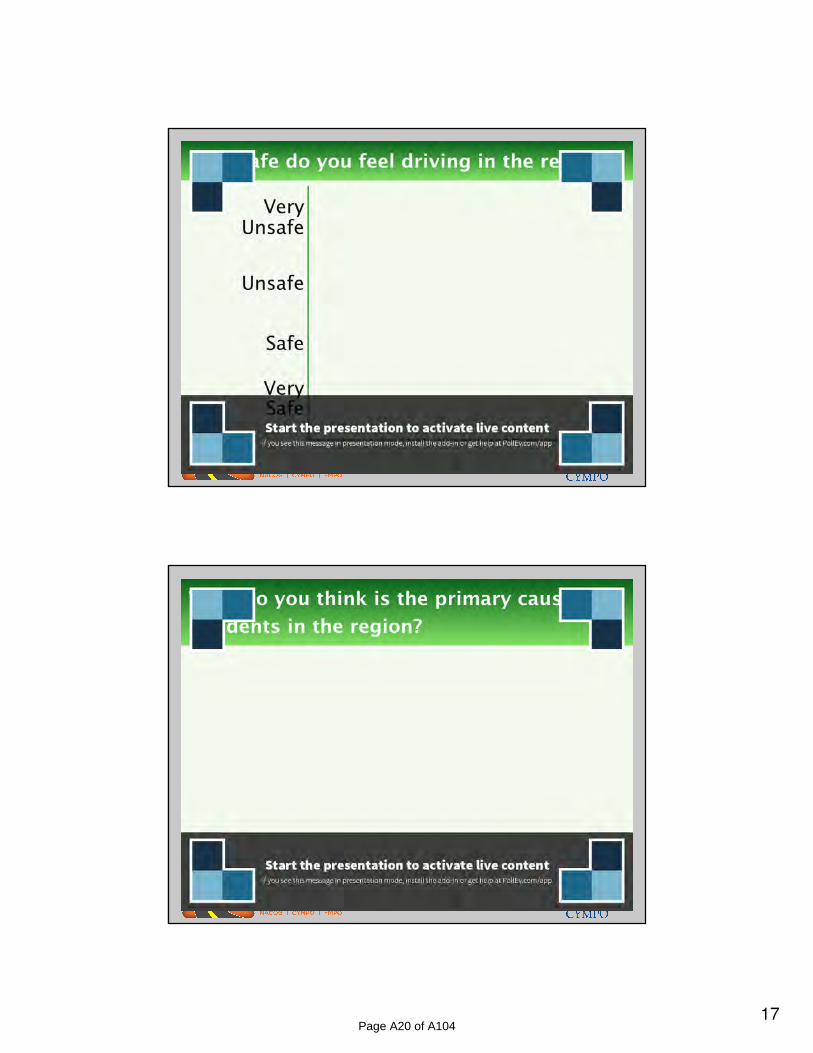
17Page A20 of A104

18
Survey Monkey and Social Pinpoint
https://www.surveymonkey.com/r/CYMPO
Page A21 of A104
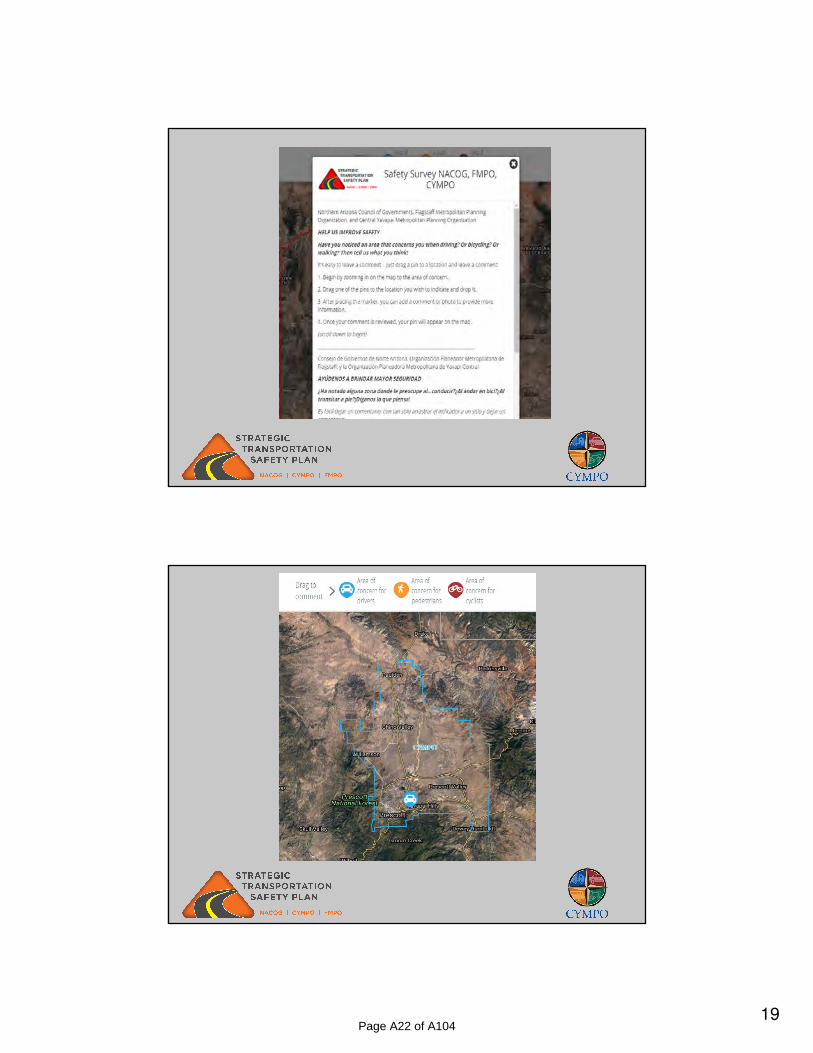
19Page A22 of A104

20
STSP VISION AND GOAL
Small Group Exercise
Page A23 of A104
21
Nevada DOT Video
National, State, Regional Visions
• FHWA Vision
Towards zero deaths and serious injuries on the Nation’s roadways.
• Arizona Vision
Towards zero deaths by reducing crashes for a safer Arizona.
• MAG Vision
Zero deaths - Zero Injuries.
Page A24 of A104
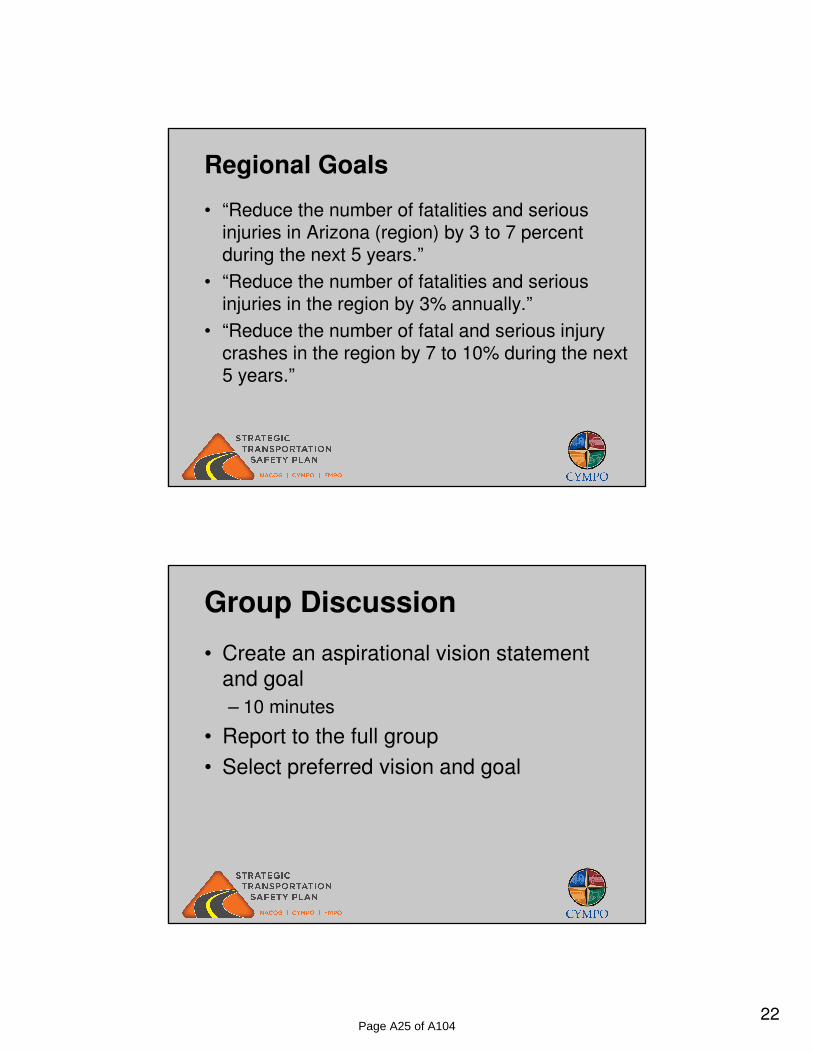
22
Regional Goals
• “Reduce the number of fatalities and serious injuries in Arizona (region) by 3 to 7 percent during the next 5 years.”
• “Reduce the number of fatalities and serious injuries in the region by 3% annually.”
• “Reduce the number of fatal and serious injury crashes in the region by 7 to 10% during the next 5 years.”
Group Discussion
• Create an aspirational vision statement
and goal
– 10 minutes
• Report to the full group
• Select preferred vision and goal
Page A25 of A104
23
NEXT STEPS
Chris Bridges
Next Steps
• Launching online survey and mapping
https://www.surveymonkey.com/r/cympo
• Network screening – Fall 2017
• Predictive analysis – Fall 2017
• Countermeasure development – Winter 2017
• Benefit to cost ratio and draft report – Spring 2018
Page A26 of A104
24
QUESTIONS / COMMENTS
Thank you for participating!
Page A27 of A104
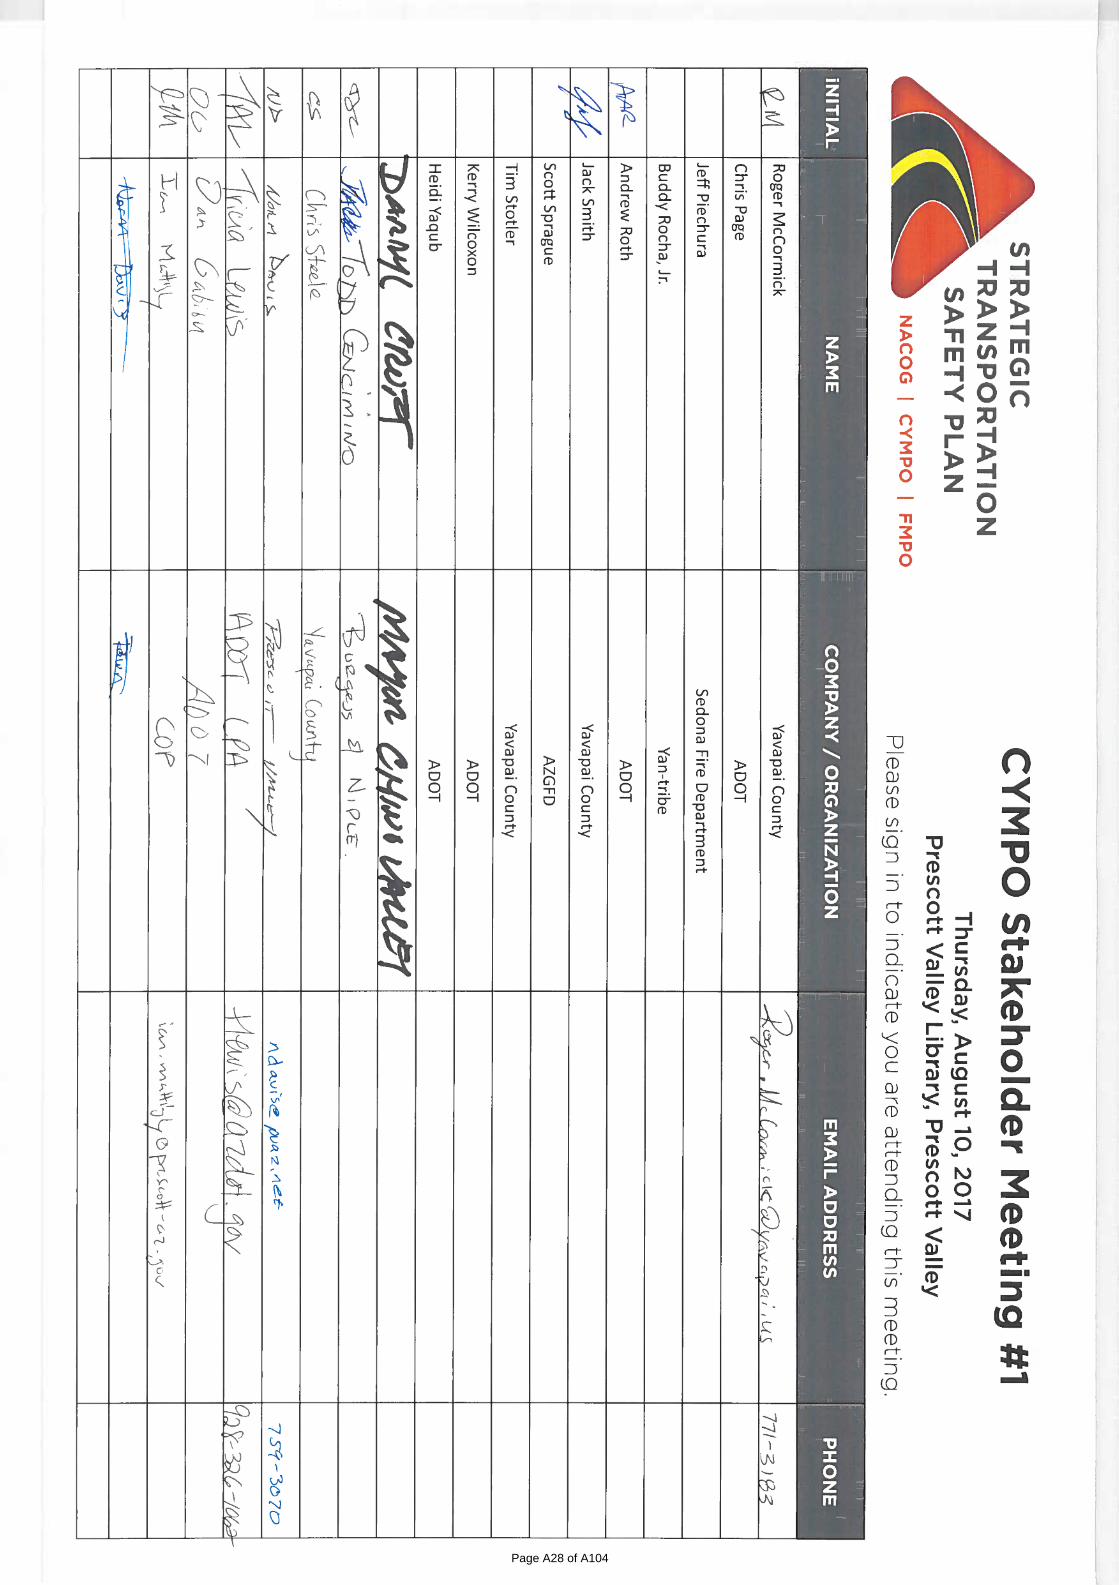
Page A28 of A104
NACOG Regional Strategic Transportation Safety Plan
1
CYMPO Stakeholder Meeting #1
DATE/TIME: August 10, 2017 – 8:00 am – 9:30 am
LOCATION: Prescott Valley Library, 7401 E Civic Circle, Prescott Valley
Attendees Stakeholders
Roger McCormick, Yavapai County
Andrew Roth, ADOT
Jack Smith, Yavapai County
Darryl Croft, Chino Valley
Chris Steele, Yavapai County
Norm Davis, Prescott Valley
Tricia Lewis, ADOT LPA
Dan Gabion, ADOT
Ian Mattingly, City of Prescott
Cynthia Gentle, Yavapai County
Bahram Dariush, ADOT
Dale Allen, Prescott
Project Team
Chris Bridges, CYMPO
Vincent Gallegos, CYMPO
Ravi Ambadipudi, Burgess & Niple
Dana Biscan, Burgess & Niple
Todd Cencimino, Burgess & Niple
Jaye Allen, GCI
Brock Barnhart, GCI
Welcome and Introductions
Chris Bridges Allen welcomed the group and introduced study team members in attendance. Mr. Bridges
thanked attendees for participating and explained the purpose of the study. He invited attendees to introduce
themselves by name and organizational affiliation.
Presentation
Bahram Dariush presented a brief description of a Strategic Transportation Safety Plan (STSP). Dana Biscan provided information on the study process and the data that has been gathered and generated, including: crash trends, statistics on emphasis areas and the first harmful events, at fault behavior and crashes by collision manner. Ms. Biscan then presented various maps showing crash locations. Jaye Allen provided an overview of the community outreach approach and requested attendees join a Poll Everywhere, real‐time electronic poll to provide their feedback on questions related to the attendees’ personal experiences as drivers in the region. Ms. Allen showed the group the Survey Monkey online surveys and the Social Pinpoint map commenting site that will be used during the summer and fall to obtain public input. Ms. Allen played a video from NDOT which underscores the importance of reducing fatal crashes. Ms. Albert requested attendees participate as a group in an exercise to brainstorm ideas for a study vision and goals. Results from the discussion are summarized below.
Page A29 of A104
NACOG Regional Strategic Transportation Safety Plan
2
Ms. Allen presented the project schedule, thanked the group for their participation and adjourned the meeting.
Group Discussion Results Vision Statements:
Reduction in fatalities for vehicles and bicyclists every year.
Agencies must involve community members to achieve goals.
The vision should be realistic and measurable.
Overarching Goals:
With continued growth expected in the Prescott area, we must focus on safety improvements now and
for the future.
Agencies and communities must work together toward the goal of Zero Deaths.
Data collection and report findings will be helpful in defining goals and creating further visioning.
Page A30 of A104
NACOG Strategic Transportation
Safety Survey
CYMPO Area Report
MAY 2018
PREPARED BY:
ON BEHALF OF:
Page A31 of A104
NACOG Regional Strategic Transportation Safety Plan – CYMPO Survey Report MAY 2018
2
INTRODUCTION
As the Northern Arizona and Central Yavapai County areas’ population and traffic congestion grow,
safety has emerged as a critical issue. The Northern Arizona Council of Governments (NACOG), Central Yavapai Metropolitan Planning Organization (CYMPO) and the Flagstaff Metropolitan Planning Organization (FMPO) are collaborating to develop a Regional Strategic Transportation Safety Plan
(RSTSP).
The RSTSP is being developed to reduce risk of death and serious injury on roadways by identifying and prioritizing hazards and hazard areas, and developing and implementing projects to mitigate the hazards.
Page A32 of A104

NACOG Regional Strategic Transportation Safety Plan – CYMPO Survey Report MAY 2018
3
1. OVERVIEW
The purpose of the Strategic Transportation Safety Plan Survey is to seek input from the public in identifying hazards. Information obtained through the survey and other sources will be used to customize the approach for the planning process to meet the unique needs of the community.
Three specific groups are addressed:
Those included in the Northern Arizona Council of Governments area, which includes the CYMPO and FMPO areas as well as Apache, Coconino, Navajo and Yavapai counties.
Those included in the Central Yavapai Metropolitan Planning Organization area only. Those included in the Flagstaff Metropolitan Planning Organization area only.
This report summarizes the experiences of stakeholders who responded to the CYMPO-area meetings and survey opportunities. Additional reports that summarize the experiences of those in the FMPO-area and the NACOG area as a whole are available separately.
This report includes information on the survey process (Section 2) including dates responses were received and survey notification methods. Survey results (Section 3), includes summary information and conclusions for each question. Complete responses and verbatim answers to questions are shown in survey responses (Section 4).
KEY ISSUES
The majority of survey respondents lives in Prescott and Prescott Valley and is between 55 and 74 years old. More men than women responded to the survey. The majority of respondents are motorists.
Key issues identified include:
Most people feel safe traveling in the community. The majority of residents believe the roadways in the region are safe for drivers. However, they
don’t believe it is safe for bicyclists, the elderly or disabled, youths, pedestrians, or motorcyclists. Respondents believe the community exhibits safety attitudes to some extent toward drivers, but
vulnerable road users are left out. Four key factors observed – each by 92% of respondents or more – include distracted driving,
speeding, failure to yield to other cars/bicyclists/pedestrians, and failure to stop at traffic signals and signs.
Driver behaviors reported by more than half of respondents included distracted, inattentive, and hurried.
The majority of motorists report feeling unsafe around pedestrians or cyclists to some degree. Nearly half of community members believe distracted driving, primarily from cell phone use,
causes crashes. Speeding/impatience is also cited as a significant cause of crashes. Suggestions to increase safety include infrastructure improvements such as new/improved roads,
traffic lights and signal timing, better signage and lane striping. Other suggestions include cell phone laws and enforcement of existing laws.
Page A33 of A104
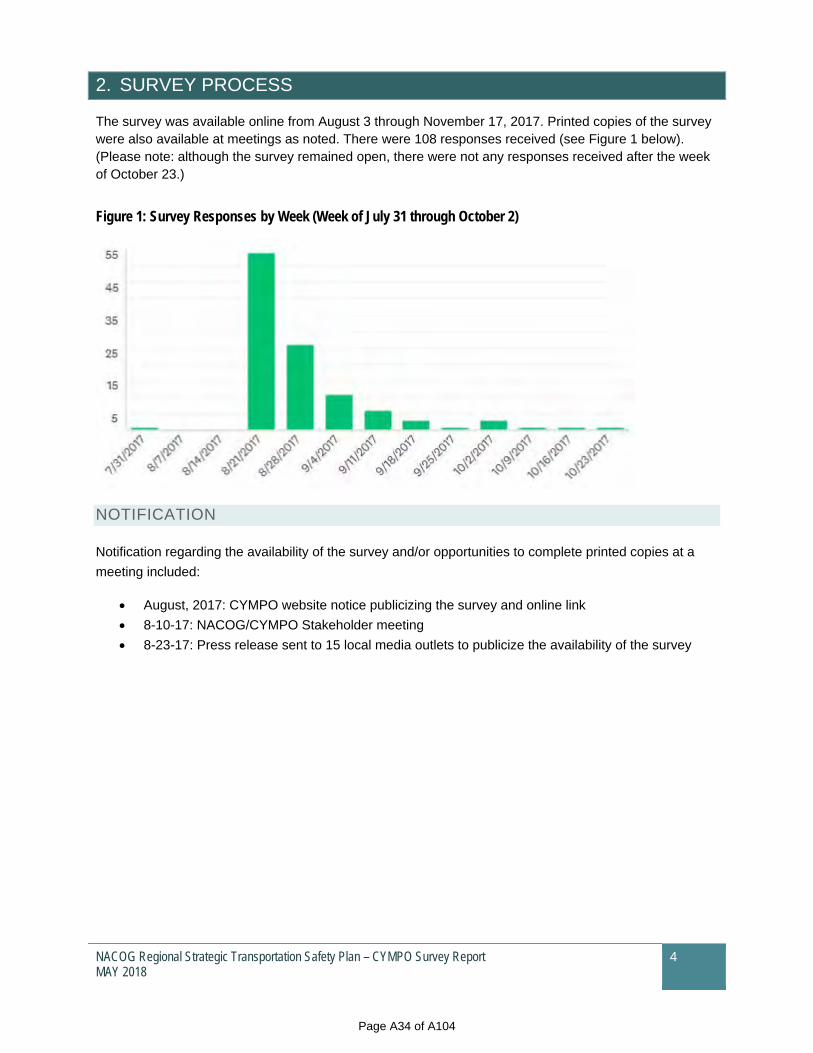
NACOG Regional Strategic Transportation Safety Plan – CYMPO Survey Report MAY 2018
4
2. SURVEY PROCESS
The survey was available online from August 3 through November 17, 2017. Printed copies of the survey were also available at meetings as noted. There were 108 responses received (see Figure 1 below). (Please note: although the survey remained open, there were not any responses received after the week of October 23.)
Figure 1: Survey Responses by Week (Week of July 31 through October 2)
NOTIFICATION
Notification regarding the availability of the survey and/or opportunities to complete printed copies at a
meeting included:
August, 2017: CYMPO website notice publicizing the survey and online link
8-10-17: NACOG/CYMPO Stakeholder meeting
8-23-17: Press release sent to 15 local media outlets to publicize the availability of the survey
Page A34 of A104
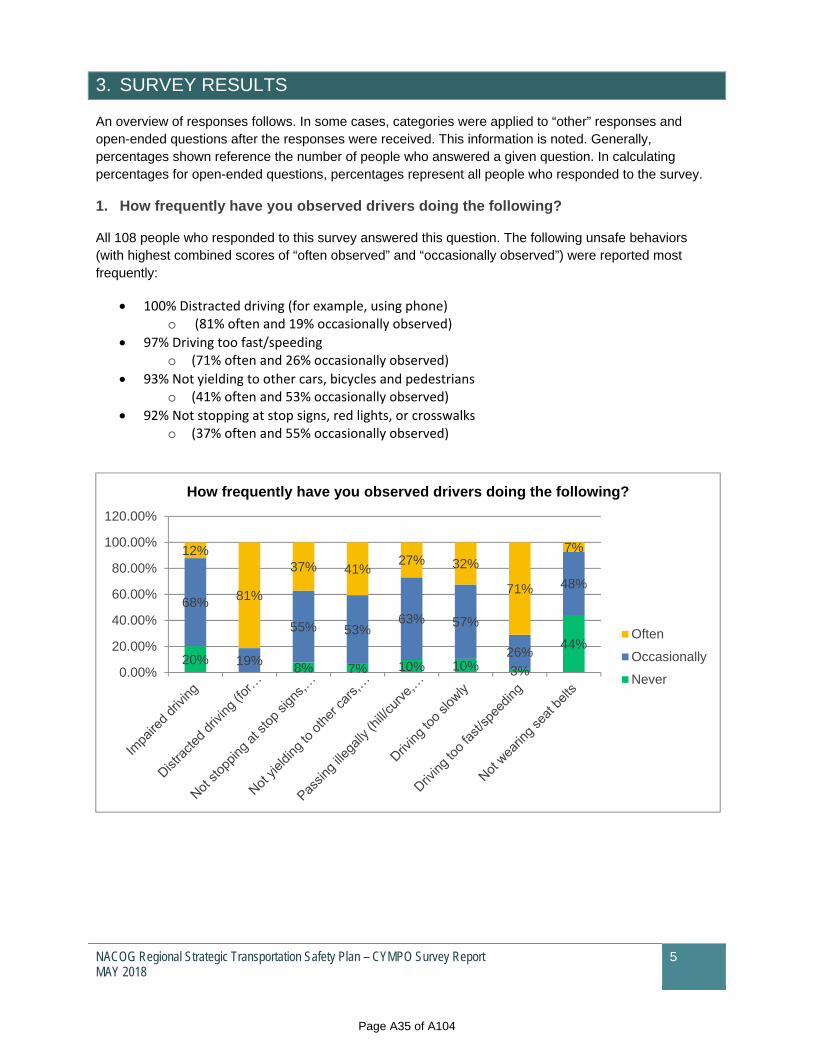
NACOG Regional Strategic Transportation Safety Plan – CYMPO Survey Report MAY 2018
5
3. SURVEY RESULTS
An overview of responses follows. In some cases, categories were applied to “other” responses and open-ended questions after the responses were received. This information is noted. Generally, percentages shown reference the number of people who answered a given question. In calculating percentages for open-ended questions, percentages represent all people who responded to the survey.
1. How frequently have you observed drivers doing the following?
All 108 people who responded to this survey answered this question. The following unsafe behaviors (with highest combined scores of “often observed” and “occasionally observed”) were reported most frequently:
100% Distracted driving (for example, using phone) o (81% often and 19% occasionally observed)
97% Driving too fast/speeding o (71% often and 26% occasionally observed)
93% Not yielding to other cars, bicycles and pedestrians o (41% often and 53% occasionally observed)
92% Not stopping at stop signs, red lights, or crosswalks o (37% often and 55% occasionally observed)
20%8% 7% 10% 10% 3%
44%
68%
19%
55% 53%63% 57%
26%
48%
12%
81%
37% 41%27% 32%
71%
7%
0.00%
20.00%
40.00%
60.00%
80.00%
100.00%
120.00%
How frequently have you observed drivers doing the following?
Often
Occasionally
Never
Page A35 of A104
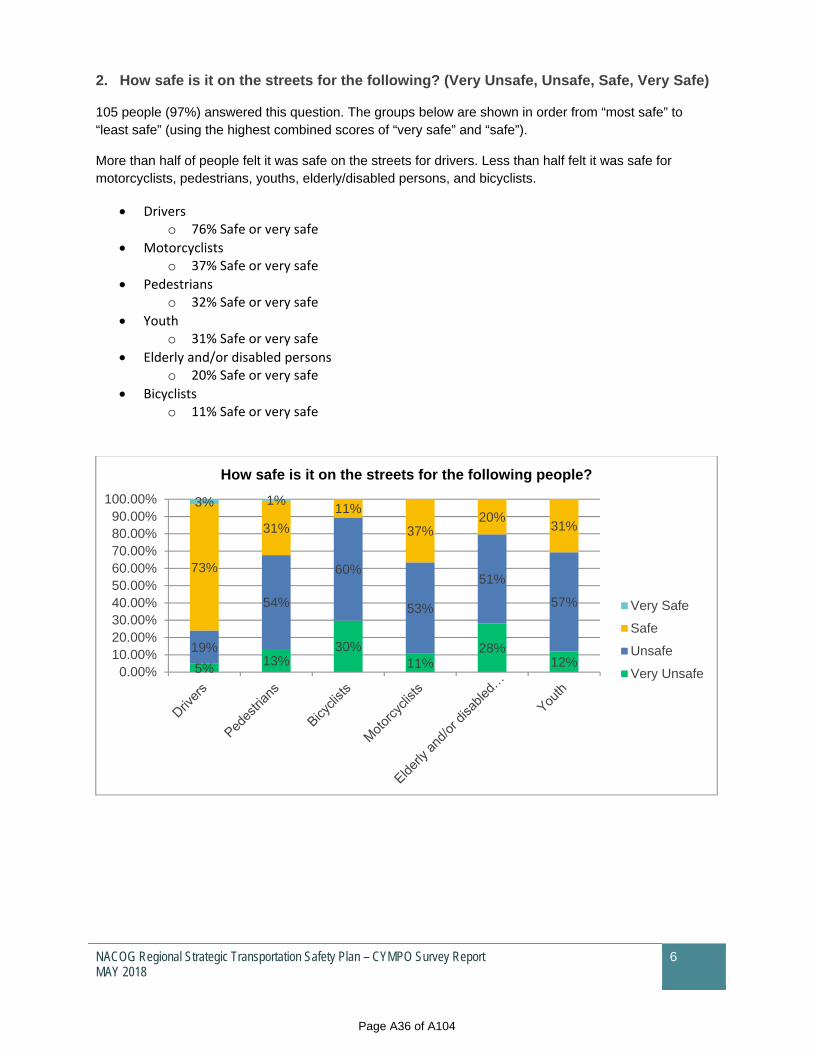
NACOG Regional Strategic Transportation Safety Plan – CYMPO Survey Report MAY 2018
6
2. How safe is it on the streets for the following? (Very Unsafe, Unsafe, Safe, Very Safe)
105 people (97%) answered this question. The groups below are shown in order from “most safe” to “least safe” (using the highest combined scores of “very safe” and “safe”).
More than half of people felt it was safe on the streets for drivers. Less than half felt it was safe for motorcyclists, pedestrians, youths, elderly/disabled persons, and bicyclists.
Drivers o 76% Safe or very safe
Motorcyclists o 37% Safe or very safe
Pedestrians o 32% Safe or very safe
Youth o 31% Safe or very safe
Elderly and/or disabled persons o 20% Safe or very safe
Bicyclists o 11% Safe or very safe
5% 13%30%
11%28%
12%19%
54%
60%
53%
51%
57%
73%
31%
11%
37%20%
31%
3% 1%
0.00%10.00%20.00%30.00%40.00%50.00%60.00%70.00%80.00%90.00%
100.00%
How safe is it on the streets for the following people?
Very Safe
Safe
Unsafe
Very Unsafe
Page A36 of A104

NACOG Regional Strategic Transportation Safety Plan – CYMPO Survey Report MAY 2018
7
3. How safe do you feel traveling in the community?
Approximately 96% (104 people) responded to this question.
Most people (62%) feel safe traveling in the community, with 58% reporting that they feel safe and 4% reporting that they feel very safe. The remaining 39% of respondents reported feeling unsafe (33%) or very unsafe (6%).
6%
33%
58%
4%
Very Unsafe Unsafe Safe Very Safe0.00%
10.00%
20.00%
30.00%
40.00%
50.00%
60.00%
70.00%
How safe do you feel traveling in the community?
Page A37 of A104
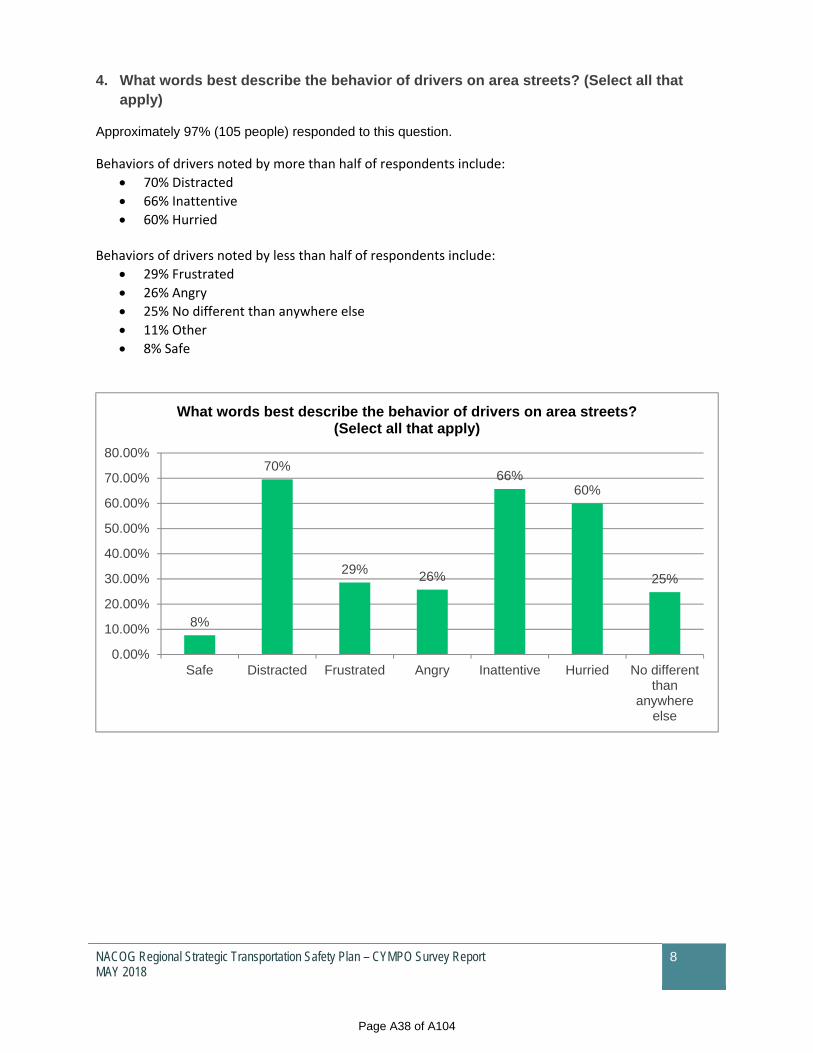
NACOG Regional Strategic Transportation Safety Plan – CYMPO Survey Report MAY 2018
8
4. What words best describe the behavior of drivers on area streets? (Select all that apply)
Approximately 97% (105 people) responded to this question.
Behaviors of drivers noted by more than half of respondents include:
70% Distracted
66% Inattentive
60% Hurried Behaviors of drivers noted by less than half of respondents include:
29% Frustrated
26% Angry
25% No different than anywhere else
11% Other
8% Safe
8%
70%
29% 26%
66%60%
25%
Safe Distracted Frustrated Angry Inattentive Hurried No differentthan
anywhereelse
0.00%
10.00%
20.00%
30.00%
40.00%
50.00%
60.00%
70.00%
80.00%
What words best describe the behavior of drivers on area streets? (Select all that apply)
Page A38 of A104
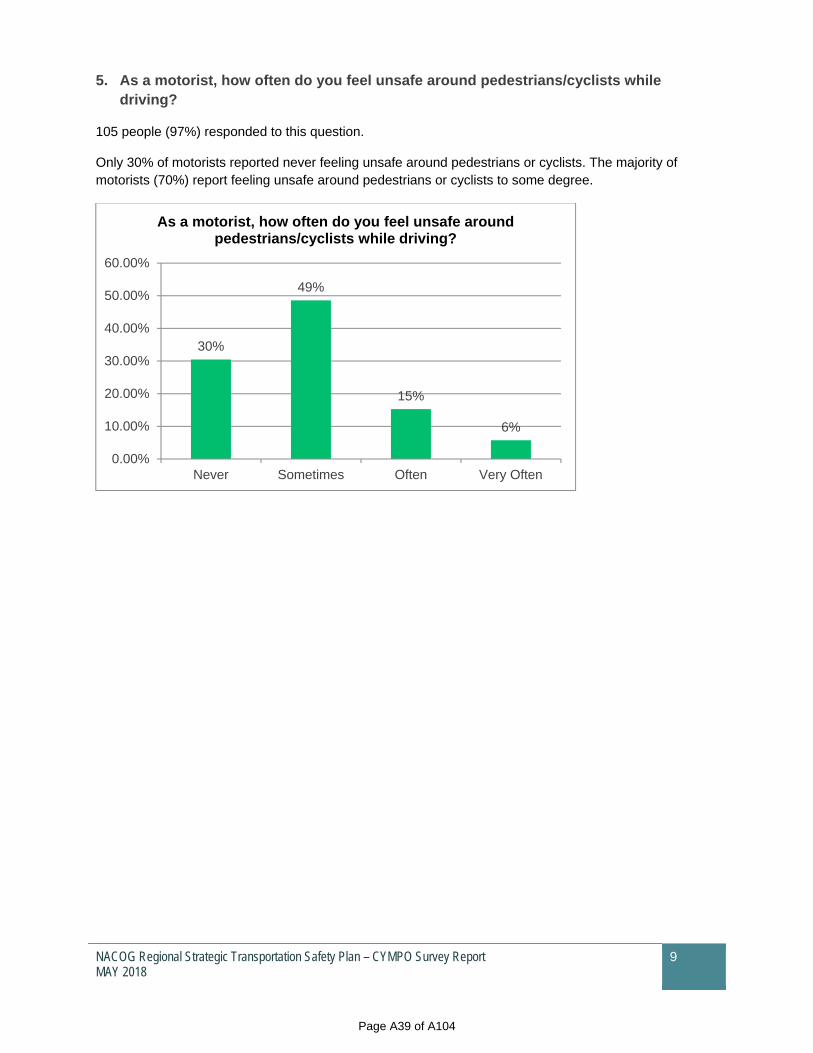
NACOG Regional Strategic Transportation Safety Plan – CYMPO Survey Report MAY 2018
9
5. As a motorist, how often do you feel unsafe around pedestrians/cyclists while driving?
105 people (97%) responded to this question.
Only 30% of motorists reported never feeling unsafe around pedestrians or cyclists. The majority of motorists (70%) report feeling unsafe around pedestrians or cyclists to some degree.
30%
49%
15%
6%
Never Sometimes Often Very Often0.00%
10.00%
20.00%
30.00%
40.00%
50.00%
60.00%
As a motorist, how often do you feel unsafe around pedestrians/cyclists while driving?
Page A39 of A104
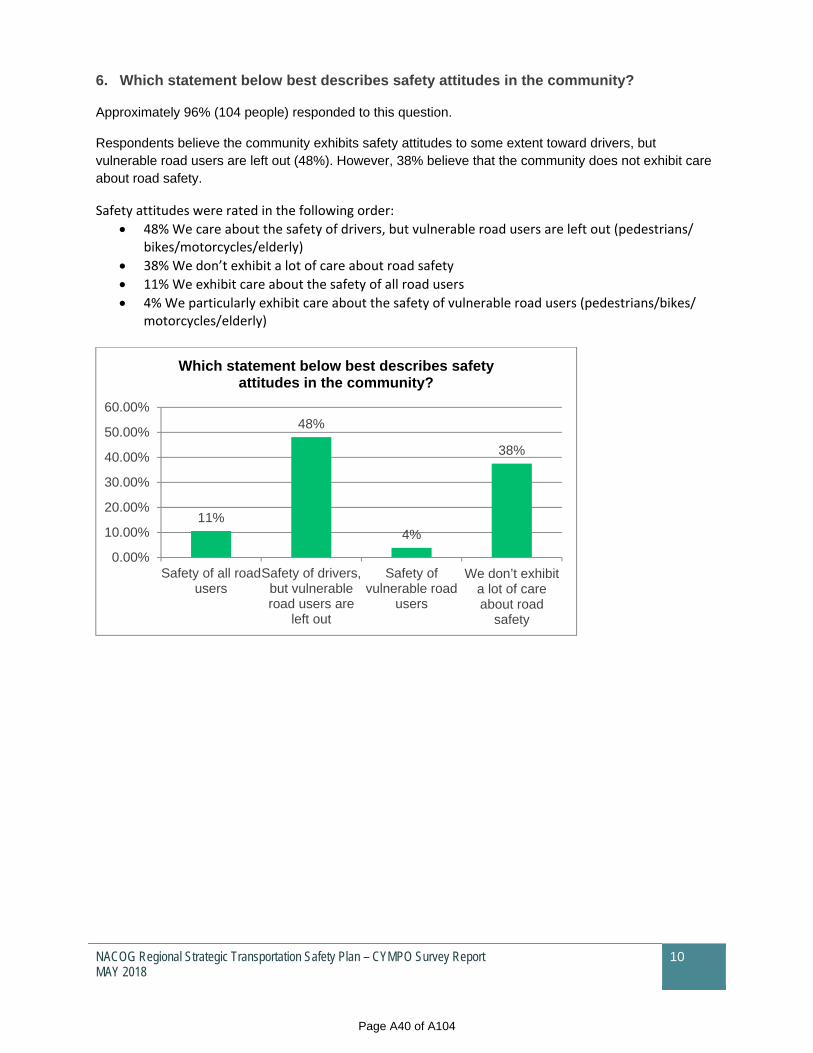
NACOG Regional Strategic Transportation Safety Plan – CYMPO Survey Report MAY 2018
10
6. Which statement below best describes safety attitudes in the community?
Approximately 96% (104 people) responded to this question.
Respondents believe the community exhibits safety attitudes to some extent toward drivers, but vulnerable road users are left out (48%). However, 38% believe that the community does not exhibit care about road safety.
Safety attitudes were rated in the following order:
48% We care about the safety of drivers, but vulnerable road users are left out (pedestrians/ bikes/motorcycles/elderly)
38% We don’t exhibit a lot of care about road safety
11% We exhibit care about the safety of all road users
4% We particularly exhibit care about the safety of vulnerable road users (pedestrians/bikes/ motorcycles/elderly)
11%
48%
4%
38%
Safety of all roadusers
Safety of drivers,but vulnerableroad users are
left out
Safety ofvulnerable road
users
We don’t exhibit a lot of care about road
safety
0.00%
10.00%
20.00%
30.00%
40.00%
50.00%
60.00%
Which statement below best describes safety attitudes in the community?
Page A40 of A104

NACOG Regional Strategic Transportation Safety Plan – CYMPO Survey Report MAY 2018
11
7. What do you think is the primary cause of crashes in the area? (Open-ended)
Approximately 88% (95 people) responded to this question. Categories indicated below were applied during analysis and were not part of the survey process. Verbatim answers are available in Section 4, Survey Responses.
Nearly half on all respondents (44%) indicated that distracted driving was a cause of crashes. The only other behavior reported at a notable percentage was speeding/hurried/impatient driving (28%).
44% Distracted driving, including inattentiveness and cell phone use
28% Speeding/hurried/impatient
10% Other behaviors
6% Other
8. What do you think needs to be changed to make it safer to travel? (Open-ended)
Approximately 87% (94 people) responded to this question. Categories indicated below were applied during analysis and were not part of the survey process. Verbatim answers are available in Section 4, Survey Responses.
Approximately 24% of respondents provided suggestion that would involve infrastructure improvements including new and improved roads (15%) or other improvements (9%) such as traffic lights and traffic light timing, better signage and lane striping. The next most significant response categories included cell phone laws (17%) as well as enforcement (16%).
18% Other
17% Cell phone laws
16% Enforcement
15% Infrastructure including new/improved roads
9% Infrastructure including traffic lights/timing, signs, striping
6% Education
4% Maintenance
4% Other bicyclist/pedestrian issues
Page A41 of A104
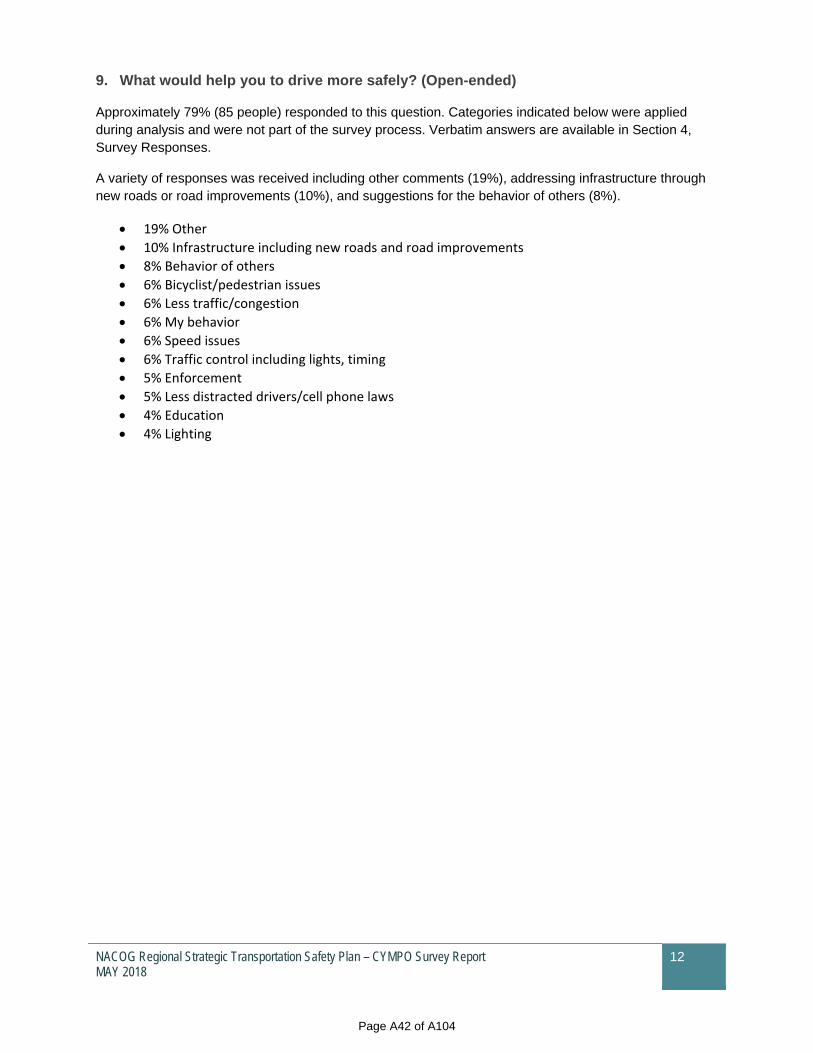
NACOG Regional Strategic Transportation Safety Plan – CYMPO Survey Report MAY 2018
12
9. What would help you to drive more safely? (Open-ended)
Approximately 79% (85 people) responded to this question. Categories indicated below were applied during analysis and were not part of the survey process. Verbatim answers are available in Section 4, Survey Responses.
A variety of responses was received including other comments (19%), addressing infrastructure through new roads or road improvements (10%), and suggestions for the behavior of others (8%).
19% Other
10% Infrastructure including new roads and road improvements
8% Behavior of others
6% Bicyclist/pedestrian issues
6% Less traffic/congestion
6% My behavior
6% Speed issues
6% Traffic control including lights, timing
5% Enforcement
5% Less distracted drivers/cell phone laws
4% Education
4% Lighting
Page A42 of A104
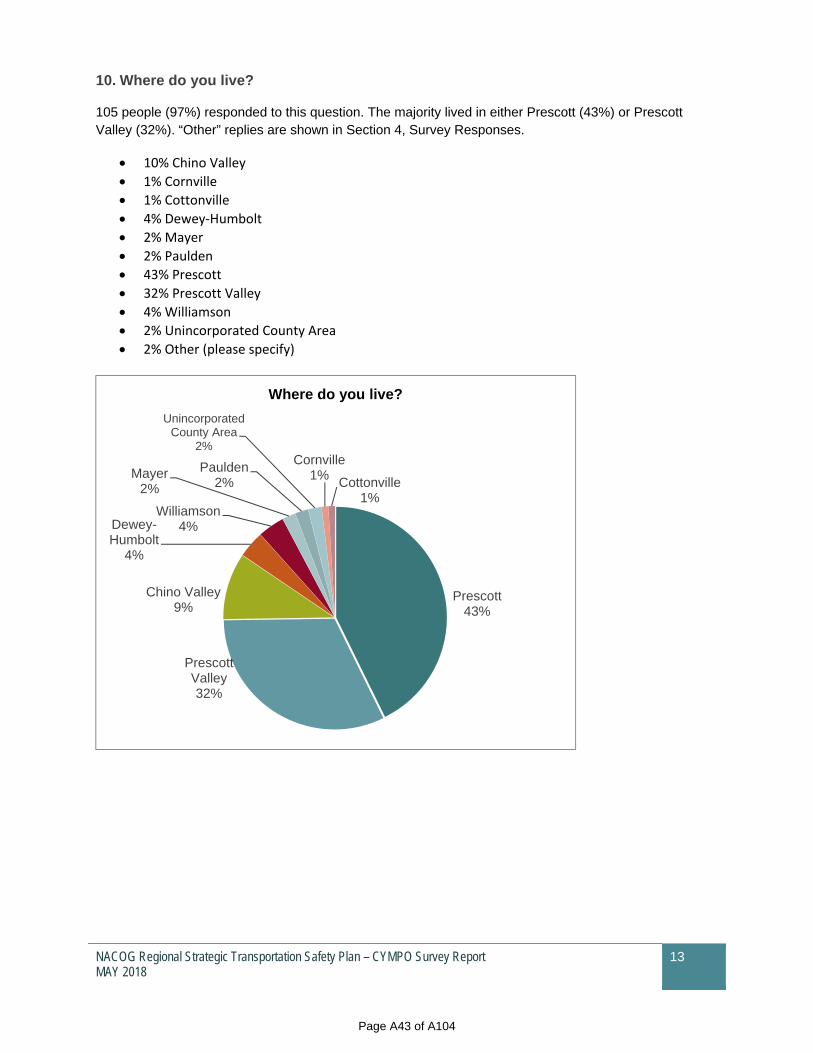
NACOG Regional Strategic Transportation Safety Plan – CYMPO Survey Report MAY 2018
13
10. Where do you live?
105 people (97%) responded to this question. The majority lived in either Prescott (43%) or Prescott Valley (32%). “Other” replies are shown in Section 4, Survey Responses.
10% Chino Valley
1% Cornville
1% Cottonville
4% Dewey‐Humbolt
2% Mayer
2% Paulden
43% Prescott
32% Prescott Valley
4% Williamson
2% Unincorporated County Area
2% Other (please specify)
Prescott43%
Prescott Valley32%
Chino Valley9%
Dewey-Humbolt
4%
Williamson4%
Mayer2%
Paulden2%
Unincorporated County Area
2%Cornville
1% Cottonville1%
Where do you live?
Page A43 of A104

NACOG Regional Strategic Transportation Safety Plan – CYMPO Survey Report MAY 2018
14
11. Primarily, I'm responding as a...
Approximately 87% (159 people) responded to this question. The vast majority (81%) identified themselves as motorists. Those who selected “other” included users of multiple modes of transportation. “Other” responses are provided verbatim in Section 4, Survey Responses.
75% Motorist
18% Bicyclist
1% Pedestrian
7% Other
75%
18%
1%7%
Motorist Bicyclist Pedestrian Other (pleasespecify)
0.00%
10.00%
20.00%
30.00%
40.00%
50.00%
60.00%
70.00%
80.00%
Primarily, I'm responding as a...
Page A44 of A104
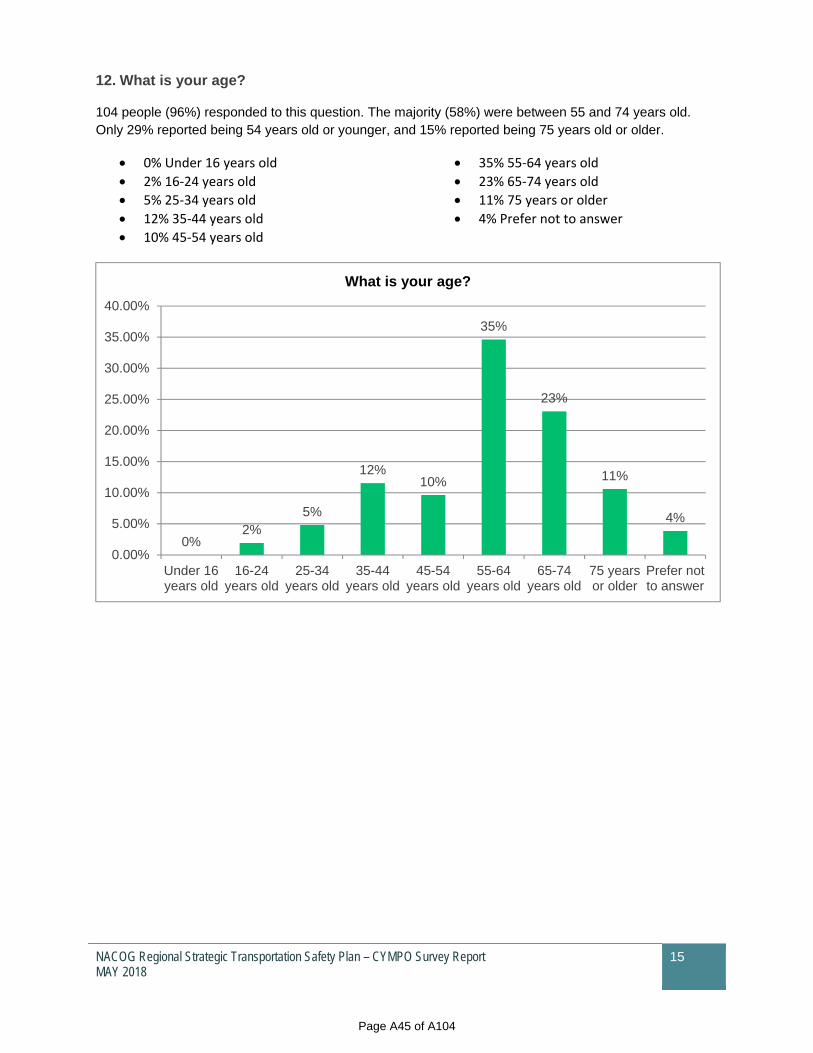
NACOG Regional Strategic Transportation Safety Plan – CYMPO Survey Report MAY 2018
15
12. What is your age?
104 people (96%) responded to this question. The majority (58%) were between 55 and 74 years old. Only 29% reported being 54 years old or younger, and 15% reported being 75 years old or older.
0% Under 16 years old
2% 16‐24 years old
5% 25‐34 years old
12% 35‐44 years old
10% 45‐54 years old
35% 55‐64 years old
23% 65‐74 years old
11% 75 years or older
4% Prefer not to answer
0%2%
5%
12%10%
35%
23%
11%
4%
Under 16years old
16-24years old
25-34years old
35-44years old
45-54years old
55-64years old
65-74years old
75 yearsor older
Prefer notto answer
0.00%
5.00%
10.00%
15.00%
20.00%
25.00%
30.00%
35.00%
40.00%
What is your age?
Page A45 of A104
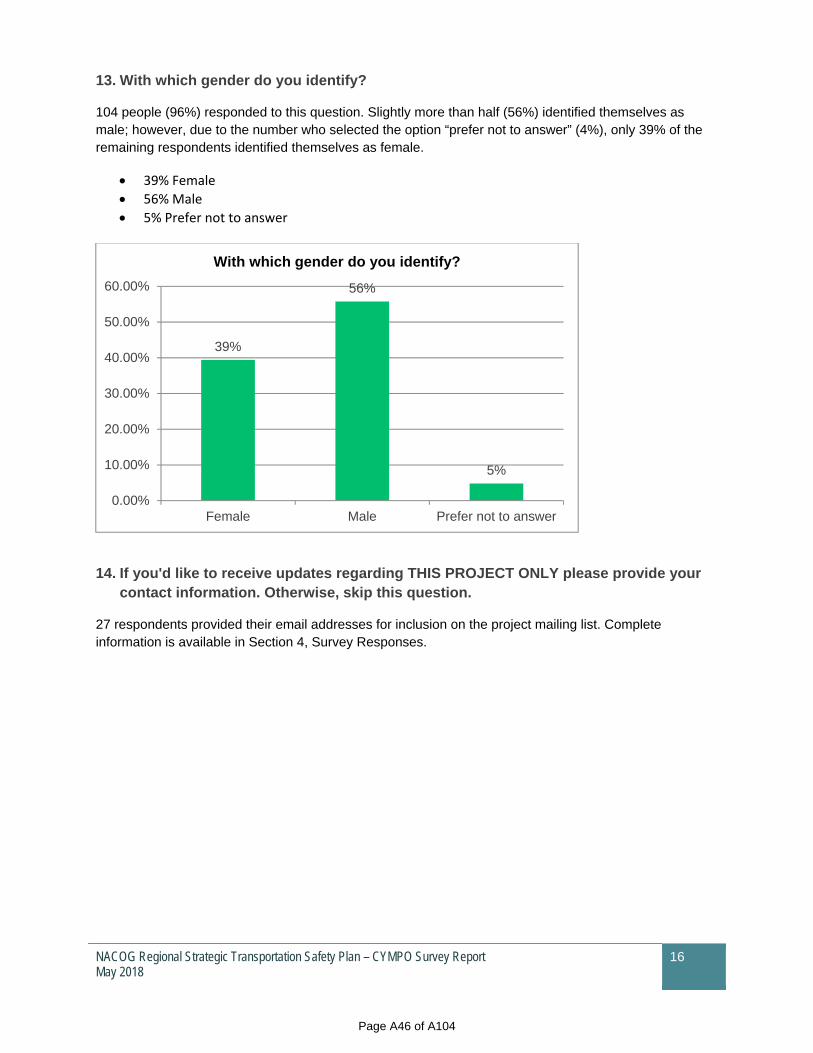
NACOG Regional Strategic Transportation Safety Plan – CYMPO Survey Report May 2018
16
13. With which gender do you identify?
104 people (96%) responded to this question. Slightly more than half (56%) identified themselves as male; however, due to the number who selected the option “prefer not to answer” (4%), only 39% of the remaining respondents identified themselves as female.
39% Female
56% Male
5% Prefer not to answer
14. If you'd like to receive updates regarding THIS PROJECT ONLY please provide your contact information. Otherwise, skip this question.
27 respondents provided their email addresses for inclusion on the project mailing list. Complete information is available in Section 4, Survey Responses.
39%
56%
5%
Female Male Prefer not to answer0.00%
10.00%
20.00%
30.00%
40.00%
50.00%
60.00%
With which gender do you identify?
Page A46 of A104
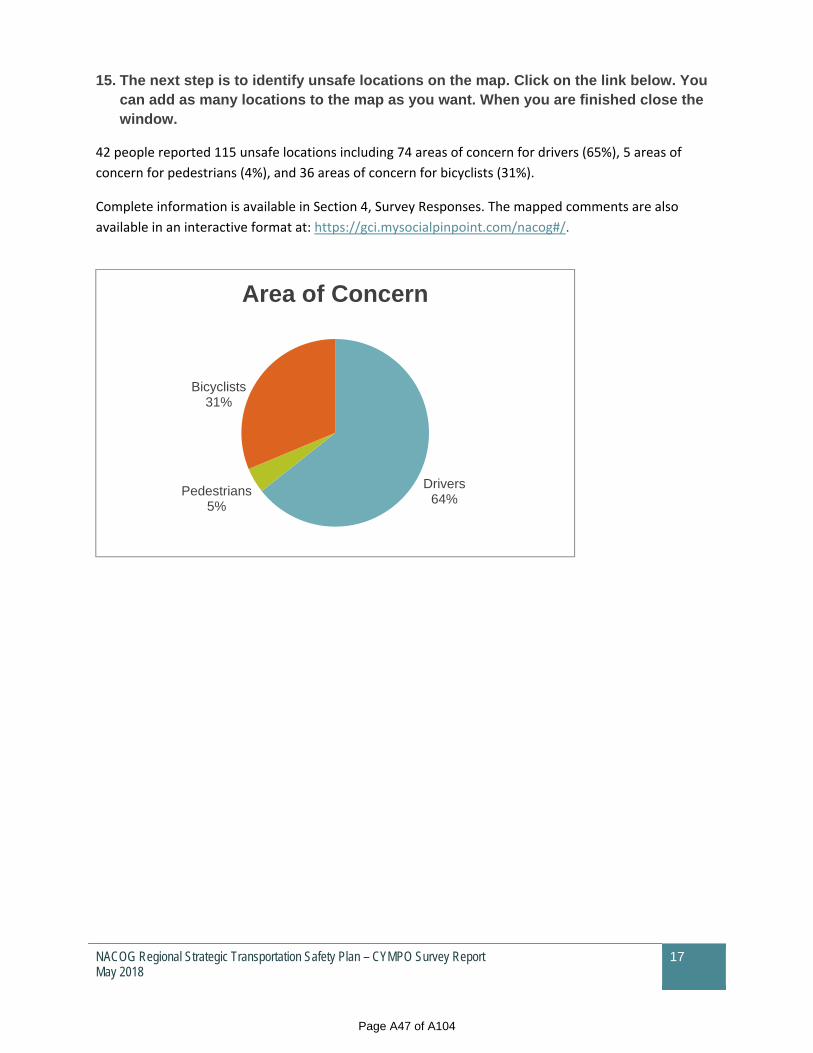
NACOG Regional Strategic Transportation Safety Plan – CYMPO Survey Report May 2018
17
15. The next step is to identify unsafe locations on the map. Click on the link below. You can add as many locations to the map as you want. When you are finished close the window.
42 people reported 115 unsafe locations including 74 areas of concern for drivers (65%), 5 areas of
concern for pedestrians (4%), and 36 areas of concern for bicyclists (31%).
Complete information is available in Section 4, Survey Responses. The mapped comments are also
available in an interactive format at: https://gci.mysocialpinpoint.com/nacog#/.
Drivers64%
Pedestrians5%
Bicyclists31%
Area of Concern
Page A47 of A104
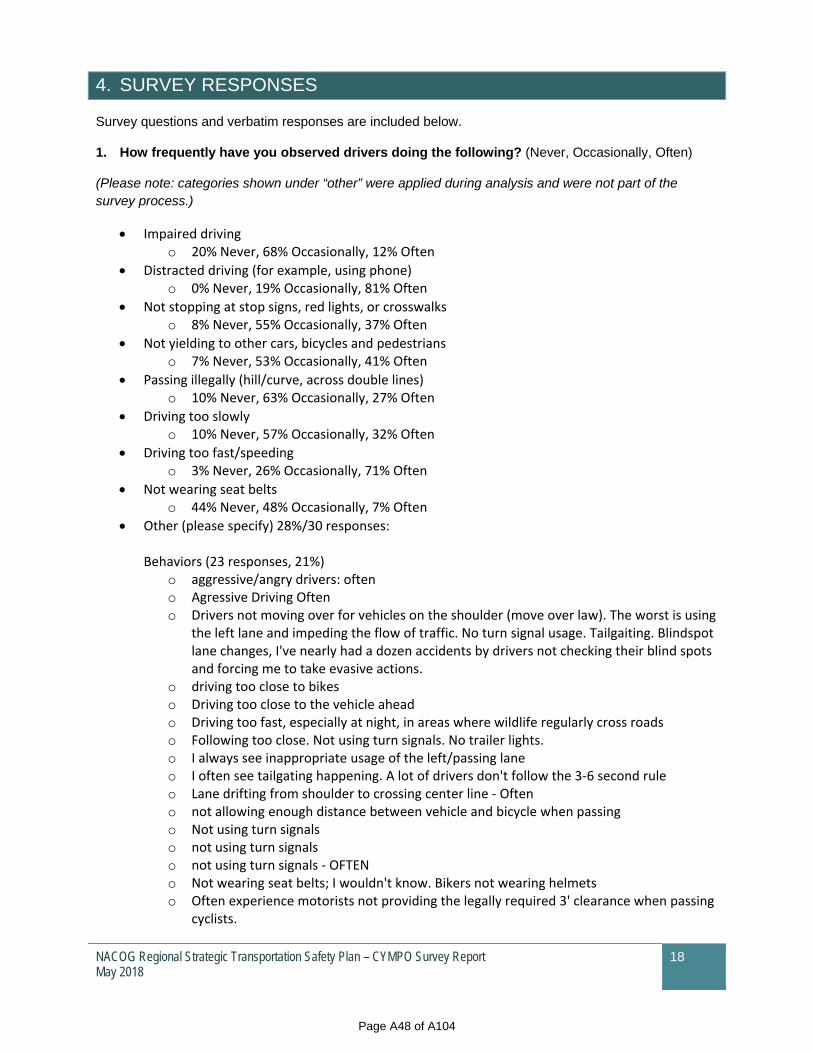
NACOG Regional Strategic Transportation Safety Plan – CYMPO Survey Report May 2018
18
4. SURVEY RESPONSES
Survey questions and verbatim responses are included below.
1. How frequently have you observed drivers doing the following? (Never, Occasionally, Often)
(Please note: categories shown under “other” were applied during analysis and were not part of the survey process.)
Impaired driving o 20% Never, 68% Occasionally, 12% Often
Distracted driving (for example, using phone) o 0% Never, 19% Occasionally, 81% Often
Not stopping at stop signs, red lights, or crosswalks o 8% Never, 55% Occasionally, 37% Often
Not yielding to other cars, bicycles and pedestrians o 7% Never, 53% Occasionally, 41% Often
Passing illegally (hill/curve, across double lines) o 10% Never, 63% Occasionally, 27% Often
Driving too slowly o 10% Never, 57% Occasionally, 32% Often
Driving too fast/speeding o 3% Never, 26% Occasionally, 71% Often
Not wearing seat belts o 44% Never, 48% Occasionally, 7% Often
Other (please specify) 28%/30 responses:
Behaviors (23 responses, 21%) o aggressive/angry drivers: often o Agressive Driving Often o Drivers not moving over for vehicles on the shoulder (move over law). The worst is using
the left lane and impeding the flow of traffic. No turn signal usage. Tailgaiting. Blindspot lane changes, I've nearly had a dozen accidents by drivers not checking their blind spots and forcing me to take evasive actions.
o driving too close to bikes o Driving too close to the vehicle ahead o Driving too fast, especially at night, in areas where wildlife regularly cross roads o Following too close. Not using turn signals. No trailer lights. o I always see inappropriate usage of the left/passing lane o I often see tailgating happening. A lot of drivers don't follow the 3‐6 second rule o Lane drifting from shoulder to crossing center line ‐ Often o not allowing enough distance between vehicle and bicycle when passing o Not using turn signals o not using turn signals o not using turn signals ‐ OFTEN o Not wearing seat belts; I wouldn't know. Bikers not wearing helmets o Often experience motorists not providing the legally required 3' clearance when passing
cyclists.
Page A48 of A104
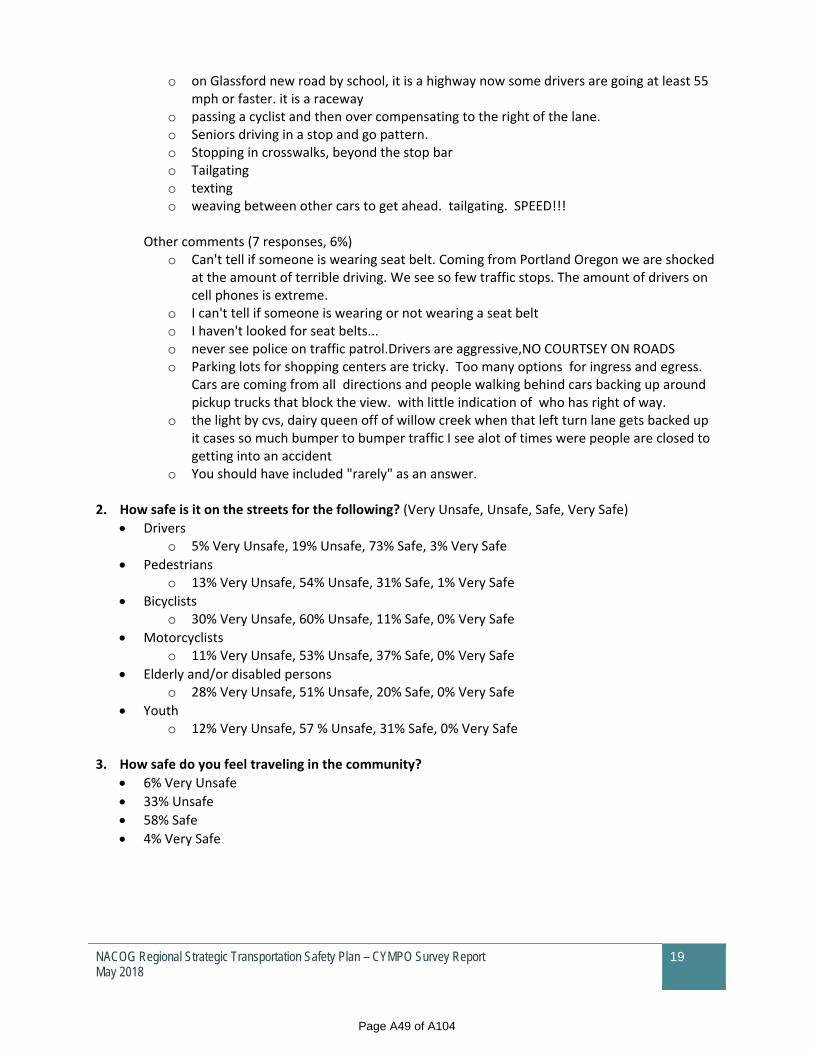
NACOG Regional Strategic Transportation Safety Plan – CYMPO Survey Report May 2018
19
o on Glassford new road by school, it is a highway now some drivers are going at least 55 mph or faster. it is a raceway
o passing a cyclist and then over compensating to the right of the lane. o Seniors driving in a stop and go pattern. o Stopping in crosswalks, beyond the stop bar o Tailgating o texting o weaving between other cars to get ahead. tailgating. SPEED!!!
Other comments (7 responses, 6%)
o Can't tell if someone is wearing seat belt. Coming from Portland Oregon we are shocked at the amount of terrible driving. We see so few traffic stops. The amount of drivers on cell phones is extreme.
o I can't tell if someone is wearing or not wearing a seat belt o I haven't looked for seat belts... o never see police on traffic patrol.Drivers are aggressive,NO COURTSEY ON ROADS o Parking lots for shopping centers are tricky. Too many options for ingress and egress.
Cars are coming from all directions and people walking behind cars backing up around pickup trucks that block the view. with little indication of who has right of way.
o the light by cvs, dairy queen off of willow creek when that left turn lane gets backed up it cases so much bumper to bumper traffic I see alot of times were people are closed to getting into an accident
o You should have included "rarely" as an answer. 2. How safe is it on the streets for the following? (Very Unsafe, Unsafe, Safe, Very Safe)
Drivers o 5% Very Unsafe, 19% Unsafe, 73% Safe, 3% Very Safe
Pedestrians o 13% Very Unsafe, 54% Unsafe, 31% Safe, 1% Very Safe
Bicyclists o 30% Very Unsafe, 60% Unsafe, 11% Safe, 0% Very Safe
Motorcyclists o 11% Very Unsafe, 53% Unsafe, 37% Safe, 0% Very Safe
Elderly and/or disabled persons o 28% Very Unsafe, 51% Unsafe, 20% Safe, 0% Very Safe
Youth o 12% Very Unsafe, 57 % Unsafe, 31% Safe, 0% Very Safe
3. How safe do you feel traveling in the community?
6% Very Unsafe
33% Unsafe
58% Safe
4% Very Safe
Page A49 of A104
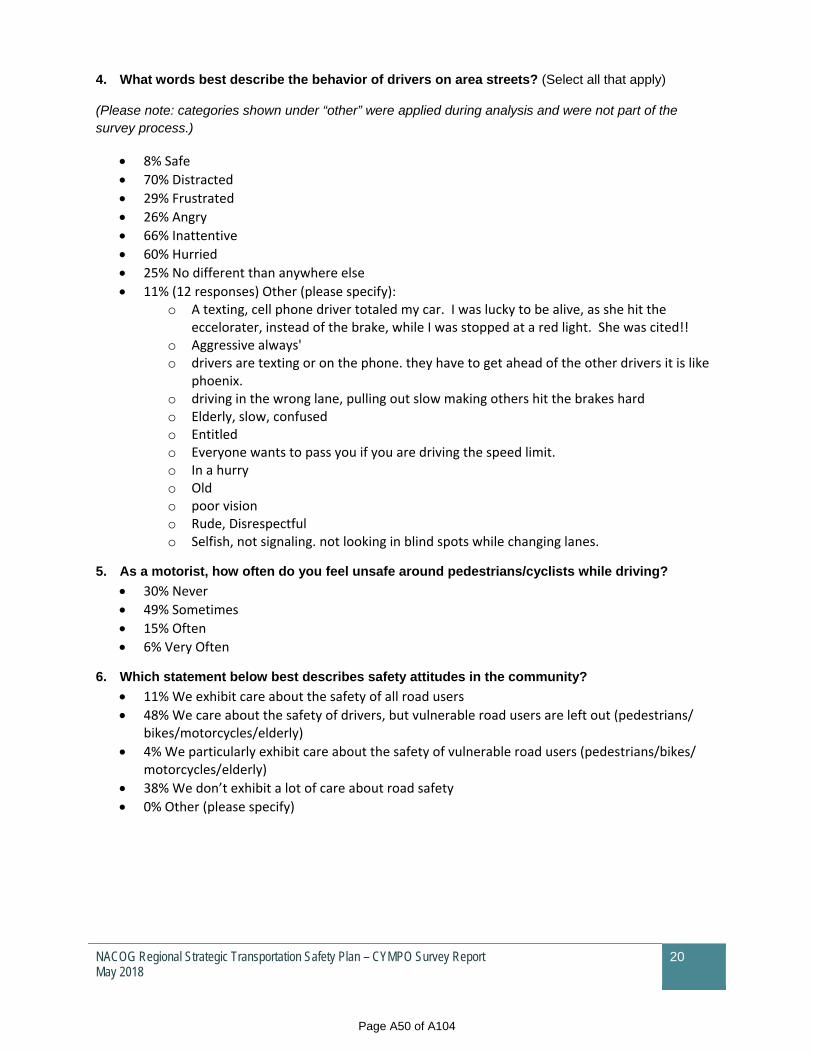
NACOG Regional Strategic Transportation Safety Plan – CYMPO Survey Report May 2018
20
4. What words best describe the behavior of drivers on area streets? (Select all that apply)
(Please note: categories shown under “other” were applied during analysis and were not part of the survey process.)
8% Safe
70% Distracted
29% Frustrated
26% Angry
66% Inattentive
60% Hurried
25% No different than anywhere else
11% (12 responses) Other (please specify): o A texting, cell phone driver totaled my car. I was lucky to be alive, as she hit the
eccelorater, instead of the brake, while I was stopped at a red light. She was cited!! o Aggressive always' o drivers are texting or on the phone. they have to get ahead of the other drivers it is like
phoenix. o driving in the wrong lane, pulling out slow making others hit the brakes hard o Elderly, slow, confused o Entitled o Everyone wants to pass you if you are driving the speed limit. o In a hurry o Old o poor vision o Rude, Disrespectful o Selfish, not signaling. not looking in blind spots while changing lanes.
5. As a motorist, how often do you feel unsafe around pedestrians/cyclists while driving?
30% Never
49% Sometimes
15% Often
6% Very Often
6. Which statement below best describes safety attitudes in the community?
11% We exhibit care about the safety of all road users
48% We care about the safety of drivers, but vulnerable road users are left out (pedestrians/ bikes/motorcycles/elderly)
4% We particularly exhibit care about the safety of vulnerable road users (pedestrians/bikes/ motorcycles/elderly)
38% We don’t exhibit a lot of care about road safety
0% Other (please specify)
Page A50 of A104
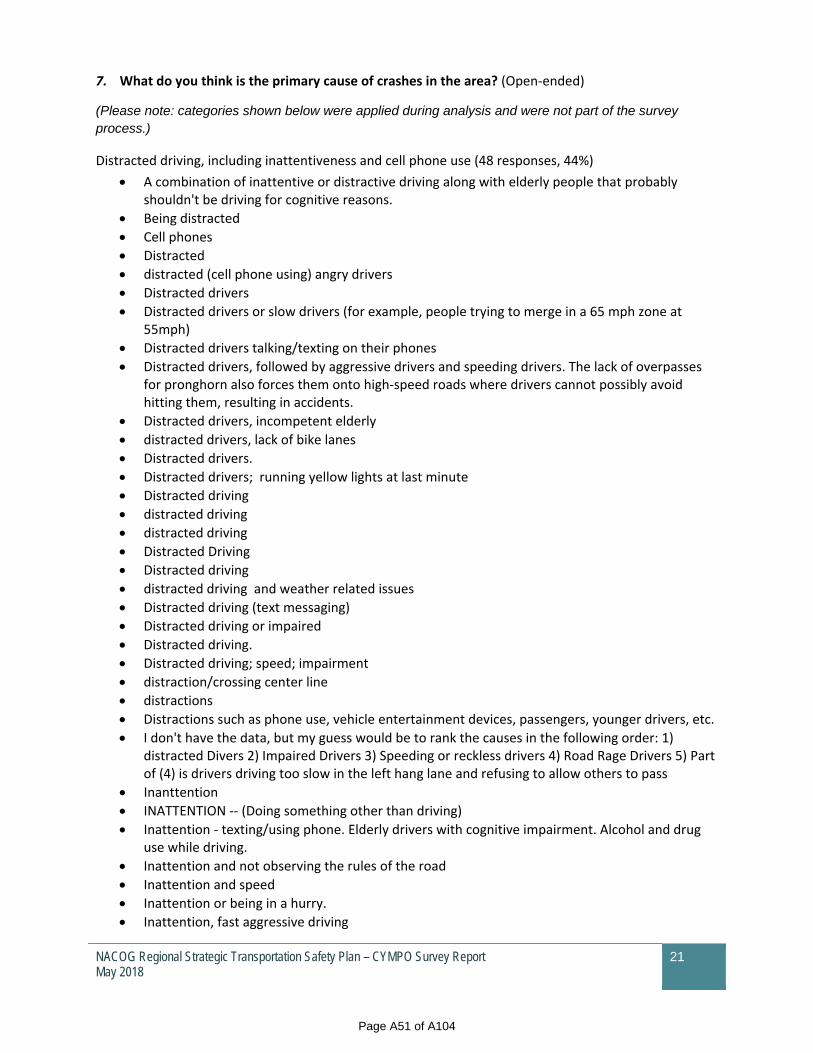
NACOG Regional Strategic Transportation Safety Plan – CYMPO Survey Report May 2018
21
7. What do you think is the primary cause of crashes in the area? (Open‐ended)
(Please note: categories shown below were applied during analysis and were not part of the survey process.)
Distracted driving, including inattentiveness and cell phone use (48 responses, 44%)
A combination of inattentive or distractive driving along with elderly people that probably shouldn't be driving for cognitive reasons.
Being distracted
Cell phones
Distracted
distracted (cell phone using) angry drivers
Distracted drivers
Distracted drivers or slow drivers (for example, people trying to merge in a 65 mph zone at 55mph)
Distracted drivers talking/texting on their phones
Distracted drivers, followed by aggressive drivers and speeding drivers. The lack of overpasses for pronghorn also forces them onto high‐speed roads where drivers cannot possibly avoid hitting them, resulting in accidents.
Distracted drivers, incompetent elderly
distracted drivers, lack of bike lanes
Distracted drivers.
Distracted drivers; running yellow lights at last minute
Distracted driving
distracted driving
distracted driving
Distracted Driving
Distracted driving
distracted driving and weather related issues
Distracted driving (text messaging)
Distracted driving or impaired
Distracted driving.
Distracted driving; speed; impairment
distraction/crossing center line
distractions
Distractions such as phone use, vehicle entertainment devices, passengers, younger drivers, etc.
I don't have the data, but my guess would be to rank the causes in the following order: 1) distracted Divers 2) Impaired Drivers 3) Speeding or reckless drivers 4) Road Rage Drivers 5) Part of (4) is drivers driving too slow in the left hang lane and refusing to allow others to pass
Inanttention
INATTENTION ‐‐ (Doing something other than driving)
Inattention ‐ texting/using phone. Elderly drivers with cognitive impairment. Alcohol and drug use while driving.
Inattention and not observing the rules of the road
Inattention and speed
Inattention or being in a hurry.
Inattention, fast aggressive driving
Page A51 of A104
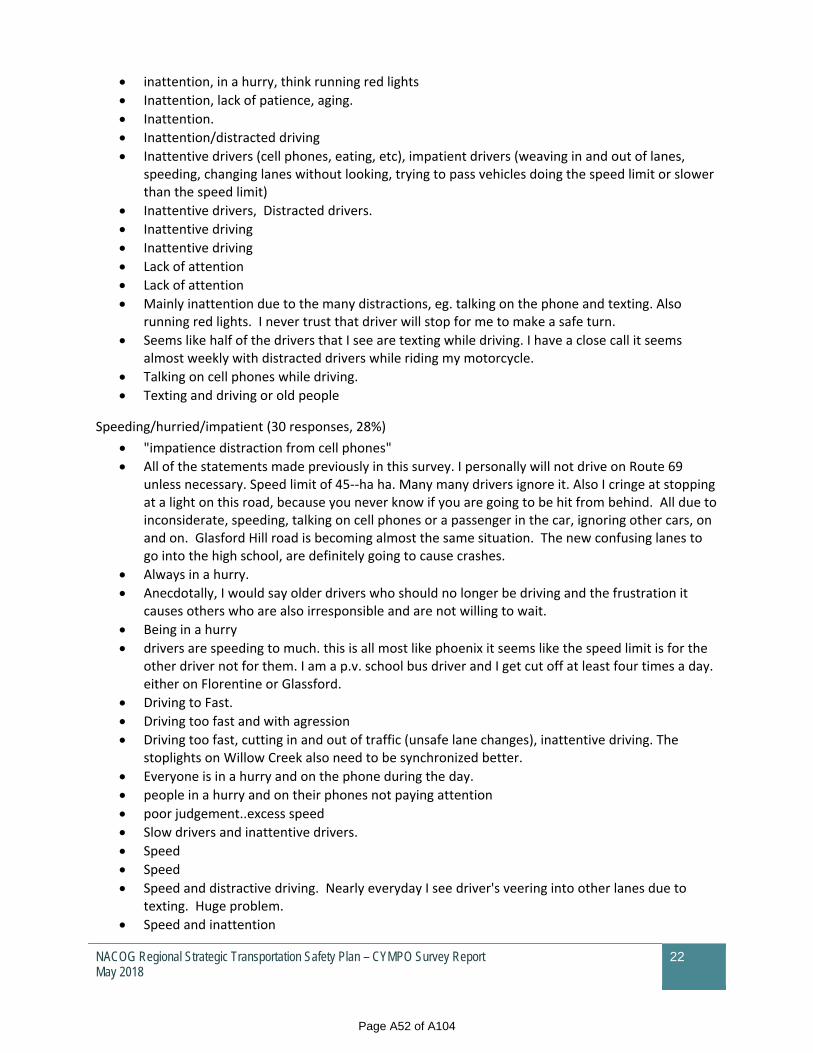
NACOG Regional Strategic Transportation Safety Plan – CYMPO Survey Report May 2018
22
inattention, in a hurry, think running red lights
Inattention, lack of patience, aging.
Inattention.
Inattention/distracted driving
Inattentive drivers (cell phones, eating, etc), impatient drivers (weaving in and out of lanes, speeding, changing lanes without looking, trying to pass vehicles doing the speed limit or slower than the speed limit)
Inattentive drivers, Distracted drivers.
Inattentive driving
Inattentive driving
Lack of attention
Lack of attention
Mainly inattention due to the many distractions, eg. talking on the phone and texting. Also running red lights. I never trust that driver will stop for me to make a safe turn.
Seems like half of the drivers that I see are texting while driving. I have a close call it seems almost weekly with distracted drivers while riding my motorcycle.
Talking on cell phones while driving.
Texting and driving or old people
Speeding/hurried/impatient (30 responses, 28%)
"impatience distraction from cell phones"
All of the statements made previously in this survey. I personally will not drive on Route 69 unless necessary. Speed limit of 45‐‐ha ha. Many many drivers ignore it. Also I cringe at stopping at a light on this road, because you never know if you are going to be hit from behind. All due to inconsiderate, speeding, talking on cell phones or a passenger in the car, ignoring other cars, on and on. Glasford Hill road is becoming almost the same situation. The new confusing lanes to go into the high school, are definitely going to cause crashes.
Always in a hurry.
Anecdotally, I would say older drivers who should no longer be driving and the frustration it causes others who are also irresponsible and are not willing to wait.
Being in a hurry
drivers are speeding to much. this is all most like phoenix it seems like the speed limit is for the other driver not for them. I am a p.v. school bus driver and I get cut off at least four times a day. either on Florentine or Glassford.
Driving to Fast.
Driving too fast and with agression
Driving too fast, cutting in and out of traffic (unsafe lane changes), inattentive driving. The stoplights on Willow Creek also need to be synchronized better.
Everyone is in a hurry and on the phone during the day.
people in a hurry and on their phones not paying attention
poor judgement..excess speed
Slow drivers and inattentive drivers.
Speed
Speed
Speed and distractive driving. Nearly everyday I see driver's veering into other lanes due to texting. Huge problem.
Speed and inattention
Page A52 of A104
NACOG Regional Strategic Transportation Safety Plan – CYMPO Survey Report May 2018
23
Speed and inattentive driving.
Speed and running red lights
Speed greater than posted. Cell phone users. Seniors with eye, ear, physical and mental deficits. Drugs and alcohol.
speed, not paying attention
speed, road rage, distracted
Speed, trying to push the envelope. Alcohol/drug imparment
Speed. Too many traffic signals in rural areas causing too much lane‐changing and too much slowing/speeding up.
Speeding
Speeding and distracted
Speeding, distracted drivers
sPEEDING, LACK OF ATTENTION/DISTRACTION by cellphones especially
Speeding, not enough space between vehicles, cell phones, street lights not in sync.
Speeding. We live next the Glassford Hill Pay and we hear the racing and speeding going on. No wonder there are so many crashes.
Other behaviors (11 responses, 10%)
Alcohol, texting while driving
blatant disregard of most traffic laws and the lack of common consideration for others
Drinking/drugs and speeding
Driver error, distraction, physical limitation of drivers (reaction time, judgement, loss of driving skill due to age, poor understanding of TWLTL, protected permissive LT signal indications, slower drivers staying right except to pass, roundabout yielding laws).
Drivers who are not properly trained. Many times I see drivers who ARE paying attention: looking both ways, driving the speed limit, stopping at stop signs/lights; and STILL pull out in front of other drivers; and STILL merge into lanes where there's already a vehicle; and STILL almost hit bicyclists, etc. It seems to stem from inexperience, lack of driver safety training, not knowing the rules, poor eyesight, confused, old age, etc. Although I see a lot of distracted drivers (i.e. cell phone users), those people do not seem to be the cause of accidents and/or near‐misses. It's typically "bad drivers" (from above mentioned) that cause accidents.
Drugs, Cell Phones, Sight Lines
Elderly drivers
Not using safe, basic driving skills. You have to wonder where most of the people learned to drive because I see bad driving habits every day that I am out on the streets and roads.
old people going too slow and not having understanding of what is around them
Tailgating. I see people less than a car length behind the car in front of them going 50+ mph
Unsafe left hand turn areas need left hand turn arrow signals. Areas should have been evaluated before putting a turning lane in. Example: Windsong and Lakeshore. From left hand turn lane you cannot see on coming traffic if large trucks or school buses are making left hand turn from the opposite direction. I am sure it is the same way in both directions. Poor planning. Robert Road and Lakeshore is also very busy, could us turning signal.
Page A53 of A104
NACOG Regional Strategic Transportation Safety Plan – CYMPO Survey Report May 2018
24
Other (6 responses, 6%)
I think road signage is a contributing factor. The roundabout directions on the road are misleading ‐ indicating we could turn left if we went in the direction of the arrow. This is not how it is in Europe roundabouts. The arrow indicating to go left is a circular arrow.
Moved here three month's ago from Phoenix. Haven't seen one accident yet up here!
no idea
Not enough turn lanes and too many sight hazards.
Road design‐‐there are few bicycle lanes and a poor area attitude about the value of cyclists and pedestrians.
Weather, people in a hurry
8. What do you think needs to be changed to make it safer to travel? (Open-ended)
(Please note: categories shown below were applied during analysis and were not part of the survey process.)
Other (19 responses, 18%)
1. Require road tests for Arizona residents over the age of 65 and every 5 years thereafter. 2. Raise the speed limits in Prescott Valley to reflect that actual speed that vehicles should travel on roads like Robert Road. 3. Install medians the entire length of SR‐69 from I‐17 to SR 89, with adequate breaks for intersection turning. 4. Make drivers from other state's aware of laws that may be different in Arizona (such as red lights and the line of prolongation versus crossing the intersection). 5. Targeted traffic enforcement seeking out irresponsible drivers‐ either driving too slow or too fast.
don't know
Driver attitude.
Frequent and comprehensive testing to get a driver's license. Allow only competent drivers to be on the road.
I don't think you can change people's attitudes. Folks just need to take a deep breath and calm down. No need to rush to get where you are going, just enjoy the ride. Leave a little earlier to give yourself plenty of time to get where you are going.
Left lane usage, left lane for passing only. Timed lights, Hwy 69 is horrible for one car on signaled side road stopping traffic. (Dewey/Humboldt main street), Hwy 169 interchange, Every side road light is timed to quickly to change red for the ONE CAR on a side road!!!
Lower the speed limit.
Mandatory cognitive testing on 85th birthday. Transit for the young, old, disabled, low income, environmentalist, bicyclist and those who would rather ride than drive.
More frequent and honest driver safety tests. Once a person reaches 70 years old, it should be a mandatory driver safety test (in real world driving conditions) every 2 years.
More respect
One thing I'm concerned about is my 93‐year‐old mother just got her license renewed for 5 more years, and all she had to do was have her eyes checked. She seems to be a pretty safe driver, and mostly goes to the grocery store, but I feel there should be restrictions for drivers of that age.
People need to obey speed limits and leave earlier to get to there destinations.
People need to pay attention to driving while driving, and nothing else, while also obeying the laws of the road. Unfortunately these kind of people need laws to force them to do that; we need a strong law against driving while using phones, just like we have laws against speeding.
Page A54 of A104

NACOG Regional Strategic Transportation Safety Plan – CYMPO Survey Report May 2018
25
People are dying because the Legislature won't enact such a law. And we need a strategically placed overpass over Highway 89 between Prescott and CV, and another over Fain, to keep pronghorn off high‐speed roads. Bicycles should be banned from Highway 89A between Prescott Valley and Jerome because there is nowhere for them to ride off the main lanes; I've almost hit them when coming around blind curves.
People need to pay attention to what they are doing.
Require license applicants to pass a written test in English to show a basic understanding of traffic laws and driving habits that are expected to accommodate proper traffic flow.
Slow drivers need to not drive in the passing lane. Campaign educating drivers about this law might help with frustrated drivers.
strategic planning that focuses less on single occupant car travel
Test our elders in the car and outlaw the use of phones for testing and hand held devices.
Urge motorists to be attentive to all other traffic while driving Cell phone laws (18 responses, 17%)
Ban cellphone use while driving ‐ with $$$ fines escalating with each infraction
Ban state wide cell phone use while driving.
Ban the use of cell phones. Give tickets for those that do not use turn signals when they should.
Clamp down on cell phone use while driving, especially if not hands free.
For automobiles; no cell phone use while driving and drug enforcement. For cyclists; designated bike lanes and bike routes (off roadway where possible), both of which are well signed.
Get off the telephone. Signs to remind people to pull over to use their telephone.
If people put their phones/distractions down and focus on driving.
Law against distracted driving Connector with overpasses to eliminate congestion
Laws against using cell phones while driving. Strict enforcement.
legislation for hands‐free driving; safety barriers between all two‐lane roads with 50mph speed or higher
mandate a no cell phone use while driving
More restrictive traffic laws regarding use of electronic equipment of any kind; make it a primary offense and follow it up with enforcement; more enforcement of speed laws. A majority of drivers on arterials treat the speed limit as a suggestion that they can and will ignore; more enforcement of cars driving slowly in the interior lanes of 4 lane and divided roads. It creates road rage and frustrated drivers weaving in and out of traffic.
no cell phones period while driving
No texting while driving law
No texting while driving. I believe that hands free phone calls work fine but when you have to look down to touch a screen or read a text, etc., that is when it becomes dangerous. Prescott Valley needs bike lanes added to all the main thoroughfares. Schools should include education on Bicycle road & safety rules. The students as well as adults do not know the laws and rules of riding on the road , including the when and how to use turn lanes and sidewalks. More education is needed on sharing the road with bicyclists.
Outlaw cell phone use while driving for ALL drivers, not just teenagers, and enforce it
Stricter texting and driving enforcement
Take everyone's cell phones away.
Page A55 of A104
NACOG Regional Strategic Transportation Safety Plan – CYMPO Survey Report May 2018
26
Enforcement (17 responses, 16%)
Enforce speed limits for those who go well over the posted limit as well as those who go well under. It seems that slow drivers enrage those who want to go faster which creates an unsafe dynamic on the roadways. Also, many drivers who want to drive slow do not drive in the slow lane and instead plug up the fast lane again creating agression.
enforcement of the exisisting traffic laws such as speed limits! officers DO NOT enforce speed limits, i.e., 'it's OK to go 11 mph over the posted limits"??? (why have laws if we don't need to obey them?) maybe if they would enforce the laws and stop all tailgaters and other blatant disregard, we would see a reduction of the accidents on our highways and streets!
I have not seen patrolmen/women traveling the streets and issuing tickets or warnings for a very long time. There is 1 motorcycle person on Copper Basin Road issuing tickets and that is it.
Law enforcement needs to step it up. Enact and enforce texting laws.
More cops on patrol.
More enforcement
More patrols
More police patrol is a definite first. I rarely see any drivers pulled over on Route 69 for various infractions. Speeding on this road, again is such a joke as nothing is done about it. We really do not need a hiway in the middle of two towns. Drop the speed limit to 40mph, and more stop lights so drivers do not continue to ignore it all.
More police presence
More policing and stronger driving rules. We see people on cell phones every day. A lot of them are swerving all over the road. We see drivers cutting off other drivers all the time. We come from Portland Oregon and so glad to be here, but we have never seen so many terrible drivers in one place. I would never ride a bicycle around here on the road.
More tickets for tailgating or required driver courses
More traffic monitoring by police, more awareness in the community about safe driving, especially younger adult drivers. They seem to be the worst about not observing basic traffic rules. Bring back the "red light" cameras, after they were removed everyone saw a big increase in speeding, running red lights which hasn't abated.
Mors Police action.
Occasional speed monitoring
ticket people for being in the wrong lane and not passing when they should
Tickets to yellow light drivers
we need are police to be out where the speed is high. the drivers real think the road by the school is a highway. drivers need to use there turn signals more. I even see police and fire personal not using signals. drivers have to make a stop on red before turning right. quit crashing stop signs.
Infrastructure including new/improved roads (16 responses, 15%)
3 lane roads, or alternate routes to and from PV/Prescott
Addition of more driving lanes when possible. Consistency with lane mergers (some lanes require you to merge left, others merge right).
Better roads and signals.
bike lanes
Bike lanes and making texting while driving illegal and require use of hands free for talking on phone. Absolutely mind‐numbing that we don't have these laws.
Page A56 of A104
NACOG Regional Strategic Transportation Safety Plan – CYMPO Survey Report May 2018
27
Bike lanes, educate people about rights of cyclists ‐ both cyclists and motorists. Enforce laws regarding rights of pedestrians in crosswalks.
Definitely more bicycle lanes/shoulders. And it would probably be a good idea to retest any driver over the age of 65 every 3 years.
Disignited bike lanes on roads or separate paved trails for bikes and pedestrians
Improvements need to be made to highways and local streets to make driving easier. Lots of dumb street alignments and intersections.
More alternative routes.
more and wider bike lanes, and keep keep the bike lanes clean so rider's don't need to go into the path of cars to avoid debris
More bike lanes and more people using them.
more bike lanes, signage
The primary travel corridor between Prescott and the rest of the world in SR 69. Areas that currently have 3 lanes of traffic in each direction need to be expanded in conjunction with timing the traffic signals better. I see more issues with traffic safety in this corridor than any other location in this region.
We need more room on the side of the roads for bicycles. The 12 inches or so that are available on most roads is not enough.
Wider roadways, less stop light, bigger roundabouts Infrastructure including traffic lights/timing, signs, striping (10 responses, 9%)
Align traffic light where you do not hit 10‐12 straight red lights. This generates frustrated drivers who will speed up to not have to stop so frequently.
Enhanced safety features to control errant vehicles, enhanced signing and striping. Education promoting slower drivers staying right except to pass. Education on use of protected permissive left turn indications at signals, Roundabout education
Fewer traffic signals. Speed/red light cameras.
Make it more efficient to travel between the communities. For example, there is high traffic volume with too many stop lights on Hwy 69 between Dewey and Prescott. As a result, it takes an excessive amount of time to travel between the two areas because you are constantly stopping and cannot travel faster than 45 mph. This leads to people speeding/weaving in and out of traffic, frustrated drivers when slow cars stay in the left travel lane, etc.
More turn arrow lights, evaluation of turning left areas.
More turn lanes
On some intersections on Hwy 69, the left turn signal is in the middle lane, not directly over the left turn lane. I think this may be confusing to some people.
Post your speed limits on bigger signs.
Signage on how to enter and go through a round about, more police presence particularly during rush hour times of the day on major roadways like SR89 and SR69. Educational PSA's on the radio and newspapers.
Space out light changes so that there is a pause after a light turns red, to keep drivers from entering the intersection too soon‐‐might help with reducing accidents when people run a yellow or red light. More bike lanes, and make them a bit wider, to make more room so cars aren't as likely to side‐swipe cyclists.
Page A57 of A104
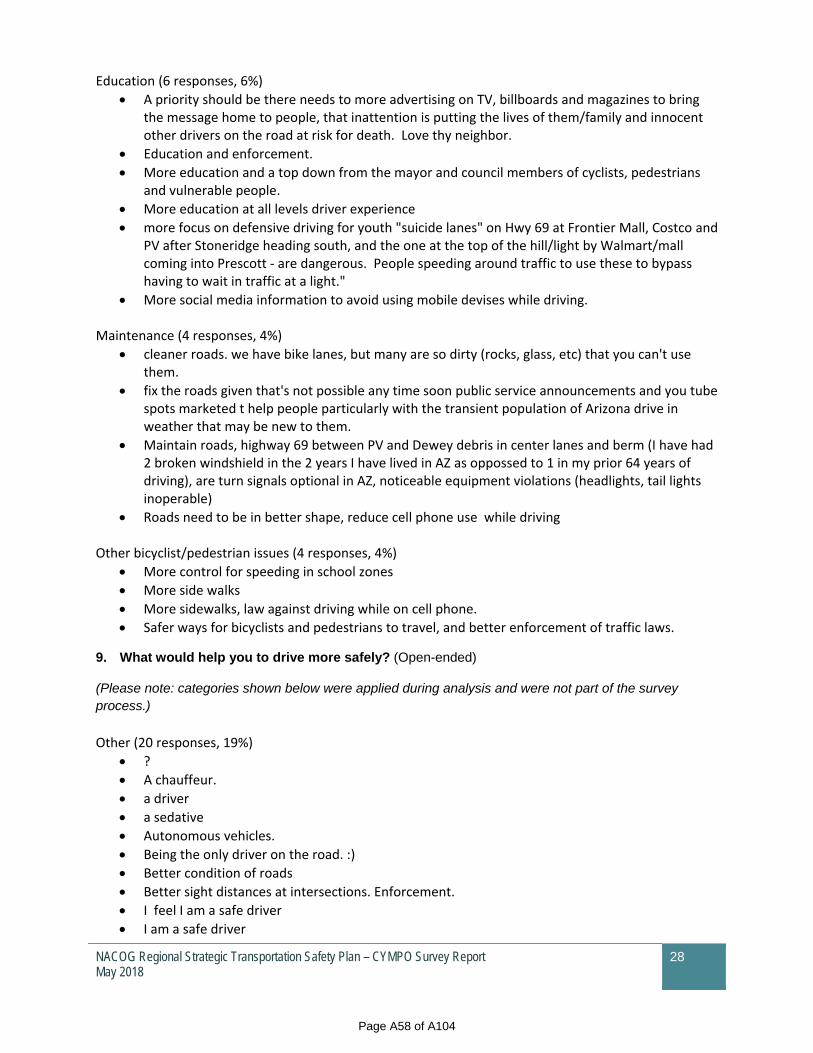
NACOG Regional Strategic Transportation Safety Plan – CYMPO Survey Report May 2018
28
Education (6 responses, 6%)
A priority should be there needs to more advertising on TV, billboards and magazines to bring the message home to people, that inattention is putting the lives of them/family and innocent other drivers on the road at risk for death. Love thy neighbor.
Education and enforcement.
More education and a top down from the mayor and council members of cyclists, pedestrians and vulnerable people.
More education at all levels driver experience
more focus on defensive driving for youth "suicide lanes" on Hwy 69 at Frontier Mall, Costco and PV after Stoneridge heading south, and the one at the top of the hill/light by Walmart/mall coming into Prescott ‐ are dangerous. People speeding around traffic to use these to bypass having to wait in traffic at a light."
More social media information to avoid using mobile devises while driving. Maintenance (4 responses, 4%)
cleaner roads. we have bike lanes, but many are so dirty (rocks, glass, etc) that you can't use them.
fix the roads given that's not possible any time soon public service announcements and you tube spots marketed t help people particularly with the transient population of Arizona drive in weather that may be new to them.
Maintain roads, highway 69 between PV and Dewey debris in center lanes and berm (I have had 2 broken windshield in the 2 years I have lived in AZ as oppossed to 1 in my prior 64 years of driving), are turn signals optional in AZ, noticeable equipment violations (headlights, tail lights inoperable)
Roads need to be in better shape, reduce cell phone use while driving Other bicyclist/pedestrian issues (4 responses, 4%)
More control for speeding in school zones
More side walks
More sidewalks, law against driving while on cell phone.
Safer ways for bicyclists and pedestrians to travel, and better enforcement of traffic laws.
9. What would help you to drive more safely? (Open-ended)
(Please note: categories shown below were applied during analysis and were not part of the survey process.)
Other (20 responses, 19%)
?
A chauffeur.
a driver
a sedative
Autonomous vehicles.
Being the only driver on the road. :)
Better condition of roads
Better sight distances at intersections. Enforcement.
I feel I am a safe driver
I am a safe driver
Page A58 of A104
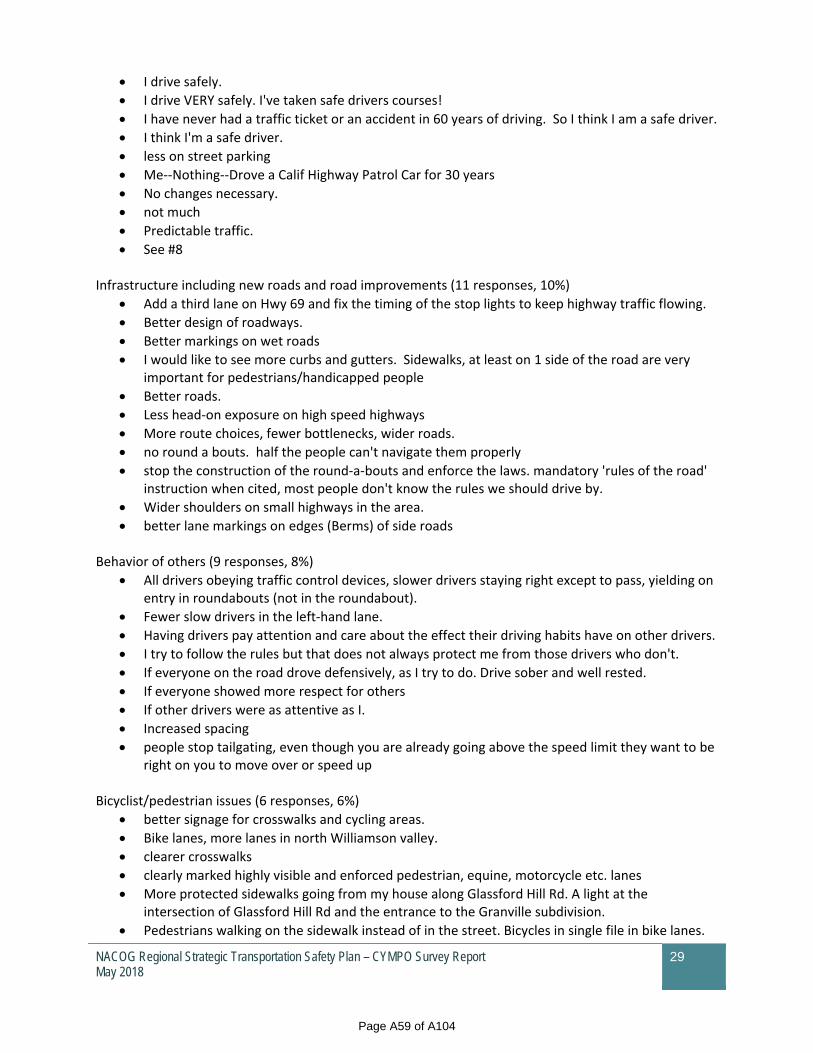
NACOG Regional Strategic Transportation Safety Plan – CYMPO Survey Report May 2018
29
I drive safely.
I drive VERY safely. I've taken safe drivers courses!
I have never had a traffic ticket or an accident in 60 years of driving. So I think I am a safe driver.
I think I'm a safe driver.
less on street parking
Me‐‐Nothing‐‐Drove a Calif Highway Patrol Car for 30 years
No changes necessary.
not much
Predictable traffic.
See #8 Infrastructure including new roads and road improvements (11 responses, 10%)
Add a third lane on Hwy 69 and fix the timing of the stop lights to keep highway traffic flowing.
Better design of roadways.
Better markings on wet roads
I would like to see more curbs and gutters. Sidewalks, at least on 1 side of the road are very important for pedestrians/handicapped people
Better roads.
Less head‐on exposure on high speed highways
More route choices, fewer bottlenecks, wider roads.
no round a bouts. half the people can't navigate them properly
stop the construction of the round‐a‐bouts and enforce the laws. mandatory 'rules of the road' instruction when cited, most people don't know the rules we should drive by.
Wider shoulders on small highways in the area.
better lane markings on edges (Berms) of side roads Behavior of others (9 responses, 8%)
All drivers obeying traffic control devices, slower drivers staying right except to pass, yielding on entry in roundabouts (not in the roundabout).
Fewer slow drivers in the left‐hand lane.
Having drivers pay attention and care about the effect their driving habits have on other drivers.
I try to follow the rules but that does not always protect me from those drivers who don't.
If everyone on the road drove defensively, as I try to do. Drive sober and well rested.
If everyone showed more respect for others
If other drivers were as attentive as I.
Increased spacing
people stop tailgating, even though you are already going above the speed limit they want to be right on you to move over or speed up
Bicyclist/pedestrian issues (6 responses, 6%)
better signage for crosswalks and cycling areas.
Bike lanes, more lanes in north Williamson valley.
clearer crosswalks
clearly marked highly visible and enforced pedestrian, equine, motorcycle etc. lanes
More protected sidewalks going from my house along Glassford Hill Rd. A light at the intersection of Glassford Hill Rd and the entrance to the Granville subdivision.
Pedestrians walking on the sidewalk instead of in the street. Bicycles in single file in bike lanes.
Page A59 of A104
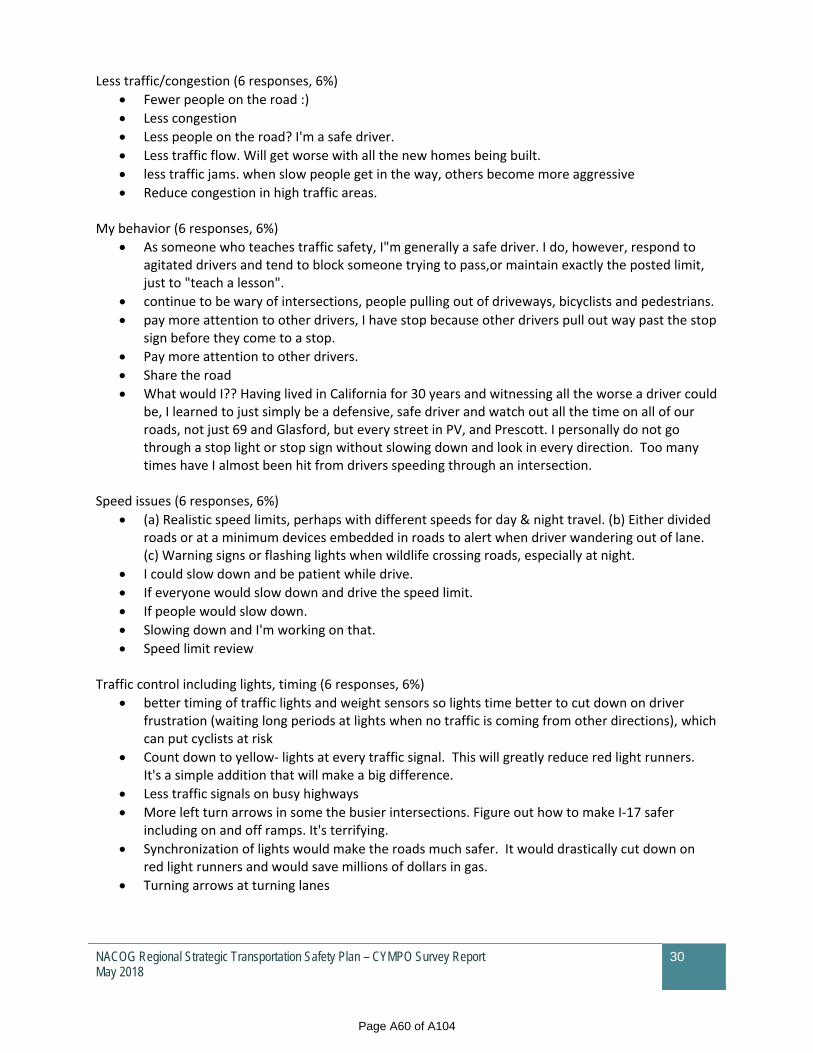
NACOG Regional Strategic Transportation Safety Plan – CYMPO Survey Report May 2018
30
Less traffic/congestion (6 responses, 6%)
Fewer people on the road :)
Less congestion
Less people on the road? I'm a safe driver.
Less traffic flow. Will get worse with all the new homes being built.
less traffic jams. when slow people get in the way, others become more aggressive
Reduce congestion in high traffic areas. My behavior (6 responses, 6%)
As someone who teaches traffic safety, I"m generally a safe driver. I do, however, respond to agitated drivers and tend to block someone trying to pass,or maintain exactly the posted limit, just to "teach a lesson".
continue to be wary of intersections, people pulling out of driveways, bicyclists and pedestrians.
pay more attention to other drivers, I have stop because other drivers pull out way past the stop sign before they come to a stop.
Pay more attention to other drivers.
Share the road
What would I?? Having lived in California for 30 years and witnessing all the worse a driver could be, I learned to just simply be a defensive, safe driver and watch out all the time on all of our roads, not just 69 and Glasford, but every street in PV, and Prescott. I personally do not go through a stop light or stop sign without slowing down and look in every direction. Too many times have I almost been hit from drivers speeding through an intersection.
Speed issues (6 responses, 6%)
(a) Realistic speed limits, perhaps with different speeds for day & night travel. (b) Either divided roads or at a minimum devices embedded in roads to alert when driver wandering out of lane. (c) Warning signs or flashing lights when wildlife crossing roads, especially at night.
I could slow down and be patient while drive.
If everyone would slow down and drive the speed limit.
If people would slow down.
Slowing down and I'm working on that.
Speed limit review Traffic control including lights, timing (6 responses, 6%)
better timing of traffic lights and weight sensors so lights time better to cut down on driver frustration (waiting long periods at lights when no traffic is coming from other directions), which can put cyclists at risk
Count down to yellow‐ lights at every traffic signal. This will greatly reduce red light runners. It's a simple addition that will make a big difference.
Less traffic signals on busy highways
More left turn arrows in some the busier intersections. Figure out how to make I‐17 safer including on and off ramps. It's terrifying.
Synchronization of lights would make the roads much safer. It would drastically cut down on red light runners and would save millions of dollars in gas.
Turning arrows at turning lanes
Page A60 of A104
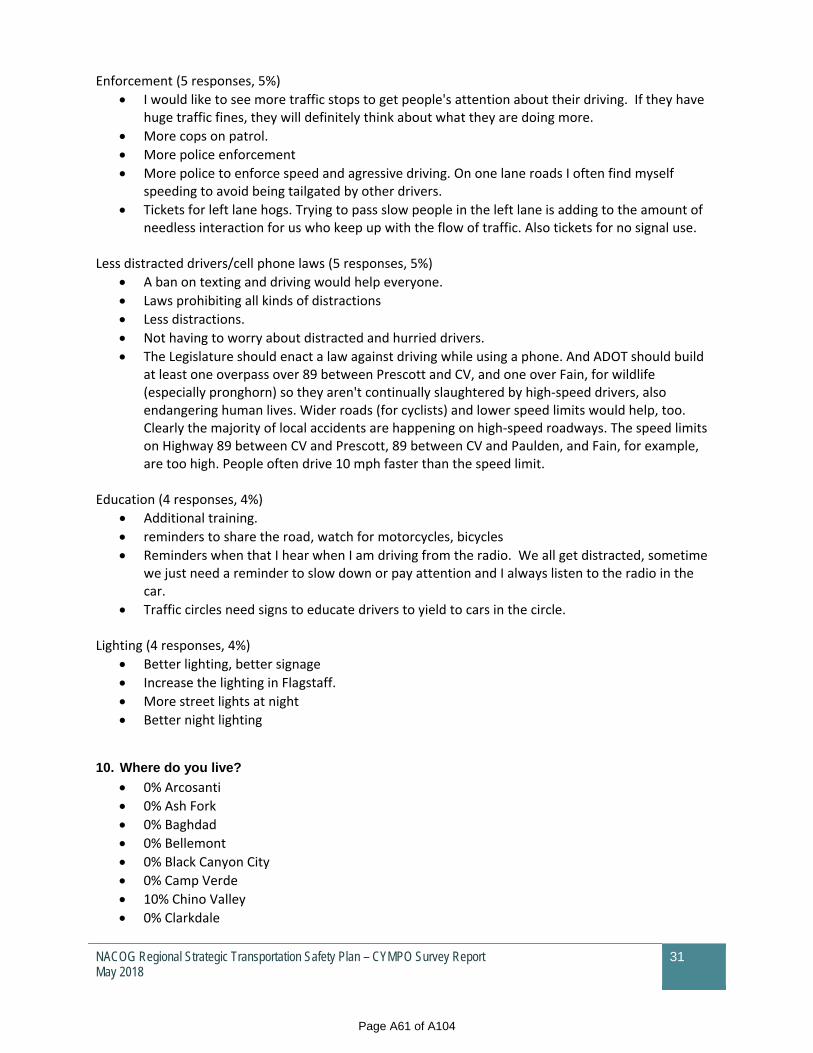
NACOG Regional Strategic Transportation Safety Plan – CYMPO Survey Report May 2018
31
Enforcement (5 responses, 5%)
I would like to see more traffic stops to get people's attention about their driving. If they have huge traffic fines, they will definitely think about what they are doing more.
More cops on patrol.
More police enforcement
More police to enforce speed and agressive driving. On one lane roads I often find myself speeding to avoid being tailgated by other drivers.
Tickets for left lane hogs. Trying to pass slow people in the left lane is adding to the amount of needless interaction for us who keep up with the flow of traffic. Also tickets for no signal use.
Less distracted drivers/cell phone laws (5 responses, 5%)
A ban on texting and driving would help everyone.
Laws prohibiting all kinds of distractions
Less distractions.
Not having to worry about distracted and hurried drivers.
The Legislature should enact a law against driving while using a phone. And ADOT should build at least one overpass over 89 between Prescott and CV, and one over Fain, for wildlife (especially pronghorn) so they aren't continually slaughtered by high‐speed drivers, also endangering human lives. Wider roads (for cyclists) and lower speed limits would help, too. Clearly the majority of local accidents are happening on high‐speed roadways. The speed limits on Highway 89 between CV and Prescott, 89 between CV and Paulden, and Fain, for example, are too high. People often drive 10 mph faster than the speed limit.
Education (4 responses, 4%)
Additional training.
reminders to share the road, watch for motorcycles, bicycles
Reminders when that I hear when I am driving from the radio. We all get distracted, sometime we just need a reminder to slow down or pay attention and I always listen to the radio in the car.
Traffic circles need signs to educate drivers to yield to cars in the circle. Lighting (4 responses, 4%)
Better lighting, better signage
Increase the lighting in Flagstaff.
More street lights at night
Better night lighting
10. Where do you live?
0% Arcosanti
0% Ash Fork
0% Baghdad
0% Bellemont
0% Black Canyon City
0% Camp Verde
10% Chino Valley
0% Clarkdale
Page A61 of A104

NACOG Regional Strategic Transportation Safety Plan – CYMPO Survey Report May 2018
32
0% Congress
0% Cordes Lakes
1% Cornville
1% Cottonville
0% Cottonwood
4% Dewey‐Humbolt
0% Drake
0% Eagar
0% Flagstaff
0% Grand Canyon
0% Hillside
0% Holbrook
0% Jerome
0% Kachina Village
0% Kayenta
2% Mayer
0% Page
2% Paulden
0% Peeples Valley
0% Perkinsville
0% Pinetop‐Lakeside
43% Prescott
32% Prescott Valley
0% Sedona
0% Seligman
0% Show Low
0% Snowflake
0% Springerville
0% Spring Valley
0% St. Johns
0% Taylor
0% Tuba City
0% Tusayan
0% Village of Oak Creek
0% Wickenburg
0% Wilhoit
0% Williams
4% Williamson
0% Winslow
0% Yarnell
0% Yava
2% Unincorporated County Area
2% Other (please specify) o Dewey (not Humboldt), county line. o Quailwood
Page A62 of A104

NACOG Regional Strategic Transportation Safety Plan – CYMPO Survey Report May 2018
33
11. Primarily, I'm responding as a...
75% Motorist
18% Bicyclist
1% Pedestrian
7% Other (please specify): o All of the above, I'm very active in each area. o commercial truck driver o concerned area resident who's all of the above o I am a bicyclist, but I would never ride my bike in they area because of the terrible
drivers. o I am primarily a Pedstrian but also ride my bicycle often o I drive, cycle, and walk about the same amount o Motorist and Transportation Professional
12. What is your age?
0% Under 16 years old
2% 16‐24 years old
5% 25‐34 years old
12% 35‐44 years old
10% 45‐54 years old
35% 55‐64 years old
23% 65‐74 years old
11% 75 years or older
4% Prefer not to answer
13. With which gender do you identify?
39% Female
56% Male
5% Prefer not to answer
14. If you'd like to receive updates regarding THIS PROJECT ONLY please provide your contact information. Otherwise, skip this question.
Name Organization (if applies) Email Address Linda Amendola [email protected]
Cal Willahan calwill3@yahoo,com
John Stryker [email protected]
Marlys Mccrank [email protected]
Fred Pamer [email protected]
Jeff Low City of Prescott [email protected] Don Hersh Cyclists For Life [email protected] Kevin Attebery City of Prescott [email protected] linders [email protected]
Robert Kec [email protected]
aurora rojas Yavapai Health Services [email protected] Denise Mitten [email protected]
Linda Hearing [email protected] F Gustin [email protected]
Mark Armstrong [email protected] Richard Macdonald [email protected]
Page A63 of A104

NACOG Regional Strategic Transportation Safety Plan – CYMPO Survey Report May 2018
34
Larry Byk [email protected]
Larry Meads [email protected] Dave Hollenbeck None and Retired [email protected] Denice Caywood [email protected]
Chris [email protected]
Neil Jonielunas [email protected]
P.J.Smith N/A [email protected] Sandy Stutey [email protected]
Robert Luzius [email protected]
15. The next step is to identify unsafe locations on the map. Click on the link below. You can add as many locations to the map as you want. When you are finished close the window.
Table includes nearest city, intersection, and verbatim comment. Numbered comments in blue
represent areas of concern for drivers, yellow represents areas of concern for pedestrians, and red
represents areas of concern for bicyclists. The mapped comments are also available in an interactive
format at: https://gci.mysocialpinpoint.com/nacog#/.
Page A64 of A104
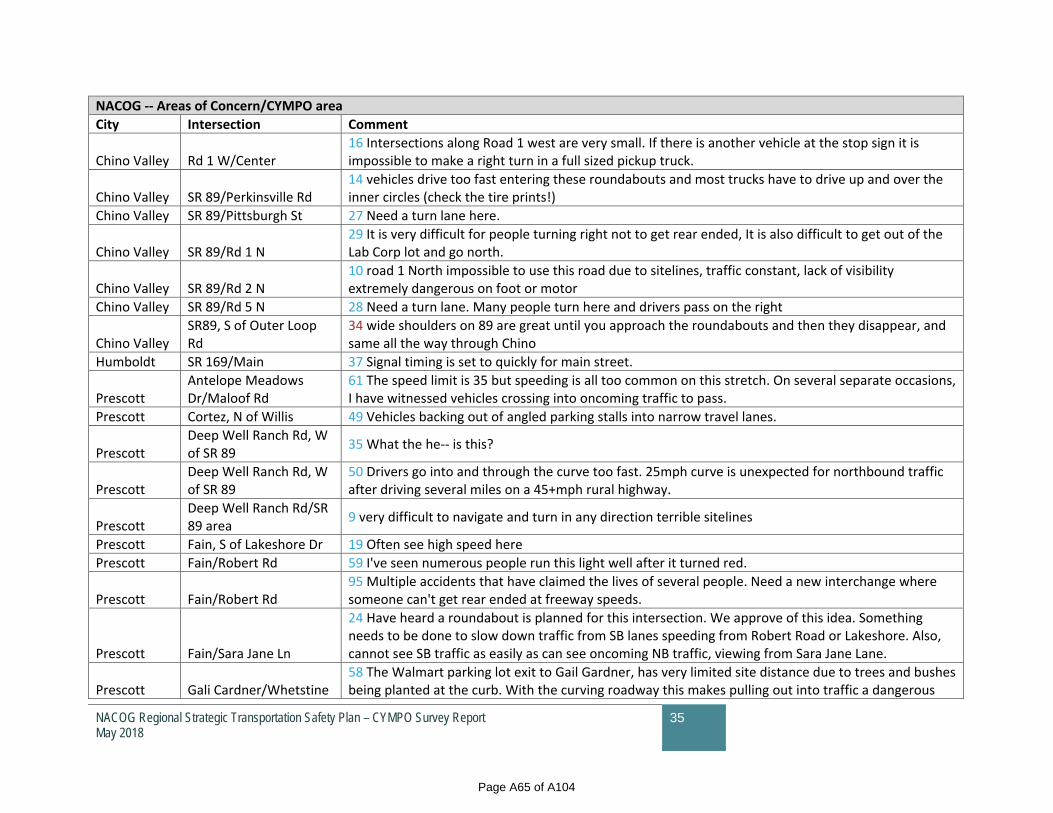
NACOG Regional Strategic Transportation Safety Plan – CYMPO Survey Report May 2018
35
NACOG ‐‐ Areas of Concern/CYMPO area
City Intersection Comment
Chino Valley Rd 1 W/Center 16 Intersections along Road 1 west are very small. If there is another vehicle at the stop sign it is impossible to make a right turn in a full sized pickup truck.
Chino Valley SR 89/Perkinsville Rd 14 vehicles drive too fast entering these roundabouts and most trucks have to drive up and over the inner circles (check the tire prints!)
Chino Valley SR 89/Pittsburgh St 27 Need a turn lane here.
Chino Valley SR 89/Rd 1 N 29 It is very difficult for people turning right not to get rear ended, It is also difficult to get out of the Lab Corp lot and go north.
Chino Valley SR 89/Rd 2 N 10 road 1 North impossible to use this road due to sitelines, traffic constant, lack of visibility extremely dangerous on foot or motor
Chino Valley SR 89/Rd 5 N 28 Need a turn lane. Many people turn here and drivers pass on the right
Chino Valley SR89, S of Outer Loop Rd
34 wide shoulders on 89 are great until you approach the roundabouts and then they disappear, and same all the way through Chino
Humboldt SR 169/Main 37 Signal timing is set to quickly for main street.
Prescott Antelope Meadows Dr/Maloof Rd
61 The speed limit is 35 but speeding is all too common on this stretch. On several separate occasions, I have witnessed vehicles crossing into oncoming traffic to pass.
Prescott Cortez, N of Willis 49 Vehicles backing out of angled parking stalls into narrow travel lanes.
Prescott Deep Well Ranch Rd, W of SR 89
35 What the he‐‐ is this?
Prescott Deep Well Ranch Rd, W of SR 89
50 Drivers go into and through the curve too fast. 25mph curve is unexpected for northbound traffic after driving several miles on a 45+mph rural highway.
Prescott Deep Well Ranch Rd/SR 89 area
9 very difficult to navigate and turn in any direction terrible sitelines
Prescott Fain, S of Lakeshore Dr 19 Often see high speed here
Prescott Fain/Robert Rd 59 I've seen numerous people run this light well after it turned red.
Prescott Fain/Robert Rd 95 Multiple accidents that have claimed the lives of several people. Need a new interchange where someone can't get rear ended at freeway speeds.
Prescott Fain/Sara Jane Ln
24 Have heard a roundabout is planned for this intersection. We approve of this idea. Something needs to be done to slow down traffic from SB lanes speeding from Robert Road or Lakeshore. Also, cannot see SB traffic as easily as can see oncoming NB traffic, viewing from Sara Jane Lane.
Prescott Gali Cardner/Whetstine 58 The Walmart parking lot exit to Gail Gardner, has very limited site distance due to trees and bushes being planted at the curb. With the curving roadway this makes pulling out into traffic a dangerous
Page A65 of A104

NACOG Regional Strategic Transportation Safety Plan – CYMPO Survey Report May 2018
36
situation.
Prescott Glassford Hill Rd/Lakeshore Dr
185 Need a right hand turn lane coming out of this area to go south on Glassford Hill Road
Prescott Glassford Hill Rd/Long Look Dr
182 Having only one lane coming out of Lone Cactus is horrible in the mornings. Traffic backs up and if someone is turning left, you wait forever for them to go. The construction took out the extra room to go around them, so now the line of cars just gets stuck and goes nowhere.
Prescott Glassford Hill Rd/Long Look Dr
183 Glassford Hill Road is extremely icy in the winter time. This is because the asphalt was laid too thick. This area is particularly bad and makes it difficult to drive through.
Prescott Glassford Hill Rd/SR 69 184 One takes life in their own hands if they attempt to fully cross this intersection.
Prescott Goodwin, E of Montezuma
6 See comments about oversized vehicles on Gurley
Prescott Goodwin, W of Montezuma
51 Sight restrictions for southbound traffic making a left turn.
Prescott Granite St near Montezuma
42 the crosswalk at Gurley and Summit is almost non‐existent. It is a highly used area that is extremely dangerous to pedestrians and cyclists
Prescott Gurley, S of Sheldon 27 Hwy 89 South Bound merge to E. Gurley on Bike. Very dangerous.
Prescott Gurley/Park 30 It's difficult for a cyclist to make ANY turns in this intersection. Motorists are not aware that cyclists can use car lanes to make their turns.
Prescott Gurley/Park
54 Dual right turn lanes on Northbound Park Ave. creates a "weave" of traffic when some cars in the #2 right turn lane attempt to cross over the #1 Eastbound Gurley lane to turn left onto Grove within less than 200'.
Prescott Gurley/Sheldon 179 Traffic traveling to Prescott Valley backs up in this area every afternoon (after 5:00pm) and extends past the light at the casinos.
Prescott Gurley/Sheldon
181 Afternoon traffic (after 5:00pm) backs up here everyday and extends far down on Sheldon Street. Traffic again backs up at the Heather Heights intersection and continues past Costco. This is a horrible stretch of road to get through and many rear end accidents occur (or almost occur) here everyday.
Prescott Gurley/Willow
8 Intersection of Gurley and South Willow. Because of the road design pedestrians crossing Gurley cannot see cars well from either side. I am a resident who needs to cross the street and feel in danger always.
Prescott Iron Springs Rd/Gali Gardner area
51 The shoulder is narrow near Wildwood Estates and then widens after that but without stripping. Very confusing for cyclists and does not deliniate where cars/bikes should be
Prescott Iron Springs Rd/Vyne 176 Speed
Prescott Miller Valley Rd/Hillside 56 not a square intersection resulting in near head on conflict in opposite turn lanes E/W and N/S.
Page A66 of A104
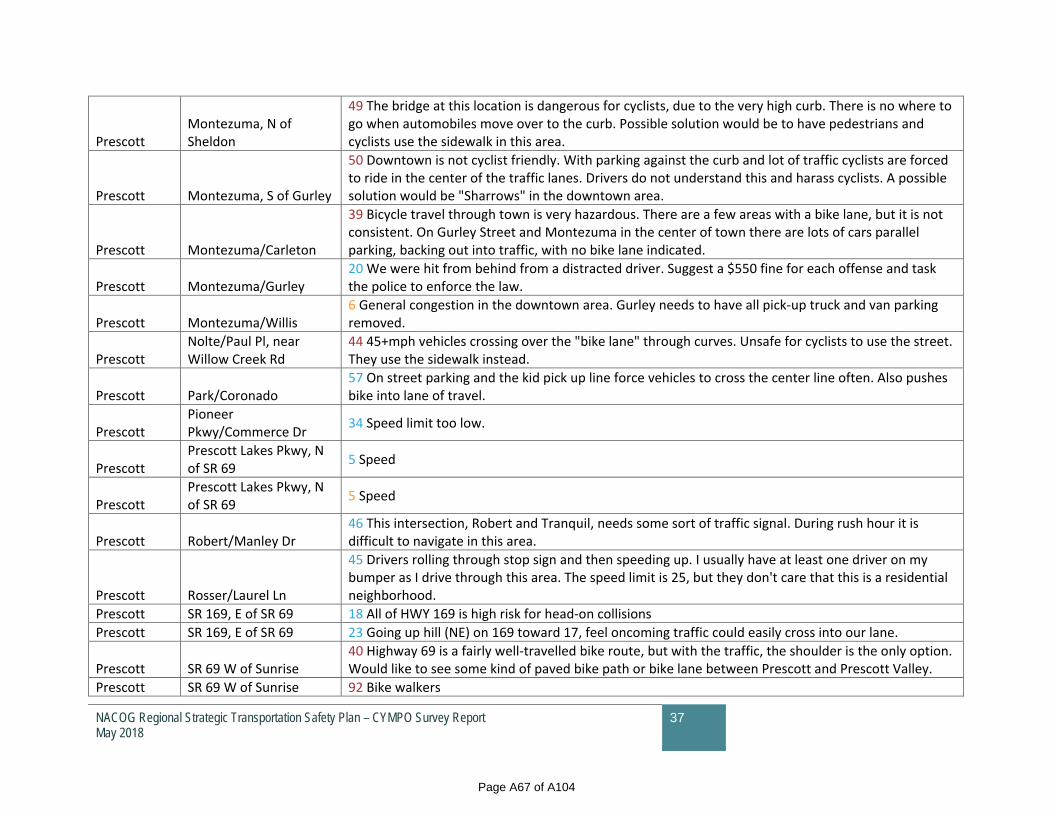
NACOG Regional Strategic Transportation Safety Plan – CYMPO Survey Report May 2018
37
Prescott Montezuma, N of Sheldon
49 The bridge at this location is dangerous for cyclists, due to the very high curb. There is no where to go when automobiles move over to the curb. Possible solution would be to have pedestrians and cyclists use the sidewalk in this area.
Prescott Montezuma, S of Gurley
50 Downtown is not cyclist friendly. With parking against the curb and lot of traffic cyclists are forced to ride in the center of the traffic lanes. Drivers do not understand this and harass cyclists. A possible solution would be "Sharrows" in the downtown area.
Prescott Montezuma/Carleton
39 Bicycle travel through town is very hazardous. There are a few areas with a bike lane, but it is not consistent. On Gurley Street and Montezuma in the center of town there are lots of cars parallel parking, backing out into traffic, with no bike lane indicated.
Prescott Montezuma/Gurley 20 We were hit from behind from a distracted driver. Suggest a $550 fine for each offense and task the police to enforce the law.
Prescott Montezuma/Willis 6 General congestion in the downtown area. Gurley needs to have all pick‐up truck and van parking removed.
Prescott Nolte/Paul Pl, near Willow Creek Rd
44 45+mph vehicles crossing over the "bike lane" through curves. Unsafe for cyclists to use the street. They use the sidewalk instead.
Prescott Park/Coronado 57 On street parking and the kid pick up line force vehicles to cross the center line often. Also pushes bike into lane of travel.
Prescott Pioneer Pkwy/Commerce Dr
34 Speed limit too low.
Prescott Prescott Lakes Pkwy, N of SR 69
5 Speed
Prescott Prescott Lakes Pkwy, N of SR 69
5 Speed
Prescott Robert/Manley Dr 46 This intersection, Robert and Tranquil, needs some sort of traffic signal. During rush hour it is difficult to navigate in this area.
Prescott Rosser/Laurel Ln
45 Drivers rolling through stop sign and then speeding up. I usually have at least one driver on my bumper as I drive through this area. The speed limit is 25, but they don't care that this is a residential neighborhood.
Prescott SR 169, E of SR 69 18 All of HWY 169 is high risk for head‐on collisions
Prescott SR 169, E of SR 69 23 Going up hill (NE) on 169 toward 17, feel oncoming traffic could easily cross into our lane.
Prescott SR 69 W of Sunrise 40 Highway 69 is a fairly well‐travelled bike route, but with the traffic, the shoulder is the only option. Would like to see some kind of paved bike path or bike lane between Prescott and Prescott Valley.
Prescott SR 69 W of Sunrise 92 Bike walkers
Page A67 of A104
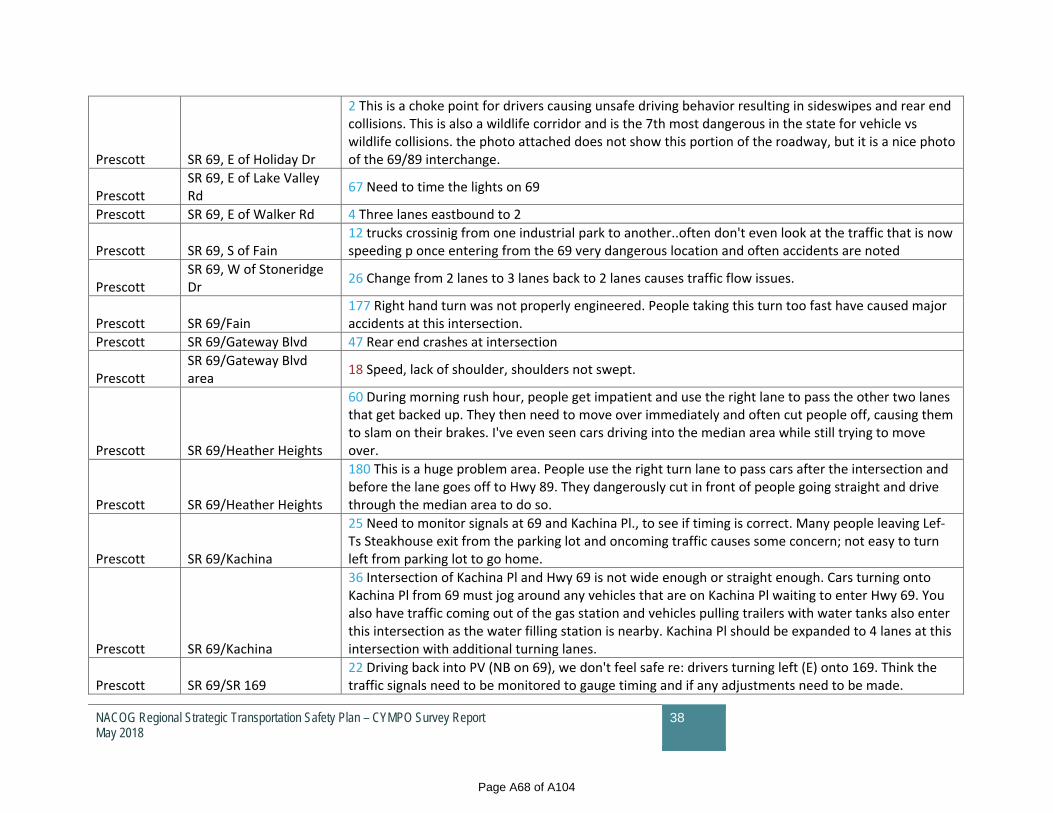
NACOG Regional Strategic Transportation Safety Plan – CYMPO Survey Report May 2018
38
Prescott SR 69, E of Holiday Dr
2 This is a choke point for drivers causing unsafe driving behavior resulting in sideswipes and rear end collisions. This is also a wildlife corridor and is the 7th most dangerous in the state for vehicle vs wildlife collisions. the photo attached does not show this portion of the roadway, but it is a nice photo of the 69/89 interchange.
Prescott SR 69, E of Lake Valley Rd
67 Need to time the lights on 69
Prescott SR 69, E of Walker Rd 4 Three lanes eastbound to 2
Prescott SR 69, S of Fain 12 trucks crossinig from one industrial park to another..often don't even look at the traffic that is now speeding p once entering from the 69 very dangerous location and often accidents are noted
Prescott SR 69, W of Stoneridge Dr
26 Change from 2 lanes to 3 lanes back to 2 lanes causes traffic flow issues.
Prescott SR 69/Fain 177 Right hand turn was not properly engineered. People taking this turn too fast have caused major accidents at this intersection.
Prescott SR 69/Gateway Blvd 47 Rear end crashes at intersection
Prescott SR 69/Gateway Blvd area
18 Speed, lack of shoulder, shoulders not swept.
Prescott SR 69/Heather Heights
60 During morning rush hour, people get impatient and use the right lane to pass the other two lanes that get backed up. They then need to move over immediately and often cut people off, causing them to slam on their brakes. I've even seen cars driving into the median area while still trying to move over.
Prescott SR 69/Heather Heights
180 This is a huge problem area. People use the right turn lane to pass cars after the intersection and before the lane goes off to Hwy 89. They dangerously cut in front of people going straight and drive through the median area to do so.
Prescott SR 69/Kachina
25 Need to monitor signals at 69 and Kachina Pl., to see if timing is correct. Many people leaving Lef‐Ts Steakhouse exit from the parking lot and oncoming traffic causes some concern; not easy to turn left from parking lot to go home.
Prescott SR 69/Kachina
36 Intersection of Kachina Pl and Hwy 69 is not wide enough or straight enough. Cars turning onto Kachina Pl from 69 must jog around any vehicles that are on Kachina Pl waiting to enter Hwy 69. You also have traffic coming out of the gas station and vehicles pulling trailers with water tanks also enter this intersection as the water filling station is nearby. Kachina Pl should be expanded to 4 lanes at this intersection with additional turning lanes.
Prescott SR 69/SR 169 22 Driving back into PV (NB on 69), we don't feel safe re: drivers turning left (E) onto 169. Think the traffic signals need to be monitored to gauge timing and if any adjustments need to be made.
Page A68 of A104
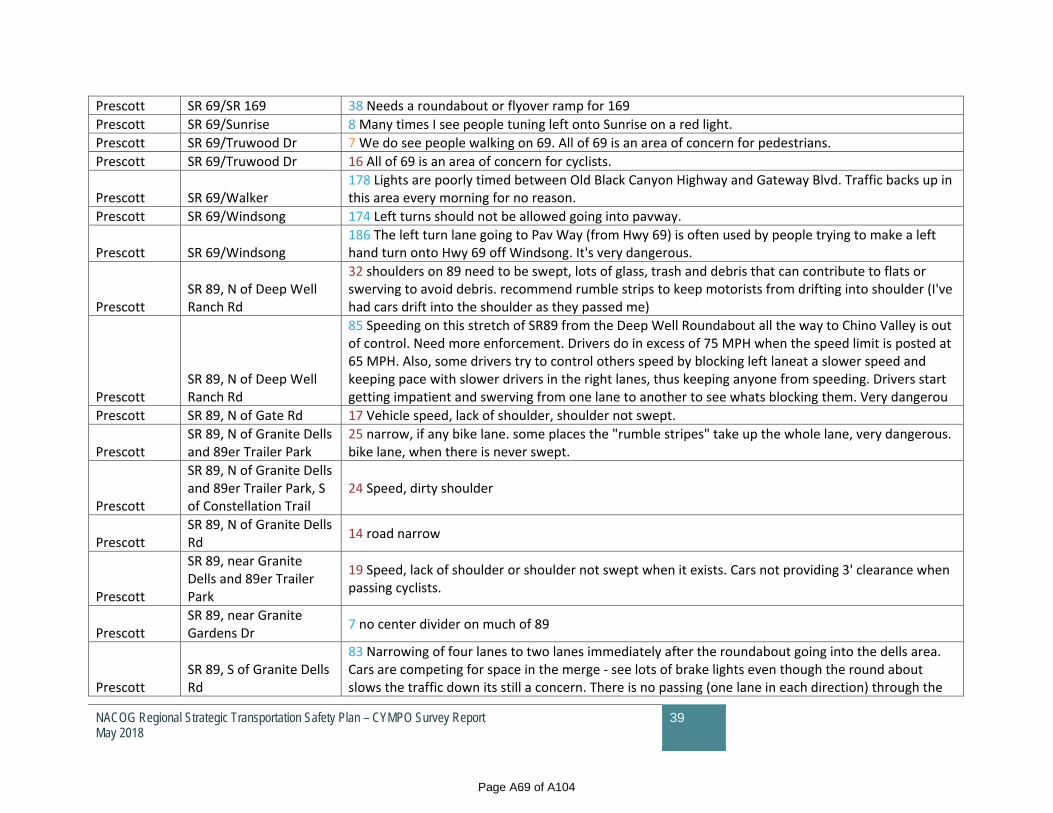
NACOG Regional Strategic Transportation Safety Plan – CYMPO Survey Report May 2018
39
Prescott SR 69/SR 169 38 Needs a roundabout or flyover ramp for 169
Prescott SR 69/Sunrise 8 Many times I see people tuning left onto Sunrise on a red light.
Prescott SR 69/Truwood Dr 7 We do see people walking on 69. All of 69 is an area of concern for pedestrians.
Prescott SR 69/Truwood Dr 16 All of 69 is an area of concern for cyclists.
Prescott SR 69/Walker 178 Lights are poorly timed between Old Black Canyon Highway and Gateway Blvd. Traffic backs up in this area every morning for no reason.
Prescott SR 69/Windsong 174 Left turns should not be allowed going into pavway.
Prescott SR 69/Windsong 186 The left turn lane going to Pav Way (from Hwy 69) is often used by people trying to make a left hand turn onto Hwy 69 off Windsong. It's very dangerous.
Prescott SR 89, N of Deep Well Ranch Rd
32 shoulders on 89 need to be swept, lots of glass, trash and debris that can contribute to flats or swerving to avoid debris. recommend rumble strips to keep motorists from drifting into shoulder (I've had cars drift into the shoulder as they passed me)
Prescott SR 89, N of Deep Well Ranch Rd
85 Speeding on this stretch of SR89 from the Deep Well Roundabout all the way to Chino Valley is out of control. Need more enforcement. Drivers do in excess of 75 MPH when the speed limit is posted at 65 MPH. Also, some drivers try to control others speed by blocking left laneat a slower speed and keeping pace with slower drivers in the right lanes, thus keeping anyone from speeding. Drivers start getting impatient and swerving from one lane to another to see whats blocking them. Very dangerou
Prescott SR 89, N of Gate Rd 17 Vehicle speed, lack of shoulder, shoulder not swept.
Prescott SR 89, N of Granite Dells and 89er Trailer Park
25 narrow, if any bike lane. some places the "rumble stripes" take up the whole lane, very dangerous. bike lane, when there is never swept.
Prescott
SR 89, N of Granite Dells and 89er Trailer Park, S of Constellation Trail
24 Speed, dirty shoulder
Prescott SR 89, N of Granite Dells Rd
14 road narrow
Prescott
SR 89, near Granite Dells and 89er Trailer Park
19 Speed, lack of shoulder or shoulder not swept when it exists. Cars not providing 3' clearance when passing cyclists.
Prescott SR 89, near Granite Gardens Dr
7 no center divider on much of 89
Prescott SR 89, S of Granite Dells Rd
83 Narrowing of four lanes to two lanes immediately after the roundabout going into the dells area. Cars are competing for space in the merge ‐ see lots of brake lights even though the round about slows the traffic down its still a concern. There is no passing (one lane in each direction) through the
Page A69 of A104

NACOG Regional Strategic Transportation Safety Plan – CYMPO Survey Report May 2018
40
dells area.
Prescott SR 89, S of Haisley Rd 45 Vegetation hanging into roadways pushes cyclists into travel lane.
Prescott SR 89, S of Perkins Dr 15 When a southbound care is waiting to turn into the golf course all of the southbound motorists pass on the right shoulder.
Prescott SR 89, S of Watson Lake Park Rd
18 I have seen pedestrians try to walk through the cross walk to the convenience store in the round about here and nearly get run over on more than one occasion. Traffic coming into the roundabout barely break if there are no cars since it's a yield and not a stop. Perhaps some signage to watch for pedestrians.
Prescott SR 89, Stoneridge Dr area
13 SR69 through Prescott Valley is constant stop and go. Too many commercial vehicles mixed with private passenger vehicles.
Prescott SR 89/Copper Basin Rd 37 need wide and well marked bicycle lanes.
Prescott SR 89/Copper Basin Rd 43 setting sun glare. Vehicle drivers may not see cyclist waiting at the signal.
Prescott SR 89/Copper Basin Rd 53 Setting sun glare in winter for westbound drivers approaching the signal.
Prescott SR 89/Perkins Dr
84 This is a horrible driveway location/entrance. It should be moved to MacCurdy so that people can get onto SR89 at the traffic light. Left turns from the Golf Club House are sooooooo unsafe. People take risks all the time because they get tired of waiting to turn. Speed on SR89 posted at 45 but people always go faster than that through this area.
Prescott SR 89/Watson Lake Park Rd
47 The Prescott Circle Trail has two locations which have dangerous roadway crossings, this is one of them. From Watson Lake trail to the Willow Lake trail, a cyclists/hikers must cross SR 89 at this roundabout and proceed along Willow Lake Road. Neither of which are safe.
Prescott SR 89A, E of SR89 20 Motorists' speed and lack of paved, safe path for cyclists to travel east west.
Prescott SR 89A, E of SR89
41 All of the on/off ramps along this highway create a hazardous situation for cyclists. With motorists entering the highway at high speed, cyclists riding between Prescott and Prescott Valley are caught in between the highway traffic and entering/exiting traffic. m
Prescott SR 89A, E of SR89 near Side Rd
21 Motorists' speed and lack of safe, paved path for cyclists to travel east/west between Prescott and Prescott Valley.
Prescott SR 89A, E of SR89 near Side Rd
33 shoulders on 89 need to be swept, lots of glass, trash and debris that can contribute to flats or swerving to avoid debris. recommend rumble strips to keep motorists from drifting into shoulder (I've had cars drift into the shoulder as they passed me)
Prescott SR 89A, W of Glassford Hill Rd
11 horrible conditions in weather and speeding vehicles and trucks create massive sight issues...many drivers washed over with spray and snow from trucks and dangerous. no safe place to pull off and be seen, bikes, motorcycles and even pedestrians often on ighway.
Prescott SR 89A/Viewpoint Dr 26 Good shoulder for bike riding but very dirty ... glass, etc.
Page A70 of A104

NACOG Regional Strategic Transportation Safety Plan – CYMPO Survey Report May 2018
41
Prescott Viewpoint/Park View Dr
68 Speed limit should be raised to 35 mph on Viewpoint Drive. This is supported by the 2006 Speed Limit Analysis Study commissioned by Prescott Valley which shows the 85‐percentile speed along this corridor to be between 37‐39 mph.
Prescott Williamson Valley Rd, N of Bridle Path
38 Lack of shoulder or bike lane; lots of trucks pulling trailers at relatively high speed.
Prescott Williamson Valley Rd, N of Pioneer Pkwy
31 Williams Valley road from Pioneer Parkway to Outer Loop Road has no shoulders or bike lanes
Prescott Williamson Valley Rd, S of Pioneer Pkwy
23 Lack of shoulder on sections of Williamson Valley Road make it unsafe for bicyclists
Prescott Williamson Valley Rd, S of Ridge Dr
39 Fast moving traffic on this single lane road can be dangerous when a vehicle needs to come to a complete stop in order to turn across traffic. Also, with the lack of passing lanes on this strech agressive drivers are often encountered who appear frustrated at having to go the speed limit and often tailgate.
Prescott Williamson Valley Rd/Pioneer Pkwy
33 Through traffic light too short.
Prescott Williamson Valley Rd/Pioneer Pkwy
48 Hikers/Cyclists must cross Williamson Valley Road at this point, when doing the Prescott Circle Trail. This intersection does not have crosswalks, nor does it allow for a safe crossing of Williamson Valley Road or Pioneer Parkway at this intersection. Installing crosswalks and signaling from the NE corner of the intersection to the West and South would greatly improve safe crossings.
Prescott Willis, E of Montezuma 48 Vehicles backing out of angled parking stalls into narrow travel lanes.
Prescott Willow Creek Rd, N of Mitchell
46 Willow Creek Road from Pleasant Valley Drive to Green Lane is one of the most dangerous roads in the Prescott area for Cyclists. The traffic is at 40 MPH+ with no bike lane and vehicles use the "white stripped area" on the right side of the roadway for extra lane width. As there are no other North/South routes in this part of the area, it is a highly used cycling route. Please design a way to have an off pavement pedestrian/bike lane along this portion of Willow Creek Road.
Prescott Willow Creek Rd, S of Mitchell
29 Would like to commute to ERAU from south side of Prescott, but drivers travel to fast.
Prescott Willow Creek Rd, S of Mitchell
55 Higher speed traffic (45+mph) through curves and hills with no median space between head‐on traffic.
Prescott Willow Creek, S of Nolte 87 Frequent speeding on Willow Creek Road, which is curvy and is only separated by a double yellow line. Crossover collisions are a real possibility.
Prescott Willow Creek/Commerce Dr
41 Major congestion during the morning commute time heading towards town. Lights are not long enough and/or timed well resulting in traffic back‐ups.
Page A71 of A104
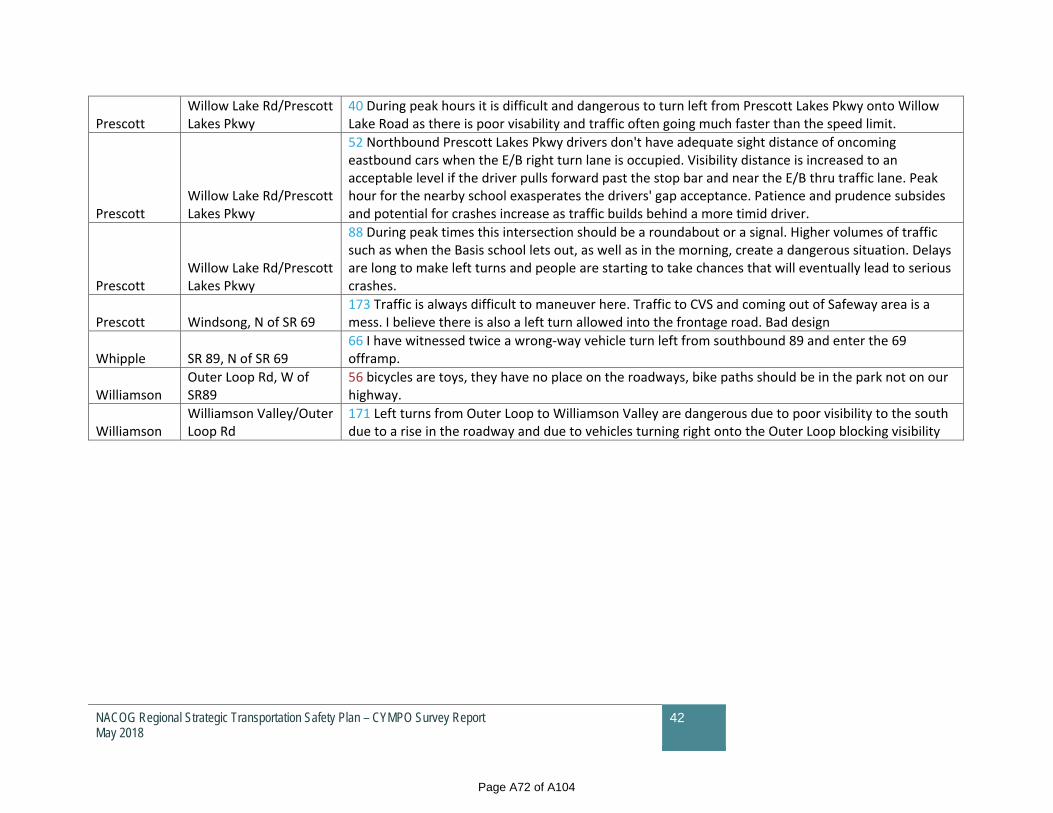
NACOG Regional Strategic Transportation Safety Plan – CYMPO Survey Report May 2018
42
Prescott Willow Lake Rd/Prescott Lakes Pkwy
40 During peak hours it is difficult and dangerous to turn left from Prescott Lakes Pkwy onto Willow Lake Road as there is poor visability and traffic often going much faster than the speed limit.
Prescott Willow Lake Rd/Prescott Lakes Pkwy
52 Northbound Prescott Lakes Pkwy drivers don't have adequate sight distance of oncoming eastbound cars when the E/B right turn lane is occupied. Visibility distance is increased to an acceptable level if the driver pulls forward past the stop bar and near the E/B thru traffic lane. Peak hour for the nearby school exasperates the drivers' gap acceptance. Patience and prudence subsides and potential for crashes increase as traffic builds behind a more timid driver.
Prescott Willow Lake Rd/Prescott Lakes Pkwy
88 During peak times this intersection should be a roundabout or a signal. Higher volumes of traffic such as when the Basis school lets out, as well as in the morning, create a dangerous situation. Delays are long to make left turns and people are starting to take chances that will eventually lead to serious crashes.
Prescott Windsong, N of SR 69 173 Traffic is always difficult to maneuver here. Traffic to CVS and coming out of Safeway area is a mess. I believe there is also a left turn allowed into the frontage road. Bad design
Whipple SR 89, N of SR 69 66 I have witnessed twice a wrong‐way vehicle turn left from southbound 89 and enter the 69 offramp.
Williamson Outer Loop Rd, W of SR89
56 bicycles are toys, they have no place on the roadways, bike paths should be in the park not on our highway.
Williamson Williamson Valley/Outer Loop Rd
171 Left turns from Outer Loop to Williamson Valley are dangerous due to poor visibility to the south due to a rise in the roadway and due to vehicles turning right onto the Outer Loop blocking visibility
Page A72 of A104
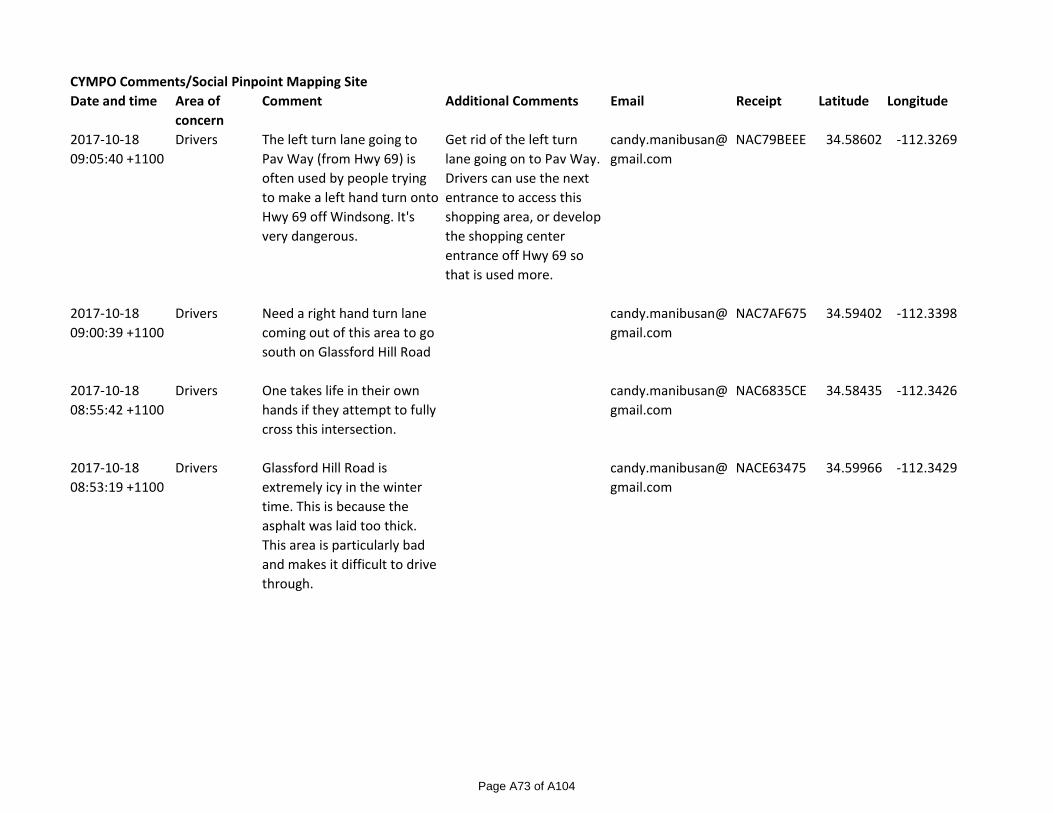
CYMPO Comments/Social Pinpoint Mapping SiteDate and time Area of
concernComment Additional Comments Email Receipt Latitude Longitude
2017-10-18 09:05:40 +1100
Drivers The left turn lane going to Pav Way (from Hwy 69) is often used by people trying to make a left hand turn onto Hwy 69 off Windsong. It's very dangerous.
Get rid of the left turn lane going on to Pav Way. Drivers can use the next entrance to access this shopping area, or develop the shopping center entrance off Hwy 69 so that is used more.
NAC79BEEE 34.58602 -112.3269
2017-10-18 09:00:39 +1100
Drivers Need a right hand turn lane coming out of this area to go south on Glassford Hill Road
NAC7AF675 34.59402 -112.3398
2017-10-18 08:55:42 +1100
Drivers One takes life in their own hands if they attempt to fully cross this intersection.
NAC6835CE 34.58435 -112.3426
2017-10-18 08:53:19 +1100
Drivers Glassford Hill Road is extremely icy in the winter time. This is because the asphalt was laid too thick. This area is particularly bad and makes it difficult to drive through.
NACE63475 34.59966 -112.3429
Page A73 of A104

2017-10-18 08:49:09 +1100
Drivers Having only one lane coming out of Lone Cactus is horrible in the mornings. Traffic backs up and if someone is turning left, you wait forever for them to go. The construction took out the extra room to go around them, so now the line of cars just gets stuck and goes nowhere.
Need to add extra lanes coming out of Lone Cactus to allow for people going right, making a left, or trying to get to the left turn lanes on Long Look for going south on Glassford Hill Rd.
NACB86742 34.60061 -112.3423
2017-10-18 08:41:01 +1100
Drivers Afternoon traffic (after 5:00pm) backs up here everyday and extends far down on Sheldon Street. Traffic again backs up at the Heather Heights intersection and continues past Costco. This is a horrible stretch of road to get through and many rear end accidents occur (or almost occur) here everyday.
Fix the signals to keep heavy traffic flowing during the busy morning and afternoon hours.
NACCB604B 34.5446 -112.4535
Page A74 of A104
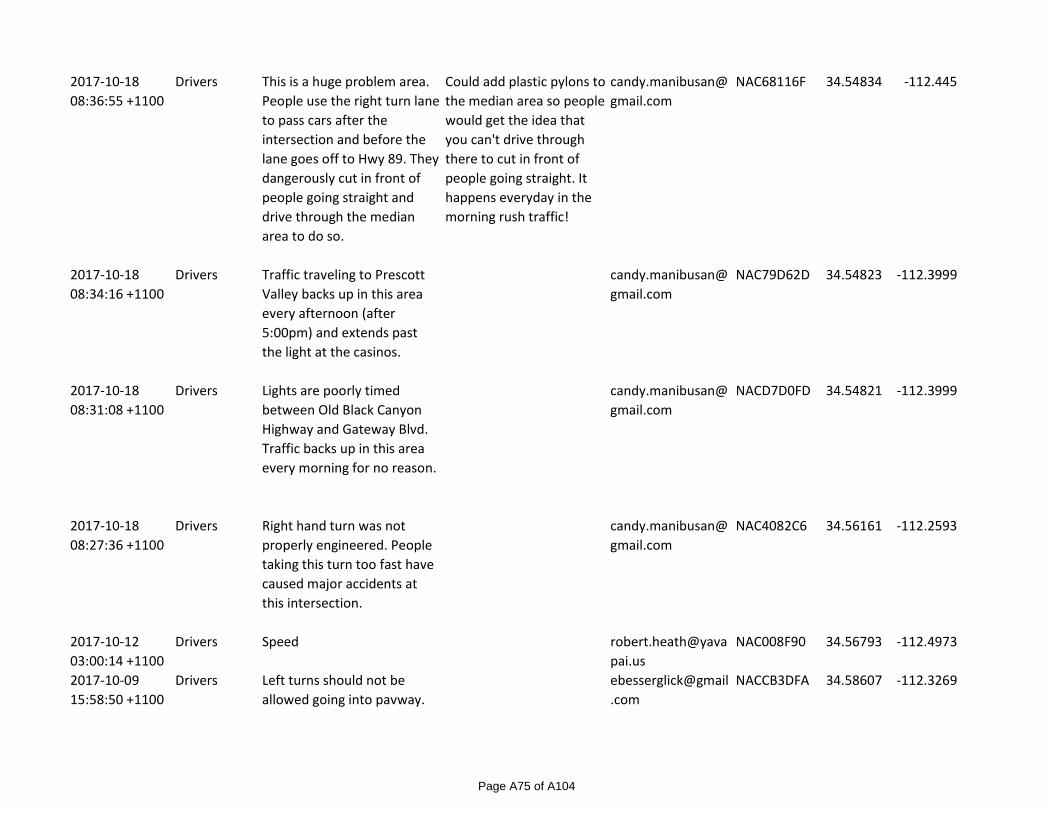
2017-10-18 08:36:55 +1100
Drivers This is a huge problem area. People use the right turn lane to pass cars after the intersection and before the lane goes off to Hwy 89. They dangerously cut in front of people going straight and drive through the median area to do so.
Could add plastic pylons to the median area so people would get the idea that you can't drive through there to cut in front of people going straight. It happens everyday in the morning rush traffic!
NAC68116F 34.54834 -112.445
2017-10-18 08:34:16 +1100
Drivers Traffic traveling to Prescott Valley backs up in this area every afternoon (after 5:00pm) and extends past the light at the casinos.
NAC79D62D 34.54823 -112.3999
2017-10-18 08:31:08 +1100
Drivers Lights are poorly timed between Old Black Canyon Highway and Gateway Blvd. Traffic backs up in this area every morning for no reason.
NACD7D0FD 34.54821 -112.3999
2017-10-18 08:27:36 +1100
Drivers Right hand turn was not properly engineered. People taking this turn too fast have caused major accidents at this intersection.
NAC4082C6 34.56161 -112.2593
2017-10-12 03:00:14 +1100
Drivers Speed [email protected]
NAC008F90 34.56793 -112.4973
2017-10-09 15:58:50 +1100
Drivers Left turns should not be allowed going into pavway.
NACCB3DFA 34.58607 -112.3269
Page A75 of A104
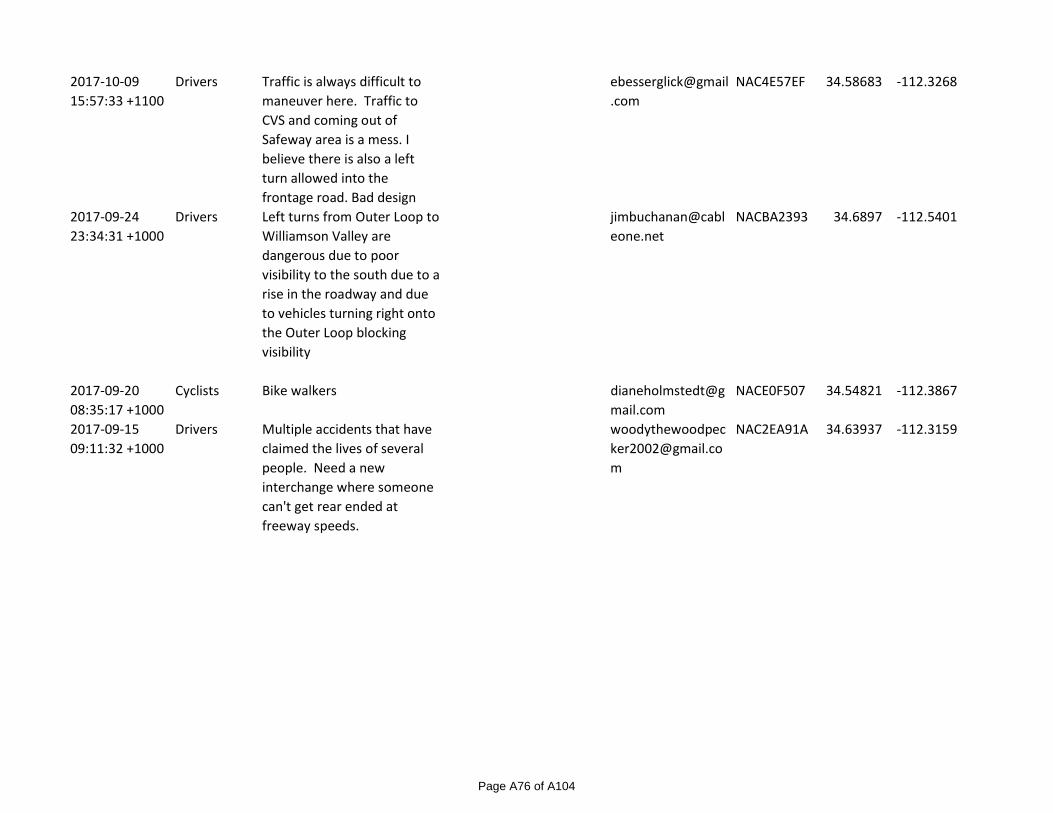
2017-10-09 15:57:33 +1100
Drivers Traffic is always difficult to maneuver here. Traffic to CVS and coming out of Safeway area is a mess. I believe there is also a left turn allowed into the frontage road. Bad design
NAC4E57EF 34.58683 -112.3268
2017-09-24 23:34:31 +1000
Drivers Left turns from Outer Loop to Williamson Valley are dangerous due to poor visibility to the south due to a rise in the roadway and due to vehicles turning right onto the Outer Loop blocking visibility
NACBA2393 34.6897 -112.5401
2017-09-20 08:35:17 +1000
Cyclists Bike walkers [email protected]
NACE0F507 34.54821 -112.3867
2017-09-15 09:11:32 +1000
Drivers Multiple accidents that have claimed the lives of several people. Need a new interchange where someone can't get rear ended at freeway speeds.
NAC2EA91A 34.63937 -112.3159
Page A76 of A104
2017-09-14 23:53:31 +1000
Drivers During peak times this intersection should be a roundabout or a signal. Higher volumes of traffic such as when the Basis school lets out, as well as in the morning, create a dangerous situation. Delays are long to make left turns and people are starting to take chances that will eventually lead to serious crashes.
NAC27327B 34.59325 -112.4317
2017-09-14 23:45:30 +1000
Drivers Frequent speeding on Willow Creek Road, which is curvy and is only separated by a double yellow line. Crossover collisions are a real possibility.
NAC73C7B8 34.58381 -112.4804
2017-09-13 02:29:49 +1000
Pedestrians I have seen pedestrians try to walk through the cross walk to the convenience store in the round about here and nearly get run over on more than one occasion. Traffic coming into the roundabout barely break if there are no cars since it's a yield and not a stop. Perhaps some signage to watch for pedestrians.
NAC2F3416 34.59142 -112.4258
Page A77 of A104
2017-09-13 02:27:11 +1000
Drivers Speeding on this stretch of SR89 from the Deep Well Roundabout all the way to Chino Valley is out of control. Need more enforcement. Drivers do in excess of 75 MPH when the speed limit is posted at 65 MPH. Also, some drivers try to control others speed by blocking left laneat a slower speed and keeping pace with slower drivers in the right lanes, thus keeping anyone from speeding. Drivers start getting impatient and swerving from one lane to another to see whats blocking them. Very dangerou
NAC5B0E5F 34.65718 -112.4366
Page A78 of A104
2017-09-13 02:23:01 +1000
Drivers This is a horrible driveway location/entrance. It should be moved to MacCurdy so that people can get onto SR89 at the traffic light. Left turns from the Golf Club House are sooooooo unsafe. People take risks all the time because they get tired of waiting to turn. Speed on SR89 posted at 45 but people always go faster than that through this area.
NAC734D0A 34.63911 -112.4315
2017-09-13 02:20:27 +1000
Drivers Narrowing of four lanes to two lanes immediately after the roundabout going into the dells area. Cars are competing for space in the merge - see lots of brake lights even though the round about slows the traffic down its still a concern. There is no passing (one lane in each direction) through the dells area.
NACC4025D 34.60057 -112.4244
Page A79 of A104

2017-09-07 07:58:55 +1000
Cyclists bicycles are toys, they have no place on the roadways, bike paths should be in the park not on our highway.
I was taught to be polite to others, to wait my turn etc. This apparently is not the case today. Punching someone in the nose will get you sued. Law Enforcement unfortunately is left with this job. The public's behavior is out of control.
NAC170E02 34.68912 -112.5021
2017-09-07 05:44:08 +1000
Drivers Speed limit should be raised to 35 mph on Viewpoint Drive. This is supported by the 2006 Speed Limit Analysis Study commissioned by Prescott Valley which shows the 85-percentile speed along this corridor to be between 37-39 mph.
Study can be found here: http://www.pvaz.net/documentcenter/view/731. See page 19 for traffic data for Viewpoint Drive.
NAC74C6C0 34.65273 -112.3365
2017-09-07 05:33:28 +1000
Drivers Need to time the lights on 69 [email protected]
NAC53EEB7 34.58543 -112.3301
2017-09-07 05:27:33 +1000
Drivers I have witnessed twice a wrong-way vehicle turn left from southbound 89 and enter the 69 offramp.
NAC416FEA 34.55073 -112.4499
Page A80 of A104
2017-09-07 03:32:38 +1000
Cyclists The shoulder is narrow near Wildwood Estates and then widens after that but without stripping. Very confusing for cyclists and does not deliniate where cars/bikes should be
Iron Springs Road is a very popular road for cyclists throughout the US to ride on when in this area, which is often. The Race Across America frequently uses this route. Local citizens use this road as part of "Skull Valley Loop" A Bicycle Lane on both sides of the road for the entire length to the intersection turning to Hillside would be ideal
NAC54BE80 34.56128 -112.4911
2017-09-02 09:01:05 +1000
Drivers The speed limit is 35 but speeding is all too common on this stretch. On several separate occasions, I have witnessed vehicles crossing into oncoming traffic to pass.
NAC05DA9C 34.64307 -112.3193
Page A81 of A104
2017-09-02 08:22:13 +1000
Drivers During morning rush hour, people get impatient and use the right lane to pass the other two lanes that get backed up. They then need to move over immediately and often cut people off, causing them to slam on their brakes. I've even seen cars driving into the median area while still trying to move over.
NAC8A48F9 34.54837 -112.4448
2017-09-02 08:16:51 +1000
Drivers I've seen numerous people run this light well after it turned red.
NAC56E26D 34.63923 -112.3155
2017-09-02 00:53:40 +1000
Cyclists Downtown is not cyclist friendly. With parking against the curb and lot of traffic cyclists are forced to ride in the center of the traffic lanes. Drivers do not understand this and harass cyclists. A possible solution would be "Sharrows" in the downtown area.
NACFD953A 34.54096 -112.4701
Page A82 of A104
2017-09-02 00:50:20 +1000
Cyclists The bridge at this location is dangerous for cyclists, due to the very high curb. There is no where to go when automobiles move over to the curb. Possible solution would be to have pedestrians and cyclists use the sidewalk in this area.
NACF2BF8C 34.548 -112.4694
2017-09-02 00:47:12 +1000
Cyclists Hikers/Cyclists must cross Williamson Valley Road at this point, when doing the Prescott Circle Trail. This intersection does not have crosswalks, nor does it allow for a safe crossing of Williamson Valley Road or Pioneer Parkway at this intersection. Installing crosswalks and signaling from the NE corner of the intersection to the West and South would greatly improve safe crossings.
NAC6AF259 34.60542 -112.4959
Page A83 of A104

2017-09-02 00:41:27 +1000
Cyclists The Prescott Circle Trail has two locations which have dangerous roadway crossings, this is one of them. From Watson Lake trail to the Willow Lake trail, a cyclists/hikers must cross SR 89 at this roundabout and proceed along Willow Lake Road. Neither of which are safe.
NACB17813 34.59229 -112.4258
2017-09-02 00:32:42 +1000
Drivers The Walmart parking lot exit to Gail Gardner, has very limited site distance due to trees and bushes being planted at the curb. With the curving roadway this makes pulling out into traffic a dangerous situation.
NACF71BF2 34.56537 -112.4846
Page A84 of A104
2017-09-02 00:28:01 +1000
Cyclists Willow Creek Road from Pleasant Valley Drive to Green Lane is one of the most dangerous roads in the Prescott area for Cyclists. The traffic is at 40 MPH+ with no bike lane and vehicles use the "white stripped area" on the right side of the roadway for extra lane width. As there are no other North/South routes in this part of the area, it is a highly used cycling route. Please design a way to have an off pavement pedestrian/bike lane along this portion of Willow Creek Road.
NACEF7E7D 34.59061 -112.4724
2017-09-01 10:23:56 +1000
Cyclists Vegetation hanging into roadways pushes cyclists into travel lane.
NAC04D7AF 34.51466 -112.4774
2017-09-01 10:20:13 +1000
Drivers On street parking and the kid pick up line force vehicles to cross the center line often. Also pushes bike into lane of travel.
Equally bad for bikes. [email protected]
NAC2FBC1C 34.54042 -112.4774
Page A85 of A104
2017-09-01 10:17:30 +1000
Drivers not a square intersection resulting in near head on conflict in opposite turn lanes E/W and N/S.
NAC60899E 34.55306 -112.4808
2017-09-01 09:31:16 +1000
Drivers Higher speed traffic (45+mph) through curves and hills with no median space between head-on traffic.
NAC6B597A 34.58726 -112.4743
2017-09-01 09:29:36 +1000
Cyclists 45+mph vehicles crossing over the "bike lane" through curves. Unsafe for cyclists to use the street. They use the sidewalk instead.
NAC92392A 34.58594 -112.4762
2017-09-01 09:27:24 +1000
Drivers Dual right turn lanes on Northbound Park Ave. creates a "weave" of traffic when some cars in the #2 right turn lane attempt to cross over the #1 Eastbound Gurley lane to turn left onto Grove within less than 200'.
NAC84DFE4 34.54215 -112.4771
2017-09-01 09:24:17 +1000
Cyclists setting sun glare. Vehicle drivers may not see cyclist waiting at the signal.
NAC1C19E5 34.52953 -112.4756
2017-09-01 09:23:23 +1000
Drivers Setting sun glare in winter for westbound drivers approaching the signal.
NAC85438A 34.5295 -112.4758
Page A86 of A104
2017-09-01 09:21:09 +1000
Drivers Northbound Prescott Lakes Pkwy drivers don't have adequate sight distance of oncoming eastbound cars when the E/B right turn lane is occupied. Visibility distance is increased to an acceptable level if the driver pulls forward past the stop bar and near the E/B thru traffic lane. Peak hour for the nearby school exasperates the drivers' gap acceptance. Patience and prudence subsides and potential for crashes increase as traffic builds behind a more timid driver.
NAC8CD58A 34.59335 -112.4316
2017-09-01 09:09:54 +1000
Drivers Sight restrictions for southbound traffic making a left turn.
NACDB3662 34.53979 -112.4715
2017-09-01 09:06:39 +1000
Drivers Drivers go into and through the curve too fast. 25mph curve is unexpected for northbound traffic after driving several miles on a 45+mph rural highway.
NAC9124B7 34.6509 -112.4387
Page A87 of A104
2017-09-01 09:00:46 +1000
Drivers Vehicles backing out of angled parking stalls into narrow travel lanes.
NACBB5C30 34.54434 -112.4687
2017-09-01 09:00:25 +1000
Drivers Vehicles backing out of angled parking stalls into narrow travel lanes.
NAC97871E 34.54365 -112.4694
2017-09-01 08:57:25 +1000
Drivers Rear end crashes at intersection
NACBF5AC9 34.55108 -112.411
2017-09-01 06:43:10 +1000
Drivers This intersection, Robert and Tranquil, needs some sort of traffic signal. During rush hour it is difficult to navigate in this area.
NAC562973 34.61547 -112.3208
2017-09-01 01:19:05 +1000
Cyclists the crosswalk at Gurley and Summit is almost non-existent. It is a highly used area that is extremely dangerous to pedestrians and cyclists
Most towns in AZ have clearly marked crosswalks with lighting that pedestrians can use when crossing high use crossings. This crosswalk often has drivers looking into the sun who cannot see people who are crossing. A crossing light would be of great benefit.
NAC514906 34.52919 -112.4698
Page A88 of A104
2017-08-31 02:30:13 +1000
Drivers Drivers rolling through stop sign and then speeding up. I usually have at least one driver on my bumper as I drive through this area. The speed limit is 25, but they don't care that this is a residential neighborhood.
NACC74374 34.56933 -112.4619
2017-08-29 14:27:40 +1000
Cyclists All of the on/off ramps along this highway create a hazardous situation for cyclists. With motorists entering the highway at high speed, cyclists riding between Prescott and Prescott Valley are caught in between the highway traffic and entering/exiting traffic. m
At each entrance or exit ramp, there is no clear signage to say who has right of way, and who should yield. Cyclists are typically riding on the shoulder and have to move from the regular shoulder, across the entrance or exit lane, to the far right in order to stay out of traffic. Cars are generally not interested in yielding to cyclists but it becomes very dangerous to be caught in the middle when traffic is busy.
NAC24C142 34.63474 -112.4156
Page A89 of A104
2017-08-29 14:23:45 +1000
Cyclists Highway 69 is a fairly well-travelled bike route, but with the traffic, the shoulder is the only option. Would like to see some kind of paved bike path or bike lane between Prescott and Prescott Valley.
NAC96115D 34.54778 -112.3893
2017-08-29 14:21:05 +1000
Cyclists Bicycle travel through town is very hazardous. There are a few areas with a bike lane, but it is not consistent. On Gurley Street and Montezuma in the center of town there are lots of cars parallel parking, backing out into traffic, with no bike lane indicated.
It is very difficult to commute or travel through Prescott on a bicycle. Once you are close to town, the roads narrow and there are little or no bike lanes. Parallel or angle parking adds an additional hazard, with lots of tourists looking for parking and not paying attention to cyclists. We need a well-marked bicycle route and lane through town.
NACC4A76A 34.53866 -112.4707
Page A90 of A104
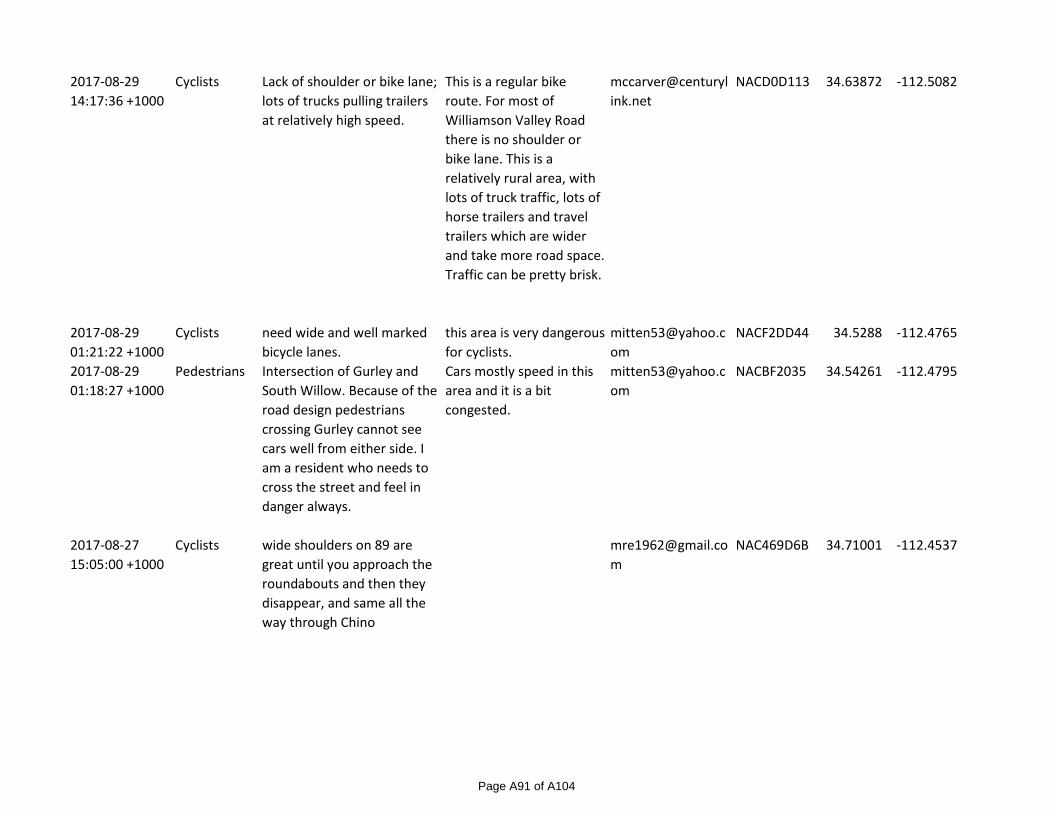
2017-08-29 14:17:36 +1000
Cyclists Lack of shoulder or bike lane; lots of trucks pulling trailers at relatively high speed.
This is a regular bike route. For most of Williamson Valley Road there is no shoulder or bike lane. This is a relatively rural area, with lots of truck traffic, lots of horse trailers and travel trailers which are wider and take more road space. Traffic can be pretty brisk.
NACD0D113 34.63872 -112.5082
2017-08-29 01:21:22 +1000
Cyclists need wide and well marked bicycle lanes.
this area is very dangerous for cyclists.
NACF2DD44 34.5288 -112.4765
2017-08-29 01:18:27 +1000
Pedestrians Intersection of Gurley and South Willow. Because of the road design pedestrians crossing Gurley cannot see cars well from either side. I am a resident who needs to cross the street and feel in danger always.
Cars mostly speed in this area and it is a bit congested.
NACBF2035 34.54261 -112.4795
2017-08-27 15:05:00 +1000
Cyclists wide shoulders on 89 are great until you approach the roundabouts and then they disappear, and same all the way through Chino
NAC469D6B 34.71001 -112.4537
Page A91 of A104
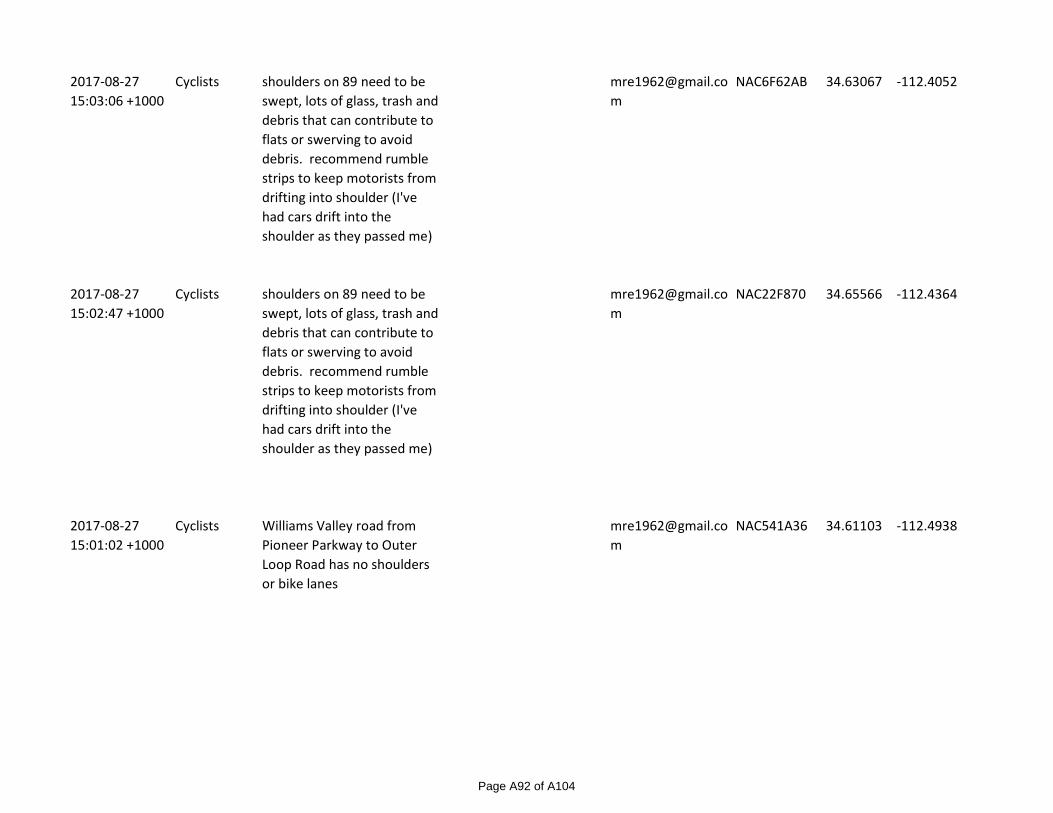
2017-08-27 15:03:06 +1000
Cyclists shoulders on 89 need to be swept, lots of glass, trash and debris that can contribute to flats or swerving to avoid debris. recommend rumble strips to keep motorists from drifting into shoulder (I've had cars drift into the shoulder as they passed me)
NAC6F62AB 34.63067 -112.4052
2017-08-27 15:02:47 +1000
Cyclists shoulders on 89 need to be swept, lots of glass, trash and debris that can contribute to flats or swerving to avoid debris. recommend rumble strips to keep motorists from drifting into shoulder (I've had cars drift into the shoulder as they passed me)
NAC22F870 34.65566 -112.4364
2017-08-27 15:01:02 +1000
Cyclists Williams Valley road from Pioneer Parkway to Outer Loop Road has no shoulders or bike lanes
NAC541A36 34.61103 -112.4938
Page A92 of A104
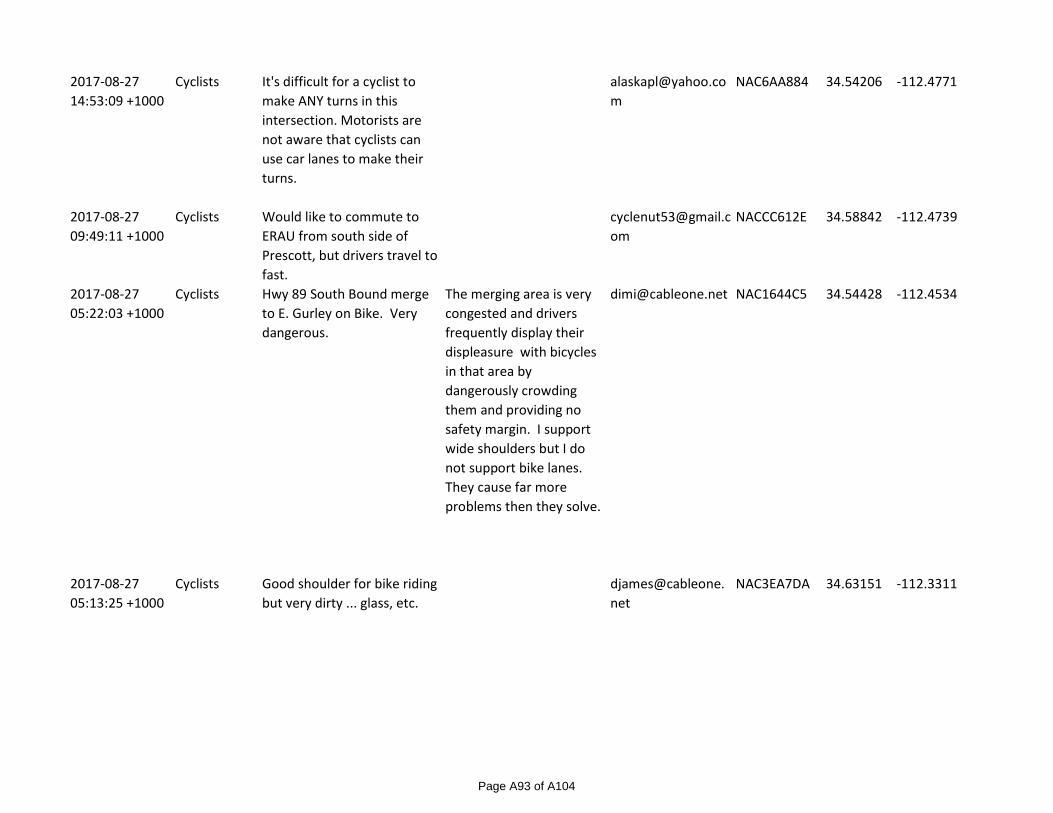
2017-08-27 14:53:09 +1000
Cyclists It's difficult for a cyclist to make ANY turns in this intersection. Motorists are not aware that cyclists can use car lanes to make their turns.
NAC6AA884 34.54206 -112.4771
2017-08-27 09:49:11 +1000
Cyclists Would like to commute to ERAU from south side of Prescott, but drivers travel to fast.
NACCC612E 34.58842 -112.4739
2017-08-27 05:22:03 +1000
Cyclists Hwy 89 South Bound merge to E. Gurley on Bike. Very dangerous.
The merging area is very congested and drivers frequently display their displeasure with bicycles in that area by dangerously crowding them and providing no safety margin. I support wide shoulders but I do not support bike lanes. They cause far more problems then they solve.
[email protected] NAC1644C5 34.54428 -112.4534
2017-08-27 05:13:25 +1000
Cyclists Good shoulder for bike riding but very dirty ... glass, etc.
NAC3EA7DA 34.63151 -112.3311
Page A93 of A104
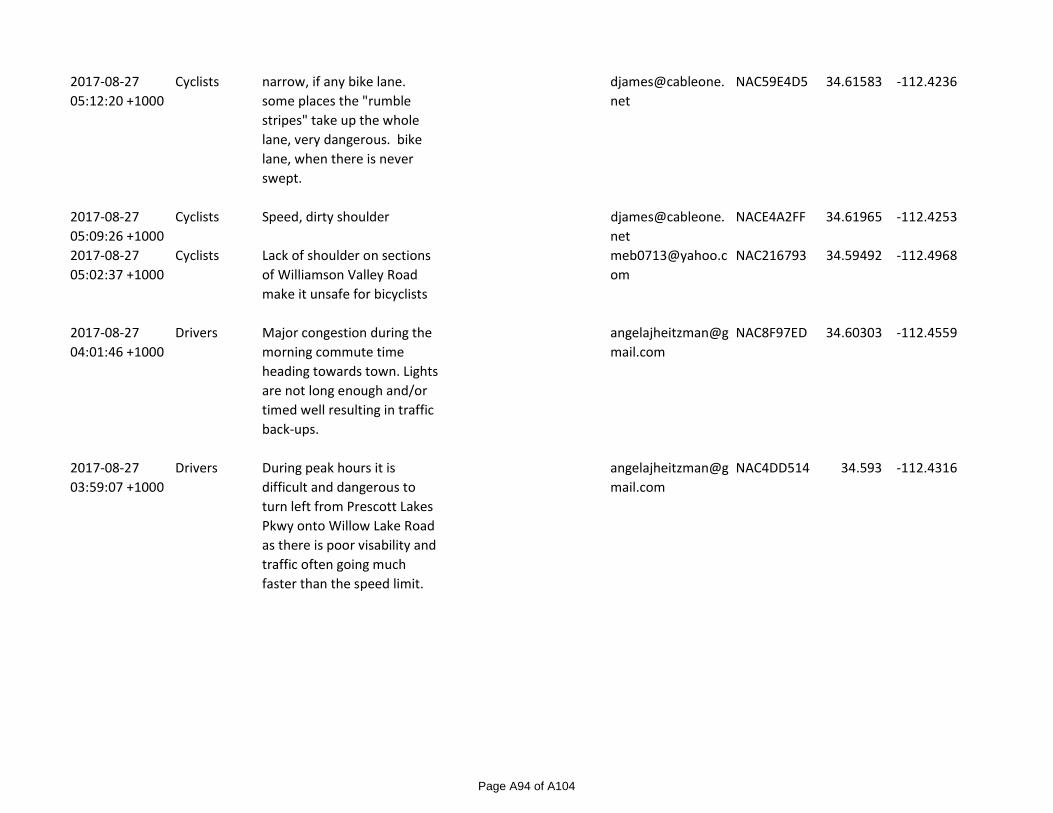
2017-08-27 05:12:20 +1000
Cyclists narrow, if any bike lane. some places the "rumble stripes" take up the whole lane, very dangerous. bike lane, when there is never swept.
NAC59E4D5 34.61583 -112.4236
2017-08-27 05:09:26 +1000
Cyclists Speed, dirty shoulder [email protected]
NACE4A2FF 34.61965 -112.4253
2017-08-27 05:02:37 +1000
Cyclists Lack of shoulder on sections of Williamson Valley Road make it unsafe for bicyclists
NAC216793 34.59492 -112.4968
2017-08-27 04:01:46 +1000
Drivers Major congestion during the morning commute time heading towards town. Lights are not long enough and/or timed well resulting in traffic back-ups.
NAC8F97ED 34.60303 -112.4559
2017-08-27 03:59:07 +1000
Drivers During peak hours it is difficult and dangerous to turn left from Prescott Lakes Pkwy onto Willow Lake Road as there is poor visability and traffic often going much faster than the speed limit.
NAC4DD514 34.593 -112.4316
Page A94 of A104
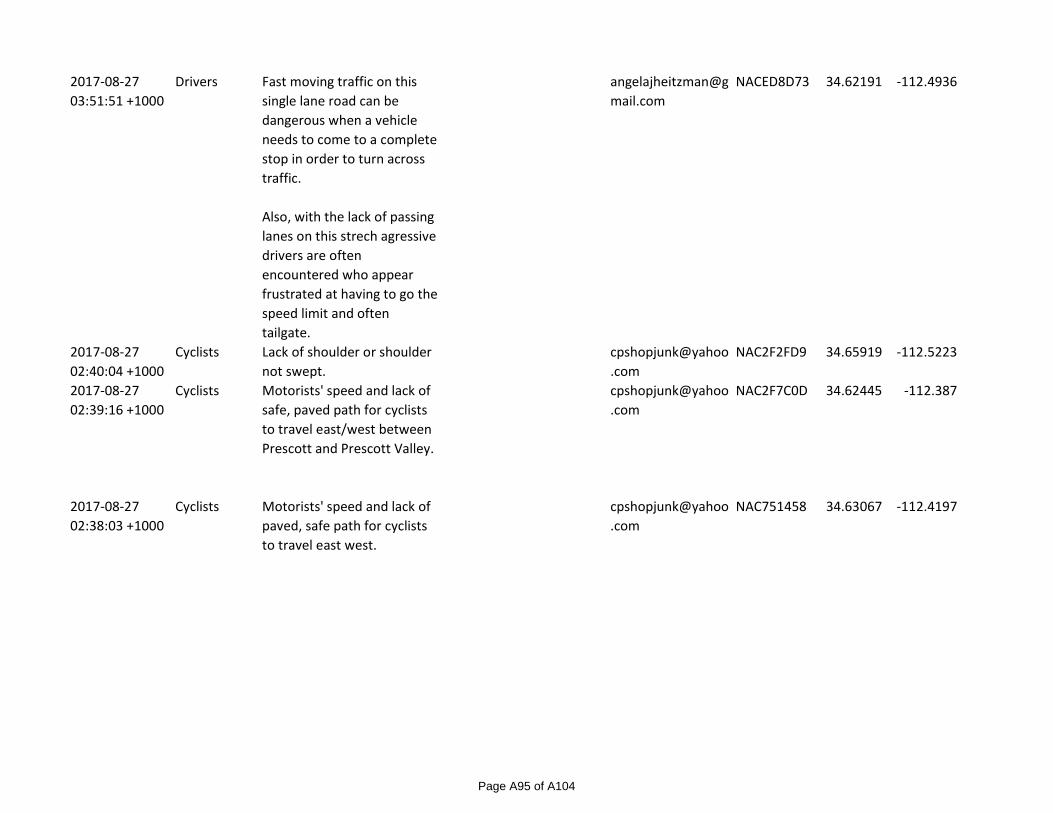
2017-08-27 03:51:51 +1000
Drivers Fast moving traffic on this single lane road can be dangerous when a vehicle needs to come to a complete stop in order to turn across traffic.
Also, with the lack of passing lanes on this strech agressive drivers are often encountered who appear frustrated at having to go the speed limit and often tailgate.
NACED8D73 34.62191 -112.4936
2017-08-27 02:40:04 +1000
Cyclists Lack of shoulder or shoulder not swept.
NAC2F2FD9 34.65919 -112.5223
2017-08-27 02:39:16 +1000
Cyclists Motorists' speed and lack of safe, paved path for cyclists to travel east/west between Prescott and Prescott Valley.
NAC2F7C0D 34.62445 -112.387
2017-08-27 02:38:03 +1000
Cyclists Motorists' speed and lack of paved, safe path for cyclists to travel east west.
NAC751458 34.63067 -112.4197
Page A95 of A104
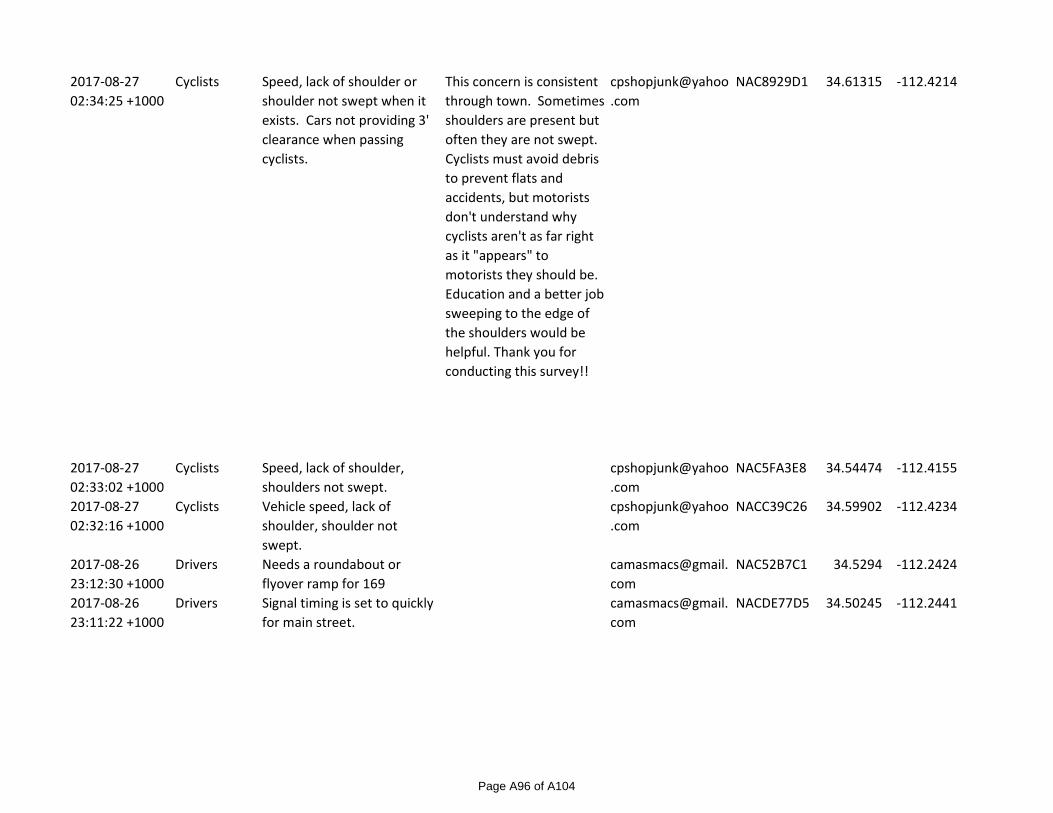
2017-08-27 02:34:25 +1000
Cyclists Speed, lack of shoulder or shoulder not swept when it exists. Cars not providing 3' clearance when passing cyclists.
This concern is consistent through town. Sometimes shoulders are present but often they are not swept. Cyclists must avoid debris to prevent flats and accidents, but motorists don't understand why cyclists aren't as far right as it "appears" to motorists they should be. Education and a better job sweeping to the edge of the shoulders would be helpful. Thank you for conducting this survey!!
NAC8929D1 34.61315 -112.4214
2017-08-27 02:33:02 +1000
Cyclists Speed, lack of shoulder, shoulders not swept.
NAC5FA3E8 34.54474 -112.4155
2017-08-27 02:32:16 +1000
Cyclists Vehicle speed, lack of shoulder, shoulder not swept.
NACC39C26 34.59902 -112.4234
2017-08-26 23:12:30 +1000
Drivers Needs a roundabout or flyover ramp for 169
NAC52B7C1 34.5294 -112.2424
2017-08-26 23:11:22 +1000
Drivers Signal timing is set to quickly for main street.
NACDE77D5 34.50245 -112.2441
Page A96 of A104
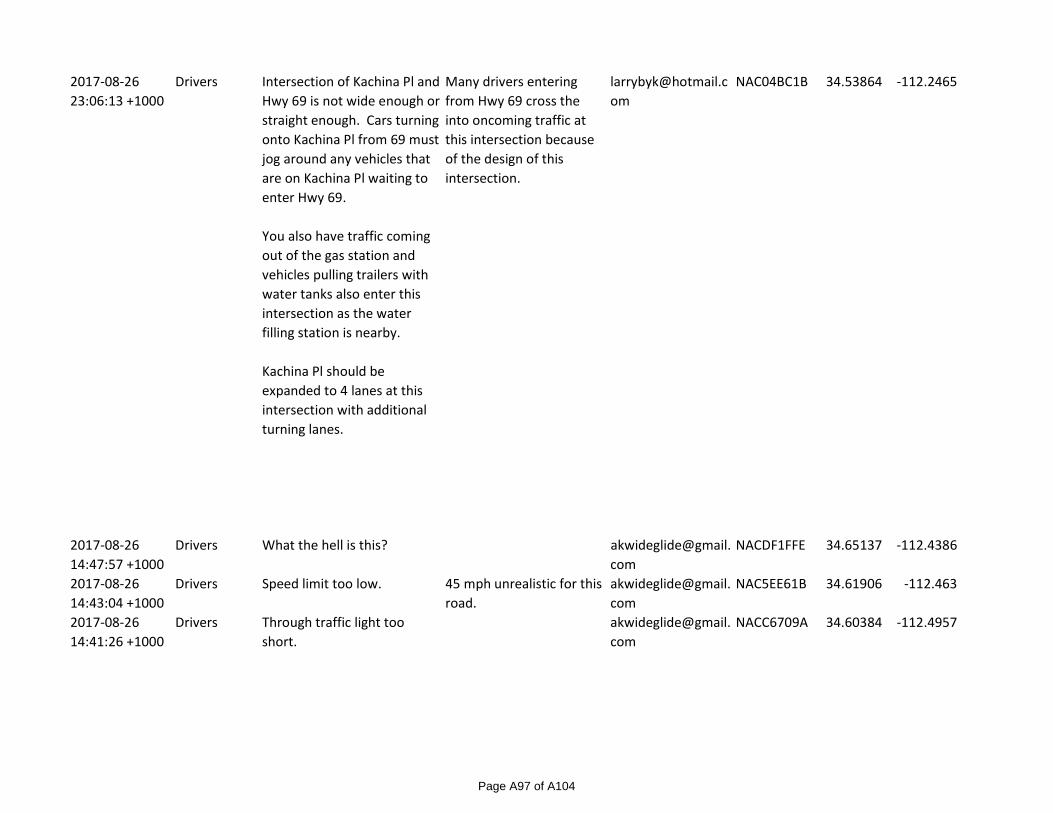
2017-08-26 23:06:13 +1000
Drivers Intersection of Kachina Pl and Hwy 69 is not wide enough or straight enough. Cars turning onto Kachina Pl from 69 must jog around any vehicles that are on Kachina Pl waiting to enter Hwy 69.
You also have traffic coming out of the gas station and vehicles pulling trailers with water tanks also enter this intersection as the water filling station is nearby.
Kachina Pl should be expanded to 4 lanes at this intersection with additional turning lanes.
Many drivers entering from Hwy 69 cross the into oncoming traffic at this intersection because of the design of this intersection.
NAC04BC1B 34.53864 -112.2465
2017-08-26 14:47:57 +1000
Drivers What the hell is this? [email protected]
NACDF1FFE 34.65137 -112.4386
2017-08-26 14:43:04 +1000
Drivers Speed limit too low. 45 mph unrealistic for this road.
NAC5EE61B 34.61906 -112.463
2017-08-26 14:41:26 +1000
Drivers Through traffic light too short.
NACC6709A 34.60384 -112.4957
Page A97 of A104
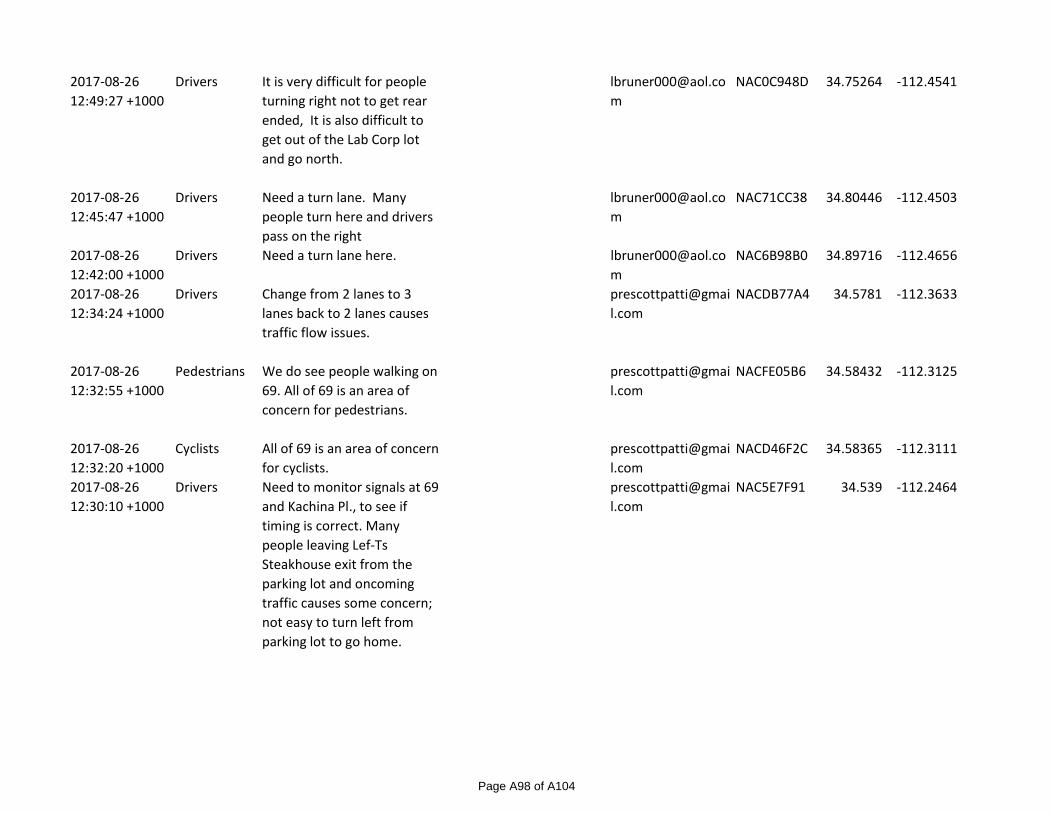
2017-08-26 12:49:27 +1000
Drivers It is very difficult for people turning right not to get rear ended, It is also difficult to get out of the Lab Corp lot and go north.
NAC0C948D 34.75264 -112.4541
2017-08-26 12:45:47 +1000
Drivers Need a turn lane. Many people turn here and drivers pass on the right
NAC71CC38 34.80446 -112.4503
2017-08-26 12:42:00 +1000
Drivers Need a turn lane here. [email protected]
NAC6B98B0 34.89716 -112.4656
2017-08-26 12:34:24 +1000
Drivers Change from 2 lanes to 3 lanes back to 2 lanes causes traffic flow issues.
NACDB77A4 34.5781 -112.3633
2017-08-26 12:32:55 +1000
Pedestrians We do see people walking on 69. All of 69 is an area of concern for pedestrians.
NACFE05B6 34.58432 -112.3125
2017-08-26 12:32:20 +1000
Cyclists All of 69 is an area of concern for cyclists.
NACD46F2C 34.58365 -112.3111
2017-08-26 12:30:10 +1000
Drivers Need to monitor signals at 69 and Kachina Pl., to see if timing is correct. Many people leaving Lef-Ts Steakhouse exit from the parking lot and oncoming traffic causes some concern; not easy to turn left from parking lot to go home.
NAC5E7F91 34.539 -112.2464
Page A98 of A104
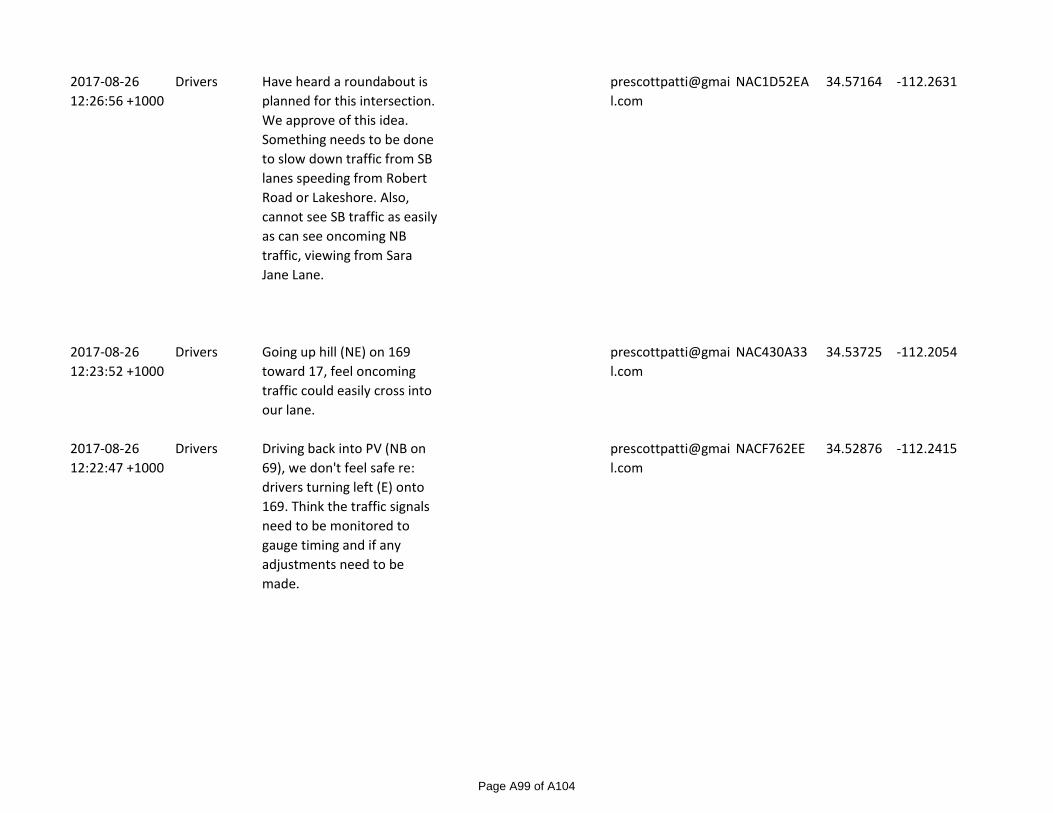
2017-08-26 12:26:56 +1000
Drivers Have heard a roundabout is planned for this intersection. We approve of this idea. Something needs to be done to slow down traffic from SB lanes speeding from Robert Road or Lakeshore. Also, cannot see SB traffic as easily as can see oncoming NB traffic, viewing from Sara Jane Lane.
NAC1D52EA 34.57164 -112.2631
2017-08-26 12:23:52 +1000
Drivers Going up hill (NE) on 169 toward 17, feel oncoming traffic could easily cross into our lane.
NAC430A33 34.53725 -112.2054
2017-08-26 12:22:47 +1000
Drivers Driving back into PV (NB on 69), we don't feel safe re: drivers turning left (E) onto 169. Think the traffic signals need to be monitored to gauge timing and if any adjustments need to be made.
NACF762EE 34.52876 -112.2415
Page A99 of A104

2017-08-26 06:22:32 +1000
Drivers We were hit from behind from a distracted driver. Suggest a $550 fine for each offense and task the police to enforce the law.
NACFE97AF 34.54222 -112.4702
2017-08-26 06:19:34 +1000
Drivers Often see high speed here [email protected]
NAC4DADA3 34.61025 -112.2717
2017-08-26 02:15:26 +1000
Drivers All of HWY 169 is high risk for head-on collisions
People routinely drive 70+ mph on this road which has frequent weather as well. There are only 3-4 safe areas to pass on this 15 mile stretch. It needs to either be divided or have a safety barrier between lanes.
NACD4A620 34.52466 -112.2123
2017-08-26 01:44:40 +1000
Drivers Intersections along Road 1 west are very small. If there is another vehicle at the stop sign it is impossible to make a right turn in a full sized pickup truck.
NAC58B933 34.7454 -112.4656
2017-08-26 01:41:52 +1000
Drivers When a southbound care is waiting to turn into the golf course all of the southbound motorists pass on the right shoulder.
NACBF5E88 34.63828 -112.4316
Page A100 of A104
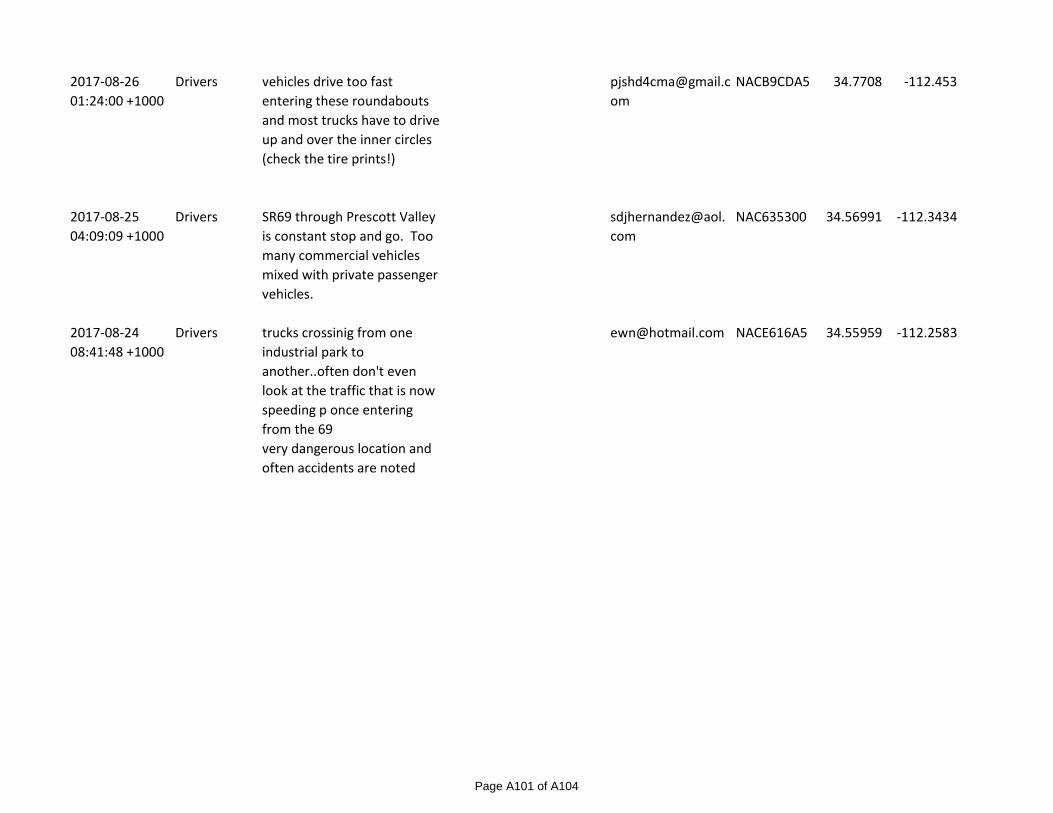
2017-08-26 01:24:00 +1000
Drivers vehicles drive too fast entering these roundabouts and most trucks have to drive up and over the inner circles (check the tire prints!)
NACB9CDA5 34.7708 -112.453
2017-08-25 04:09:09 +1000
Drivers SR69 through Prescott Valley is constant stop and go. Too many commercial vehicles mixed with private passenger vehicles.
NAC635300 34.56991 -112.3434
2017-08-24 08:41:48 +1000
Drivers trucks crossinig from one industrial park to another..often don't even look at the traffic that is now speeding p once entering from the 69very dangerous location and often accidents are noted
[email protected] NACE616A5 34.55959 -112.2583
Page A101 of A104
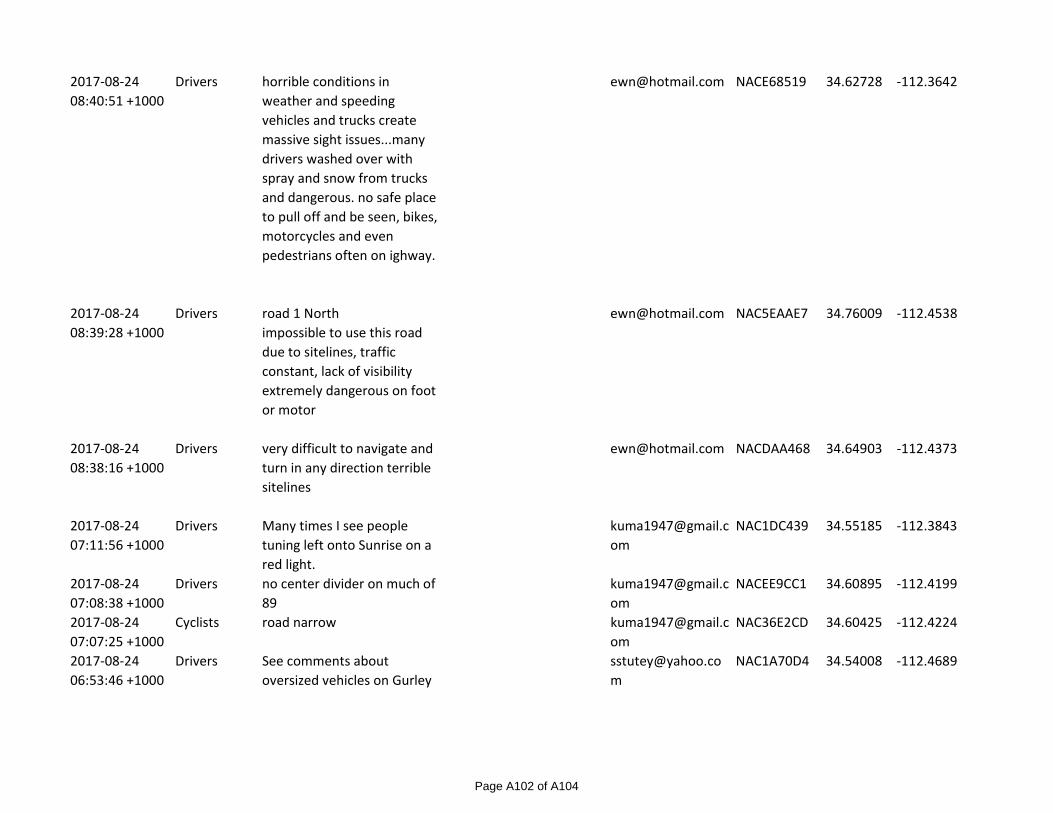
2017-08-24 08:40:51 +1000
Drivers horrible conditions in weather and speeding vehicles and trucks create massive sight issues...many drivers washed over with spray and snow from trucks and dangerous. no safe place to pull off and be seen, bikes, motorcycles and even pedestrians often on ighway.
[email protected] NACE68519 34.62728 -112.3642
2017-08-24 08:39:28 +1000
Drivers road 1 Northimpossible to use this road due to sitelines, traffic constant, lack of visibility extremely dangerous on foot or motor
[email protected] NAC5EAAE7 34.76009 -112.4538
2017-08-24 08:38:16 +1000
Drivers very difficult to navigate and turn in any direction terrible sitelines
[email protected] NACDAA468 34.64903 -112.4373
2017-08-24 07:11:56 +1000
Drivers Many times I see people tuning left onto Sunrise on a red light.
NAC1DC439 34.55185 -112.3843
2017-08-24 07:08:38 +1000
Drivers no center divider on much of 89
NACEE9CC1 34.60895 -112.4199
2017-08-24 07:07:25 +1000
Cyclists road narrow [email protected]
NAC36E2CD 34.60425 -112.4224
2017-08-24 06:53:46 +1000
Drivers See comments about oversized vehicles on Gurley
NAC1A70D4 34.54008 -112.4689
Page A102 of A104
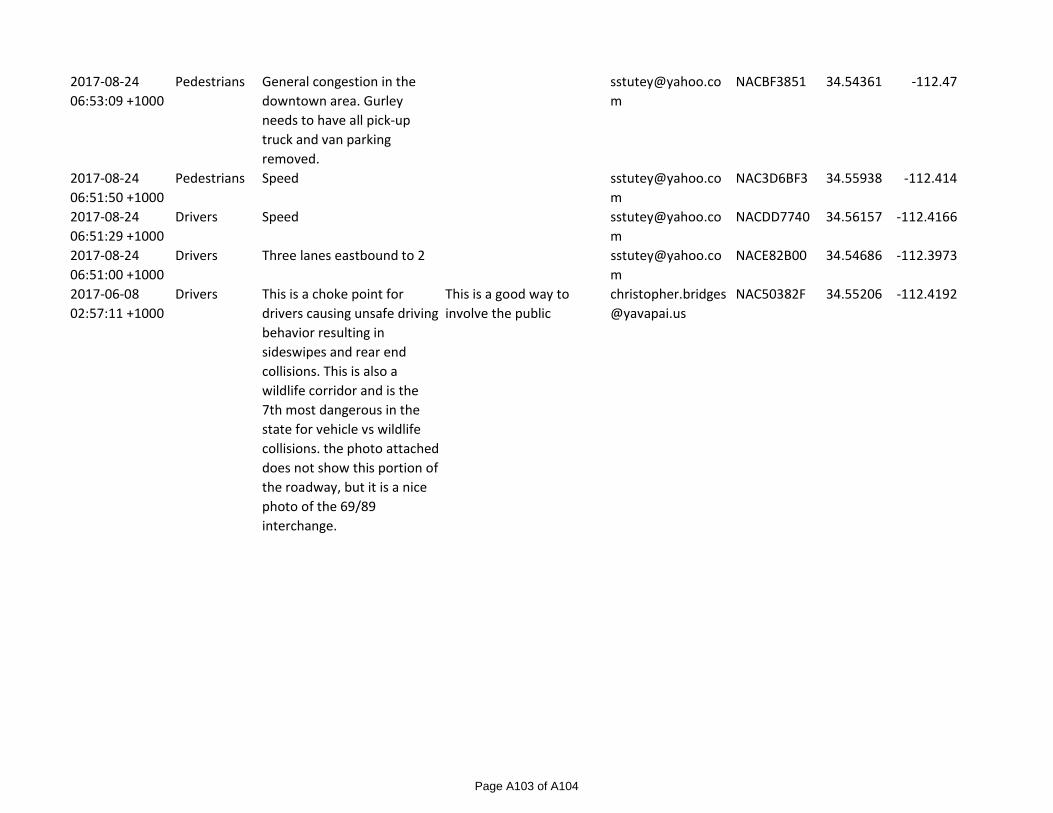
2017-08-24 06:53:09 +1000
Pedestrians General congestion in the downtown area. Gurley needs to have all pick-up truck and van parking removed.
NACBF3851 34.54361 -112.47
2017-08-24 06:51:50 +1000
Pedestrians Speed [email protected]
NAC3D6BF3 34.55938 -112.414
2017-08-24 06:51:29 +1000
Drivers Speed [email protected]
NACDD7740 34.56157 -112.4166
2017-08-24 06:51:00 +1000
Drivers Three lanes eastbound to 2 [email protected]
NACE82B00 34.54686 -112.3973
2017-06-08 02:57:11 +1000
Drivers This is a choke point for drivers causing unsafe driving behavior resulting in sideswipes and rear end collisions. This is also a wildlife corridor and is the 7th most dangerous in the state for vehicle vs wildlife collisions. the photo attached does not show this portion of the roadway, but it is a nice photo of the 69/89 interchange.
This is a good way to involve the public
NAC50382F 34.55206 -112.4192
Page A103 of A104
NEWS For Immediate Release: August 23, 2017
Opportunity to Improve Traffic Safety
Share your concerns via online survey, email or mail
Prescott, Ariz. - With 44 fatal crashes in the Central Yavapai Metropolitan Planning Organization (CYMPO) region in the past five years, the traffic safety campaign states, “There is No Room for One More Fatality!”
CYMPO and its design team, Burgess & Niple, Inc., are analyzing crash data to determine the primary causes and identify potential projects and educational efforts which could reduce the number of crashes. However, input from drivers, bicyclists, and pedestrians is a vital element.
“We want the public to let us know what they have observed and experienced on the roadways and areas of concern. This information is valuable because it alerts us to potential dangers that we may not be aware of before a fatal crash occurs,” said Chris Bridges, CYMPO Administrator.
An online survey at, https://www.surveymonkey.com/r/CYMPO has been established to gather input from the community to identify unsafe driving behaviors and locations where there are concerns about safety. There is also an opportunity to place virtual pinpoints on a map to identify worrisome areas and leave comments for the team.
For those who prefer to communicate directly, the team can be reached via email at [email protected] or by mailing comments to GCI, 67 E. Weldon, Suite 103, Phoenix, AZ 85012.
The survey process is part of the Northern Arizona Council of Governments (NACOG) Strategic Transportation Safety Plan designed to understand current conditions, identify strategies to reduce the number of crashes, and implement solutions for safer travel in the region. The survey link is specific for the Central Yavapai Metropolitan Planning Organization’s region included in the study. To view CYMPO boundaries visit: https://www.cympo.org/about-cympo/.
For more information, please contact Chris Bridges, CYMPO Administrator, at (928) 442-5730.
Page A104 of A104
Regional Strategic Transportation Safety Plan
APPENDIX B Implementation Plan: Sites and Countermeasures
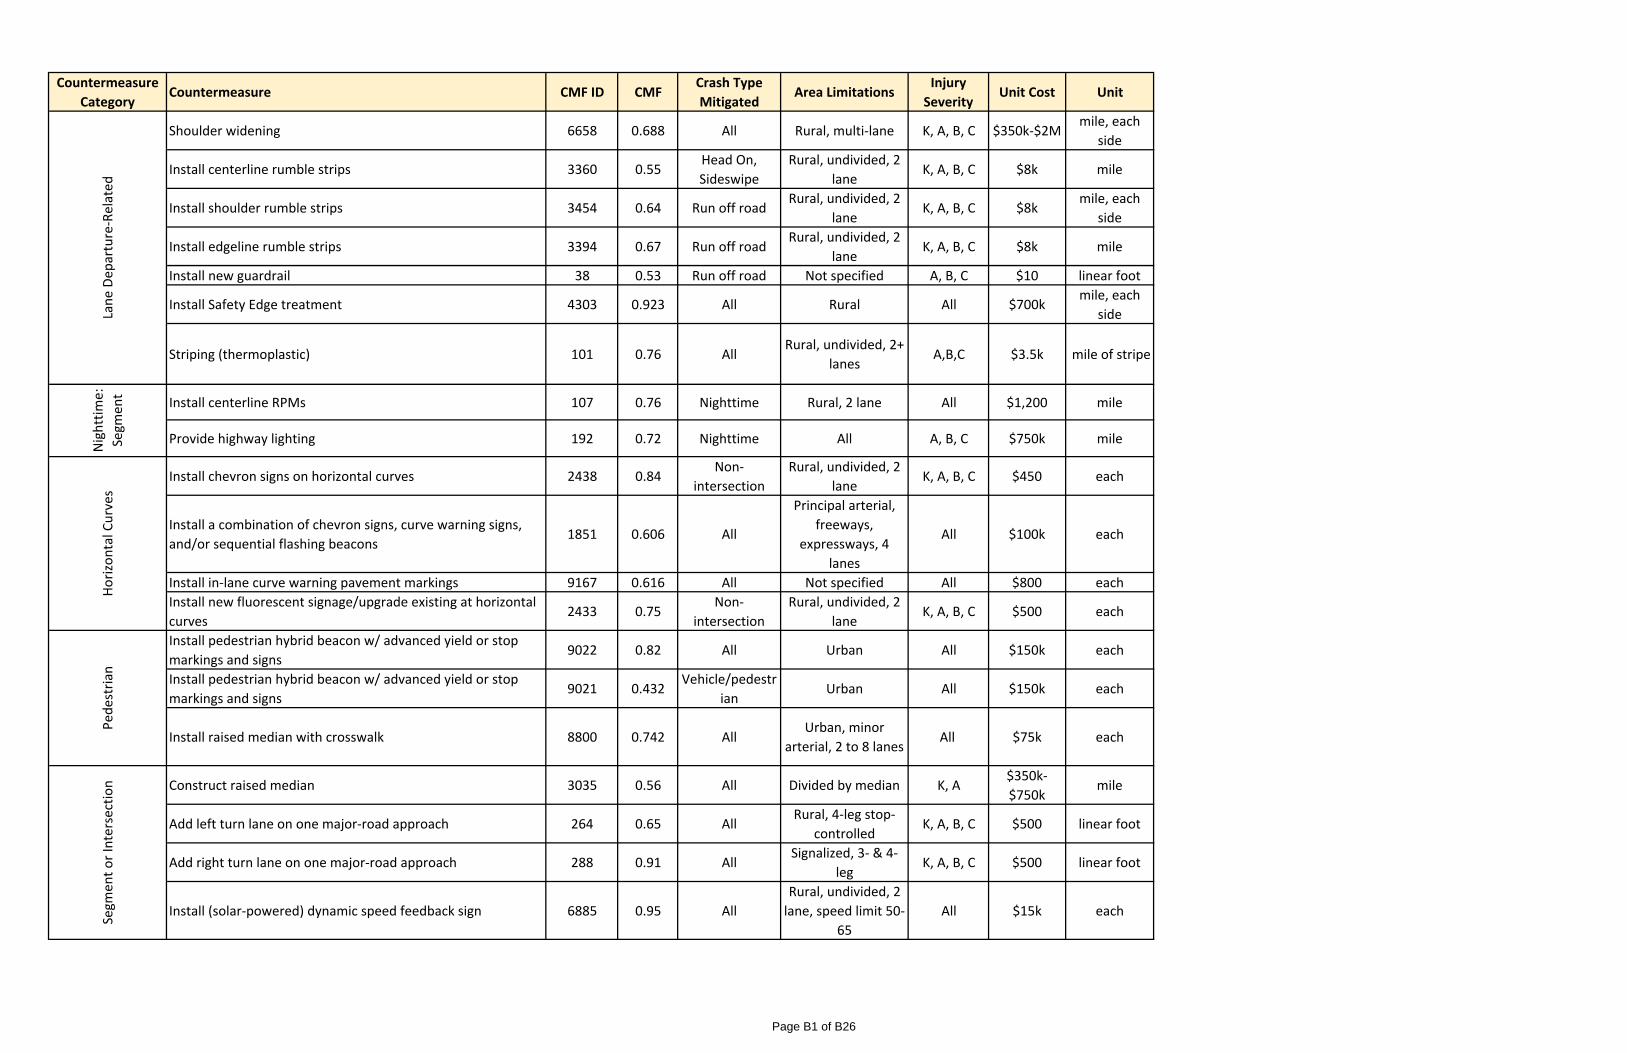
Countermeasure
CategoryCountermeasure CMF ID CMF
Crash Type
MitigatedArea Limitations
Injury
SeverityUnit Cost Unit
Shoulder widening 6658 0.688 All Rural, multi‐lane K, A, B, C $350k‐$2Mmile, each
side
Install centerline rumble strips 3360 0.55Head On,
Sideswipe
Rural, undivided, 2
laneK, A, B, C $8k mile
Install shoulder rumble strips 3454 0.64 Run off roadRural, undivided, 2
laneK, A, B, C $8k
mile, each
side
Install edgeline rumble strips 3394 0.67 Run off roadRural, undivided, 2
laneK, A, B, C $8k mile
Install new guardrail 38 0.53 Run off road Not specified A, B, C $10 linear foot
Install Safety Edge treatment 4303 0.923 All Rural All $700kmile, each
side
Striping (thermoplastic) 101 0.76 AllRural, undivided, 2+
lanesA,B,C $3.5k mile of stripe
Install centerline RPMs 107 0.76 Nighttime Rural, 2 lane All $1,200 mile
Provide highway lighting 192 0.72 Nighttime All A, B, C $750k mile
Install chevron signs on horizontal curves 2438 0.84Non‐
intersection
Rural, undivided, 2
laneK, A, B, C $450 each
Install a combination of chevron signs, curve warning signs,
and/or sequential flashing beacons1851 0.606 All
Principal arterial,
freeways,
expressways, 4
lanes
All $100k each
Install in‐lane curve warning pavement markings 9167 0.616 All Not specified All $800 each
Install new fluorescent signage/upgrade existing at horizontal
curves2433 0.75
Non‐
intersection
Rural, undivided, 2
laneK, A, B, C $500 each
Install pedestrian hybrid beacon w/ advanced yield or stop
markings and signs9022 0.82 All Urban All $150k each
Install pedestrian hybrid beacon w/ advanced yield or stop
markings and signs9021 0.432
Vehicle/pedestr
ianUrban All $150k each
Install raised median with crosswalk 8800 0.742 AllUrban, minor
arterial, 2 to 8 lanesAll $75k each
Construct raised median 3035 0.56 All Divided by median K, A$350k‐
$750k mile
Add left turn lane on one major‐road approach 264 0.65 AllRural, 4‐leg stop‐
controlledK, A, B, C $500 linear foot
Add right turn lane on one major‐road approach 288 0.91 AllSignalized, 3‐ & 4‐
legK, A, B, C $500 linear foot
Install (solar‐powered) dynamic speed feedback sign 6885 0.95 All
Rural, undivided, 2
lane, speed limit 50‐
65
All $15k each
Lane Departure‐Related
Segm
ent or Intersection
Horizontal Curves
Pedestrian
Nighttim
e:
Segm
ent
Page B1 of B26
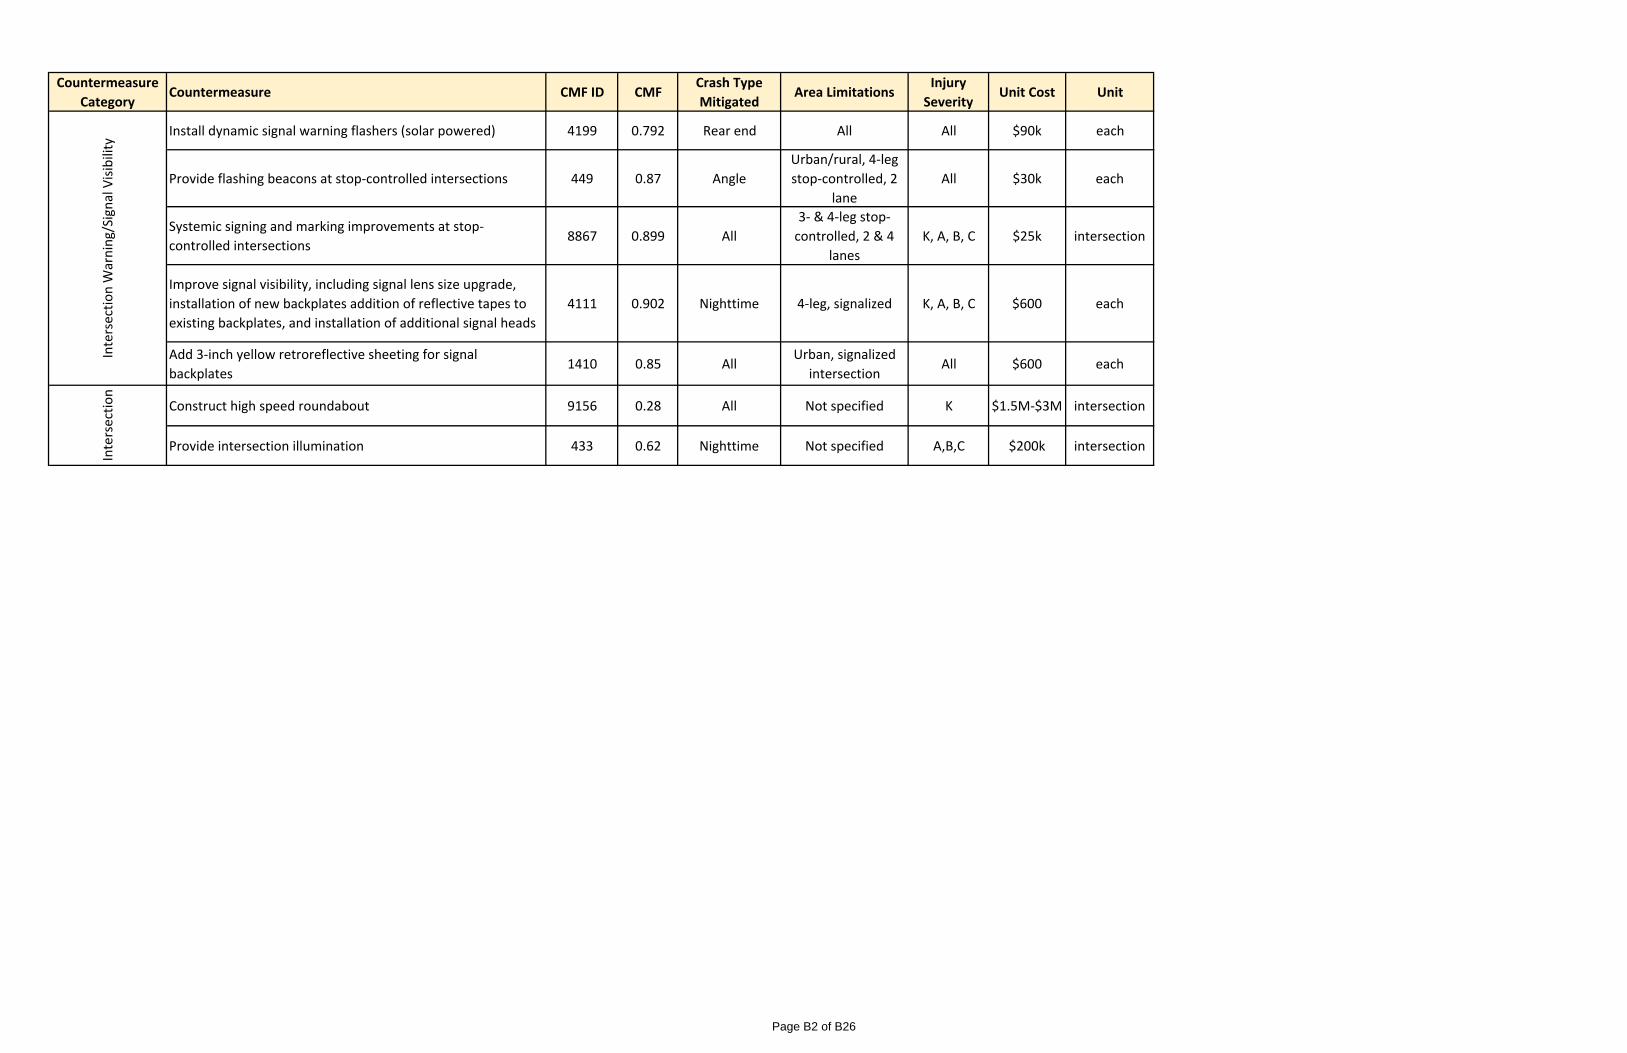
Countermeasure
CategoryCountermeasure CMF ID CMF
Crash Type
MitigatedArea Limitations
Injury
SeverityUnit Cost Unit
Install dynamic signal warning flashers (solar powered) 4199 0.792 Rear end All All $90k each
Provide flashing beacons at stop‐controlled intersections 449 0.87 Angle
Urban/rural, 4‐leg
stop‐controlled, 2
lane
All $30k each
Systemic signing and marking improvements at stop‐
controlled intersections8867 0.899 All
3‐ & 4‐leg stop‐
controlled, 2 & 4
lanes
K, A, B, C $25k intersection
Improve signal visibility, including signal lens size upgrade,
installation of new backplates addition of reflective tapes to
existing backplates, and installation of additional signal heads
4111 0.902 Nighttime 4‐leg, signalized K, A, B, C $600 each
Add 3‐inch yellow retroreflective sheeting for signal
backplates1410 0.85 All
Urban, signalized
intersectionAll $600 each
Construct high speed roundabout 9156 0.28 All Not specified K $1.5M‐$3M intersection
Provide intersection illumination 433 0.62 Nighttime Not specified A,B,C $200k intersection
Intersection W
arning/Signal Visibility
Intersection
Page B2 of B26

Fain Road – State Route 69 to State Route 89A Segment Length: 7.2 Miles Posted speed: 55 mph NB, 65 mph SB, 35 SB at horizontal curve Typical section: Four‐lane divided roadway, left and right turn bays at non‐stop controlled intersection, bridge
structures over 3 washes Roadside: Paved 4‐foot inside shoulder, paved 10‐foot outside shoulder, intermittent guardrail, rumble strips
Crash Map
Crash Data
Emphasis Area Analysis
Emphasis Area CYMPO Fatal State Fatal SHSP Fatal Corridor Fatal
Speeding and Aggressive Driving 34.1% 32.0% 36.7% 100.0%
Impaired Driving 31.8% 35.4% 34.1% 40.0%
Occupant Protection 47.7% 40.9% 46.8% 60.0%
Motorcycles 29.5% 17.5% 16.1% 20.0%
Distracted Driving 43.2% 39.0% 14.3% 60.0%
Roadway Infrastructure and Operations: Lane/Roadway Departure
65.9% 47.4% 51.1% 80.0%
Roadway Infrastructure and Operations: Intersections/Railroad Crossings
34.1% 27.2% 23.8% 0.0%
Age Related: Young Drivers 27.3% 26.0% 29.7% 40.0%
Age Related: Older Drivers 29.5% 22.0% 18.2% 0.0%
Non‐motorized Users: Pedestrians 13.6% 20.4% 17.1% 0.0%
Non‐motorized Users: Bicyclists 2.3% 3.4% 2.8% 0.0%
Heavy Vehicles/Buses/Transit 9.1% 12.9% 12.4% 0.0%
Natural Risks: Weather 2.3% 2.9% 3.7% 0.0%
Natural Risks: Animal 0.0% 0.2% 0.3% 0.0%
Traffic Incident Management (Work Zones) 2.3% 1.3% 1.4% 20.0% *Red, bold text indicates the crash rate for this emphasis area was higher than 2012 to 2016 statewide incident reports.
Summary of Crashes by First Harmful Event (All severities)
First Harmful Event Corridor
% Statewide % Rural Areas % Urban Areas
Total %
Collision with Motor Vehicle in Transport 9 21.4% 64.3% 51.4% 67.3%
Overturning 11 26.2% 2.2% 8.2% 0.8%
Collision with Pedestrian 0 0.0% 1.0% 0.7% 1.1%
Collision with Pedalcyclist 0 0.0% 1.2% 0.6% 1.4%
Collision with Animal 5 11.9% 1.6% 7.2% 0.3%
Collision with Fixed Object 14 33.3% 10.0% 19.0% 8.0%
Collision with Non‐fixed Object* 1 2.4% 4.0% 5.0% 3.7%
Vehicle Fire or Explosion 0 0.0% 0.3% 1.0% 0.1%
Other Non‐collision** 2 4.8% 0.8% 2.0% 0.5%
Unknown 0 0.0% 14.6% 5.0% 16.8%
Total 42 100.0% *Includes Collision with Parked Vehicles, Trains, Railway Vehicles, and Work Zone Equipment **Includes Vehicle Immersion, Jackknife, and Cargo Loss or Shift
Page B3 of B26

Fatal and Incapacitating Crash Data
ID Date Time Injury Severity First Harmful Collision Manner
Light Condition Weather Alcohol Drug Distracted Impaired Unrestrained V1Travel Direction
V1 Unit Action
2980676 Saturday, July 25, 2015 5:45:00 AM FATAL OVERTURN_ROLLOVER SINGLE_VEH DAYLIGHT CLEAR 1 1 2 ‐ SOUTH GOING_STRAIGHT_AHEAD
2717755 Saturday, March 23, 2013 12:38:00 PM FATAL MOTOR_VEHICLE_IN_TRANSPORT SS_SAME_DIR DAYLIGHT CLEAR 3 ‐ EAST OVERTAKING_PASSING
3165068 Saturday, September 17,
2016 1:56:00 AM FATAL OVERTURN_ROLLOVER SINGLE_VEH DARK_NOT_LIGHTED CLEAR 2 ‐ SOUTH GOING_STRAIGHT_AHEAD
3128139 Wednesday, August 24,
2016 9:40:00 PM FATAL MOTOR_VEHICLE_IN_TRANSPORT REAR_END DARK_NOT_LIGHTED CLEAR 1 2 ‐ SOUTH GOING_STRAIGHT_AHEAD
2889773 Friday, October 24, 2014 6:10:00 AM FATAL GUARDRAIL_END SINGLE_VEH DARK_NOT_LIGHTED CLEAR 1 1 1 1 2 ‐ SOUTH NEGOTIATING_A_CURVE
2633315 Thursday, June 14, 2012 8:29:00 PM INCAPACITATING_INJURY MOTOR_VEHICLE_IN_TRANSPORT ANGLE DARK_NOT_LIGHTED CLEAR 4 ‐ WEST GOING_STRAIGHT_AHEAD
2604464 Saturday, April 21, 2012 8:52:00 AM INCAPACITATING_INJURY MOTOR_VEHICLE_IN_TRANSPORT SS_SAME_DIR DAYLIGHT CLEAR 1 2 ‐ SOUTH AVOIDING_VEHICLE_OBJECT_PE
DESTRIAN
2958301 Saturday, May 16, 2015 8:57:00 AM INCAPACITATING_INJURY OVERTURN_ROLLOVER SINGLE_VEH DAYLIGHT CLOUDY 1 2 ‐ SOUTH GOING_STRAIGHT_AHEAD
2708296 Monday, March 04, 2013 7:00:00 AM INCAPACITATING_INJURY OVERTURN_ROLLOVER SINGLE_VEH DAYLIGHT CLEAR 2 ‐ SOUTH NEGOTIATING_A_CURVE
2836012 Tuesday, April 29, 2014 2:45:00 AM INCAPACITATING_INJURY OVERTURN_ROLLOVER SINGLE_VEH DARK_NOT_LIGHTED CLEAR 1 1 1 ‐ NORTH GOING_STRAIGHT_AHEAD
SINGLE_VEH74%
REAR_END5%
ANGLE 2%
OTHER5%
SS_SAME_DIR7%
LEFT_TURN5% HEAD_ON
2%
Crash Type SummaryCrash Summary: All Years
Crash Type Total %
Fatal 5 11.9%
Incapacitating 5 11.9%
Injury 10 23.8%
Possible Injury 2 4.8%
PDO 20 47.6%
Multi‐Vehicle 11 26.2%
Single‐Vehicle 31 73.8%
Total 42 100.0%
Selected Lane Departure Crash Characteristics
Corridor
Total % of Total Fatal % of Fatal
Speeding 21 72.4% 4 100.0%
Impaired 7 24.1% 2 50.0%
Distracted 8 27.6% 2 50.0%
Unrestrained 4 13.8% 2 50.0%
Older 2 6.9% 0 0.0%
Younger 5 17.2% 1 25.0%
Weather 4 13.8% 0 0.0%
Total 29 100.0% 4 100.0%
Crashes by Lighting Condition (All severities)
Lighting Condition Corridor
Total % of Total
Daylight 26 61.9%
Dawn 1 2.4%
Dusk 0 0.0%
Dark ‐ Lighted 0 0.0%
Dark ‐ Not Lighted 15 35.7%
Dark ‐ Unknown Lighting 0 0.0%
Total 42 100.0%
Page B4 of B26
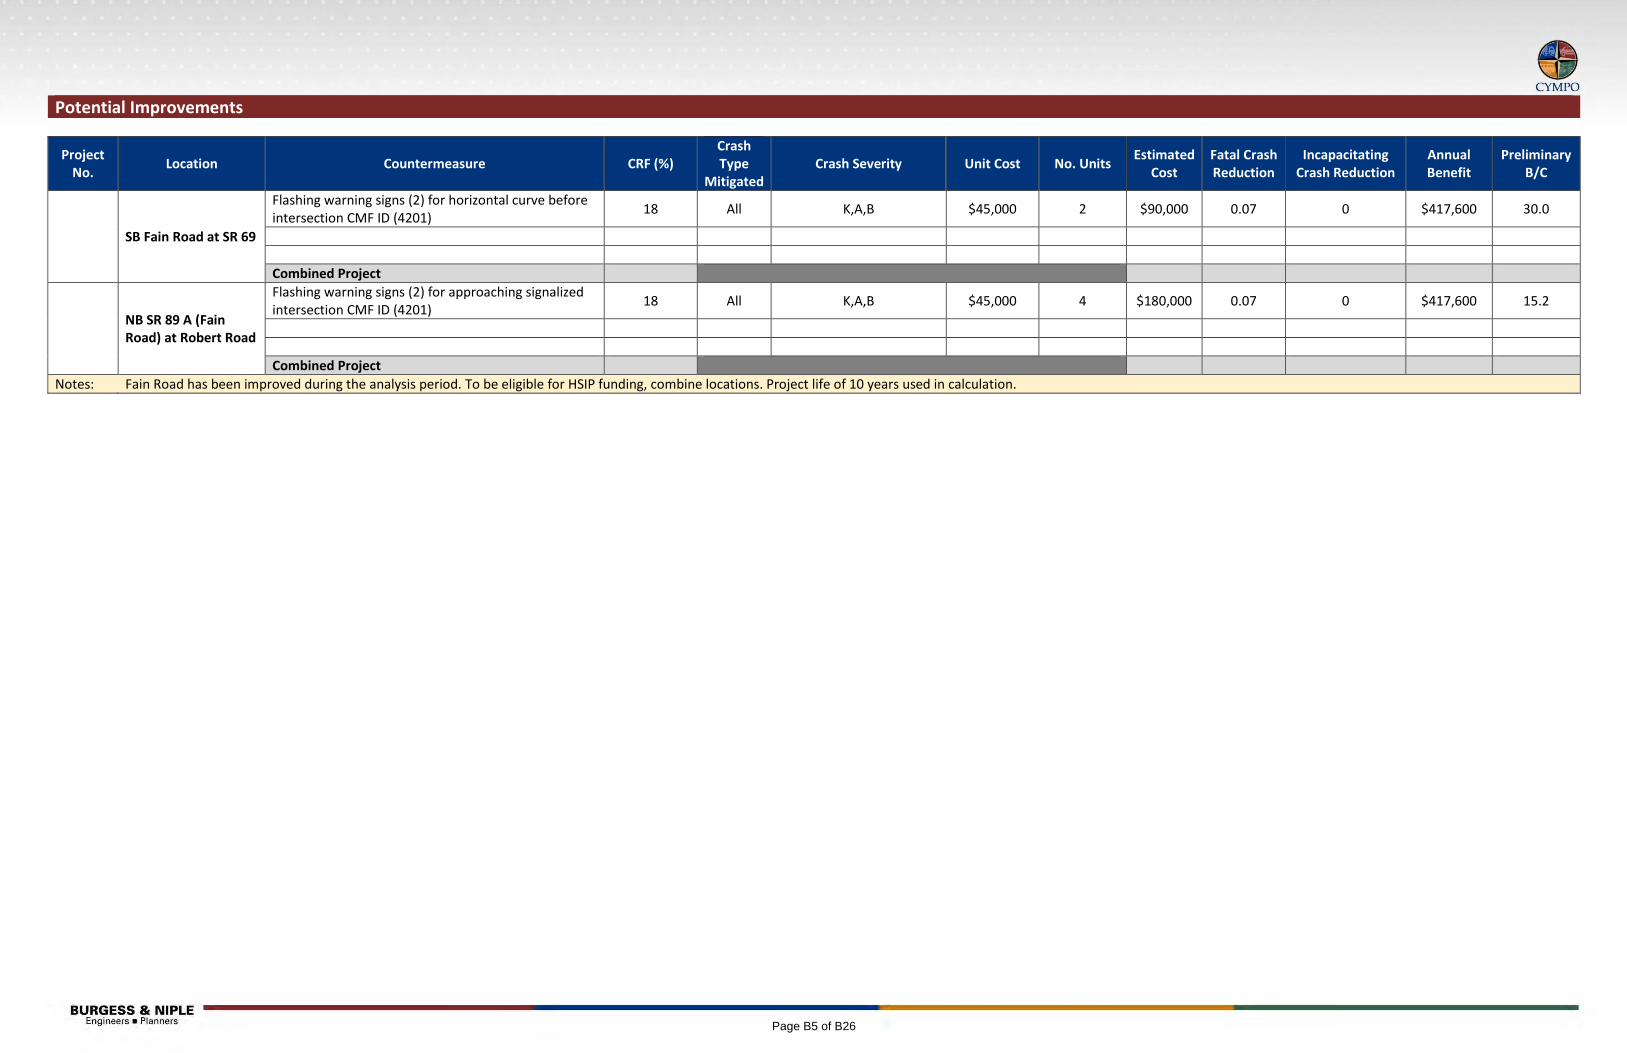
Potential Improvements
Project No.
Location Countermeasure CRF (%) Crash Type
Mitigated Crash Severity Unit Cost No. Units
Estimated Cost
Fatal Crash Reduction
Incapacitating Crash Reduction
Annual Benefit
Preliminary B/C
SB Fain Road at SR 69
Flashing warning signs (2) for horizontal curve before intersection CMF ID (4201)
18 All K,A,B $45,000 2 $90,000 0.07 0 $417,600 30.0
Combined Project
NB SR 89 A (Fain Road) at Robert Road
Flashing warning signs (2) for approaching signalized intersection CMF ID (4201)
18 All K,A,B $45,000 4 $180,000 0.07 0 $417,600 15.2
Combined Project
Notes: Fain Road has been improved during the analysis period. To be eligible for HSIP funding, combine locations. Project life of 10 years used in calculation.
Page B5 of B26
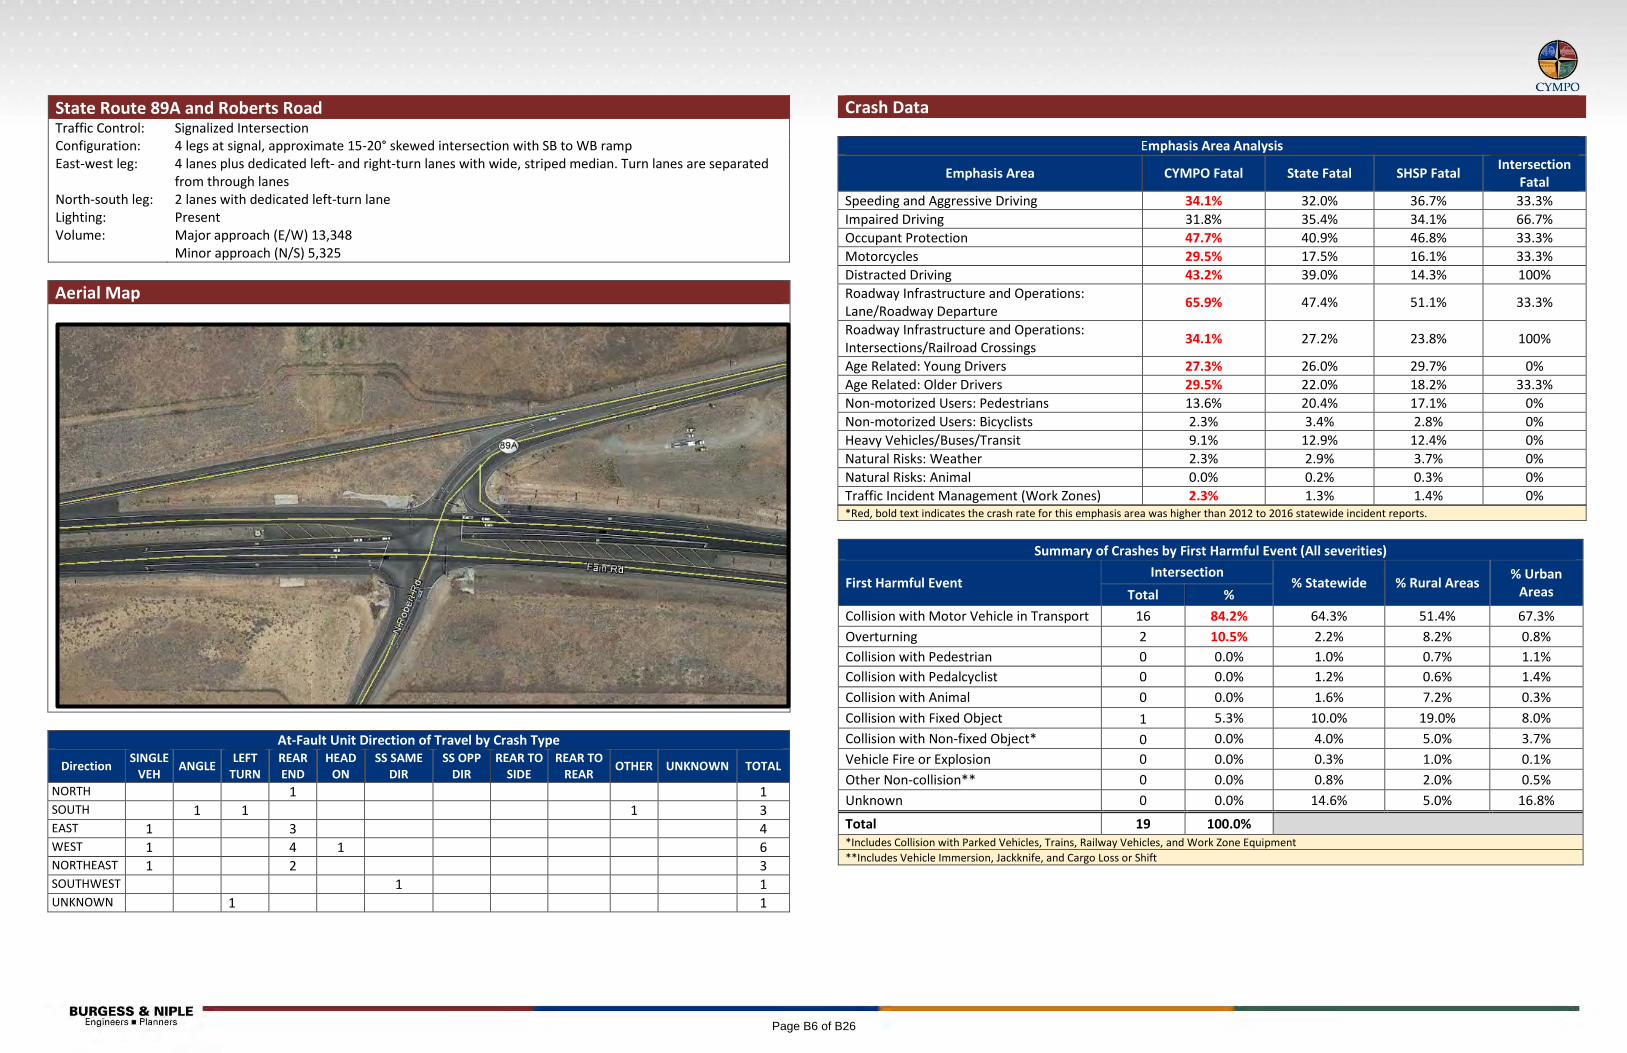
State Route 89A and Roberts Road Traffic Control: Signalized Intersection Configuration: 4 legs at signal, approximate 15-20° skewed intersection with SB to WB ramp East-west leg: 4 lanes plus dedicated left- and right-turn lanes with wide, striped median. Turn lanes are separated
from through lanes North-south leg: 2 lanes with dedicated left-turn lane Lighting: Present Volume: Major approach (E/W) 13,348
Minor approach (N/S) 5,325 Aerial Map
At-Fault Unit Direction of Travel by Crash Type
Direction SINGLE VEH ANGLE LEFT
TURN REAR END
HEAD ON
SS SAME DIR
SS OPP DIR
REAR TO SIDE
REAR TO REAR OTHER UNKNOWN TOTAL
NORTH 1 1 SOUTH 1 1 1 3 EAST 1 3 4 WEST 1 4 1 6 NORTHEAST 1 2 3 SOUTHWEST 1 1 UNKNOWN 1 1
Crash Data
Emphasis Area Analysis
Emphasis Area CYMPO Fatal State Fatal SHSP Fatal Intersection Fatal
Speeding and Aggressive Driving 34.1% 32.0% 36.7% 33.3% Impaired Driving 31.8% 35.4% 34.1% 66.7% Occupant Protection 47.7% 40.9% 46.8% 33.3% Motorcycles 29.5% 17.5% 16.1% 33.3% Distracted Driving 43.2% 39.0% 14.3% 100% Roadway Infrastructure and Operations: Lane/Roadway Departure 65.9% 47.4% 51.1% 33.3%
Roadway Infrastructure and Operations: Intersections/Railroad Crossings 34.1% 27.2% 23.8% 100%
Age Related: Young Drivers 27.3% 26.0% 29.7% 0% Age Related: Older Drivers 29.5% 22.0% 18.2% 33.3% Non-motorized Users: Pedestrians 13.6% 20.4% 17.1% 0% Non-motorized Users: Bicyclists 2.3% 3.4% 2.8% 0% Heavy Vehicles/Buses/Transit 9.1% 12.9% 12.4% 0% Natural Risks: Weather 2.3% 2.9% 3.7% 0% Natural Risks: Animal 0.0% 0.2% 0.3% 0% Traffic Incident Management (Work Zones) 2.3% 1.3% 1.4% 0% *Red, bold text indicates the crash rate for this emphasis area was higher than 2012 to 2016 statewide incident reports.
Summary of Crashes by First Harmful Event (All severities)
First Harmful Event Intersection
% Statewide % Rural Areas % Urban Areas Total %
Collision with Motor Vehicle in Transport 16 84.2% 64.3% 51.4% 67.3% Overturning 2 10.5% 2.2% 8.2% 0.8% Collision with Pedestrian 0 0.0% 1.0% 0.7% 1.1% Collision with Pedalcyclist 0 0.0% 1.2% 0.6% 1.4% Collision with Animal 0 0.0% 1.6% 7.2% 0.3% Collision with Fixed Object 1 5.3% 10.0% 19.0% 8.0% Collision with Non-fixed Object* 0 0.0% 4.0% 5.0% 3.7% Vehicle Fire or Explosion 0 0.0% 0.3% 1.0% 0.1% Other Non-collision** 0 0.0% 0.8% 2.0% 0.5% Unknown 0 0.0% 14.6% 5.0% 16.8%
Total 19 100.0% *Includes Collision with Parked Vehicles, Trains, Railway Vehicles, and Work Zone Equipment **Includes Vehicle Immersion, Jackknife, and Cargo Loss or Shift
Page B6 of B26
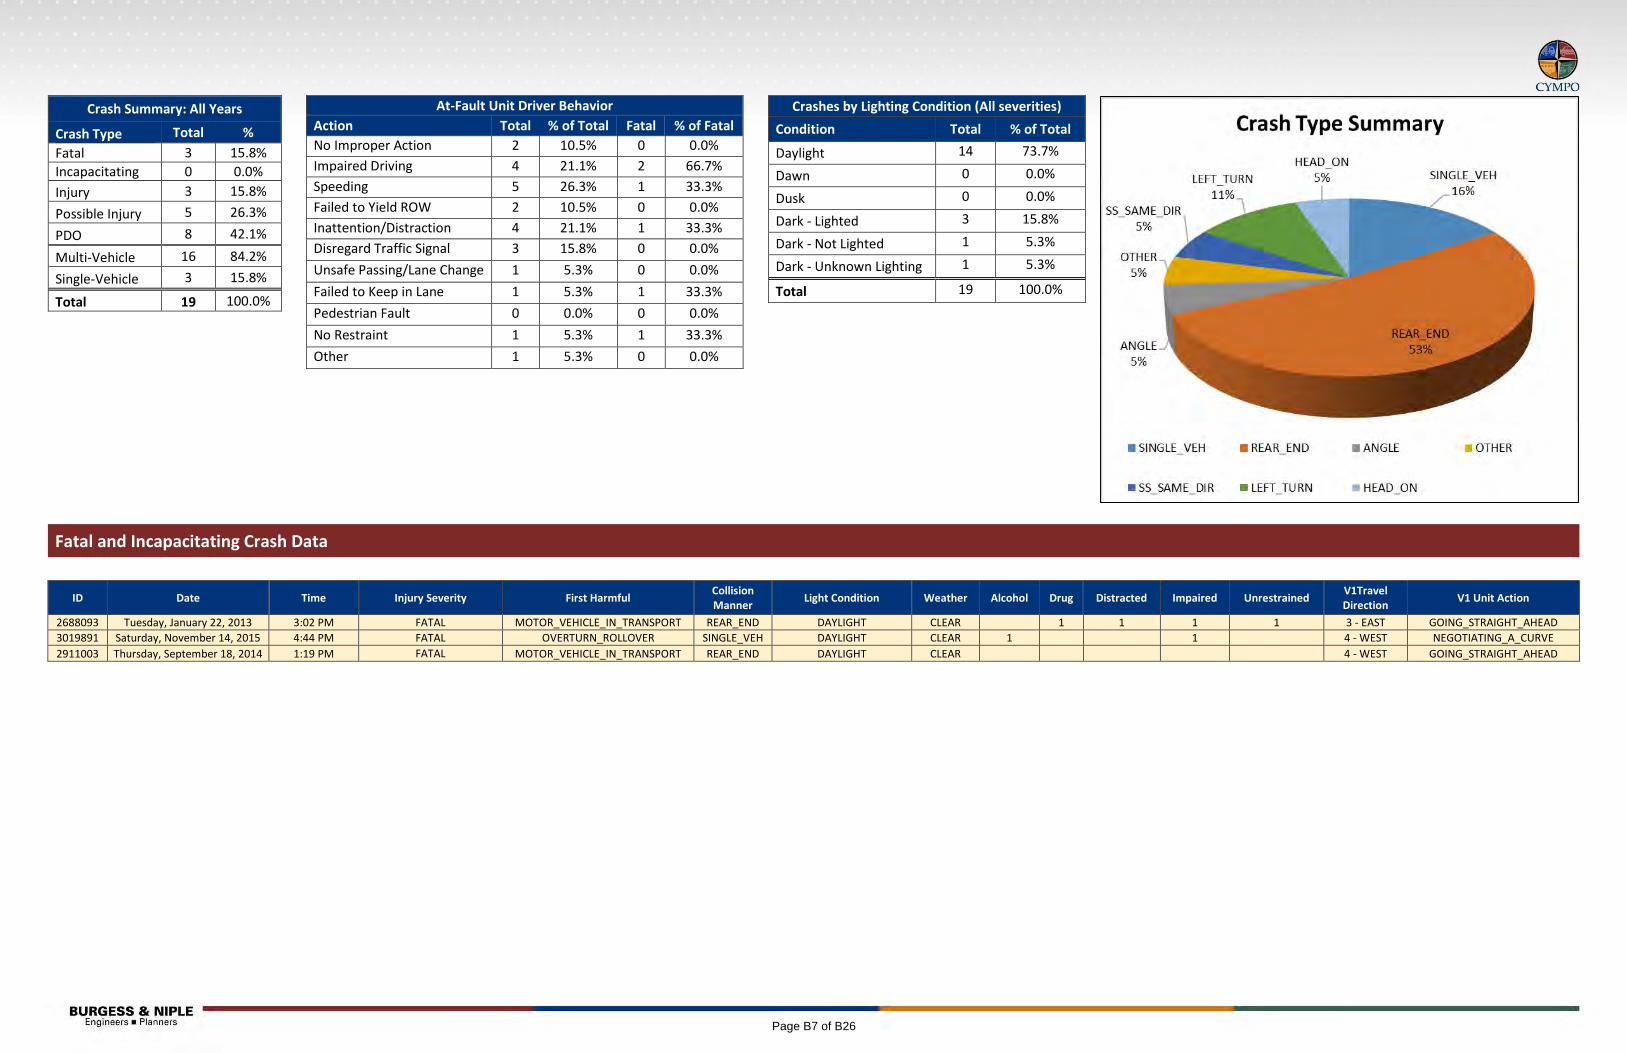
Fatal and Incapacitating Crash Data
ID Date Time Injury Severity First Harmful Collision Manner Light Condition Weather Alcohol Drug Distracted Impaired Unrestrained V1Travel
Direction V1 Unit Action
2688093 Tuesday, January 22, 2013 3:02 PM FATAL MOTOR_VEHICLE_IN_TRANSPORT REAR_END DAYLIGHT CLEAR 1 1 1 1 3 - EAST GOING_STRAIGHT_AHEAD 3019891 Saturday, November 14, 2015 4:44 PM FATAL OVERTURN_ROLLOVER SINGLE_VEH DAYLIGHT CLEAR 1 1 4 - WEST NEGOTIATING_A_CURVE 2911003 Thursday, September 18, 2014 1:19 PM FATAL MOTOR_VEHICLE_IN_TRANSPORT REAR_END DAYLIGHT CLEAR 4 - WEST GOING_STRAIGHT_AHEAD
Crash Summary: All Years
Crash Type Total % Fatal 3 15.8% Incapacitating 0 0.0% Injury 3 15.8% Possible Injury 5 26.3% PDO 8 42.1%
Multi-Vehicle 16 84.2% Single-Vehicle 3 15.8%
Total 19 100.0%
At-Fault Unit Driver Behavior Action Total % of Total Fatal % of Fatal No Improper Action 2 10.5% 0 0.0% Impaired Driving 4 21.1% 2 66.7% Speeding 5 26.3% 1 33.3% Failed to Yield ROW 2 10.5% 0 0.0% Inattention/Distraction 4 21.1% 1 33.3% Disregard Traffic Signal 3 15.8% 0 0.0% Unsafe Passing/Lane Change 1 5.3% 0 0.0% Failed to Keep in Lane 1 5.3% 1 33.3% Pedestrian Fault 0 0.0% 0 0.0% No Restraint 1 5.3% 1 33.3% Other 1 5.3% 0 0.0%
Crashes by Lighting Condition (All severities) Condition Total % of Total
Daylight 14 73.7%
Dawn 0 0.0%
Dusk 0 0.0%
Dark - Lighted 3 15.8%
Dark - Not Lighted 1 5.3%
Dark - Unknown Lighting 1 5.3%
Total 19 100.0%
Page B7 of B26

Potential Improvements
Project No.
Location Countermeasure CRF (%) Crash Type
Mitigated Crash Severity Unit Cost No. Units
Estimated Cost
Fatal Crash Reduction
Incapacitating Crash Reduction
Annual Benefit
Preliminary B/C
SR 89A and Roberts Road: EB & WB
Flashing warning signs (CMF 4201) 18 All K,A,B $45,000 4 $180,000 0.07 0 $417,600 15.2
Combined Project
Combined Project
Notes: Costs developed using 10 year project life $1,000 annual maintenance. Two fatal rear-end crashes included in annual benefit. Include in application with Fain Road and SR 69, identified on Fain Road segment.
Page B8 of B26
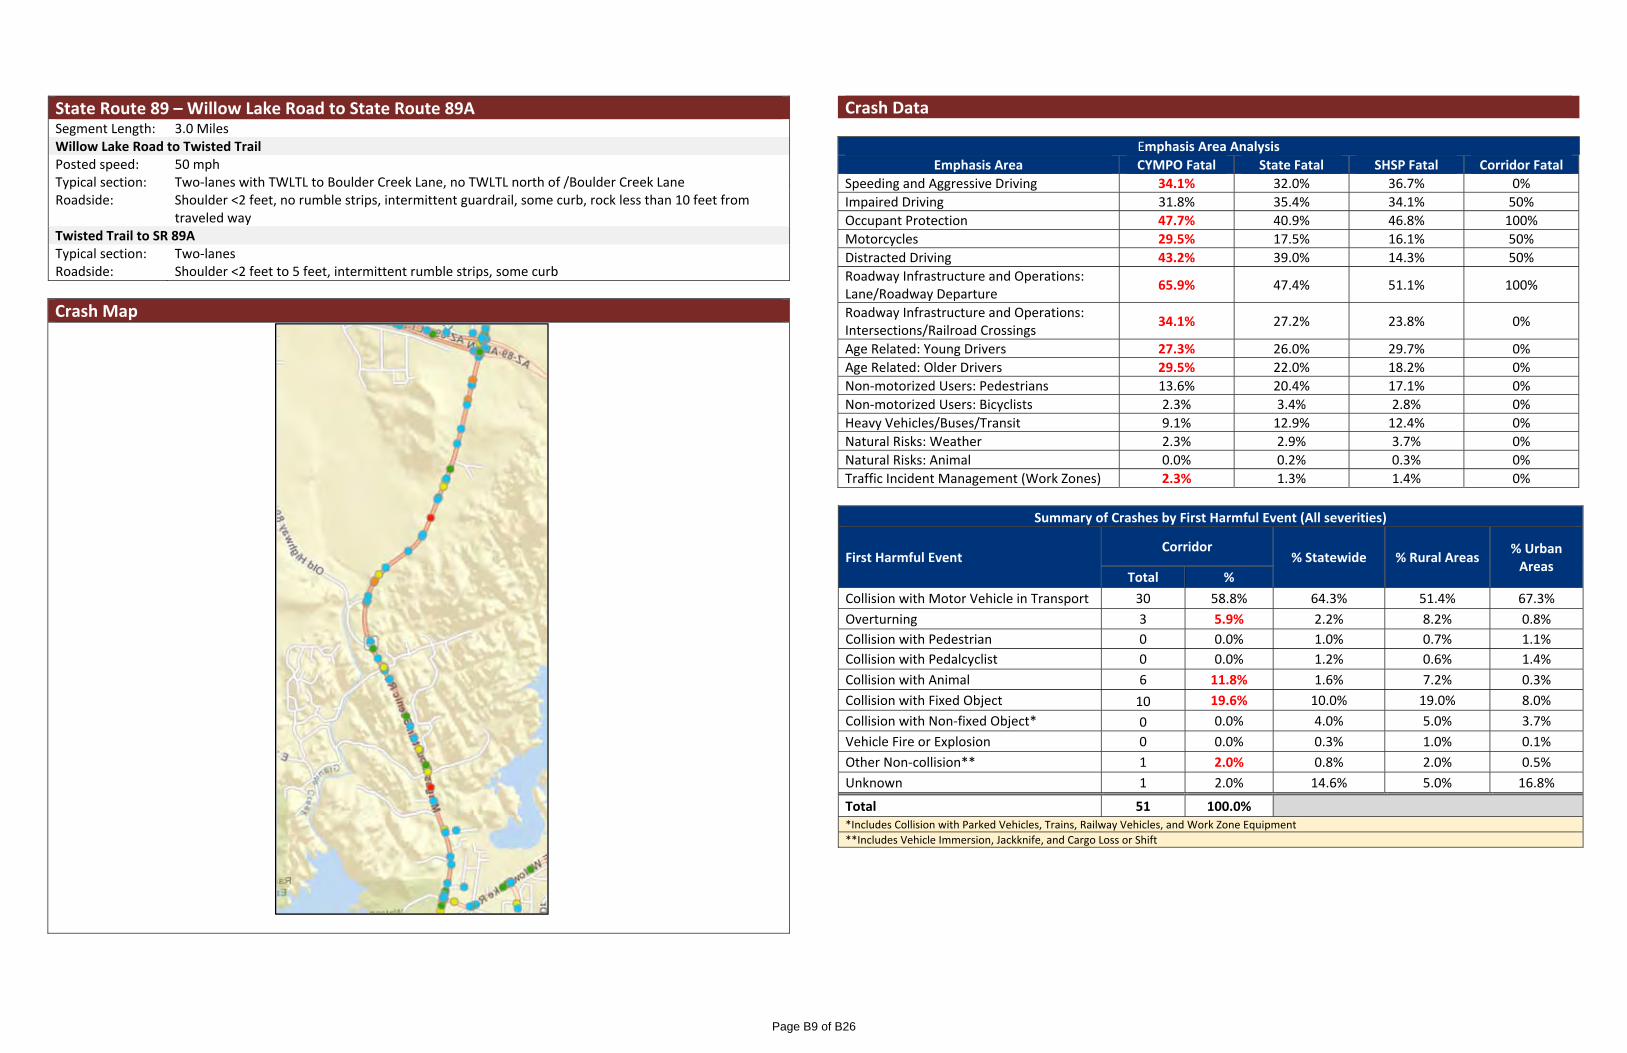
State Route 89 – Willow Lake Road to State Route 89A Segment Length: 3.0 Miles Willow Lake Road to Twisted Trail Posted speed: 50 mph Typical section: Two‐lanes with TWLTL to Boulder Creek Lane, no TWLTL north of /Boulder Creek Lane Roadside: Shoulder <2 feet, no rumble strips, intermittent guardrail, some curb, rock less than 10 feet from
traveled way Twisted Trail to SR 89A Typical section: Two‐lanes Roadside: Shoulder <2 feet to 5 feet, intermittent rumble strips, some curb
Crash Map
Crash Data
Emphasis Area Analysis
Emphasis Area CYMPO Fatal State Fatal SHSP Fatal Corridor Fatal
Speeding and Aggressive Driving 34.1% 32.0% 36.7% 0%
Impaired Driving 31.8% 35.4% 34.1% 50%
Occupant Protection 47.7% 40.9% 46.8% 100%
Motorcycles 29.5% 17.5% 16.1% 50%
Distracted Driving 43.2% 39.0% 14.3% 50%
Roadway Infrastructure and Operations: Lane/Roadway Departure
65.9% 47.4% 51.1% 100%
Roadway Infrastructure and Operations: Intersections/Railroad Crossings
34.1% 27.2% 23.8% 0%
Age Related: Young Drivers 27.3% 26.0% 29.7% 0%
Age Related: Older Drivers 29.5% 22.0% 18.2% 0%
Non‐motorized Users: Pedestrians 13.6% 20.4% 17.1% 0%
Non‐motorized Users: Bicyclists 2.3% 3.4% 2.8% 0%
Heavy Vehicles/Buses/Transit 9.1% 12.9% 12.4% 0%
Natural Risks: Weather 2.3% 2.9% 3.7% 0%
Natural Risks: Animal 0.0% 0.2% 0.3% 0%
Traffic Incident Management (Work Zones) 2.3% 1.3% 1.4% 0%
Summary of Crashes by First Harmful Event (All severities)
First Harmful Event Corridor
% Statewide % Rural Areas % Urban Areas
Total %
Collision with Motor Vehicle in Transport 30 58.8% 64.3% 51.4% 67.3%
Overturning 3 5.9% 2.2% 8.2% 0.8%
Collision with Pedestrian 0 0.0% 1.0% 0.7% 1.1%
Collision with Pedalcyclist 0 0.0% 1.2% 0.6% 1.4%
Collision with Animal 6 11.8% 1.6% 7.2% 0.3%
Collision with Fixed Object 10 19.6% 10.0% 19.0% 8.0%
Collision with Non‐fixed Object* 0 0.0% 4.0% 5.0% 3.7%
Vehicle Fire or Explosion 0 0.0% 0.3% 1.0% 0.1%
Other Non‐collision** 1 2.0% 0.8% 2.0% 0.5%
Unknown 1 2.0% 14.6% 5.0% 16.8%
Total 51 100.0% *Includes Collision with Parked Vehicles, Trains, Railway Vehicles, and Work Zone Equipment **Includes Vehicle Immersion, Jackknife, and Cargo Loss or Shift
Page B9 of B26
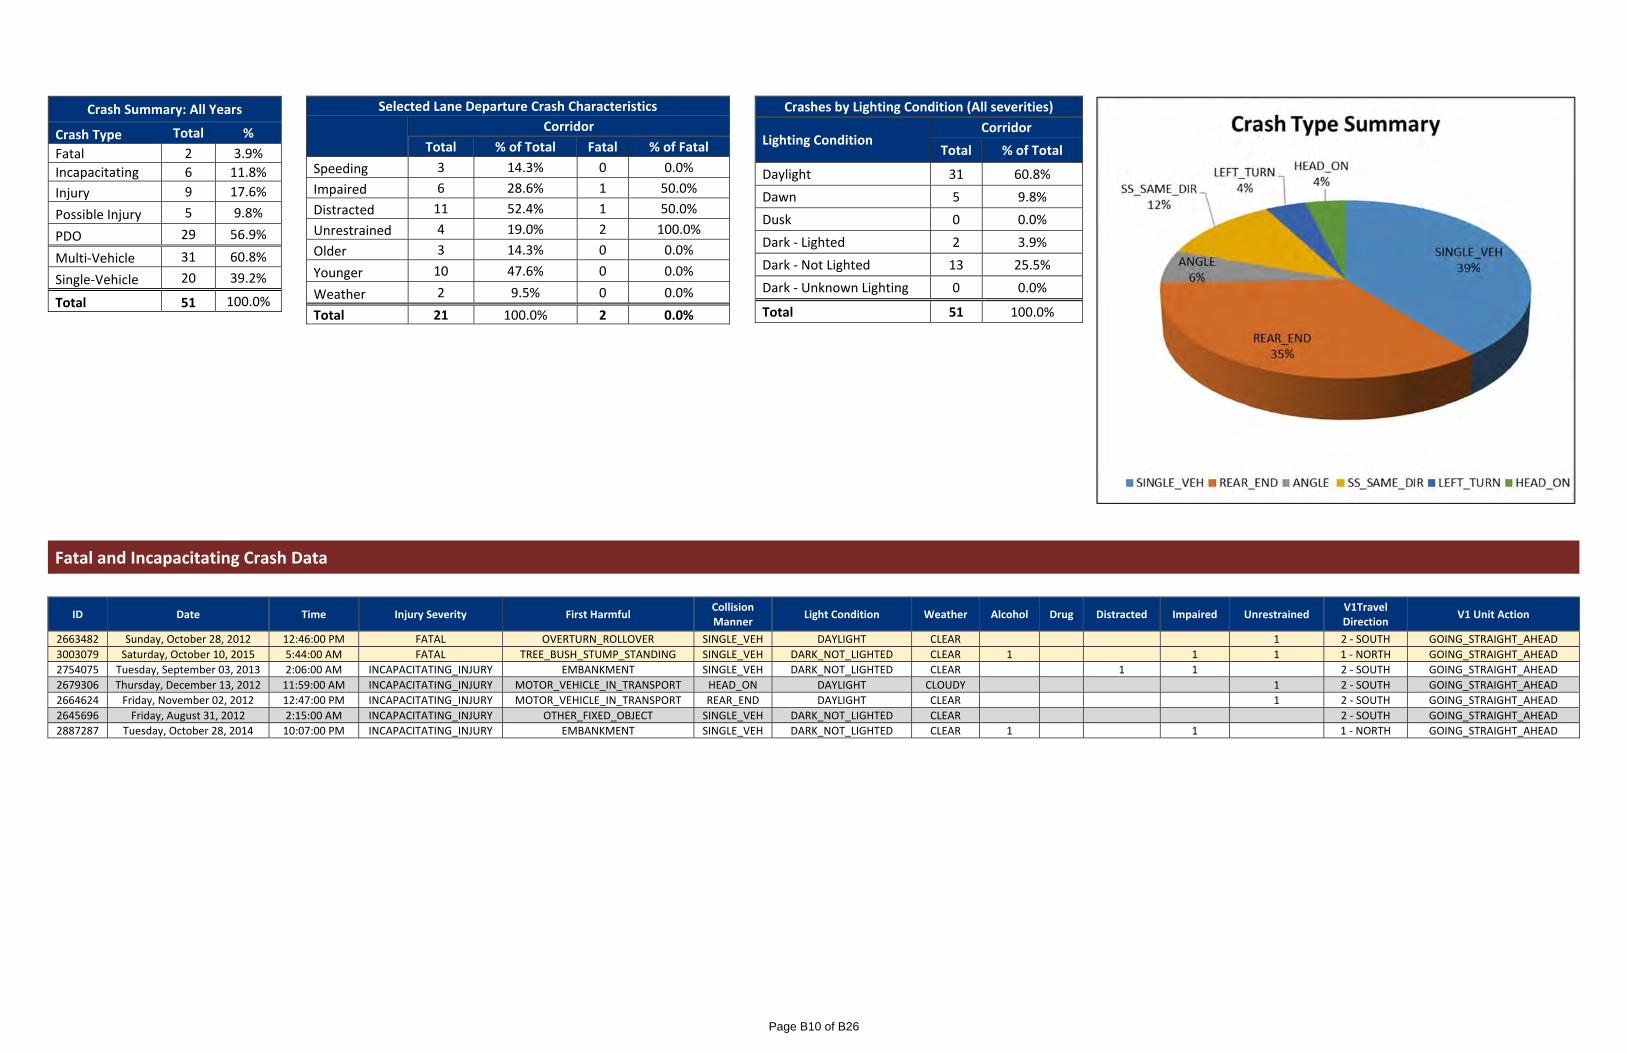
Fatal and Incapacitating Crash Data
ID Date Time Injury Severity First Harmful Collision Manner
Light Condition Weather Alcohol Drug Distracted Impaired Unrestrained V1Travel Direction
V1 Unit Action
2663482 Sunday, October 28, 2012 12:46:00 PM FATAL OVERTURN_ROLLOVER SINGLE_VEH DAYLIGHT CLEAR 1 2 ‐ SOUTH GOING_STRAIGHT_AHEAD
3003079 Saturday, October 10, 2015 5:44:00 AM FATAL TREE_BUSH_STUMP_STANDING SINGLE_VEH DARK_NOT_LIGHTED CLEAR 1 1 1 1 ‐ NORTH GOING_STRAIGHT_AHEAD
2754075 Tuesday, September 03, 2013 2:06:00 AM INCAPACITATING_INJURY EMBANKMENT SINGLE_VEH DARK_NOT_LIGHTED CLEAR 1 1 2 ‐ SOUTH GOING_STRAIGHT_AHEAD
2679306 Thursday, December 13, 2012 11:59:00 AM INCAPACITATING_INJURY MOTOR_VEHICLE_IN_TRANSPORT HEAD_ON DAYLIGHT CLOUDY 1 2 ‐ SOUTH GOING_STRAIGHT_AHEAD
2664624 Friday, November 02, 2012 12:47:00 PM INCAPACITATING_INJURY MOTOR_VEHICLE_IN_TRANSPORT REAR_END DAYLIGHT CLEAR 1 2 ‐ SOUTH GOING_STRAIGHT_AHEAD
2645696 Friday, August 31, 2012 2:15:00 AM INCAPACITATING_INJURY OTHER_FIXED_OBJECT SINGLE_VEH DARK_NOT_LIGHTED CLEAR 2 ‐ SOUTH GOING_STRAIGHT_AHEAD
2887287 Tuesday, October 28, 2014 10:07:00 PM INCAPACITATING_INJURY EMBANKMENT SINGLE_VEH DARK_NOT_LIGHTED CLEAR 1 1 1 ‐ NORTH GOING_STRAIGHT_AHEAD
Crash Summary: All Years
Crash Type Total %
Fatal 2 3.9%
Incapacitating 6 11.8%
Injury 9 17.6%
Possible Injury 5 9.8%
PDO 29 56.9%
Multi‐Vehicle 31 60.8%
Single‐Vehicle 20 39.2%
Total 51 100.0%
Selected Lane Departure Crash Characteristics
Corridor
Total % of Total Fatal % of Fatal
Speeding 3 14.3% 0 0.0%
Impaired 6 28.6% 1 50.0%
Distracted 11 52.4% 1 50.0%
Unrestrained 4 19.0% 2 100.0%
Older 3 14.3% 0 0.0%
Younger 10 47.6% 0 0.0%
Weather 2 9.5% 0 0.0%
Total 21 100.0% 2 0.0%
Crashes by Lighting Condition (All severities)
Lighting Condition Corridor
Total % of Total
Daylight 31 60.8%
Dawn 5 9.8%
Dusk 0 0.0%
Dark ‐ Lighted 2 3.9%
Dark ‐ Not Lighted 13 25.5%
Dark ‐ Unknown Lighting 0 0.0%
Total 51 100.0%
Page B10 of B26
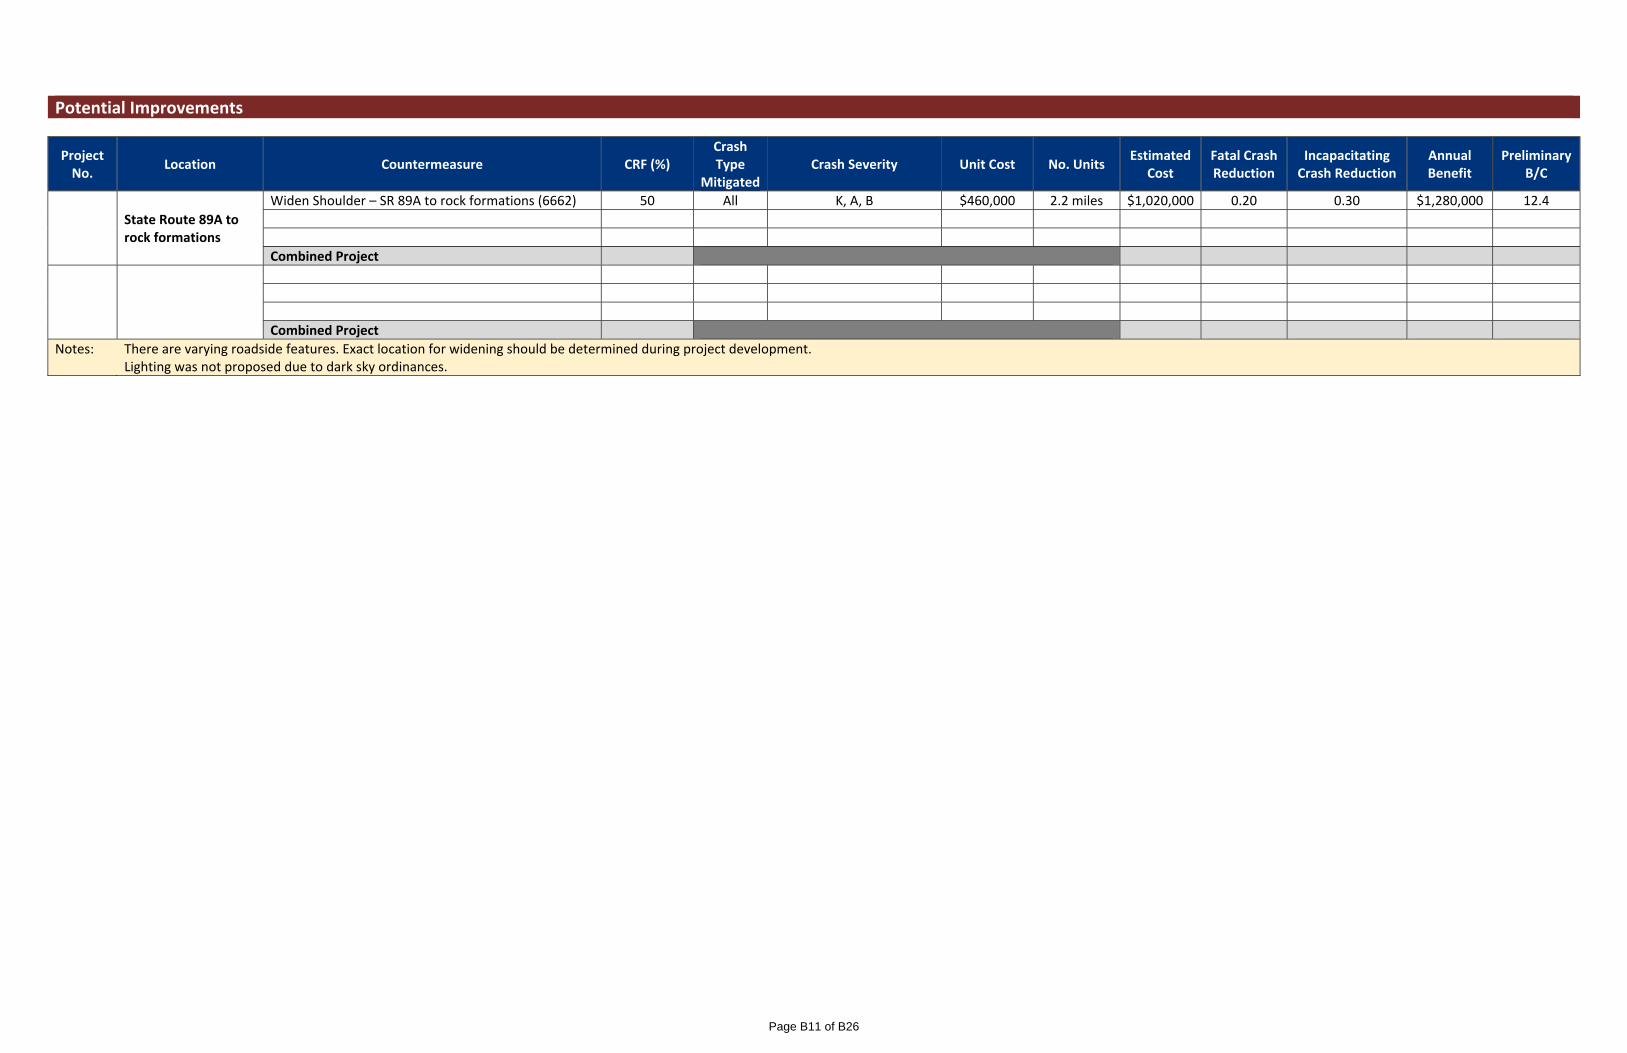
Potential Improvements
Project No.
Location Countermeasure CRF (%) Crash Type
MitigatedCrash Severity Unit Cost No. Units
Estimated Cost
Fatal Crash Reduction
Incapacitating Crash Reduction
Annual Benefit
Preliminary B/C
State Route 89A to rock formations
Widen Shoulder – SR 89A to rock formations (6662) 50 All K, A, B $460,000 2.2 miles $1,020,000 0.20 0.30 $1,280,000 12.4
Combined Project
Combined Project
Notes: There are varying roadside features. Exact location for widening should be determined during project development. Lighting was not proposed due to dark sky ordinances.
Page B11 of B26
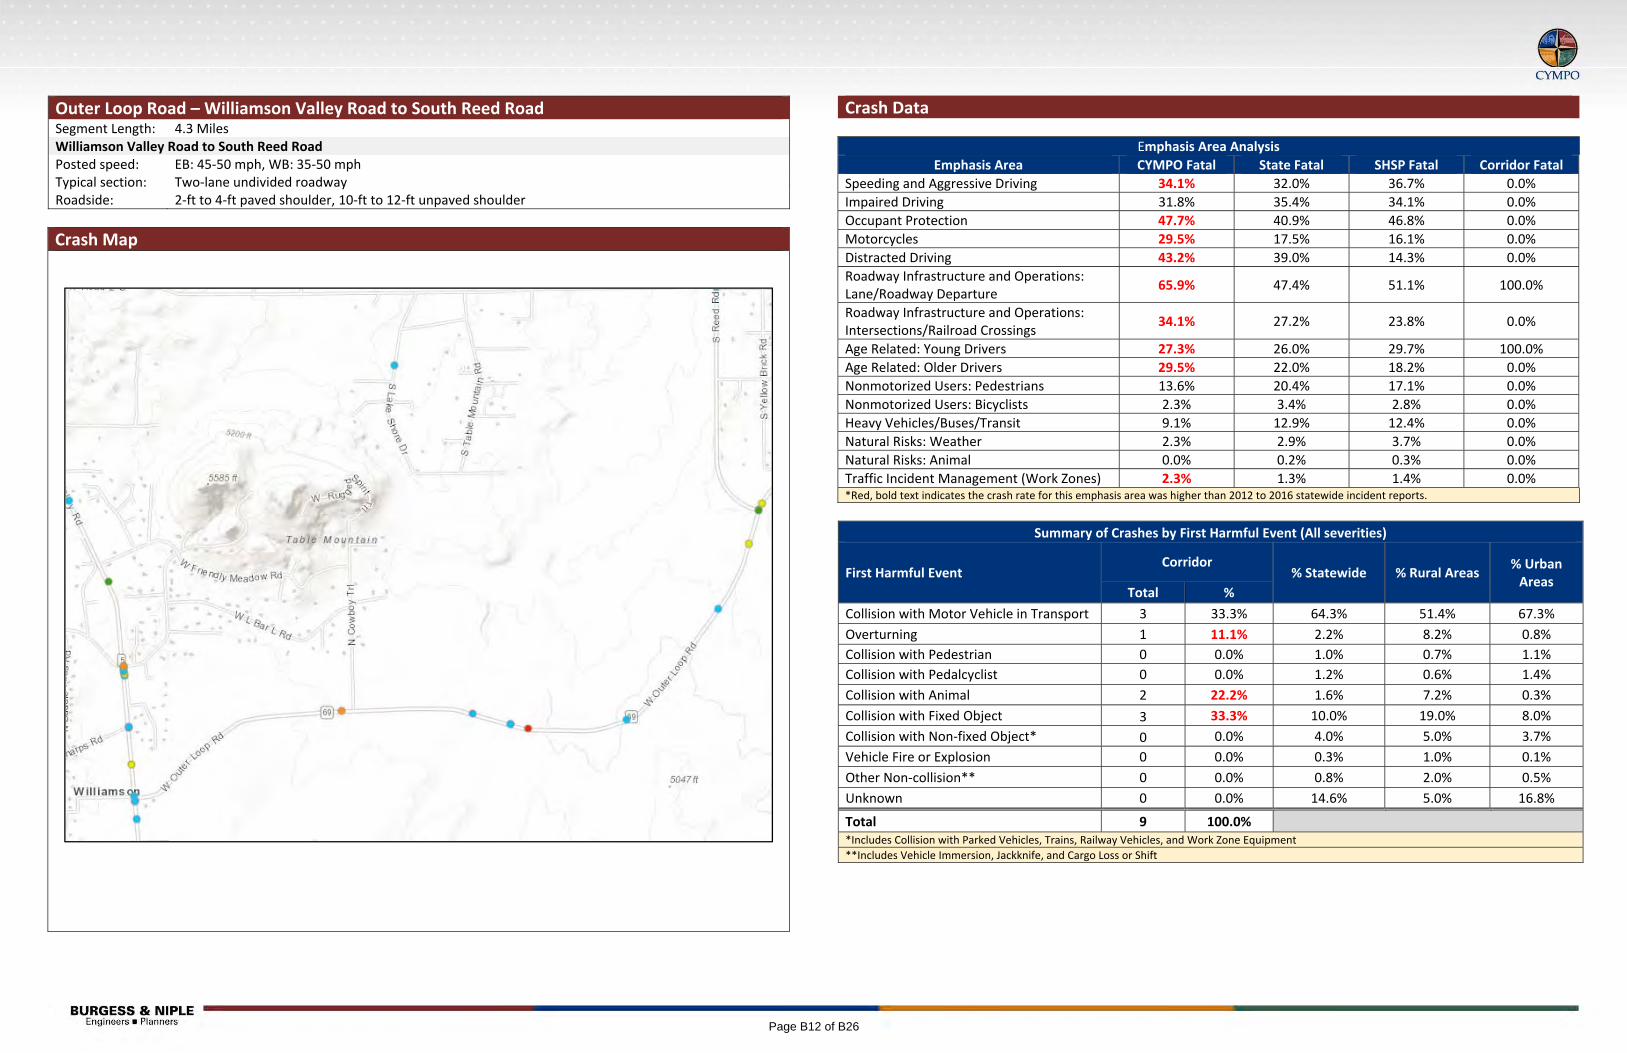
Outer Loop Road – Williamson Valley Road to South Reed Road Segment Length: 4.3 Miles Williamson Valley Road to South Reed Road Posted speed: EB: 45‐50 mph, WB: 35‐50 mph Typical section: Two‐lane undivided roadway Roadside: 2‐ft to 4‐ft paved shoulder, 10‐ft to 12‐ft unpaved shoulder
Crash Map
Crash Data
Emphasis Area Analysis
Emphasis Area CYMPO Fatal State Fatal SHSP Fatal Corridor Fatal
Speeding and Aggressive Driving 34.1% 32.0% 36.7% 0.0%
Impaired Driving 31.8% 35.4% 34.1% 0.0%
Occupant Protection 47.7% 40.9% 46.8% 0.0%
Motorcycles 29.5% 17.5% 16.1% 0.0%
Distracted Driving 43.2% 39.0% 14.3% 0.0%
Roadway Infrastructure and Operations: Lane/Roadway Departure
65.9% 47.4% 51.1% 100.0%
Roadway Infrastructure and Operations: Intersections/Railroad Crossings
34.1% 27.2% 23.8% 0.0%
Age Related: Young Drivers 27.3% 26.0% 29.7% 100.0%
Age Related: Older Drivers 29.5% 22.0% 18.2% 0.0%
Nonmotorized Users: Pedestrians 13.6% 20.4% 17.1% 0.0%
Nonmotorized Users: Bicyclists 2.3% 3.4% 2.8% 0.0%
Heavy Vehicles/Buses/Transit 9.1% 12.9% 12.4% 0.0%
Natural Risks: Weather 2.3% 2.9% 3.7% 0.0%
Natural Risks: Animal 0.0% 0.2% 0.3% 0.0%
Traffic Incident Management (Work Zones) 2.3% 1.3% 1.4% 0.0% *Red, bold text indicates the crash rate for this emphasis area was higher than 2012 to 2016 statewide incident reports.
Summary of Crashes by First Harmful Event (All severities)
First Harmful Event Corridor
% Statewide % Rural Areas % Urban Areas
Total %
Collision with Motor Vehicle in Transport 3 33.3% 64.3% 51.4% 67.3%
Overturning 1 11.1% 2.2% 8.2% 0.8%
Collision with Pedestrian 0 0.0% 1.0% 0.7% 1.1%
Collision with Pedalcyclist 0 0.0% 1.2% 0.6% 1.4%
Collision with Animal 2 22.2% 1.6% 7.2% 0.3%
Collision with Fixed Object 3 33.3% 10.0% 19.0% 8.0%
Collision with Non‐fixed Object* 0 0.0% 4.0% 5.0% 3.7%
Vehicle Fire or Explosion 0 0.0% 0.3% 1.0% 0.1%
Other Non‐collision** 0 0.0% 0.8% 2.0% 0.5%
Unknown 0 0.0% 14.6% 5.0% 16.8%
Total 9 100.0% *Includes Collision with Parked Vehicles, Trains, Railway Vehicles, and Work Zone Equipment **Includes Vehicle Immersion, Jackknife, and Cargo Loss or Shift
Page B12 of B26
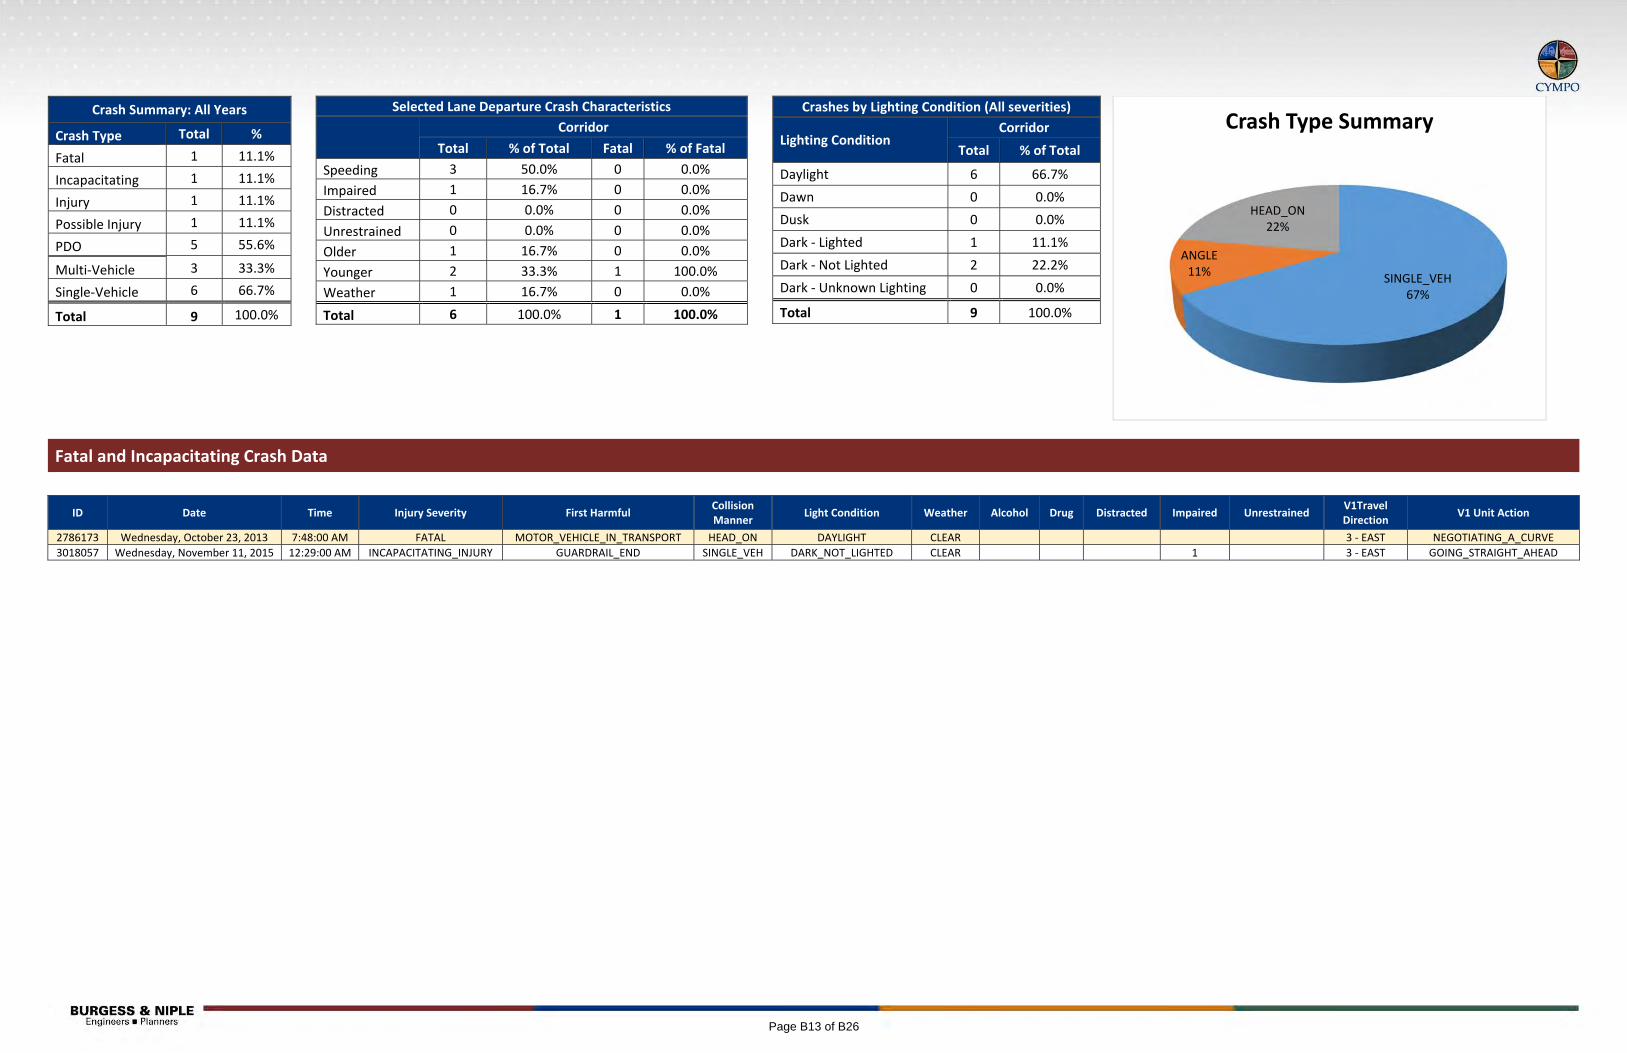
Fatal and Incapacitating Crash Data
ID Date Time Injury Severity First Harmful Collision Manner
Light Condition Weather Alcohol Drug Distracted Impaired Unrestrained V1Travel Direction
V1 Unit Action
2786173 Wednesday, October 23, 2013 7:48:00 AM FATAL MOTOR_VEHICLE_IN_TRANSPORT HEAD_ON DAYLIGHT CLEAR 3 ‐ EAST NEGOTIATING_A_CURVE
3018057 Wednesday, November 11, 2015 12:29:00 AM INCAPACITATING_INJURY GUARDRAIL_END SINGLE_VEH DARK_NOT_LIGHTED CLEAR 1 3 ‐ EAST GOING_STRAIGHT_AHEAD
SINGLE_VEH67%
ANGLE 11%
HEAD_ON22%
Crash Type SummaryCrash Summary: All Years
Crash Type Total %
Fatal 1 11.1%
Incapacitating 1 11.1%
Injury 1 11.1%
Possible Injury 1 11.1%
PDO 5 55.6%
Multi‐Vehicle 3 33.3%
Single‐Vehicle 6 66.7%
Total 9 100.0%
Selected Lane Departure Crash Characteristics
Corridor
Total % of Total Fatal % of Fatal
Speeding 3 50.0% 0 0.0%
Impaired 1 16.7% 0 0.0%
Distracted 0 0.0% 0 0.0%
Unrestrained 0 0.0% 0 0.0%
Older 1 16.7% 0 0.0%
Younger 2 33.3% 1 100.0%
Weather 1 16.7% 0 0.0%
Total 6 100.0% 1 100.0%
Crashes by Lighting Condition (All severities)
Lighting Condition Corridor
Total % of Total
Daylight 6 66.7%
Dawn 0 0.0%
Dusk 0 0.0%
Dark ‐ Lighted 1 11.1%
Dark ‐ Not Lighted 2 22.2%
Dark ‐ Unknown Lighting 0 0.0%
Total 9 100.0%
Page B13 of B26
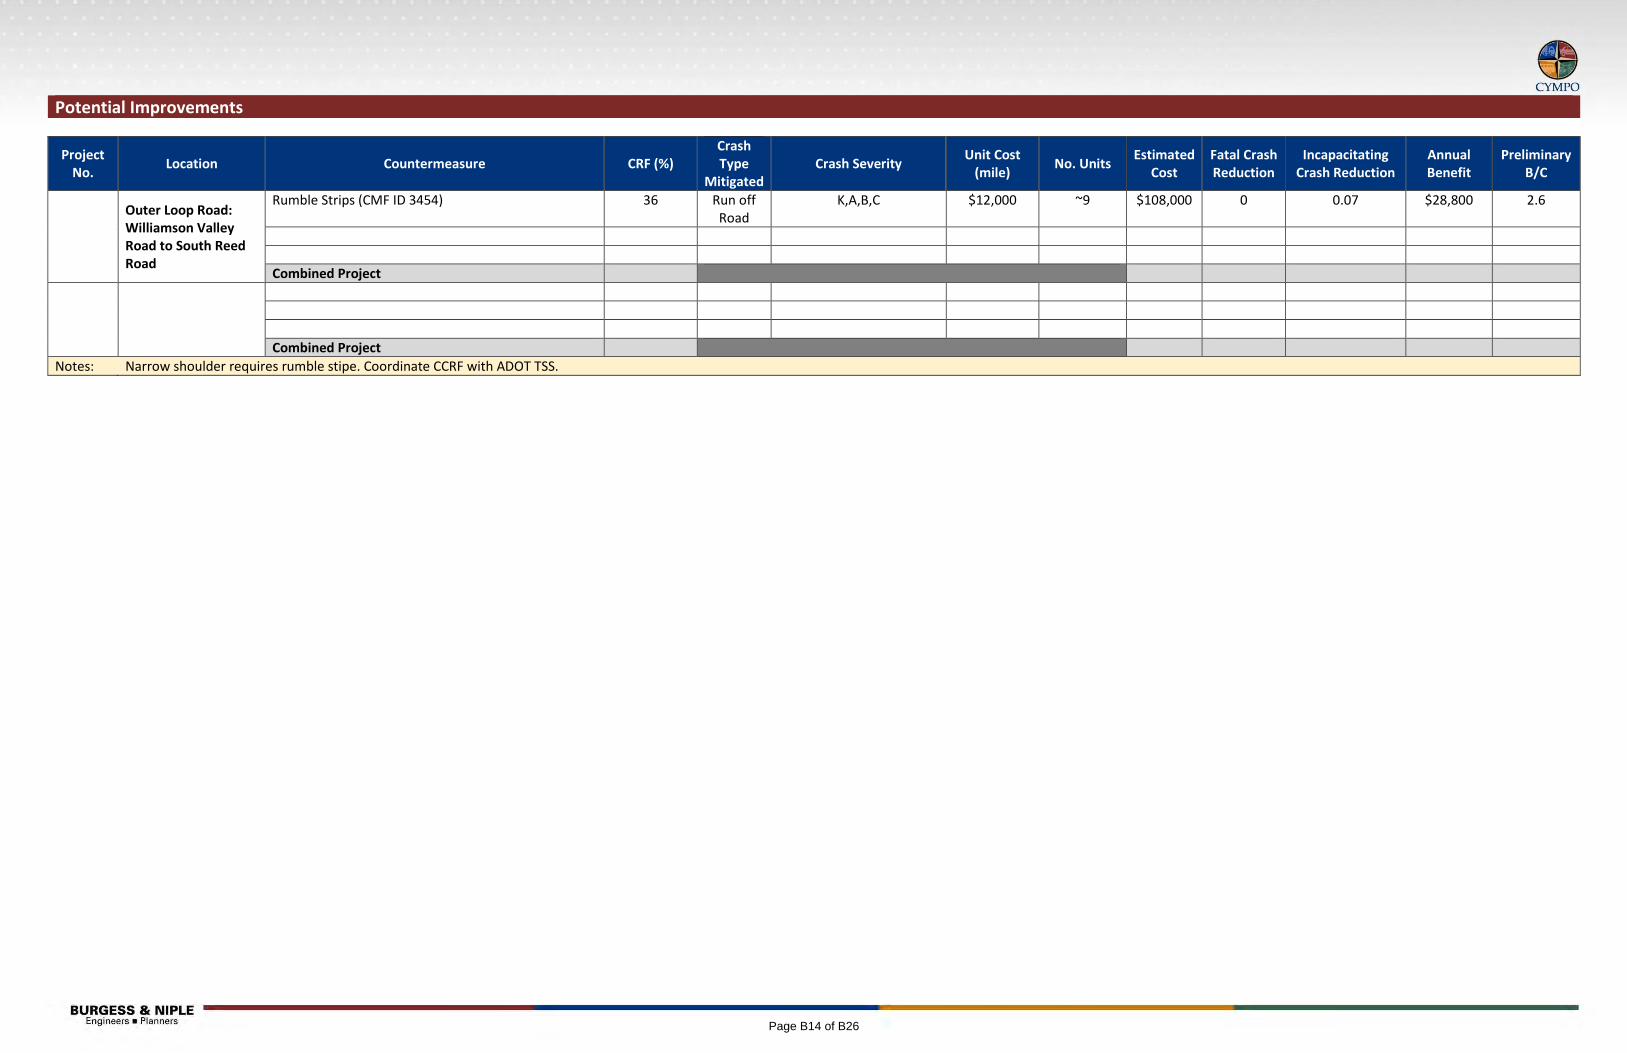
Potential Improvements
Project No.
Location Countermeasure CRF (%) Crash Type
Mitigated Crash Severity
Unit Cost (mile)
No. Units Estimated
Cost Fatal Crash Reduction
Incapacitating Crash Reduction
Annual Benefit
Preliminary B/C
Outer Loop Road: Williamson Valley Road to South Reed Road
Rumble Strips (CMF ID 3454) 36 Run off Road
K,A,B,C $12,000 ~9 $108,000 0 0.07 $28,800 2.6
Combined Project
Combined Project
Notes: Narrow shoulder requires rumble stipe. Coordinate CCRF with ADOT TSS.
Page B14 of B26

Williamson Valley Road – Iron Springs Road to Outer Loop Road Segment Length: 9.3 Miles Iron Springs Road to Yakashba Drive Posted speed: 35 mph Typical section: four‐lane undivided roadway with TWLTL Roadside: 5‐ft paved shoulder, curb Yakashba Drive to Burnt Ranch Drive Typical Section: four‐lane undivided roadway Roadside: 4‐ft to 10‐ft paved shoulder, intermittent curb, intermittent guardrail Burnt Ranch Drive to Southview Drive Typical Section: four‐lane undivided roadway with TWLTL Roadside: 4‐ft paved shoulder, intermittent guardrail Southview Drive to Pioneer Parkway Typical section: four‐lane divided roadway with landscaped median Roadside: 4‐ft paved shoulder, intermittent guardrail
Pioneer Parkway to Outer Loop Road Typical section: two‐lane undivided roadway Roadside: 1‐ft to 10‐ft paved shoulder, 4‐ft to 10‐ft unpaved shoulder, ground mount delineators
Crash Map
Crash Data
Emphasis Area Analysis
Emphasis Area CYMPO Fatal State Fatal SHSP Fatal Corridor Fatal
Speeding and Aggressive Driving 34.1% 32.0% 36.7% 100.0%
Impaired Driving 31.8% 35.4% 34.1% 100.0%
Occupant Protection 47.7% 40.9% 46.8% 100.0%
Motorcycles 29.5% 17.5% 16.1% 100.0%
Distracted Driving 43.2% 39.0% 14.3% 0.0%
Roadway Infrastructure and Operations: Lane/Roadway Departure
65.9% 47.4% 51.1% 100.0%
Roadway Infrastructure and Operations: Intersections/Railroad Crossings
34.1% 27.2% 23.8% 0.0%
Age Related: Young Drivers 27.3% 26.0% 29.7% 0.0%
Age Related: Older Drivers 29.5% 22.0% 18.2% 0.0%
Non‐motorized Users: Pedestrians 13.6% 20.4% 17.1% 0.0%
Non‐motorized Users: Bicyclists 2.3% 3.4% 2.8% 0.0%
Heavy Vehicles/Buses/Transit 9.1% 12.9% 12.4% 0.0%
Natural Risks: Weather 2.3% 2.9% 3.7% 0.0%
Natural Risks: Animal 0.0% 0.2% 0.3% 0.0%
Traffic Incident Management (Work Zones) 2.3% 1.3% 1.4% 0.0% *Red, bold text indicates the crash rate for this emphasis area was higher than 2012 to 2016 statewide incident reports.
Summary of Crashes by First Harmful Event (All severities)
First Harmful Event Corridor
% Statewide % Rural Areas % Urban Areas
Total %
Collision with Motor Vehicle in Transport 32 35.6% 64.3% 51.4% 67.3%
Overturning 7 7.8% 2.2% 8.2% 0.8%
Collision with Pedestrian 0 0.0% 1.0% 0.7% 1.1%
Collision with Pedalcyclist 2 2.2% 1.2% 0.6% 1.4%
Collision with Animal 21 23.3% 1.6% 7.2% 0.3%
Collision with Fixed Object 23 25.6% 10.0% 19.0% 8.0%
Collision with Non‐fixed Object* 1 1.1% 4.0% 5.0% 3.7%
Vehicle Fire or Explosion 0 0.0% 0.3% 1.0% 0.1%
Other Non‐collision** 1 1.1% 0.8% 2.0% 0.5%
Unknown 3 3.3% 14.6% 5.0% 16.8%
Total 90 100.0% *Includes Collision with Parked Vehicles, Trains, Railway Vehicles, and Work Zone Equipment **Includes Vehicle Immersion, Jackknife, and Cargo Loss or Shift
Page B15 of B26

Fatal and Incapacitating Crash Data
ID Date Time Injury Severity First Harmful Collision Manner
Light Condition Weather Alcohol Drug Distracted Impaired Unrestrained V1Travel Direction
V1 Unit Action
2617726 Sunday, April 08, 2012 7:18:00 PM FATAL OVERTURN_ROLLOVER SINGLE_VEH DUSK CLEAR 1 1 1 1 ‐ NORTH NEGOTIATING_A_CURVE
2703756 Friday, March 08, 2013 3:36:00 PM INCAPACITATING_INJURY DITCH SINGLE_VEH DAYLIGHT SNOW 1 ‐ NORTH GOING_STRAIGHT_AHEAD
3006427 Sunday, September 06, 2015 6:36:00 PM INCAPACITATING_INJURY PEDALCYCLE OTHER DUSK CLEAR 2 ‐ SOUTH OVERTAKING_PASSING
3082804 Wednesday, April 06, 2016 2:00:00 PM INCAPACITATING_INJURY MOTOR_VEHICLE_IN_TRANSPORT LEFT_TURN DAYLIGHT CLEAR 1 ‐ NORTH MAKING_LEFT_TURN
SINGLE_VEH59%
SS_OPP_DIR1%
REAR_END18%
ANGLE 5%
OTHER2%
SS_SAME_DIR4% LEFT_TURN
9%
HEAD_ON1%
REAR_TO_REAR1%
Crash Type SummaryCrash Summary: All Years
Crash Type Total %
Fatal 1 1.1%
Incapacitating 3 3.3%
Injury 15 16.7%
Possible Injury 10 11.1%
PDO 61 67.8%
Multi‐Vehicle 37 41.1%
Single‐Vehicle 53 58.9%
Total 90 100.0%
Selected Lane Departure Crash Characteristics
Corridor
Total % of Total Fatal % of Fatal
Speeding 11 30.6% 1 100.0%
Impaired 11 30.6% 1 100.0%
Distracted 12 33.3% 0 0.0%
Unrestrained 2 5.6% 1 100.0%
Older 11 30.6% 0 0.0%
Younger 13 36.1% 0 0.0%
Weather 5 13.9% 0 0.0%
Total 36 100.0% 1 100.0%
Crashes by Lighting Condition (All severities)
Lighting Condition Corridor
Total % of Total
Daylight 54 60.0%
Dawn 4 4.4%
Dusk 4 4.4%
Dark ‐ Lighted 2 2.2%
Dark ‐ Not Lighted 25 27.8%
Dark ‐ Unknown Lighting 1 1.1%
Total 90 100.0%
Page B16 of B26
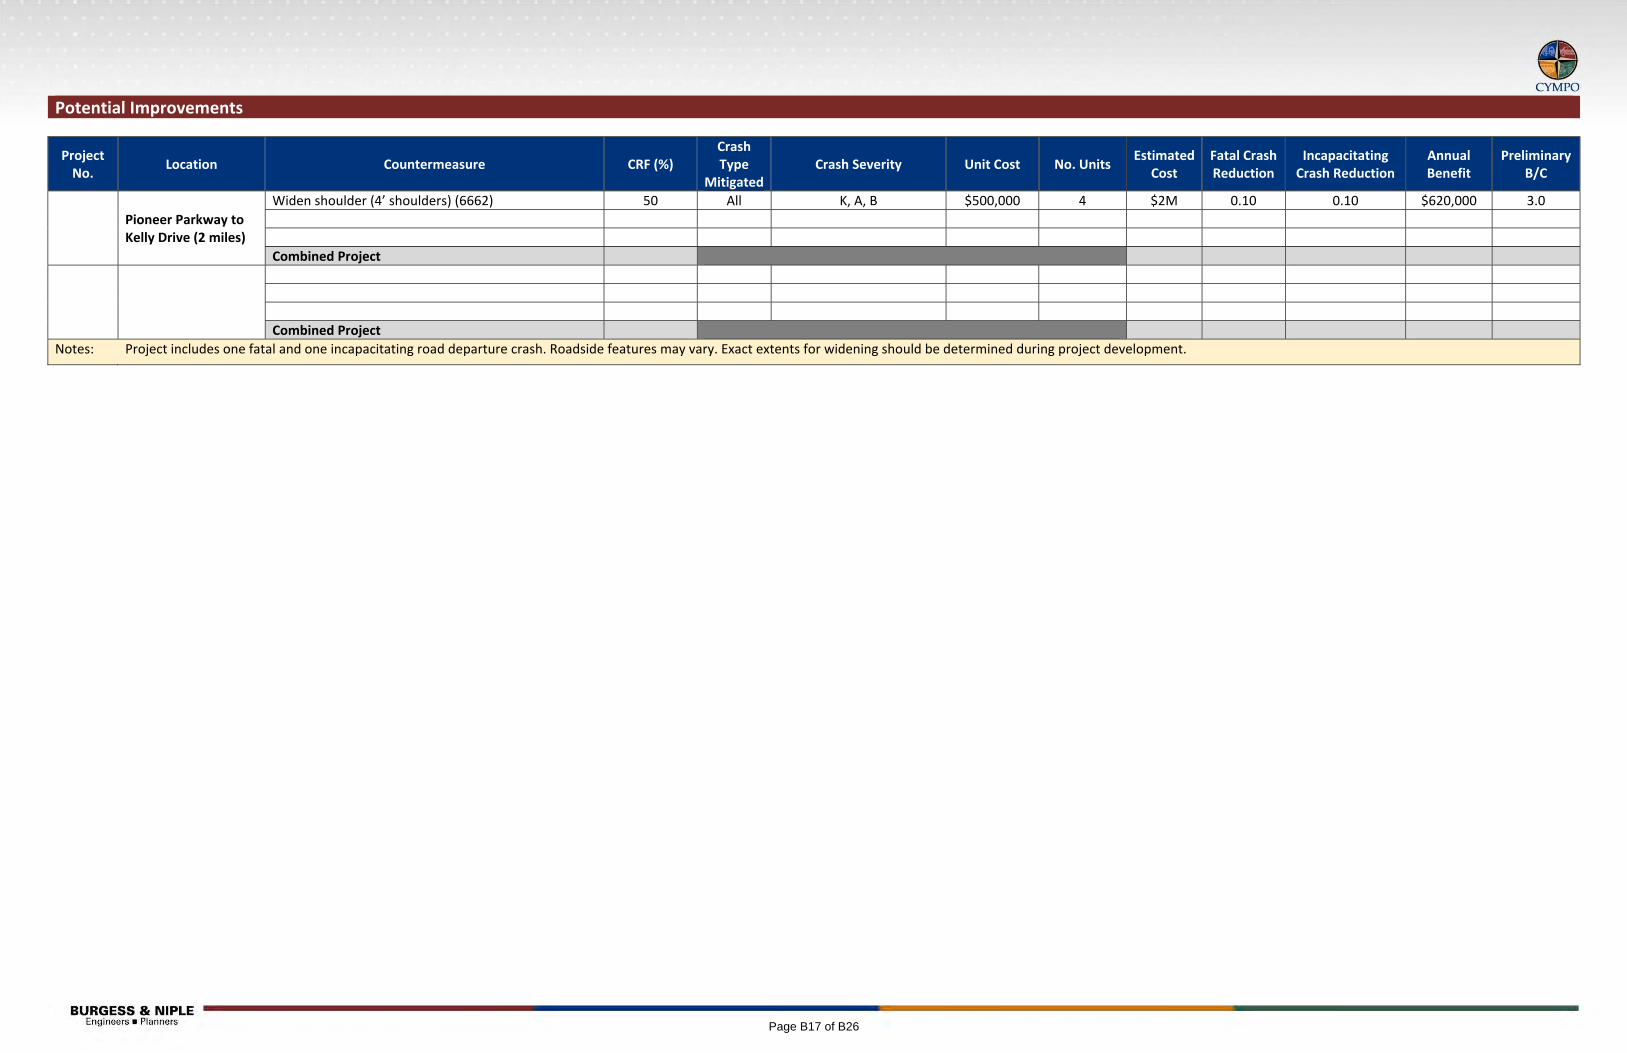
Potential Improvements
Project No.
Location Countermeasure CRF (%) Crash Type
MitigatedCrash Severity Unit Cost No. Units
Estimated Cost
Fatal Crash Reduction
Incapacitating Crash Reduction
Annual Benefit
Preliminary B/C
Pioneer Parkway to Kelly Drive (2 miles)
Widen shoulder (4’ shoulders) (6662) 50 All K, A, B $500,000 4 $2M 0.10 0.10 $620,000 3.0
Combined Project
Combined Project
Notes: Project includes one fatal and one incapacitating road departure crash. Roadside features may vary. Exact extents for widening should be determined during project development.
Page B17 of B26
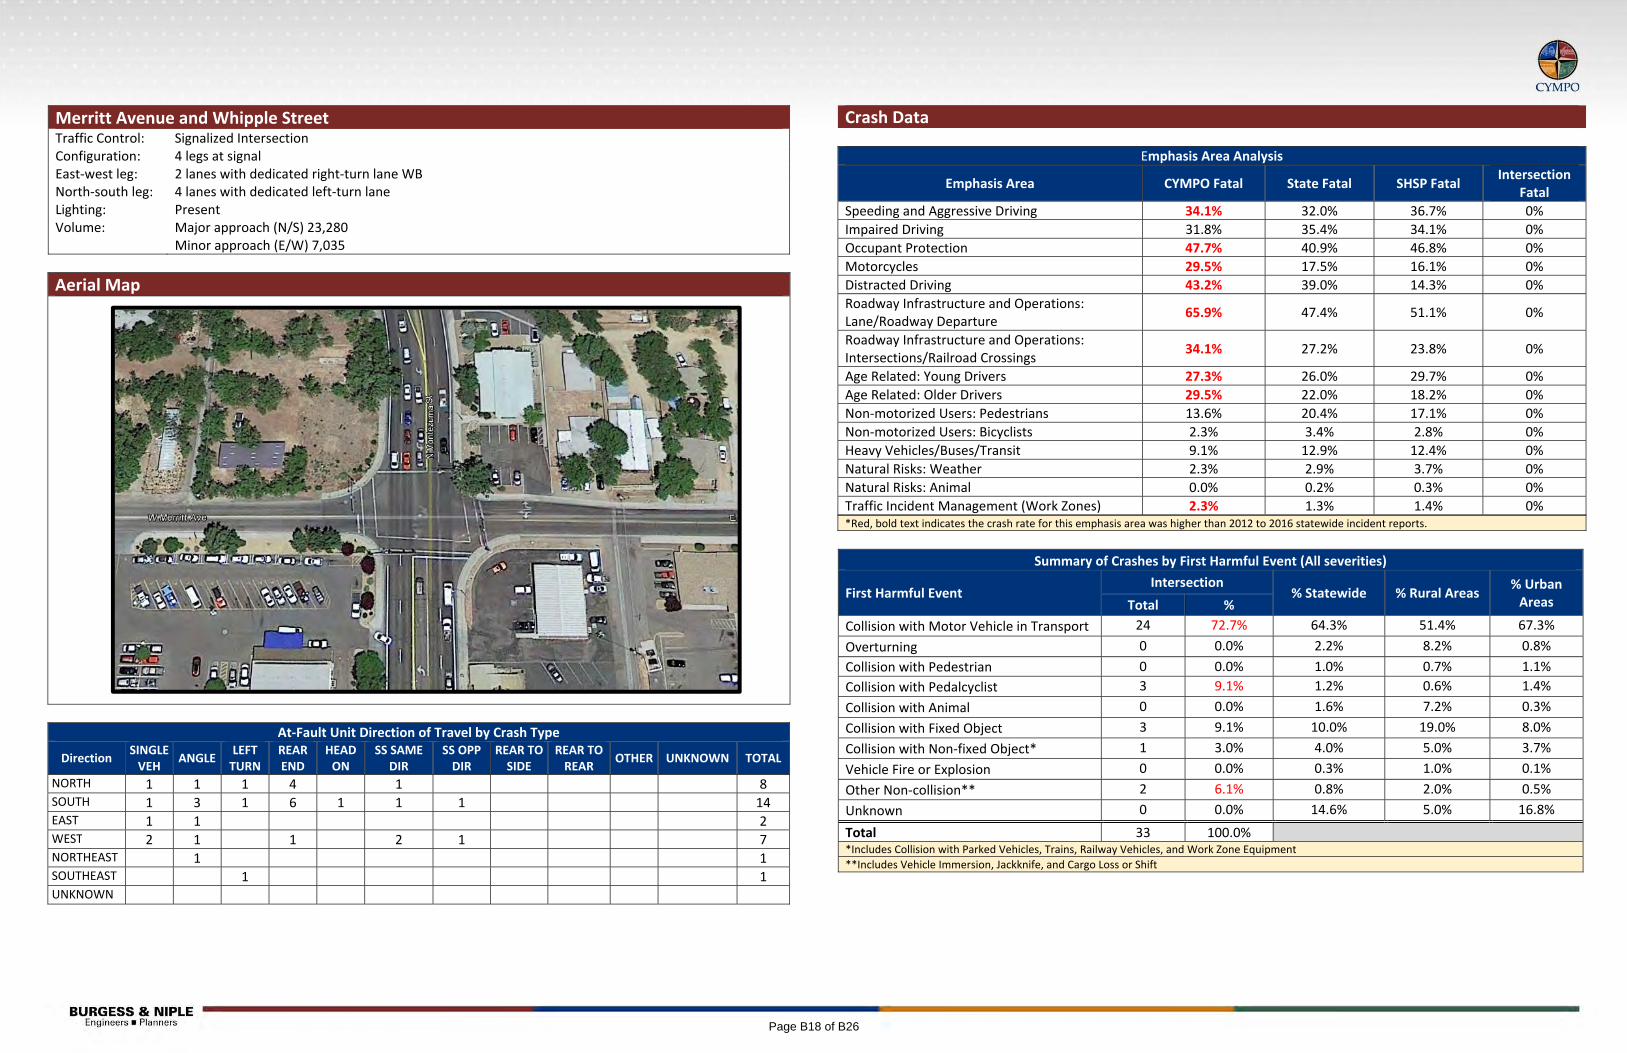
Merritt Avenue and Whipple Street Traffic Control: Signalized Intersection Configuration: 4 legs at signal East‐west leg: 2 lanes with dedicated right‐turn lane WB North‐south leg: 4 lanes with dedicated left‐turn lane Lighting: Present Volume: Major approach (N/S) 23,280
Minor approach (E/W) 7,035
Aerial Map
At‐Fault Unit Direction of Travel by Crash Type
Direction SINGLE VEH
ANGLE LEFT TURN
REAR END
HEAD ON
SS SAME DIR
SS OPP DIR
REAR TO SIDE
REAR TO REAR
OTHER UNKNOWN TOTAL
NORTH 1 1 1 4 1 8 SOUTH 1 3 1 6 1 1 1 14 EAST 1 1 2 WEST 2 1 1 2 1 7 NORTHEAST 1 1 SOUTHEAST 1 1 UNKNOWN
Crash Data
Emphasis Area Analysis
Emphasis Area CYMPO Fatal State Fatal SHSP Fatal Intersection
Fatal
Speeding and Aggressive Driving 34.1% 32.0% 36.7% 0%
Impaired Driving 31.8% 35.4% 34.1% 0%
Occupant Protection 47.7% 40.9% 46.8% 0%
Motorcycles 29.5% 17.5% 16.1% 0%
Distracted Driving 43.2% 39.0% 14.3% 0%
Roadway Infrastructure and Operations: Lane/Roadway Departure
65.9% 47.4% 51.1% 0%
Roadway Infrastructure and Operations: Intersections/Railroad Crossings
34.1% 27.2% 23.8% 0%
Age Related: Young Drivers 27.3% 26.0% 29.7% 0%
Age Related: Older Drivers 29.5% 22.0% 18.2% 0%
Non‐motorized Users: Pedestrians 13.6% 20.4% 17.1% 0%
Non‐motorized Users: Bicyclists 2.3% 3.4% 2.8% 0%
Heavy Vehicles/Buses/Transit 9.1% 12.9% 12.4% 0%
Natural Risks: Weather 2.3% 2.9% 3.7% 0%
Natural Risks: Animal 0.0% 0.2% 0.3% 0%
Traffic Incident Management (Work Zones) 2.3% 1.3% 1.4% 0% *Red, bold text indicates the crash rate for this emphasis area was higher than 2012 to 2016 statewide incident reports.
Summary of Crashes by First Harmful Event (All severities)
First Harmful Event Intersection
% Statewide % Rural Areas % Urban Areas Total %
Collision with Motor Vehicle in Transport 24 72.7% 64.3% 51.4% 67.3%
Overturning 0 0.0% 2.2% 8.2% 0.8%
Collision with Pedestrian 0 0.0% 1.0% 0.7% 1.1%
Collision with Pedalcyclist 3 9.1% 1.2% 0.6% 1.4%
Collision with Animal 0 0.0% 1.6% 7.2% 0.3%
Collision with Fixed Object 3 9.1% 10.0% 19.0% 8.0%
Collision with Non‐fixed Object* 1 3.0% 4.0% 5.0% 3.7%
Vehicle Fire or Explosion 0 0.0% 0.3% 1.0% 0.1%
Other Non‐collision** 2 6.1% 0.8% 2.0% 0.5%
Unknown 0 0.0% 14.6% 5.0% 16.8%
Total 33 100.0% *Includes Collision with Parked Vehicles, Trains, Railway Vehicles, and Work Zone Equipment **Includes Vehicle Immersion, Jackknife, and Cargo Loss or Shift
Page B18 of B26

Fatal and Incapacitating Crash Data
ID Date Time Injury Severity First Harmful Collision Manner
Light Condition Weather Alcohol Drug Distracted Impaired Unrestrained V1Travel Direction
V1 Unit Action
2926532 Friday, February 20, 2015 3:08:00 PM INCAPACITATING_INJURY MOTOR_VEHICLE_IN_TRANSPORT ANGLE DAYLIGHT CLOUDY 1 ‐ NORTH GOING_STRAIGHT_AHEAD
2588713 Thursday, January 26, 2012 1:01:00 PM INCAPACITATING_INJURY PEDALCYCLE ANGLE DAYLIGHT CLEAR 1 6 ‐ NORTHEAST MAKING_RIGHT_TURN
2656315 Friday, October 05, 2012 5:57:00 PM INCAPACITATING_INJURY MOTOR_VEHICLE_IN_TRANSPORT HEAD_ON DUSK CLOUDY 1 2 ‐ SOUTH NEGOTIATING_A_CURVE
2611099 Tuesday, March 27, 2012 3:12:00 PM INCAPACITATING_INJURY MOTOR_VEHICLE_IN_TRANSPORT ANGLE DAYLIGHT CLEAR 1 3 ‐ EAST MAKING_LEFT_TURN
2750191 Wednesday, August 14, 2013 10:45:00 PM INCAPACITATING_INJURY TREE_BUSH_STUMP_STANDING SINGLE_VEH DARK_LIGHTED CLEAR 1 1 1 ‐ NORTH MAKING_RIGHT_TURN
Crash Summary: All Years
Crash Type Total %
Fatal 0 0.0%
Incapacitating 5 15.2%
Injury 6 18.2%
Possible Injury 5 15.2%
PDO 17 51.5%
Multi‐Vehicle 28 84.8%
Single‐Vehicle 5 15.2%
Total 33 100.0%
At‐Fault Unit Driver Behavior
Action Total % of Total Fatal % of Fatal
No Improper Action 0 0.0% 0 0.0%
Impaired Driving 4 12.1% 0 0.0%
Speeding 6 18.2% 0 0.0%
Failed to Yield ROW 6 18.2% 0 0.0%
Inattention/Distraction 9 27.3% 0 0.0%
Disregard Traffic Signal 1 3.0% 0 0.0%
Unsafe Passing/Lane Change 2 6.1% 0 0.0%
Failed to Keep in Lane 3 9.1% 0 0.0%
Pedestrian Fault 0 0.0% 0 0.0%
No Restraint 2 6.1% 0 0.0%
Other 6 18.2% 0 0.0%
Crashes by Lighting Condition (All severities)
Condition Total % of Total
Daylight 26 78.8%
Dawn 0 0.0%
Dusk 1 3.0%
Dark ‐ Lighted 6 18.2%
Dark ‐ Not Lighted 0 0.0%
Dark ‐ Unknown Lighting 0 0.0%
Total 33 100.0%
Page B19 of B26
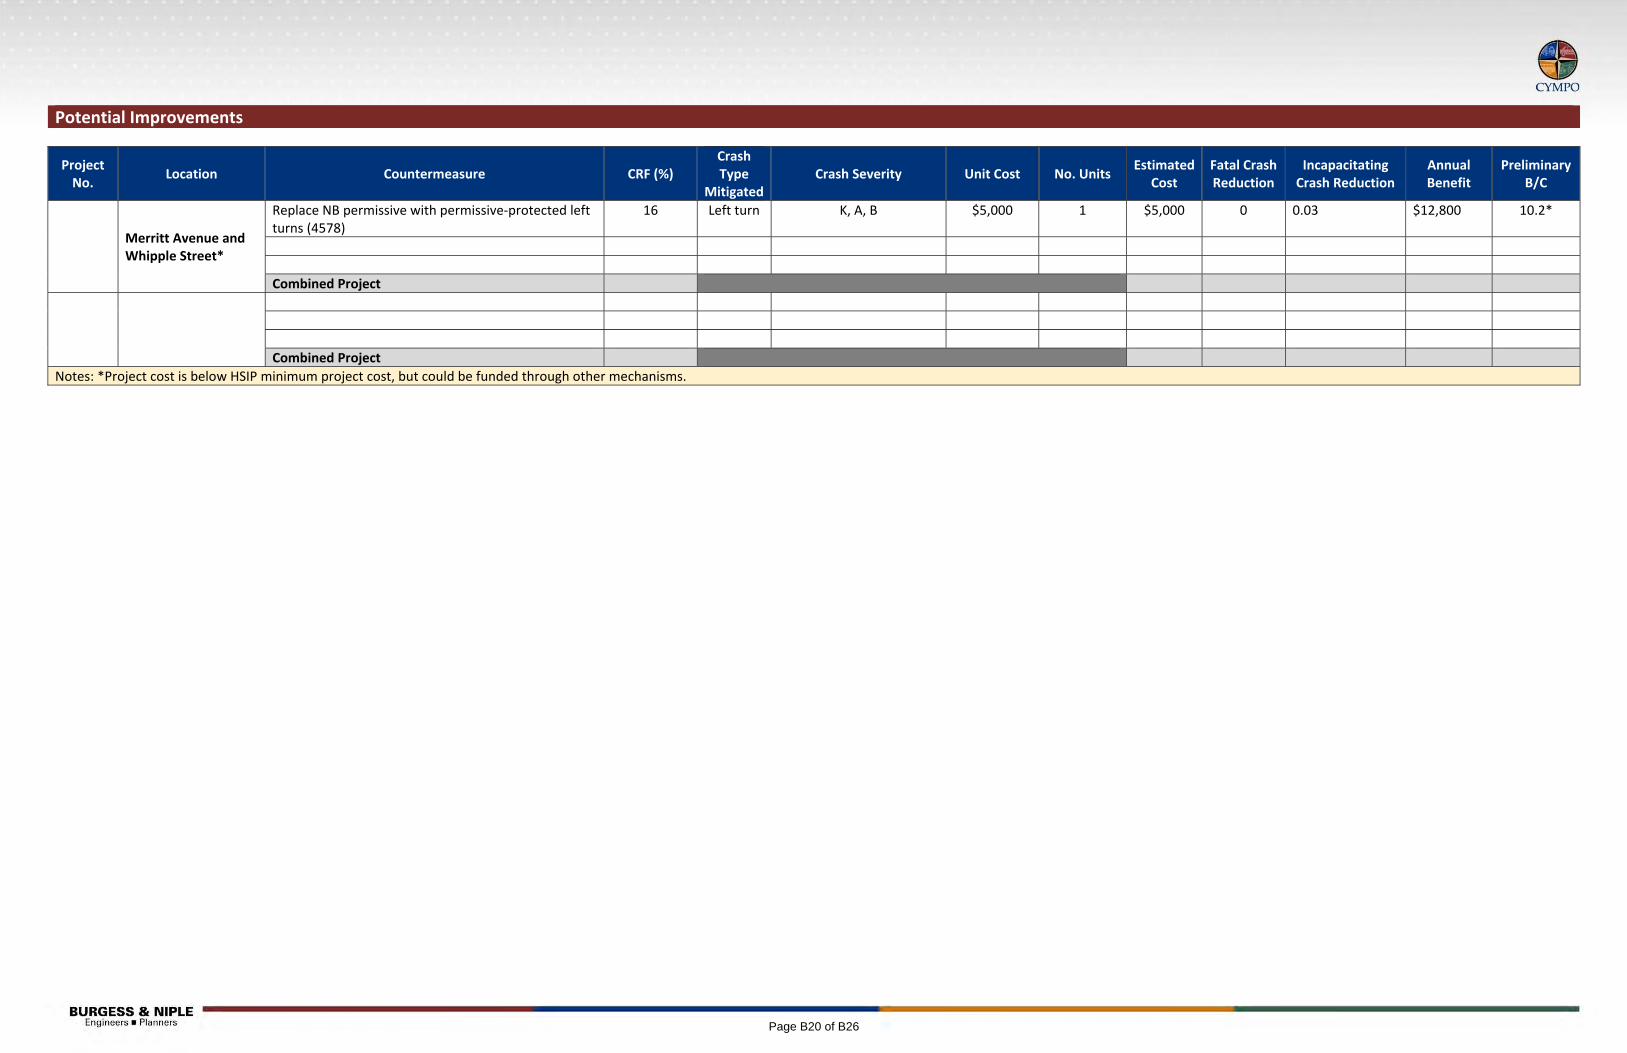
Potential Improvements
Project No.
Location Countermeasure CRF (%) Crash Type
MitigatedCrash Severity Unit Cost No. Units
Estimated Cost
Fatal Crash Reduction
Incapacitating Crash Reduction
Annual Benefit
Preliminary B/C
Merritt Avenue and Whipple Street*
Replace NB permissive with permissive‐protected left turns (4578)
16 Left turn K, A, B $5,000 1 $5,000 0 0.03 $12,800 10.2*
Combined Project
Combined Project
Notes: *Project cost is below HSIP minimum project cost, but could be funded through other mechanisms.
Page B20 of B26
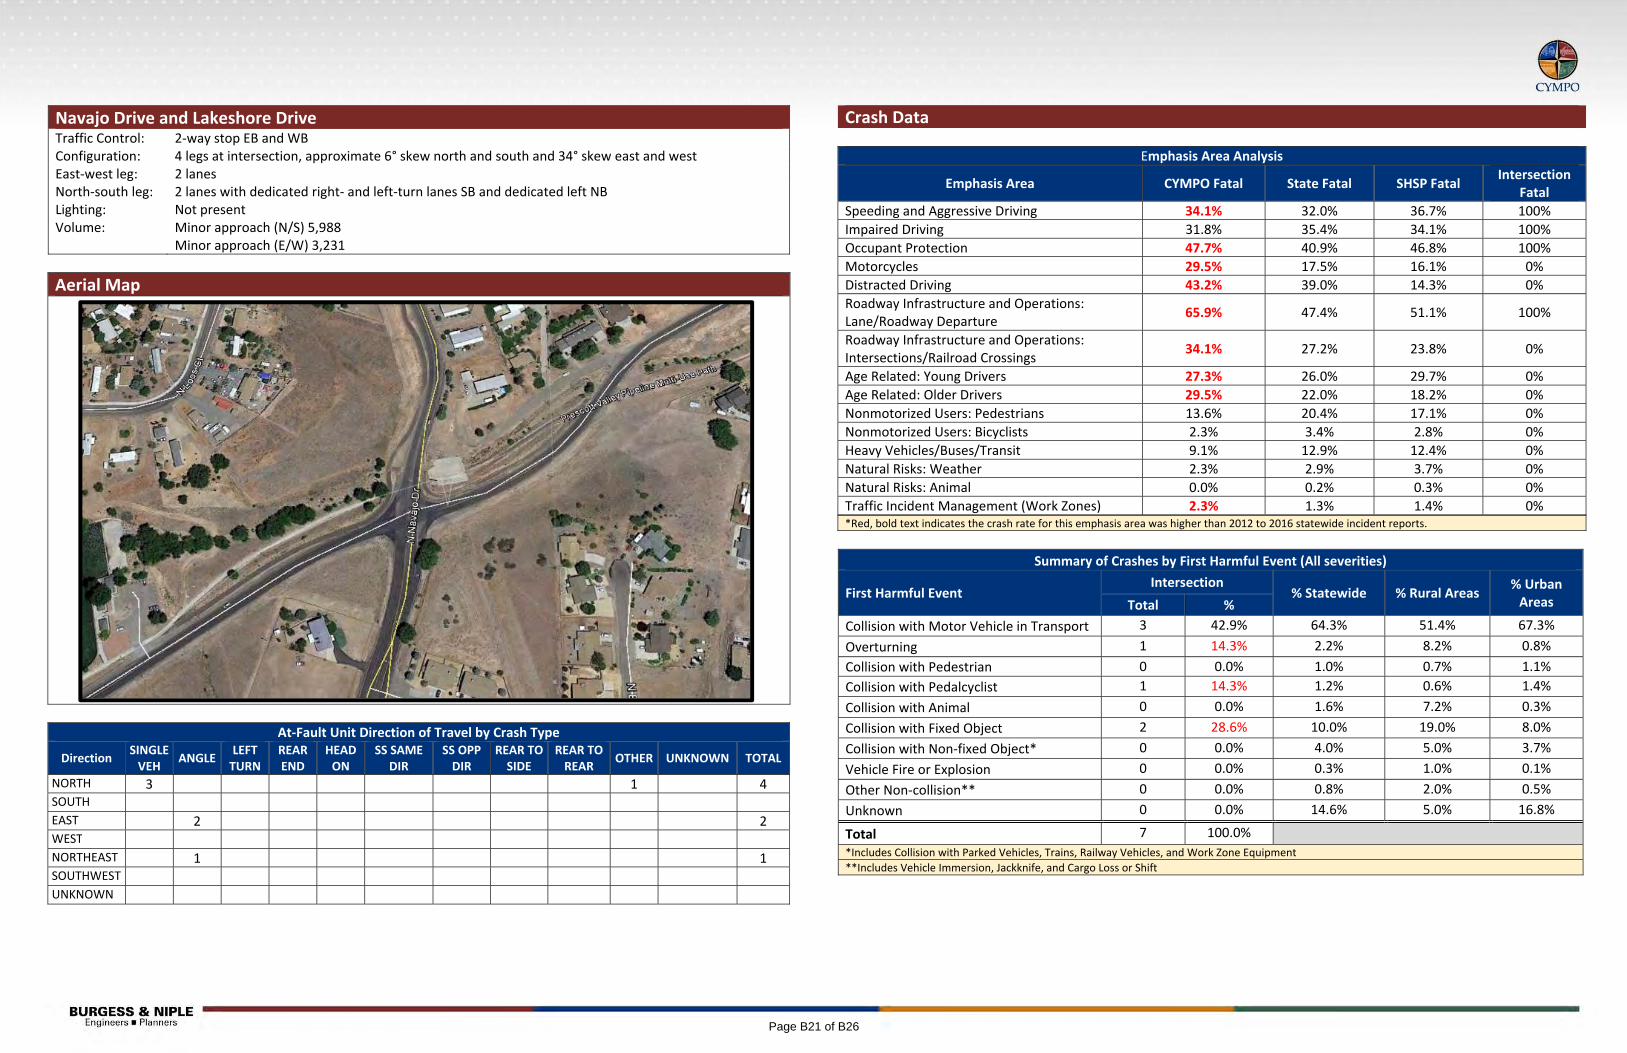
Navajo Drive and Lakeshore Drive Traffic Control: 2‐way stop EB and WB Configuration: 4 legs at intersection, approximate 6° skew north and south and 34° skew east and west East‐west leg: 2 lanes North‐south leg: 2 lanes with dedicated right‐ and left‐turn lanes SB and dedicated left NB Lighting: Not present Volume: Minor approach (N/S) 5,988
Minor approach (E/W) 3,231
Aerial Map
At‐Fault Unit Direction of Travel by Crash Type
Direction SINGLE VEH
ANGLE LEFT TURN
REAR END
HEAD ON
SS SAME DIR
SS OPP DIR
REAR TO SIDE
REAR TO REAR
OTHER UNKNOWN TOTAL
NORTH 3 1 4 SOUTH EAST 2 2 WEST NORTHEAST 1 1 SOUTHWEST UNKNOWN
Crash Data
Emphasis Area Analysis
Emphasis Area CYMPO Fatal State Fatal SHSP Fatal Intersection
Fatal
Speeding and Aggressive Driving 34.1% 32.0% 36.7% 100%
Impaired Driving 31.8% 35.4% 34.1% 100%
Occupant Protection 47.7% 40.9% 46.8% 100%
Motorcycles 29.5% 17.5% 16.1% 0%
Distracted Driving 43.2% 39.0% 14.3% 0%
Roadway Infrastructure and Operations: Lane/Roadway Departure
65.9% 47.4% 51.1% 100%
Roadway Infrastructure and Operations: Intersections/Railroad Crossings
34.1% 27.2% 23.8% 0%
Age Related: Young Drivers 27.3% 26.0% 29.7% 0%
Age Related: Older Drivers 29.5% 22.0% 18.2% 0%
Nonmotorized Users: Pedestrians 13.6% 20.4% 17.1% 0%
Nonmotorized Users: Bicyclists 2.3% 3.4% 2.8% 0%
Heavy Vehicles/Buses/Transit 9.1% 12.9% 12.4% 0%
Natural Risks: Weather 2.3% 2.9% 3.7% 0%
Natural Risks: Animal 0.0% 0.2% 0.3% 0%
Traffic Incident Management (Work Zones) 2.3% 1.3% 1.4% 0% *Red, bold text indicates the crash rate for this emphasis area was higher than 2012 to 2016 statewide incident reports.
Summary of Crashes by First Harmful Event (All severities)
First Harmful Event Intersection
% Statewide % Rural Areas % Urban Areas Total %
Collision with Motor Vehicle in Transport 3 42.9% 64.3% 51.4% 67.3%
Overturning 1 14.3% 2.2% 8.2% 0.8%
Collision with Pedestrian 0 0.0% 1.0% 0.7% 1.1%
Collision with Pedalcyclist 1 14.3% 1.2% 0.6% 1.4%
Collision with Animal 0 0.0% 1.6% 7.2% 0.3%
Collision with Fixed Object 2 28.6% 10.0% 19.0% 8.0%
Collision with Non‐fixed Object* 0 0.0% 4.0% 5.0% 3.7%
Vehicle Fire or Explosion 0 0.0% 0.3% 1.0% 0.1%
Other Non‐collision** 0 0.0% 0.8% 2.0% 0.5%
Unknown 0 0.0% 14.6% 5.0% 16.8%
Total 7 100.0%
*Includes Collision with Parked Vehicles, Trains, Railway Vehicles, and Work Zone Equipment **Includes Vehicle Immersion, Jackknife, and Cargo Loss or Shift
Page B21 of B26
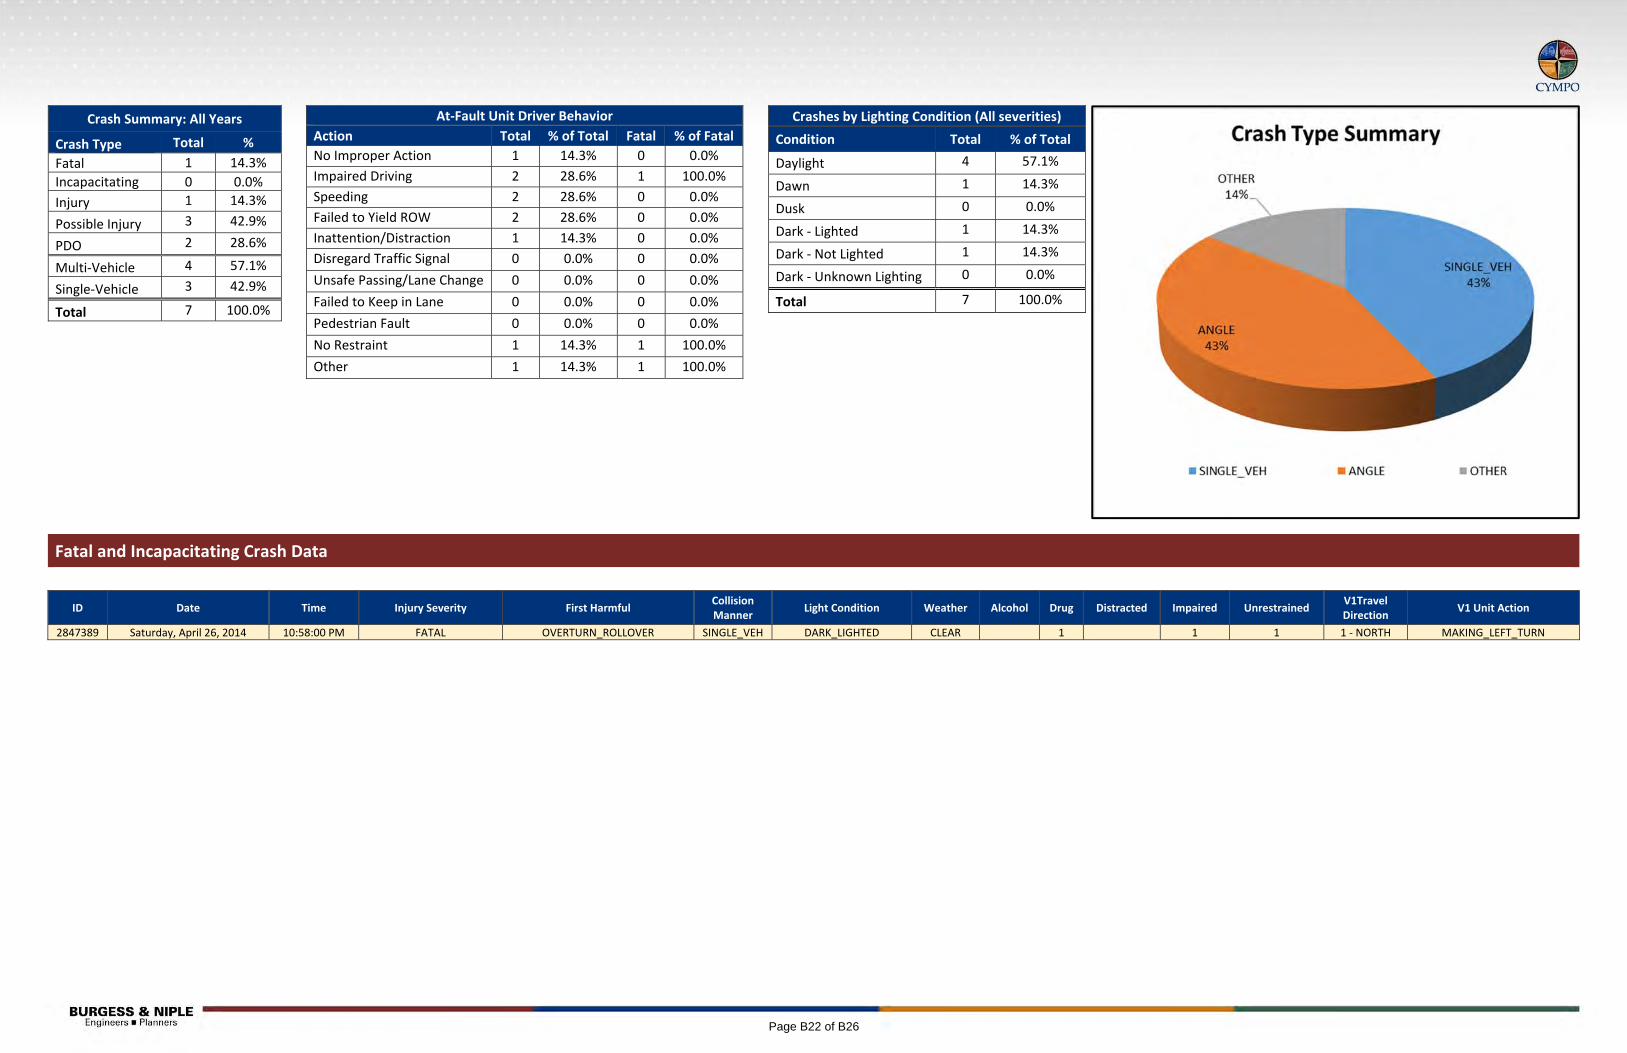
Fatal and Incapacitating Crash Data
ID Date Time Injury Severity First Harmful Collision Manner
Light Condition Weather Alcohol Drug Distracted Impaired Unrestrained V1Travel Direction
V1 Unit Action
2847389 Saturday, April 26, 2014 10:58:00 PM FATAL OVERTURN_ROLLOVER SINGLE_VEH DARK_LIGHTED CLEAR 1 1 1 1 ‐ NORTH MAKING_LEFT_TURN
Crash Summary: All Years
Crash Type Total %
Fatal 1 14.3%
Incapacitating 0 0.0%
Injury 1 14.3%
Possible Injury 3 42.9%
PDO 2 28.6%
Multi‐Vehicle 4 57.1%
Single‐Vehicle 3 42.9%
Total 7 100.0%
At‐Fault Unit Driver Behavior
Action Total % of Total Fatal % of Fatal
No Improper Action 1 14.3% 0 0.0%
Impaired Driving 2 28.6% 1 100.0%
Speeding 2 28.6% 0 0.0%
Failed to Yield ROW 2 28.6% 0 0.0%
Inattention/Distraction 1 14.3% 0 0.0%
Disregard Traffic Signal 0 0.0% 0 0.0%
Unsafe Passing/Lane Change 0 0.0% 0 0.0%
Failed to Keep in Lane 0 0.0% 0 0.0%
Pedestrian Fault 0 0.0% 0 0.0%
No Restraint 1 14.3% 1 100.0%
Other 1 14.3% 1 100.0%
Crashes by Lighting Condition (All severities)
Condition Total % of Total
Daylight 4 57.1%
Dawn 1 14.3%
Dusk 0 0.0%
Dark ‐ Lighted 1 14.3%
Dark ‐ Not Lighted 1 14.3%
Dark ‐ Unknown Lighting 0 0.0%
Total 7 100.0%
Page B22 of B26
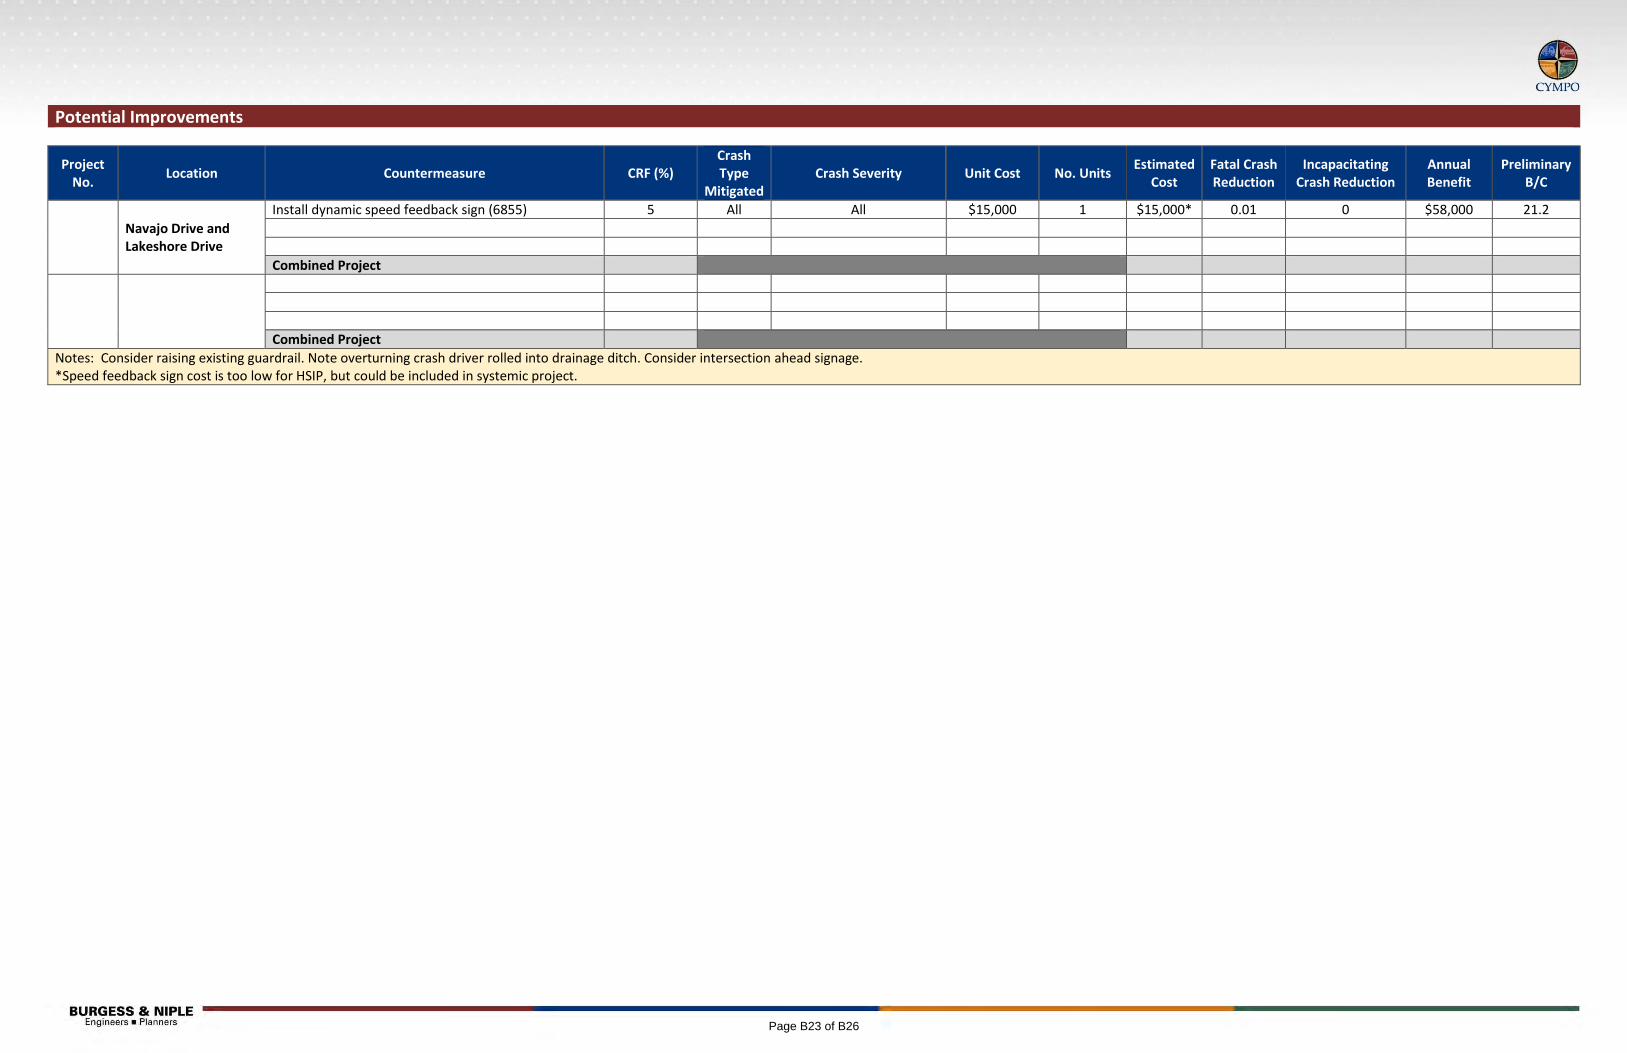
Potential Improvements
Project No.
Location Countermeasure CRF (%) Crash Type
Mitigated Crash Severity Unit Cost No. Units
Estimated Cost
Fatal Crash Reduction
Incapacitating Crash Reduction
Annual Benefit
Preliminary B/C
Navajo Drive and Lakeshore Drive
Install dynamic speed feedback sign (6855) 5 All All $15,000 1 $15,000* 0.01 0 $58,000 21.2
Combined Project
Combined Project
Notes: Consider raising existing guardrail. Note overturning crash driver rolled into drainage ditch. Consider intersection ahead signage. *Speed feedback sign cost is too low for HSIP, but could be included in systemic project.
Page B23 of B26
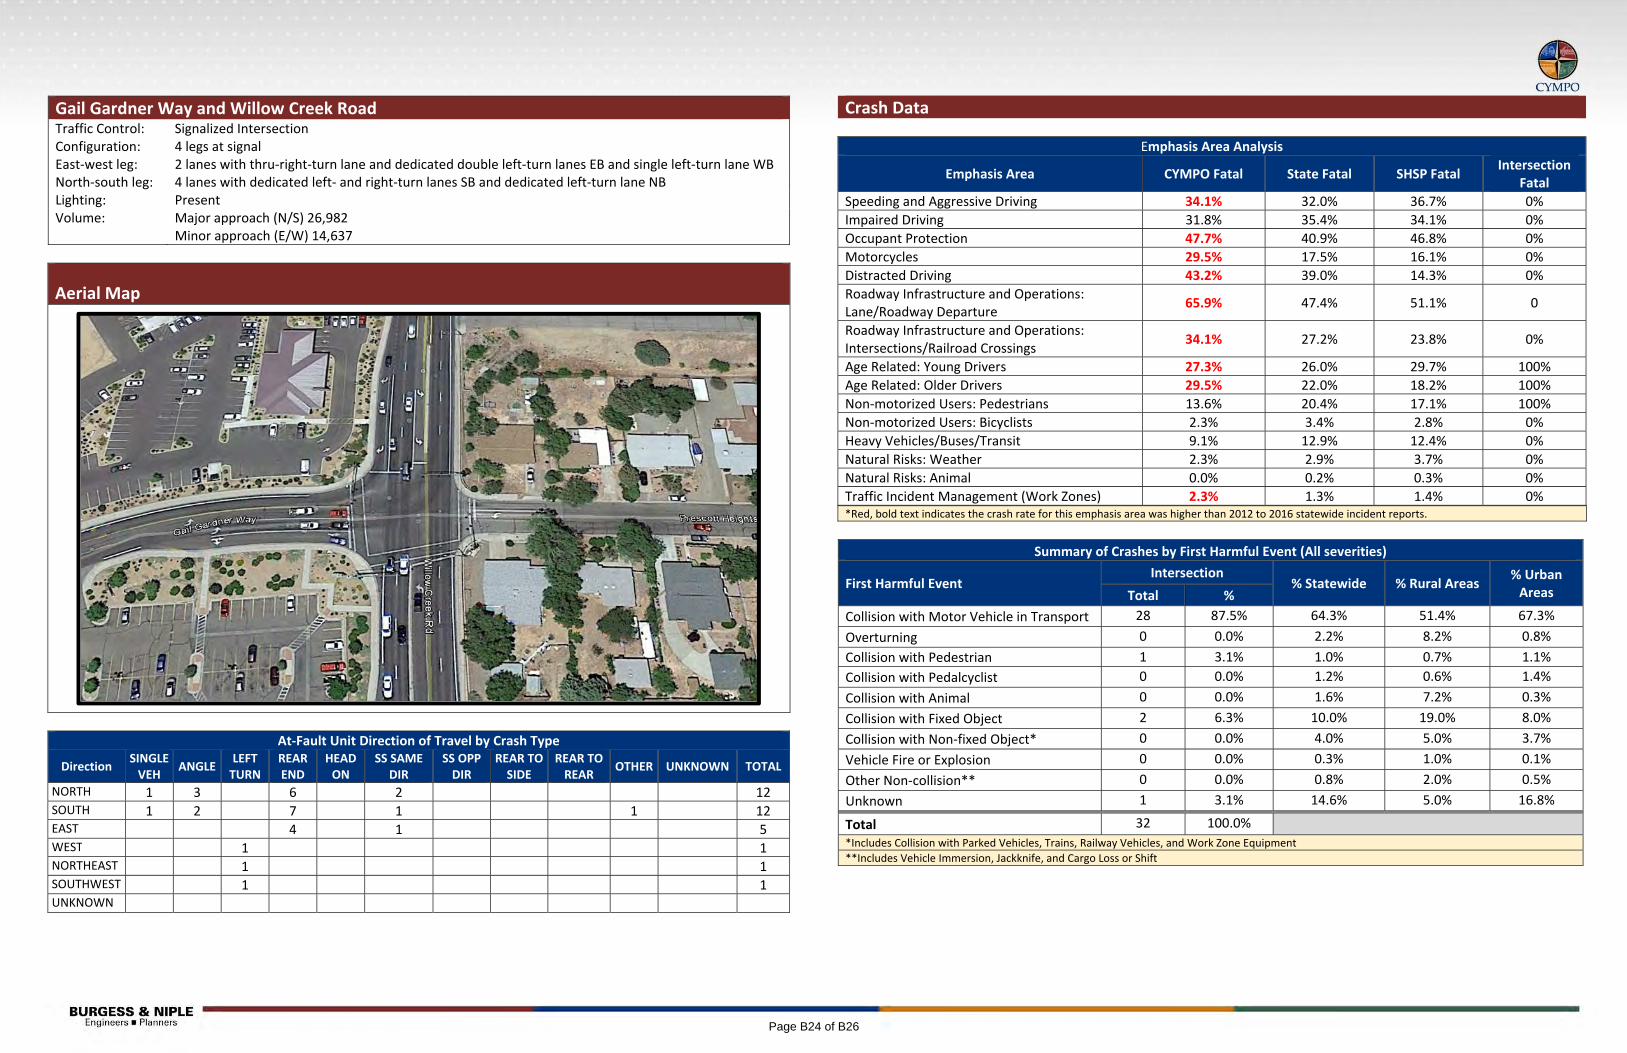
Gail Gardner Way and Willow Creek Road Traffic Control: Signalized Intersection Configuration: 4 legs at signal East‐west leg: 2 lanes with thru‐right‐turn lane and dedicated double left‐turn lanes EB and single left‐turn lane WB North‐south leg: 4 lanes with dedicated left‐ and right‐turn lanes SB and dedicated left‐turn lane NB Lighting: Present Volume: Major approach (N/S) 26,982
Minor approach (E/W) 14,637
Aerial Map
At‐Fault Unit Direction of Travel by Crash Type
Direction SINGLE VEH
ANGLE LEFT TURN
REAR END
HEAD ON
SS SAME DIR
SS OPP DIR
REAR TO SIDE
REAR TO REAR
OTHER UNKNOWN TOTAL
NORTH 1 3 6 2 12 SOUTH 1 2 7 1 1 12 EAST 4 1 5 WEST 1 1 NORTHEAST 1 1 SOUTHWEST 1 1 UNKNOWN
Crash Data
Emphasis Area Analysis
Emphasis Area CYMPO Fatal State Fatal SHSP Fatal Intersection
Fatal
Speeding and Aggressive Driving 34.1% 32.0% 36.7% 0%
Impaired Driving 31.8% 35.4% 34.1% 0%
Occupant Protection 47.7% 40.9% 46.8% 0%
Motorcycles 29.5% 17.5% 16.1% 0%
Distracted Driving 43.2% 39.0% 14.3% 0%
Roadway Infrastructure and Operations: Lane/Roadway Departure
65.9% 47.4% 51.1% 0
Roadway Infrastructure and Operations: Intersections/Railroad Crossings
34.1% 27.2% 23.8% 0%
Age Related: Young Drivers 27.3% 26.0% 29.7% 100%
Age Related: Older Drivers 29.5% 22.0% 18.2% 100%
Non‐motorized Users: Pedestrians 13.6% 20.4% 17.1% 100%
Non‐motorized Users: Bicyclists 2.3% 3.4% 2.8% 0%
Heavy Vehicles/Buses/Transit 9.1% 12.9% 12.4% 0%
Natural Risks: Weather 2.3% 2.9% 3.7% 0%
Natural Risks: Animal 0.0% 0.2% 0.3% 0%
Traffic Incident Management (Work Zones) 2.3% 1.3% 1.4% 0% *Red, bold text indicates the crash rate for this emphasis area was higher than 2012 to 2016 statewide incident reports.
Summary of Crashes by First Harmful Event (All severities)
First Harmful Event Intersection
% Statewide % Rural Areas % Urban Areas Total %
Collision with Motor Vehicle in Transport 28 87.5% 64.3% 51.4% 67.3%
Overturning 0 0.0% 2.2% 8.2% 0.8%
Collision with Pedestrian 1 3.1% 1.0% 0.7% 1.1%
Collision with Pedalcyclist 0 0.0% 1.2% 0.6% 1.4%
Collision with Animal 0 0.0% 1.6% 7.2% 0.3%
Collision with Fixed Object 2 6.3% 10.0% 19.0% 8.0%
Collision with Non‐fixed Object* 0 0.0% 4.0% 5.0% 3.7%
Vehicle Fire or Explosion 0 0.0% 0.3% 1.0% 0.1%
Other Non‐collision** 0 0.0% 0.8% 2.0% 0.5%
Unknown 1 3.1% 14.6% 5.0% 16.8%
Total 32 100.0% *Includes Collision with Parked Vehicles, Trains, Railway Vehicles, and Work Zone Equipment **Includes Vehicle Immersion, Jackknife, and Cargo Loss or Shift
Page B24 of B26
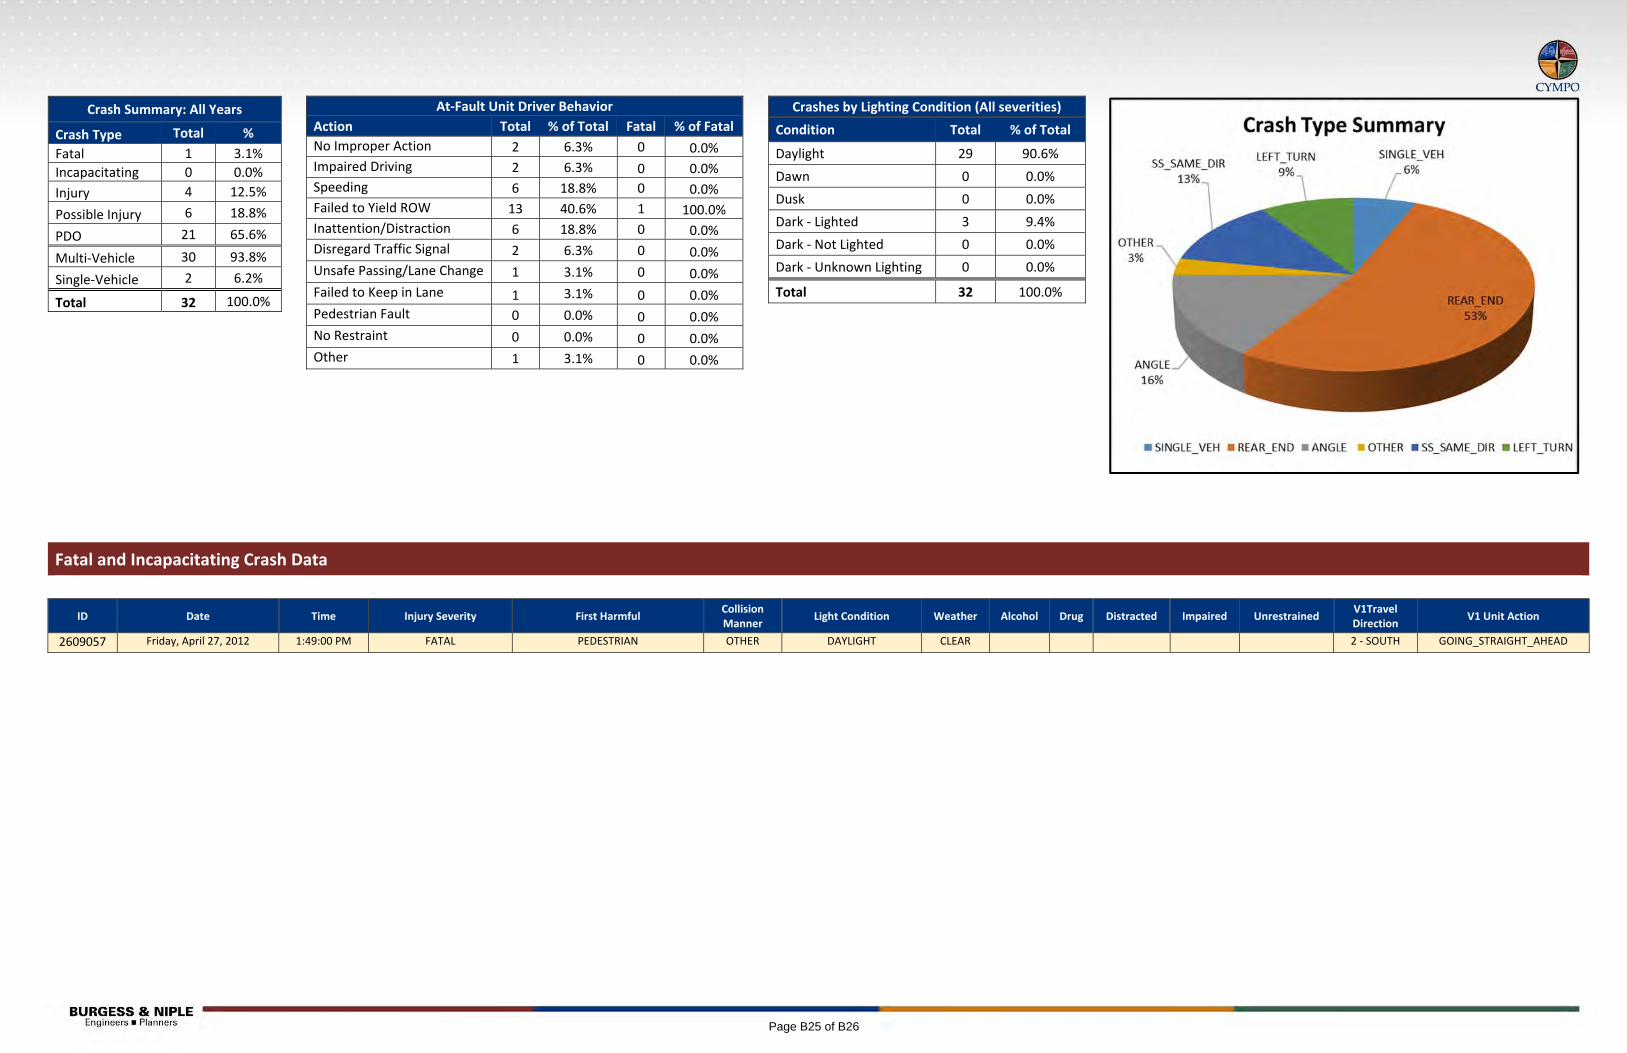
Fatal and Incapacitating Crash Data
ID Date Time Injury Severity First Harmful Collision Manner
Light Condition Weather Alcohol Drug Distracted Impaired Unrestrained V1Travel Direction
V1 Unit Action
2609057 Friday, April 27, 2012 1:49:00 PM FATAL PEDESTRIAN OTHER DAYLIGHT CLEAR 2 ‐ SOUTH GOING_STRAIGHT_AHEAD
Crash Summary: All Years
Crash Type Total %
Fatal 1 3.1%
Incapacitating 0 0.0%
Injury 4 12.5%
Possible Injury 6 18.8%
PDO 21 65.6%
Multi‐Vehicle 30 93.8%
Single‐Vehicle 2 6.2%
Total 32 100.0%
At‐Fault Unit Driver Behavior
Action Total % of Total Fatal % of Fatal
No Improper Action 2 6.3% 0 0.0%
Impaired Driving 2 6.3% 0 0.0%
Speeding 6 18.8% 0 0.0%
Failed to Yield ROW 13 40.6% 1 100.0%
Inattention/Distraction 6 18.8% 0 0.0%
Disregard Traffic Signal 2 6.3% 0 0.0%
Unsafe Passing/Lane Change 1 3.1% 0 0.0%
Failed to Keep in Lane 1 3.1% 0 0.0%
Pedestrian Fault 0 0.0% 0 0.0%
No Restraint 0 0.0% 0 0.0%
Other 1 3.1% 0 0.0%
Crashes by Lighting Condition (All severities)
Condition Total % of Total
Daylight 29 90.6%
Dawn 0 0.0%
Dusk 0 0.0%
Dark ‐ Lighted 3 9.4%
Dark ‐ Not Lighted 0 0.0%
Dark ‐ Unknown Lighting 0 0.0%
Total 32 100.0%
Page B25 of B26
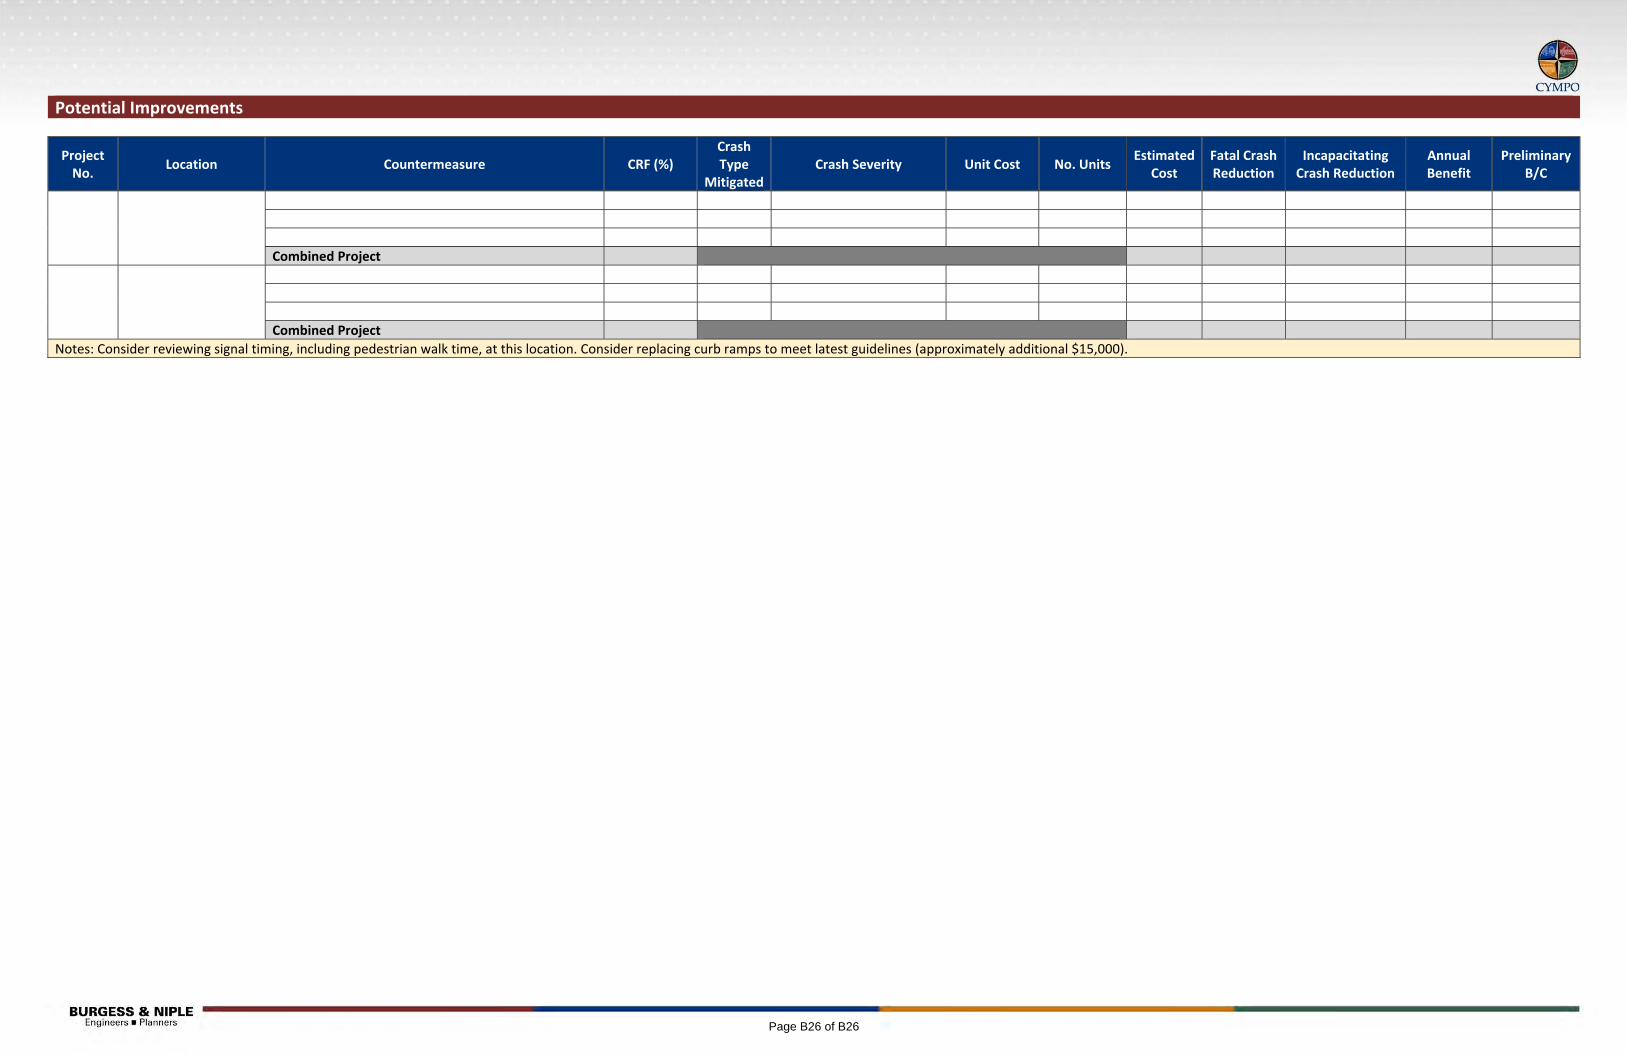
Potential Improvements
Project No.
Location Countermeasure CRF (%) Crash Type
MitigatedCrash Severity Unit Cost No. Units
Estimated Cost
Fatal Crash Reduction
Incapacitating Crash Reduction
Annual Benefit
Preliminary B/C
Combined Project
Combined Project
Notes: Consider reviewing signal timing, including pedestrian walk time, at this location. Consider replacing curb ramps to meet latest guidelines (approximately additional $15,000).
Page B26 of B26