Regional left ventricular wall thickness and systolic function during the first year after index...
10
ELSEVIER International Journal of Cardiology 53 (1996) 45-54 International Journal of cardiology Regional left ventricular wall thickness and systolic function during the first year after index anterior wall myocardial infarction: Serial effects of ventricular remodeling ’ Manu Sehgal, Ken Hirose, Judd E. Reed, John A. Rumberger* Department of CardiovascularDiseases and Internal Medicine, Mayo Clinic and Foundation,200 First St. SW, Rochester,MN 55905. USA Received 14 August 1995;revision received 17 October 1995;accepted 17 October 1995 There is controversy regarding changes in regional left ventricular systolic function and thickness during remodeling after infarction. To addressthis, electron beam computed tomography was done in 22 patients with an index anterior wall infarction at discharge, 6 weeks, 6 months and 1 year, and global ventricular chamber volumes and massquan- tified. A mid-ventricular short-axis scan from each study was divided into 4, 90” sectors (anterior, septal, lateral and posterior walls). Regional wall thickness, ejection fraction, and absolute and percent wall thickening were determined and comparedwith 10 normal adults. Global infarct sizewas estimated at 24.2% * 3.4%of the ventricle. In thesesub- jects, the ventricular chamber enlarged steadily during the year, while global ventricular mass initially decreased during the first 6 weeks, but then increased by 1 year. Regional ejection fraction changed little during the year, apart from the lateral wall, which was less than normal. Absolute wall thickening was reduced in the anterior (infarct) and septal walls throughout the year, but was normal and unchanged in the posterior and lateral walls. Regional percent wall thickening was not different from normal individuals. The anterior wall was thinned at discharge and tended to thin further during the year. The lateral wall was thinner than normal 6 weeks after infarction, but remained unchanged thereafter. The posterior wall tended to thin for the first 6 months, but the values at any time were not above normal. There was little change in septal wall thickness throughout the year. It is concluded that, after a moderate size, un- complicated index anterior infarction, regional systolic function remains generally unaffected by remodeling. However, regional walls tend to thin and/or remain at normal thickness. These data confirm differential regional patterns after anterior infarction for systolic function, muscle atrophy and/or minimal hypcrtrophy which accompany serial changes in global ventricular chamber volumes and mass. Keywords: Myocardial infarction; Remodeling; Hypertrophy; Systolic function l Corresponding author. Tel.: 507 284 8260, Fax: 507 284 5470. 1. Introd~on ’ Frcscnted in part at the Annual Conference for the American Heart Association, Dallas TX, 19941Sehgal M, Hirose K, Reed JE, Rumberger JA: Serial changesin regional leh ventricular wall thicknessduring the first year after anterior wall infarction. Circulation 1994$0%377. Previous studies have focusedon global left ven- tricular dynamics and structural changes which occur either early or late after infarction [l-3], but serial changesin regional dynamics, despite their 0167-5273@6/$15.00 0 1996Elsevier ScienceIreland Ltd. All rights reserved SSDI 0167-5273(95)02507-S’
-
Upload
independent -
Category
Documents
-
view
3 -
download
0
Transcript of Regional left ventricular wall thickness and systolic function during the first year after index...
ELSEVIER International Journal of Cardiology 53 (1996) 45-54
International Journal of
cardiology
Regional left ventricular wall thickness and systolic function during the first year after index anterior wall myocardial
infarction: Serial effects of ventricular remodeling ’
Manu Sehgal, Ken Hirose, Judd E. Reed, John A. Rumberger* Department of Cardiovascular Diseases and Internal Medicine, Mayo Clinic and Foundation, 200 First St. SW, Rochester, MN
55905. USA
Received 14 August 1995; revision received 17 October 1995; accepted 17 October 1995
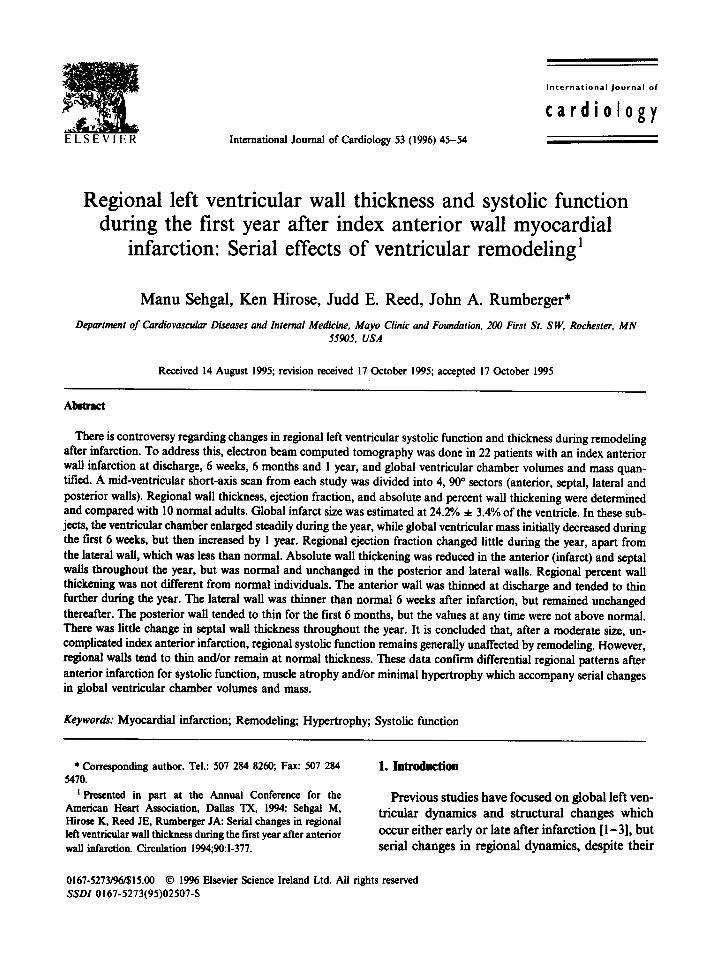
There is controversy regarding changes in regional left ventricular systolic function and thickness during remodeling after infarction. To address this, electron beam computed tomography was done in 22 patients with an index anterior wall infarction at discharge, 6 weeks, 6 months and 1 year, and global ventricular chamber volumes and mass quan- tified. A mid-ventricular short-axis scan from each study was divided into 4, 90” sectors (anterior, septal, lateral and posterior walls). Regional wall thickness, ejection fraction, and absolute and percent wall thickening were determined and compared with 10 normal adults. Global infarct size was estimated at 24.2% * 3.4% of the ventricle. In these sub- jects, the ventricular chamber enlarged steadily during the year, while global ventricular mass initially decreased during the first 6 weeks, but then increased by 1 year. Regional ejection fraction changed little during the year, apart from the lateral wall, which was less than normal. Absolute wall thickening was reduced in the anterior (infarct) and septal walls throughout the year, but was normal and unchanged in the posterior and lateral walls. Regional percent wall thickening was not different from normal individuals. The anterior wall was thinned at discharge and tended to thin further during the year. The lateral wall was thinner than normal 6 weeks after infarction, but remained unchanged thereafter. The posterior wall tended to thin for the first 6 months, but the values at any time were not above normal. There was little change in septal wall thickness throughout the year. It is concluded that, after a moderate size, un- complicated index anterior infarction, regional systolic function remains generally unaffected by remodeling. However, regional walls tend to thin and/or remain at normal thickness. These data confirm differential regional patterns after anterior infarction for systolic function, muscle atrophy and/or minimal hypcrtrophy which accompany serial changes in global ventricular chamber volumes and mass.
Keywords: Myocardial infarction; Remodeling; Hypertrophy; Systolic function
l Corresponding author. Tel.: 507 284 8260, Fax: 507 284 5470.
1. Introd~on
’ Frcscnted in part at the Annual Conference for the American Heart Association, Dallas TX, 19941 Sehgal M, Hirose K, Reed JE, Rumberger JA: Serial changes in regional leh ventricular wall thickness during the first year after anterior wall infarction. Circulation 1994$0%377.
Previous studies have focused on global left ven- tricular dynamics and structural changes which occur either early or late after infarction [l-3], but serial changes in regional dynamics, despite their
0167-5273@6/$15.00 0 1996 Elsevier Science Ireland Ltd. All rights reserved SSDI 0167-5273(95)02507-S’
46 hf. Sehgai et al. /International Joumal of Cardiology 53 (19%) 45-54
significance in the understanding of long term responses of the ventricle to necrosis, have not been well characterized in previous animal or pa- tient studies [4-lo]. Furthermore, although regional changes may occur in myocardial wall thickness during remodeling, these cannot be defined independent of systolic function within the same region, since it may, in turn, have a profound effect on their magnitude [lo]. The purpose of the current investigation was two-fold: firstly, to study regional changes in muscle thicknesses to define left ventricular remodeling over the course of a year in patients after infarction, and to contrast these results with global changes in ventricular mass and chamber volumes; secondly, to serially define the dynamics of systolic function in the in- farcted and non-infarcted regions. To research these issues, serial electron beam computed tomographic scans done during the first year after an uncomplicated index anterior wall myocardial infarction in 22 patients were evaluated and com- pared to scans from 10 normal adult subjects.
2. Methods
2.1. Subjects Adult patients hospitalized in the coronary care
unit were identified within 1 to 3 days of an acute anterior wall myocardial infarction as possible candidates for study. Entry criteria were: normal sinus rhythm, electrocardiographic (ECG) evi- dence of acute transmural anterior infarction (ST segment elevation > 2 mm above baseline in at least two contiguous anterior precordial leads, and/or development of new Q waves in the ante- rior precordial leads), recent history of angina lasting >30 min, and serial changes in creatine kinase and creatine kinase-MB isoenzymes consis- tent with acute myocardial infarction. Exclusion criteria were: documented or historical evidence of any previous Q-wave or non- Q-wave infarction, historical physical examination or Doppler echocardiographic findings consistent with left- sided valvular stenosis or regurgitation beyond mild, uncontrolled hypertension, cardiogenic shock, or need for inotropic support at anytime. Since all patients were to undergo contrast enhanced computed tomographic scans, they were
to have no allergy to contrast medium and a nor- mal serum creatinine. Before entry, each patient signed an Institutional Review Committee approv- ed consent form.
Twenty-two consecutive patients with an un- complicated, index anterior wall infarction (mean age 61 f 10 years) were entered into the study (2 women, 20 men). Interventions at the time of pre- sentation with acute myocardial infarction includ- ed urgent coronary angioplasty (n = ll), intravenous thrombolytic therapy (n = 9) and con- ventional therapy without initial attempts to estab- lish reperfusion (n = 2). As directed by their cardiologists, all had coronary angiography emergently or electively within 1 week of infarc- tion, and all had a patent infarct-related artery documented at termination of the angiographic procedure.
Electron beam computed tomographic scans from 10 normal adult males (ages 20 to 35 years) were identified for comparison with the infarct pa- tients. None had historical, electrocardiographic, or physical examination findings of cardiac or valvular heart disease.
2.2. Scanner and imaging protocols Electron beam computed tomography has been
documented to provide noninvasive, high tempo- ral, spatial, and density resolution left ventricular images at multiple, parallel tomographic planes using validated methods of cardiac border detini- tion [ 11-151. The design and operation of the scanner and the general methods for imaging of subjects is described elsewhere [16]. Each subject fasted and discontinued medications at least 4 h before scanning. Prospective electrocardiographic triggering at the R-wave (end-diastole) allowed for acquisition of consecutive polytomographic im- ages at a rate of 17 frames/s. An l&gauge, 5.08 cm catheter was placed in a right antecubital vein. After a non-contrast localization scan was per- formed to determine the level of the ventricular apex, each subject was positioned so as to acquire parallel tomographic images in the short axis from the apex to the right ventricular outtlow tract. The subject was then mechanically adjusted within the scanner gantry to make certain that the most caudad tomographic images were obtained at the

hf. Sehgal et al. /International Journal of Cardiology 53 (19%) 45-54 41
level of the cardiac apex. This assured that all in- dividuals were imaged in a uniform fashion. Once positioned, an estimation of circulation time was determined during normal respiration after admin- istration of a bolus injection of 10 ml of a dilute solution of magnesium sulfate (0.2%) through the intravenous site. Noting the time between injection and the associated warm sensation under the tongue by the subject expedited accurate timing of the contrast injection and scanning sequences. During imaging, a powered injector delivered an infusion of non-ionic contrast medium (Iohexol- 350, Sterling Winthrop or Iopamidol-370, E.R. Squibb & Sons) through the intravenous catheter at 3 ml/s for 20 s. Commencing image acquisition at the ‘circulation time’ assured excellent and simultaneous opacification of both ventricular cavities at all levels scanned. Imaging of the nor- mal subjects was done at either 6 or 8 contiguous, parallel tomographic levels with either 13 or 10 consecutive 50 ms frames through each cardiac cycle [17,18]. Imaging of infarct patients was first done at 6 levels and 13 frames per level. After a 2 to 5 min interval in all infarct patients and most normal subjects, the scanning table was moved (with the subject lying still) 6.0 cm (or 8.0 cm, if appropriate) and the scanning sequence and con- trast injection repeated. For the subjects entered into this protocol, the vast majority could be imag- ed using the procedures as noted; however, several infarct patients, because of significant left ventric- ular dilation, required a third scanning run inter- rogating 18 consecutive tomographic levels of the heart. The total contrast load/subject for each complete examination was approximately 1.2 ml/kg. All data were stored on optical disk for viewing and analysis directly on a SUN microcom- puter workstation [19]. This software allows for definition of the ventricular surfaces in all images during the cardiac cycle using an epicardial floating-point centroid method. Once the raw image data were analyzed, numerical results were recorded directly into a relational database. Nor- mal subjects were scanned once. Infarct patients were scanned 4 times: hospital discharge (index scan, 8 f 1 days after infarction), 6 weeks (61 f 3 days after infarction), 6 months (213 * 8 days after infarction), and 1 year (398 f 7 days after infarction).
2.3. Calculation of left ventricular chamber volumes and mass
For the infarct patients, ventricular volumes and mass were quantified using established methods [20-231. Data were analyzed at each ventricular tomographic level in an identical fashion for all patients at each of the 4 serial scans. Firstly, the end-diastolic (image temporally related to the R- wave on the ECG) and the end-systolic (smallest chamber volume during the cardiac cycle) images were identified at each tomographic level. Second- ly, the areas inscribing the endocardial and epicar- dial surfaces of the ventricle were determined. Tomographic ventricular chamber area was the area inscribed by the endocardial surface, and the left ventricular muscle was the area inscribed be- tween the endocardial and epicardial surfaces. For each ventricle, images were analyzed from the apical through basal tomographic sections, in- cluding the outflow tract. This constituted from 8 to 10 separate tomographic slices per study, depending on the overall ventricular long axis di- mensions. Tomographic chamber volumes were the product of tomographic (end-diastolic and end-systolic) areas and slice thickness (1 cm center- to-center). Tomographic left ventricular mass was the product of the muscle (myocardial) area, slice thickness, and the specific gravity of myocardium. Although the specific gravity of functional myo- cardium and infarcted myocardium are not iden- tical, a single value was chosen for convenience to represent all myocardial surfaces (1.05 gm/ml). Global left ventricular chamber volumes were determined by summing the tomographic chamber (end-diastolic and end-systolic) volumes and tomographic muscle (end-diastolic) masses over all slices (modified Simpson’s rule) from apex to base.
2.4. Estimation of myocardial infarct size An index of the extent of myocardial damage
was developed from quantitative analysis of regional chamber motion on the scan performed at hospital discharge. This method has been used in a previous publication from our laboratory [20]. Although, it is appreciated that exact quantifica- tion of left ventricular myocardial infarct size in man using tomographic imaging techniques can be problematic, especially when using information re- lated to analysis of regional wall motion abnor-

48 M. Sehgal et al. /International Joumal of Cardiology 53 (19%) 45-54
malities [21], it was reasoned that a consistent application to defining an index of infarct size at hospital discharge would be acceptable for longi- tudinal comparison studies performed in the same group of individuals. Analysis of the electron beam computed tomography data in normal pa- tients [17], using the epicardial centroid method, has previously demonstrated an average regional ejection fraction of the human left ventricle to be approximately 65% f 6%. Furthermore, no regional ejection fraction at any level was < 30%. For the purposes of the current investigation, identification of both the endocardial and epicar- dial surfaces was done on the end-diastolic and end-systolic images; thereafter, each set of tomographic images were divided by computer into 64, 5.625’ pie-wedged segments, and regional ejection fraction determined using a floating point epicardial centroid as the reference. Any regional ejection fraction c 30%, which represented a value greater than two standard deviations from the nor- mal mean value, was considered to be within a region of infarction. Thus, the areas with abnor- mal regional ejection fraction represented areas of severe hypo- or akinesis. The total number of segments with severe hypokinesis/akinesis out of the 64 regional segments examined was determined in each left ventricular tomographic level. The sum of regional tomographic segments on the scan done at hospital discharge with severe hypo- or akinesis were expressed as a percent of the total number of segments examined per heart and designated as the index of initial infarct size.
2.5. Mid-ventricular analysis Scans from each infarct patient were fastidiously
reviewed for identification of representative mid- ventricular (equatorial) images, which were anatomically comparable across all 4 serial stud- ies. Features such as position of papillary muscles, gross characteristics of right ventricular geometry, and relative apex to base positioning were careful- ly compared to allow for identification of anatomic sites with distinct similarities across and among serial studies. The level chosen correspond- ed anatomically to the mid-papillary muscle level in all instances. Identical anatomic criteria were used to identify appropriate mid-ventricular level
scans from each of the normal subjects for com- parison to data from the infarct patients.
Regional anatomic and functional data from the infarct patients were generated by dividing each mid-ventricular short axis scan into 64 wedge- shaped segments (5.625” of circumferential arc) originating from a common epicardial based cen- troid. Using these fine segments, the data were grouped to construct 4 equal left ventricular sec- tors, each 90” in circumferential angle; these con- sisted of the infarct region (anterior wall), two adjacent per&infarct regions (septal and lateral walls), and a remote non-infarcted region (posterior wall) (Fig. 1). Scans from end-diastole and end-systole were analyzed in pairs. These areas were assessed for sector ejection fraction, ab- solute systolic wall thickening, percent wall thickening, and absolute enddiastolic wall thickness. For the normal subjects, a circumferen- tial determination was made in each individual at the mid-ventricle for ejection fraction, systolic wall thickening, percent wall thickening, and absolute end-diastolic wall thickness.
2.6. Statistics Data were expressed as mean f SEM. Serial
left ventricular global and regional data in the in- farct patients were compared using repeated mea- sures analysis of variance (ANOVA) with a Student-Neumann-Keuls t-test for comparisons between examinations. ANOVA was performed to
ANTERIOR WALL (INFARCTION) 9 /
LATERAL
WALL
INFERIOR WALL (REMOTE) l Epicardial Centroid
Fig. 1. Schematic illustration of divisions of the mid-ventricular chamhcr and myocardium into equal 90” sectors (anterior or in- farct well, lateral wall, posterior wall and lateral well). RV, right ventricle; LV, l& ventricle.
M. Sehgal et al. /International Jomtal of Cardiology 5.1 (19%) 45-54 49
determine differences between individual ventricu- lar regions at each scan date. Comparisons be- tween data from infarct patients at each scan date and normal subjects were made using a non-paired f-test. A value of P < 0.05 for a two-tailed test was considered to achieve statistical significance.
3. Results
3.1. Demographics, index of infarct size, and hemo- dynamics
No infarct patient had heart failure at presenta- tion to the hospital, at discharge, or during follow- up. A majority of patients were taking beta- blockers and long acting nitrates at the initial and subsequent scan dates (n = 16 and 14, respective- ly). Calcium channel blockers, prescribed prior to hospitalization, were taken by approximately half the patients (n = 10). Captopril was taken during the study period in a minority of patients (n = 2). One patient had recurrent angina and underwent a successful second angioplasty of the infarct- related artery at 6 months after infarction; there was no recurrence of angina at 1 year. No patient underwent bypass grafting and no patient had a recurrent infarction during follow-up. All were ambulatory and in normal sinus rhythm.
Infarct sire estimated in the 22 patients from analysis of the electron beam computed tomographic studies done at hospital discharge averaged 24.2% * 3.9% of the left ventricle. Me- dian infarct sire was 19.7%, with a range from 0% to 69%. Thus, going by the mean, infarct size was moderate.
Mean heart rate (beats/minute) for the infarct patients was 70 * 2, 65 f 2t, 63 * 3t, and 62 l 37 at discharge, 6 weeks, 6 months and 1 year, respectively (tP < 0.05 vs. index scan at hos- pital discharge). Mean heart rate in the normal in- dividuals was 76 * 10 (P = NS compared to serial exams in infarct patients). Mean arterial pressure (mmHg estimated by cuff) in the infarct patients was 81 f 2, 84 f 3, 88 & 3, and 93 * 3t$ for the 4 serial scan dates, respectively (SP < 0.05 vs. 6 weeks). Mean arterial pressure for the normal subjects was 92 * 5t. Heart rate was thus significantly lower and arterial pressure significantly higher after 1 year compared to base-
line at hospital discharge in the infarct patients, but was only different from normal during this time period in one instance (arterial pressure at hospital discharge).
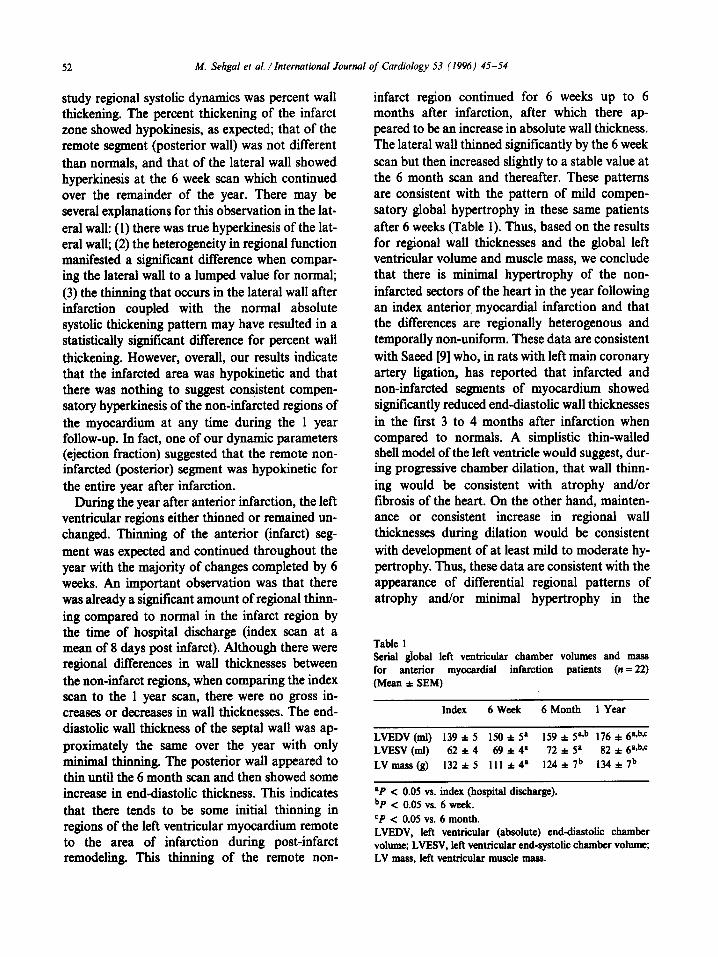
3.2. Global left ventricular volume and mass in infarct patients
Table 1 shows global ventricular chamber volumes and mass over the course of the year in the 22 patients after anterior infarction. Left ven- tricular end-diastolic volume steadily increased, with each value significantly greater than the preceeding value. Left ventricular end-systolic volume also increased over the year but the differ- ences between the 6 week and 6 month scans were not sign&ant. During the first 6 weeks, there was a significant decrease in global ventricular mass. Subsequently, there was an increase in ventricular mass at 6 months and 1 year.
3.3. Mid-ventricular systolic function and wall thickness in normal subjects
In the 10 normal individuals, the mean (cir- cumferential) ejection fraction, absolute wall thickening, percent wall thickening and end- diastolic wall thickness were 0.62 f 0.02 (% x
10-2), 6.7 i 0.4 mm, 0.69 f 0.05 (% x 10-2), and 10.4 f 0.3 mm, respectively.
3.4. Regional ejection fraction in infarct patients Data comparing regional ejection fraction at the
mid-ventricle in the infarct patients throughout the year compared to normals are given on Fig. 2. The ejection fraction in the anterior, septal, and posterior walls was less than normal over the en- tire year. All 3 sectors showed an increase from discharge (index scan) to 6 weeks, but thereafter the values were stable. The ejection fraction of the anterior wall was diminished compared to the posterior and lateral walls over the course of the year and to the septal wall at the index and 6 week scans. Also, the ejection fraction of the anterior wall at the index scan was significantly less when compared to itself in the other serial scans. The ejection fraction of the septal wall was less than that of the posterior and lateral walls at the 6 month and 1 year scans. The lateral wall also showed mild improvement in ejection fraction to a

50 M. Sehgal et al. /International Journal of Cardiology 53 (19%) 45-54
*f
I/“’
03
* ~~0.05 vs. Normal
Fig. 2. Regional mid-ventricular ejection fraction (?/o x lo-*) in the infarct patients during the year after Suction. Data are compared to the range of normal in each instance. *P < 0.05 vs. normal. In&x =!irst scan at hospital discharge; 6 week = scan at 6 weeks after infarction; 6 month = scan at 6 months after infarction; 1 year = scan at 1 year after infarction. Regional Iefi ventricular walls are as noted in Fig. 1.
plateau value at the 6 month scan. Values for regional ejection fraction for the lateral wall were not statistically different from normal values over the year.
3.5. Absolute systolic wall thickening in infarct patients
Fig. 3 shows absolute mid-ventricular regional wall thickening (mm) in the infarct patients com- pared to normals. Absolute wall thickening of the
2 1 2 * p<O.O5 vs. Norma!
1 I lNOEX 6 WEEK 6 MONTH I YEAR
Time From MyoCOrdlOl Infarction
Fig. 3. Regional mid-ventricular absolute wall thickening (mm) in the infarct patients during the year after infarction. Nota- tions arc as given in Fig. 2.
anterior and septal walls was less than normal and less than that of the posterior and lateral walls over the course of the year. Absolute wall thicken- ing of the anterior and septal walls peaked at the 6 week scan and then remained relatively stable after the 6 month scan. Systolic wall thickening of the posterior wall was not significantly different compared to normals over the year. The lateral wall, however, tended to increase in absolute wall thickening from the discharge scan to the 1 year scan. There were no differences between the posterior and lateral wall absolute thickening com- pared to each other or to normal values at any time.
3.6. Percent wall thickening in infarct patients Data on regional mid-ventricular percent wall
thickening are presented in Fig. 4. Percent wall thickening of the anterior and septal walls was signScantly less than normal over the year (except for the anterior wall at the 6 month scan). Percent wall thickening of the anterior wall was less than that of the posterior and lateral walls at the index, 6 week and 1 year scan, and less than the lateral wall at the 6 month scan. Percent wall thickening of the septal wall was less than that of the posterior and lateral walls at all times over the year. In contrast, percent wall thickening of the posterior (remote, non-infarcted) wall was not dif- ferent to normal over the year after infarction. The percent wall thickening of the lateral wall con-
Fig. 4. Regional mid-ventricular percent wall thickening (% x lo-3 in the infarct patients during the year af& infarc- tion. Notations are as given in Fig. 2.
M. Sehgal et al. /International Journal of Cardiology 53 (19%) 45-54 51
timed to increase over the year where it became significantly greater than normal at the 6 week scan and remained so thereafter. There were no differences in percent wall thickening when com- paring the posterior and lateral walls to each other over the year.
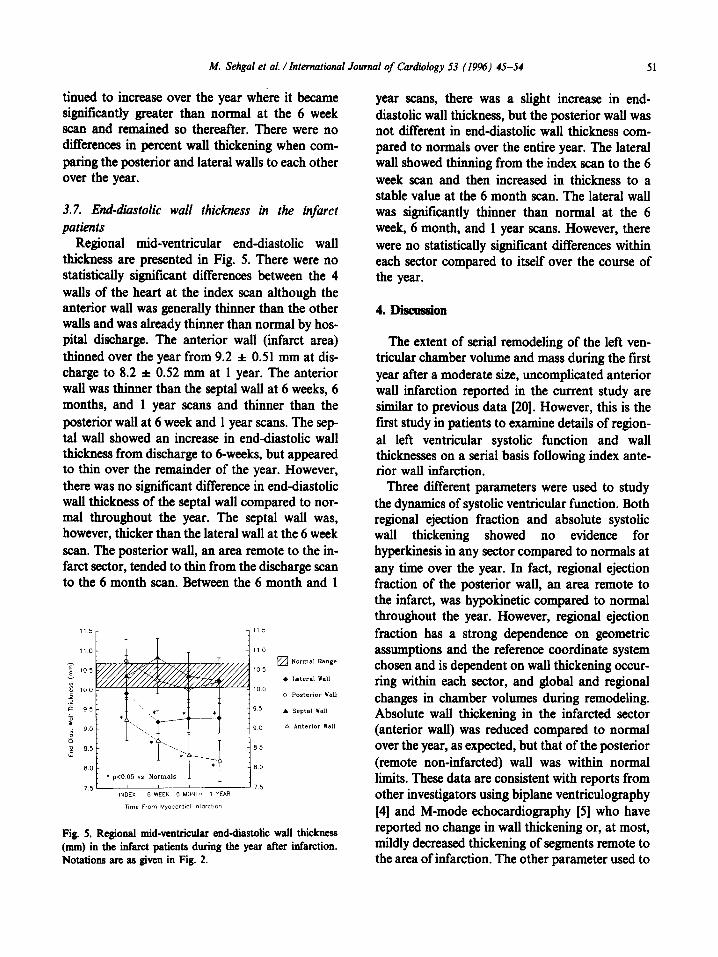
3.7. End-diastolic wall thickness in the infarct patients
Regional mid-ventricular end-diastolic wall thickness are presented in Fig. 5. There were no statistically significant differences between the 4 walls of the heart at the index scan although the anterior wall was generally thinner than the other walls and was already thinner than normal by hos- pital discharge. The anterior wall (infarct area) thinned over the year from 9.2 f 0.51 mm at dis- charge to 8.2 f 0.52 mm at 1 year. The anterior wall was thinner than the septal wall at 6 weeks, 6 months, and 1 year scans and thinner than the posterior wall at 6 week and 1 year scans. The sep- tal wall showed an increase in end-diastolic wall thickness from discharge to 6-weeks, but appeared to thin over the remainder of the year. However, there was no significant difference in end-diastolic wall thickness of the septal wall compared to nor- mal throughout the year. The septal wall was, however, thicker than the lateral wall at the 6 week scan. The posterior wall, an area remote to the in- farct sector, tended to thin from the discharge scan to the 6 month scan. Between the 6 month and 1
Fig. 5. Regional mid-ventricular end-diastolic wall thickness (mm) in the infarct patients during the year after infarction. Notations arc as given in Fig. 2.
year scans, there was a slight increase in end- diastolic wall thickness, but the posterior wall was not different in end-diastolic wall thickness com- pared to normals over the entire year. The lateral wall showed thinning from the index scan to the 6 week scan and then increased in thickness to a stable value at the 6 month scan. The lateral wall was significantly thinner than normal at the 6 week, 6 month, and 1 year scans. However, there were no statistically significant differences within each sector compared to itself over the course of the year.
4. Dlsamslon
The extent of serial remodeling of the left ven- tricular chamber volume and mass during the first year after a moderate size, uncomplicated anterior wall infarction reported in the current study are similar to previous data [20]. However, this is the first study in patients to examine details of region- al left ventricular systolic function and wall thicknesses on a serial basis following index ante- rior wall infarction.
Three different parameters were used to study the dynamics of systolic ventricular function. Both regional ejection fraction and absolute systolic wall thickening showed no evidence for hyperkinesis in any sector compared to normals at any time over the year. In fact, regional ejection fraction of the posterior wall, an area remote to the infarct, was hypokinetic compared to normal throughout the year. However, regional ejection fraction has a strong dependence on geometric assumptions and the reference coordinate system chosen and is dependent on wall thickening occur- ring within each sector, and global and regional changes in chamber volumes during remodeling. Absolute wall thickening in the infarcted sector (anterior wall) was reduced compared to normal over the year, as expected, but that of the posterior (remote non-infarcted) wall was within normal limits. These data are consistent with reports from other investigators using biplane ventriculography [4] and M-mode echocardiography [5] who have reported no change in wall thickening or, at most, mildly decreased thickening of segments remote to the area of infarction. The other parameter used to
52 M. Sehgai et al. /International Journal of Cardiology 53 (19%) 45-54
study regional systolic dynamics was percent wall thickening. The percent thickening of the infarct zone showed hypokinesis, as expected; that of the remote segment (posterior wall) was not different than normals, and that of the lateral wall showed hyperkinesis at the 6 week scan which continued over the remainder of the year. There may be several explanations for this observation in the lat- eral wall: (1) there was true hyperkinesis of the lat- eral wall; (2) the heterogeneity in regional function manifested a significant difference when compar- ing the lateral wall to a lumped value for normal; (3) the thinning that occurs in the lateral wall after infarction coupled with the normal absolute systolic thickening pattern may have resulted in a statistically significant difference for percent wall thickening. However, overall, our results indicate that the infarcted area was hypokinetic and that there was nothing to suggest consistent compen- satory hyperkinesis of the non-infarcted regions of the myocardium at any time during the 1 year follow-up. In fact, one of our dynamic parameters (ejection fraction) suggested that the remote non- infarcted (posterior) segment was hypokinetic for the entire year after infarction.
During the year after anterior infarction, the left ventricular regions either thinned or remained un- changed. Thinning of the anterior (infarct) seg- ment was expected and continued throughout the year with the majority of changes completed by 6 weeks. An important observation was that there was already a significant amount of regional thinn- ing compared to normal in the infarct region by the time of hospital discharge (index scan at a mean of 8 days post infarct). Although there were regional differences in wall thicknesses between the non-infarct regions, when comparing the index scan to the 1 year scan, there were no gross in- creases or decreases in wall thicknesses. The end- diastolic wall thickness of the septal wall was ap- proximately the same over the year with only minimal thinning. The posterior wall appeared to thin until the 6 month scan and then showed some increase in end-diastolic thickness. This indicates that there tends to be some initial thinning in regions of the left ventricular myocardium remote to the area of infarction during post-infarct remodeling. This thinning of the remote non-
infarct region continued for 6 weeks up to 6 months after infarction, after which there ap- peared to be an increase in absolute wall thickness. The lateral wall thinned significantly by the 6 week scan but then increased slightly to a stable value at the 6 month scan and thereafter. These patterns are consistent with the pattern of mild compen- satory global hypertrophy in these same patients after 6 weeks (Table 1). Thus, based on the results for regional wall thicknesses and the global left ventricular volume and muscle mass, we conclude that there is minimal hypertrophy of the non- infarcted sectors of the heart in the year following an index anterior. myocardial infarction and that the differences are regionally heterogenous and temporally non-uniform. These data are consistent with Saeed [9] who, in rats with left main coronary artery ligation, has reported that infarcted and non-infarcted segments of myocardium showed significantly reduced end-diastolic wall thicknesses in the first 3 to 4 months after infarction when compared to normals. A simplistic thin-walled shell model of the left ventricle would suggest, dur- ing progressive chamber dilation, that wall thinn- ing would be consistent with atrophy and/or fibrosis of the heart. On the other hand, mainten- ance or consistent increase in regional wall thicknesses during dilation would be consistent with development of at least mild to moderate hy- pertrophy. Thus, these data are consistent with the appearance of differential regional patterns of atrophy and/or minimal hypertrophy in the
Table 1 Serial global left ventricular chamber volumes and mass for anterior myocardial infarction patients (n= 22) (Mean zt SEM)
Index 6 Week 6 Month 1 Year
LVEDV (ml) 139 f 5 150 f 5O 159 f SGb 176 t 6bbc LVESV (ml) 62 t 4 69 f 4p 12 l 9 82 f 6a,bC LVmaas(g) 132aS 111~4’ 124*7b 134a7b
*P c 0.05 vs. index (hospital discharge). bP < 0.05 vs. 6 week. cP < 0.05 vs. 6 month. LVEDV, left ventricular (absolute) end-diastolic chamber volume; LVESV, left ventkular end-systolic chamber volume; LV mass, left ventricular muscle maas.

M. Sehgol et al. /International Journal of Cardiology 53 (19%) 45-54 53
various walls of the left ventricle after moderate- sized infarction, further compounding the com- plexity of global and regional cardiac remodeling which occurs during the first year after myocardial infarction.
4.1. Study limitations Alterations of left ventricular volumes and
mass, and perhaps regional systolic function, could occur as a result of cardiac medications. Beta-blockers 1241, calcium channel antagonists [25] and long-acting nitrates [26] have been im- plicated in either limiting the development of left ventricular hypertrophy [271 or limiting the extent of ventricular dilation [28]. Two patients received an angiotensin-converting enzyme (ACE) inhibitor following infarction and this may have limited the extent to which the left ventricle dilated after in- farction [29]. But, since the majority of patients were taking the same medications prescribed prior to hospital discharge and the index scan, and these were continued throughout the study period, it is assumed that if any pharmacologic effects were contributory to the results, the magnitude of this contribution was consistent on serial follow-up. Another limitation is that all patients had an ‘open artery’ documented on or about the time of hospi- tal discharge. If infarct artery patency has an inde- pendent effect on the extent of ventricular chamber dilation after infarction [30-321, then the magnitude of changes seen in this study are an underestimation of the extent of remodeling that could occur in some patients. Since we did not have a companion group who had non-patent in- farct related arteries at hospital discharge, this issue cannot be addressed by the current study design. Finally, the patients were older than the normals used for comparisons, but their hemody- namics were similar. Although there may be some differences in ventricular volumes and dynamics between men and women, 20 out of 22 of the in- farct patients and all of the normals were male. Po- tential differences due to sex of the patients and normals should therefore have little contribution to the data presented.
Acknowledgements
Supported by The Graduate School of Medi-
cine, The Mayo Clinic and Foundation and an Established Investigator Award to Dr. Rumberger from the American Heart Association.
References
VI
121
131
141
I’51
171
Is1
191
IlO1
1111
I121
Erlebacher JA, Weiss JL, Eaton LW, Kallman C, Weisfeldt ML, Bulkley BH. Late effects of acute infarct dilatation on heart sire: a two-dimensional echocar- diographic study. Am J Cardiol 1982; 49: 1120-26. McKay RG, Pfeffer MA, Pastemak RC et al. Loft ven- tricular remodeling after infarct expansion: A corollary to infarct expansion. Circulation 1986; 74: 693-702. Lamas GA, Pfeffer MA. Increased left ventricular volume following myocardial infarction in man. Am Heart J 1986; 111: 30-35. Mitchell GF, Lamas GA, Vaughan DE, Pfeffer MA. LeR ventricular remodeling in the year after ftrst anterior myocardial infarction: A quantitative analysis of con- tractile segment lengths and ventricular shape. J Am Coll Cardiol 1992; 19: 1136-1144. Kit&son MD, Knowlen GC, Johnson LE. Early and late global and regional left ventricular function after experi- mental transmural myccardial infarction: Relationships of regional wall motion, wall thickening, and global per- formance. Am Heart J 1987; 114: 70-77. Nieminen M, Parisi AF, O’Boyle JE, Folland ED, Khuri S, Kloner RA. Serial evaluation of myocardial thicken- ing and thinning in acute experimental infarction: Identi- fication and quantification using two-diisional echocardiography. Circulation 1982; 66: 174-180. Buda AJ, Zotx RI, Gallagher KP. The effect of inotropic stimulation on normal and ischemic myocardium after coronary occlusion. Circulation 1987; 76: 163-172. Secbtem U, Sommerhoff BA, Markiewicx W, White RD, Cheitlin MD, Higgins CB. Regional left ventricular wall thickening by magnetic resonance imaging: Evaluation in normal persons and patients with global and regional dysfunction. Am J Cardiol 1987; 59: 145-151. heed M, Wendland MF, Seelos K, Masui T, Derugin N, Higgins CB. Effect of cilaxapril on regional left ventricu- lar wall thickness and chamber dimension following acute myccardial infarction: In vivo assessment using MRI. Am Heart J 1992; 123: 1472-1480. Kramer CM, Lii JAC, Reichek N. Regional differ- ences in function within noninfarcted myocardium dur- ing left ventricular remodeling. Circulation 1993; 88: 1279-1288. Feiring AJ, Rumberger JA, Skorton DJ et al. Determina- tion of left ventricular mass in the dog with rapid aquisi- tion cardiac Cf scanning. Circulation 1985; 72: 1355-1364. Reiter SJ, Rumberger JA, Feiring AJ, Stanford W, Marcus ML. Precision of right and left ventricular stroke volume measurements by rapid acquisition tine com- puted tomography. Circulation 1986; 74: 890-900.

54 M. Sehgal et al. /International Journal of Cardiology 53 (19%) 45-54
[13] Rumberger JA. Quantifying left ventricular regional and global systolic function using ultrafast computed tomog- raphy. Am J Cardiac Imag 1991; 5: 29-37.
[14] Lipton MJ, Rumberger JA. The assessment of left ven- tricular systolic and diastolic function by ultrafast com- puted tomography. Am J Cardiac Imag 1991: 5: 318-327.
[IS] Farmer D, Lipton MJ, Higgins CB et al. In vivo assess- ment of left ventricular wall and chamber dynamics dur- ing transient myocardial ischemis using tine computed tomography. Am J Cardiol 1985; 55: X0-565.
[16] Rumberger JA, Behrenbeck T, Sheedy PF, Stanson AW. Ultrafast computed tomography. In: Giuliani ER, Fuster V, Gersh BJ, McGoon MD, McGoon DC, editors. Car- diology Fundamentals and Practice. St. Louis, MO, Mosby Year Book. 1991: 387-397.
[17] Feiring AJ, Rumberger JA, Reiter SJ, Collins SM, Skorton DJ, Rees M, Marcus ML. Sectional and segmen- tal variability of left ventricular function: Experimental and clinical studies using ultrafast computed tomogra- phy. J Am Co11 Cardiol 1988; 12: 415425.
1181 Feiring AJ, Rumberger JA. Ultra-fast computed tomog- raphy analysis of regional radius-to-wall thickness ratios in normal and volume.-overloaded human left ventricle. Circulation 1992; 85: 1423-1432.
[19] Rumberger JA, Reed JE, Behrenbeck T, Davitt PJ, Sheedy PF. Development and application of image pro- cessing, data pr ocessing, database and data query tools to study post infarction cardiac remodeling in man. Physiology and Function from Multidimensional Images - Proceedings SPIE, The International Society for Gpti- Cal Engineering, Medical Imaging 1994, Newport Beach, CA, Feb. 13-13, 1994; Volume 2168: 131-140
[20] Rumberger JA, Behrenbeck T, Breen JR, Reed JE, Gersh BJ. Non-parallel changes in global chamber volume and muscle mass during the fmt year following transmural myccardial infarction in man. J Am Coll Cardiol 1993; 21: 673-682.
1211 Force TC, Folland ED, Aebischer N, Sharma S, Parisi AF. Echocardiographic asmsmcnt of ventricular furi* tion. In: Marcus ML, Schelbert HR, Skorton DJ, Wolf GL, editors. Cardiac Imaging. Phila., WB Saunders, 1991: pp 374-401.
[22] Hirose IC, Shu NH, Reed JE, Rumberger JA. Right ven- tricular dilatation and remodeliig the first year after an
initial transmural myocardial infarction. Am J Cardiol 1993; 72: 1126-1130.
[23] Hirose IC, Reed JE, Rumberger JA. Serial changes in left and right ventricular systolic and diastolic mechanics during the first year after an initial left ventricular Q- wave myocardial infarction. J Am Co11 Cardiol 1995; 25: 1097-1104.
[24] Fouad FM, Soliminiski MJ, Taraxi RC, Gallagher JH. Alterations in left ventricular filling with beta-adrenergic blockade. Am J Cardiol 1983; 51: 161-164.
[25] Bonow RO. Effects of calcium-channel blocking agents on left ventricular diastolic function in hypertrophic car- diomyopathy and in coronary artery disease. Am J Car- diol 1985; 55: 172B-178B.
[26] Plotnick GD, Hahn B, Rogers WJ, Fisher ML, Becker LC. Effect of postural changes, nitroglycerin and verapamil on diastolic ventricular function as determined by radionuclide angiography in normal subjects. J Am Co11 Cardiol 1998; 12: 121-129.
[271 McDonald KM, Carlyle PF, Francis GS, Cohn JN. The comparative effects of beta-adrenoceptor blockade and angiotensin converting enxynz inhibitor therapy on established ventricular remodeling in the dog. Am J Hypertens 1993; 6(5): 14A (abstract).
128) McDonald KM, Francis GS, Matthews J, Hunter D, Cohn JN. Long-term oral nitrate therapy prevents chronic ventricular remodeling in the dog. J Am Coll Cardiol 1993; 21: 514-522.
[29] Pfeffer MA, Lamas GA, Vaughan DE, Parisi AF, Braunwald E. Effect of captopril on progressive ventricu- lar dilatation after anterior myocardial infarction. N Engl J Med 1988; 319: 80-86.
1301 Christian TF, Behrenbeck T, Genh BJ, Gibbons RJ. Relation of left ventricular volume and function over one year alter acute myocardial infarction to infarction sire determine by technician-99m sestamibi. Am J Cardiol 1991; 68: 21-26.
[31] Warren SE, Rayal HD, Markis JE. Time course of left ventricular dilation after myocardial infarction: In& ence of infarct-related artery and success of coronary thrombosis. J Am Coll Cardiol 1988; 11: 12-17.
1321 Braunwald E. Myocardial reperfusion, limitation of in- farct size, reduction of left ventricular dysfunction and improved survival: Should the paradigm be expanded? Circulation 1989; 79: 441-442.