Increased vascular smooth muscle contractility in TRPC6-/-mice
Upload
independentCategory
view
1download
0
JACC 'hi 4, No 4October 1984:715-24
715
Left Ventricular End-Systolic Wall Stress-Velocity of Fiber ShorteningRelation: A Load-Independent Index of Myocardial Contractility
STEVEN D. COLAN, MD, KENNETH M. BOROW, MD, ALEXANDER NEUMANN
Boston, Massachusetts and Chicago. Illinois
The velocity of circumferential fiber shortening (Vcf) isan index of myocardial performance which, althoughsensitive to contractile state, has limited usefulness because of its dependence on left ventricular loading conditions. This study investigated the degree and velocityof left ventricular fiber shortening as it relates to wallstress in an attempt to develop an index of contractilitythat is independent of preload and heart rate while incorporating afterload. Studieswere performed in 78normal subjects using M-mode echocardiography, phonocardiography and indirect carotid pulse tracings underbaselineconditions. In addition, studies were performedon 25subjects during afterload augmentation with methoxamine, 8 subjects before and during afterload challengeafter increased preload with dextran and 7 subjectswith enhanced left ventricular contractility with dobutamine. The relation of end-systolic stress to the velocityof fiber shortening and to the rate-corrected velocity ofshortening (corrected by normalization to an RR intervalof 1) was inversely linear with correlation coefficients of- 0.72 and - 0.84, respectively.Alterations in afterload,
The velocity of left ventricular fiber shortening (Vcf) is anindex of myocardial performance that can be accuratelymeasured by noninvasive means and is capable in certainsituations of distinguishing patients with normal myocardialperformance from those with impaired function(1-3). Although sensitive to changes in contractile state, the velocityof fiber shortening is highly dependent on cardiac loadingconditions and heart rate (4-8). As with other ejection phaseindexes including ejection fraction and percent fractionalshortening, the clinical utility of shortening velocity is limited by its inability to distinguish between the effects ofaltered loading conditions and abnormalities in left ventric-
From the Cardiology Department. The Children's Hospital, Boston,Massachusetts and the Cardiovascular Section. Department of Medicine.University of Ctncago, Chicago, Illinois. Manuscript received February23. 1984; revised manuscript received May 8. 1984, accepted May II,1984.
Address for repnnts: Kenneth M. Borow, MD, Cardiovascular Secnon.Department of Medicine, University of Chicago Hospitals and Clinics,950 East 59th Street, Box 44, Chicago, Illinois 60637
© 1984 by the Amencan College of Cardiology
preload or a combination of the two did not significantlyaffect the end-systolicwall stress/rate-corrected velocityof shortening relation, whereas during inotropic stimulation, the values were higher, with 94% of the datapoints above the normal range. Age did not appear toaffect the range of normal values for this index. In contrast, the end-systolic wall stress/fractional shorteningrelation was not independent of preload status, responding in a manner similar to that seen with a positiveinotropic intervention.
Thus, the velocity of circumferential fiber shorteningnormalized for heart rate is inversely related to endsystolic wall stress in a linear fashion. Accurate quantitation can be performed by noninvasive means and arange of normal values determined. This index is a sensitive measure of contractile state that is independent ofpreload, normalized for heart rate and incorporates afterload. In contrast, the end-systolic wall stress/fractionalshortening relation is dependent on end-diastolic fiberlength in the range of physiologically relevant changesin preload.
ular contractility. Efforts to overcome these limitations havefocused unsuccessfully on the relation of velocity of shortening to afterload, quantitated as either instantaneous leftventricular wall stress (9-12) or peak left ventricular wallstress (4). Recently, several investigators (13-16) observeda unique preload-independent relation between left ventricular volume and afterload at end-systole. On the basis ofthese observations, we previously investigated (17) the relation of fractional shortening to end-systolic wall stress,the force that limits fiber shortening at end-systole. Thisindex is sensitive to contractile state while incorporatingafterload. The use of the left ventricular wall stress/shorteningrelation has also been reported by other investigators (18-21).Our recent experience, however, indicated that this indexmay not accurately reflect contractile state in the presenceof abnormal left ventricular preload conditions. We, therefore, investigated the preload dependence of the left ventricular wall stress/shortening relation in normal subjectsover a wide range of arterial pressures.
0735-1097/84/$300

716 COLAN ET AL.END-SYSTOLIC STRESS-VELOCITY RELATION
lACC Vol 4. No 4Octoher 19X4 715-24
Additionally, because mean velocity of fiber shorteningis known to be independent of initial fiber length, the relationof end-systolic wall stress to velocity of shortening wasevaluated as a potentially preload-independent index of contractility that incorporates afterload status. Our previouslyreported (17,22,23) noninvasive method was used to examine the response of the end-systolic stress/velocity ofshortening relation to afterload challenge (infusion of thepure alpha-adrenergic agonist methoxamine [24,25]), preload augmentation (dextran infusion) with and without afterload challenge and inotropic stimulation (dobutamine infusion) (26) with and without afterload challenge.
MethodsStudysubjects. The study group consisted of 68 healthy
subjects (40 male, 28 female) aged 3 to 70 years. None hadknown cardiovascular disease on the basis of history. physical examination, electrocardiogram and two-dimensionaland M-mode echocardiogram, and none was taking cardioactive medications.
Recordings. Data acquisition was performed using previously described methods (17). An Irex or Hewlett-Packardultrasound imaging system with a 2.25 or 3.5 MHz transducer was used for echocardiographic, external carotid pulseand phonocardiographic recordings. Phonocardiograms wererecorded from the right upper sternal border. The Dinamap845 vital signs monitor (Critikon) was used to obtain peaksystolic and diastolic blood pressure measurements. We previously documented (27) the high degree of accuracy andreproducibility of measurements made with this device.
Protocol. For each study, simultaneous recordings ofleft ventricular echocardiograrn, phonocardiogram. indirectcarotid pulse tracing, electrocardiogram and systolic anddiastolic blood pressures were obtained. All 78 subjectswere studied under rest conditions. In 25 subjects, we alsoobtained data during afterload manipulation. Each of thesesubjects was premedicated with atropine, 0.01 mg/kg intravenously, to maintain a stable heart rate during the subsequent studies. After several baseline recordings had beenmade, an intravenous infusion of methoxamine (25 j.Lg/kgper min, maximal rate I mg/min) was begun in all 25 subjects. Repeat recordings were made every 1 to 2 minutesduring a gradual increase in peak systolic blood pressure to30 to 60 mm Hg above baseline. The methoxamine infusion
was then discontinued. In seven subjects after a 10 to 15mm Hg decrease in blood pressure below the peak systoliclevel had occurred, an intravenous infusion of dobutamine,5 j.Lg/kg per min was begun. Recordings were obtained every1 to 2 minutes during the gradual dissipation of the methoxamine pressor effect. In eight other subjects, a 500 mlinfusion of dextran was administered over a 20 to 30 minuteperiod after the first methoxamine study had been com-
pleted. The foot of the patient's bed was then raised to anangle of 30° and the infusion of methoxamine was repeatedas just described. In summary, recordings were made underrest conditions in 68 subjects, over a wide range of afterloadconditions at stable heart rates in 25 subjects, with andwithout inotropic augmentation (dobutamine infusion) in 7subjects and with and without increased preload (dextran)in 8 subjects.
Measurements and calculations. Left ventricular internal dimension and left ventricular posterior wall thicknesswere measured at end-diastole (defined as the Q wave ofthe electrocardiogram) and end-systole (defined as the firsthigh frequency component of the aortic second heart sound)in five cardiac cycles, and mean values were computed. Theleft ventricular percent fractional shortening was calculatedas end-diastolic dimension minus end-systolic dimension,divided by end-diastolic dimension. Left ventricular ejectiontime was measured from the simultaneous carotid pulsetracing and taken as the average of five beats. The ejectiontime was rate-corrected to a heart rate of 60 beats/min bydividing by the square root of the RR interval. The meanvelocity of circumferential fiber shortening of the left ventricle was calculated and normalized to the end-diastolicdimension by dividing fractional shortening by the ejectiontime. The rate-corrected velocity of shortening was calculated by dividing the fractional shortening by the rate-corrected ejection time.
Calibration of the carotid pulse tracings was performedas described previously (28), with assignment of systolic
blood pressure to the peak and diastolic pressure to the nadirof the tracing. Linear interpolation to the level of the incisurawas then performed to estimate end-systolic pressure. Values obtained in this manner differ by 3 ± 4 mm Hg (mean± SD) from simultaneous central aortic values with a correlation coefficient of 0.97 (29).
The left ventricular end-systolic meridional wall stresswas calculated by the method of Grossman et al. (30)
(1.35)(Pes)(Des)Stresses = --'---'---'---'---""--(4 )(hes)[l + (heslDes)]
where stresses is left ventricular wall stress (g/crrr') at endsystole, Pes is the left ventricular pressure (mm Hg) at endsystole, Desand h., are the left ventricular internal dimensionand posterior wall thickness (ern) at end-systole, respectively, 1.35 is a conversion factor (mm Hg to g/cnr'), and4 is a geometric factor that results from conversion of radiusto internal dimension.
Statistical analysis. Simple linear regression by the leastsquares method was used to calculate end-systolic wall stressextent of shortening equations and end-systolic wall stress/velocity of shortening equations for each of the experimentalconditions. The t test for paired data was used for statisticalanalysis, with a probability value of less than 0.05 consid-

JACC \',,1 4, No.4Octobei 1984715-24
COLAN ET AL.END-SYSTOLIC STRESS-VELOCITY RELATION
717
Table 1. Hemodynamic Response to Increased Afterload(methoxamine infusion) in Eight Subjects
ered statistically significant. All subjects were studied usinga protocol approved by the Committee for the Protection of
0/,aD = percent dimension change; Dcd = end-diastolic dimension,Dc,' end-systolicdimension; ET = ejection tune. ETc = rate-correctedejection time; h.; = end-systolic wall thickness; (TO' = end-systolicwallstress:Pc, = end-systolicpressure;Ver = velocityof circumferential shorteninp: Ver, = rate-corrected velocity of circumferentIal shortenmg.
Heart rate (beats/min)PO' (n rn Hg)Dc, (c 11)
h.; (ern I
a.; (g crrr')Dcd (c rn)%~D
ET (111')
ET, ('IIS)
Vet (c irc/s)
v.; (;Irc/s)
Baseline
79 ± 1999 ± 9
3,20 ± 0,47
1.46 ± 0.1851 ± 9
4.75 ± 0.6732.5 ± 2 I293 ± 28333 ± 231.12 ± 0.120,98 ± 007
PeakAfterload
79 ± 20141 ± 13
3.57 ± 0.521.34 ± 0.17
92 ± 18502 ± 0.6728.6 ± 2.9312 ± 34352 ± 35
0.92 ± 0 130.82 ± 0.1\
pValue
NS<001<0.01<0.01<0.01<0.01<0.01<0.01<0.01<0.01<0.01
Human Subjects from Research Risks of the Boston's Children's Hospital and the University of Chicago Hospitals andClinics.
ResultsLeft ventricular hemodynamics. The hemodynamic data
from all 25 subjects under rest and peak methoxamine pressor conditions are summarized in Table 1. The increase inend-systolic pressure seen with methoxamine resulted in anincrease in end-systolic dimension and wall stress and adecrease in end-systolic wall thickness, percent dimensionchange, velocity of shortening and rate-corrected velocityof shortening, with no change in heart rate. In Table 2, theindividual hemodynamic responses of the eight subjects whoreceived preload augmentation with 500 ml dextran are shownwith data matched for end-systolic wall stress. No significantchange in end-systolic pressure, dimension or wall stressoccurred, whereas significant increases in end-diastolic dimension, percent dimension change and ejection time were
Table 2. Individual Hemodynamic Response to Preload Augmentation With 500 ml Dextran (data matched for end-systolic stress)
Heart Rate( ase (beats/min) Pc, De~ n, %~D ETc v.; (Tc,
IC 76 113 3.30 5.15 35.9 328 1.09 55P 64 113 3.30 5,40 38.9 342 1.14 55
2C 49 122 440 610 279 312 0.89 87P 52 117 4.55 6,45 29.5 345 0.86 90
3C 78 166 3.55 4.65 23.7 310 0.76 112P 75 163 355 4.80 260 358 0.75 110
4
C 72 136 3.60 5.00 28.0 307 0.91 89P 74 144 3.55 5 15 31 I 337 0.91 91
5C 75 138 345 500 31.0 326 0.92 81P 70 137 3.50 5.25 33.3 351 0.94 83
6( 88 116 3.05 450 32.2 337 0.95 58P 80 113 305 4.70 35.1 360 0.98 57
7( 75 147 4.00 5.75 30,4 358 0.85 lIDI' 75 147 410 6.05 32.2 362 0.85 113
8(' 60 119 3,40 4.90 30.6 320 0.99 63I' 54 116 3,45 510 32,4 323 1.00 63
CMean 72 132 3,59 5.13 30,0 325 0.92 82, SD 12 18 0,42 0,54 3.6 17 0.10 22
PMean 68 131 363 5.36 32,3 347 0.93 83± SD 10 19 0,47 060 38 13 0,12 23
p \ alue NS NS NS <001 <001 <0.01 NS NSIe vs. P)
C = control; P = preload-augmented conditions; other abbrevrauons a, m Table I.

718 COLAN ET ALEND-SYSTOLIC STRESS-VELOCITY RELATION
lACC Vol 4. No 4October 19H4 715-24
Table 3. Individual Hemodynamic Response to Inotropic Stimulation (dobutamine)
Heart RateCase (beats/min) r, De' %~D ETc v., (Te,
C 83 103 3.00 32.6 368 0.89 59D 100 127 2.85 387 341 I 13 59
2C 46 105 3.45 33.0 293 1.12 50D 59 127 3.20 42.3 312 1.36 49
3C 100 102 3 15 30.0 349 0.86 56D 101 120 2.80 38.5 325 1.18 51
4C 79 98 3.30 30.5 321 0.95 57D 108 138 3.10 392 320 1.21 57
5C 69 110 3.30 31.3 311 1.01 50D 61 134 3.15 37.6 308 1.22 50
6C 105 102 310 32.6 373 0.87 55D 120 129 2.95 39.2 357 1.10 54
7C 108 100 2.70 32.5 362 0.90 50D 115 119 2.20 45.0 332 1.36 32
CMean 84 103 3.14 31.8 340 0.94 54± SD 22 4 0.25 1.2 31 0.09 4
DMean 95 128 2.89 40.1 328 1.22 50± SD 25 7 0.34 2.6 17 0.10 9
p Value NS <0.001 <0.001 <0.01 NS <0.001 NS(C vs. D)
Data are matched for end-systolic wall stress. Abbreviations as in Tables 1 and 2.
found. There was no change in the velocity of shortening subjects who received dobutamine (matched for end-systolic
or rate-corrected velocity of shortening with preload wall stress) are presented in Table 3. Heart rate increasedaugmentation. by 13% (from 84 ± 22 to 95 ± 25 beats/min) during
The hemodynamic response elicited in each of the seven dobutamine administration. Increased contractile state re-
1.6
•
Vcf = -0.0045 O'es • 1.36r=-0.72
n =118
...............................
...................... ....... .......... ........-.. ...... ~.- ........... .. ........
........... • <, -......;.... ,. . ...................~·It • .........
............ I' • •....... ......... ......... ..,............ ............ ..................... .........
-280
Mean
+280
0.8
1 0
1.2
1.4~ow~
owcr ......cr Ul
0'0() .:I 0w ......~c(crzoz
Figure 1. Relation between left ventricular (LV)end-systolic wall stress and the mean velocity ofcircumferential fiber shortening (Vcr) for 118 datapoints obtained in 25 subjects under rest and increased afterload conditions. The relation is inversely linear over a wide range of wall stress values(a). The linear regression equation is given andillustrated along with 95% confidence intervals,correlation coefficient (r) and the number of datapoints (n).
0.6~__""""' ~__--"- """'__---'-__---.J
o 20 40 60 80 100
LV END-SYSTOLIC WALL STRESS(g/cm2)
lACC \1,,1 4, No 4Octobe: 1984 715-24
COLAN ET ALEND-SYSTOLtC STRESS·VELOCITY RELATION
719
1,6
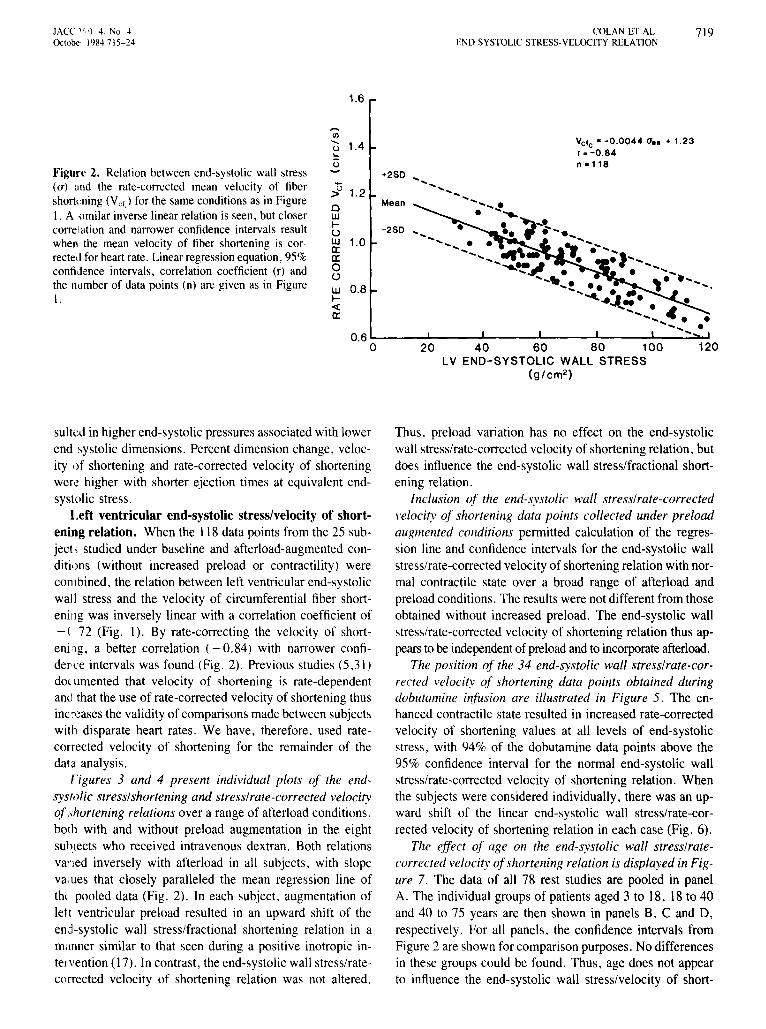
Figure 2. Relation between end-systolic wall stress(a) and the rate-corrected mean velocity of fibershortening(Vcf) for the same conditionsas in FigureI, A similar inverse linear relation is seen, but closercorrelation and narrower confidence intervals resultwhen the mean velocity of fiber shortening is correctedfor heart rate. Linearregressionequation, 95%confidence intervals, correlation coefficient (r) andthe number of data points (n) are given as in FigureI.
,...,CIl
~ 1.4...o
~ 1.2ow~
ow 1.0a:a:o(,)
w 0.8~
-ca:
+280
Mean
VCfc z -0,0044 0". + 1,23r. -0.84n .118
12020 40 60 80 100LV END-SYSTOLIC WALL STRESS
(g/cm2 )
0.6 '--__~ .L___~ .......__~__...::a...I
o
sulted in higher end-systolic pressures associated with lowerend systolic dimensions. Percent dimension change, velocity of shortening and rate-corrected velocity of shorteningwere higher with shorter ejection times at equivalent endsystolic stress.
Left ventricular end-systolic stress/velocity of shortening relation. When the 118 data points from the 25 subject, studied under baseline and afterload-augmented conditions (without increased preload or contractility) werecombined. the relation between left ventricular end-systolicwall stress and the velocity of circumferential fiber shortening was inversely linear with a correlation coefficient of-( 72 (Fig. 1). By rate-correcting the velocity of shortening. a better correlation (-0,84) with narrower confiderce intervals was found (Fig. 2). Previous studies (5.31)doc limented that velocity of shortening is rate-dependentand that the use of rate-corrected velocity of shortening thusinc reases the validity of comparisons made between subjectswith disparate heart rates. We have, therefore. used ratecorrected velocity of shortening for the remainder of thedata analysis,
Figures 3 and 4 present individual plots of the endsystolic stress/shortening and stress/rate-corrected velocityof shortening relations over a range of afterload conditions,both with and without preload augmentation in the eightsubiects who received intravenous dextran. Both relationsvaned inversely with afterload in all subjects. with slopeva.ues that closely paralleled the mean regression line ofthe pooled data (Fig, 2), In each subject, augmentation oflett ventricular preload resulted in an upward shift of theend-systolic wall stress/fractional shortening relation in amanner similar to that seen during a positive inotropic inteivention (17). In contrast, the end-systolic wall stress/ratecorrected velocity of shortening relation was not altered.
Thus. preload variation has no effect on the end-systolicwall stress/rate-corrected velocity of shortening relation, butdoes influence the end-systolic wall stress/fractional shortening relation.
Inclusion of the end-systolic wall stress/rate-correctedvelocity of shortening data points collected under preloadaugmented conditions permitted calculation of the regression line and confidence intervals for the end-systolic wallstress/rate-corrected velocity of shortening relation with normal contractile state over a broad range of afterload andpreload conditions, The results were not different from thoseobtained without increased preload. The end-systolic wallstress/rate-corrected velocity of shortening relation thus appears to be independent of preload and to incorporate afterload.
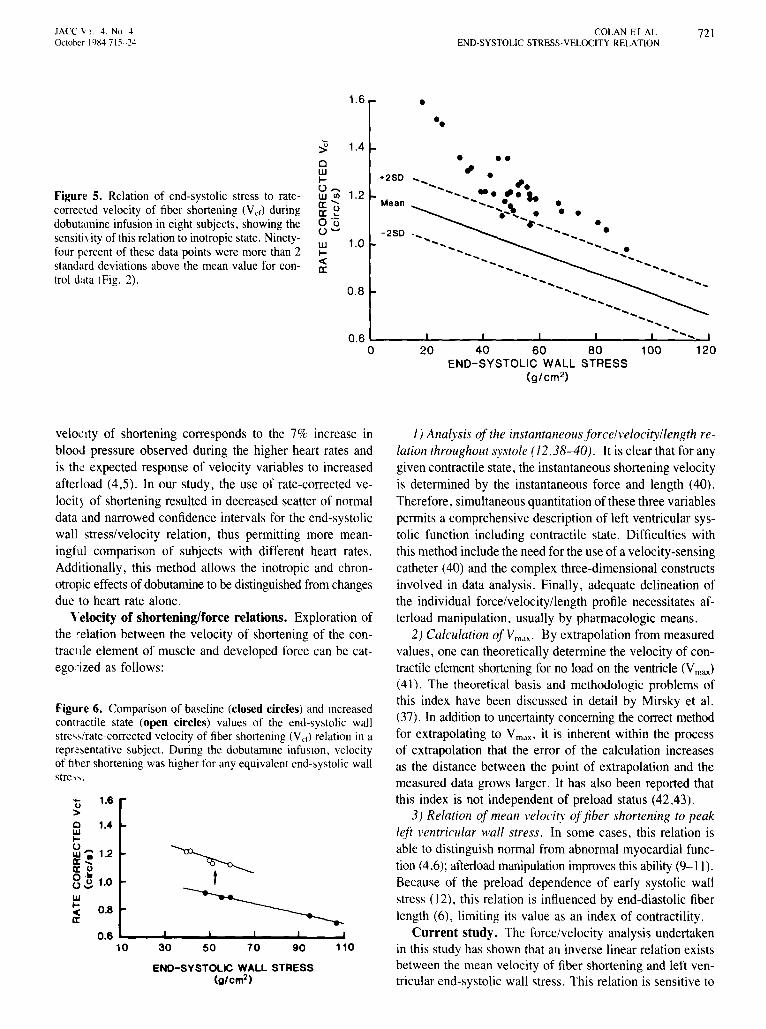
The position of the 34 end-systolic wall stress/rate-corrected velocity of shortening data points obtained duringdobutamine infusion are illustrated in Figure 5. The enhanced contractile state resulted in increased rate-correctedvelocity of shortening values at all levels of end-systolicstress, with 94% of the dobutamine data points above the95% confidence interval for the normal end-systolic wallstress/rate-corrected velocity of shortening relation. Whenthe subjects were considered individually, there was an upward shift of the linear end-systolic wall stress/rate-corrected velocity of shortening relation in each case (Fig. 6).
The effect of age on the end-systolic wall stress/ratecorrected velocity ofshortening relation is displayed in Figure 7. The data of all 78 rest studies are pooled in panelA. The individual groups of patients aged 3 to 18, 18 to 40and 40 to 75 years are then shown in panels B. C and 0,respectively. For all panels. the confidence intervals fromFigure 2 are shown for comparison purposes. No differencesin these groups could be found. Thus, age does not appearto influence the end-systolic wall stress/velocity of short-

720 COLAN ET AL.END-SYSTOLIC STRESS-VELOCITY RELATION
lACC Vol 4 . No 4October 19X4 715-24
50 70 90 110
m
~" "" ",...
END-SYSTOLIC WALL STRESS(g/cm 2 )
50 70 90 110
1.10
0 .70
0.90
1.10
0 .90
0.70
,...,rJl, m
~rn0 1.10.:0 ,.....
0.90
~ 0.700W~() m illw 1.10c:c~c:c
0 0.90~o
W 0.70~c(c:c
~, tn [1J',0
< ,
0".,.........~<,
',oQ
~" " #>g"
0 ' ·
~&-'Q
.......'0 ... l!J
~'0.,' .
~f -~'~'
lID lID
~...,.,
•
~o.o _ ....a.
'''''_, rn lID
~-Q_-~---,.o...,. '-
'/1...- .
~-"
25.0
35.0
30.0
25.0
35 .0
25.0
30.0
50 70 90 110 50 70 90 110End-Syltolc Wal Str••• (glcm2)
Figure 3. Relation of end-systolic wall stress to left ventricularpercent fractional shortening in eight subjects before (closed circles) and after (open circles) dextran infusion over a wide rangeof afterload conditions. In each case, preload augmentation resulted in a significant upward shift (arrows) of the stress/shorteningrelation in a manner similar to that seen with positive inotropicintervention. Linear regression lines before (solid) and after (dashed)dextran infusion are shown .
ening relation over the broad range of 3 to 75 years. Asimilar analysis according to gender did not reveal a difference in end-systolic wall stress/velocity of shorteningvalues between male and female subjects.
DiscussionThe mean velocity of fiber shortening has been calculated
by several different technique s, depending on the methodused for determining end-diastole and end-systole as wellas measurement of ejection time (2-4.32,33). The approachused in this study results in highly reproducible detenninations of end-systolic and end-d iastolic dimension, withinsignificant inter- or intraobserver variation in measurement(34). Ejection time calculated from externally recorded ca-
Figure 4. Relation of end-systolic wall stress to rate-correctedvelocity of fiber shortening (Vcr) in eight subjects before (closedcircles) and after (open circles) preload augmentation over a widerange of afterload condit ions. There was no significant change.Linear regression lines before (solid) and after (dashed) dextraninfusion are illustrated.
rotid pulse tracings is not significantly different from anintraarterial standard (35). When determined by a similarapproach with a combined echocardiogram and carotid pulsetracing, velocity of shortening correlates well (r = 0.94 )with angiographically determined values (33) .
Rate-corrected velocity of shortening. Because velocity of shortening is calculated as a rate of change in lengthper unit length (dUdt per unit length), it represents a strainrate (strain is defined as "change in length per unit lengthor dilL). Conceptuall y, velocity of shortening represents a" normalized velocity" and allows one to compare heartsof different sizes (36.37). Although normalized for enddiastolic diameter , mean velocity of shortening values aredirectly related to heart rate (5,3 1). This was demonstratedin the study of Hirshleifer et ai. (5), in which a 13% increasein mean velocity of shortening was induced by a 55% increase in heart rate. However , when velocity of shorteningfrom the Hirshleifer data is rate-corrected, velocity of shortening actually decreases 9%. This decrease in rate-corrected
lACC I; l i 4. No 4October 1484 715- 24
COLAN ET ALEND-SYSTOLIC STRESS·VELOCITY RELATION
721
1.6 •••
••
• ••, .
20 40 60 80 100 120END-SYSTOLIC WALL STRESS
(g/cm 2 )
..................... '..... -.,............. ...... ..............\ . ................................... ..... ...... ...... ...
",
' ..............
..............-..... .... ........ .. ...... ...... .....
............ .....
...... ...........
-250
Mean
+250
0.6 L..-__--L .L-__......L .......__--'-__.:::::-..I
a
1.0
1.2
0.8
W~
«a:
~ 1.4cW~
u"WUla: .....a: ~o '(ju--
Figure 5. Relation of end-systolic stress to ratecorrected velocity of fiber shortening (Vef) duringdobutamine infusion in eight subjects. showing thesensitivity of this relation to inotropic state. Ninetyfour percent of these data points were more than 2standard deviations above the mean value for control data (Fig. 2).
1) Analysis of the instantaneous fo rce/velocity/ length relation throughout systole (12 ,38-40) . It is clear that for anygiven contractile state. the instantaneous shortening velocityis determined by the instantaneous force and length (40).Therefore, simultaneous quantitation of these three variablespermits a comprehensive description of left ventricular systolic function including contractile state. Difficulties withthis method include the need for the use of a velocity-sensingcatheter (40) and the complex three-dimensional constructsinvolved in data analysis. Finally, adequate delineation ofthe individual force/velocity/length profile necessitates afterload manipulation. usually by pharmacologic means.
2) Calculation ofVm dx ' By extrapolation from measuredvalues, one can theoretically determine the velocity of contractile element shortening for no load on the ventricle (Vmax)
(41). The theoretical basis and methodologic problems ofthis index have been discussed in detail by Mirsky et al.(7). In addition to uncertainty concerning the correct methodfor extrapolating to Vma x - it is inherent within the processof extrapolation that the error of the calculation increasesas the distance between the point of extrapolation and themeasured data grows larger. It has also been reported thatthis index is not independent of preload status (42,43).
3 ) Relation of mean velocity of fiber shortening to peakleft ventricular wall stress . In some cases, this relation isable to distinguish normal from abnormal myocardial function (4.6); afterload manipulation improves this ability (9- 11).Because of the preload dependence of early systolic wallstress (\ 2). this relation is influenced by end-diastolic fiberlength (6), limiting its value as an index of contractility.
Current study. The force/velocity analysis undertakenin this study has shown that an inverse linear relation existsbetween the mean velocity of fiber shortening and left ventricular end-systolic wall stress. This relation is sensitive to
11090705030
0.6 ...._ .....__.....__.....__...._~
10
Figure 6. Comparison of baseline (closed circles) and increasedcontractile state (open circles) values of the end-systolic wallstre- s/rate-corrected velocity of fiber shortening (Vcd relation inarepresentative subject. During the dobutamme infusion , velocityof fiber shorteningwas higherfor anyequivalent end-systolic wallstre-,- .
END-SYSTOLIC WALL STRESS(g/cm2)
'0 1.6>o 1."w...~. 1.2a: .....a:uo ·li::02 1.0
w~ 0.8a:
velocity of shortening corresponds to the 7% increase inblood pressure observed during the higher heart rates andis the expected response of velocity variables to increasedafterload (4,5). In our study, the use of rate-corrected velocity of shortening resulted in decreased scatter of normaldata and narrowed confidence intervals for the end-systolicwall stress/velocity relation, thus permitting more meaningful comparison of subjects with different heart rates.Additionally, this method allows the inotropic and chronotropic effectsof dobutamine to be distinguished fromchangesdue to heart rate alone.
Velocity of shortening/force relations. Exploration ofthe relation between the velocity of shortening of the contracule element of muscle and developed force can be categorized as follows:

722 COLAN ET AL.END-SYSTOLlC STRESS-VELOCITY RELATION
lACC Vol 4, No 4October 19154715--24
A) C)
1.4 1.4
~ ~1.3 +2S0 a 1.3 +250 .~ n.25a ...~ n=7a ...~
~ ...~ 1.1.11.1.1 ... ...~... ................ ... ...1.2 U 1.2 ......
U Mean '1- .... 1.1.1 .... Mean ......1.1.1,.... ................. . 0:", ......0:"' ....~ ...0:'0 1.1 0: .... 1.1. .. .'.-.......... O~ . ........0.: -2S0. .......US -280.............. •• •• - ..................... U~ ~ ... , ......
1.0 - ...............7 • • • ..... ..... 1.1.1 1.0 ~ ... ... ...1.1.1 ...... . ......... ~ ...... .............~ ..... « ...... ..............- .« ...... 0:0: 0.9 .......... ... . 0.9 ......... '""'- .......... . ............ ... ...
0.80
...~0.8
0
......20 40 60 80 20 40 60 80
LV END-SYSTOLIC WALL STRESS LV END-SYSTOliC WALL STRESSB) (g/cm2) D) (g/cm2)
1.4 1.4
~ n.30 Ji n"l:23a 1.3 +250 ... a 1.3 +2SD ....1.1.1
...... W ............ ... ... ........., ..... ......U 1.2 ...... U 1.21.1.1.....
Mean l ...... 1.1.1 .... Mean0:"' ••• fro. ... 0:"' . .....0:- 1.1 .......... O:u 1.1 .....O~ • • , .... ' <, 0.: ....U '0 -250 • U (J -250 .. ............................. . ..~ - ~ ..w- 1.0 ................. . ...~ w 1.0 ~ ... ............ ... ... ... ........ ...t. ,. ..... .........~ .« ......... «0: 0.9 0: 0.9 .....<;~ ••• .. ...
......... ..... - .....!
0.8~ ...... ......
0 20 40 60 800.8
0 20 40 60 80LV END-SYSTOLIC WALL STRESS LV END-SYSTOLIC WALL STRESS
(g/cm2) (g/cm2)
Figure 7. Relation of end-systolic wall stress/rate-corrected velocity of shortening (Vcf) to age. Rest data points for all 78 subjectsare illustrated in panel A. Data are then divided into groups aged3 to 18 years (30 subjects, panel B), 19 to 40 years (25 subjects,panel C) and 41 to 75 years (23 subjects, panel D). In all cases,the normal confidence limits from Figure 2 are shown for comparison. No influence of age on the end-systolic stress/rate-corrected velocity of shortening relation was discernible.
altered contractile state, is independent of preload, incorporates both afterload and heart rate and can be accuratelydetermined by noninvasive means without manipulation ofloading conditions.
The lack of influence of end-diastolic fiber length on therelation ofend-systolic wall stress to rate-corrected velocityof shortening derives from the fact that neither of thesevariables is preload-dependent. Although instantaneous ve-
1.6
'"'l/J.... 1.4()
.=:c.....
~ 1.2olJJIUlJJ 1.0ex:a:oow 0.8I-«a:
+2 SOVcfe high for l1es
Mean~
-2 SO .~
VeIL appropriatelor Oes
VCfc low for aes
Figure 8. Diagram of the end-systolic wall stress(uos)/rate-corrected velocity of fiber shortening (Vcf)
relation. Depressed contractile state (Vcf, low for thelevel of ues) may be distinguished from situations inwhich contractility is normal but afterload is increased(Vcr, appropriate for the level of ues) . Velocity of fibershortening, which is high for the level of end-systolicwall stress, is characteristic of increased inotropic state.
12020 40 60 80 100LV END-SYSTOLIC WALL STRESS
(g/cm2 )
0.6 '--__...I-__--'-__--I .L.-__...L- _
o

lACC V,,i 4, No 4October 1'184:7\5-24
COLAN ET ALEND-SYSTOLIC STRESS-VELOCITY RELATION
723
locity is higher during preload augmentation in papillarymuscle preparations (44) and isolated canine hearts (12),concomitant prolongation of ejection time and elevation ofearly systolic wall stress results in mean velocity of shortening values that are independent of preload over the physiologic range (4,7,45), Additionally, end-systolic wall stress,in contrast to peak stress, is not related to preload status,When isolated, ejecting canine hearts are subjected to increased filling volumes while the absolute level of ejectionpressure is held constant, higher early systolic wall stress(including peak stress) is attained, while end-systolic wallstress is unchanged (40), Thus, if afterload is defined interms of wall stress, then only at end-systole is afterloadindependent of preload, This influence of end-diastolic fiberlength on early systolic wall stress results in the preloaddependence of the mean velocity of shortening/peak wallstress relation, Only by relating mean velocity of shorteningto afterload at end-systole is it possible to define a preloadindependent index of contractility,
This principle is also illustrated by the preload dependena of the end-systolic stress/fractional shortening relation documented in this study, Fractional shortening is knownto be preload-dependent, whereas end-systolic stress is notinfluenced by end-diastolic fiber length, Comparison of preand post-dextran infusion data points at similar levels ofend-systolic stress (Table 2) shows that fractional shorteningincreased 7,6 ± L9%. Thus, their ratio is responsive toalterations in loading under conditions that are clearly physiologically relevant. This load dependence limits the usefulness of the stress/shortening relation as an index of contractile state. As also shown in Table 2, the concomitant7.1 ± 4.9% increase in ejection time during preload infusion resulted in the velocity of shortening being unchanged. Figure 8 illustrates the use of the end-systolicstress/velocity of fractional shortening relation for the interpret.uion of clinical data, For any given end-systolic stress,a normal range of rate-corrected velocity of shortening values can be defined, It is thereby possible to distinguishreduced velocity of shortening due to excessive afterloadfrom the effects of depressed contractility, Both rate-corrected mean velocity of shortening and wall stress are normalized for heart size, permitting comparison of patientswith different heart sizes and ages, Normalization of meanvelocity of shortening for heart rate enables inter- and intrapatient comparison under changing physiologic conditions.
Limitations. The potential limitations of this method ofleft ventricular wall stress quantitation have been previouslydiscussed in detail (17,22,23), It should be noted that measurcments from multiple cardiac cycles were averaged foreacn wall stress and rate-corrected velocity of shorteningcomputation, Additionally, conclusions are based on theanalysis of individual responses over a wide range of afterload conditions, By these means, the influence of randommeasurement error is minimized. This method of quantifi-
cation of meridional wall stress as a measure of left ventricular afterload yields accurate results by noninvasivemethods (46), Although quantitatively different from circumferential wall stress, these two measures of afterloadcorrelate well (47) and relate similarly to left ventricularperformance (48), Even in conditions with altered left ventricular geometry, such as aortic regurgitation and congestive cardiomyopathy, a correlation of 0,94 has been foundbetween the two orthogonal stress determinations (20). Wechose to use meridional wall stress as a measure of afterloadin this analysis because of the ease and reproducibility ofthe measurements involved. Clinical conditions in whichthe usual relation of meridional and circumferential wallstress is significantly disturbed may require an alternativeapproach,
Clinical implications. The end-systolic stress/rate-corrected velocity of fiber shortening relation is obtainable inthe rest state by noninvasive means without need for alteration of loading conditions, rendering it ideal for longitudinal studies assessing the effects of therapeutic interventions, disease progression and so forth. In particular, thisindex may be especially advantageous in situations in whichpreload status is either unpredictable or known to be abnormal, such as hereditary anemias, vasodilator therapy orthe postoperative state, Further investigations of the clinicalutility of this method are needed.
We thank Kathleen O'Bnen and Emily Flynn for their assistance in preparation of this manuscnpt.
ReferencesI. Karhner JS. Gault JH, Eckberg D. Mullins CB, Ross J Jr. Mean
velocity of fiber shortenmg. A simplified measure of left ventncularmyocardial contractility. Circulation 1971;44:323-33.
2. Fortum NJ, Hood WP. Craige E. Evaluation of left ventncularfunctionby echocardiography. Circulation 1972;46'26-35.
3. Paraskos JA, Grossman W, Saltz S, Dalen JE, Dexter L. A noninvasive technique for the determination of velocity of circumferentialfiber shortening in man. Circ Res 1971;29:610-5
4 Qumones MA, Gaasch WH, Cole JS, Alexander JK. Echocardiographic determination of left ventncular stress-velocity relations mman. With reference to the effects of loadmg and contractility Circulation 1975;51.689-700.
5. Hirshleifer 1. Crawford M, O'Rourke RA, Karhner JS. Influence ofacute alterations in heart rate and systemic artenal pressure on echocardiographic measures of left ventncular performance in normal human subjects. Circulation 1975;52:835-41.
6. Sasayama S. Kotoura H. Echocardiographic approach for the clunealassessment of left ventncular function. the analysis of end-systolicpressure (wall-stressj-diameter relation and force-velocity relation ofejectmg ventricle. Jpn Circ J 1979,43:357-66.
7 Mahler F, Ross J JR. O'Rourke RA, Covell JW. Effects of changesIII preload. afterload and inotropic state on ejection and isovolumicphase measures of contractihty III the conscious dog. Am J Cardiol1975;35'626-34.
8 Rosenblatt A, Clark R. Burgess J, Cohn K. Echocardiographic as-

724 COLAN ET AL.END-SYSTOLIC STRESS-VELOCITY RELATION
lACC Vol 4. No 4October 1984 715-24
sessment of the level of cardiac compensation in valvular heart disease.Circulation 1976;54:509-18.
9. Ross J Jr. The concept of afterload mismatch and Its implications Inthe clinical assessment of cardiac contractility. Jpn Circ J 1976;40:865-75.
10. Ross J Jr. Franklin D, Sasayama S. Preload, afterload and the role ofafterload mismatch in the descending limb of cardiac function. Eur JCardiol 1976;4:77-86.
II. Ross J Jr. Afterload mismatch and preload reserve: a conceptual framework for the analysis of ventricular function. Prog Cardiovasc Dis1976;18:255-64.
12. Weber KT, Janicki JS. Instantaneous force-velocity-length relationsin isolated dog heart. Am J Physiol 1977;232:H241-9.
13. Suga H, Sagawa K. Instantaneous pressure-volume relationshipsandtheir ratio In the excised, supported canine left ventricle. Circ Res1974;35:117-26.
14. Weber KT, Janicki JS, Hefner LL. Left ventricular force-length relations of isovolumic and ejecting contractions. Am J Physiol1976;231:337-43.
15. Grossman W, Braunwald E, Mann T, McLaurin LP, Green LH. Contractile state of the left ventricle 10 man as evaluated from the endsystolic pressure-volume relation. Circulation 1977;56:845-52.
16. Suga H, Kitabatake A, Sagawa K. End-systolic pressure determinesstroke volume from fixed end-diastolic volume in the isolated leftventricle under a constant contractile state. Circ Res 1979;44:238-49.
17. Borow KM, Green LH, Grossman W. Braunwald E. Left ventricularend-systolic stress-shortening and stress-length relations In humans.Normal values and sensitivity to inotropic state. Am J Cardiol1982;50:1301-8.
18. Wisenbaugh T. Spann 1. Carabello B. Chronic volume overload ofsimilar severity produces different ventncular mechanics in mitralversus aortic regurgitation (abstr). CIrculation 1983;68(suppl II1):II1238.
19. Hirota Y, Shimizu G, Kaka K, Takaharu S, Kawamura K. Two dimensional analysis of left ventricular funcnon by afterload-ejectionfraction, and end-systolic stress-volume relationships (abstr). Circulation 1983;68(suppl II1):II1-238.
20. Douglas P, Reichek N, Plappert T, Muhammad A, St John Sutton M.Multiplanar analysis of left ventncular stress-shortening relationships(abstr). Circulation 1983;68(suppl 111):111-239.
21. Pfeffer MA, Pfeffer JM, Iwai J. Effects of graded dietary NaCI onleft ventricular hypertrophy and performance in Dahl hypertensive rats(abstr). Circulation 1983;68(suppl III):II1-224.
22. Borow KM. Neumann A. Wynne J. Sensitivity of end-systolic pressure-dimension and pressure-volume relations to inotropic state inhumans. Circulation 1982;65:988-97.
23. Borow KM. Propper R, Bierman FZ, Grady S. Inau A. Left ventricularend-systolic pressure-dimension relation in patients with thalassemiamajor: a new noninvasive method of assessing contractile state. Circulation 1982;66:980-5.
24. Duke M, Ames RP, Ablemann WHo Hemodynamic effect of methoxamine in normal human subjects. Am J Med Sci 1963;246:301-7.
25. Goldberg LI, Bloodwell RD, Braunwald E, Morrow AG. The directeffect of norepinephrine, epinephrine, and methoxamine on myocardial contractile force in man. Circulation 1960;22:1125-32.
26. Tuttle RR, Mills J. Dobutamine. Development of a new catecholamineto selectively increase cardiac contractility. Circ Res 1975;36:185-96.
27. Borow KM, Newberger JW. Noninvasive estirnanon of central aorticpressure using the oscillometric method for analyzing systemic arterypulsatile blood flow: comparative study of indirect systolic, diastohc,and mean brachial artery pressure with Simultaneous direct ascendingaortic pressure measurements. Am Heart J 1982;103:879-86.
28. Stefadouros MA, Dougherty MS, Grossman W, Craige E Determination of systemic vascular resistance by a nomnvasive technique.Circulation 1973;47:101-7.
29. Marsh JD, Green LH, Wynne J, Cohn PF. Grossman W. Left ventricular end-systolic pressure-dimension and stress-length relations innormal human subjects. Am J CardIOI1979;44:1311-7.
30. Grossman W. Jones D. McLaurin LP. Wall stress and patterns ofhypertrophy in the human left ventncle. J Clin Invest 1975,56:56-64.
31. Mahler F, Yoran C, Ross J Jr. Inotropic effect of tachycardia andpoststimulation potentiation in the conscious dog. Am J Physiol1974;227:569-75.
32. Cooper RH, O'Rourke RA, Karliner JS, Peterson KL, Leopold GR.Comparison of ultrasound and cinangiographic measurements of themean rate of circumferential fiber shortening in man. Circulation1972;46:914-23.
33. Quinones MA, Gaasch WH, Alexander JK. Echocardiographic assessment of left ventncular function. With special reference to normalized velocities. Circulation 1974;50:42-51.
34. Lapido GOA, Dunn FG, Pringle TH, Bastian B, Lawrie TDV. Serialmeasurements of left ventricular dimensions by echocardiography:assessment of week-to-week. inter- and intra-observer variability innormal subjects and patients With valvular heart disease. Br Heart J1980;44:284-9.
35. Van de Werf F, Piesseus J, Kesteloot H, DeGeest H. A comparisonof systolic time Intervals denved from the central aortic pressure andfrom the external carotid pulse tracings. Circulation 1975;51:310-6.
36. Mirsky I, Pasternac A, Ellison RC. A general index for the assessmentof cardiovascular function. Am J Cardiol 1970;26:649-50.
37 Mirsky I, Pasternac A, Ellison RC. Hugenholtz PG. Clinical application of force-velocity parameters and the concept of a "normalizedvelocity." In: Musky I, Ghista DN, Sandler H, eds. Cardiac Mechanics New York: John Wiley & Sons, 1974:293-329.
38. Fry DL, Gnggs DM. Greenfield JC Jr. Myocardial mechanics: tensionvelocity-length relationships of heart muscle. Circ Res 1964;14:73-85.
39. Peterson KL, Uther JB, Shabetai R, Braunwald E. Assessment of leftventricular performance in man. Instantaneous tension-velocity-lengthrelations obtained with the aid of an electromagnetic velocity catheterin the ascending aorta. Circulation 1973;47:924-35.
40. Weber KT. Janicki JS. Instantaneous force-velocity-length relanons:expenmental findings and clinical correlates. Am J Cardiel1977;40:740-7.
41. Sonnenblick EH. Force-velocity relations 10 mammalian heart muscle.Am J Physiol 202:1962;931-9.
42. Nejad NS, Klein MD, Mirsky I. Lown B. Assessment of myocardialcontractility from ventncular pressure recordings. Cardiovasc Res1971;5:15-23.
43. Grossman W, Haynes F. Paraskos JA, Saltz S, Dalen JE, Dexter L.Alterations in preload and myocardial mechanics 10 the dog and inman. Circ Res 1972,31:83-94.
44. Sonnenbhck EH, Parmley WW, Urschel CWo The contractile state ofthe heart as expressed by force-velocity relations. Am J Cardiol1969:23:488-503
45. Nixon JV, Murray RG, Leonard PD, Mitchell JH, Blomqvist CG.Effect of large variations in preload on left ventricular performancecharacteristics in normal subjects. Circulation 1982;65:698-703.
46 Brodie BR, McLaurin LP, Grossman W. Combined hemodynamicultrasonic method for studying left ventricular wall stress: comparisonwith angiography. Am J Cardiol 1976;37:864-70.
47 DePace NL, Reu JF. Iskandnan AS, Kotter MN, Hakki AH, SegalBL. Correlation of echocardiograpluc wall stress and left ventncularpressure and function in aortic stenosis Circulation 1983;67:854-9.
48. Sandler H, Dodge HT. Left ventricular tension and stress in man. CircRes 1963;13:91-104.
Copyright © 2022 FDOKUMEN