
Regional impact assessment on forest structure and functions under climate change—the Brandenburg...
14
Regional impact assessment on forest structure and functions under climate change—the Brandenburg case study P. Lasch * , M. Lindner, M. Erhard, F. Suckow, A. Wenzel Potsdam Institute for Climate Impact Research, P.O. Box 60 12 03, D-14412 Potsdam, Germany Abstract A forest simulation model has been applied in a regional impact assessment to investigate impacts of climate change on forest structure and function in the Federal state of Brandenburg, Germany. The forest model FORSKA-M was linked to a GIS that included soil, groundwater table and land-use maps. Two climate scenarios (current climate and a climate change of 1.5 K temperature increase which is combined with a precipitation decrease of 10–20% on average) for 40 meteorological stations in and around Brandenburg were used to assess the sensitivity of species composition to climate change. Furthermore, the implications of vegetation changes for other forest functions were analysed by means of several indicators. To evaluate the impacts of climate change on biodiversity, measures of species diversity (Shannon’s and Simpson’s index) and habitat and structural diversity (Seibert’s index) were applied. The evaluation of impacts on groundwater recharge of natural and managed forests was carried out using the soil water balance model of FORSKA-M. At first, model simulations of the potential natural vegetation (PNV) on the whole area of Brandenburg with different climate scenarios were analysed. The results indicated that climatic warming would lead to a shift in the natural species composition in Brandenburg towards more drought tolerant species. The simulated diversity of the forests would be reduced, and groundwater recharge would be decreased. The majority of forests in the state of Brandenburg have been managed intensively in the past. At present, large areas of Brandenburg’s forests are dominated by pure stands of Scots pine, but current forest management practice aims at increasing the share of deciduous and mixed forests. In order to analyse the possible consequences of climate change on forest management, forest inventory data were used to initialise FORSKA-M with representative forest stands. Simulation experiments with three different management scenarios showed that the short to mid-term effects of climatic change in terms of species composition were not as severe as expected. However, the comparison of different diversity measures indicates a decrease in the species diversity in contrast to an increase in habitat diversity under climate warming. Furthermore, a decrease in productivity and groundwater recharge was simulated under the climate change scenario. The regional impact assessment corroborated the high sensitivity of natural forests in the region to the projected climatic change and it underlined the importance of adaptive management strategies to help forestry to cope with climatic change. # 2002 Elsevier Science B.V. All rights reserved. Keywords: Regional impact analysis; Succession model; FORSKA; Climate change; Forest management; Forest functions 1. Introduction The temperate forests of Central Europe are man- aged with multiple objectives, and the rotation periods are very long—usually between 80 and 200 years. Forest Ecology and Management 162 (2002) 73–86 * Corresponding author. Tel.: þ49-331-2882662; fax: þ49-331-2882695. E-mail address: [email protected] (P. Lasch). 0378-1127/02/$ – see front matter # 2002 Elsevier Science B.V. All rights reserved. PII:S0378-1127(02)00051-8
-
Upload
independent -
Category
Documents
-
view
3 -
download
0
Transcript of Regional impact assessment on forest structure and functions under climate change—the Brandenburg...

Regional impact assessment on forest structure and functionsunder climate change—the Brandenburg case study
P. Lasch*, M. Lindner, M. Erhard, F. Suckow, A. WenzelPotsdam Institute for Climate Impact Research, P.O. Box 60 12 03, D-14412 Potsdam, Germany
Abstract
A forest simulation model has been applied in a regional impact assessment to investigate impacts of climate change on forest
structure and function in the Federal state of Brandenburg, Germany. The forest model FORSKA-M was linked to a GIS that
included soil, groundwater table and land-use maps. Two climate scenarios (current climate and a climate change of 1.5 K
temperature increase which is combined with a precipitation decrease of 10–20% on average) for 40 meteorological stations in
and around Brandenburg were used to assess the sensitivity of species composition to climate change. Furthermore, the
implications of vegetation changes for other forest functions were analysed by means of several indicators. To evaluate the
impacts of climate change on biodiversity, measures of species diversity (Shannon’s and Simpson’s index) and habitat and
structural diversity (Seibert’s index) were applied. The evaluation of impacts on groundwater recharge of natural and managed
forests was carried out using the soil water balance model of FORSKA-M.
At first, model simulations of the potential natural vegetation (PNV) on the whole area of Brandenburg with different climate
scenarios were analysed. The results indicated that climatic warming would lead to a shift in the natural species composition in
Brandenburg towards more drought tolerant species. The simulated diversity of the forests would be reduced, and groundwater
recharge would be decreased.
The majority of forests in the state of Brandenburg have been managed intensively in the past. At present, large areas of
Brandenburg’s forests are dominated by pure stands of Scots pine, but current forest management practice aims at increasing the
share of deciduous and mixed forests. In order to analyse the possible consequences of climate change on forest management,
forest inventory data were used to initialise FORSKA-M with representative forest stands. Simulation experiments with three
different management scenarios showed that the short to mid-term effects of climatic change in terms of species composition
were not as severe as expected. However, the comparison of different diversity measures indicates a decrease in the species
diversity in contrast to an increase in habitat diversity under climate warming. Furthermore, a decrease in productivity and
groundwater recharge was simulated under the climate change scenario.
The regional impact assessment corroborated the high sensitivity of natural forests in the region to the projected climatic
change and it underlined the importance of adaptive management strategies to help forestry to cope with climatic change.
# 2002 Elsevier Science B.V. All rights reserved.
Keywords: Regional impact analysis; Succession model; FORSKA; Climate change; Forest management; Forest functions
1. Introduction
The temperate forests of Central Europe are man-
aged with multiple objectives, and the rotation periods
are very long—usually between 80 and 200 years.
Forest Ecology and Management 162 (2002) 73–86
* Corresponding author. Tel.: þ49-331-2882662;
fax: þ49-331-2882695.
E-mail address: [email protected] (P. Lasch).
0378-1127/02/$ – see front matter # 2002 Elsevier Science B.V. All rights reserved.
PII: S 0 3 7 8 - 1 1 2 7 ( 0 2 ) 0 0 0 5 1 - 8

Climate models currently project a temperature
increase of approximately 1.5–3.0 K up to the year
2100 (Kattenberg et al., 1996). Thus, the majority of
present day forests will probably live long enough to
experience significant changes in the climatic condi-
tions. In order to ensure the sustainability of the forest
resources including the multitude of forest functions,
there is a clear need to develop adaptive management
strategies to cope with the effects of climate changes
on forests (Lindner, 2000). Since, there are still great
uncertainties about the regional characteristics of the
future climate as well as about the response of our
forests to the changes in the atmospheric and climatic
conditions (Kirschbaum et al., 1996; Korner, 1996;
Solomon et al., 1996; Kellomaki, personal commu-
nication) the development of adaptive management
strategies should be based on sensitivity and risk
analysis.
This study is part of ongoing investigations on
impact assessments of climatic change on natural
and anthropogenic systems in the Federal State of
Brandenburg, Germany (Stock and Toth, 1996). For-
ests cover approximately one-third of the territory, i.e.
about 1 million ha. Forestry is an important economic
factor in many remote areas of the state, moreover,
forests are equally important for recreation and tour-
ism, and as a source for high quality drinking water for
the metropolitan area of Berlin. Forests clearly affect
the regional water balance of Brandenburg (Lutzke,
1991). The state of Brandenburg has a large percen-
tage of protected areas in national parks and biosphere
reserves, where the forests are also important for
habitat conservation. However, large forest areas are
currently covered by pure stands of Scots pine (Pinus
sylvestris L.), which are characterised by extraordin-
ary high risks for insect infestations and wildfires.
These stands are a product of more than a century of
intensive forest management aiming at a maximisation
of yield. Under natural conditions broad-leaved spe-
cies (e.g. beech, Fagus sylvatica L., oak, Quercus
robur L. and Q. petraea (Matt.) Liebl., hornbeam,
Carpinus betulus L., lime, Tilia cordata (Mill.)) would
prevail in the majority of these forests.
Brandenburg has a relatively dry temperate climate,
and the water balance is strongly influencing the
growth and vitality of the forests. Therefore, the
projected changes in climate will most likely have
distinct impacts on the forests in this region. In a
previous study (Lindner et al., 1997a), two forest gap
models, FORSKA (Prentice et al., 1993) and ForClim,
(Bugmann, 1996) were applied to simulate the possi-
ble impacts of climate change on the tree species
composition in the potential natural vegetation
(PNV) of Brandenburg. Lasch et al. (1999) improved
the methodology of the regional impact assessment
and extended the analysis to include managed forest
stands. The objective of this study was to combine the
analysis of species composition and forest productiv-
ity with an evaluation of the impacts of simulated
vegetation changes on other forest functions.
2. Methods
2.1. The forest simulation model
In this study a modified version of the forest gap
model FORSKA (Prentice et al., 1993) was used.
FORSKA simulates growth, regeneration and mortal-
ity of individual trees on small forest patches (Botkin
et al., 1972; Shugart, 1984) and was used successfully
to simulate forest dynamics in Scandinavia (Leemans,
1992), Canada (Price and Apps, 1996) and north-east
Germany (Lindner et al., 1997a; Lasch et al., 1998).
The applied version of the model, FORSKA-M,
includes tree-specific response functions for various
climatic factors (Prentice et al., 1993), soil fertility
(Lindner et al., 1997a), and distance to the ground-
water (Lasch et al., 1999). In the current model version
a multi-layer soil percolation model (Grote and
Suckow, 1998) a modified height growth function
(Lindner et al., 1997b), and management subroutines
(Lindner, 2000) are implemented. A more detailed
description of the above mentioned characteristics of
FORSKA-M was given in (Lasch et al., 1999). The
model works with daily time series of mean tempera-
ture, precipitation, and relative sunshine duration as
climatological driving forces.
2.2. Management scenarios
A variety of forest management activities can be
simulated with FORSKA-M using three modes of
regeneration (unrestricted seed availability, natural
regeneration of species with trees, planting of selected
species), different harvesting techniques (clear cut,
74 P. Lasch et al. / Forest Ecology and Management 162 (2002) 73–86
shelter wood harvesting, and selective harvesting), and
a Weibull-distribution based stochastic thinning rou-
tine (Gerold, 1990).
Three different management scenarios were inves-
tigated:
1. Traditional forest management (MS1), favouring
economically important species, which at present
prevail in the stands. No shift of species
composition is considered in the response to
changing climate. Seed availability of other
species was assumed to be 2% of the standard
values for climax species and 10% for pioneer
species.
2. Adaptive forest management (MS2), favouring the
climatically best-adapted species. Climatic adap-
tation was estimated using the climate response
functions of the FORSKA model (Prentice et al.,
1993). Two tolerance thresholds to identify
species with high and low drought risk under the
typical climate at a site were introduced: a lower
threshold below which a species is considered to
be sensitive to drought stress, and an upper
threshold, above which a species is considered to
be well-adapted for this climate. When stand
regeneration occurred the three best-adapted
species were planted with 1333 saplings per ha.
3. Maximisation of tree species diversity (MS3),
regenerating all climatically well-adapted species.
Climatic adaptation was estimated as described
above. All well-adapted species were planted with
a density of 4000/Nspec saplings per ha, where
Nspec was the number of well-adapted species at
the site.
2.3. Climate scenarios
The climate data necessary to drive the model
include time series of daily temperature (8C), preci-
pitation (mm) and relative sunshine duration (%) for
40 meteorological stations in or around the state of
Brandenburg.
Time series of current climate and a climatic change
have been produced using a multivariate statistical
analysis of long-term meteorological observations
from several meteorological stations in the state of
Brandenburg (Werner and Gerstengarbe, 1997). The
basic scenario S0 represents climate of the period
1951–1990 and serves as reference scenario. The
climate change scenario was calculated for a time
period of 55 years after an instantaneous increase of
temperature by 1.5 K (S2). A description of the sce-
nario production and an analysis of the scenarios was
carried out in Lasch et al. (1999) and showed that the
temperature increase was well reproduced by the
climate change scenarios. For annual precipitation
most scenarios indicated a clear decrease between
40 and 140 mm (Gerstengarbe et al., 1999).
2.4. Data
FORSKA-M requires soil and groundwater infor-
mation, which were derived from the map ground-
water table produced by the WASY Gmbh
(Gesellschaft fur wasserwirtschaftliche Planung und
Systemforschung mbH) and the digital soil map of
Germany (Bodenubersichtskarte der Bundesrepublik
Deutschland 1:1,000,000, BUK 1000) generated by
the Federal Institute for Geosciences and Natural
Resources (BGR), Hannover (cf. Lasch et al.,
1999). It was assumed that soil conditions and depth
of water table remain unchanged under climate
change. Furthermore, the CORINE land use map of
Germany (Statistisches Bundesamt Wiesbaden) was
used.
The simulation of managed forests is based on the
inventory data of the ‘‘Okologische Waldzustandskon-
trolle’’, a forest health monitoring program of former
East Germany. The 488 data sets were selected which
included stand data as number of tree strata, number,
age, mean height and diameter of trees, basal area of
strata for 1990. The selected sites are representative
for the forests of Brandenburg. Most of them are pure
Scots pine stands (74%) with some mixed pine broad-
leaved stands (17%) and few beech and oak stands
(Fig. 1).
2.5. Evaluation of forest functions
The effects of vegetation changes and management
under current climate and climate change on different
forest functions (biodiversity, habitat value, and
groundwater recharge) were evaluated. The evaluation
of the impacts on forest functions was based on the
simulated vegetation responses of unmanaged and
managed forest ecosystems.
P. Lasch et al. / Forest Ecology and Management 162 (2002) 73–86 75
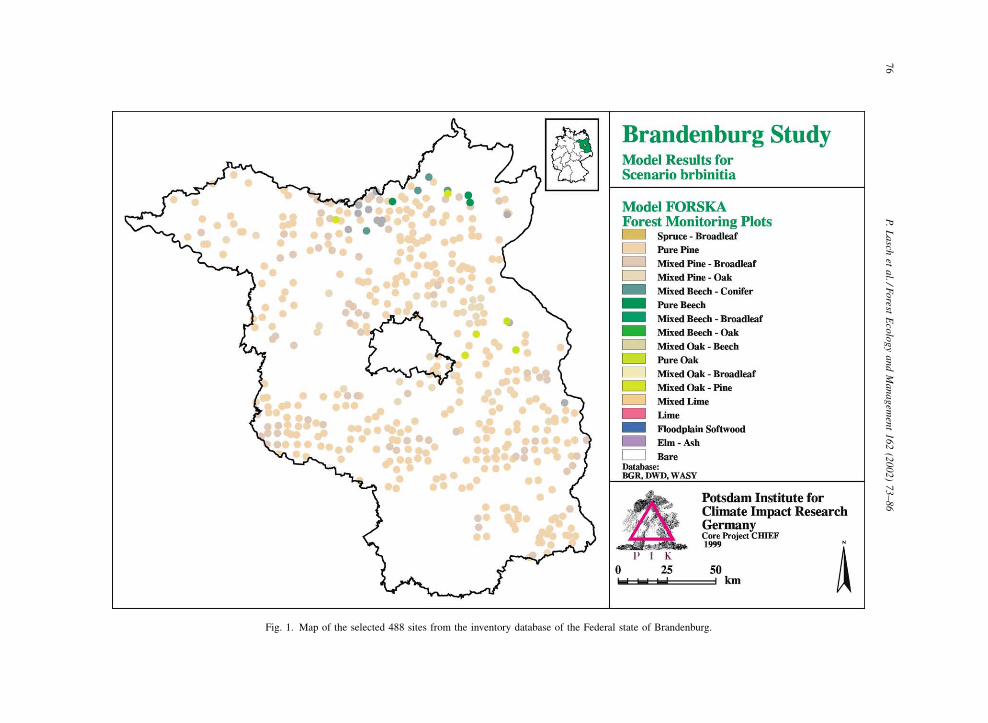
Fig. 1. Map of the selected 488 sites from the inventory database of the Federal state of Brandenburg.
76
P.
La
schet
al./F
orest
Eco
log
ya
nd
Ma
na
gem
ent
16
2(2
00
2)
73
–8
6

2.5.1. Biodiversity and habitat value
Species diversity and structural diversity were used
as indicators of the biodiversity and habitat values of
the forest stands. Two measures of species diversity
were applied. Both indices were derived from relative
biomass frequencies of tree species pi as independent
variables. The relative biomass frequencies were cho-
sen according to Kohl and Zingg (1996) and Swindel
et al. (1991). For the evaluation of model simulations
the proportion of biomass of a species gives a more
realistic view for the occurrence of the species in the
stand than the number of individuals because the
model is able to regenerate a lot of small trees every
year which do not live very long. The first index was
calculated using Shannon’s index H (Shannon, 1948),
a measure for the entropy of a finite probability field:
H ¼ �Xn
i¼1
pi ln pi where pi ¼Bi
Bi ¼ 1; . . . ; n
(1)
n is the number of species; Bi the share of biomass of
species i in total biomass; B the total biomass of stand.
The application of this index is based on the hypoth-
esis that a community of species is maximally diverse if
the species are equally distributed. In this case Shan-
non’s index has a maximum, which depends only on n.
The second measure of species diversity is Simp-
son’s index D (Simpson, 1949):
D ¼ 1 �Xn
i¼1
p2i (2)
This index varies from 0 to (1 � 1=n). D can simply be
interpreted as the probability that two randomly cho-
sen individual trees will be found to belong to the same
species type (Simpson, 1949). In contrast to Shannon’s
index H the maximum value of Simpson’s index D is
limited by 1, whereas, Shannon’s index increases with
the total number of species. D is mainly determined by
the frequency of the dominating species (Kohl and
Zingg, 1996).
To include an additional facet of diversity a struc-
tural diversity index of a forest stand, Ds was adopted
from expert knowledge of vegetation scientists (Seibert,
1980):
Ds ¼Dlay þ Dspec
2(3)
Dlay is a rating, which evaluates the occurrence of tree
and shrub layers and the height of ground vegetation.
It is calculated as a total sum of points corresponding
to the different existing layers of a forest according
to Table 1. The maximum number of Dlay is 5. Dspec is
defined as a rating calculated by the total number
of species of the stand according to Table 2. The
structural index varies for the considered forest types
between 1.5 (for example, pure beech stand) and 4.5
(hardwood/floodplain forest). All 27 forest types of
Brandenburg simulated by the model FORSKA-M
were characterised by the structural diversity index
using descriptions of forest ecosystems by vegetation
scientists (Seibert, 1980; Hofmann, 1997).
2.5.2. Groundwater recharge
Different methods of quantitative evaluation of the
groundwater recharge of forest ecosystems are possi-
ble. We used the annual percolation at 1 m soil depth
calculated by FORSKA-M. We assume that this value
approximates the annual groundwater recharge below
a forest stand.
2.6. Model application—natural and managed forests
The PNV was simulated for the whole area of
Brandenburg. The overlay of soil and groundwater
Table 1
Ratings of Dlay, which evaluates the layer structure of a forest stand
Occurrence of structure Rating (points)
First tree layer 1
Second tree layer 1
First shrub layer 1
Second shrub layer 0.5
Ground vegetation with height >30 cm 1
Ground vegetation with height <30 cm 0.5
Table 2
Ratings of Dspec, which evaluates number of species in the
structural index according to (Seibert, 1980)
Species number Rating (points)
1–10 1
11–20 2
21–30 3
31–40 4
>40 5
P. Lasch et al. / Forest Ecology and Management 162 (2002) 73–86 77

data with the land use map using a geographic infor-
mation system (GIS) resulted in 648 polygons with
different site conditions. Climate data were assigned
to the polygons from the nearest of the 40 climatolo-
gical stations. The model simulated 600 years of forest
growth starting from bare patches without trees. For
each polygon a steady-state species composition was
calculated as aggregated value of the simulation runs
by averaging the model output of the years 400–600 on
50 replicated patches. The species composition was
classified by the dominant species with respect to
standing biomass into 27 forest types similar to those
of the German forest inventory.
In order to analyse the impact of climate change and
management strategies on managed forests FORSKA-
M was applied at 488 sites of the forest inventory data
set. The model was initialised with the inventory
data by means of a structure generator, which supplies
the model specific stand data input (Lindner, 2000).
The simulations were carried out for 110 years (1990–
2100) with two climate scenarios (Section 2.3) com-
bined with three management scenarios (Section 2.2).
In this experiment, the simulated output variables like
biomass and groundwater recharge were averaged
over the last 20 years and analogously classified as
in the case of PNV simulations.
The simulation tool SPRINT-S (Flechsig, 1998)
was used to execute the model runs on a parallel
computer system (SP2) and to supply data sets for
the visualisation of the results in the GIS. A more
detailed description of the methodology of these
simulations can be found in Lasch et al. (1999).
3. Results
3.1. Impacts on natural forests
3.1.1. Impacts on forest composition and productivity
Fig. 2 presents maps of simulated forest types under
current climate and the climate change scenario. Under
current climate, FORSKA-M simulated beech and
beech–oak forests in the north-west of Brandenburg
as well as in few scattered sub-regions in the south
of the state. Pine forests occurred only on the sites
poorest in nutrients. Mixed forests dominated
mainly by oak covered the rest of the area. With
increasing temperature (>1.5 K) the abundance of
beech decreased significantly. Most forests were com-
posed of drought tolerant species such as pine, oak,
hornbeam and lime, the latter two on fertile sites.
3.1.2. Impacts on other forest functions
The species diversity as evaluated with Shannon’s
index (Fig. 3) of most simulated plots decreased
strongly. Under current climate Shannon’s index var-
ied from 0. to 1.74 (corresponding to seven species)
but under climate change the upper limit decreased to
1.59. The mean value over all forest areas decreased
from 0.93 to 0.64. Rather uniform stands of lime on
fertile sites and oak and pine on pure sites caused this
decrease in simulated diversity.
A comparison of groundwater recharge under both
climate scenarios is given in Fig. 4. Regional differ-
ences were large under current climate with annual
averages varying from 0 to 148 mm. The temperature
increase and the precipitation decrease of the climate
change scenario caused a distinct decrease in the
average annual groundwater recharge in comparison
with the current climate simulation on almost all
plots. The overall average of groundwater recharge
decreased from 39 to 9 mm and the maximum value
from 148 to 60 mm. The share of areas without any
groundwater recharge increased.
3.2. Impacts on managed forests
3.2.1. Forest composition and productivity
Aggregated results regarding the productivity of the
488 investigated forest stands after 110 years simula-
tion time are given by Table 3. Under the climate
change scenario the average productivity of all stands
decreased with all management strategies. Most simu-
lated stands were less productive under climate change
compared with the current climate and had lower
standing biomass. The reduction of average standing
biomass varied from 53% (MS2) to 67% (MS1). For
each climate scenario there were only slight differ-
ences in biomass comparing the three management
scenarios. Adaptive management (MS2) produced
greater standing biomass at the end of the simulation
period under current climate than the other manage-
ment strategies (14% gain in comparison with MS1,
5% gain in comparison with MS3). Under climate
change forests generated by MS1 had more average
biomass at the end of the simulation period than
78 P. Lasch et al. / Forest Ecology and Management 162 (2002) 73–86

Fig. 2. Maps of the GIS-based simulated PNV under current climate (left) and climate change (right).
P.
La
schet
al./F
orest
Eco
log
ya
nd
Ma
na
gem
ent
16
2(2
00
2)
73
–8
67
9

forests generated by the adaptive and the maximising
management strategies (MS2, MS3).
Table 4 presents a comparison of biomass losses
and gains for the 488 stands. Relative biomass per
stand at the end of the simulation period was calcu-
lated by dividing biomass under climate change by
biomass per stand under current climate. Regardless
Fig. 3. Maps of the Shannon index calculated from the GIS-based simulations of PNV under current climate (left) and climate change (right).
Fig. 4. Maps of groundwater recharge (mm) calculated from the GIS-based simulations of PNV under current climate (left) and climate
change (right).
Table 3
Average biomass (t/ha) of all 488 inventory stands under two
climate scenarios S0 and S2 and three management scenarios
MS1 MS2 MS3
S0 146.91 167.50 160.03
S2 98.09 89.41 90.32
80 P. Lasch et al. / Forest Ecology and Management 162 (2002) 73–86

of management, in about 80% of all stands biomass
was reduced under climate change. Some stands with
low productivity showed higher biomass at the end of
the simulation period (relative biomass >1). This may
be caused by a delayed harvesting of the stands under
temperature increase and low precipitation.
Table 5 summarises simulated forest types for all
scenario simulations (three management scenarios
combined with two climate scenarios). All simulated
forest types were aggregated into nine types of forest
stands. Most forest stands of the inventory plots were
pine or pine dominated stands. The management
scenario 1 generated only little changes in simulated
forest types under climatic change compared to cur-
rent climate. Under both climate scenarios, the domi-
nant role of pine forests was preserved. Additionally, a
slight share of hardwood forests including lime, horn-
beam and oak forests was present. Under both climate
scenarios, the adaptation management scenario (MS2)
generated mainly oak forests and a smaller share of
birch forests. In the case of the species maximising
scenario (MS3) mainly hardwood forests developed
with hornbeam, lime, elm, ash, and oak forests. It is
remarkable that beech disappeared completely under
the climate change scenario and the management
scenarios MS2 and MS3 increased the share of decid-
uous species.
Generally, every management scenario simulated
similar forest types for current climate and the climate
change scenario.
3.2.2. Impacts on other forest functions
Three diversity indices were calculated for the
scenario experiment. They were averaged over all
488 stands (Table 6). All indices showed an increasing
average species diversity of simulated stands in com-
parison with the average species diversity of the stand
initialisation. Both Shannon’s and Simpson’s index
declined in the case of climate change, whereas,
Seibert’s index increased. The decrease was caused
by the change of simulated forest type towards rather
uniform stands with lime on fertile sites (MS3) or
birch on less fertile sites. Because the lime forest is
rich in shrubs and herbaceous species, Seibert’s index
increased for those stands. Fig. 5 exemplifies cumu-
lative frequencies of Shannon’s index, which demon-
strate the increasing share of stands with lower species
diversity under climate change for all management
scenarios. The model simulations with management
scenario MS2 under current climate indicated that
<30% of the stands had a Shannon index �0.1 but
Table 4
Frequencies of relative biomass (biomass under climate change
(S2) divided by biomass under current climate (S0) per stand) for
three management scenarios
Relative biomass MS1 MS2 MS3
0.5 184 219 211
1 174 173 194
1.5 72 48 50
2 23 27 15
2.5 9 9 4
3 10 4 2
3.5 3 3 4
4 4 3 2
>4 9 2 6
Table 5
Occurrence of forest types at all 488 inventory sites after 110 years for current climate (S0) and climate change (S2) and the management
scenarios MS1, MS2, MS3, the column initialisation shows the forest types of initialisation
Forest type Current climate (S0) Climate scenario (S2) (>1.5 K)
Initialisation MS1 MS2 MS3 MS1 MS2 MS3
Pure Scots pine 360 154 0 1 237 0 4
Mixed pine–broadleaf 83 189 9 184 132 20 131
Beech forests 13 29 15 50 0 2 0
Oak forests 7 30 234 86 29 286 145
Mixed oak–pine 3 3 55 34 12 90 40
Birch forests 0 32 147 1 35 65 0
Hardwoods 0 30 20 118 23 16 151
Other forests 19 14 0 5 10 0 0
Bare patches 3 7 8 9 10 9 17
P. Lasch et al. / Forest Ecology and Management 162 (2002) 73–86 81

under climate change the share increased to >40%.
The other management scenarios produced similar
shifts between current climate and climate change
but differed in the frequency distribution of species
diversity.
The average annual groundwater recharge over 488
inventory plots after 110 years of simulation was
significantly reduced under climate change (Table 7).
The reduction varied from 33% (MS1) to 37% (MS2)
with similar trends under all management scenarios.
The number of plots with a very low annual ground-
Table 6
Shannon, Simpson and Seibert’s index averaged for the 488
inventory sites after 110 years for current climate (S0) and climate
change (S2) and the management scenarios MS1, MS2, MS3
Shannon Simpson Seibert
Initialisation 0.17 0.10 2.39
MS1/S0 0.54 0.28 2.50
MS1/S2 0.5 0.30 2.70
MS2/S0 0.68 0.35 2.40
MS2/S2 0.48 0.27 2.40
MS3/S0 1.23 0.63 3.10
MS3/S2 0.93 0.53 3.20
Fig. 5. Cumulative frequencies of Shannon’s index calculated for the three management scenarios MS1, MS2, MS3 under current climate (S0)
and climate change (S2).
Table 7
Average annual groundwater recharge of all inventory plots
Current climate Climate scenario (1.5 K)
Mean Minimum Maximum Mean Minimum Maximum
MS1 52.6 0 186.4 17.6 0 138.2
MS2 55.3 0 188.6 21.1 0 115.1
MS3 51.8 0 197.2 17.8 0 126.6
Mean: mean value of annual groundwater recharge of 488 plots (mm); minimum: minimum value of groundwater recharge of 488 plots (mm);
maximum: maximum value of groundwater recharge of 488 plots (mm).
82 P. Lasch et al. / Forest Ecology and Management 162 (2002) 73–86

water recharge, below 0.5 mm, increased from 13 to
104 plots averaging over all management scenarios.
4. Discussion
Forest management in central Europe is facing
difficult decisions. It is currently not possible to make
reliable forecasts of the regional climate for the next
century. Nevertheless, the forests, which are regener-
ated today, will most probably grow under changing
environmental conditions. The presented simulation
study suggests that a temperature increase of 1.5 K
may have strong impacts on forest productivity and the
competitive relationships between different tree spe-
cies in Brandenburg. The impacts of climate warming
on forest growth are mainly negative in this region,
because changes in the water balance will lead to
increased drought stress. Other simulation studies
have shown that, for example, in northern Europe
where water limitations are less important, climate
warming may enhance forest productivity (Kellomaki
and Kolstrom, 1993; Kellomaki et al., 1993). Simula-
tion studies with a variety of climate change scenarios
have indicated that positive growth responses could
also occur in temperate forests if increasing precipita-
tion balances the increased evaporative demand under
elevated temperatures (Bugmann, 1997; Lindner et al.,
1997a).
Climatic change will not only affect the composi-
tion and growth of the forests; it will also influence
other forest functions. We enhanced the analysis of
impacts on forest functions which was based on the
simulations of potential natural forest conditions
(Lindner et al., 2000) by an analysis of impacts on
forest functions based on simulations of managed
forest stands. The results indicate that the simulated
shifts in the species composition would be associated
with a reduction in species diversity and habitat value.
Furthermore, groundwater recharge decreased in the
case of the climate change scenario. Hence, the total
impact of climatic change may imply more than
vegetation changes alone.
Most of the methods to evaluate the impacts of
climate change on other forest functions were origin-
ally designed for other purposes. They have typically
been applied to stand scale investigations under cur-
rent climatic conditions and, therefore, there are clear
limitations, which should be kept in mind when
interpreting the results of the regional impact assess-
ment. The used soil water model is only applicable at
sites with low groundwater table because capillary rise
of water was ignored. The rooting depth was consid-
ered to extent down to 1 m soil depth.
The habitat diversity, for example, was evaluated
using indicator species and empirical data from
detailed forest ecosystem analysis. It is unknown,
however, if the rich flora and fauna of mixed hardwood
forests could re-establish in impoverished Scots pine
forests.
The soil water model implemented in FORSKA-M
calculates the soil water percolation out of the given
soil layers on sites with low groundwater table. It was
validated and tested as a part of the FORSANA pine
model (Grote and Suckow, 1998). The application
of the model to calculate groundwater recharge allows
the consideration of climate change scenarios, because
the model calculates the water budget depending on
temperature and precipitation conditions including the
calculation of evapotranspiration rates, which respond
to the changing climate.
At present, the forests of Brandenburg are still
dominated by managed Scots pine stands and natural
forests are rare. However, with an increasing impor-
tance of tourism and a high percentage of national
parks and other protected landscapes in the state,
forest reserves as well as the biological diversity
and amenity values of forests receive more attention
than in the past.
The application of the model FORSKA-M for
simulation of PNV and of managed forests supplied
information about the competitiveness of different tree
species. Results of both simulation experiments
stressed the hazard of beech under the assumed cli-
mate change and suggested that other deciduous tree
species may benefit from this change. The evaluation
of forest functions from results of both the experi-
ments supplied similar results. Analysing Shannon’s
index it has to be stated that the climate change
scenario led to a decrease in species diversity due
to the fact that the simulated forest types of PNV or
managed forests are rather uniform with a lower
number of species and one dominating tree species.
The evaluation of biodiversity by the used indices was
limited to the evaluation of tree species and structural
diversity.
P. Lasch et al. / Forest Ecology and Management 162 (2002) 73–86 83

The analysis of effects of climate change on ground-
water recharge indicated that the decreasing precipita-
tion and increasing temperatures will lead to a
reduction of percolation rates and finally of ground-
water recharge in consequence of increasing transpira-
tion demand. Furthermore, the percolation calculation
under both PNV and managed forests indicated that
the share in forest areas without groundwater recharge
will increase under climate change. All this may have
unfavourable consequences for the regional water
balance in Brandenburg which is already critical
today.
Forest management needs to respond to climatic
change because projected shifts in the natural species
composition (as indicated by the simulated PNV) will
restrict the choice of suitable species that can be
cultivated at a specific location in the future. Further-
more, the productivity of existing and future forest
stands will also be influenced by changes in the
climate. While most species in the investigated forest
stands tolerate the projected scenarios of climate
change, there are clear responses in terms of simulated
biomass production. The average simulated biomass
on all stands of the inventory data sets decreased under
the climate change. Previous analyses of the transient
behaviour of biomass development indicated that on
fertile soils an adaptive management might be able to
more than compensate for the reduced productivity of
drought sensitive species (Lindner, 1999). Moreover,
increased biomass production on some sites led to a
shortage of thinning period that induced an additional
thinning at the end of the simulation period. In this
case, the average biomass of the last 20 years of
simulation period is very low. On poor sandy soils
even the stress tolerant pine responded to the climate
change scenario with reduced biomass production.
The productivity related results under different cli-
mate and management scenarios were not always
conclusive. We used standing biomass as an indicator
of productivity and, in most sites, we observed a clear
response of the simulated biomass to the climate
change scenario. However, when different manage-
ment scenarios were compared, it became obvious that
decreased growth sometimes will lead to delayed
thinning and harvesting schedules. Because we com-
pared the average biomass over the last 20 simulation
years, the standing biomass during this period may be
higher in a low productivity scenario if this postpones
stand harvesting long enough. More direct measures
of productivity like NPP or mean annual stand growth
would, therefore, produce more meaningful results
under such circumstances. While FORSKA-M could
be used to generate growth related information, there
has been only very limited evaluation of forest gap
models in this respect. For more detailed analyses of
productivity effects of climate change it is recom-
mended to apply process-based models (Friend et al.,
1997; Makela et al., 2000; Thornley and Cannell,
2000).
Nevertheless, forest management retains a consid-
erable choice of management options under climate
change and different management strategies are fea-
sible. Each strategy implies different consequences for
the forests and their functions considered above.
Therefore, not only impacts on biomass production
but also on water balance and species diversity need to
be considered in the decision making process of the
forest management. The regional application of three
management scenarios demonstrates the possibilities
of analysing alternative strategies with regard to
impacts on different forest functions under the climate
change.
5. Conclusions
The extended model FORSKA-M allows an assess-
ment of forest dynamics and functioning under chan-
ging climatic conditions and management. While
simulated long-term impacts of climate change on
the potential natural forest composition show drastic
changes in species composition in Brandenburg as
well as in groundwater recharge and species diversity,
the analysis of impacts on managed forests indicates
that the future development (until the year 2100) may
depend strongly on stand composition and site char-
acteristics as well as management strategies. The
results underline the gain of information by evaluation
of management strategies regarding impacts on pro-
duction in connection with impacts on secondary
values of forests.
A regional assessment taking into account the con-
sequences of both climate change and management on
the productivity of forests and their functions consider-
ing species diversity and groundwater recharge seems
to be necessary as first step towards recommendations
84 P. Lasch et al. / Forest Ecology and Management 162 (2002) 73–86

and implications for the forest planning authorities
that helps them cope with climate change.
References
Botkin, D.B., Janak, J., Wallis, J., 1972. Some ecological
consequences of a computer model of forest growth. J. Ecol.
60, 849–872.
Bugmann, H., 1997. Sensitivity of forests in the European Alps to
future climatic change. Climate Res. 8, 35–44.
Bugmann, H.K.M., 1996. A simplified forest model to study
species composition along climate gradients. Ecology 77,
2055–2074.
Flechsig, M., 1998. SPRINT-S: a parallelization tool for experi-
ments with simulation models. Potsdam Institute for Climate
Impact Research, PIK-Report 47, 66 pp.
Friend, A.D., Stevens, A.K., Knox, R.G., Cannell, M.G.R., 1997. A
process based, terrestrial biosphere model of ecosystem
dynamics (hybrid v3.0). Ecol. Modelling 95, 249–287.
Gerold, D., 1990. Modellierung des Wachstums von Waldbestan-
den auf der Basis der Durchmesserstruktur. Dissertation B,
Technische Universitat Dresden, 174 pp.
Gerstengarbe, F.-W., Werner, P.C., Lindner, M., Bruschek, G.,
1999. Estimation of future forest fire development in the state
of Brandenburg. Int. For. Fire News 21, 91–93.
Grote, R., Suckow, F., 1998. Integrating dynamic morphological
properties into forest growth modelling. Part I. Effects on water
balance and gas exchange. For. Ecol. Manage. 112, 101–119.
Hofmann, G., 1997. Mitteleuropaische Wald- und Forst-Okosys-
temtypen in Wort und Bild. AFZ/Der Wald, Sonderheft, 85.
Kattenberg, A., Giorgi, F., Grassl, H., Meehl, G.A., Mitchell, J.F.B.,
Stouffer, R.J., Tokioka, T., Weaver, A.J., Wigley, T.M.L., 1996.
Climate models—projections of future climate. In: Houghton,
J.T., Meira Filho, L.G., Callander, B.A., Harris, N., Kattenberg,
A., Maskell, K. (Eds.), Climate Change, 1995. The Science of
Climate Change. Contribution of WG I to the 2nd Assessment
Report of the IPCC. Cambridge University Press, Cambridge,
pp. 285–357.
Kellomaki, S., Kolstrom, M., 1993. Computations on the yield of
timber by Scots pine when subjected to varying levels of
thinning under changing climate in southern Finland. For. Ecol.
Manage. 59, 237–255.
Kellomaki, S., Vaisanen, H., Strandman, H., 1993. Finnfor: a model
for calculating the response of boreal forest ecosystem to climate
change. University of Joensuu, Faculty of Forestry, 120 pp.
Kirschbaum, M.U.F., Fischlin, A., Cannell, M.G.R., Cruz, R.V.O.,
Cramer, W.P., 1996. Climate change impacts on forests. In:
Watson, R.T., Zinyowera, M.C., Moss, R.H. (Eds.), Climate
Change 1995. Impacts, Adaptation and Mitigation of Climate
Change: Scientific–technical Analyses. Contribution of WG II
to the Second Assessment Report of the IPCC. Cambridge
University Press, Cambridge, pp. 95–129.
Kohl, M., Zingg, A., 1996. Eignung von Diversitatsindizes bei
Langzeituntersuchungen zur Biodiversitat in Waldbestanden.
Allg. Forst-u. J.-Ztg. 167, 76–85.
Korner, C., 1996. The response of complex multispecies systems to
elevated CO2. In: Walker, B.H., Steffen, W.L. (Eds.), Global
Change and Terrestrial Ecosystems. Cambridge University
Press, Cambridge, pp. 20–42.
Lasch, P., Lindner, M., Ebert, B., Flechsig, M., Gerstengarbe, F.-
W., Suckow, F., Werner, P.C., 1999. Regional impact analysis of
climate change on natural and managed forests in the Federal
state of Brandenburg, Germany. Environ. Modelling Assess-
ment 4, 273–286.
Lasch, P., Suckow, F., Burger, G., Lindner, M., 1998. Sensitivity
analysis of a forest gap model concerning current and future
climate variability. In: Beniston, M., Innes, J. (Eds.), The
Impacts of Climate Variability on Forests. Springer, Heidel-
berg, pp. 273–288.
Leemans, R., 1992. Simulation and future projection of succession
in a Swedish broad-leaved forest. For. Ecol. Manage. 48,
305–319.
Lindner, M., 1999. Forest management strategies in the context of
potential climate change (German). Forstwissenschaftliches
Centralblatt 118, 1–13.
Lindner, M., 2000. Developing adaptive forest management
strategies to cope with climate change. Tree Physiol. 20,
299–307.
Lindner, M., Bugmann, H., Lasch, P., Flechsig, M., Cramer, W.,
1997a. Regional impacts of climatic change on forests in the
state of Brandenburg, Germany. Agric. For. Meteorol. 84, 123–
135.
Lindner, M., Lasch, P., Wenzel, A., Erhard, M., 2000. Scenarios of
the regional impacts of climate change on forests in the Federal
state of Brandenburg, Germany. In: Proceedings of Fifth
International Congresses, Factor Forest: The International
Dialogue in Luneburg Heath—1998–2000, Congress Forests
and Atmosphere–Water–Soil. CD-ROM. Alfred Topfer Akade-
mie fur Naturschutz/AID e.V., Soltau, Germany.
Lindner, M., Sievanen, R., Pretzsch, H., 1997b. Improving the
simulation of stand structure in a forest gap model. For. Ecol.
Manage. 95, 183–195.
Lutzke, R., 1991. Bestandesklima und Wasserhaushalt in Kiefern-
bestanden des nordostdeutschen Tieflandes. Forschungsanstalt
fur Forst- und Holzwirtschaft, Berichte aus Forschung und
Entwickung 25, 4–20.
Makela, A., Landsberg, J., Ek, A.R., Burk, T.E., Ter-Mikaelian, M.,
Agren, G.I., Oliver, C.D., Puttonen, P., 2000. Process-based
models for forest ecosystem management: current state of the
art and challenges for practical implementation. Tree Physiol.
20, 289–298.
Prentice, I.C., Sykes, M.T., Cramer, W., 1993. A simulation model
for the transient effects of climate change on forest landscapes.
Ecol. Modelling 65, 51–70.
Price, D.T., Apps, M.J., 1996. Boreal forest responses to climate-
change scenarios along an ecoclimatic transect in central
Canada. Climatic Change 34, 179–190.
Seibert, P., 1980. Okologische Bewertung von homogenen
Landschaftsteilen, Okosystemen und Pflanzengesellschaften.
Berichte der ANL 4, 10–23.
Shannon, C.E., 1948. The mathematical theory of communication.
In: Shannon, C.E., Weaver, W. (Eds.), The Mathematical
P. Lasch et al. / Forest Ecology and Management 162 (2002) 73–86 85

Theory of Communication. University of Illinois Press, Urbana,
pp. 3–91.
Shugart, H.H., 1984. A Theory of Forest Dynamics. Springer, New
York, pp 278.
Simpson, E.H., 1949. Measurement of diversity. Nature 163,
688.
Solomon, A.M., Ravindranath, N.H., Stewart, R.B., Weber, M.,
Nilsson, S., 1996. Wood production under changing climate
and land use. In: Watson, R.T., Zinyowera, M.C., Moss, R.H.
(Eds.), Climate Change 1995. Impacts, Adaptation and
Mitigation of Climate Change: Scientific–technical Analyses.
Contribution of WG II to the Second Assessment Report of
the IPCC. Cambridge University Press, Cambridge, pp. 487–
510.
Stock, M., Toth, F. (Eds.), 1996. Mogliche Auswirkungen von
Klimaanderungen auf das Land Brandenburg. Potsdam Institute
for Climate Impact Research, Potsdam, pp 166.
Swindel, B.F., Smith, J.E., Abt, R.C., 1991. Methodology for predicting
species diversity in managed forests. For. Ecol. Manage. 40, 75–85.
Thornley, J.H.M., Cannell, M.G.R., 2000. Managing forests for
wood yield and carbon storage: a theoretical study. Tree
Physiol. 20, 477–484.
Werner, P.C., Gerstengarbe, F.-W., 1997. A proposal for the
development of climate scenarios. Climate Res. 8, 171–182.
86 P. Lasch et al. / Forest Ecology and Management 162 (2002) 73–86