Input Constraints Handling in an MPC/Feedback Linearization Scheme
Upload
khangminh22Category
view
3download
0
REGION 11 Hazard Mitigation Plan
2017 Update for Brooke and Hancock Counties
and the municipalities therein

REGION 11
HAZARD MITIGATION PLAN
RELEASED 2017
FOR BROOKE AND HANCOCK COUNTIES AND THE MUNICIPALITIES THEREIN

i
Region 11 Hazard Mitigation Plan Table of Contents
TABLE OF CONTENTS LIST OF TABLES………………………………………………………………….…………………. 1.0 INTRODUCTION ……………………………………………………………………………….
1.1 The Planning Process………………………………………………………………………
1.1.1 Current Update Process………………………………………………….
1.1.2 Steering Committee Involvement…………………………………….………..
1.1.3 Engaging the Public……………………………………………..………….
1.1.4 Research Conducted……………………………………………………….
1.1.5 Implementing the Plan and Monitoring the Process……………………
1.2 Description of the Planning Area……………………………………………………..…….
1.2.1 County Geography……………………………………………………..…….
1.2.2 County Demographics…………………………………………………….
1.2.3 Economy……………………………………………………………………..
1.2.4 Transportation……………………………………………..……………….
1.2.5 Medical Access……………………………………………………….……….
1.2.6 Utilities…………………………………………………………………………..
1.2.7 Jurisdictional Capabilities………………………………………………….
1.2.8 Disaster Declarations in Brooke and Hancock Counties……………….
2.0 RISK ASSESSMENT…………………………………………………………………………….. 2.1 Hazards & Vulnerability…………………………………………………………………….
2.1.1 Hazard Analysis……………………………………………………………
2.1.2 Hazard Identification……………………………………………………….
2.1.3 Probability vs. Severity………………………………….………………..
2.1.4 Complicating Variables…………………………………………………….
2.1.5 Hazards and Climate Change………………………………..……………
2.1.6 Public Health and Social Vulnerability………………………….…………
2.1.7 Hazard Snapshots…………………………………………………………
2.2 Profile Hazards………………………………………………………………..……………….
2.2.1 Acts of Violence…………………………………………….…………………..
iv
1
2
2
3
6
7
8
9
9
11
12
13
15
15
16
17
19
20
20
20
21
24
25
26
29
37
38

ii
Region 11 Hazard Mitigation Plan Table of Contents
2.2.2 Dam Failure……………………………………………….……………………..
2.2.3 Drought………………………………………………………………………..
2.2.4 Earthquakes…………………………………………………………………
2.2.5 Extreme Temperatures………………………………………………………
2.2.6 Flood……………………………..…………………………………………
2.2.7 Hazardous Materials…………………………………………………………
2.2.8 Mass Movements…………………………………………………………….
2.2.9 Radiological……………………………………………………………………….
2.2.10 Severe Weather………………………………………………………………..
2.2.11 Wildfire……………………………….……………………………………………
2.3 Inventory Assets……………………………………………………………………………..
2.3.1 Asset Inventory……………………………………………………………
2.4 Analyze Development Trends………….………………………………………………….
3.0 ACTION PLAN………………………………………………………………………………….. 3.1 Local Hazard Mitigation Goals…………………………….………………………………
3.1.1 Setting and Prioritizing Goals………………………………………………
3.2 Project Implementation……………………………………………………………………….
4.0 PLAN MAINTENANCE…………………………………………………………………………. 4.1 Monitoring, Evaluating and Updating the Plan……………………………………………….
4.2 Plan Addendums……………………………………………………………………………..
4.3 Implementation Through Existing Programs/Capabilities Assessment………………
4.4 Continued Public Involvement……………………………………………………………..
5.0 APPENDICES…………………………………………………………………………………….
Appendix 1: Meeting Documentation…………………………………………………………….
Appendix 2: Public Survey……………………………………………………………………….
Appendix 3: Citations ……………………………………………………………………………
Appendix 4: Inactive Projects…………………………………………………………………….
Appendix 5: Hazmat and Health……………………………………………………………….
44
54
60
66
72
89
95
103
107
114
119
122
138
143
144
144
147
165
165
167
167
168
170
171
314
350
355
388

iii
Region 11 Hazard Mitigation Plan Table of Contents
Appendix 6: NFIP Surveys………………………………………………………………….
Adopting Resolutions……………………………………………………………………..……
396
424

iv
Region 11 Hazard Mitigation Plan Table of Contents
LIST OF TABLES
1.0 INTRODUCTORY MATERIALS
1.1 Region 11 Planning Committee Representation…………………………………………
1.2 Region 11 Steering Committee……………………………………………………….……
1.3 Meetings……………………………………………………………………………………….
1.4 Referenced Documents…………………………………………………………………….
1.5 Municipalities………………………………………………………………………..………..
1.6 Region 11 Demographics…………………………………………………………………..
1.7 Utility Services in Region 11…………………………………………………………..…..
1.8 Jurisdictional Capabilities……………………………………………………………………
1.9 Emergency/Disaster Declarations in Brooke and Hancock Counties since 2010…..
2.0 RISK ASSESSMENT 2.1 Probability……………………………………………………………………………………..
2.2 Severity……………………………………………………………………………………….
2.3 Risk Assessment Matrix………………………………………………………………………
2.4 Risk Assessment Matrix with Hazards……………………………………………………..
2.5 Hazard Snapshots……………………………………………………………………………….
2.6 Dams in Region 11………………………………………………………………………….
2.7 Palmer Drought Severity Index…………………………………………………………….
2.8 USDA Survey and Census Information (2002-2016)………………………………………
2.9 Modified Mercalli Scale………………………………………………………………………
2.10 Extreme Temperatures…………………………………………………………………………
2.11 Communities Participating in the NFIP…………………………………………………..
2.12 Floods in Region 11……………………………………………………………………….
2.13 Property Losses……………………………………………………………………………..
2.14 Expected Building Damage by Occupancy – Hancock County……………….……..
2.15 Expected Building Damage by Building Type – Hancock County……………………….
2.16 Building-Related Economic Loss Estimates – Hancock County………………………
2.17 Expected Building Damage by Occupancy – Hancock County……………….……..
2.18 Expected Building Damage by Building Type – Hancock County……………………….
2.19 Building-Related Economic Loss Estimates – Hancock County………………………
2.20 Hazmat Incidents (1990-2015)………………………………………………………………
3
3
4
7
9
12
15
17
18
22
23
23
23
31
47
54
58
60
69
73
75
78
79
79
79
80
80
80
90

v
Region 11 Hazard Mitigation Plan Table of Contents
2.21 Superfunds and Brownfields……………………………………………………………..
2.22 Severe Weather……………………………………………………………………………..
2.23 Brooke County Assets……………………………………………………………………….
2.24 Hancock County Assets……………………………………………………………………
2.25 Beech Bottom Assets………………………………………………………………………
2.26 Bethany Assets……………………………………………………………………………….
2.27 Chester Assets……………………………………………………………………………….
2.28 Follansbee Assets…………………………………………………………………………….
2.29 New Cumberland Assets……………………………………………………………………
2.30 Weirton Assets………………………………………………………………………………
2.31 Wellsburg Assets…………………………………………………………………………….
2.32 Windsor Heights Assets…………………………………………………………………..
3.0 ACTION PLAN 3.1 Original Goal Prioritization Voting Results…………………………………………………
3.2 Region 11 Original Hazard Mitigation Goals…………………………………………………
3.3 Region 11 Final Hazard Mitigation Goals…………………………………………………..
3.4 Region 11 Projects………………………………………………………………………………
3.5 Brooke County Projects…………………………………………………………………….
3.6 Hancock County Projects……………………………………………………………………….
3.7 Beech Bottom Projects…………………………………………………………………………
3.8 Bethany Projects………………………………………………………………………………..
3.9 Chester Projects…………………………………………………………………………………
3.10 Follansbee Projects…………………………………………………………………………..
3.11 New Cumberland Projects……………………………………………………………………
3.12 Weirton Projects………………………………………………………………………………
3.13 Wellsburg Projects……………………………………………………………………………..
3.14 Windsor Heights Projects………………………………………………………………
4.0 PLAN MAINTENANCE 4.1 Other Plan Integration with Hazard Mitigation……………………………………………..
5.0 APPENDICES 5.1 Brooke-Hancock Regional Council……………………………………………………………
91
112
122
123
124
125
126
127
129
131
134
137
145
145
146
149
151
154
155
156
157
158
160
161
163
164
168
173

vi
Region 11 Hazard Mitigation Plan Table of Contents
5.2 Steering Committee Meeting Attendance…………………………………………………
5.3 Steering Committee Email Log for Hazard Mitigation Plan………………………………
5.4 Steering Committee Phone Log……………………………………………………………
5.5 Public Attendance at Meetings……………………………………………………………..
5.6 Region 11 Inactive Projects…………………………………………………………………
5.7 Brooke County Inactive Projects……………………………………………………………
5.8 Hancock County Inactive Projects……………………………………………………………
5.9 Beech Bottom Inactive Projects……………………………………………………………..
5.10 Bethany Inactive Projects……………………………………………………………………
5.11 Follansbee Inactive Projects………………………………………………………………….
5.12 New Cumberland Inactive Projects…………………………………………………………….
5.13 Weirton Inactive Projects………………………………………………………………………
5.14 Wellsburg Inactive Projects……………………………………………………………………
5.15 Windsor Heights Inactive Projects…………………………………………………………..
5.16 Inorganic Contaminants Found in Groundwater……………………………………………
5.17 Organic Contaminants Found in Groundwater…………………………………………….
5.18 Microbiological Contaminants Found in Groundwater…………………………………….
5.19 Physical Characteristics of Groundwater………………………………………………….
5.20 Petroleum Constituents in Groundwater…………………………………………………
5.21 Health Effects of Extremely Hazardous Substances……………………………………
189
190
193
310
356
356
363
370
373
376
379
380
382
385
388
391
391
391
393
395

1
Region 11 Hazard Mitigation Plan 1.0 Introduction
1.0 INTRODUCTION
This section presents an introduction to the hazard mitigation plan and defines the
authority, scope and purpose of the plan.
Plan Introduction
The Region 11 Hazard Mitigation Plan details natural and human-caused hazards
that threaten Brooke and Hancock Counties and its various municipalities. The plan fulfills
the requirements set forth by the Disaster Mitigation Act of 2000 (DMA, 2000). This Act
requires counties to formulate a hazard mitigation plan in order to be eligible for mitigation
funds made available by the Federal Emergency Management Agency (FEMA).
Plan Authority
This multi-jurisdictional plan has been completed in accordance with Section 322 of
the Robert T. Stafford Disaster Relief and Emergency Assistance Act, as enacted by Section
104 of the Disaster Mitigation Act of 2000. The guidelines for the completion of this plan
appear in the Code of Federal Regulations under Title 44: Emergency Services, Part 201.6.
Specific reference is made to the Local Mitigation Planning Handbook (USDHS/FEMA,
2013).
Plan Scope
The Region 11 Hazard Mitigation Plan includes all unincorporated areas of Brooke
and Hancock Counties as well as the incorporated areas of all municipalities within the
counties. All hazards that have or can affect the residents of Brooke and Hancock Counties
have been analyzed. Hazard mitigation objectives, goals and projects are discussed, as are
project lead agencies and potential funding sources.
Plan Purpose
The purpose of the Region 11 Hazard Mitigation Plan is to identify and evaluate all
natural and human-caused hazards that can and may affect Brooke and Hancock Counties
and to describe mitigation strategies to address these hazards.

2
Region 11 Hazard Mitigation Plan 1.0 Introduction
1.1 THE PLANNING PROCESS
§201.6(b) and 201.6(c)(1)
An open public involvement process is essential to the development of an effective plan. In order to develop a more comprehensive approach to reducing the effects of natural disasters, the planning process shall include:
(1) An opportunity for the public to comment on the plan during the drafting stage and prior to plan approval; (2) An opportunity for neighboring communities, local and regional agencies involved in hazard mitigation activities, and agencies that have the authority to regulate development, as well as businesses, academia and other private and non-profit interests to be involved in the planning process; and (3) Review and incorporation, if appropriate, of existing plans, studies, reports, and technical information.
[The plan shall document] the planning process used to develop the plan, including how it was prepared, who was involved in the process, and how the public was involved.
This plan was developed in accordance with Part 201.6 of Section 322 of the
Robert T. Stafford Disaster Relief and Emergency Assistance Act, as enacted by Section
104 of the Disaster Mitigation Act of 2000. Several resources were used during the
development of the plan, including the United States Department of Homeland Security
(USDHS or DHS) / Federal Emergency Management Agency’s (FEMA) Local Mitigation
Planning Handbook (USDHS/FEMA, 2013), the governing regulations in the Code of
Federal Regulations.
1.1.1 Current Update Process
Two committees accomplished the update of the hazard mitigation plan – the
planning committee and the steering committee. The Brooke-Hancock-Jefferson
Metropolitan Planning Commission (BHJ MPC or BHJ) served as the coordinating agency
for West Virginia’s Region 11 Planning and Development Council (PDC) Hazard Mitigation
Plan update of 2017. The Brooke-Hancock Regional Planning and Development Council
served as the full planning committee for the hazard mitigation plan update of 2017.
Members attended meetings throughout the update process. A list of planning committee
members in attendance at those meetings as well as meeting minutes can be found in
Appendix 1.
Full committee membership included representatives from the agencies or
organizations outlined in Table 1.1.

3
Region 11 Hazard Mitigation Plan 1.0 Introduction
TABLE 1.1 REGION 11 PLANNING COMMITTEE REPRESENTATION Type Representative Agency/Organization
Senator Offices
Senator Joe Manchin’s Office Senator Shelly Moore Capito’s Office
Regional Organizations
Region 11 PDC (BHJ MPC) Business Development Corporation
County Organizations
Brooke County Commission (Brooke County Office of Emergency Management)
Hancock County Commission (Hancock County Office of Emergency Management)
Municipal Jurisdictions
Beech Bottom, Village of Bethany, Town of Chester, City of Follansbee, City of New Cumberland, City of Wellsburg, City of Windsor Heights, Village of Weirton, City of
Community Organizations Mary H Weir Public Library Transportation
Route 2/168 Authority Weirton Transit Corporation
1.1.2 Steering Committee Involvement
The BHJ MPC submitted email requests to each county’s commissions and
jurisdictions on September 15, 2016 for invitations to participate in the hazard mitigation
plan update. The email invitation and the signed letters of interest returned from the
jurisdictions can be found in Appendix 1.
Following the invitation, Region 11 established a multi-jurisdictional steering
committee to guide the completion of the plan at the local level. The team was tasked with
making decisions for the plan, attending workshops, completing exercises, and establishing
goals and projects for hazard mitigation. The steering committee was the primary body that
worked with the consultant. A list of steering committee members is outlined in Table 1.2. All
committee members participated in the process through meeting attendance, email
correspondence and/or direct phone contact with the consultant.
TABLE 1.2 REGION 11 STEERING COMMITTEE Organization Representative Position Status
BHJ MPC Barbara Zimnox Region 11 Planner 2012 and 2017 committee member
Brooke County EMA Andy Nickerson Deputy Director New committee member for 2017 update
Brooke County EMA Robert Fowler Emergency Management
Director 2012 and 2017 committee member
Hancock County OEM Jeremy Ober Emergency Management
Director New committee member for 2017 update

4
Region 11 Hazard Mitigation Plan 1.0 Introduction
TABLE 1.2 REGION 11 STEERING COMMITTEE Organization Representative Position Status
Hancock County Commission Bob Vidas Director of Technology &
Communication New committee member for 2017 update
Village of Beech Bottom Becky Uhlly Mayor New committee member for 2017 update
Village of Beech Bottom Robert Sadler Vice-Mayor New committee member for 2017 update
Town of Bethany Cindy Hoffman Recorder 2012 and 2017 committee member
City of Chester Larry Forsythe Mayor New committee member for 2017 update
City of Follansbee John DeStefano City Manager New committee member for 2017 update
City of New Cumberland Richard Blackwell Floodplain Manager New committee member for 2017 update
City of Wellsburg Steve Maguschak City Manager New committee member for 2017 update
Village of Windsor Heights James Smith Mayor New committee member for 2017 update
City of Weirton Mark Miller Director of Planning &
Development New committee member for 2017 update
On November 30, 2016, BHJ, county and municipal representatives, and the
consultant attended a meeting held at the Mary H. Weir Public Library in Weirton, WV to
formally kick-off the hazard mitigation plan update project. The consultant explained the
purpose and importance of hazard mitigation planning and activities within the region. The
steering committee had four meetings during the update of the plan. Table 1.3 provides
information about these meetings.
TABLE 1.3 MEETINGS Date and Time Location Topics Discussed
Meeting 1 November 30, 2016, 12:00 pm
Mary H. Weir Library Weirton, WV
Overview of process Review and define local hazards Asset Inventorying Survey for public involvement
Meeting 2 December 19, 2016, 12:00 pm
Mary H. Weir Library Weirton, WV
Survey for public involvement Define hazard mitigation goals Hazards perceptions exercise
Meeting 3 February 6, 2017, 12:30 pm
Mary H. Weir Library Weirton, WV
Survey for public involvement Hazard mitigation goals and projects
Meeting 4 May 4, 2017, 5:30 pm
Millsop Community Center Weirton, WV
Project review and approval Assets review and approval Jurisdictional capabilities Plan maintenance
Committee Meeting 1
The first committee meeting agenda included an overview of the hazard mitigation
planning process and an outline of committee members’ roles and responsibilities during the

5
Region 11 Hazard Mitigation Plan 1.0 Introduction
process. The consultant presented a review of each hazard including information on
occurrences of each hazard since the last update in 2012. The committee members
approved the new grouping of hazards (for example, including hailstorms, lightning,
tornadoes, wind, blizzards and ice storms under severe weather) and did not add any other
hazards.
After reviewing the hazards, the members participated in an exercise by completing
the risk assessment matrix worksheet that consisted of locating each hazard within a range
of probability and severity according to their convictions and experiences to determine the
risk. The members received their jurisdiction’s asset list as well as their project list from 2012
for review and update noting projects that had been completed, deferred, or deleted. The
consultant presented the idea of an online survey for public involvement to which the
committee agreed.
Committee Meeting 2
During the second committee meeting the consultant presented the members with
the link for the online public involvement survey and encouraged them to post it on their
websites and social media pages. The members then completed the hazards perception
exercise in which they indicated their concerns regarding each hazard. The main exercise of
the meeting focused on establishing goals for hazard mitigation. For this activity, the
members formed two groups; each group, after a brief discussion, had to determine six
mitigation goals for the region. Later they were compared and contrasted to create a total of
five goals. After the goals had been established the members rated them in order of priority;
this process and results are further explained in Section 3.1 Local Hazard Mitigation Goals.
Once the members established and prioritized the goals, they completed new project
worksheets in which the consultant instructed them to add new projects. These projects
should be S.M.A.R.T. (specific, measurable, achievable, realistic, and time sensitive) and
relate back to the goals previously set.
Committee Meeting 3
The consultant presented the committee members with the current status of the
online survey for public involvement to encourage members to reach out to their
communities as well as the results of the goal prioritization at the third meeting. After a brief
review and discussion of the goals and the projects created in the previous meeting, the

6
Region 11 Hazard Mitigation Plan 1.0 Introduction
members prioritized their project lists based on a variety of factors further explained in
Section 3.2 Project Implementation.
Because the committee members know the area they live in much better than any
online database could indicate, the consultant presented maps to the committee for their
input and knowledge of drought, hazmat incidents, land subsidence and severe weather.
They divided into two groups and identified areas that were more or less prone to those
types of hazards.
Committee Meeting 4
The last committee meeting was held just prior to the public meeting. During this
gathering the members reviewed and approved their jurisdictional projects and assets for
inclusion in the hazard mitigation plan. Members also completed a worksheet that surveyed
their jurisdictional capabilities. Following the review, the members discussed the strategies
they would employ for plan maintenance once it is been approved, as well as how they
would integrate the hazard mitigation plan into other jurisdictional plans and ideas for
continued public involvement.
Non-Meeting Activities
After the initial and even after the last committee meetings, the members and the
consultant had regular communication via phone calls and email. The topics of discussion
included gathering information about hazards in each community, reviewing jurisdictional
projects for updates and changes, reporting current hazard incidents in the area, and
general comments on the hazard mitigation planning process.
Evidence of committee member participation is presented in Appendix 1 and
includes the following documents.
Sign-in sheets
Agendas
Presentations
Documentation of exercises in which committee members participated
A call log detailing the process of contacting the jurisdictions.
1.1.3 Engaging the Public
The planning process allowed for multiple opportunities for public involvement such
as the local emergency planning committee (LEPC) meetings in Hancock County, a hazard

7
Region 11 Hazard Mitigation Plan 1.0 Introduction
mitigation specific public meeting, and through the online survey made available in different
ways to the public. A few members of the public attended two committee member meetings
and attendance at the public meeting was minimal even though BHJ had advertised the
meeting in the Weirton Daily Times and Brooke County Review newspapers.
The consultant developed an online survey using the Survey Monkey platform
(www.surveymonkey.com) which received 120 responses between the end of November,
2016 and the end of April, 2017, receiving most of the responses in January, 2017 after
select jurisdictions posted the survey link in their newsletters, on their webpages and social
media pages. The survey aimed to gather data from the public about hazards in their area,
officials’ response to incidents, effective methods of communication, flood insurance
utilization, and general demographic information.
Evidence of public meetings is presented in Appendix 1 and includes sign in sheets
and presentations. Evidence of public involvement through the online survey is presented in
Appendix 2 and includes jurisdictions’ survey announcements as well as the raw survey
data collected.
1.1.4 Research Conducted
The research conducted for the risk assessment phase of this update included data
from federal, state, higher education, and mass media sources. The research aim was
primarily to validate and describe the hazards included for consideration in this plan.
Specific sources relative to individual hazards are listed in the appropriate hazard profile
contained in Section 2.0.
The consultant reviewed a number of existing plans and reports to (a) identify any
obvious inconsistencies between other development and mitigation efforts, (b) as baseline
information for such sections as Analyzing Development Trends, and (c) to support
discussions surrounding mitigation projects. Those documents included the following.
TABLE 1.3 REFERENCED DOCUMENTS
Document type Document citation How incorporated into plan Magazine Business Development Council (2015) Creativity
Rewarded. Online Used to identify targeted development areas.
Report BHJ-MPC. (2016) Regional Review. Online Used to identify targeted development areas. Plan Federal Energy Regulatory Commission (2016) Rover
Pipeline, Panhandle Backhaul, and Trunkline Backhaul Projects, Final Environmental Impact Statement. Online
Used to identify targeted development areas

8
Region 11 Hazard Mitigation Plan 1.0 Introduction
TABLE 1.3 REFERENCED DOCUMENTS Document type Document citation How incorporated into plan
Plan Brooke County. (2014) Comprehensive Plan. Online Used to identify targeted development areas validate county administrative capabilities
Plan Hancock County. (2013). Hazardous Materials Emergency Plan.
Used to identify Tier II facilities in the county
Plan Dewberry. (2013). 2013 West Virginia Statewide Standard Hazard Mitigation Plan Update. Online.
Referenced for HIRA and mitigation strategy guidance.
Report USDHS FEMA. (2016). Disaster Declarations for West Virginia. Online.
Used as data on types of significant hazards incidents to have occurred in Region 3
Technical Information
USACE. (2014). National inventory of dams. Online. Used to validate list of names and locations of dams in Region 3
Technical Information
USDHS FEMA Region III. (July, 2015). Plan Integration: Linking Local Planning Efforts. Federal Government: Washington, D.C.
Used as guidance on incorporating local planning efforts/plans into the planning process.
Technical Information
USDHS FEMA. (June, 2016). National Mitigation Framework. Federal Government: Washington, DC
Used as general guidance on mitigation planning.
Technical Information
USDHS FEMA. (May, 2005). Integrating Historic Property and Cultural Resource Considerations into Hazard Mitigation Planning. Federal Government: Washington, D.C.
Used as general guidance for incorporating historic property and cultural protection.
Technical Information
USDHS FEMA. (March, 2013). Local mitigation planning handbook. Federal Government: Washington, D.C.
Used as general guidance on revised mitigation planning process
Technical Information
USDHS FEMA. (March, 2013). Integrating Hazard Mitigation Into Local Planning. Federal Government: Washington, D.C.
Used as general guidance on existing plan integration for hazard mitigation
1.1.5 Implementing the Plan and Monitoring Progress
Region 11’s stakeholders realize that the plan must remain viable in order to
appropriately guide mitigation in the region. To that end, plan implementation (i.e., the
mitigation strategy and project prioritization) is presented in Section 3.0 Action Plan. The
monitoring process is presented in Section 4.0 Plan Maintenance Process.

9
Region 11 Hazard Mitigation Plan 1.0 Introduction
1.2 DESCRIPTION OF THE PLANNING AREA
1.2.1 County Geography
Region 11 is comprised of Hancock and Brooke Counties located at the
northernmost part of the state of West Virginia on the Northern Panhandle. To the north and
west, Hancock County is surrounded by Ohio,
separated by the Ohio River. On the west it
borders Pennsylvania and to the south is Brooke
County. Brooke County also borders Pennsylvania
and Ohio to the east and west, respectively, and is
across the Ohio River from Ohio. To the south of
Brooke County is Ohio County, West Virginia.
Created in 1848 from Brooke County, Hancock
County is the smallest county in the state with only
88 square miles of land and is named after John
Hancock, signer of the Declaration of
Independence. The county seat is in New Cumberland and its largest city is Weirton. In
1796 Brooke
County was
established from
Ohio County
territory and was
named after
Robert Brooke,
the Attorney
General of
Virginia. The table
above lists the
municipalities and
townships found in
Region 11 and
these are also
displayed on the
map to the right.
TABLE 1.5 MUNICIPALITIES
Name Type County
Brooke County N/A
Hancock County N/A
Beech Bottom Village Brooke
Bethany Town Brooke
Follansbee City Brooke
Weirton City Brooke/Hancock
Wellsburg City Brooke
Windsor Heights Village Brooke
Chester City Hancock
New Cumberland City Hancock
PE
NN
SY
LVA
NIA
OHIO

10
Region 11 Hazard Mitigation Plan 1.0 Introduction
Each village, town and city in Region 11 is unique in its culture, history, and
economic diversity. The Business Development Corporation of the Northern Panhandle
describes the municipalities in Brooke and Hancock Counties the following way (BDC, n.d.).
Beech Bottom/Windsor Heights: The quiet villages of Beech Bottom and Windsor
Heights border the beautiful Ohio River and boast rich industries from farming to coal
mining. Both were once "company towns" and remain close-knit communities, where
friendships last lifetimes and some third- and fourth-generation laborers work for
local manufacturers.
Bethany: The college town of Bethany
embraces a diversity of thought and lifestyle,
allowing both students and full-time residents
to enjoy the opportunity to grow within a small
community context. Situated in the foothills of
the Allegheny Mountains, Bethany's lush
vistas attract visitors to view the spectacular
autumn colors.
Chester: Truly at "the top of West Virginia,"
the city of Chester is sandwiched between the
states of Ohio and Pennsylvania. Settled by
potters, Chester offers quiet suburban life — a
haven for commuters with easy access to two
major metropolitan areas. Chester is small in
size, big in history and strong on community
pride!
Follansbee: The riverside community of Follansbee possesses that rock-solid
"Hometown Feeling." With the entrance of the town from the north cut right out of the
Allegheny foothills, Follansbee welcomes you! Major industry borders the Ohio River
in a town with stately homes and safe, desirable neighborhoods.
New Cumberland: With their motto "Good people make a good town," New
Cumberland stands as a pleasant, close-knit residential community of about 1,100
people. Its residents boast possession of one of West Virginia's most beautiful state
parks, Tomlinson Run, providing a wide range of recreational opportunities in a
spectacular natural landscape buried deep in the West Virginia hills.

11
Region 11 Hazard Mitigation Plan 1.0 Introduction
Weirton: Forged by
steel, the city of Weirton
combines the warmth,
security and
camaraderie inherent in
a small town with cultural, educational and economic benefits of a metropolitan area.
Often described as a "melting pot," Weirton's ethnic diversity provides a cultural
variety second to none. Consistently rated as one of the safest cities in the United
States with a reasonable cost of living, Weirton borders both the Ohio River and the
Pennsylvania border, offering a curious blend of major industry, tourist attractions
and recreational opportunities. Weirton is located in Brooke and Hancock Counties.
Wellsburg: Settled by members of the famous Lewis and Clark Expedition,
Wellsburg possesses a historical charm and cultural appreciation embraced by both
visitors and residents. This riverside community has attracted bus tours and stops by
the Mississippi and Delta Queens, while the Brooke Hills Playhouse Players
showcase local talent.
1.2.2 County Demographics
According to the 2015 U.S. Census Bureau estimates, Brooke and Hancock
Counties have a total population of 53,165; of which 23,350 are in Brooke County and
29,815 are in Hancock County. Of that total population, the majority age range is between
18-65 years old, and slightly more than half are female. The vast majority of people are
white with a very small percentage of Hispanic, Asian, or African American ethnicity.
The table on the next page summarizes general population information as well as the
economy and special status in each county, when available. The data in this table is taken
from several sources such as the U.S. Census Bureau database, the Bureau of Labor
Statistics database and from Point-In-Time (January 2015) data provided by the Wheeling
Coalition for the Homeless.
The type of information presented in this table is a base for understanding how the
population in Region 11 could potentially be vulnerable to different hazards. Section 2.1.6
Public Health and Social Vulnerability describes this correlation more in depth.
Understanding the demographic makeup and their specific vulnerabilities in the region can
inform planners and officials about projects and strategies they should consider to mitigate
or lessen the negative impact disaster-causing hazards have on the population.

12
Region 11 Hazard Mitigation Plan 1.0 Introduction
1.2.3 Economy
Four of the top five largest employing
industries for Brooke and Hancock Counties
are the same: healthcare and social
assistance, manufacturing, retail trade and
educational services. The bar graphs below
show a breakdown of the number of
employees in each industry by county,
according to information from Data USA.
The ten largest employers in the
region are Arcelor Mittal Steel, Mountaineer
Casino Racetrack and Resort, Homer
Laughlin China, Marsh Bellofram, Severstal
TABLE 1.6 REGION 11 DEMOGRAPHICS
Item Brooke Hancock
Total Population 23,350 29,815
Land Area (sq. mi.) 89.21 82.61
AGE DISTRIBUTION
Population over 65 22.10% 20.70%
Population 18-65 60.20% 59.90%
Population Under 18 17.70% 19.40%
Population Under 5 3.80% 4.60%
GENDER
Female 50.90% 51.60%
Male 49.10% 48.40%
ETHNICITY
White 96.50% 95.40%
African American 1.70% 2.50%
Asian 0.40% 0.40%
Hispanic 0.90% 1.30%
ECONOMY
Median Household Income $44,067 $39,342
Per Capita Income $23,310 $23,947
Unemployment rate Jan 2017 7.2 7.0
Unemployment rate Jan 2016 8.1 8.7
Unemployment rate Jan 2015 7.8 8.8
Unemployment rate Jan 2014 8.1 9.1
Unemployment rate Jan 2013 9.6 10.3
Unemployment rate Jan 2012 9.7 10.5
Living in Poverty 15.10% 12.90%
SPECIAL STATUS
Language other than English 1.70% 1.70%
Disability 10.80% 13.80%
Do Not Own a Vehicle 3.06% 2.50%
Homeless 5
Mental Illness 14
Substance Abuse 9
Veterans 4
Sources: 2015 U.S. Census Bureau, Bureau of Labor Statistics, 2015 Point-In-Time data, Wheeling Coalition for the Homeless
2231 2093
1369
824 806
Hea
lthca
re a
ndSo
cial
Ass
ista
nce
Man
ufac
turin
g
Ret
ail T
rade
Educ
atio
nal
Ser
vice
s
Acco
mod
atio
nan
d Fo
od S
ervi
ce
Brooke County Industries
Number ofEmployees
1889
1326 12751035
666
Hea
lthca
re a
ndSo
cial
Ass
ista
nce
Ret
ail T
rade
Man
ufac
turin
g
Educ
atio
nal
Serv
ices
Con
stru
ctio
n
Hancock County Industries
Number ofEmployees

13
Region 11 Hazard Mitigation Plan 1.0 Introduction
North America, Weirton Medical Center, Ergon, Wheeling Nisshin, Ball Corporation and
Eagle Manufacturing. Currently, the state of West Virginia is offering incentives to
businesses to move to the area; according to the Milken Institute Cost of Doing Business
Index, West Virginia's cost of doing business is 13% lower than the United States average
(Business Development Corporation of the Northern Panhandle, 2016).
1.2.4 Transportation
Roads
The major roads in Region 11 include U.S. 22 which winds through the south of
Hancock County and the northern part of Brooke County, U.S. 30 in the northern part of
Hancock County and State Route 2 that runs along the Ohio River through the western side
of both counties. Secondary routes include State Routes 8, 27, 68, and 88. The network of
roads passes mostly through rural areas; many of the routes have relatively steep grades.
Personal vehicles are the primary means of transportation in the region.
Rail
There are two rail systems in Region 11.
Wheeling & Lake Erie Railway Company: A short line partner of CSX; operates
across 800 miles in Maryland, Ohio, Pennsylvania and West Virginia. Crosses the
region east-west between Follansbee and Wellsburg, WV.
Norfolk Southern: This railway company operates along the Ohio River at the far
west of Region 11 and parallels Route 2 in both counties.
Air
The following lists a few of the airports that are closest to the region, both public and
privately owned. There are no public airports within Region 11.
Herron: Located in New Cumberland, WV; this airport is privately owned.
Wheeling Ohio County Airport: Located eight miles northeast of Wheeling, WV,
just on the Brooke-Ohio County line; this is the closest public airport to Region 11 in
West Virginia. A portion of the runway is located within the Brooke County limits.
Jefferson County Airpark: Open to the public and located in Wintersville, OH near
Steubenville, approximately seven miles southwest of Weirton, WV.

14
Region 11 Hazard Mitigation Plan 1.0 Introduction
Pittsburgh International Airport: This is the closest international airport to the area,
located in Pennsylvania; it is approximately 14 miles from the West Virginia line in
Hancock County
Public Transit
Brooke County does not have public transportation. It does, however, have taxi and
limousine services that serve both Brooke and Hancock Counties which include Brooke
County Cab Company, Weir-Cove Taxi Company, First Class Limousine, and Kirk Livery.
Public transit for the area includes the following services.
Weirton Transit Corporation (WTC): Offers bus service throughout the city of
Weirton. The bus operates Monday through Friday with limited service on Saturdays
(City of Weirton).
Regional Access Mobility Partnership (RAMP): Offers employment, health care,
non-emergency specialized transportation, and fixed-route and demand-response
public transit services (BHJ).

15
Region 11 Hazard Mitigation Plan 1.0 Introduction
1.2.5 Medical Access
Weirton Medical Center is the only hospital located within Region 11. However, just
outside Brook and Hancock Counties, across the Ohio River in Ohio and south of Brooke
County in Ohio County other hospitals can be found:
Acuity Specialty Hospital, Ohio
East Liverpool City Hospital, Ohio
East Ohio Regional Hospital, Ohio
Wheeling Hospital, West Virginia
1.2.6 Utilities
The following table lists the available cable/internet/telephone, electric, gas, sewer,
solid waste and water utility companies in Region 11 according to the Public Service
Commission of West Virginia.
TABLE 1.7 UTILITY SERVICES IN REGION 11
County → Brooke County Hancock County
Utility ↓
Electric Monongahela Power Company Monongahela Power Company
Natural Gas Mountaineer Gas Company Mountaineer Gas Company
Sewer
Brooke County PSD Town of Bethany Sanitation Board City of Follansbee City of Weirton Sanitary Board Wellsburg Sanitary Board
Chester Municipal Sewer Department City of New Cumberland City of Weirton Sanitary Board Ogden Sewer Company The Newell Company
Solid Waste Brooke County Sanitary Landfill
Telecommunications Comcast Frontier West Virginia
Comcast Frontier West Virginia
Water
City of Weirton Hammond PSD Ohio County PSD Washington Pike PSD Village of Beech Bottom City of Follansbee Wellsburg Municipal Water Department Brooke County PSD
Hancock County PSD The Newell Company Grant PSD Oakland PSD Tomlinson PSD City of New Cumberland City of Weirton Chester municipal Water Department
Source: Public Service Commission of West Virginia

16
Region 11 Hazard Mitigation Plan 1.0 Introduction
1.2.7 Jurisdictional Capabilities
Participating jurisdictions have a number of capabilities that can support (or at least
be related to) mitigation efforts. The capabilities, what they mean, and how they tie into
mitigation efforts are described below.
Planning Commission: Determines locations where development is allowed. With
the help of the risk assessment, the planning commission can designate certain
areas as high or low risk and allow or restrict development in those areas.
Comprehensive Plan: Lays out a strategy for how the jurisdiction plans to grow. The
comprehensive plan contains projects that can be considered to mitigate a hazard.
Radiological Emergency Plan: Outlines response and evacuation procedures in
case of radiological emergencies at the nuclear power plant. When an incident
occurs at the power plant, the population will know what to do if they are familiar with
the plan and reduce the risk to themselves by evacuating in time.
Floodplain Regulations: Restrict construction in certain flood-prone areas and seek
to make existing buildings in floodplains safer. The impacts of flooding are reduced if
buildings, infrastructure, and development are kept out of the floodplain or follow the
required steps for construction within a floodplain.
Building Codes: Require new construction and building remodeling to be up-to-date
and built with the current standards.
Zoning Ordinances: Allow for development to be directed towards lower risk areas.
The ordinances restrict construction in places that are determined to be high risk
areas. Enforcing the ordinances in high risk hazard areas can reduce vulnerability.
Historic Preservation Plan: Historic properties and cultural resources are economic
assets that increase property values and attract businesses. The plan provides for
the protection of historic buildings and areas from hazards.
Community Rating System: Encourages jurisdictions to go above and beyond
regular National Flood Insurance Program (NFIP) requirements.
Capital Budget: Funds long-term infrastructure projects within a jurisdiction. These
can include hazard mitigation projects outlined in the hazard mitigation plan.
Public Works Budget: Designates funds to general utility projects. These can
include hazard mitigation projects such as storm water management.
Community Economic Development Strategy (CEDS): Similar to the
comprehensive plan, the CEDS establishes strategies for business development in
the area.

17
Region 11 Hazard Mitigation Plan 1.0 Introduction
The table below outlines each jurisdiction’s capabilities.
TABLE 1.8 JURISDICTIONAL CAPABILITIES
Capability → Jurisdiction ↓ Pl
anni
ng C
omm
issi
on
Com
preh
ensi
ve P
lan
Rad
iolo
gica
l Em
erge
ncy
Plan
Floo
dpla
in R
egul
atio
ns
Build
ing
Cod
es
Zoni
ng O
rdin
ance
s
His
toric
Pre
serv
atio
n Pl
an
Com
mun
ity R
atin
g Sy
stem
Cap
ital B
udge
t
Publ
ic W
orks
Bud
get
CED
S
Brooke County YES YES YES YES YES** YES YES NO YES NO YES**
Hancock County YES NO YES YES YES** YES NO NO NO NO YES**
Beech Bottom YES† NO YES YES YES** NO NO NO NO NO YES**
Bethany YES† NO YES YES YES** NO NO NO NO NO YES**
Chester YES† NO YES YES YES** NO NO NO NO NO YES**
Follansbee YES YES YES YES YES** YES NO NO YES YES YES**
New Cumberland YES† NO YES YES YES** NO NO NO YES NO YES**
Weirton YES YES YES YES YES** YES NO NO YES NO YES**
Wellsburg YES† NO YES YES YES** NO NO NO NO NO YES**
Windsor Heights YES† NO YES NO YES** NO NO NO NO NO YES**
** Covered under state, regional or county plan/codes † Planning commission is Region 11 PDC
1.2.8 Disaster Declarations in Brooke and Hancock Counties
As of November 2016, there have been 67 FEMA declarations in the state of West
Virginia, including emergency declarations, fire management assistance declarations, and
major disaster declarations. Four of these declarations have included either Brooke or
Hancock Counties or both. Emergency declarations and major disaster declarations differ in
that major disasters will involve damaged caused by some natural event, with some
exceptions, and provides a wide range of federal assistance programs while emergency
declarations can be declared for any occasion when the President determines federal
assistance is needed. By statute an emergency declaration may not exceed $5 million in
assistance (FEMA, 2011). The incident types and total number of declarations in Region 11
are shown in the table below. The hurricane declaration is related to sheltering issues faced

18
Region 11 Hazard Mitigation Plan 1.0 Introduction
during the evacuation of the gulf coast during Katrina. Some evacuees were relocated to the
region.
TABLE 1.9 EMERGENCY/DISASTER DECLARATIONS IN BROOKE AND HANCOCK COUNTIES SINCE 2010
Declaration Hazard Counties Description Assistance
1903
Major
Disaster Declaration
April 23,
2010
Severe Winter Storms and Snowstorms (Severe Weather)
Berkeley, Brooke, Doddridge, Hampshire, Hancock, Hardy, Jefferson, Marion, Marshall, Morgan, Ohio, Pocahontas, Preston, Ritchie, Tucker, Tyler, Wetzel.
President Obama declared a major disaster in West Virginia. This declaration made Public Assistance requested by the Governor available to State and eligible local governments and certain private nonprofit organizations on a cost-sharing basis for emergency work and the repair or replacement of facilities damaged by the severe winter storms and snowstorms. This declaration also made Public Assistance, including snow assistance, requested by the Governor available to State and eligible local governments. Finally, this declaration made Hazard Mitigation Grant Program assistance requested by the Governor available for hazard mitigation measures statewide.
Per Capita Impact: Brooke County: $5.49 Hancock County: $6.14
3345
Emergency Declaration
June 29,
2012
Severe Thunderstorms (Severe Weather)
All 55 counties of West Virginia
Federal emergency aid was made available to West Virginia to supplement state and local response efforts due to the emergency conditions resulting from severe storms beginning on June 29, 2012, and continuing. (A.K.A. 2012 North American Derecho).
N/A
3358
Emergency Declaration
October 29,
2012
Severe Snowstorms (Severe Weather)
All 55 counties of West Virginia
Federal emergency was made available to West Virginia to supplement state and local response efforts due to the emergency conditions resulting from Hurricane Sandy beginning on October 29, 2012, and continuing.
Public assistance Category B: $19,645.54
4220
Major
Disaster Declaration
May 18,
2015
Severe Storms, Flooding, Landslides and Mudslides (Flooding, Land Subsidence & Severe Weather)
Braxton, Brooke, Doddridge, Gilmer, Jackson, Lewis, Marshall, Ohio, Pleasants, Ritchie, Tyler, Wetzel.
Federal disaster aid was made available to West Virginia to supplement state and local recovery efforts in the area affected by severe storms, flooding, landslides, and mudslides during the period of April 8-11, 2015.
Total public assistance grants - dollars obligated: $7,137,833.86 Emergency work (Categories A & B) dollars obligated: $11,537.97 Permanent work (Categories C-G) dollars obligated: $7,075,885.89
SOURCE: FEMA

19
Region 11 Hazard Mitigation Plan 2.0 Risk Assessment
2.0 RISK ASSESSMENT
§201.6(c)(2)(i)
[The risk assessment shall include a] description of the…location and extent of all natural hazards that can affect the jurisdiction. The plan shall include information on previous occurrences of hazard events and on the probability of future hazard events.
Section Overview
A risk assessment analyzes “the potential for damage, loss, or other impacts created
by the interaction of hazards with community assets” (FEMA, 2013). The risk assessment
section contains information on identified hazards that threaten the region, the vulnerability
of the area as it relates to its assets and a list of community assets for both Brooke and
Hancock Counties.

20
Region 11 Hazard Mitigation Plan 2.0 Risk Assessment
2.1 HAZARDS & VULNERABILITY
§201.6(c)(2)(i)
[The risk assessment shall include a] description of the type…of all natural hazards that can affect the jurisdiction.
§201.6(c)(2)(i)
[The risk assessment shall include a] description of the…location and extent of all natural hazards that can affect the jurisdiction. The plan shall include information on previous occurrences of hazard events and on the probability of future hazard events.
2.1.1 Hazard Analysis
The goal of the hazard analysis section is to identify those naturally-occurring,
technological and human-caused hazards that pose a risk to Brooke and Hancock Counties
and their various municipalities. Current conditions within the counties and historical hazard
occurrences inform each hazard profile. Each hazard profile includes the following
components: a brief overview of the hazard, location and extent, historical occurrences,
impacts and social vulnerability, loss and damages, probability and severity calculation, and
a risk map detailing locations within the counties that are most vulnerable to each hazard.
2.1.2 Hazard Identification
Historically, Region 11 has been vulnerable to a number of natural hazards that
disrupt lives and damage or destroy property. This mitigation plan takes the following list of
natural hazards present in the region into consideration for further development. This list
shows how the hazards have changed from the previous 2012 plan update.
Drought (no change)
Earthquakes (no change)
Extreme Temperatures (new hazard)
Flooding (no change)
Mass Movements (previously Land Subsidence)
Severe Weather (consolidated: hail, thunderstorm, wind and winter weather
and added: tornado, winter storm, and winter weather.)
Wildfires (no change)
For the purposes of this document extreme temperatures will include both heat and
cold temperatures and severe weather will encompass all types of winter weather, hail,
thunderstorms, high wind, and tornadoes; these have been grouped under one profile

21
Region 11 Hazard Mitigation Plan 2.0 Risk Assessment
heading because mitigation efforts and strategies are similar for these types of severe
weather events.
Non-natural or human-caused hazards are also included in this risk assessment.
Given the proximity of Hancock and Brooke Counties to the Beaver Valley Nuclear Power
Plant (NPP) in Shippingport, PA, a radiological component has been identified as a hazard
that could affect the region and therefore has been included in the profiles. Non-natural,
technological and human-caused hazards analyzed in this risk assessment include the
following hazards. Any changes from the previous plan in 2012 are noted here.
Acts of Violence (previously Civil Disturbance)
Dam Failure (no change)
Hazardous Materials (no change)
Radiological (no change)
The risk assessment identified several other naturally-occurring hazards that do not
affect either Brooke or Hancock Counties. Because of the location of the region in the
continent (i.e. far from any coast) and its geography, the following hazards are not
considered.
Avalanches happen mainly in the western United States and Canada (Keller,
Devecchio, 2015 p. 229).
Coastal Erosion, Coastal Storms, Hurricanes and Tsunamis because the East Coast
is approximately 320 miles away and the West Coast is approximately 2,250 miles
away (Google Earth).
Volcanoes are not a threat to the area. The closest monitored volcano is in
Yellowstone National Park in Wyoming (USGS) and is approximately 1,550 miles
away (Google Earth).
2.1.3 Probability vs. Severity
One of the components of the risk assessment is determining both the probability of
a hazard occurring and the potential severity of that hazard event. This process helps
identify which hazards pose the most significant risk to Region 11 and its municipalities. The
probability and severity of an event are largely based on historical research. The probability
of an event happening is determined based on the number of events that have occurred
within a certain timeframe. The timeframe is based on information available from different
resources and varies depending on the data.

22
Region 11 Hazard Mitigation Plan 2.0 Risk Assessment
CALCULATION PROBABILITY
Years Events
Online Database News
ResearchArticles
Interviews
Value
SOURCES
The probability of occurrence is broken down into five categories as seen in the table
below.
The chance of occurrence of a hazard within the next year can be quantified based
on historical data. This can be expressed in a numerical measure or as a percentage of 0-
100 percent. It is calculated by adding the total occurrences of a specific hazard and dividing
it by the years of data. For example, if there have been seven earthquakes in a region
between 1950 and 2016 (66 years), the quantitative probability would be calculated by
dividing seven events by 66 years. The result would be 0.10 or 10% chance of earthquake,
roughly one every ten years. The percentage would then indicate an ‘improbable’ probability
of occurrence, based on the information presented in the table above. This formula for
calculating probability will be used when appropriate (i.e. historical data is available).
Although some hazards have zero recorded occurrences, the risk still exists. Since
non-natural hazards generally do not depend on weather patterns to occur, they are not
informed by this type of historical data. Non-natural and human-caused hazards are nearly
impossible to assign a measurement of probability.
TABLE 2.1 PROBABILITY
Value Description Definition
3.1+ Frequent Likely to occur frequently
1.6 - 3 Probable Will occur several times in a year
0.7 – 1.5 Occasional Likely to occur sometime during a year
0.3 – 0.6 Remote Unlikely to occur in a year
0 – 0.2 Improbable So unlikely that it can be assumed it will not occur in a year
Number of events 7
= Probability OR = 0.10 OR 1 time every 10 years
Number of years 66

23
Region 11 Hazard Mitigation Plan 2.0 Risk Assessment
The severity of an event is based on three main factors: 1) the historical deaths,
injuries, and property/crop damage; 2) the extent of potential secondary and/or cascading
impacts of the hazard and; 3) the potentially impacted geographic area as determined
through risk mapping. Generally, the severity estimations will be less exact than probability
estimations. The four classifications of severity are shown in the table below.
TABLE 2.2 SEVERITY Description Definition
Catastrophic Death or major structural loss
Critical Severe injury, severe illness, or marginal structural damage
Marginal Minor injury, minor illness, or structural damage
Negligible Less than minor injury, illness or structural damage
The combination of hazard probability and hazard severity results are shown in the table
below, known as the Risk Assessment Matrix. The matrix is designed to show the hazards
that are of most concern to Region 11 and its municipalities.
TABLE 2.3 RISK ASSESSMENT MATRIX
PROBABILITY
Frequent Probable Occasional Remote Improbable
SEVE
RIT
Y
Catastrophic High High High Moderate Moderate
Critical High High Moderate Moderate Moderate
Marginal Moderate Moderate Moderate Moderate Low
Negligible Moderate Moderate Low Low Low
In the table below, each hazard is located within the risk assessment matrix based
on the research and analysis of each hazard. For more detailed information, refer to each
hazard profile section.
TABLE 2.4 RISK ASSESSMENT MATRIX WITH HAZARDS
PROBABILITY
Frequent Probable Occasional Remote Improbable
SEVE
RIT
Y
Catastrophic Acts of
Violence
Critical HazMat Flood Radiological Dam Failure
Marginal
Severe Weather
Mass Movements
Negligible Extreme
Temperatures Drought,
Earthquake Wildfires

24
Region 11 Hazard Mitigation Plan 2.0 Risk Assessment
2.1.4 Complicating Variables
Direct consequences of disasters can include fatalities, injuries, and damages to
humans, animals or property. However, disasters do not end there; there are a number of
indirect effects, both tangible and intangible associated with disasters. Some examples of
these include loss of livelihood and income, loss of community and population, mental and
psychosocial impacts, costs of rebuilding, repair or replacement, loss of inventory, wages
and tax revenue, etc. (Coppola, 2015). All of these also have a cost associated with them
but it is much more difficult to assign a specific dollar value and quantify accurately. For the
purposes of this analysis, the primary focus of loss estimates will be direct consequences of
the given hazard.
A number of situations could occur that would result in a disruption to a number of
critical systems throughout Brooke and Hancock Counties. Some hazards are complicated
by a series of loosely-related variables; these are often considered cascading hazards. For
example, high winds may cause sporadic damage throughout the county, but often do not
become a significant countywide concern until a large number of residents are without
power. In addition to weather-related power outages, cascading hazards in Region 11 could
include (but not be limited to) the following.
Damage to infrastructure (i.e. roads, bridges, tunnels, pipes, utility poles etc.) and to
residences following flooding
Flooding of downstream areas in the event of a dam failure
Drinking water supply shortages and contamination following severe and prolonged
drought conditions or floods
Power outages, ruptured gas lines, etc. following earthquakes or severe weather
Public health concerns following flooding conditions or a HazMat incident
Road closures resulting from land subsidence
The complicating variables related to each hazard are described within the profiles.
The information presented is based on worst-case scenario events; a single event may not
always reach all impacts described. However, it is important to understand that the impacts
of hazards go beyond what is seen immediately after the event. The effects of one event
can last months or even years, especially where public health, social, economic,
environmental and infrastructure impacts are concerned.

25
Region 11 Hazard Mitigation Plan 2.0 Risk Assessment
2.1.5 Hazards and Climate Change
Many natural hazards are related to climate such as droughts, severe weather,
floods and wildfires. There is an important distinction between weather and climate. Weather
refers to the atmospheric conditions of a geographical region over a short period of time,
such as days or weeks. Climate, in contrast, refers to the atmospheric conditions of a
geographical area over long periods of time, such as years, or even decades (Keller,
Devecchio, 2015, pp. 406-407).
According to the U.S. Global Change Research Program (2016), there are several
weather and climate changes that have already been observed in the United States.
Since recordkeeping began in 1895, the average U.S. temperature has increased by
1.3°F to 1.9°F with most of the increase happening since 1970. In addition, the first
decade of the 2000s has been the warmest on record.
The average precipitation across the U.S. has increased since 1900 with some areas
experiencing higher than the national average and some lower. Heavy downpours
are increasing, especially over the last 30-50 years.
Drought events have increased in the west. Changes in precipitation and runoff,
combined with changes in consumption and withdrawal, have reduced surface and
groundwater supplies in many areas.
Some types of severe weather events have experienced changes; heat waves are
more frequent and intense, and cold waves have become less frequent and intense
overall.
The intensity, frequency, and duration of North Atlantic hurricanes have increased
since the early 1980s.
Climate change can have a significant impact on human health and the environment.
The changes mentioned above can affect the environment by leading to changes in land-
use, ecosystems, infrastructure conditions, geography and agricultural production. Extreme
heat, poor air quality, reduced food and water supply and quality, changes in infectious
agents and population displacement can lead to public health concerns such as heat-related
illnesses, cardiopulmonary illnesses, food, water and vector-borne diseases and have
consequences on mental health and stress (USGCRP, 2016).
The National Climate Assessment (NCA) defined climate trends for national U.S.
regions in 2014. The major trends are seen to be
wildfires and heat waves on the west coast,

26
Region 11 Hazard Mitigation Plan 2.0 Risk Assessment
rising temperatures and increased severity and frequency of winter storms in the
middle of the country,
more rain and flooding in the Midwest and northeastern parts of the country, and
an increase in sea levels in the mid-Atlantic with an increase of hurricane activity in
the southeastern states.
In West Virginia, the trend will be an increase in precipitation which will lead to more
events of hazards such as flooding, mass movements, and possible dam failures. This is
detailed in the map below.
2.1.6 Public Health and Social Vulnerability
Area demographics, economy, income, the physical environment, clinical care and
health behaviors are all factors that are closely interrelated with the public health of the
counties and contribute to overall social vulnerabilities to hazards. The following paragraphs
outline the general public health of Region 11 considering the factors mentioned previously.

27
Region 11 Hazard Mitigation Plan 2.0 Risk Assessment
According to the American Lung Association (ALA) in their State of the Air 2015
report, the Pittsburgh-New Castle-Weirton, PA-OH-WV area is included on the lists for the
top 25 most polluted cities by ozone, by year-round particle pollution, and by short-term
particle pollution falling at numbers 21, 9, and 10, respectively, 1 being the highest. Brooke
and Hancock County fall within this area. The ALA gives grades to air quality and Hancock
County fails the ozone quality test putting it in the red category, indicating “unhealthy” air
quality with a
range of 86-105
ppb (parts per
billion) of ozone.
The different
levels of air quality are shown in the colored circles. Ozone data for Brooke County was not
recorded in the report but it can be assumed, due to its proximity to Hancock County and
similar condition, that the air quality would be similar. However, both counties have a grade
“A” for particle pollution in a 24-hour period (ALA, 2017). Heavy industrial activity in both
Brooke and Hancock Counties as well as the surrounding areas in Pennsylvania and Ohio
may play a role in causing these unhealthy levels.
The annual County Health Rankings reports for West Virginia published by the
University of Wisconsin Population Health Institute and the Robert Wood Johnson
Foundation include information on public health factors that affect the overall health
outcomes for each county in the state. The study considers health factors such as health
behaviors (tobacco use, diet and exercise, alcohol and drug use, sexual activity), clinical
care (access to care, quality of care), social and economic factors (education, employment,
income, family and social support, community safety), and the physical environment (air and
water quality, housing and transit). All of these factors are given a certain percentage that
influences the overall health outcomes (length of life and quality of life) (UWPHI, 2017).
Each county in the state is ranked from 1 to 55, 1 is the highest ranking indicating the best
health outcome or health factors. Reports to back to the year 2011; rankings for Brooke and
Hancock Counties since then until 2017 are shown below.

28
Region 11 Hazard Mitigation Plan 2.0 Risk Assessment
0
10
20
30
40
50
2011 2012 2013 2014 2014 2016 2017
HEALTH OUTCOMES OVERALL RANKING
Brooke
Hancock
The data suggests that
Region 11’s population health
outcomes (quality and length
of life) have slightly increased
over the last six years, while
the health factors considered
in the study have steadily
declined. Given the downward
ranking trend of overall health
factors (which inform the
health outcomes), it can be
expected that the overall
health outcomes could decline
over the next few years if
changes are not made to
improve public health.
Vulnerable populations,
populations of concern, or
populations at risk are defined
as those individuals or groups
of people who are more
exposed to the risks of the
impacts of a hazard because of their age, gender, income, occupation, disability, physical or
mental health, literacy, income, religion, education, or ethnicity.
Some groups face a number of stressors related to both climate and non-climate
factors. For example, people living in impoverished urban or isolated rural areas,
floodplains, coastlines, and other at-risk locations are more vulnerable not only to extreme
weather and persistent climate change but also to social and economic stressors. Many of
these stressors can occur simultaneously or consecutively. Over time, this “accumulation” of
multiple, complex stressors is expected to become more evident as climate impacts interact
with stressors associated with existing mental and physical health conditions and with
other socioeconomic and demographic factors
Some populations of concern demonstrate relatively greater vulnerability to
the health impacts of climate change. The definitions of the following key concepts are
0
10
20
30
40
50
2011 2012 2013 2014 2014 2016 2017
HEALTH FACTORS OVERALL RANKING
Brooke
Hancock

29
Region 11 Hazard Mitigation Plan 2.0 Risk Assessment
important to understand how some people or communities are disproportionately affected by
climate-related health risks. Definitions are adapted from the Intergovernmental Panel on
Climate Change (IPCC) and the National Research Council (NRC) (USGCRP, 2016).
It is important to understand the impacts each hazard could potentially have on
different individuals and groups of people. One hazard may affect one group of people
differently than another. For example, severe weather conditions may affect children and
elderly adults more than women; or the need to evacuate would affect people with
disabilities and those who cannot read more than those who are of a certain religion, while
acts of violence may be directed at a group of people of a certain religion and not at
children.
It is important to keep in mind what this information tells us: when planning for
disasters we must consider the population living within the community along with their
strengths and vulnerabilities. Accounting for age, disabilities, economic status, etc., a large
portion of the population may be vulnerable to different hazards. Making considerations for
different types of vulnerabilities of populations within the region during mitigation planning
can make a community more resilient to disasters and ultimately save lives.
Each hazard profile goes further into detail explaining how the hazard could affect
public health and social vulnerability.
2.1.7 Hazard Snapshots
The following table contains a summary of all the hazards analyzed, presented in
alphabetical order. Data within the table includes the following information:
Description: Definition of the hazard.
Period of Occurrence: The typical time of the year events of this type can occur
Number of Years: Actual number of years data is available based on the ‘record
years’.
Number of Events: The times that event has occurred within the timeframe of the
‘number of years’ according to the sources.
Probability: The calculation of occurrence of a certain event based on number of
years and number of events, as described above (ranging from 0.0 to 7.0, based on
the highest probability calculated in this table; probability can be higher if more
events take place).
Severity: Based on historical impacts
Risk: Low, medium or high based on the risk assessment matrix

30
Region 11 Hazard Mitigation Plan 2.0 Risk Assessment
Warning Time: The amount of time that passes from when the event is detected to
when it occurs
Total Damages to Date: Amount in dollars of damages to property or cost of repair.
Vulnerable Populations: Lists the type of populations that may be vulnerable to the
specific hazard.
Impacts: To include public health, social, economic, environmental and
infrastructure impacts of the hazard on the community.
Cascading Effects: primary hazards can have secondary effects; one hazard could
give way to other consequences.
For more complete information, refer to each hazard profile for detailed descriptions,
historical occurrences, methods of loss and damage estimation as well as the probability
and severity calculation, and risk area maps.

31
Region 11 Hazard Mitigation Plan 2.0 Risk Assessment
TABLE 2.5 HAZARD SNAPSHOTS
Hazard Description Period of
Occurrence # of
Years # of
Events Probability Severity
Regional Risk
Warning Time Total
Damages to Date
Vulnerable Populations
Acts of Violence
"An intentional use of force or power, against oneself, another person, or against a group or community, which either results in or has a high likelihood of resulting in injury, death, psychological harm, maldevelopment, or deprivation" (WHO).
At any time throughout the
year N/A N/A N/A
Remote Catastrophic Moderate
None Days
Weeks $0
Everyone surrounding the incident
Targeted populations (varies)
Public Health Impacts: Death, injury, illness (depending on type of attack), PTSD, exacerbation of chronic illnesses Cascading effects: Dam failure HazMat Radiological Fires
Social Impacts: Distrust of groups of people, displacement of population, disruption of normal activities, hysteria
Economic Impacts: Loss or damage to homes and businesses, disruption of business and income, cost of clean-up
Environmental Impacts: Water quality (depending on type of attack), air quality (depending on type of attack)
Infrastructure Impacts: Power outages, loss or damage to structures and transportation infrastructure (roads, bridges, rail)
Dam Failure
“The sudden breach of a river water containment wall, known as a dam, which results in a sudden and uncontrolled downstream rush of water and debris.” (Haddow, Bullock, & Coppola, 2014, pg.389).
At any time throughout the
year 21 0 0
Improbable Critical Moderate
Days Weeks Months
$0
People living within the risk area
People who cannot evacuate
Public Health Impacts: Death, injury, illness (water-borne), standing water, exacerbation of chronic illnesses Cascading effects: Flood
Social Impacts: Displacement of population, disruption of normal activities, evacuation
Economic Impacts: Loss or damage to homes and businesses, disruption of business and income, cost of clean-up
Environmental Impacts: Erosion, water quality, change in topography, change in natural habitat
Infrastructure Impacts: Power outages, loss or damage to structures and transportation infrastructure (roads, bridges, rail)

32
Region 11 Hazard Mitigation Plan 2.0 Risk Assessment
TABLE 2.5 HAZARD SNAPSHOTS
Hazard Description Period of
Occurrence # of
Years # of
Events Probability Severity
Regional Risk
Warning Time Total
Damages to Date
Vulnerable Populations
Drought
“Extended period of unusually low precipitation that produces a temporary shortage of water for people, animals, and plants (Keller, DeVecchio, 2015).
Summer months or periods of low
precipitation 9 10 1.1
Occasional Negligible Low Weeks
Months $0
Agricultural workers
Public Health Impacts: Illness (water-borne), insect infestations, compromised food, standing water Cascading effects: Extreme temperatures Mass movements
Social Impacts: Disruption of recreational activities
Economic Impacts: Loss of crops and livestock
Environmental Impacts: Erosion, water quality, change in topography, change in natural habitat, air quality
Infrastructure Impacts: Power outages
Earthquake
“Sudden, rapid shaking of the earth’s crust cause by the breaking and shifting of tectonic plates beneath the earth’s surface” (Haddow, Bullock, & Coppola, 2014, pg.34).
At any time throughout the
year 16 12
0.75 Occasional Negligible Low None $0
Everyone
Public Health Impacts: Death, injury, PTSD, Exacerbation of chronic illnesses Cascading effects: Mass movements HazMat Radiological
Social Impacts: Displacement of population, disruption of normal activities, hysteria
Economic Impacts: Loss or damage to homes and businesses, disruption of business and income, cost of clean-up
Environmental Impacts: Erosion, air quality, water quality, change in natural habitat
Infrastructure Impacts: Power and water outages, loss or damage to structures and transportation infrastructure (roads, bridges, rail)

33
Region 11 Hazard Mitigation Plan 2.0 Risk Assessment
TABLE 2.5 HAZARD SNAPSHOTS
Hazard Description Period of
Occurrence # of
Years # of
Events Probability Severity
Regional Risk
Warning Time Total
Damages to Date
Vulnerable Populations
Extreme Temperatures
“Major diversions in average seasonal temperatures. Extreme heat occurs when temperatures of ten or more degrees above the average high temperature persist across a geographic region for several days or weeks. There is no standard definition for extreme cold, but generally refers to periods of colder than normal conditions.” (Haddow, Bullock, & Coppola, 2014).
Any season, but generally
summer and winter
7 8 1.14
Probable Negligible Moderate
Hours Days
$0
Children Elderly adults Poor
Public Health Impacts: Frostbite, heat stroke, exacerbation of chronic illnesses Cascading effects: Severe weather
Social Impacts: Disruption of recreational activities
Economic Impacts: Disruption of business and income
Environmental Impacts: Air quality, water quality
Infrastructure Impacts: Power outages, damage to structures
Flood
“An overabundance of water that engulfs land and other property that is normally dry” (Haddow, Bullock, & Coppola, 2014, pg.32.) At any time
throughout the year
19 57 3
Probable Critical High Hours Days $61.7M
Homeless Poor Children Elderly Adults People living
within risk area People who
cannot evacuate
Public Health Impacts: Death, injury, illness (water-borne), standing water, exacerbation of chronic illnesses Cascading effects: Dam failure Mass movements Social Impacts: Displacement of population, disruption of normal activities, hysteria, evacuation
Economic Impacts: Loss or damage to homes and businesses, disruption of business and income, cost of clean-up

34
Region 11 Hazard Mitigation Plan 2.0 Risk Assessment
TABLE 2.5 HAZARD SNAPSHOTS
Hazard Description Period of
Occurrence # of
Years # of
Events Probability Severity
Regional Risk
Warning Time Total
Damages to Date
Vulnerable Populations
Environmental Impacts: Erosion, water quality, air quality, change in natural habitats
Infrastructure Impacts: Power and water outages, loss or damage to structures and transportation infrastructure (roads, bridges, rail)
HazMat
“Hazardous materials are chemical substances that if released or misused can pose a threat to environment or personal health” (Haddow, Bullock, & Coppola, 2014, pg.55).
At any time throughout the
year 25 162
6.48 Frequent Critical High None $204K
Everyone surrounding the incident
Public Health Impacts: Death, injury, illness, PTSD, compromised food Cascading effects: Radiological
Social Impacts: Displacement of population, disruption of normal activities, hysteria, evacuation
Economic Impacts: Loss or damage to homes, businesses and crops, disruption to businesses and income, cost of clean-up
Environmental Impacts: Air quality, water quality, change of natural habitats
Infrastructure Impacts: Loss or damage to structures and transportation infrastructure (roads, bridges, rail)
Mass Movements
Sinking, settling, or other lowering of parts of the crust of the Earth (Keller, DeVecchio, 2015)
At any time throughout the year. Increased chance following long periods of
heavy rain, snowmelt, or
near construction activity
10 147 14.7
Frequent Marginal Moderate Days
Weeks Months
$18.6M
People living within the risk area
People who cannot evacuate
Public Health Impacts: Death, injury Cascading effects: Earthquakes
Social Impacts: Displacement of population, disruption of normal activities, evacuation
Economic Impacts: Loss or damage to homes and businesses, disruption to businesses and income, cost of clean-up
Environmental Impacts: Erosion, change in topography, change of natural habitats
Infrastructure Impacts: Loss or damage to structures and transportation infrastructure (roads, bridges, rail)

35
Region 11 Hazard Mitigation Plan 2.0 Risk Assessment
TABLE 2.5 HAZARD SNAPSHOTS
Hazard Description Period of
Occurrence # of
Years # of
Events Probability Severity
Regional Risk
Warning Time Total
Damages to Date
Vulnerable Populations
Radiological
Radiation is any form of energy that travels through space or matter. The radiation emitted by many radioactive isotopes contains enough energy to change the physical state of the material through which it passes. A radiological emergency is an incident that poses an actual or potential hazard to public health or safety or loss of property. (FEMA)
At any time throughout the
year N/A N/A N/A
Remote Critical Moderate
Hours Days
Weeks $0
Everyone People who
cannot evacuate
Public Health Impacts: Death, illness, injury (burns), cancer, compromised food Cascading effects:
Social Impacts: Displacement of population, disruption of normal activities, hysteria, evacuation
Economic Impacts: Loss or damage to homes and businesses, disruption to businesses and income, cost of clean-up
Environmental Impacts: Air quality, water quality, change of natural habitats
Infrastructure Impacts: Power and water outages, loss or damage to structures and transportation infrastructure (roads, bridges, rail)
Severe Weather
Severe weather “affects considerable portions of North America and cause significant death and destruction each year” (DeVecchio & Keller, 2015). Includes instances of hail, heavy snow, high wind, lighting, strong wind, thunderstorm wind, winter storms and winter weather.
The various types of severe
weather can occur year-round
59 264 4.47
Frequent Marginal Moderate Days
Weeks $3M
Children Elderly adults Poor
Public Health Impacts: Exacerbation of chronic illnesses Cascading effects: Flood Drought Social Impacts: Disruption of normal and recreational activities, evacuation
Economic Impacts: Loss or damage to homes and businesses, disruption to businesses and income, cost of clean-up

36
Region 11 Hazard Mitigation Plan 2.0 Risk Assessment
TABLE 2.5 HAZARD SNAPSHOTS
Hazard Description Period of
Occurrence # of
Years # of
Events Probability Severity
Regional Risk
Warning Time Total
Damages to Date
Vulnerable Populations
Environmental Impacts: Air quality, water quality, change of natural habitats, erosion
Infrastructure Impacts: Power and water outages, loss or damage to structures and transportation infrastructure (roads, bridges, rail)
Wildfire
“A large, often out-of-control burning of trees, fallen wood, detritus, and other debris in uninhabited or sparsely inhabited forest or grasslands” (Haddow, Bullock, Coppola, 2014).
At any time throughout the year. Increased chance following
dry weather
N/A N/A N/A
Remote Negligible Low None Hours $0
Everyone surrounding the incident
Public Health Impacts: Illness (breathing), death, injury (burns), PTSD Cascading effects: Flood
Social Impacts: Disruption of normal activities, displacement of population, evacuation
Economic Impacts: Loss or damage to homes and businesses, disruption to businesses and income, cost of clean-up
Environmental Impacts: Air quality, water quality, change of natural habitats, erosion
Infrastructure Impacts: Power and water outages, loss or damage to structures

37
Region 11 Hazard Mitigation Plan 2.0 Risk Assessment
2.2 PROFILE HAZARDS
§201.6(c)(2)(i)
[The risk assessment shall include a] description of the…location and extent of all natural hazards that can affect the jurisdiction. The plan shall include information on previous occurrences of hazard events and on the probability of future hazard events.
Section Overview
Several natural and human-caused hazards affect Region 11, as noted in Section
2.1. This section contains a profile of each hazard considered by this plan, which provides
details on how the hazard impacts the area. Within each profile, research and historical data
informs the following elements:
Hazard Overview: Defines the hazard.
Possible Causes: Describes a variety of causes that can contribute to the
occurrence of a hazard.
Location & Extent: Identifies the physical places in the region that are vulnerable to
the hazard and the severity of a hazard in a given location.
Historical Occurrences: Summarizes significant past events related to the hazard.
Impact & Social Vulnerability: Describes impacts on different topics such as health,
the environment, or infrastructure that may result from the hazard as well as specific
populations that may be vulnerable.
Loss & Damages: Outlines the methods used for loss amounts (of deaths, injury
and/or property damage depending on information available) and estimates based
on historical information and vulnerable populations, structures, and infrastructure.
Probability & Severity Calculations: Detailed methods of calculating probability
and severity of each hazard.
Risk Map: Graphically shows the geographic locations in the counties that are
vulnerable to each hazard.
The beginning of each profile displays a table that contains a definition of the hazard,
possible hazard warning time, a summary of the risk assessment as calculated in the profile,
and the 2013 West Virginia Hazard Mitigation Plan risk assessment determination for that
hazard.

38
Region 11 Hazard Mitigation Plan 2.0 Risk Assessment
2.2.1 ACTS OF VIOLENCE
"An intentional use of force or power, against oneself, another person, or against a group or community, which either results in or has a high likelihood of resulting in injury, death, psychological harm, maldevelopment, or
deprivation" (WHO).
Period of Occurrence Warning Time Region 11 Risk
Assessment State Risk Assessment
At any time throughout the year None / Days / Weeks MODERATE Not ranked
With the increase in violence countrywide, it is necessary to analyze the potential
impacts different acts of violence could have in Brooke and Hancock County. For the
purposes of this analysis, acts of violence are not considered to be routine law enforcement
activities, robbery, homicides, kidnapping, sexual assault, or domestic disputes. Acts of
violence considered include the following topics.
Active Assailants: Attacks with weapons, including plots of attacks located at, but
not limited to schools, work places, shopping plazas, industrial facilities,
infrastructure, and government buildings.
Civil Disturbance: Including but not limited to protests relating to environmental
issues due to heavy industry, politics, race, religion, etc.
Drug and Gang-Related Violence: Increase in consumption translate directly or
indirectly to increase in violence and criminal activity.
Terrorism/Bioterrorism: To include active groups in West Virginia, Pennsylvania
and Ohio.
Human activity is difficult, if not impossible to predict. An active assailant can be
described as, “an individual actively engaged in killing or attempting to kill people in a
confined and populated area. In most cases, active assailants use firearms and there is no
method to their selection of victims. Active assailant situations are unpredictable and evolve
quickly” (Washoe County Sheriff's Department, n.d.).
The region is home to a great deal of industry, which could lead to various types of
demonstrations, protests, sabotage, etc. Other local events, such as sporting events, could
lead to smaller-scale disturbances.
Both Brooke and Hancock Counties are within the Appalachia High Intensity Drug
Trafficking Areas (HIDTA). According to the 2015 AHIDTA report, in most recent years,
prescription drugs, methamphetamine and heroin have had significant impact in the area;

39
Region 11 Hazard Mitigation Plan 2.0 Risk Assessment
the cost associated with supply and demand for prescription drugs rose, which resulted in
heroin consumption, a cheaper alternative. However, marijuana is the most commonly used
illicit drug in the United States and the geography of the Appalachia HIDTA consists of areas
across Kentucky, Tennessee, Virginia, and West Virginia that are conducive to cultivation,
production and trafficking of marijuana (Appalachia HIDTA, 2015). The map below shows
the AHIDTA counties.
Due to the proximity to large cities like Pittsburgh, PA, Wheeling, WV, Morgantown,
WV, and Steubenville, OH, Brooke and Hancock Counties have the potential for gang-
related activities. In an article in February of 2016, WAJR reported that drug dealers from as
far away as Detroit, MI, were targeting West Virginia for sales of heroin (WAJR, 2016). In
September of 2014, regional media reported that Steubenville, OH had been having trouble
with violence and drug trafficking from gangs (The Intelligencer, 2014).
Additionally, various media outlets have explored the possibility of terrorist activities
in the region. Local government officials and emergency managers routinely coordinate with
the West Virginia Intelligence Fusion Center (WVFIC) in Charleston, WV on these matters.

40
Region 11 Hazard Mitigation Plan 2.0 Risk Assessment
POSSIBLE CAUSES
There is no single cause of acts of violence; it is typically a non-rational, complicated,
intertwined, series of reasons that have the outcome of violence. In his article Causes of
Terrorism, Nick Grothaus lays out the most common causes cited by leaders in the field of
counterterrorism. These categories may apply to other types of violence not related to
terrorism.
Ethno-Nationalism: The desire of a population to break away from a government or
ruling power and create a state of their own.
Alienation/Discrimination: Individuals or groups face discrimination leading to
further feelings of isolation. These people may become jaded towards society and
feel excluded.
Religion: Religion as a part of terrorism has been mainly attributed to Islamic
fundamentalism although other religions have also had involvement in terrorist
activities. For example, Christian Fundamentalists target abortion clinics, the Aryan
Nation and the Church of Christ, Christians target the Jews and minorities (Post,
2007, pp. 211-212).
Socio-Economic Status: Individuals and groups may be driven by a sense of
relative depravation and lack of upward mobility within society.
Political Grievances: A lack of political inclusiveness or grievances against a
certain political order may cause individuals to join or create terrorist groups.
LOCATION AND EXTENT
Potential locations of acts of violence include schools, government buildings,
shopping plazas, businesses, and infrastructure. Brooke and Hancock Counties have events
such as festivals, county fairs, concerts, etc., assets, and facilities that could lead to
potential acts of violence.
Due to the proximity of both counties to large cities with drug trafficking, gang
activities, and reports of terrorist camps, among other considerations, the entire
geographical areas of Brooke and Hancock Counties are determined to be at risk for acts of
violence. Of particular concern are the areas surrounding Route 22 that connect
Pennsylvania to Ohio through Weirton in West Virginia, Route 30 passing through Chester,
and Route 2 that runs along the entire western border of West Virginia, since these are the

41
Region 11 Hazard Mitigation Plan 2.0 Risk Assessment
routes that allow drug transportation between one state and another.
HISTORICAL OCURRENCES
September 25, 2009
Police arrested two people, a student and his mother, in relation to threatening text
messages received by various students at Weirton High School (WHSV 3ABC, 2009).
December 30, 2016
A man was charged with threatening to commit a terrorist act after he made threats
toward a school and its employees in Hancock County citing that he could “get away with it
because he is bi-polar” and could say he forgot to take his medication. The man was upset
because a bus driver did not drop his child off at his house (Black, 2016).
December 17, 2015
In Harrisburg, PA, a 19 year old was arrested for trying to help ISIS. Investigators
discovered several items in his possession leading them to believe he was planning an
attack. The teenager used social media to advocate violence and disseminate ISIS
propaganda (CBS Pittsburgh, 2015).
The occurrence of this event indicates that there have been activities reported in
Pennsylvania that are connected with terrorism. If this type of activity can be located in a
small city like Harrisburg, the probability exists that the same type or similar activity can be
found in a larger city such as Pittsburgh. Pittsburgh is approximately 30 miles from the
center of Weirton.
IMPACTS AND SOCIAL VULNERABILITY
Social vulnerability from acts of violence depends on what individual, group of people
or organization is perpetrating the crime and who it is against as well as what the motivation
is. It is impossible to predict who will target someone at any given time, for this reason it is
assumed that all people are equally at risk to an act of violence; even if they are not the
intended target, they may be bystanders that come in contact with the violent event.
In the case of bioterrorism, there are some specific agents that have been identified
as possible methods of infection: anthrax, botulism, plague, smallpox, tularemia, and viral
hemorrhagic fever. Each one of these has specific effects on the body.
When the form of attack is an explosive, the main injuries are caused by
barotraumas, which are damage resulting from dramatic pressure change, and blast injuries,

42
Region 11 Hazard Mitigation Plan 2.0 Risk Assessment
to include damage to hollow organs such as the ears, eyes, lungs, gastrointestinal tract,
bunt trauma injuries, fractures, burns, crush injuries and respiratory problems (Clements,
2009, pp.66-69). If chemical agents are used as a weapon, these may have different effects
depending on the type. For information on hazardous materials health effects, see section
2.2.7 Hazmat.
During active assailant events, the injuries involved can be directly caused by a
variety of weapons such as rifles, pistols, axes, or knives; indirectly injuries resulting from
falls or fighting may also be present. Any act of violence, regardless of the cause, has the
potential to cause mental distress, anxiety, panic attacks, and post-traumatic stress at
varying degrees of intensity and for varying amounts of time in each individual directly or
indirectly affected by the attack.
LOSS AND DAMAGES
An estimation of loss and damages is not calculated for acts of violence because
there has been no significant event relating to this hazard in the planning area. In addition,
acts of violence, no matter what type, are random, unpredictable acts that cannot be
financially estimated.
PROBABILITY AND SEVERITY CALCULATION
Instances of acts of violence can include such a wide variety of events that it is
impossible to calculate the amount of incidents that have occurred with any accuracy and
assign probability based on historical data alone. However, given that there have been
some instances of violence in the region, the probability is determined as “remote”.
Although the impacts of acts of violence have been marginal or even negligible in the
past, the possible severity of acts of violence can be “catastrophic” for the region, depending
on the incident.
Given the “remote” probability of an event, combined with its potential “catastrophic”
effects, acts of violence are a “moderate” risk to region 11, according to the risk assessment
matrix.
RISK: MODERATE
PROBABILITY: REMOTE
SEVERITY: CATASTROPHIC

43
Region 11 Hazard Mitigation Plan 2.0 Risk Assessment
RISK MAP
No risk map is calculated for this hazard due to the highly unpredictable nature of
any type of acts of violence.

44
Region 11 Hazard Mitigation Plan 2.0 Risk Assessment
2.2.2 DAM FAILURE
“The sudden breach of a river water containment wall, known as a dam, which results in a sudden and uncontrolled downstream rush of water and debris.” (Haddow, Bullock, & Coppola, 2014, pg.389).
Period of Occurrence Warning Time Region 11 Risk
Assessment State Risk Assessment
At any time throughout the year Weeks / Days / Months MODERATE N/A
The West Virginia Department of Environmental Protection (WVDEP) defines a dam
as “an artificial barrier or obstruction that impounds, or will impound water and must be 25
feet or more in height and impound 15 or more acre-feet of water volume or six feet or more
in height and impound 50 or more acre-feet of water volume” (WVDEP, 2009).The WVDEP
is in charge of conducting inspections of existing dams and those under construction, and
reviewing design plans to ensure that they are constructed, maintained, and operated or
removed in a safe manner, as well as responding to emergencies (WVDEP, 2016).
The WVDEP classifies dams into four categories, including the following:
Class 1 (High Hazard): Dams located where failure may cause loss of human life or
major damage to dwellings, commercial or industrial buildings, main railroads,
important public utilities, or where a high risk highway may be affected or damaged.
All Class 1 - High Hazard dams must have an Emergency Action Plan as required by
the West Virginia Department of Environmental Protection (2016).
Class 2 (Significant Hazard): Dams located where failure may cause minor
damage to dwellings, commercial or industrial buildings, important public utilities,
main railroads, or cause major damage to unoccupied buildings, or where a low risk
highway may be affected or damaged. Loss of human life from a failure of a Class 2
dam is unlikely.
Class 3 (Low Hazard): Dams located in rural or agricultural areas where failure may
cause minor damage to non-residential and normally unoccupied buildings, or rural
or agricultural land. Failure of a Class 3 dam would cause only a loss of the dam
itself and a loss of property use, such as use of related roads, with little additional
damage to adjacent property.
Class 4 (Negligible Hazard): Dams where failure is expected to have no potential
for loss of human life, no potential for property damage, and no potential for
significant harm to the environment.

45
Region 11 Hazard Mitigation Plan 2.0 Risk Assessment
Dams are used for a variety of purposes (recreation, flood control, water storage,
irrigation, mine tailings, electrical generation, debris control or navigation); in Region 11, the
14 dams are used for one of the following, as described by FEMA.
Flood Control: Prevent loss of life and property caused by flooding. They impound
floodwaters and either release them under control to the river below or sore or divert
the water for other uses.
Recreation: Facilities designed for boating, skiing, camping, picnic areas, and boat
launches can all be supported by dams.
Navigation: Provide a stable system of inland river transportation.
Mine Tailings: Allow the mining and processing of coal and other minerals while
protecting the environment.
The average age of dams in the
U.S. is 52 years old. In Brooke and
Hancock Counties the average is 48
based on data available from the NPDP
and the National Inventory of Dams (NID).
According to the 2013 Report Card for
America’s Infrastructure, the number of
high-hazard dams in the country is
beginning to rise due to aging
infrastructure and gives an overall
average score of dams in the country a
“D”. However, the state of West Virginia
has a higher percentage of dams with an
emergency action plan (EAP), ranked at
number 18 nationwide with 91%, and is
also ranked in the higher percentage of
the states for the amount of budget
dedicated to dam safety, ranked at number 20 with an average budget of $625k (ASCE,
2013). The top map above shows states in lighter blue having a higher percentage of EAPs.
In the map below, the states with lighter blue indicate states that have higher dam safety
budgets.

46
Region 11 Hazard Mitigation Plan 2.0 Risk Assessment
POSSIBLE CAUSES
Dam failure is often the result of prolonged rainfall or flooding or, during prolonged
dry periods, erosion. The primary hazard surrounding dam failure is the swift and
unpredictable flooding of areas immediately downstream. According to the Association of
State Dam Safety Officials (ASDSO), most dam failures fall into one of three categories:
structural failures, mechanical failures and hydraulic failures.
Structural Failures: Foundation or piping defects, including settlement and slope
instability or damaged cause by earthquakes, have caused about 30% of all U.S.
dam failures.
Mechanical Failures: Malfunctioning gates, conduits or valves can cause dam
failure or flooding both upstream and downstream.
Hydraulic Failures: Overtopping of a dam is often a precursor of dam failure.
National statistics show that overtopping due to inadequate spillway design, debris
blockage of spillways or settlement of the dam crest account for approximately 34%
of all U.S. dam failures (2012, p.8).
Dam failures generally result from a complex interrelationship of several failure
modes. Uncontrolled seepage may weaken the soil and lead to a structural failure.
Structural failure may shorten the seepage path and lead to a piping failure. Surface erosion
may lead to structural or piping failures.
LOCATION AND EXTENT
The National Performance of Dams Program (NPDP) from Stanford University
maintains a database of dams in the United States and identifies 12 dams within the borders
of Region 11; nine of those are classified as Class 1 or High Hazard dams, two are
classified as Class 2 or Significant Hazard, and one is unknown. The National Inventory of
Dams (NID) identifies Harmon Creek Dam #6 as being in Brooke County but has no location
data available for the dam; the NPDP does not recognize this dam. For this reason, it is
omitted from the list. Although physically located just across the state line in Pennsylvania,
Little Blue Run Dam, classified as High Hazard, could affect the north easternmost part of
Hancock County near the Ohio River should it fail. For this reason it is included in the
following list of dams in Region 11.

47
Region 11 Hazard Mitigation Plan 2.0 Risk Assessment
Dams may have a long period of warning time before they fail when it is related to
erosion or maintenance issues because inspections should be carried out regularly. There
may be less warning time when a failure is due to heavy rain that could overtop the structure
and cause problems downstream. This means that dam failure could happen at any time
throughout the year and is not confined to any one season or period of time.
The dams in the region, although of high or significant hazard, are located in areas of
low population that are mostly wooded areas.
TABLE 2.6 DAMS IN REGION 11
Dam Name Owner Purpose Height Hazard City County Built
Burek Farm Pond Joe Burek Recreation 34 Unknown Short Creek Brooke 1988
Castleman's Run Lake No. 1 WVDNR Recreation 34 High Bethany Brooke 1961
Cherry Lake Dam Paul Settle Recreation 21 High New Cumberland Hancock 1972
Harmon Creek No. 1 Dam (Sappington Run)
City of Weirton Flood Control 84 High Weirton Brooke 1974
Harmon Creek No. 2 Dam City of Weirton Flood Control 71 High Weirton Brooke 1973
Harmon Creek No. 3 Dam (Mechling Run)
City of Weirton Flood Control 77 High Colliers Brooke 1970
Harmon Creek No. 4 Dam (Mechling Run) City of Weirton Flood Control 64 High Colliers Brooke 1970
Harmon Creek No. 13 Dam City of Weirton Flood Control 72 High Colliers Brooke 1973
Harmon Creek No. 14 Dam (a.k.a. Alexanders Run) City of Weirton Flood Control 76 High Weirton Brooke 1968
New Cumberland Locks and Dam (New Cumberland Pool)
CELRP Navigation 64 High New Cumberland Hancock 1963
Tomlinson Lake Dam (Tomlinson Run Dam) WVDNR Recreation 38 Significant New Manchester Hancock 1936
Woodland Lake Dam D. Dawson Recreation 34 Significant Gas Valley Hancock 1969
Little Blue Lake Dam* First Energy Generation, LLC Tailings 122 High Greene, PA Beaver 1977
* Dam located outside Region 11 boundaries but failure effects within range of Hancock County. SOURCES: National Inventory of Dams (NID) by US Army Corps of Engineers
Stanford University National Performance of Dams Program
HISTORICAL OCCURRENCES
The Stanford National Performance of Dams Program (NPDP) tracks dam incidents

48
Region 11 Hazard Mitigation Plan 2.0 Risk Assessment
that occur around the world and collects data related to these incidents. According to the
NPDP there have been no incidents within Brooke or Hancock Counties or any other dam
outside the jurisdiction that would affect the region. However, dam failures have occurred in
West Virginia and in the surrounding states. Two of the closest, most notable dam failures
near Region 11 are described herein.
February 26, 1972
The failure of the Buffalo Creek Valley
coal-waste impoundment failed and killed 125
people and caused more than $400M in
damages as it flooded the area. It also
destroyed over 500 homes. (Damsafety.org,
n.d.). The photo to the right illustrates some of
the damages caused by the dam failure near
the town of Lorado, in Logan County, WV. This
is an example of what could happen in a West Virginia community if a dam were to fail in the
region.
June 14, 2004
The Simmons Dam in Washington County, PA overtopped after heavy rains. Some
inhabitants voluntarily evecuated the area and there were no significant damages caused.
The DEP ordered the dam owner to drain the lake and obtain necessary permits for the dam
improvements. This dam failure occurred in a neighboring counties.
IMPACTS AND SOCIAL VULNERABILITY
Dam failures themselves do not pose a threat to public health; the cascading effects
that occur after a failure are more concerning. When a dam fails it causes flooding
downstream that can cause death, injury, and illnesses relating to water-borne diseases and
standing water. The consequences of flooding from a dam can cause damage to buildings
and transportation infrastructure and power outages. As a result of flooding, people might
have to evacuate and be displaced from their homes. In a large enough event, this can
translate into economic loss for the area due to businesses closing and loss of workforce
including the cost of clean-up activities after the event.

49
Region 11 Hazard Mitigation Plan 2.0 Risk Assessment
LOSS AND DAMAGES
There have been no losses of life or property in Brooke or Hancock Counties since
there has never been a dam failure event in the region. However, this does not mean that
there will never be any losses due to this type of event.
“Dam safety risk assessment is like a stool that stands on three legs. These legs
quantify the likelihood that various initiating events (hydrologic, seismic, structural/internal,
mechanical, or human error) will occur; the likelihood that the dam would fail given these
initiating events; and the likelihood that, given a failure, the resulting flood wave would result
in various levels of damage. The meaningful quantification of risk depends on credible
estimates of the damages that would result from each significant failure scenario. Loss of
human life is generally accepted as the most important consequence so it often dominates
dam-safety decisions. Unfortunately, the confidence with which life loss can currently be
estimated is low. This high level of uncertainty applies to both statistical confidence limits
and to expert opinion. As such, this single limitation is a critical hindrance to the credibility
and value of dam-safety risk assessment results. Indeed, some would like to push the stool
over on its weak leg and abandon probabilistic risk assessment altogether” (USACE, 2002).
PROBABILITY AND SEVERITY CALCULATION
Based on the absence of events that have occurred in the area, the probability of a
dam failure event is low, but not impossible; something that has not happened yet does not
mean that it will never happen. Because there have been no occurrences of dam failure in
the region, it is impossible to calculate the probability of it happening in any given year
based on historical events. However, even though there have been no occurrences in the
past, the risk of a failure is still present due to the fact that there are dams in the area,
therefore the probability of a dam failure is assigned as “improbable”.
The severity of a failure can vary from one dam to another and cause varying
amounts of damages. However, the majority of dams, although designated as high hazard,
may not affect large amounts of population but may cause structural damage. Because of
the majority designation of high hazard, the severity is determined to be “critical”.
SEVERITY: CRITICAL
PROBABILITY: IMPROBABLE

50
Region 11 Hazard Mitigation Plan 2.0 Risk Assessment
With a probability determination of “improbable” and given the “critical” severity of the
hazard, the risk assessment matrix gives dam failures a “moderate” risk to the region.
RISK MAP
The map to the
right shows the
locations of the twelve
dams that affect Region
11. Following this map
are closer views of each
dam showing the
possible flooding that
could be caused by
failure. These are
organized in
alphabetical order.
There is no map of the
New Cumberland Locks
and Dam because even
if it failed, it would not
cause any significant
rise in the river level
because it is a navigational dam, not a flood control dam. The maps show the dam location,
the lake, stream or creek on which they are located and surrounding roads. In some cases
where the dams are close to the 100-year floodplain, it is shown.
These renderings are not intended to be utilized for engineering purposes but rather
general mitigation planning purposes. The failure was calculated using a combination of
available data and analysis of topography; each dam’s emergency operations plan (EOP)
maintained by the owner should contain exact failure specifications and outcomes.
RISK: MODERATE

51
Region 11 Hazard Mitigation Plan 2.0 Risk Assessment

52
Region 11 Hazard Mitigation Plan 2.0 Risk Assessment

53
Region 11 Hazard Mitigation Plan 2.0 Risk Assessment

54
Region 11 Hazard Mitigation Plan 2.0 Risk Assessment
2.2.3 DROUGHT
“Extended period of unusually low precipitation that produces a temporary shortage of water for people, animals, and plants (Keller & DeVecchio, 2015).
Period of Occurrence Warning Time Region 11 Risk
Assessment State Risk Assessment
Summer months or periods of low precipitation
Weeks / Months LOW LOW
A drought, according to the National Center for Environmental Information (NCEI), is
a complex event that is difficult to monitor or define. It is a “prolonged dry period in natural
climate cycle. It is a slow-onset phenomenon caused by rainfall deficit combined with other
predisposing factors. They are often predictable” (WHO).
The most prevalent method of measuring
drought severity in the United States is the Palmer
Drought Severity Index (PDSI) developed in 1965.
The index takes a number of factors into account to
assign a score between -4 (extremely dry) and +4
(extremely wet), with 0 being the “normal” value
(Palmer, 1965). Palmer drought values typically
reflect long term drought, but can be calculated both
monthly and weekly. The PDSI is shown graphically to
the right.
Drought conditions are not the same
everywhere. To know what drought conditions for the
area are, it is necessary to know the normal
precipitation amount and average climate of the
region. The NCEI provides average “normal” of
precipitation; the closest city to the Region 11 area
with recorded information is Wheeling, WV. In Wheeling, the average annual precipitation
between the years of 1981 and 2010 is of 3.36 inches of rain.
POSSIBLE CAUSES
Precipitation in the form of rain or snow falls in uneven patterns across the country.
The amount of precipitation at a particular location varies from year to year, but over a
TABLE 2.7 PALMER DROUGHT SEVERITY INDEX
< -4.0 Extreme drought
-3.99 to -3.0 Severe drought
-2.99 to -2.0 Moderate drought
-1.99 to -1.0 Mild drought
-0.99 to -0.5 Incipient drought
-0.49 to 0.49 Near normal
0.50 to 0.99 Incipient moist spell
1.0 to 1.99 Moist spell
2.0 to 2.99 Unusual moist spell
3.0 to 3.99 Very moist spell
> 4.0 Extreme moist spell

55
Region 11 Hazard Mitigation Plan 2.0 Risk Assessment
period of years, the average amount is fairly constant. The amount of rain and snow also
varies with the seasons. Even if the total amount of rainfall for a year is about average,
rainfall shortages can occur during a period when moisture is critically needed for plant
growth, such as in the early summer. When little or no rain falls, soils can dry out and plants
can die. When rainfall is less than normal for several weeks, months, or years, the flow of
streams and rivers declines, water levels in lakes and reservoirs fall, and the depth to water
in wells increases. If dry weather persists and water-supply problems develop, the dry period
can become a drought (USGS, 2016).
There are four types of droughts, increasing in severity level: meteorological drought,
hydrological drought, agricultural drought, and socioeconomic drought.
Meteorological Drought: Dry weather patterns dominating an area.
Hydrological Drought: Usually after several months of meteorological drought,
when low water supplies become noticeable (i.e. low water levels in streams and
reservoirs).
Agricultural Drought: When crops become affected by the drought conditions.
Socioeconomic Drought: Relates the supply and demand of various commodities
to drought.
LOCATION AND EXTENT
Both Brooke and Hancock Counties have experienced droughts that affected the
entire region in the past. Generally, the extent of drought conditions would encompass an
entire county, as well as neighboring counties. This hazard is a region-wide hazard that can
affect all areas and jurisdictions within the region. Droughts are widespread events that may
extend to several states in varying degrees of severity. In Brooke and Hancock Counties,
the extent of a drought would be equal given the region’s geography and environmental
qualities.
A drought can vary in severity throughout the year; what starts out as a mild drought
can reach severe or extreme drought status and then return to a mild drought. This process
could take weeks or even months and the effects could be felt even months after the
drought conditions are over.

56
Region 11 Hazard Mitigation Plan 2.0 Risk Assessment
HISTORICAL OCCURRENCES
August and September, 1999
The NOAA
National Centers for
Environmental Information
(NCEI) Storm Events
Database records one
drought event in both
Brooke and Hancock
Counties lasting the
months of August and
September of 1999, but
no disaster declarations
were issued. Dry
conditions began in July
of the previous year and
continued across
Northern West Virginia. Rainfall deficits in August and September averaged between 15%
and 25% below normal conditions and for the previous year ranged from 10% to 20% below
normal. Roughly, this translates to around two to six inches of rain.
The image above illustrates the NOAA record dated for the week of September 11,
1999, during the drought. As shown in the blue circle on the map, the Northern Panhandle of
West Virginia is tinted red indicating Extreme Drought measuring -4.0 or less.
Since 2007, the latest year of record
available on the National Drought Mitigation
Center’s Drought Impact Reporter, there have
been between three and five droughts in
Brooke and Hancock Counties as shown in
the map to the right. Information was
gathered from sources such as the U.S.
Drought Monitor Map Archive as well as from
the National Weather Service’s (NWS)
Climate Prediction Center. The data analyzed
from these sources had some minor discrepancies about dates of reports indicating the

57
Region 11 Hazard Mitigation Plan 2.0 Risk Assessment
highest drought conditions in the area. However, they do correspond in year and season.
The U.S. Drought Monitor Map Archive shows “abnormally dry” conditions for Brook and
Hancock Counties for June to August of 2007, October of 2008 to January of 2009,
sporadically from March to November of 2009, on and off from April to November of 2010,
June through October of 2012, August to October of 2015, and July and August of 2016 with
“moderate drought” conditions in June of 2007 and July of 2012. Data from the NWS
Climate Prediction Center indicates “severe drought” conditions for September of 2007,
August and September of 2012, and September of 2015.Both sources are consistent in
identifying years of drought to be in the summer months of 2007, 2012 and 2015.
As mentioned previously, amount of precipitation and the variants it has can play a
role in determining drought conditions. For the drought year of 1999, the average
precipitation was a -2.94 departure from the mean of 0.05 and in 2007 it was -1.08.
However, according to data from NCEI, the years previously determined to be years of
abnormal dryness only have -0.02 departure from the mean in 2012 and in 2015 the
average was 0.82 above the mean.
IMPACTS AND SOCIAL VULNERABILITY
Droughts can impact drinking water both in terms of availability and demand.
According to the U.S. Environmental Protection Agency (EPA), as temperatures rise, people
and animals need more water to maintain health. Additionally, a large number of economic
activities require abundant water sources such as energy production (hydroelectric and
nuclear power generation, for example) and growing food crops. As droughts reduce
available water sources, local officials will need to closely monitor water usage to maintain
enough for critical uses.
LOSS AND DAMAGES
Droughts mainly affect people, animals and crops rather than structures. The
following table shows data from the U.S. Department of Agriculture’s (USDA) survey and
inventory data for a few selected years. The year 1997 was chosen for setting a precedent
for the drought year of 1999. Additionally, 2002, 2007 and 2012 are the National Agricultural
Statistics Service (NASS) census years so data from those publications is included. Also
included is available information for the years 2014, 2015 and 2016.The table shows how
drought can affect crops and livestock. For example, in the years following the 1999
drought, there was a reduction in hay yield and heads of cattle for each county. As

58
Region 11 Hazard Mitigation Plan 2.0 Risk Assessment
evidenced in the historical occurrences, 2012 also had impacts in the following years
regarding crop yield and amounts of heads of cattle.
TABLE 2.8 USDA SURVEY AND CENSUS INFORMATION (2002-2016)
# Farms Change from
previous year Hay Yield (In
Tons) Change from previous year
Heads of cattle Change from
previous record year
Broo
ke C
ount
y
1992 80 N/A N/A N/A 1,412 N/A
1997 95 +15 N/A N/A 1,840 +428
1999 95* N/C 2.0 N/A 2,000 +160
2002 98 +3 1.97 -0.03 938 -1,072
2007 104 +6 1.5 -0.47 1,961 +1023
2012 96 -8 1.6 +0.1 2,054 +93
2014 N/A N/A 1.7 +0.1 1,900 -154
2015 N/A N/A 1.6 -0.1 1,800 -100
2016 N/A N/A N/A N/A 1,900 +100
Total Change +16 -0.4 +478
# Farms
Change from previous year
Hay Yield (In Tons)
Change from previous year Heads of cattle
Change from previous record
year
Han
cock
Cou
nty
1992 75 N/A N/A N/A 952 N/A
1997 64 -11 N/A N/A 824 -128
1999 64* N/C 1.6 N/A 1,000 +176
2002 81 +17 1.42 -0.18 394 -606
2007 109 +28 1.22 -0.2 790 +396
2012 96 -13 1.5 +0.28 662 -164
2014 N/A N/A 1.35 -0.15 600 -62
2015 N/A N/A 1.35 N/C 600 N/C
2016 N/A N/A N/A N/A 600 N/C
Total Change +21 -0.25 -388
*Number of Farms is from 1997 Census, data not available for 1999. Survey Source: US Department of Agriculture National Agriculture Statistics Survey
1997, 2007, 2012, 2016
N/A - Not Available or Applicable N/C - No Change
PROBABILITY AND SEVERITY CALCULATION
Based on recorded events from the U.S. Drought Monitor Map Archive and the NWS
since 2007, the earliest year that both sources have records, there have been 10 events of
abnormally dry conditions. The latest year of record is 2016.

59
Region 11 Hazard Mitigation Plan 2.0 Risk Assessment
The severity of the drought hazard in Region 11 is determined to be very low due to
the lack of damage it causes to humans and structures.
With a value of 1.1 events in a given year, the probability of an event is determined
to be “occasional” and given the “negligible” severity of the hazard, the risk assessment
matrix gives this hazard a “low” risk to the region.
RISK MAP
Drought in Region
11 is most likely to occur in
land covered with crops.
According to the USDA,
crops are located in orange
areas shown on the map to
the right; these places
within the region would be
most susceptible to drought
conditions.
Number of events 10
= Probability OR = 1.1
Number of years 9
SEVERITY: NEGLIGIBLE
RISK: LOW
PROBABILITY: OCCASIONAL

60
Region 11 Hazard Mitigation Plan 2.0 Risk Assessment
2.2.4 EARTHQUAKES
“Sudden, rapid shaking of the earth’s crust cause by the breaking and shifting of tectonic plates beneath the earth’s surface” (Haddow, Bullock, & Coppola, 2014, pg.34).
Period of Occurrence Warning Time Region 11 Risk
Assessment State Risk Assessment
At any time throughout the year None LOW LOW
An earthquake’s sudden release of stored energy may manifest itself by the shaking
or displacement of the ground. According to the U.S. Geological Society, based on historical
trends, the frequency of an earthquake occurrence inversely relates to its magnitude. There
are an estimated 1.3 million earthquakes every year with a magnitude between 2.0 and 2.9
while there is, on average, one magnitude 8.0 or higher earthquake annually.
Earthquakes move or shake the earth in three different directions depending on the
plate movements: convergent, divergent, and transform generating primary and secondary
waves. There are a few ways to measure an earthquake:
Richter scale,
modified Mercalli Scale, and
peak ground acceleration (PGA).
Developed in 1935, the Richter scale
measures the scale and severity of an
earthquake, The magnitude of an earthquake can
range between 0 and 10. The image to the right
shows the Richter scale and what effects each
magnitude can have. The effects of an earthquake
can extend far beyond the site of its occurrence.
The modified Mercalli scale measures
earthquakes based on their intensity on the
surface. This scale, shown to the right, uses
roman numerals I through XII to denote detection
and damage levels associated with an
earthquake.
Peak ground acceleration (PGA) is “the
TABLE 2.9

61
Region 11 Hazard Mitigation Plan 2.0 Risk Assessment
maximum ground acceleration that occurred during earthquake shaking at a
location. PGA is equal to the amplitude of the largest absolute acceleration recorded
on an accelerogram at a site during a particular earthquake” (Douglas, 2003).
POSSIBLE CAUSES
The Earth is made up of tectonic plates; the boundary lines where these tectonic
plates meet are called faults. Friction along the boundaries or faults causes the rocks to
stress and strain. “When the stress of the rocks exceed their strength, that is, their ability to
withstand the force, the rock rupture and are permanently displaced along the fault plane”
(Keller & Devecchio, 2015) causing earthquakes that reach and affect the infrastructure on
the surface.
A common misconception is that hydraulic fracturing, or “fracking” is causing all of
the induced earthquakes. In reality, fracking “is directly causing a small percentage of the
felt-induced earthquakes observed in the United States…Most induced earthquakes in the
United States are a result of the deep disposal of fluids (waste water) related to oil and gas
production” (Rubinstein and Mahani, 2015).
LOCATION AND EXTENT
The United States has areas that are prone to earthquakes. The coasts of California,
Oregon and Washington are more vulnerable to seismic activity due to the presence of the
Ballenas, Brothers, and the San Andreas Faults on the west coast. Also of note is the New
Madrid Seismic Zone located in Arkansas, Missouri, and Tennessee. On the east coast,
there is the Eastern Tennessee Seismic Zone that stretches from Alabama to Virginia.
These faults can be seen in the map below to the left, shown in red. To the left is a map of
West Virginia showing how earthquake-prone the state is; Brooke and Hancock Counties fall
under a very low percentage of earthquakes.

62
Region 11 Hazard Mitigation Plan 2.0 Risk Assessment
According to the West Virginia Geological and Economic Survey, there have been no
earthquakes with epicenters originating in Brooke or Hancock Counties between 1824 and
2016. However, the state of West Virginia has had erthquake epicenters with a mangitude of
no more than 4.0-4.9 on the Richter scale, generally located in the central and southern
parts of the state.
Although no earthquake epicenters have originated in either Brooke or Hancock
Counties, there is still possibility of feeling earthquakes and their effects. An earthquake that
originates as far away as Canada can still have effects on the local region. For this reason,
the possible extent of the damage can be determined to be countywide if an earthquake that
is large enough reaches the area because the effects of earthquakes are not localized to
one region.
HISTORICAL OCCURRENCES
While earthquake epicenters have historically been nonexistent in Region 11, there

63
Region 11 Hazard Mitigation Plan 2.0 Risk Assessment
have been a few earthquakes that have been felt in the area since 1925 (NOAA). Of note
are the following events.
Wheeling, West Virginia
March 1, 1925. 7.0 Magnitude, 2 MMI. This earthquake’s epicenter originated in
Saguenay, Quebec, Canada, a distance of 1,209 miles away and was felt in Wheeling, WV.
No structural damage was caused by this earthquake in the area.
Wheeling, West Virginia
July 27, 1980. 5.1 Magnitude, 2 MMI. The epicenter was located in Sharpsburg, KY,
344 miles away and was registered in Wheeling, WV. No structural damage was caused by
this earthquake in the area.
Brooke and Hancock Counties
August 23, 2011. 5.8 Magnitude, 7MMI. An earthquake felt along the East Coast all
the way into Canada that originated in Louisa, VA was also felt in both Brooke and Hancock
Counties. No structural damage was caused by this earthquake in the area.
IMPACTS AND SOCIAL VULNERABILITY
Earthquakes can affect people and structures alike, although older structures may be
more susceptible to cracks and damage. “With most earthquakes, trauma caused by the
collapse of buildings is the cause of most deaths and injuries. However, a surprisingly large
number of patients require acute care for non-surgical problems such as acute myocardial
infraction, exacerbation of chronic diseases such as diabetes or hypertension, anxiety and
other mental health problems, respiratory disease from exposure to dust and asbestos fibers
from rubble, and near-drowning because of flooding from broken dams. An earthquake may
precipitate a major technologic disaster by damaging or destroying nuclear power stations,
hospitals with dangerous biologic products, hydrocarbon storage areas, and hazardous
chemical plants. As with most natural disasters, the risk of secondary epidemics is minimal,
and only mas vaccination campaigns based on results of epidemiological surveillance are
appropriate following earthquakes” (Noji, 1999).

64
Region 11 Hazard Mitigation Plan 2.0 Risk Assessment
LOSS AND DAMAGES
The somewhat random historical occurrences of earthquakes would indicate that
structures throughout both counties to roughly be equally at risk from earthquakes (some
older structures may be more vulnerable due to age and type of construction). The severity
of those earthquakes though, is expected to be very low. Officials in both counties
estimated earthquake losses to be zero.
PROBABILITY AND SEVERITY CALCULATION
Since 2000, there have been 12
earthquakes in the area surrounding Region 11.
Information is based off of the USGS
earthquakes mapping tool that focused on an
area between Cleveland, OH and just north of
Charleston, WV. The limit to the west is
Huntington, WV and to the east is Oakland, MD.
This area roughly encompasses 33,000 square
miles around Region 11 which is shown in the
red box on the map to the right; Region 11 is in
the blue circle and the recorded earthquakes are
identified with purple circles.
The severity of the earthquake hazard in Region 11 is very low due to the low
magnitude of the events and lack of damages from previously felt earthquakes in the region.
Of the 12 earthquakes identified in this region, the highest magnitude reported was of 4.0 in
the Youngstown-Akron urban area in Ohio in 2011, roughly 40 miles north of Region 11. The
most number of earthquakes in one year was four in 2011 (USGS). All other earthquakes in
Number of events 12
= Probability OR = 0.75
Number of years 16
PROBABILITY: OCCASIONAL

65
Region 11 Hazard Mitigation Plan 2.0 Risk Assessment
the area varied in magnitude from as low as 2.6. The years used to search the database
were from 2000 to 2016.
With a value of 0.75 events in a given year, the probability of an event is determined
to be “occasional” and given the “negligible” severity of the hazard, the risk assessment
matrix gives this hazard a “low” risk to the region.
RISK MAP
Both counties in
Region 11 are equally at
low risk of earthquakes.
SEVERITY: NEGLIGIBLE
RISK: LOW

66
Region 11 Hazard Mitigation Plan 2.0 Risk Assessment
2.2.5 EXTREME TEMPERATURES
“Major diversions in average seasonal temperatures. Extreme heat occurs when temperatures of ten or more degrees above the average high temperature persist across a geographic region for several days or weeks. There
is no standard definition for extreme cold, but generally refers to periods of colder than normal conditions.” (Haddow, Bullock, & Coppola, 2014).
Period of Occurrence Warning Time Region 11 Risk
Assessment State Risk Assessment
Any season, but generally summer and winter months.
Hours / Days MODERATE N/A (Extreme Heat)
Not Ranked (Extreme Cold)
Temperatures vary widely over the course of a year, but each season has average
temperature ranges associated with them. Summer and winter have, generally, the highest
and lowest range of temperatures,
respectively. When the
temperature is consistently greater
than the normal in summer,
meteorologists refer to it as a heat
wave, which means,
“temperatures of ten or more
degrees above the average high
temperature persist across the
geographic region for several days
or weeks” (Haddow, Bullock, & Coppola, 2014, p.51). These conditions can be a contributor
to drought conditions when combined with a lack of rainfall. Excessive heat has a history of
being deadly. In the United States “more than 1,500 die from exposure to excessive heat”
(Haddow, Bullock, & Coppola, 2014, p.52). These conditions can also have serious impacts
on crops, causing below average harvests. Repeated years of extreme temperatures can
easily cause significant economic impacts on agricultural industries.
While there is no widely accepted definition of extremely cold temperatures, periods
of colder than average conditions can cause an array of negative consequences depending
on their duration (Haddow, Bullock, & Coppola, 2014, p.51). Extremely cold temperatures
are immediately dangerous to both humans and livestock by causing frostbite and
hypothermia, which can lead to permanent injury and death. The chart on the next page
shows how quickly frostbite can occur at different temperatures and wind speeds. In
unprotected structures cold temperatures can freeze water pipes causing them to burst

67
Region 11 Hazard Mitigation Plan 2.0 Risk Assessment
0.0
10.0
20.0
30.0
40.0
50.0
60.0
70.0
80.0
90.0
JAN
FEB
MAR AP
R
MAY JU
N
JUL
AUG
SEP
OC
T
NO
V
DEC
Daily Max.
Daily Min.
Mean
upon thawing, leading to significant damage. Cold snaps during typically warmer weather
during the growing season can
damage and destroy some crops,
depending on their sensitivity to
temperature.
To know what range of
temperature is considered extreme
for the region, it is necessary to
know what the average
temperatures are throughout any
given year. The National Oceanic
and Atmospheric Administration
(NOAA), through its National Environmental Satellite, Data, and Information Service, can
generate reports of monthly normals at its different stations. The closest to the region is in
Wheeling, WV. The following graphic shows average ranges of temperature from 1981 to
2010. Every month has a high, low average and mean temperature in degrees Fahrenheit.
Extreme temperatures would be those either 10 degrees above or below the average high
or low temperatures.
The National Centers for Environmental Information (NCEI) tracks four types of
extreme temperatures.
Cold/Wind Chill: Period of low temperatures or wind chill temperatures reaching or
exceeding locally/regionally defined advisory (typical value is -18° F or colder)
conditions, on a widespread or localized basis. There can be situations where

68
Region 11 Hazard Mitigation Plan 2.0 Risk Assessment
advisory criteria are not met, but the combination of seasonably cold temperatures
and low wind chill values (roughly 15° F below normal) may result in a fatality.
Extreme Cold/Wind Chill: A period of extremely low temperatures or wind chill
temperatures reaching or exceeding locally/regionally defined warning criteria
(typical value around -35° F or colder), on a widespread or localized basis. Normally
these conditions should cause significant human and/or economic impact.
Heat: A period of heat resulting from the combination of high temperatures (above
normal) and relative humidity. A heat event occurs whenever heat index values meet
or exceed locally/regionally established advisory thresholds or a directly-related
fatality occurs due to the heat event.
Excessive Heat: Excessive heat results from a combination of high temperatures
(well above normal) and high humidity. An excessive heat event occurs when heat
index values meet or exceed locally/regionally established excessive heat warning
thresholds, on a widespread or localized basis (National Weather Service Instruction
10-1605, 2007).
POSSIBLE CAUSES
Weather patterns throughout the year naturally cause temperatures to rise and fall in
the summer and winter months due to the inclination of the Earth towards the sun. However,
the extreme temperatures that have been experienced in the last decade are attributable to
climate change. See Section 2.1.5 Hazards and Climate Change.
LOCATION AND EXTENT
Extreme temperatures are a region wide hazard that can affect all geographic areas
and jurisdictions of the counties at once. Extreme temperatures have the potential to last
several days or even weeks and typically have sufficient warning time (a matter of days) for
preparation.
HISTORICAL OCCURRENCES
Since 2009, there have been seven recorded events of excessive temperature that
have occurred in Region 11 per the NCEI. Excessive temperature events have a large
extent by their nature. Generally, such an event will occur in all parts of Brooke and
Hancock Counties as well as in neighboring counties and states.

69
Region 11 Hazard Mitigation Plan 2.0 Risk Assessment
The table to the right shows the breakdown of these events by the types defined
above and recorded by the NCEI. Cold events are more prevalent than heat events based
on the historical data. A total of eight cold temperature events
have been recorded by NCEI. Although there is no data
recorded for heat events, this does not mean that there have
not been heat or excessive heat events.
Brooke and Hancock County, WV
From January 5 to 7 of 2014, extreme cold
temperatures were registered in the region. “An arctic cold
front crossed the Upper Ohio Valley on the 6th, bringing record low temperatures and
extreme wind chills the morning of the 7th. It was the coldest January 7th on record in
Pittsburgh with a low temperature of 9 below zero and a high temperature of 4 above zero.
Across eastern Ohio, western Pennsylvania, northern West Virginia, and Garrett County,
Maryland, low temperatures ranged from 5 to 15 degrees below zero on the morning of the
7th, with the lowest wind chill readings from 25 to 55 degrees below zero” according to data
from the NCEI. However, no damages, injuries or fatalities were attributed to this event.
Brooke County, WV
Between February 14 and February 16, 2015, “an arctic cold front crossed eastern
Ohio, western Pennsylvania, northern West Virginia and Garrett County, Maryland the
afternoon of the 14th, with snow squalls reducing visibility below one quarter mile at times.
Wind gusts over 40 mph occurred with the snow squalls, and thunder snow was reported.
Behind the front from the morning of the 15th into the 16th, temperatures dropped below zero,
with extreme wind chills; a wind chill of -24 was recorded the morning of the 15th near
Bethany, with a low temperature of -8° on the morning of the 16th“(NCEI). No damages,
injuries, or fatalities were reported to be caused by this event.
IMPACTS AND SOCIAL VULNERABILITY
The majority of the impacts of extreme temperatures affect the population’s health
rather than damage buildings. Some of the effects extreme temperatures could have on
structures are minor compared to other hazards. Effects on buildings and infrastructure
could include broken pipes, cracks in roads or bridges due to expansion and contraction,
TABLE 2.10 EXTREME TEMPERATURES
Type #
Cold/Wind Chill 1
Extreme Cold/Wind Chill 7
Heat 0
Excessive Heat 0
Total 8

70
Region 11 Hazard Mitigation Plan 2.0 Risk Assessment
and power outages. In addition to impacts on health, extreme temperatures can also cause
damages to transportation infrastructure, agriculture, energy, and water resources.
Extreme heat can cause a wide range of health problems or even make existing
health problems worse. Some of the more mild symptoms include discomfort, skin eruptions
and heat fatigue which can lead to heat craps, heat exhaustion and heat stroke.
Occasionally some people may require medical attention. Prolonged exposure to extreme
heat can even cause death (CDC). Problems arising from prolonged exposure to the cold
can include hypothermia, frostbite and non-freezing cold injuries such as chilblains and
trench/immersion foot. Sunburn is also possible during extreme cold weather events (Army
Public Health Center).
Although extreme temperatures affect everyone in the region, some people may be
more vulnerable to their effects. For example, the homeless population could be more at risk
simply for being exposed to the elements; children and the elderly population may be more
susceptible to changes in temperature as well as the poor if they cannot afford to keep cool
during an extreme heat event or to stay warm during an extreme cold event.
In Region 11, according to the 2016 U.S. Census, vulnerable people under the age
of five and over 65 years constitute approximately 27% of the population, roughly one third
of the total population in Brooke and Hancock Counties. More population could be at risk if
the overall health factors continue to decline as described in section 2.1.6 Public Health and
Social Vulnerability.
LOSS AND DAMAGES
This region of the country has become accustomed to fluctuations in temperature
that range from extreme heat to extreme cold throughout the year. Destruction of property
and injury are typically not associated with these types of events; the NCEI reports a loss of
$0 for extreme temperature events, both heat and cold, since 2009. However, damages can
be inflicted on properties if pipes freeze and burst.
PROBABILITY AND SEVERITY CALCULATION
Based on recorded events from the National Center for Environmental Information,
there have been eight events of extreme temperatures in Region 11 between 2009 and
2016.

71
Region 11 Hazard Mitigation Plan 2.0 Risk Assessment
The severity of the extreme temperature hazard in Region 11 is determined to be
very low due to the lack of damage it causes to structures.
With a value of 1.14 events in a given year, the probability of an event is determined
to be “probable” and given the “negligible” severity of the hazard, the risk assessment matrix
gives this hazard a “moderate” risk to the region.
RISK MAP
Brooke and
Hancock Counties are
equally at moderate risk
of extreme temperature
occurrences throughout
the year. This includes
both hot and cold
temperature extremes.
Number of events 8
= Probability OR = 1.14
Number of years 7
SEVERITY: NEGLIGIBLE
RISK: MODERATE
PROBABILITY: PROBABLE

72
Region 11 Hazard Mitigation Plan 2.0 Risk Assessment
2.2.6 FLOOD
“An overabundance of water that engulfs land and other property that is normally dry” (Haddow, Bullock, & Coppola, 2014, p.32).
Period of Occurrence Warning Time Region 11 Risk
Assessment State Risk Assessment
At any time throughout the year Hours / Days HIGH HIGH
Flooding is one of the most frequent of the natural hazards faced by communities
across the country as well as one of the most costly. West Virginia is no stranger to flooding;
in fact, it is the number one natural hazard in the state. The topography of the region is
mountainous with many valleys and gorges with rivers and streams, making the region
prone to flooding activity. There are three types of flood, each with their own characteristics,
as described below.
River Floods typically develop over a period of days and occur when a river
gradually rises and overspills its banks. These floods can be attributed to large
amounts of rain or snowmelt both in the region impacted and upstream. Due to their
nature of gradually building up, these types of floods will typically have a warning
period of a few days.
Flash Floods are the most common severe weather emergency in the United States
according to the National Flood Insurance Program (NFIP) (2016). The NFIP also
states that a flash flood is defined as, “a rapid flooding of low-lying areas in less than
six hours, which is caused by intense rainfall from a thunderstorm or several
thunderstorms” (2016).
The third type of flooding is caused by dam failures, which are discussed in more
detail in the “2.2.2 Dam Failure” section of this plan.
The NFIP is a governmental program administered through FEMA that, “aims to
reduce impact on private and public structures… by providing affordable insurance to
property owners and by encouraging communities to adopt and enforce floodplain
management regulations” (FEMA). Each jurisdiction participating in the NFIP has a
designated NFIP coordinator, sometimes referred to as the floodplain manager. This
individual maintains the jurisdiction’s floodplain ordinance and ensures that development is
compliant with that ordinance. In Brooke and Hancock Counties, generally, all floodplain
managers provide floodplain identification, floodplain management, and outreach. Each

73
Region 11 Hazard Mitigation Plan 2.0 Risk Assessment
local floodplain manager serves as the point of contact with FEMA regarding floodplain
mapping. For more information on how each jurisdiction participates in the NFIP, refer to
Appendix 6 NFIP Surveys.
The Community Rating System (CRS) is an additional program run by the NFIP to
encourage additional community activities that exceed minimum NFIP requirements, with
the goal of reducing flood risk. By participating in the CRS, a community can receive
discounted flood insurance premiums.
POSSIBLE CAUSES
According to NOAA, some of the possible causes for flooding include the following.
Excessive Rainfall: This is the most common cause of flooding. Water accumulates
quicker than the soil can absorb resulting in flooding.
Snowmelt: It occurs when the major source of water involved is caused by melting
snow. Unlike rainfall that can reach the soil almost immediately, the snowpack can
store the water for an extended amount of time until temperatures rise above
freezing and the snow melts.
Ice or Debris Jams: Common during the winter and spring along rivers, streams and
creeks. As ice or debris moves downstream, it may get caught on any sort of
obstruction to the water flow. When this occurs, water can be held back, causing
upstream flooding. When the jam finally breaks, flash flooding can occur
TABLE 2.11 COMMUNITIES PARTICIPATING IN THE NFIP
CID Jurisdiction County Initial FIRM Identified
Current Effective Map Date
Regular Emergency Date
Interested in CRS
participation 540093 Beech Bottom Brooke 4/19/2010 4/19/2010 4/26/2011 Undecided 540012 Bethany Brooke 9/28/1979 04/19/2010 (M) 9/28/1979 Undecided 540011 Brooke County Brooke 12/15/1983 4/19/2010 12/15/1983 Undecided 540048 Chester Hancock 12/1/1982 4/19/2010 12/1/1982 Undecided 540013 Follansbee Brooke 9/30/1982 4/19/2010 9/30/1982 Undecided 540047 Hancock County Hancock 6/15/1984 4/19/2010 6/15/1984 Yes 540049 New Cumberland Hancock 5/15/1980 4/19/2010 5/15/1980 Undecided 540014 Weirton Brooke/Hancock 9/28/1979 4/19/2010 9/28/1979 Undecided 540015 Wellsburg Brooke 11/17/1982 4/19/2010 11/17/1982 Undecided
FIRM - Flood Insurance Rate Map (M) - No elevation determined - All Zone A, C and X
Source: FEMA Community Status Book Report West Virginia

74
Region 11 Hazard Mitigation Plan 2.0 Risk Assessment
downstream.
Dam Breaks or Levee Failure: Dams can overtop, have excessive seepage or have
structural failure. For more information on this topic see section 2.2.2 Dam Failure.
LOCATION AND EXTENT
Historically, severe flooding has occurred along the numerous streams, creeks and
rivers that wind through Brooke and Hancock Counties. Additional flooding can occur due to
inadequate storm drain capacity and/or ground saturation. The vast amount of streams,
creeks and rivers in both Brooke and Hancock Counties make flooding extremely likely.
Flooding along the Ohio River in both counties, Kings Creek in Hancock County, and
Harmon Creek, Cross Creek and Buffalo Creek in Brooke County is a common occurrence.
There is an area in the town of
Bethany behind Bethany College at
Buffalo Creek that has experienced
repetitive flooding. Local officials took
the photo seen to the right in December
of 2016. This area is adjacent to the
floodplain and is next to the community
center that has experienced damage
from floodwaters in the past.
Another area of concern due to
the pile-up of debris is Allegheny Creek
that runs through the city of Follansbee.
The creek runs directly through the
downtown area of the city and has
caused problems in the past as well. In
some places it runs open and in others
it runs through underground pipes under roads and residential buildings. The bottom image
above shows some of the debris found in the creek; the photo was taken in February of
2017. The City of Follansbee is currently seeking mitigation funds for this project.
Floods can have some warning time of up to a couple of days if precipitation
amounts have been high over a period of days or weeks; flash floods have less warning
time. The amount of time that clean-up after a flood takes varies greatly from home to home
and town to town. The effects of the flood can still be felt long after the waters have receded.

75
Region 11 Hazard Mitigation Plan 2.0 Risk Assessment
HISTORICAL OCCURRENCES
Flash floods are a common concern
in the region and have historically occurred
frequently. Of the 57 flooding events
compiled by NCEI in the studied time period
between 1996 and 2015, 32 were flash
floods. Flash floods develop more quickly
that river flooding, and are harder to predict.
Unlike river flooding, flash floods can occur in many places that river flooding does not.
These areas are less prepared for flooding, leading to greater danger and potential for
property damage.
July, 2016
In late July, the region experienced heavy rains causing flooding in Follansbee, WV.
“Virginia Avenue and other areas of Follansbee were flooded heavily when the former Lantz
Dairy building collapsed into the adjacent Allegheny Creek, causing water from the creek to
rise up to two feet over Allegheny Street and other side streets” (Scott, 2016). The flooding
caused street closures, power outages and debris. Debris in Allegheny Creek caused water
to back up and flood city streets in Follansbee (Miller, 2016).
September, 2004
Hurricane Ivan formed in the Atlantic and traveled through the Caribbean, turned
north towards the Florida
Panhandle and continued
northeast crossing Alabama,
Tennessee, and Virginia before
turning south and heading for
southern Florida, then turning west
and ending in Texas. It started as a
tropical depression and got up to a
Category 5 hurricane before
reducing back to a tropical
depression when it made landfall
TABLE 2.12 FLOODS IN REGION 11
County Flash Floods Floods
Brooke 19 12
Hancock 13 13
Totals 32 25
Source: NCEI

76
Region 11 Hazard Mitigation Plan 2.0 Risk Assessment
(Weather Underground). The eye of the storm passed just south of West Virginia in
September of 2004.
The city of Wellsburg and surrounding areas experienced flooding due to the effects
of Hurricane Ivan. The hurricane affected southeastern states and east coast states alike
dropping up to 15” of rain in some areas; rainfall amounts can be seen in the map below on
the left. According to maps from the NOAA, the rainfall for the northern panhandle of West
Virginia was around 7”. The photo shown below on the right was taken by the Brooke
County Sheriff’s Department and can be found on their website along with many others.
March, 1936
The flood referred to as “the big one” caused the
Ohio River to crest at 55.2 feet after heavy snow and
rainfall in March of 1936. Utility services were interrupted
and bridges were closed in the flood that caused 16
deaths and 20,000 people to leave their homes (Ohio
County Public Library Archives, 2015). In Weirton, WV,
impacted areas included the Ohio River and Hammond Creek submerging railroads and
roads, reaching houses and businesses.
IMPACTS AND SOCIAL VULNERABILITY
“Fast-flowing water carrying debris, such as boulders and fallen trees, accounts for
the primary flood-related injuries and deaths. Not surprisingly, the main cause of death from
floods is drowning, followed by various combinations of trauma, drowning, and hypothermia
with or without submersion. From a public health viewpoint, floods may disrupt water

77
Region 11 Hazard Mitigation Plan 2.0 Risk Assessment
purification and sewage disposal systems, causing toxic waste sites to overflow or dislodge
chemicals stored above ground. There is potential for water-borne disease transmission.
Despite the potential for communicable diseases that follow floods, mass vaccination
programs have been counterproductive for a variety of reasons. They not only distract
limited personnel and resources from other critical relief tasks, but also may create a false
sense of security and cause persons who have been vaccinated to neglect basic hygiene.
The proper approach to the problem of communicable diseases is to set up an
epidemiological surveillance system so that an increase in cases of communicable diseases
in the flood stricken area can be identified quickly” (Noji, 2000).
“People affected by floods are often apprehensive about the potential, long term
adverse effects of exposure to contaminants, mold, and toxic substances that may be
present in their homes after clean up. Unfortunately there are no data that address these
concerns. The long term effects of flooding on psychological health may perhaps be even
more important than illness or injury. For most people the emotional trauma continues long
after the water has receded. Making repairs, cleaning up, and dealing with insurance claims
can be stressful. If there is a lack of support during the recovery process, stress levels may
increase further” (Ohl & Tapsell, 2000, p.1167).
“Floods may indirectly lead to an increase in vector-borne diseases through the
expansion in the number and range of vector habitats. Standing water caused by heavy
rainfall or overflow of rivers can act as breeding sites for mosquitoes, and therefore enhance
the potential for exposure of the disaster-affected population and emergency workers to
infections such as dengue, malaria and West Nile fever. Flooding may initially flush out
mosquito breeding, but it comes back when the waters recede. The lag time is usually
around 6-8 weeks before the onset of a malaria epidemic. Contrary to common belief, there
is no evidence that corpses pose a risk of disease "epidemics" after natural disasters. Most
agents do not survive long in the human body after death (with the exception of HIV -which
can be up to 6 days) and the source of acute infections is more likely to be the survivors.
Human remains only pose health risks in a few special cases requiring specific precautions,
such as deaths from cholera or hemorrhagic fevers. Power cuts related to floods may disrupt
water treatment and supply plants thereby increasing the risk of water-borne diseases as
described above but may also affect proper functioning of health facilities, including cold
chain” (WHO).

78
Region 11 Hazard Mitigation Plan 2.0 Risk Assessment
LOSS AND DAMAGES
The National Center for Environmental Information keeps records on the cost of
events. As mentioned previously, there have been 57 floods and flash floods in both Brooke
and Hancock Counties. According to NCEI, the total amount of damages of the flash floods
in the area since 1996 was $140k, and the total in damages of floods was $61.6M, bringing
the total damages in Region 11 to $61,745,000. This amount indicates, historically, the
average cost of a flood or flash flood event is just over $1M.
Some properties are more vulnerable to floods than others. For those properties that
have had claims, FEMA defines repetitive loss (RL) and severe repetitive loss (SRL)
properties as follows:
A Repetitive Loss (RL) property is any insurable building for which two or more
claims of more than $1,000 were paid by the National Flood Insurance Program
(NFIP) within any rolling ten-year period, since 1978. A RL property may or may not
be currently insured by the NFIP. Currently there are over 122,000 RL properties
nationwide.
A Severe Repetitive Loss (SRL) property is a single family property (consisting of 1
to 4 residences) that is covered under flood insurance by the NFIP and has incurred
flood-related damage for which 4 or more separate claims payments have been paid
under flood insurance coverage, with the amount of each claim payment exceeding
$5,000 and with cumulative amount of such claims payments exceeding $20,000; or
for which at least 2 separate claims payments have been made with the cumulative
amount of such claims exceeding the reported value of the property. There are
currently approximately 6,000 properties nationwide meeting the definition.
In Brooke and Hancock Counties there are a few properties that meet these criteria.
Based on information provided by WVDHSEM, the breakdown of RL properties is shown in
the table below. According to the report, no severe repetitive loss properties exist in Brooke
or Hancock Counties.
TABLE 2.13 PROPERTY LOSSES County Total Payments Average Payments Losses Properties
Brooke County $110,141.98 $13,767.75 8 3 Weirton $323,894.08 $8,097.35 40 17
Wellsburg $2,183,955.47 $18,352.57 119 53 Hancock County $392,152.70 $11,204.36 35 16 New Cumberland $811,123.16 $21,922.25 37 16
Totals $3,821,267.39 $14,668.85 239 105

79
Region 11 Hazard Mitigation Plan 2.0 Risk Assessment
The HAZUS-MH program from FEMA estimates that approximately 283 buildings
would be at least moderately damaged by a 100-year flood in Region 11, and 40 would be
substantially damaged, for a total of 323 damaged buildings. The following tables
summarize the HAZUS data by county.
TABLE 2.14 EXPECTED BUILDING DAMAGE BY OCCUPANCY – HANCOCK COUNTY
Occupancy 1-10 11-20 21-30 31-40 41-50 Substantially
Ct. % Ct. % Ct. % Ct. % Ct. % Ct. % Agriculture 0 0.00 0 0.00 0 0.00 0 0.00 0 0.00 0 0.00 Commercial 0 0.00 1 100.00 0 0.00 0 0.00 0 0.00 0 0.00 Education 0 0.00 0 0.00 0 0.00 0 0.00 0 0.00 0 0.00 Government 0 0.00 0 0.00 0 0.00 0 0.00 0 0.00 0 0.00 Industrial 0 0.00 0 0.00 0 0.00 0 0.00 0 0.00 0 0.00 Religion 0 0.00 0 0.00 0 0.00 0 0.00 0 0.00 0 0.00 Residential 0 0.00 1 0.84 27 22.69 18 15.13 55 46.22 18 15.13
Total (120) 0 2 27 18 55 18
TABLE 2.15 EXPECTED BUILDING DAMAGE BY BUILDING TYPE – HANCOCK COUNTY Building
Type 1-10 11-20 21-30 31-40 41-50 Substantially
Ct. % Ct. % Ct. % Ct. % Ct. % Ct. % Concrete 0 0.00 0 0.00 0 0.00 0 0.00 0 0.00 0 0.00 Manufactured Housing
0 0.00 0 0.00 0 0.00 0 0.00 0 0.00 9 100.00
Masonry 0 0.00 0 0.00 5 20.83 4 16.67 14 58.33 1 4.17 Steel 0 0.00 0 0.00 0 0.00 0 0.00 0 0.00 0 0.00 Wood 0 0.00 1 1.16 22 25.58 14 16.28 41 47.67 8 9.30
TABLE 2.16 BUILDING-RELATED ECONOMIC LOSS ESTIMATES (MILLIONS OF DOLLARS) – HANCOCK COUNTY Category Area Residential Commercial Industrial Others Total
Building Loss Building 17.10 1.67 0.02 0.47 19.25 Content 10.25 4.77 0.04 2.64 17.70 Inventory 0.00 0.08 0.01 0.00 0.09 Subtotal 27.35 6.52 0.07 3.11 37.04
Business Income 0.00 0.02 0.00 0.00 0.02 Interruption Relocation 0.02 0.00 0.00 0.00 0.02
Rental Income 0.00 0.00 0.00 0.00 0.00 Wage 0.00 0.02 0.00 0.04 0.06 Subtotal 0.02 0.03 0.00 0.04 0.10
All Total 27.37 6.55 0.07 3.05 37.14

80
Region 11 Hazard Mitigation Plan 2.0 Risk Assessment
TABLE 2.17 EXPECTED BUILDING DAMAGE BY OCCUPANCY – BROOKE COUNTY
Occupancy 1-10 11-20 21-30 31-40 41-50 Substantially
Ct. % Ct. % Ct. % Ct. % Ct. % Ct. % Agriculture 0 0.00 0 0.00 0 0.00 0 0.00 0 0.00 0 0.00 Commercial 0 0.00 0 0.00 0 0.00 0 0.00 0 0.00 0 0.00 Education 0 0.00 0 0.00 0 0.00 0 0.00 0 0.00 0 0.00 Government 0 0.00 0 0.00 0 0.00 0 0.00 0 0.00 0 0.00 Industrial 0 0.00 0 0.00 0 0.00 0 0.00 0 0.00 0 0.00 Religion 0 0.00 0 0.00 0 0.00 0 0.00 0 0.00 0 0.00 Residential 0 0.00 5 2.46 46 22.66 24 11.82 106 52.22 22 10.84
Total (203) 0 5 46 24 106 22
TABLE 2.18 EXPECTED BUILDING DAMAGE BY BUILDING TYPE – BROOKE COUNTY Building
Type 1-10 11-20 21-30 31-40 41-50 Substantially
Ct. % Ct. % Ct. % Ct. % Ct. % Ct. % Concrete 0 0.00 0 0.00 0 0.00 0 0.00 0 0.00 0 0.00 Manufactured Housing
0 0.00 0 0.00 0 0.00 0 0.00 0 0.00
Masonry 0 0.00 1 2.00 12 24.00 5 10.00 28 56.00 4 8.00 Steel 0 0.00 0 0.00 0 0.00 0 0.00 0 0.00 0 0.00 Wood 0 0.00 4 2.61 34 22.22 19 12.42 78 50.98 18 11.76
TABLE 2.19 BUILDING-RELATED ECONOMIC LOSS ESTIMATES (MILLIONS OF DOLLARS) – BROOKE COUNTY Category Area Residential Commercial Industrial Others Total
Building Loss Building 3.12 2.97 2.01 1.09 37.19 Content 18.66 7.87 3.72 4.97 35.21 Inventory 0.00 0.17 0.43 0.00 0.60 Subtotal 49.78 11.00 6.16 6.06 73.00
Business Income 0.00 0.04 0.00 0.00 0.05 Interruption Relocation 0.03 0.00 0.00 0.00 0.03
Rental Income 0.00 0.00 0.00 0.00 0.00 Wage 0.00 0.04 0.00 0.30 0.35 Subtotal 0.03 0.09 0.00 0.31 0.43
All Total 49.80 11.09 6.16 6.37 73.43
There have been a few local projects to mitigate the effects of flooding. In
Follansbee, WV, the estimated cost to clean out the debris from Allegheny Creek, clean out
the retention pond, and reconstruct the sewage line is approximately $454k.

81
Region 11 Hazard Mitigation Plan 2.0 Risk Assessment
PROBABILITY AND SEVERITY CALCULATION
Based on recorded events from the NCEI, there have been a total of 57 flood and
flash flood events of in Region 11. Data is available for the years between 1996 and 2015.
Based on damages recorded, the cost of floods in this area is high. Although no
fatalities have been reported, this hazard is classified as ‘critical’.
With a value of three events in a given year, the probability of an event is determined
to be “probable” and given the “critical” severity of the hazard, the risk assessment matrix
gives this hazard a “high” risk to the region.
Number of events 57
= Probability OR = 3
Number of years 19
SEVERITY: CRITICAL
RISK: HIGH
PROBABILITY: PROBABLE

82
Region 11 Hazard Mitigation Plan 2.0 Risk Assessment
RISK MAPS
The map to the right
shows the areas that are
most prone to flooding in
Region 11 in red. The
shaded areas reflect the
following flood zones:
Zone A
Zone AE
0.2% Chance
The following pages
contain more detailed maps
for each jurisdiction shown in
geographical order from
north to south, then east. A
brief description of creeks
and roads that would be
affected is included with
each jurisdictional map. The 100-year flood plain shows the parts of the jurisdictions that are
most affected by severe flooding.
Outside of the City of Chester to the west, is the town of Congo. This falls under the
jurisdiction of Hancock County since it is not incorporated. It is worth mentioning because
during a 100-year flood event, most, if not all of the roads northwest of State Route 2 would
be flooded . Most of what is located in this area is industrial; Ergon West Virginia, Ergon
Trucking, Shell Lubricants, and CE Minerals Processing, among others, are situated in this
flood zone.

83
Region 11 Hazard Mitigation Plan 2.0 Risk Assessment
As shown in the map above, parts
of the City of Chester are in the
100-year floodplain. Middle Run
Creek is also affected by flooding.
Some of the streets affected if this
type of flood would occur would
include the following:
Louella Ave
Columbia Dr
Ferry Rd

84
Region 11 Hazard Mitigation Plan 2.0 Risk Assessment
In New Cumberland, the low-lying
area west of State Route 2 along
the Ohio River is the most affected.
The area has residential buildings
as well as recreational facilities
and industrial facilities.
Hardin Run would flood.

85
Region 11 Hazard Mitigation Plan 2.0 Risk Assessment
Some of the creeks around the
Weirton area that would be
affected by floods would include
Alexander’s Run, King’s Creek,
North Run, Morrow Run, and
Harmon Creek.
In addition, roads that border these
creeks would also be affected. The
areas just outside the Weirton
jurisdictional boundaries across
the creeks would be similarly
flooded.

86
Region 11 Hazard Mitigation Plan 2.0 Risk Assessment
In the City of Wellsburg, a 100-
year flood event would flood over
half of the jurisdiction. With flood
waters rising from the Ohio River
as far east as State Route 2, also
known as Commerce St., the
majority of the residential areas
would be under water. Also
affected would be some
recreational facilities and some
industrial buildings. Buffalo Creek,
just south of Wellsburg, would
flood.
The most affected area in
Follansbee during a 100-year flood
event would be along State Route 2,
also known as Main Street. Flood
waters would spread to streets on
either side of Main St. from
Washington Dr. and Harris St. in at
the south end of Follansbee as far
north as Allegheny St. The area is
mostly residential.
Allegheny Creek is not in the 100-
year flood zone but due heavy rain it
could cause flooding along its banks.

87
Region 11 Hazard Mitigation Plan 2.0 Risk Assessment
Although this map looks like most
of Beech Bottom would be under
water in a 100-year flood event,
the reality is that most of the area
shown in red are open fields and
wooded areas, although it does
have some industrial buildings
within it. The majority of the
residential area is east or State
Route 2, mostly outside the flood
zone.

88
Region 11 Hazard Mitigation Plan 2.0 Risk Assessment
Most of the flooding in Bethany
takes place along Buffalo Creek.
The areas shown under water in
red are mostly recreational
facilities and wooded areas, rarely
affecting structures.
However, when the creek floods, it
can isolate the town because the
creek causes flooding downstream
along Bethany Pike making it
impossible to travel and/or
evacuate to the west. This also
would cause problems for
evacuation from the west, from
towns like Wellsburg and Beech
Bottom.
Windsor Heights, as the name
suggests sits on a high plain. For
this reason, the entire jurisdiction
of Windsor Heights is unaffected
by 100-year flood events, as
shown in the map above.

89
Region 11 Hazard Mitigation Plan 2.0 Risk Assessment
2.2.7 HAZMAT
“Hazardous materials are chemical substances that if released or misused can pose a threat to environment or personal health” (Haddow, Bullock, & Coppola, 2014, pg.55).
Period of Occurrence Warning Time Region 11 Risk
Assessment State Risk Assessment
At any time throughout the year None / Hours HIGH Not Ranked
The use of hazardous materials (Hazmat) is prevalent in a large number of industries
and products, including agriculture, medicine, and research. (Haddow, Bullock, & Coppola,
2014). The Emergency Planning and Citizen Right to Know Act (EPCRA) of 1984 requires
facilities to report what chemicals they have on site and their quantities. The act also
requires local governments to have emergency response plans in place.
The Pipeline and Hazardous Materials Safety Administration (PHMSA), a division of
the U.S. Department of Transportation (DOT), tracks hazardous materials incidents that
occur during transport. Between 1997 and 2016 in West Virginia, there have been a total of
31 significant pipeline related incidents causing five fatalities and 12 injuries with a total of
$29,390,261 in damages over the course of the 19 years of reporting period. The Right to
Know Network (RTK Net) maintains data, based on reports from the Coast Guard’s National
Response Center, on incidents that involve a hazardous materials release. In West Virginia,
there were 1,890 incidents between 2010 and 2015 (the most recent complete year
available). These resulted in 62 fatalities, 157 hospitalizations, and 177 injuries. Nearly half
of these incidents (46.5%) involved a mobile vehicle, while 34% were at a fixed site such as
a building. The U.S. Department of Transportation (DOT) also maintains records of
hazardous materials incidents that occur during transport at the state level. According to the
DOT, there were 59 incidents in West Virginia in 2015, resulting in four injuries and over $24
Million in damage. The majority of these incidents involved highway transportation vehicles
(2016).
Data analyzed within this section includes hazardous materials information relating
transportation (highway, rail, and water), pipelines, and fixed facilities (industries, gas
stations, and storage tanks).
POSSIBLE CAUSES
There are a few different causes attributed to hazardous materials incidents that the
National Response Center identifies. The most common are listed below with the

90
Region 11 Hazard Mitigation Plan 2.0 Risk Assessment
percentage of occurrence for each type based on data from 162 incidents.
Equipment Failure 35.8%
Unknown 26.54%
Operator Error 25.3%
Natural Phenomenon 9.87%
Dumping 2.46%
LOCATION AND EXTENT
Hazmat incidents can occur at any location
within Region 11. However, there are some areas
that are more susceptible to incidents than others.
For example, roads, highways and rails, where
hazardous materials are transported will have a
higher chance of accidents, spills or leaks. At the
same time, due to the nature of the some
businesses in the area, certain fixed facilities,
especially Tier II reporting facilities or gas stations,
have a higher chance of incident occurrence. In
Brooke County, there are 12 Tier II reporting
facilities; in Hancock County there are 25. There are four facilities located in Weirton, WV
that report to both counties for a total of 41 Tier II reporting facilities in
Region 11 based on data provided by local officials. The table above
outlines the type of incidents occurred between 1990 and 2015.
In addition to incidents and accidents on roadways, railroads,
waterways, and industries, another type of fixed facility can include oil
and gas drilling sites. The map to the right indicates drilling sites with
green dots within Region 11 according to drillingmaps.com. These sites
can be potential locations for incidents due to the materials that are used
and/or extracted at the site. According to a report by Molly Peterson, it
was found that “more than 40 toxic chemicals have been used in dozens
of drilling operations, often near homes, schools, and hospitals” (2014).
Some of these chemicals include the use of silica, methanol, hydrofluoric
acid, and formaldehyde.
TABLE 2.20 HAZMAT INCIDENTS (1990-2015)
Type of Incident Incidents
Transportation - Highway 59
Transportation - Rail 2
Transportation - Water 17
Fixed Facilities 64
Pipeline 2
Water Sheet 18
Total 162
Sources: PHMSA & NRC

91
Region 11 Hazard Mitigation Plan 2.0 Risk Assessment
Spills of hazardous materials are most difficult to plan for during transportation since
they can occur at any time, at any place and involve a wide variety of materials. While leaks,
spills and accidents occur in a specific location, the effects of these have the potential to
affect distant regions.
In Region 11, there are several sites that are qualified as superfunds or brownfields.
Any land that has been
contaminated by hazardous waste
and identified by the EPA because
of its risk to human health and/or
the environment is known as a
“superfund” site. Some superfunds
are on the National Priorities List
(NPL) which is, “the list of
hazardous waste sites in the U.S.
eligible for long-term remedial
action (cleanup) financed under the
federal Superfund program. Congress created the Superfund in 1980 to pay for the cleanup
of the country's most hazardous waste sites” (Homefacts.com). Brownfields are defined as
property locations where “the expansion, redevelopment, or reuse of which may be
complicated by the presence or potential presence of a hazardous substance, pollutant, or
contaminant” (Homefacts.com). The table to the right lists the quantities of superfunds,
brownfields, and tanks and spills listed by the EPA in each county. There are a total of 61
superfunds and 25 brownfields in Region 11. The breakdown of types of sites are shown in
the table.
HISTORICAL OCURRENCES
Follansbee, WV
On the morning of January 26, 2015, there was a pressure drop that caused a
rupture in an Enterprise Products Partners LP’s pipeline going from Washington County, PA
to Mont Belvieu, TX in Follansbee. The 20” ATEX (Appalachia to Texas) caught fire after
releasing ethane causing an explosion (Willis, 2015). Two of the four injection points were
impacted by the blast and deliveries were limited downstream. The ruptured location was
part of a 369-mile segment that had been recently built (Nichols, 2015).
TABLE 2.21 SUPERFUNDS AND BROWNFIELDS
Type of Site Brooke County
Hancock County Totals
Superfunds 22 39 61
Active NPL 0 0 0
Active Non-NPL 5 6 11
Archived 17 33 50
Brownfields 9 16 25
Tanks & Spills 56 131 187
Totals 87 186 273
Source: homefacts.com from EPA information

92
Region 11 Hazard Mitigation Plan 2.0 Risk Assessment
New Cumberland, WV
On December 9, 2010, the AL Solutions plant had an explosion of titanium powder
which is used as an alloy addition for aluminum. The metal powder exploded, and the
subsequent fire was put out by six fire departments. Two people were killed and two others
were severely burned as a result. This was the fourth fire in five years and the second fatal
fire since 2006, according to OSHA (Spencer, 2010). As a result, the company shut down.
Weirton, WV
On March 17, 1998, a driver left a carrier terminal property with a loaded trailer and
noticed drippage within the first mile. He turned around at Weirton but left a 10-gallon puddle
of product at the turn around point and made it back to carrier yard when the major portion
of the underside of the trailer collapsed onto the ground spilling most of the shipment. The
material was 500° F. Weavertown Environmental Group cleaned the scene and state
highway crews worked on the spill in Weirton. One motorist passing by was nauseated by
the smells and fumes. He became ill, called the sheriff and then reported to the hospital for
examination. This incident was the most costly reported by the RTK Network at a cost of
$87,000.
IMPACTS AND SOCIAL VULNERABILITY
Due to the wide variety of substances that are used, transported and stored in the
area, it is difficult to assign an overall impact of these substances to public health, the
environment, the economy and the infrastructure. As outlined in the section below, there are
some spills that cause minor if any damage to the area. For example, spilling a few gallons
of gasoline on concrete during transfer causes minimal economic impact; rarely does the
spilled substance cause any environmental impacts. This is not to say that all spills are
minor, some can be very harmful to human health and the environment and costs
thousands, if not millions of dollars to clean up.
Spills into waterways and those that reach the groundwater are of particular concern
due to the threat they impose to drinking water and subsequently public health, the
environment, and fauna in the area. For a list of contaminants found in groundwater and
their potential effects, refer to Appendix 5 Hazmat and Health.

93
Region 11 Hazard Mitigation Plan 2.0 Risk Assessment
The Hancock County Commodity Flow Study identified five extremely hazardous
substances (EHSs) over the course of the study: ammonia, chorine, hydrochloric acid,
hydrogen peroxide and sulfuric acid. The EHSs made up 4% of the total Hazmat traffic
(HCLEPC 2015, p.13). For details on how these EHSs could be potentially harmful, refer to
Appendix 5 Hazmat and Health.
LOSS AND DAMAGES
The Right-to-Know (RTK) Network and the National Response Center (NRC) have
databases of Hazmat incidents going back to 1990; the RTK database includes costs. Some
incidents, because of their size, have no cost associated with them; these include incidents
such as spilling a small amount of product while filling a tank, to reports of sheens on the
Ohio River. Of the 55 incidents recorded by the RTK Network, only 26 have a cost
associated with them. Of those 26, 14 are under $1000 per incident. The total cost of all 55
incidents with costs reported is $204,595.
Because the EPA, NRC and PHMSA databases do not include costs, the historical
losses for highway and rail incidents are calculated based on information available from the
RTK Network. At a total cost of $204,595 for 55 incidents, the average cost per incident is
$3,720.
PROBABILITY AND SEVERITY CALCULATION
Information gathered from PHMSA, the RTK Network and the NRC between the
years of 1990 and 2015 indicated a total of 162 separate Hazmat events.
Historically, the severity of Hazmat incidents in Region 11 has resulted in very few
injuries or illness, and there has been little property damage. However, the potential for
damage is high given the frequent occurrence of this type of events. For this reason, the
severity of the hazard is categorized as “critical”.
Number of events 162
= Probability OR = 6.48
Number of years 25
SEVERITY: CRITICAL
PROBABILITY: FREQUENT

94
Region 11 Hazard Mitigation Plan 2.0 Risk Assessment
With a value of 6.48 events in a given year, the probability of an event is determined
to be “frequent” and given the “critical” severity of the hazard, the risk assessment matrix
gives this hazard a “high” risk to the region, with the understanding that there are locations
in the counties that are more prone to incidents as discussed previously.
RISK MAP
The map on the
right shows the locations
of Tier II reporting
facilities as well as
locations of known
hazmat incidents, as
reported by the RTK
Network. Areas in purple
symbolize facilities that
have had more than 15
incidents since 1990.
The color scale ranges
from purple through pink,
orange and finally yellow.
The light yellow areas
symbolize locations that
have had one or less
reported incidents since
1990.
The purple areas are mainly located in Weirton and New Cumberland regions. This
is due to the higher amount of industries in the area. By simple probability, the more
industries that work with chemicals in a small area, the more chance there will be of an
incident occurrence.
In addition to fixed facilities as shown on this map, general areas of higher
occurrence of spills can take place along transportation routes, by river, road, and rail.
RISK: HIGH

95
Region 11 Hazard Mitigation Plan 2.0 Risk Assessment
2.2.8 MASS MOVEMENTS
Sinking, settling, or other lowering of parts of the crust of the Earth (Keller, DeVecchio, 2015)
Period of Occurrence Warning Time Region 11 Risk
Assessment State Risk Assessment
At any time throughout the year. Increased chance following long periods of heavy rain, snowmelt
or construction activity.
Days / Weeks / Months MODERATE N/A (Landslide)
Mass movements cause damage and loss of life through several processes.
Mass movements include pushing, crushing or burying objects in their path and the
damming of rivers and waterways (Haddow, Bullock, & Coppola, 2014, p.46.) There are
numerous categories of mass movements: landslides, mudflows, rock falls, land
subsidence and expansive soils. Because mitigation efforts are similar for these types of
hazards, they were grouped under one common profile heading.
Landslides: Landslides occur when areas of relatively dry rock, soil or debris move
uncontrollably down a slope. Landsides may be localized or massive in size and can
move at high rates of speed.
Mudflows: Mudflows are water saturated rivers of earth, rock and debris. Mudflows
develop when water rapidly accumulates in the material, such as during heavy
rainfall or rapid snowmelt. Mudflows can develop and move quickly, giving little to no
warning. There is no historical evidence of mudflows in Region 11.
Rock Falls: Rock falls occur when rocks or other materials detach from a slope or
cliff and descend in a freefall, rolling or bouncing manner. Rock falls can occur
naturally, through faults and seismic activity, or as a product of human activity, such
as blasting.
Land Subsidence: Land subsidence is the loss of elevation caused by the removal
of support below the surface. These events can range in size from a large regional
lowering to severe localized collapses, such as sinkholes. The primary cause of land
subsidence is human activity such as mining and the extraction of groundwater or
petroleum.
Expansive Soils: Expansive soils are soils or soft rocks that will swell or shrink
depending on their moisture content. The swelling and shrinking action can cause
extensive damage to transportation routes, such as highways and rail lines, and

96
Region 11 Hazard Mitigation Plan 2.0 Risk Assessment
structures that are built over these areas. There is no historical evidence of
expansive soils in Region 11.
As seen on the map below, West Virginia has a wide variety of types of soil. For
Brooke and Hancock Counties, the most prevalent era-period soil is “Q”, Cenozoic –
Quaternary (0-2 million years ago), composed of alluvial deposits of sand, gravel, silt and
clay along major streams, and “P”, Paleozoic-Pennsylvanian (299-318 million years ago),
which has cyclic sequences of sandstone, shale, clay, coal, and limestone with deposits of
coal, gas, oil and brine (WVGES, 2011). This type of soil composition makes the land
susceptible to mass movements.
The entire state of West Virginia contains many steep slopes that have retaining
walls or experience rock falls and road slips. Steve Kite, the chair of West Virginia
University’s Department of Geology and Geography says that “a lot of the costs of a land
slide is the prevention of landslides through things like retaining walls and structures that
prevent fatalities and injuries and damage.” Kite has been working on a Light Imaging and

97
Region 11 Hazard Mitigation Plan 2.0 Risk Assessment
Detecting Radar (LIDAR) that are laser beams attached to fixed-wind planes or helicopters
that map the ground area below. This technology allows the detecting of landslides and to
determine the causes (Board, 2014).
POSSIBLE CAUSES
Mass movements can be secondary effects of heavy rainfall and earthquakes
(WHO). Some of the causes attributed to mass movements can include:
intense deforestation and soil erosion,
construction of human settlement in landslide prone areas,
roads or communications lines in mountain areas,
building with weak foundations,
buried pipelines, and
lack of understanding of landslide hazards, and lack of warning systems.
LOCATION AND EXTENT
Due to the nature of the steep mountainous terrain in the entire state of West
Virginia, mass movements are common, and Region 11 is no exception. The most notable
areas of land subsidence according to local officials are along Route 2 in both Brooke and
Hancock Counties where the mountains are steep on the east side of the road leading into
the Ohio River. In addition to this location, there are several other places that are currently
experiencing mass movements to include land subsidence and rock falls. For more detail on
these, refer to the Historical Occurrences section below.
The most common areas for mass movements in Brooke and Hancock Counties are
along the state and county routes. Although land subsidence can happen in one location,
the extent of the impact can reach far beyond that location. For example, if a state or county
road were to experience land subsidence and, as a result, have to be closed, the impact
would go far beyond the location of the subsidence since residents and visitors would have
to find another route to get around the incident. It could also potentially block off access to
an entire village or town. For this reason, the extent of the impact could be countywide.
In data provided by the WV Department of Transportation (DOT), there have been
147 slips in Brooke and Hancock Counties the past 10 years; of those, 71.7% were in
Brooke County while only 28.6% were located in Hancock County. This data correlates with
information provided by local officials, where Brooke County officials mentioned several

98
Region 11 Hazard Mitigation Plan 2.0 Risk Assessment
mass movement incidents occurring, while officials in Hancock County did not have any
incidences of note.
HISTORICAL OCCURRENCES
Follansbee, WV
Recently, Follansbee has experienced land subsidence in two places: “City Park”,
near the Parkview residential area behind the Follansbee Middle School and downtown at
the Volunteer Fire Department building on the corner of Main Street and Allegheny Street
where Allegheny Creek flows under the parking lot. The images below illustrate land
subsidence in these two areas. The image to the left is of City Park and the image to the
right is the parking lot at the Follansbee Volunteer Fire Department.
The City of Follansbee provided documentation for costs of repair for the gabion wall
that collapsed into Alleghany Creek. The estimated cost of the restoration is around
$41,660. The estimation provided also included costs for cleaning out the creek to mitigate
against flooding; for more information on this project refer to section 2.2.6 Flood.
Weirton, WV
On October 17, 2016, a landslide presented on Pennsylvania Avenue in Weirton due
to construction activity in the area. The WV Department of Transportation (WVDOT) issued
the following announcement on its website:
Hancock County: WV105 closed due to road slip
The West Virginia Division of Highways advises that effective immediately, WV
105, Pennsylvania Avenue in Weirton will be closed due to a slip. The closure will
occur approximately ½ mile from the intersection with WV 2 to 11th Street.

99
Region 11 Hazard Mitigation Plan 2.0 Risk Assessment
The alternate route is WV2 South to US 22 East to Exit 5, Colliers Way, left off
the exit to WV 105.
As of
March 2017, the
road had not
been opened;
according to
officials, there is
currently no date
for reopening the
road. WTOV9
Fox reported the
incident; an image taken from the video on the website of the report can be seen below.
Bethany, WV
Another area prone to land subsidence and rock falling is Route 67 from Route 2 in
Wellsburg southeast to Bethany. There are several places that are experiencing mass
movements along this road. Two examples include rock falling close to Mile Marker 5 shown
below on the left and evidence of road shifting just outside McKinleyville illustrated below on
the right.
Beech Bottom, WV
The Village of Beech Bottom has experienced several instances of mass movement

100
Region 11 Hazard Mitigation Plan 2.0 Risk Assessment
activity. According to village officials, there have been significant events recorded relating to
old storm sewer pipes suspected to be built in the early 1900’s by the Beech Bottom Mine,
now known as the Windsor Mine. The pipes were built using clay tiles and have eroded after
one hundred years of use. Aside from eroding, the pipe has caved in in several locations
around the village. The most significant incident occurred in 1966 on 2nd Street where a
small sinkhole was noticed in the ground and in only a month, the sinkhole grew to
approximately 10 feet in diameter; FEMA paid close to $83,000 to repair it. The Village has
had to make major repairs to the old storm sewer pipe throughout the years: the most
notable instances were in 1987, 1996, 1988, 2007, 2011, and 2016.
The following photographs illustrate the existing condition of the pipe (on the left) and
the 1996 sinkhole that appeared as a result of the old infrastructure (on the right).
IMPACTS AND SOCIAL VULNERABILITY
Although there have not been any instances of large, catastrophic mass movements
in Region 11, the potential for damage is still present. Generally, mass movements cause
death, injuries, trauma and suffocation from entrapment. Short and long-term mental health
effects have been observed. Depending on the location, these events could cause loss or
damage to homes, infrastructure and critical facilities and block whole communities off.
There is potential for loss of property value, livestock and crops (WHO).
LOSS AND DAMAGES
The information gathered for loss and damage estimation purposes comes directly
from the WV Department of Transportation database. Within the information received, costs
are shown that are associated with each slip. Slips can include very minor jobs where there
is little to no disturbance to roads and highways, to severe incidents that block and reroute

101
Region 11 Hazard Mitigation Plan 2.0 Risk Assessment
traffic. There were 147 total incidents (105 in Brooke County and 42 in Hancock County) in
the 10 years of data for both Brooke and Hancock Counties. The average cost of fixing a
slip is around $126,600, which amounts to over $18.6M over the last 10 years.
PROBABILITY AND SEVERITY CALCULATION
Records from the WV DOT going back 10 years indicate that there have been 147
slips that have had to be fixed.
The severity of mass movements has historically been negligible or marginal at best
since there have been no deaths or injuries associated with them. However, given the
damages in injuries, death and damage to property, this hazard is categorized as a
“marginal” one.
With a value of 14.7 events in a given year, the probability of an event is determined
to be ‘”frequent” and given the “marginal” severity of the hazard, the risk assessment matrix
gives this hazard a “moderate” risk to the region.
Number of events 147
= Probability OR = 14.7
Number of years 10
SEVERITY: MARGINAL
RISK: MODERATE
PROBABILITY: FREQUENT

102
Region 11 Hazard Mitigation Plan 2.0 Risk Assessment
RISK MAP
The map to the
right shows each road slip
that the West Virginia
Department of
Transportation (WVDOT)
registered within
approximately the last ten
years. As evidenced by
the Historical Events
section above, many of
the mass movement
events occur on roadways
and vary in severity.
This map shows
clusters of dots which
form lines along roads.
According to the data,
many of these slips have
occurred. From north to
south, the following are brief descriptions of these clusters, shown on the map circled in red.
Just north of New Cumberland, mainly along Rt. 8.
South of Weirton, a cluster can be seen along US 22.
South of Wellsburg along Rt. 67 going east to Bethany.
Along Rt. 2 in both counties (not shown in red circle).

103
Region 11 Hazard Mitigation Plan 2.0 Risk Assessment
2.2.9 RADIOLOGICAL
Radiation is any form of energy that travels through space or matter. The radiation emitted by many radioactive isotopes contains enough energy to change the physical state of the material through which it passes. A
radiological emergency is an incident that poses an actual or potential hazard to public health or safety or loss of property (FEMA).
Period of Occurrence Warning Time Region 11 Risk
Assessment State Risk Assessment
At any time throughout the year Hours / Days / Months MODERATE Not Ranked
Although there are no major radiological hazards within either of the counties of
Region 11, the radiological hazard is considered due to the proximity to the Beaver Valley
Nuclear Power Plant (NPP) located in Shippingport, Pennsylvania. The Beaver Valley NPP
is currently operated by First Energy Nuclear Operating Company but will be sold or closed
starting in mid-2018 (Funk, 2017). The plant has two active water reactors; the first NPP
reactor began operation in July of 1976 and the second in August of 1987 (Hancock County
Office of Emergency Management, 2010).
POSSIBLE CAUSES
This radiological hazard can be considered similar to the causes of hazardous
materials incidents at fixed facilities. Some of the possible causes of failure involving nuclear
components may include:
equipment failure,
operator error, and
natural phenomenon (severe weather, earthquake, flooding).
LOCATION AND EXTENT
The Beaver Valley NPP is located in
Shippingport, PA approximately 4.6 miles
directly east of the West Virginia –
Pennsylvania border. The closest city in West
Virginia is Chester in Hancock County.
The Nuclear Regulatory Commission
(NRC) defines two emergency planning zones
(EPZ): the first extends 10 miles in radius,

104
Region 11 Hazard Mitigation Plan 2.0 Risk Assessment
known as the plume exposure pathway, and the second extends 50 miles in radius and is
considered the ingestion pathway (WVDHSEM. 2010). The northeastern part of Hancock
County falls within the 10-mile radius EPZ as shown to the right in a map included in the
2016/2017 Emergency Preparedness Information booklet published by the Beaver County
Emergency Management Agency. The green line outlines the 10-mile EPZ that extends to
Hancock County in the bottom left corner of the map.
The 50-mile radius EPZ includes the entire area of Hancock and Brook Counties and
beyond. If a significant incident were to occur, the entire region would be considered
affected.
HISTORICAL OCURRENCES
The Beaver Valley Nuclear Power Plant has not had a significant incident affecting
the public’s health or safety since its construction. However, there have been cases of small
spills reported. The following are a few examples of those occurrences.
August 24, 1977
A leak originated from a contained sump area through a connection intended to
connect Beaver Valley 1 and 2. “The water traveled along an underground duct and spilled
into soil on a steep trenched area within the Unit 2 construction site, according to a
Duquesne Light statement” (“Radioactive leak found at Shippingport”, 1977).
June 22, 1981
According to an article by The Gettysburg Times, radioactive water leaked inside
Reactor 1 due to a malfunctioning degasifier. At the time the NPP was owned by Duquesne
Light Co. and Reactor 2 hadn’t been built. The spill occurred in an auxiliary building in a
discharge ventilation duct and was shut down as soon as the spill was detected. No
contamination was spread to surrounding communities (“Reactor leak didn’t spill”, 1981).
November 2, 1985
The NRC and emergency management agencies were notified of a 300 gallon
radioactive water leak due to a partially open valve. Some of the water reached the Ohio
River but the water was tested about 2 miles downstream and tests did not detect
radioactive material. This situation did not pose any threat to the health and safety of the
public (“Radioactive water gets dumped into a pipe trench”, 1985).

105
Region 11 Hazard Mitigation Plan 2.0 Risk Assessment
IMPACTS AND SOCIAL VULNERABILITY
The Uranium (U-235) used in nuclear power generation can radiate alpha particles
and gamma rays. Alpha particles are not able to penetrate human skin but they might be
inhaled, ingested, or absorbed through an open wound. They can irradiate surrounding
living cells and cause chronic health risks and can only travel a few inches through the air
(Clements, 2009). Radiation from gamma rays is more dangerous; the electromagnetic
energy can penetrate most surfaces and can travel many feet in the air (Clements, 2009).
They can pass completely through the human body and as they do, they could cause
damage to tissue and DNA (EPA).
Chronic doses of radiation are cumulative over each person’s lifetime and are known
to cause thyroid cancer, leukemia, solid cancers, circulatory disease, cataracts, and birth
defects. In general, children and pregnant women are at higher risk to radiation exposure.
However, should a radiological disaster occur, the entire population living within the
exposure zone will be equally vulnerable.
LOSS AND DAMAGES
According to an article published by MSNBC in 2011, the U.S. Nuclear Regulatory
Commission (NRC) analyzed the possibilities of an earthquake causing catastrophic failure
to the nuclear plants across the country. The factors that were taken into consideration were
the chance of a serious earthquake and the strength of design of the NPP. Beaver Valley 1
ranks among the top 10 on the list of 104 total analyzed plants. Beaver Valley 2 ranked at
number 36 on the list. The estimates are not based on the Richter or Mercalli scale, but on
the peak ground acceleration, a unit that measures how violently the ground shakes, caused
by the depth, distance from the epicenter and frequencies of waves that the earthquake
generates (Dedman, 2011). For more information about peak ground acceleration, refer to
section 2.2.4 Earthquakes.
PROBABILITY AND SEVERITY CALCULATION
The probability of an event cannot be calculated based on traditional historical
occurrences over a period of years since there have not been any major incidents at the
nuclear power plant. However, the fact that there is a power plant that includes Hancock
County within its 10-mile emergency planning zone, the possibility of there being an
occurrence cannot be ignored. Given that there have been some minor incidents at the

106
Region 11 Hazard Mitigation Plan 2.0 Risk Assessment
power plant, the possibility of another occurrence is present; for this reason the possibility is
determined to be “remote”.
In the past, the severity of the radiological hazard has been negligible. However, if
there were a significant incident at the power plant, the severity of the impact to Hancock
and Brooke Counties would be “critical”.
According to the risk assessment matrix, a “remote” possibility of occurrence
combined with a “critical” severity will pose a “moderate” risk to Region 11 with a possibility
of higher impacts in Hancock County within the 10-mile emergency planning zone.
RISK MAP
The
Beaver Valley
Nuclear
Power Plant
10-Mile
Emergency
Planning
Zone (EPZ)
reaches parts
of northern
Hancock
County as
shown on the
map to the
right.
SEVERITY: CRITICAL
RISK: MODERATE
PROBABILITY: REMOTE
PE
NN
SY
LVA
NIA
OHIO

107
Region 11 Hazard Mitigation Plan 2.0 Risk Assessment
2.2.10 SEVERE WEATHER
Various types of severe weather can occur throughout the year, typically defined by seasonal meteorological activity. Severe weather “affects considerable portions of North America and cause significant death and
destruction each year” (DeVecchio & Keller, 2015). This severe weather hazard profile includes instances of hail, heavy snow, high wind, lighting, strong wind, thunderstorm wind, winter storms and winter weather.
Period of Occurrence Warning Time Region 11 Risk
Assessment State Risk Assessment
The various types of severe weather can occur year-round.
Days / Weeks MODERATE
LOW (Hail) N/A (Lightning)
MEDIUM (Tornado) MEDIUM (Wind)
Severe weather, for the purposes of this analysis, will include the following types of
events that can occur throughout the entire year in all areas of Region 11. Because
mitigation efforts are similar for these types of hazards, they were grouped under one
common profile heading.
Blizzard: A winter storm which produces the following conditions for three hours or
longer: 1) sustained winds or frequent gusts 30 knots (35 mph) or greater, and 2)
falling and/or blowing snow reducing visibility frequently to less than 1/4 mile, on a
widespread or localized basis (NCEI).
Ice Storm: Ice accretion meeting or exceeding locally/regionally defined warning
criteria (typical value is 1/4 or 1/2 inch or more), on a widespread or localized basis
(NCEI).
Hailstorms: The National Severe Storms Laboratory (NSSL), a division of NOAA,
defines hail as “a form of precipitation that occurs when updrafts in thunderstorms
carry raindrops upward into extremely cold areas of the atmosphere where they
freeze into balls of ice” (Severe Weather 101.) Hail can damage aircraft, homes,
cars, and can even injure or be deadly to livestock. Obviously, the larger the size of
the hail the more potential it has to cause damage or injury. The NSSL considers a
severe hailstorm to contain hail that is one inch or more in diameter. This is
approximately the size of a quarter.
Heavy Snow: Snow accumulation meeting or exceeding locally/regionally defined 12
and/or 24 hour warning criteria, on a widespread or localized basis. This could mean
such values as four, six or eight inches or more in 12 hours or less; or six, eight or
ten inches in 24 hours or less (NCEI).

108
Region 11 Hazard Mitigation Plan 2.0 Risk Assessment
Lightning: Lightning is a giant spark of electricity between the atmosphere and the
ground. In the initial stages of development, air acts as an insulator between the
positive and negative charges in the cloud and between the cloud and the ground;
however, when the differences in the charges becomes too great, this insulating
capacity of the air breaks down and there is a rapid discharge of electricity known as
lightning (NWS). The map to the right by
Storm Highway illustrates the average
recordings of lightning strikes per square
kilometer in the state of West Virginia.
Hancock and Brook Counties experience
between four and six.
Thunderstorms: The wind gusts and
lightning associated with thunderstorms can
pose a threat to life and property.
Thunderstorms also have the potential to produce hail and tornadoes, as discussed
previously. Thunderstorms are typically associated with cold fronts and can move in
“lines,” meaning that a location can possibly be struck by several storms in the
course of minutes or hours. The heavy rainfall associated with one or multiple storms
has been known to create flash floods in the presence of oversaturated soils. A
major secondary threat associated with thunderstorms is lightning. Individual
lightning strikes occur with no warning and kill between 75 and 100 Americans every
year (Haddow, Bullock, & Coppola, 2014, p.51.) Lighting can reach a significant
distance from a storm, up to 25 miles according to the National Severe Storms
Library (NSSL). While lightning is a common occurrence and can be seen in most
thunderstorms, only about 20% of the lighting observed in a storm will strike the
ground
Tornadoes: Tornadoes are typically
associated with the strongest
thunderstorms and are capable of
causing tremendous damage. The
Enhanced Fujita Scale (EF Scale)
measures tornadoes and categorizes
these events based on wind speed.
There are six categories in the EF

109
Region 11 Hazard Mitigation Plan 2.0 Risk Assessment
Scale, from EF0 through EF5. An EF0 tornado will cause some minor damage, while
an EF5 is considered to cause massive destruction. The graphic above, developed
by the Insurance Institute for Business & Home Safety and StateFarm, shows the
wind scales and the damaged expected in each category. Tornadoes are historically
very difficult to predict. The storms that may produce a tornado can be forecasted,
but not every storm with that potential will spawn a tornado and predicting where and
when that will happen is incredibly difficult. Historical trends show that some areas of
the country, such as the Midwest plain states, have a higher probability of tornado
occurrence. However, they can and have struck in many other areas.
Wind: A wind event is typically not associated with other hazards, such as
thunderstorms. Wind events will have little or no rain associated with them and may
last considerably longer than other events like thunderstorm wind and tornadoes.
Wind events can result in a number of impacts, including blowing tree limbs and
trees onto structures, roadways, and power lines. The National Centers for
Environmental Information (NCEI) records two types of stand-alone wind events:
high wind events and strong wind events. (NWS Instruction 10-1605).
Winter Storms: A winter weather event which has more than one significant hazard
(i.e., heavy snow and blowing snow; snow and ice; snow and sleet; sleet and ice; or
snow, sleet and ice) and meets or exceeds locally/regionally defined 12 and/or 24
hour warning criteria for at least one of the precipitation elements, on a widespread
or localized basis (NCEI).
Winter Weather: A winter precipitation event that causes a death, injury, or a
significant impact to commerce or transportation but does not meet locally/regionally
defined warning criteria. A winter weather event could result from one or more winter
precipitation types (snow, or blowing/drifting snow, or freezing rain/drizzle), on a
widespread or localized basis (NWS Instruction 10-1605).
POSSIBLE CAUSES
The types of severe weather described in this profile can be significantly altered by
human activities. Some of these activities can be described as the following.
Urban Heat Island Effect: a local climatic condition in which a metropolitan area
may become as much as 22° F warmer than the surrounding countryside.
Burning of Fossil Fuels: gasses emitted from burning of fossil fuels can linger in

110
Region 11 Hazard Mitigation Plan 2.0 Risk Assessment
the atmosphere contributing to climate changes. (Keller, Devecchio, 2015, p 317).
Climate Change: weather and climate change are closely related to the increase of
occurrences in severe weather. For more complete information, refer to section
2.1.5. Hazards and Climate Change.
LOCATION AND EXTENT
Severe weather is a hazard that can affect all areas and jurisdictions of the region.
Brooke and Hancock Counties, as well as surrounding counties and states, are at similar
risk of exposure to these types of severe weather events. Severe weather events have the
potential of lasting seconds (i.e. lightning), a few minutes (i.e. tornadoes), several hours (i.e.
thunderstorms, hailstorms, heavy snow, etc.), or even days (i.e. winter weather, high winds).
HISTORICAL OCCURRENCES
According to local officials and residents, weather events in Brooke and Hancock
Counties are typical of the region’s climate and geography; for that reason, there are no
severe weather events that stand out of significant impact. However, the NCEI records
these types of events and a selected few are mentioned here, the ones selected are events
that have had the most damages attributed to a single event.
Weirton, WV
On August 24, 1998, the NCEI reports that lightning struck a house and sparked a
fire resulting in roof and smoke damage. On the same day, lightning also struck another
house causing an exterior wall to char and smoke damage within the house.
Follansbee, WV
On July 18, 2012, severe thunderstorms developed along a slow moving cold front
from eastern Ohio to northern West Virginia and western Pennsylvania. Heavy rainfall
produced isolated flash flooding in some areas. Law enforcement reported numerous trees
and power lines down in and around Follansbee.
Brooke and Hancock Counties
Low pressure from the remains of Hurricane Ike moved across central Ohio on
September 14, 2014. Areas affected included eastern Ohio, northern West Virginia and
western Pennsylvania. Widespread damage to trees and power lines occurred across the

111
Region 11 Hazard Mitigation Plan 2.0 Risk Assessment
region causing damage to some structures. Sustained winds during the storm were from 30
to 50 mph, with gusts well over 60 mph.
IMPACTS AND SOCIAL VULNERABILITY
There are many impacts of severe weather. To analyze them, they are categorized
into events relating to winter weather (blizzards, ice storms, winter storms), wind (tornadoes
and high winds), and hailstorms.
Winter Weather: Causes respiratory illnesses and cold-related injuries to humans,
damage to the vegetation (fallen trees), and can cause damage to infrastructure
(water outages, downed power lines leading to power outages, road and bridge
closures and damage to roads from plows, damage to homes, etc).
Wind: Causes respiratory illnesses, damage to the vegetation (fallen trees), and can
cause damage to infrastructure due to flying debris.
Hailstorms: Can cause injury to humans and animals if directly exposed, damage to
vegetation and infrastructure.
As with all hazards, severe weather hazards can also have an effect on the mental
health of the population causing anxiety, panic attacks and post-traumatic stress. Vulnerable
populations can include those who are unable to evacuate during a severe weather event,
those with health issues that may be exacerbated, as well as children and elderly adults. If
poor populations are unable to provide necessary shelter during an event, they will be at
higher risk and may be more vulnerable to the effects of that event.
LOSS AND DAMAGES
The following table lists the severe weather occurrences in the region according to
data gathered from the National Centers for Environmental Information (NCEI) storm events
database. Blizzards and winter storms were combined into a single category and events
relating to wind and high winds were also grouped.
It is possible that there have been more events than recorded here; however, this list
indicates the events that were reported to the NCEI. Also, there have been no officially
recorded tornadoes since 1950, although interviews with local officials indicate that there
may have been unconfirmed sightings. Note that different events have different timeframe
years; some records are not available before the year noted.

112
Region 11 Hazard Mitigation Plan 2.0 Risk Assessment
The total cost of severe weather in damages is over $3M, giving an average cost per
event of roughly $11,000.
TABLE 2.22 SEVERE WEATHER
Event Occurrences
Brooke County Occurrences
Hancock County Total
Occurrences Timeframe Damages
Blizzard/Winter Storm 6 7 13 1999-2016 $30,000
Hailstorm 13 28 41 1980-2016 $0
Ice Storm 8 6 14 1997-2016 $6,000
Lightning 0 2 2 1996-2016 $23,000
Thunderstorm 84 85 169 1957-2016 $2,348,750
Tornado 0 0 0 1950-2016 $0
Wind 12 13 25 1999-2016 $626,500
Totals 123 141 264 $3,034,250
SOURCE: NOAA National Centers for Environmental Information Storm Events Database
PROBABILITY AND SEVERITY CALCULATION
The total number of severe weather events in Brooke and Hancock Counties is 264.
The earliest year of record with any recorded events is 1957, giving a total number of years
of 59. This information is based on data available from NCEI.
Although the average cost per severe weather event is low, the overall cost of this
hazard is noticeable. Damage to structures is the most costly since there have been no
reports of injuries or illnesses directly related to severe weather in Region 11.
With a value of 4.47 events in a given year, the probability of an event is determined
to be “frequent” and given the “negligible” severity of the hazard, the risk assessment matrix
Number of events 264
= Probability OR = 4.47
Number of years 59
SEVERITY: MARGINAL
PROBABILITY: FREQUENT

113
Region 11 Hazard Mitigation Plan 2.0 Risk Assessment
gives this hazard a “moderate” risk to the region.
RISK MAP
All regions of
Brooke and Hancock
Counties are equally at a
moderate risk of severe
weather events.
RISK: MODERATE

114
Region 11 Hazard Mitigation Plan 2.0 Risk Assessment
2.2.11 WILDFIRES
“A large, often out-of-control burning of trees, fallen wood, detritus, and other debris in uninhabited or sparsely inhabited forest or grasslands” (Haddow, Bullock, & Coppola, 2014).
Period of Occurrence Warning Time Region 11 Risk
Assessment State Risk
Assessment At any time throughout the year. Increased chance following dry
weather. None / Hours / Days LOW LOW
Wildfires are often thought about as large, out-of-control fires that burn hundreds of
acres at a time, injure or kill firefighters, and destroy homes and wildlife. For the purposes of
this analysis, the term “wildfire” includes brushfires as well as forest fires. In order for a fire
to start there must be oxygen, fuel and heat; if any one of these three components is not
present, the fire will not ignite. There are three different types of fires that can be classified
(Keller & Devecchio, 2015).
Ground: Creep along slowly just under the ground surface with little flaming and
more smoldering combustion.
Surface: Low-intensity surface fires burn grass, shrubs, dead and downed limbs, leaf
litter, and other biomass.
Crown: Those in which flaming combustion is carried through the canopies of the
trees.
“Wildland fire can be a friend and a foe. In the right place at the right time, wildland
fire can create many environmental benefits, such as reducing grass, brush, and trees that
can fuel large and severe wildfires and improving wildlife habitat. In the wrong place at the
wrong time, wildfires can wreak havoc, threatening lives, homes, communities, and natural
and cultural resources” (U.S. Forest Service).
POSSIBLE CAUSES
According to the WV Division of Forestry, “people cause the majority of forest fires in
West Virginia. In the spring of 2015, 43% of all forest fires were the result of escaped debris
fires. Equipment use was the second highest … causing 29% of all wildfires. Fires set
purposely accounted for 13%” (n.d.).
The National Park Service lists several possible causes of wildfires including human-
caused and nature-caused. Human-caused fires “result from campfires left unattended, the

115
Region 11 Hazard Mitigation Plan 2.0 Risk Assessment
burning of debris, negligently discarded cigarettes and intentional acts of arson”, which
account for up to 90% of fires. Lightning or lava causes the remaining 10% of fires (NPS).
LOCATION AND EXTENT
Fires always have an ignition point that originates in a
specific location; typically wildfires start in or around wooded
lands and begin to spread. The USGS National Gap Analysis
Program Land Cover Data Viewer shows the different types of
vegetation in each county. As shown on the map to the right,
Brooke and Hancock Counties are comprised of three different
elements: forest and woodland, agricultural vegetation and
developed and other human use. Scattered throughout the
counties in a very low amount are other types of land use, as
identified in the legend below.
Wildfires are a region-wide hazard that can affect all
areas and jurisdictions of the counties. One wildfire or brush fire
can cover several acres at time and spread rapidly though the
region. The topography of the area is important; “slopes
exposed to prevailing winds tend to have drier vegetation than
do slopes sheltered from the wind, and thus, are more prone to
combustion. Also, in mountainous areas, winds tend to circulate
up canyons providing an easy path for wildfires” (Keller,
Devecchio, 2015, p.450).
Historically, the state of West Virginia and the northern
panhandle in particular, have not been prone to wildfire activity.
However, these events do happen as evidenced by the section
below. The WV Division of Forestry periodically
publishes fire danger maps on its website
created by the National Interagency Fire Center
(NIFC). Shown on the next page are snapshots
taken in November of 2016 and February of
2017; the risk is not always the same throughout
the year.

116
Region 11 Hazard Mitigation Plan 2.0 Risk Assessment
HISTORICAL OCURRENCES
According to interviews with local fire chiefs, there have not been many wild or
brushfires of note in the area and they are few and far between. The following are a couple
of instances where brushfires made the local news.
Weirton, WV
On November 13, 2015, flames grew along the hillside of Cove Road in Weirton.
Nine fire departments responded to the human-caused incident; extinguishing fire on steep
terrain with blowing wind was a difficult task. A month later, trees and logs were still
smoldering in the 15 acres that had been consumed. There was no structural damage
(WVAlways.com, 2015).
New Manchester, WV
In March of 2016, human error caused three brushfires in northern Hancock County:
one on Route 8, another on Westlake Lane and on Snyder Road. The last one originated at
a resident’s property but continued to spread into the Hillcrest Wildlife Management Area
(The Review, 2016).

117
Region 11 Hazard Mitigation Plan 2.0 Risk Assessment
IMPACTS AND SOCIAL VULNERABILITY
Aside from the obvious effects on humans such as burns and injuries, the smoke
from fires is of great concern. “The smoke produced by wildfires can produce effects ranging
from airway and eye irritation to death, especially among individuals with conditions that
make them more susceptible to inhalational exposures” (Clements, 2009, p.283). Wildfires
cause more than just the direct damage to structures, vegetation or air quality; when a fire
removes much or all of the vegetation in a watershed, subsequent rains will have much
greater erosive potential, which in turn produces large quantities of sediment and plant
debris that affect the water quality of streams and lakes (Keller, Devecchio, 2015, p.459).
However, wildfires can also have benefits to the soil; they “tend to leave an
accumulation of carbon on the surface in the form of ash and increase the nutrient content
of a soil. Under the right conditions, when erosion does not remove the ash from the
environment, a nutrient reservoir may form that is beneficial to local plants” (Keller &
Devecchio, 2015, p 159).
LOSS AND DAMAGES
No data for losses or damages has been reported as being caused by wild or
brushfires in the area.
PROBABILITY AND SEVERITY CALCULATION
There have not been enough events to place a value of probability of occurrence on
wildfires in the area. Since they have happened in the past years there is a “remote”
possibility of a wildfire or brushfire happening in any given year.
The damages caused by wild and brush fires have been “negligible”; no significant
damages have been reported.
With a “remote” possibility of occurrence and “negligible” impacts on the region,
wildfires are of “low” risk to Region 11.
SEVERITY: NEGLIGIBLE
RISK: LOW
PROBABILITY: REMOTE

118
Region 11 Hazard Mitigation Plan 2.0 Risk Assessment
RISK MAP
The areas shown
on the map in orange
correspond to forest and
grassland land use,
according to the USGS.
These areas, although
they have a low risk of
wildfire events, are the
most vulnerable to the
hazard.

119
Region 11 Hazard Mitigation Plan 2.0 Risk Assessment
2.3 INVENTORY ASSETS
§201.6(c)(2)(ii)
[The risk assessment shall include a] description of the jurisdiction’s vulnerability of the hazards described in paragraph (c)(2)(i) of this section. This description shall include an overall summary of each hazard and its impact on the community.
§201.6(c)(2)(ii)(A)
The plan should describe vulnerability in terms of the types and numbers of existing and future buildings, infrastructure, and critical facilities located in the identified hazard areas.
This risk assessment identifies potentially-vulnerable community assets such as
critical facilities, critical infrastructure, historical properties, commercial/industrial facilities,
etc. Assets contribute directly to the quality of life in the community as well as ensure its
continued operation. As such, government facilities are often listed, as are water/wastewater
and transportation infrastructure. Assets can also be irreplaceable items within the
community, such as historical structures or even vulnerable populations (including the
elderly or youths).
Methodology
Inventorying assets first involves determining what in the community can be affected
by a hazard event. The hazard profiles contained in Section 2.2 above contain generalized
loss estimates that, in some cases identify the types of facilities that could be impacted by
the hazards considered in this plan. Additionally, the core planning committee used its
meetings during the update process to significantly revise the original asset list that was
included in this plan. In the following lists, assets are grouped into the following categories.
Critical Facilities: Governmental facilities, water/wastewater facilities, emergency
services facilities, medical facilities (hospitals/clinics), and transportation
infrastructure.
Vulnerable Populations: Schools, nursing homes, and senior centers.
Economic Assets: Large commercial/industrial facilities or large employers (not
covered in other categories).
Special Considerations: Residences, community outreach facilities, post offices,
and libraries.
Historical Considerations: Areas/structures listed on the National Register of
Historic Places.

120
Region 11 Hazard Mitigation Plan 2.0 Risk Assessment
Asset Inventory
The following tables list assets on a community-by-community basis. Each asset
table denotes the name, address, and category of asset for each facility listed as well as a
determination of vulnerability for each hazard. Vulnerability is listed as low (L),
moderate/medium (M), or high (H). Vulnerability was assessed by mapping the assets using
mapping software and overlaying hazard areas. The following describes the reasoning for
assigning the level of vulnerability to each asset according to the hazard.
Acts of Violence: All assets are considered to be of medium vulnerability
considering the unpredictable nature of the hazard.
Dam Failure: Unless the assets are in direct contact with the projected dam flooding
path in case of a failure, all assets are considered to be low vulnerability to this
hazard.
Drought: All assets are considered to be of a low vulnerability to drought because
this hazard does not affect structures.
Earthquake: All assets are currently considered to be low vulnerability to
earthquakes. A more in-depth, site specific study is required to determine each
asset’s vulnerability to include age of structure, materials used, maintenance, etc.
Extreme temperatures: Extreme temperatures can cause assets to deteriorate. For
this reason, all assets are of medium vulnerability.
Flood: Assets clearly within the 100-year floodplain are considered to be high
vulnerability. If the assets were on or close to the edge of the floodplain, they’re
considered to have a medium vulnerability. All other assets outside the floodplain are
low vulnerability.
Hazmat: Assets that are also Tier II reporting facilities or in very close proximity to
these facilities are considered to be high vulnerability. Gas stations and assets along
highly travelled routes such as State Route 2 and Route 27 are considered to have a
medium vulnerability.
Mass Movements: All assets are considered to be outside the mass movement
areas. For this reason, they are considered to be of a low vulnerability. However, due
to the old, decaying infrastructure in Beech Bottom and all the maintenance that has
had to be done, Beech Bottom’s assets are considered to be a moderate
vulnerability to the hazard.

121
Region 11 Hazard Mitigation Plan 2.0 Risk Assessment
Radiological: Assets inside the 10-mile emergency planning zone (EPZ) are
considered to have high vulnerability. Any asset outside the EPZ is considered to
have low vulnerability.
Severe Weather: Severe weather can cause varying degrees of damage to. For this
reason, all assets are of medium vulnerability.
Wildfire: All assets are considered to be outside potential wildfire areas. All assets
are considered to be of a low vulnerability.

122
Region 11 Hazard Mitigation Plan
2.0 Risk Assessment
2.3.1 ASSET INVENTORY
TABLE 2.23 BROOKE COUNTY ASSETS
Asset Vulnerability to Hazards (H, M, L)
Asset Name Category Address City Acts
of V
iole
nce
Dam
Fai
lure
Dro
ught
Earth
quak
e
Extre
me
Te
mpe
ratu
res
Floo
d
Haz
mat
Mas
s M
ovem
ents
Rad
iolo
gica
l
Seve
re W
eath
er
Wild
fire
Colliers Volunteer Fire Department - Ladies Aux Inc. Critical 341 Pennsylvania Avenue Colliers M L L L M H L L L M L
Colliers Primary School Vulnerable Population 270 Pennsylvania Avenue Colliers M L L L M M L L L M L Colliers Post Office Special Consideration 327 Pennsylvania Avenue Colliers M L L L M H L L L M L Promise of Victory Church of God Vulnerable Population 47 Dennis Ridge Road Colliers M L L L M L L L L M L
Cross Creek United Presbyterian Church Vulnerable Population 3831 Tent Church Road Colliers M L L L M L L L L M L
Follansbee Church of Christ Vulnerable Population 833 Archer Hill Road Colliers M L L L M L L L L M L Short Creek Volunteer Fire Department Critical 12 Short Creek Road Short Creek M L L L M L L L L M L
Short Creek Post Office Special Consideration 1 Short Creek Road Short Creek M L L L M L L L L M L

123
Region 11 Hazard Mitigation Plan
2.0 Risk Assessment
TABLE 2.24 HANCOCK COUNTY ASSETS Asset Vulnerability to Hazards (H, M, L)
Asset Name Category Address City Acts
of V
iole
nce
Dam
Fai
lure
Dro
ught
Earth
quak
e
Extre
me
Te
mpe
ratu
res
Floo
d
Haz
mat
Mas
s M
ovem
ents
Rad
iolo
gica
l
Seve
re W
eath
er
Wild
fire
New Manchester Elementary School
Vulnerable Population 128 Frankfort Road New Manchester M L L L M L L L M M L
New Manchester Volunteer Fire Department
Critical 193 Main Street New Manchester M L L L M L L L H M L
New Manchester Post Office Special Consideration 290 High Street New Manchester M L L L M L L L H M L Old Courthouse Historical Consideration High and Elm Street New Manchester M L L L M L L L H M L Fairview Presbyterian Vulnerable Population 99 Market Street New Manchester M L L L M L L L H M L New Manchester Christian Church
Vulnerable Population 172 High Street New Manchester M L L L M L L L H M L
Oak Glen Middle School Vulnerable Population 39 Golden Bear Drive New Manchester M L L L M L L L H M L Oak Glen High School Vulnerable Population 195 Golden Bear Drive New Manchester M L L L M L L L H M L Newell Volunteer Fire Department
Critical 542 Washington Street Newell M L L L M L M L H M L
Baker's Bottom Historic District Historical Consideration WV 2 Newell M L L L M L L L H M L Baker's Fort Massacre Site Historical Consideration WV 2 Newell M L L L M L L L H M L Nathan Hellings Apple Barn Historical Consideration WV 2 Newell M L L L M L L L H M L Mountaineer Racetrack and Gaming Resort
Historical Consideration 1420 Mountaineer Circle Newell M L L L M L L L H M L
William E. Wells House Historical Consideration 372 Virginia Terrace Newell M L L L M L L L H M L First Presbyterian Church Vulnerable Population 602 Grant Street Newell M L L L M L L L H M L First Methodist Episcopal Church
Vulnerable Population 318 Grant Street Newell M L L L M L L L H M L
Newell United Methodist Church
Vulnerable Population 311 Grant Street Newell M L L L M L L L H M L
Ergon West Virginia, Inc. Economic Asset 9995 Ohio River Boulevard
Newell M L L L M H H L H M L
Newell Water Tank Critical Wells Avenue Newell M L L L M L L L H M L Sunoco Economic Asset 600 Washington Street Newell M L L L M L M L H M L

124
Region 11 Hazard Mitigation Plan
2.0 Risk Assessment
TABLE 2.25 BEECH BOTTOM ASSETS
Asset Vulnerability to Hazards (H, M, L)
Asset Name Category Address City Acts
of V
iole
nce
Dam
Fai
lure
Dro
ught
Earth
quak
e
Extre
me
Te
mpe
ratu
res
Floo
d
Haz
mat
Mas
s M
ovem
ents
Rad
iolo
gica
l
Seve
re W
eath
er
Wild
fire
Beech Bottom Primary School Vulnerable Population High Street Beech Bottom M L L L M L L M L M L Beech Bottom Volunteer Fire Department
Critical 13 3rd Street Beech Bottom M L L L M L L M L M L
Beech Bottom Volunteer Fire Department Station 9
Critical 3rd Street Beech Bottom M L L L M L L M L M L
Beech Bottom Police Department Critical 11 3rd Street Beech Bottom M L L L M L L M L M L Beech Bottom Village Office Critical 11 3rd Street Beech Bottom M L L L M L L M L M L Beech Bottom Post Office Special Consideration 15 3rd Street Beech Bottom M L L L M L L M L M L Beech Bottom Community Church Vulnerable Population Alley C Beech Bottom M L L L M L L M L M L
Village of Beech Bottom Critical 11 3rd Street Beech Bottom M L L L M L L M L M L

125
Region 11 Hazard Mitigation Plan
2.0 Risk Assessment
TABLE 2.26 BETHANY ASSETS Asset Vulnerability to Hazards (H, M, L)
Asset Name Category Address City Acts
of V
iole
nce
Dam
Fai
lure
Dro
ught
Earth
quak
e
Extre
me
Tem
pera
ture
s
Floo
d
Haz
mat
Mas
s M
ovem
ents
Rad
iolo
gica
l
Seve
re W
eath
er
Wild
fire
Bethany College Vulnerable Population 31 S Loop Campus Drive Bethany M L L L M L L L L M L Bethany Volunteer Fire Department Critical 11 WV 88 Bethany M L L L M L L L L M L
Bethany Police Department Critical Church Street Bethany M L L L M M L L L M L Bethany Post Office Special Consideration 1 Ross Street Bethany M L L L M L L L L M L Alexander Campbell Mansion Historical Consideration Main Street Bethany M L L L M L L L L M L Delta Tau Delta Founders Home Historical Consideration 211 Main Street Bethany M L L L M L L L L M L Old Main, Bethany College Historical Consideration 31 S Loop Campus Drive Bethany M L L L M L L L L M L Old Bethany Church Vulnerable Population Main and Church Street Bethany M L L L M L L L L M L Castleman Run Church Vulnerable Population Castleman Run Road Bethany M L L L M L L L L M L Bethany Memorial Christian Church Vulnerable Population Main Street Bethany M L L L M L L L L M L
St. John Fisher Catholic Church Vulnerable Population 201 Richardson Street Bethany M L L L M L L L L M L

126
Region 11 Hazard Mitigation Plan
2.0 Risk Assessment
TABLE 2.27 CHESTER ASSETS Asset Vulnerability to Hazards (H, M, L)
Asset Name Category Address City Acts
of V
iole
nce
Dam
Fai
lure
Dro
ught
Earth
quak
e
Extre
me
Tem
pera
ture
s
Floo
d
Haz
mat
Mas
s M
ovem
ents
Rad
iolo
gica
l
Seve
re W
eath
er
Wild
fire
Orchards at Foxcrest Vulnerable Population 125 Fox Lane Chester M L L L M L L L H M L A.T. Allison Elementary Vulnerable Population 605 Railroad Street Chester M L L L M L L L H M L Chester Volunteer Fire Department Critical 371 Carolina Avenue Chester M L L L M L M L H M L
Lawrenceville Volunteer Fire Department Critical 616 Pyramys Street Chester M L L L M L L L H M L
Chester Police Department Critical 600 Indiana Avenue Chester M L L L M L L L H M L City of Chester Critical 600 Indiana Avenue Chester M L L L M L L L H M L Chester Post Office Special Consideration 323 Carolina Avenue Chester M L L L M L M L H M L Chester City Hall Critical 600 Indiana Avenue Chester M L L L M L L L H M L James F Murray House a.k.a. Murray-Abrams House Historical Consideration 530 Louisiana Avenue Chester M L L L M L L L H M L
Lynn Murray Memorial Special Consideration
Special Consideration 601 Railroad Avenue Chester M L L L M L L L H M L
Church of Christ Vulnerable Population 201 Virginia Ave Chester M L L L M L L L H M L Chester Church of the Nazarene Vulnerable Population 205 3rd Street Chester M L L L M L L L H M L First Christian Church Vulnerable Population 330 Indiana Avenue Chester M L L L M L L L H M L Sacred Heart Catholic Church Vulnerable Population 418 4th Street Chester M L L L M L L L H M L Westminster Presbyterian Church Vulnerable Population 508 Indiana Avenue Chester M L L L M L L L H M L Emmanuel Mission church Vulnerable Population Fairview Road Chester M L L L M L L L H M L Chester Sewage Treatment Plant Critical Water Louella Avenue Chester M L L L M H L L H M L Chester City Pump House Critical Collins Memorial Drive Chester M L L L M L L L H M L Chester Water Tank Critical Liberty Avenue Chester M L L L M L L L H M L Sunoco Economic Asset 800 Caroline Avenue Chester M L L L M L M L H M L

127
Region 11 Hazard Mitigation Plan
2.0 Risk Assessment
TABLE 2.28 FOLLANSBEE ASSETS Asset Vulnerability to Hazards (H, M, L)
Asset Name Category Address City Acts
of V
iole
nce
Dam
Fai
lure
Dro
ught
Earth
quak
e
Extre
me
Tem
pera
ture
s
Floo
d
Haz
mat
Mas
s M
ovem
ents
Rad
iolo
gica
l
Seve
re W
eath
er
Wild
fire
BP Economic Asset 1522 Main Street Follansbee M L L L M L M L L M L Brooke County EMS Critical 1960 Main Street Follansbee M L L L M L M L L M L City of Follansbee Critical 872 Main Street Follansbee M L L L M H M L L M L Downtown Water Plant Critical Washington Street Follansbee M L L L M H L L L M L First Church of the Nazarene Vulnerable Population 114 Mahan Lane Follansbee M L L L M L L L L M L First Energy Substation (Mon Power)
Critical WV 2 Follansbee M L L L M L L L L M L
Follansbee Water Plant Critical 807 Lee Road Follansbee M L L L M L L L L M L Follansbee Library Special Consideration 844 Main Street Follansbee M L L L M H M L L M L Follansbee Middle School Vulnerable Population 1440 Main Street Follansbee M L L L M L L L L M L Follansbee Police Department Critical 872 Main Street Follansbee M L L L M M M L L M L Follansbee Post Office Special Consideration 1005 Main Street Follansbee M L L L M H M L L M L Follansbee United Methodist Church
Vulnerable Population 1002 Virginia Avenue Follansbee M L L L M H L L L M L
Follansbee Volunteer Fire Department
Critical 1061 Main Street Follansbee M L L L M H M L L M L
Follansbee Waste Water Plant Critical Riverview Avenue Follansbee M L L L M L L L L M L FSTI Economic Asset 800 Veterans Drive Follansbee M L L L M L L L L M L Goodwill Church Vulnerable Population 2514 Eldersville Road Follansbee M L L L M L L L L M L Hooverson Heights Primary School
Vulnerable Population 200 Rockdale Road Follansbee M L L L M L L L L M L
Hooverson Heights Volunteer Fire Department Critical 116 May Road Follansbee M L L L M L L L L M L
Hooverson Heights Volunteer Fire Department (garage)
Critical 2518 Eldersville Road Follansbee M L L L M L L L L M L
Jefferson Primary School Vulnerable Population 1098 Jefferson Street Follansbee M L L L M L L L L M L Koppers Chemical Economic Asset 100 Koppers Road Follansbee M L L L M L L L L M L

128
Region 11 Hazard Mitigation Plan
2.0 Risk Assessment
TABLE 2.28 FOLLANSBEE ASSETS Asset Vulnerability to Hazards (H, M, L)
Asset Name Category Address City Acts
of V
iole
nce
Dam
Fai
lure
Dro
ught
Earth
quak
e
Extre
me
Tem
pera
ture
s
Floo
d
Haz
mat
Mas
s M
ovem
ents
Rad
iolo
gica
l
Seve
re W
eath
er
Wild
fire
Lombardi Development Company
Economic Asset 649 Virginia Avenue Follansbee M L L L M L L L L M L
Mount Zion Church Vulnerable Population 635 Virginia Avenue Follansbee M L L L M L L L L M L Mountain State Carbon Critical WV 2 Follansbee M L L L M L L L L M L Murphy Consolidated Industries Economic Asset 575 Veterans Drive Follansbee M L L L M L L L L M L Sheetz Economic Asset 1525 Main Street Follansbee M L L L M L M L L M L Sierra Chemicals Economic Asset 200 Archer Hill Road Follansbee M L L L M L L L L M L Spectra Energy Economic Asset 600 Veterans Drive Follansbee M L L L M L L L L M L St. Anthony Church Vulnerable Population 1017 Jefferson Street Follansbee M L L L M L L L L M L Sunoco Economic Asset 1405 Main Street Follansbee M L L L M L M L L M L United Presbyterian Church Vulnerable Population 1254 Main Street Follansbee M L L L M L M L L M L Wheeling-Nisshin Inc. Economic Asset 400 Penn Street Follansbee M L L L M L L L L M L

129
Region 11 Hazard Mitigation Plan
2.0 Risk Assessment
TABLE 2.29 NEW CUMBERLAND ASSETS Asset Vulnerability to Hazards (H, M, L)
Asset Name Category Address City Acts
of V
iole
nce
Dam
Fai
lure
Dro
ught
Earth
quak
e
Extre
me
Tem
pera
ture
s
Floo
d
Haz
mat
Mas
s M
ovem
ents
Rad
iolo
gica
l
Seve
re W
eath
er
Wild
fire
Herron Airport Critical 529 Herron New Cumberland M L L L M L L L H M L Lafarge Economic Asset 28 Quarry Drive New Cumberland M L L L M H L L L M L City of New Cumberland Fire Department Critical 303 N Chester Street New Cumberland M L L L M H M L L M L
New Cumberland Ambulance Services Critical 205 N Chester Street New Cumberland M L L L M H M L L M L
Hancock County Sheriff's Department Critical 104 N Court Street New Cumberland M L L L M L L L L M L
City of New Cumberland Police Department Critical 104 N Court Street New Cumberland M L L L M L L L L M L
West Virginia State Police Critical 32 County Highway 66/1 New Cumberland M L L L M M L L L M L Hancock County Critical 102 N Court New Cumberland M L L L M L L L L M L City of New Cumberland Critical 104 N Court Street New Cumberland M L L L M L L L L M L Hancock County Courthouse Critical 102 N Court New Cumberland M L L L M L L L L M L New Cumberland Post Office Special Consideration 504 Ridge Avenue New Cumberland M L L L M L M L L M L First National Bank - Graham Building Historical Consideration 100 N Chester Street New Cumberland M L L L M H M L L M L
Marshall House a.k.a. McNeil House Historical Consideration 1008 Ridge Avenue New Cumberland M L L L M L M L L M L
New Cumberland Church of the Nazarene Vulnerable Population 49 Nazarene Lane New Cumberland M L L L M L L L L M L
Hancock County Solid Waste Authority Critical 831 Gas Valley Road New Cumberland M L L L M L L L H M L
N C Sanitation Inc. Critical 292 Gas Valley Road New Cumberland M L L L M L L L H M L Hancock County PSD Critical Water 1530 N Chester Street New Cumberland M L L L M H M L H M L New Cumberland Water Tank (3) Critical Rolling Acres Road New Cumberland M L L L M L L L L M L
New Cumberland Waste Water Treatment Plant Critical Water South Chestnut Street New Cumberland M L L L M M L L L M L
New Cumberland Water Wells Critical Adams Street New Cumberland M L L L M H M L L M L

130
Region 11 Hazard Mitigation Plan
2.0 Risk Assessment
TABLE 2.29 NEW CUMBERLAND ASSETS Asset Vulnerability to Hazards (H, M, L)
Asset Name Category Address City Acts
of V
iole
nce
Dam
Fai
lure
Dro
ught
Earth
quak
e
Extre
me
Tem
pera
ture
s
Floo
d
Haz
mat
Mas
s M
ovem
ents
Rad
iolo
gica
l
Seve
re W
eath
er
Wild
fire
New Cumberland Vac Station Critical Adams Street New Cumberland M L L L M H M L L M L Fryers Auto Service Economic Asset 657 Ohio River Boulevard New Cumberland M L L L M H M L L M L Smith Oil Company Economic Asset 306 S Chester Street New Cumberland M L L L M H M L L M L

131
Region 11 Hazard Mitigation Plan
2.0 Risk Assessment
TABLE 2.30 WEIRTON ASSETS Asset Vulnerability to Hazards (H, M, L)
Asset Name Category Address City Acts
of V
iole
nce
Dam
Fai
lure
Dro
ught
Earth
quak
e
Extre
me
Tem
pera
ture
s
Floo
d
Haz
mat
Mas
s M
ovem
ents
Rad
iolo
gica
l
Seve
re W
eath
er
Wild
fire
The Wyngate Senior Living Community
Vulnerable Population 100 Wyngate Drive Weirton M L L L M L L L L M L
Weirton Madonna High School Vulnerable Population 150 Michael Way Weirton M L L L M L L L L M L Lauretta B Millsop Primary School
Vulnerable Population 1401 Legion road Weirton M L L L M L L L L M L
Weirton Medical Center Critical, Vulnerable Population 601 Colliers Way Weirton M L L L M L L L L M L Ball Metal Food and Household Products
Economic Asset 3010 Birch Drive Weirton M L L L M L L L L M L
Neo Industries Economic Asset 3025 Birch Drive Weirton M L L L M L H L L M L SAL Chemical Economic Asset 3036 Birch Drive Weirton M L L L M L H L L M L Feroleto Steel Company Economic Asset Half Moon Industrial Park Weirton M L L L M L L L L M L Walmart Economic Asset 400 Three Springs Drive Weirton M L L L M L L L L M L St. Nicholas Orthodox Church Vulnerable Population 608 Colliers Way Weirton M L L L M L L L L M L Mazzare Church Vulnerable Population 415 Old Colliers Way Weirton M L L L M L L L L M L Seventh Day Adventist Church Vulnerable Population 600 Colliers Way Weirton M L L L M L L L L M L Weirton Water Treatment Plant Critical 5000 Freedom Way Weirton M L L L M M L L L M L
Weirton Elementary School Vulnerable Population 3428 Pennsylvania Avenue
Weirton M L L L M L L L L M L
Weir Middle School Vulnerable Population 125 Sinclair Avenue Weirton M L L L M L L L L M L St. Paul School Vulnerable Population 140 Walnut Street Weirton M L L L M H L L L M L West Virginia Northern Community College
Vulnerable Population 150 Michael Way Weirton M L L L M L L L L M L
Weirton High School Vulnerable Population 100 Red Rider Road Weirton M L L L M L L L L M L Weirton Heights Elementary School
Vulnerable Population 160 S 12th Street Weirton M L L L M L L L L M L
Westbrook University Vulnerable Population 3185 Wylie Ridge Road Weirton M L L L M L L L L M L
Weirton Area Ambulance Critical 1305 Pennsylvania Avenue
Weirton M L L L M L L L L M L
Weirton Police Department Critical 200 Municipal Plaza Weirton M L L L M L L L L M L

132
Region 11 Hazard Mitigation Plan
2.0 Risk Assessment
TABLE 2.30 WEIRTON ASSETS Asset Vulnerability to Hazards (H, M, L)
Asset Name Category Address City Acts
of V
iole
nce
Dam
Fai
lure
Dro
ught
Earth
quak
e
Extre
me
Tem
pera
ture
s
Floo
d
Haz
mat
Mas
s M
ovem
ents
Rad
iolo
gica
l
Seve
re W
eath
er
Wild
fire
City of Weirton Critical 200 Municipal Plaza Weirton M L L L M L L L L M L US Army Reserve Training Center
Critical 199 Front Street Weirton M L L L M L L L L M L
Johnston-Truax House Historical Consideration 209 Seneca Street Weirton M L L L M L L L L M L Marland Heights Park and Mansion Weir Memorial Pool
Historical Consideration Williams Drive and Riverview Drive
Weirton M L L L M L L L L M L
People's Bank Historical Consideration 3383 Main Street Weirton M L L L M L M L L M L Dr. George Rigas House Historical Consideration 3412 West Street Weirton M L L L M L L L L M L MedExpress Urgent Care Critical, Vulnerable Population 218 Three Springs Drive Weirton M L L L M L L L L M L Arcelor Mittal Weirton Inc. Economic Asset 100 Pennsylvania Avenue Weirton M L L L M L H L L M L Weirton Steel Corporation Economic Asset 400 Three springs Drive Weirton M L L L M L L L L M L Mary H Weir Public Library Special Consideration 3442 Main Street Weirton M L L L M L M L L M L Voice of Pentecost Vulnerable Population 106 Mendenhall Street Weirton M L L L M M L L L M L Salvation Army Vulnerable Population 794 Cove Road Weirton M L L L M L L L L M L Sacred Heart of Mary Church Vulnerable Population 200 Preston Avenue Weirton M L L L M L L L L M L
Mercy Baptist Church Vulnerable Population 3474 Pennsylvania Avenue Weirton M L L L M L L L L M L
Christ United Methodist Vulnerable Population 3598 Pennsylvania Avenue Weirton M L L L M L L L L M L
Pleasant Valley Methodist Church Vulnerable Population 101 Lisa Court Weirton M L L L M H L L L M L
Kings Creek Union Chapel Vulnerable Population 2883 Kings Creek Road Weirton M L L L M H L L L M L Oakland Church Vulnerable Population 34 Swearingen Road Weirton M L L L M L L L L M L New Hope Baptist Church Vulnerable Population 2682 Wylie Ridge Road Weirton M L L L M L L L L M L Oakland United Presbyterian Vulnerable Population 253 Laurel Heights Weirton M L L L M L L L L M L St. Joseph The Worker Church Vulnerable Population 229 California Avenue Weirton M L L L M L L L L M L Weirton Water Tank Critical 3712 Wylie Ridge Road Weirton M L L L M L L L L M L Weirton Heights Water Tank Critical 125 E Belleview Drive Weirton M L L L M L L L L M L

133
Region 11 Hazard Mitigation Plan
2.0 Risk Assessment
TABLE 2.30 WEIRTON ASSETS Asset Vulnerability to Hazards (H, M, L)
Asset Name Category Address City Acts
of V
iole
nce
Dam
Fai
lure
Dro
ught
Earth
quak
e
Extre
me
Tem
pera
ture
s
Floo
d
Haz
mat
Mas
s M
ovem
ents
Rad
iolo
gica
l
Seve
re W
eath
er
Wild
fire
Sunoco Economic Asset 1228 Pennsylvania Ave Weirton M L L L M L M L L M L A&M Quick Market Corporation Economic Asset 201 S 11th Street Weirton M L L L M L M L L M L
Marathon Gas Economic Asset 2820 Pennsylvania Avenue
Weirton M L L L M L M L L M L
Sunoco Economic Asset 3009 Pennsylvania Avenue
Weirton M L L L M L M L L M L
Marathon Gas Economic Asset 3128 Pennsylvania Avenue
Weirton M L L L M L M L L M L
Sunoco Economic Asset 101 Three Springs Drive Weirton M L L L M L M L L M L Sheetz Economic Asset 239 Three springs Drive Weirton M L L L M L H L L M L Kroger Gas Station Economic Asset 100 St. Thomas Drive Weirton M L L L M L M L L M L
Marathon Gas Economic Asset 3700 Pennsylvania Avenue
Weirton M L L L M H M L L M L
BP Economic Asset 128 American Way Weirton M L L L M L H L L M L Weirton Main Gas Station Economic Asset 3775 Main Street Weirton M L L L M L M L L M L Marathon Gas Economic Asset 4139 Freedom Way Weirton M L L L M L M L L M L Weirton Madonna High School Vulnerable Population 150 Michael Way Weirton M L L L M L L L L M L St. Joseph The Worker School Vulnerable Population 151 Michael Way Weirton M L L L M L L L L M L

134
Region 11 Hazard Mitigation Plan
2.0 Risk Assessment
TABLE 2.31 WELLSBURG ASSETS Asset Vulnerability to Hazards (H, M, L)
Asset Name Category Address City Acts
of V
iole
nce
Dam
Fai
lure
Dro
ught
Earth
quak
e
Extre
me
Tem
pera
ture
s
Floo
d
Haz
mat
Mas
s M
ovem
ents
Rad
iolo
gica
l
Seve
re W
eath
er
Wild
fire
Wellsburg Primary School Vulnerable Population 1148 Main Street Wellsburg M L L L M H L L L M L Ann's Country Retreat Vulnerable Population 1439 Washington Pike Wellsburg M L L L M L M L L M L
Blue Ridge Manor Vulnerable Population 400 Blue Ridge Manor Drive
Wellsburg M L L L M H L L L M L
Brooke High School Vulnerable Population 29 Bruin Drive Wellsburg M L L L M H L L L M L Wellsburg Middle School Vulnerable Population 1447 Main Street Wellsburg M L L L M H L L L M L Franklin Primary School Vulnerable Population 1305 Washington Pike Wellsburg M L L L M L M L L M L Bethany Pike Volunteer Fire Department
Critical 32 Center Street Wellsburg M L L L M L L L L M L
Franklin Community Volunteer Fire Department
Critical 960 Washington Pike Wellsburg M L L L M L M L L M L
McKinleyville Volunteer Fire Department Critical 237 Cherry Street Wellsburg M L L L M H L L L M L
Wellsburg Volunteer Fire Department Critical 84 12th Street Wellsburg M L L L M H L L L M L
Brooke County EMS Critical 632 Main street Wellsburg M L L L M H L L L M L Brooke County Sheriff's Department Critical 632 Main Street Wellsburg M L L L M H L L L M L
Wellsbug Police Department Critical 70 7th Street Wellsburg M L L L M H L L L M L Brooke County Courthouse Critical 632 Main Street Wellsburg M L L L M H L L L M L City of Wellsburg Critical 70 Town Square Wellsburg M L L L M L L L L M L Beallmore a.k.a. Booher, William T. Jr., and June, House Historical Consideration 1500 Pleasant Avenue Wellsburg M L L L M L L L L M L
Brooke Cemetery Historical Consideration 2200 Pleasant Avenue Wellsburg M L L L M L L L L M L Danforth Brown House a.k.a. Old Worrell Farm
Historical Consideration 555 Washington Pike (US 27)
Wellsburg M L L L M L M L L M L
Gen. I. H. Duval Mansion Historical Consideration 1222 Pleasant Avenue Wellsburg M L L L M H L L L M L Elmhurst a.k.a. William Lynn and Carol House Historical Consideration 1606 Pleasant Avenue Wellsburg M L L L M L L L L M L

135
Region 11 Hazard Mitigation Plan
2.0 Risk Assessment
TABLE 2.31 WELLSBURG ASSETS Asset Vulnerability to Hazards (H, M, L)
Asset Name Category Address City Acts
of V
iole
nce
Dam
Fai
lure
Dro
ught
Earth
quak
e
Extre
me
Tem
pera
ture
s
Floo
d
Haz
mat
Mas
s M
ovem
ents
Rad
iolo
gica
l
Seve
re W
eath
er
Wild
fire
David Flemming and Lucy Tarr Mansion a.k.a. Oxtoby Mansion
Historical Consideration 2000 Pleasant Avenue Wellsburg M L L L M L L L L M L
Lewis Hall Mansion a.k.a. Charles Beall III and Sue House
Historical Consideration 1300 Pleasant Avenue Wellsburg M L L L M L L L L M L
Inn at Fowlerstown a.k.a. Drover's Inn Historical Consideration
1001 Washington Pike (WV 27) Wellsburg M L L L M L M L L M L
Kirker House a.k.a. Daniel Finell and Donna House
Historical Consideration 1520 Grand Avenue Wellsburg M L L L M L L L L M L
Miller's Tavern a.k.a. Brooke County Historical Museum Historical Consideration 724 Charles Street Wellsburg M L L L M H L L L M L
Nicholls House and Woolen Mill Site Historical Consideration 21 Hillview Drive Wellsburg M L L L M L L L L M L
Paull, Harry and Louisiana Beall Mansion a.k.a. Morningside
Historical Consideration 1312 Pleasant Avenue Wellsburg M L L L M L L L L M L
John C. Reeves House Historical Consideration 100 Reeves Drive Wellsburg M L L L M L L L L M L Lucy Tarr Mansion a.k.a. Highland Place
Historical Consideration 1456 Pleasant Avenue Wellsburg M L L L M L L L L M L
Vancroft (Aspen Manor) Historical Consideration 227 Brinker Road Wellsburg M L L L M L L L L M L Wellsburg Wharf Historical Consideration 132 5th Street Wellsburg M L L L M L L L L M L Eagle Manufacturing Company Economic Asset 2400 Charles street Wellsburg M L L L M H L L L M L Mazzella Welding and Fabrication
Economic Asset 3 Bethany Pike Wellsburg M L L L M H L L L M L
Brooke County Public Library Special Consideration 945 Main Street Wellsburg M L L L M H L L L M L Brooke Hills Park Special Consideration 140 Gist Lane Wellsburg M L L L M L L L L M L Apostolic Faith Assembly Church
Vulnerable Population 552 Main Street Wellsburg M L L L M H L L L M L
Brooke Hills Free Methodist Church
Vulnerable Population 1340 Washington Pike Wellsburg M L L L M L M L L M L

136
Region 11 Hazard Mitigation Plan
2.0 Risk Assessment
TABLE 2.31 WELLSBURG ASSETS Asset Vulnerability to Hazards (H, M, L)
Asset Name Category Address City Acts
of V
iole
nce
Dam
Fai
lure
Dro
ught
Earth
quak
e
Extre
me
Tem
pera
ture
s
Floo
d
Haz
mat
Mas
s M
ovem
ents
Rad
iolo
gica
l
Seve
re W
eath
er
Wild
fire
Franklin United Methodist Church
Vulnerable Population 3553 Washington Pike Wellsburg M L L L M L M L L M L
Christ Episcopal Church Vulnerable Population 1014 Main Street Wellsburg M L L L M H L L L M L Wellsburg Church of Christ Vulnerable Population 92 Rose Cottage Lane Wellsburg M L L L M L L L L M L Salvation Army Corps Vulnerable Population 401 Commerce Street Wellsburg M L L L M L M L L M L St. John the Evangelist Roman Catholic Church
Vulnerable Population 1300 Charles Street Wellsburg M L L L M H L L L M L
First Baptist Church of Wellsburg Vulnerable Population 1803 Charles Street Wellsburg M L L L M H L L L M L
Church of Christ of Latter-day Saints Vulnerable Population 84 26th Street Wellsburg M L L L M H L L L M L
Wellsburg Church of the Nazarene Vulnerable Population 835 Washington Pike Wellsburg M L L L M L M L L M L
First Presbyterian Church of Wellsburg Vulnerable Population 901 Charles Street Wellsburg M L L L M H L L L M L
Washington Pike Public Service District Critical 890 Washington Pike Wellsburg M L L L M L M L L M L
Brooke County Public Service District Critical 711 Charles Street Wellsburg M L L L M H L L L M L
Hammond Public Service District Critical 95 Elk's Road Wellsburg M L L L M L L L L M L
Kroger Fuel Center Economic Asset 91 27th Street Wellsburg M L L L M M M L L M L Marathon Gas Economic Asset 725 Commerce Street Wellsburg M L L L M H M L L M L Exxon Economic Asset 601 Commerce Street Wellsburg M L L L M H M L L M L Big D Oil Co, Economic Asset 16 3rd Street Wellsburg M L L L M H M L L M L Clark Gas Station Economic Asset 601 Commerce Street Wellsburg M L L L M H M L L M L Smith Oil Company Economic Asset WV 2 Wellsburg M L L L M L M L L M L

137
Region 11 Hazard Mitigation Plan
2.0 Risk Assessment
TABLE 2.32 WINDSOR HEIGHTS ASSETS Asset Vulnerability to Hazards (H, M, L)
Asset Name Category Address City Acts
of V
iole
nce
Dam
Fai
lure
Dro
ught
Earth
quak
e
Extre
me
Tem
pera
ture
s
Floo
d
Haz
mat
Mas
s M
ovem
ents
Rad
iolo
gica
l
Seve
re W
eath
er
Wild
fire
Windsor Heights Volunteer Fire Department
Critical 841 Main Street Windsor Heights M L L L L L L L M M L
Windsor Heights Post Office Special Consideration 728 Windy Hill Road Windsor Heights M L L L L L L L M M L Windsor Heights Church of God
Vulnerable Population 819 Main Street Windsor Heights M L L L L L L L M M L

138
Region 11 Hazard Mitigation Plan 2.0 Risk Assessment
2.4 ANALYZE DEVELOPMENT TRENDS
§201.6(c)(2)(ii)(C)
[The plan should describe vulnerability in terms of] providing a general discussion of land uses and development trends within the community so that mitigation options can be considered in future land use decisions.
In 1993, there were five economic development organizations in Region 11 that were
consolidated to form a single organization dedicated to creating jobs and encouraging
economic investment called the Business Development Corporation of the Northern
Panhandle (BDC). The BDC established Brooke and Hancock Counties as Certified
Development Communities. (Business Development Corporation, n.d.).
The profiles in Section 2.2 provide a background of risk and loss estimates based on
historical data, and are based in the past. Identifying and analyzing development trends
allows for the consideration of future vulnerability. This information comes in a variety of
sources, including economic trends, municipal comprehensive plans, and interviews with
local officials.
The 2014 Brooke County Comprehensive Plan identifies potential partners for
economic development and the need for preferred development areas. The plan describes
considerations that should be followed regarding where future development should and
should not occur. Making these land-use decisions helps the county avoid urban sprawl and
achieve a better layout of designated areas for business and industrial expansion.
Infrastructure development for present and future needs
Support of existing business or industry retention and expansion
Priority sites for continuing residential, commercial, and industrial expansion
Recruitment of desired, high growth businesses or industries (Brooke County
Planning Commission, 2014).
According to local officials, the City of Weirton is currently in the process of updating
its comprehensive plan; the last update was done in 2000.
There are a few instances of large development activities in Region 11 territory
presented below. Development of land may take years to complete when factors such as
purchasing the parcels, clearing and preparing the land (including demolition of old buildings
and clean-up of brownfields, etc.), selling the land to the new owner, getting investors
interested, and finally constructing new facilities or buildings suitable to the plan.

139
Region 11 Hazard Mitigation Plan 2.0 Risk Assessment
Rock Springs Business Park, Chester, WV
The former Taylor Smith and Taylor (TSST) pottery factory located in Chester along
the Ohio River is the new site of The Rock Springs Business Park designed to attract big
business and revitalize industry in the Ohio Valley.
The site was filled with abandoned, contaminated former industrial sites. The Taylor
factory sat empty and decaying for decades before BDC acquired it in 2012 coordinating
public, private, local, state and federal partners to navigate a path that led to demolition,
remediation and construction of the new industrial park. BDC first had to demolish and
remove the dilapidated remnants of the 80,000-square-foot factory, which was laced with
asbestos and lead. Then, the soil itself, which was also contaminated with toxic chemicals,
had to be trucked away. Finally, the river had to be dredged for pottery shards, since—for
decades—factory employees threw all the broken, lead-leaching pottery over the bank into
the river. Then construction began. (Li, Board, & Grant, 2017)
Efforts finally came to fruition in November 2015, when the BDC received a $2
million loan from the West Virginia Economic Development Authority for the construction of a
30,000-square-foot building. A second building, a mixed-use office complex, is planned for
the section closer to the river. Meanwhile, crews are cleaning up the lead contamination of
the riverbank above and below the Ohio River waterline.
Chester sought outside help with what to do with the rest of the riverfront for
development of recreation and tourism opportunities, and how to connect the Upper End to
the city’s central business district including a pedestrian/bicycle path. Riverlife received a
grant from the Pittsburgh-based Claude Worthington Benedum Foundation to replicate the
success it has had with Pittsburgh’s riverfronts with smaller communities in West Virginia
and Pennsylvania. Among other projects, Riverlife has been instrumental in the renovation
of Pittsburgh’s Point State Park and the development of North Shore Riverfront Park & Trail
and South Shore Riverfront Park (Huba, 2016).
Three Springs Business Park, Weirton, WV
In recent years, through presence at trade shows, the BDC and the State of West
Virginia have been marketing the area to companies throughout Europe and Asia. These
trade shows have focused on areas such as metals manufacturing, automotive industries,
metallurgical companies and brownfield redevelopment, bringing local representatives in
contact with business and government officials from around the globe. That is where contact

140
Region 11 Hazard Mitigation Plan 2.0 Risk Assessment
was first made with officials from
the Italian company Pietro
Fiorentini (Weirton Daily Times &
Herald-Star, 2015, p. 11), who
has recently located in Weirton.
Pietro Fiorentini is
expanding in the northern
panhandle in a move state
officials say will create 41 jobs in
phase one, and up to 150 when
fully operational, and more than
$9 million in capital investment.
The expansion takes place on
26.4 acres in the Three Springs
Business Park, owned by the
West Virginia Economic Development Authority (WVEDA). This was the fourth major
industrial project announced in the Three Springs Business Park in the past five years,
joining Rue21, Barney’s Bakery, and North American Industrial Services (Trade and Industry
Development, 2017).
Century Realty is currently leasing the properties located off of Rt. 22. A picture from
their promotional brochure is shown above.
Rover Pipeline, New Cumberland, WV
In 2017 the Federal Regulatory Commission approved licenses for the Rover
Pipeline. The project consists of nine supply laterals and three mainlines. Generally, the
supply laterals will transport gas from receipt points in the Marcellus and Utica shale supply
areas in West Virginia, Pennsylvania, and Ohio to various delivery points.
Approximately 51.8 miles of 36-inch diameter pipeline connecting at the
Burgettstown Compressor Station in Washington county, PA, extending to the Burgettstown
Tie-In and the interconnection with supply Connector lines in Carroll County, OH
(Burgettstown Lateral) (Federal Regulatory Commission, 2017). The supply lateral line is
planned to connect Washington County in Pennsylvania and Jefferson County in Ohio
through Hancock County roughly at the New Cumberland area as shown in the plan on the
following page.

141
Region 11 Hazard Mitigation Plan 2.0 Risk Assessment
Follansbee Steel, Follansbee, WV
The BDC purchased a property formerly belonging to Follansbee Steel for more
than $1.3 million and hired a company for the brownfield remediation assessment. The site
had been vacant for over four years. The mission of the BDC and Brooke and Hancock
County Commissions over the past five years has been to reclaim B.A.D. — brownfield,
abandoned and dilapidated — properties, develop them and put people back to work on
these properties. The development plan calls for selling parcels to two to three new
businesses, possibly in the energy, metals or transportation industries. The BDC and local
officials consider the property to be very valuable due to its easy access to the river, railway
and highway (Weirton Daily Times, 2016).
Just as in these cases, the Brooke and Hancock County Commissions as well as the
Business Development Corporation of the Northern Panhandle and the Brooke-Hancock-
Jefferson Metropolitan Planning Commission, have plans for many other properties that vary

142
Region 11 Hazard Mitigation Plan 2.0 Risk Assessment
in size and location throughout the region. During planning and development phases
officials and stakeholders should carefully consider the proposed land use and how they
may be vulnerable to different hazards detailed in previous sections of this plan.

143
Region 11 Hazard Mitigation Plan 3.0 Action Plan
3.0 ACTION PLAN
The action plan contains information on goals that the steering committee decided
upon and projects that the jurisdictions updated or created. This section explains in further
detail the process by which goals were established and how existing and new projects were
prioritized.

144
Region 11 Hazard Mitigation Plan 3.0 Action Plan
3.1 LOCAL HAZARD MITIGATION GOALS
The core planning committee determined several regional goals to mitigate the
hazard risks identified in the risk assessment. These mitigation actions were developed
based on projects thought to be most feasible and beneficial to hazard reduction.
Local mitigation priorities have changed since the previous hazard mitigation update
cycle. The committee has consolidated a number of hazards in the risk assessment section,
based on their similaities. The committee also chose to create a “Severe Weather” hazard
that encompasses all weather events. The committee recognized that there are few, if any,
structural mitigation actions that can be taken for severe weather events. The focus of
mitigation for these events has been shifted to public education/awareness and notification.
Based on the risk assessment of hazards in the region described in Section 2.0, the
committee members set new mitigation goals for the 2017 plan update. These may differ
from the ones set forth in the previous 2012 update of the plan because of the shift in
jurisdictions’ priorities and available resources.
3.1.1 Setting and Prioritizing Goals
Hazard mitigation goals were set and prioritized for the current plan update at the
second steering committee meeting on December 19, 2016. The six goals were determined
by consensus of the attendees after group-based discussion. Prioritization is based on the
following voting system: each member was given three different colored stickers: red,
indicating high priority; yellow, indicating medium priority; and green, indicating low priority.
The list of goals was written on a board and each member placed each of their stickers next
to the goal they determined to be of high, medium or low priority. Each sticker was given a
point value: 3 points for high priority, red; 2 points for medium priority, yellow; and 1 point for
low priority, green. The points were then added up and the results are displayed in the
following table.
The prioritization of these goals is for regional purposes (i.e. Brooke and Hancock
Counties); the projects under each goal for the various participating jurisdictions may not
line up with the goal prioritization due to the fact that every county and municipality has
different priorities within their own jurisdictional boundaries.
§201.6(c)(3)(i)
[The hazard mitigation strategy shall include a] description of mitigation goals to reduce or avoid long-term vulnerabilities to the identified hazards.
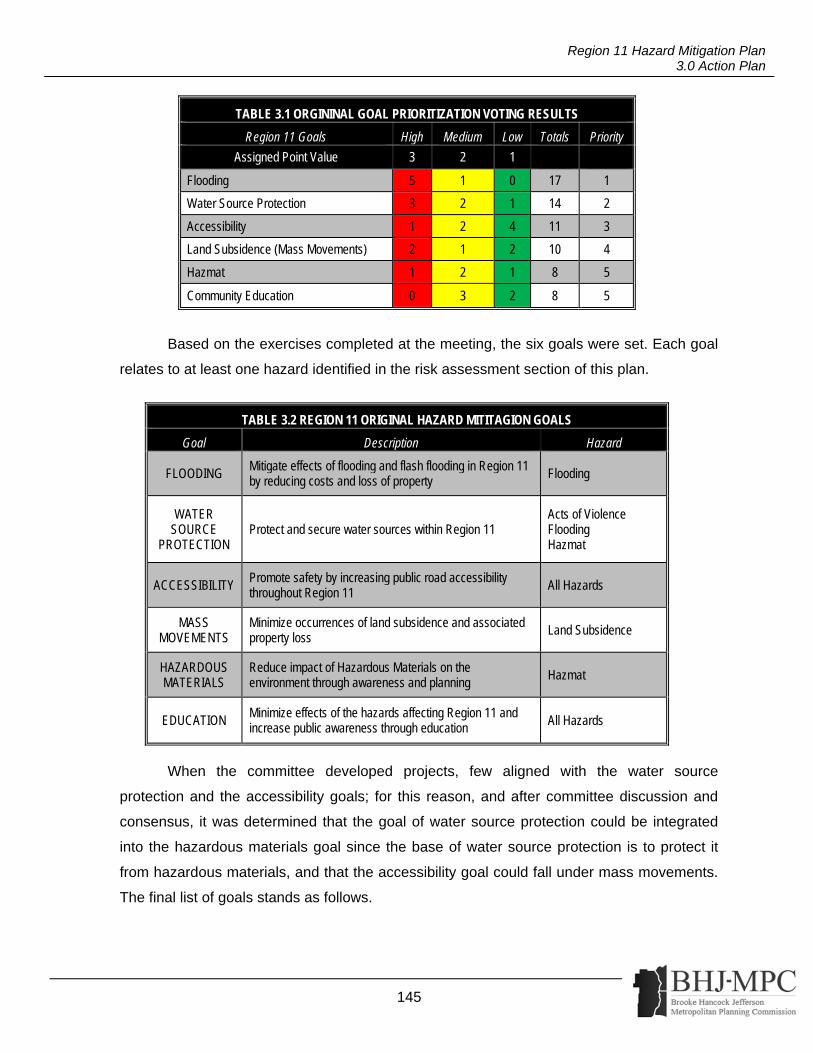
145
Region 11 Hazard Mitigation Plan 3.0 Action Plan
TABLE 3.1 ORGININAL GOAL PRIORITIZATION VOTING RESULTS
Region 11 Goals High Medium Low Totals Priority
Assigned Point Value 3 2 1
Flooding 5 1 0 17 1
Water Source Protection 3 2 1 14 2
Accessibility 1 2 4 11 3
Land Subsidence (Mass Movements) 2 1 2 10 4
Hazmat 1 2 1 8 5
Community Education 0 3 2 8 5
Based on the exercises completed at the meeting, the six goals were set. Each goal
relates to at least one hazard identified in the risk assessment section of this plan.
TABLE 3.2 REGION 11 ORIGINAL HAZARD MITITAGION GOALS
Goal Description Hazard
FLOODING Mitigate effects of flooding and flash flooding in Region 11 by reducing costs and loss of property Flooding
WATER SOURCE
PROTECTION Protect and secure water sources within Region 11
Acts of Violence Flooding Hazmat
ACCESSIBILITY Promote safety by increasing public road accessibility throughout Region 11 All Hazards
MASS MOVEMENTS
Minimize occurrences of land subsidence and associated property loss
Land Subsidence
HAZARDOUS MATERIALS
Reduce impact of Hazardous Materials on the environment through awareness and planning Hazmat
EDUCATION Minimize effects of the hazards affecting Region 11 and increase public awareness through education All Hazards
When the committee developed projects, few aligned with the water source
protection and the accessibility goals; for this reason, and after committee discussion and
consensus, it was determined that the goal of water source protection could be integrated
into the hazardous materials goal since the base of water source protection is to protect it
from hazardous materials, and that the accessibility goal could fall under mass movements.
The final list of goals stands as follows.

146
Region 11 Hazard Mitigation Plan 3.0 Action Plan
TABLE 3.3 REGION 11 FINAL HAZARD MITITAGION GOALS
Goal Description Hazard
FLOODING Mitigate effects of flooding and flash flooding in Region 11 by reducing costs and loss of property
Flooding
MASS MOVEMENTS
Minimize occurrences of land subsidence and associated property loss and promote road safety by increasing accessibility throughout Region 11
Land Subsidence
HAZARDOUS MATERIALS
Reduce impact of Hazardous Materials on the environment and in source water through awareness and planning
Hazmat
EDUCATION Minimize effects of the hazards affecting Region 11 and increase public awareness through education
All Hazards
Mitigation projects developed by the committee members from each jurisdiction will
align with these goals set forth by the committee.

147
Region 11 Hazard Mitigation Plan 3.0 Action Plan
3.2 PROJECT IMPLEMENTATION
§201.6(c)(3)(ii)
[The mitigation strategy shall include a] section that identifies and analyzes a comprehensive range of specific mitigation actions and projects being considered to reduce the effects of each hazard, with particular emphasis on new and existing buildings and infrastructure.
§201.6(c)(3)(iii)
[The mitigation strategy section shall include] an action plan describing how the actions identified in section (c)(3)(ii) will be prioritized, implemented, and administered by the local jurisdiction. Prioritization shall include a special emphasis on the extent to which benefits are maximized according to a cost benefit review of the proposed projects and their associated costs.
This portion of the plan builds on the goals presented in Section 3.1. Each project
below is listed with a timeframe, primary coordinator, support agencies, potential funding
source (and cost estimate), and its current status. It is important to note that the cost
estimates are tentative and meant as a starting point for research on project feasibility. More
specifically, these cost estimates are only ranges of probable project costs; all figures are
approximations. At the time the implementation of any strategy is considered, a full cost
estimate should be sought prior to securing funding. Possible funding sources identified
include:
Community Development Block Grant (CDBG)
Flood Mitigation Assistance Grant
Hazard Mitigation Grant Program (HMGP)
Increased Cost of Compliance
In-Kind Work (Work or Labor)
Local Funds
Pre-Disaster Mitigation Grant (PDM)
Repetitive Flood Claims Program
Severe Repetitive Loss Grant
State Funds
Other (includes N/A)
The benefit-cost review was emphasized in the prioritization process. Mitigation
actions were evaluated by their pros and cons, which are represented as costs and benefits.

148
Region 11 Hazard Mitigation Plan 3.0 Action Plan
Project prioritization occurred during the third committee meeting utilizing the project
prioritization matrix. An example of this matrix can be found in Appendix 1. Committee
members were asked to rate each project on six criteria using a one to five scale where five
is best. The criteria used are:
Ease of Implementation
Cost Effectiveness
Social Impacts
Political Impacts
Economic Impacts
Overall Positive Impact
The highest score that a proposed project could attain would be a 30 and the lowest
would be a six. The project prioritization instructions used to calculate the results can be
found in Appendix 1. The prioritized project list is shown in the table below. A list of projects
that were deleted by the committee and of projects that have been completed within the
planning cycle can be found in Appendix 4.
Letters assigned to each jurisdiction will indicate the project number that corresponds
to that jurisdiction. For example, project F3 would represent the third project for Chester, as
shown below:
A. Region 11
B. Brooke County
C. Hancock County
D. Beech Bottom
E. Bethany
F. Chester
G. Follansbee
H. New Cumberland
I. Weirton
J. Wellsburg
K. Windsor Heights

149
Region 11 Hazard Mitigation Plan Project Implementation
TABLE 3.4 REGION 11 PROJECTS
Goal Project # Projects Priority Time Frame Status Cost Estimate Funding Source
Coordinating Agency
Support Agencies
FLO
OD
ING
A1
Engage each municipality within Region 11 to continue to support NFIP "discount on insurance" support Community Rating System (2012 Project 1.1.1) (Revised)
2 Review every 2
years Ongoing N/A N/A
County Floodplain Coordinators
Municipal Floodplain Coordinators
A2
Continue to participate in acquisition / demolition, relocation, mitigation reconstruction, and elevation. (2012 Project 1.1.3).
8 10 years Ongoing Approx. $84,450 per purchased
structure HMGP Local Floodplain
Coordinators
Local government WV DHSEM FEMA
A3
Create a Repetitive Loss (RL) database from the ongoing collection of information of properties to aid in municipal flooding project implementation and refining of a strategy to address RL areas. (2012 Project 1.1.4).
9 3 years Ongoing N/A N/A Local Floodplain Coordinators
WVDHSEM
MAS
S M
OVE
MEN
TS
A4 Work with WVDOT and each municipality for accessibility issues.
3 Ongoing as
funding becomes available
New Varies according to project
Federal and state
transportation money.
BHJ WVDOT, federal highways, each municipality
HAZ
MAT
A5
Identify specific brownfield locations for clean-up due to contamination at formal industrial sites. Do assessments of sites. (2012 Project 3.1.1).
1 3 years Ongoing Up to $1,000,000 per site
EPA brownfields
assessments grant
Business development Corporation
BHJ, WVDEP, Jefferson County port authority,
A6 Partner with municipalities to identify potential water source protection issues and support project development.
4 Ongoing New Varies according to entity
Bureau of Health
BHJ Each municipality
A7
Form a preparedness “task force” with officials from industries such as oil and natural gas exploration to determine actual risks, share findings and facts, etc. (2012 Project 2.1.3).
5 Ongoing Ongoing Unknown Unknown Unknown Facilities

150
Region 11 Hazard Mitigation Plan Project Implementation
TABLE 3.4 REGION 11 PROJECTS
Goal Project # Projects Priority Time Frame Status Cost Estimate Funding Source
Coordinating Agency
Support Agencies
EDU
CAT
ION
A8
Support each municipality in their efforts for training and education of local government officials regarding the NFIP. (2012 Project 1.1.2).
7 Every 2 years Ongoing
Up to $2,500 per outreach effort
for the creation of materials, renting
training space, etc.
PDM Local funding
Local Floodplain Coordinators BHJ
A9
Partner with agencies throughout the region in support of mitigation and preparedness measures, to include but not be limited to the NextGen project, continued maintenance of this plan, etc. (2012 Project 2.1.2).
6 Ongoing Ongoing N/A N/A
County Emergency Managers Jurisdictional Officials
Brooke-Hancock-Jefferson Metropolitan Planning Commission (BHJ) Weirton Area Port Authority

151
Region 11 Hazard Mitigation Plan Project Implementation
TABLE 3.5 BROOKE COUNTY PROJECTS
Goal Project # Projects Priority Time Frame Status Cost Estimate Funding Source
Coordinating Agency
Support Agencies
FLO
OD
ING
B1
Create and maintain a database of frequently flooded roadways and share the information with WVDOH used to develop mitigation strategies for flooding and accessibility. (Revised) (2012 Project 9C.2.1).
8 Annually Ongoing N/A N/A BCEMA
Brooke county Floodplain Coordinator WVDOH
B2
Collect pertinent data and maps on flooding for annual distribution to appropriate units of local government. (2012 Project 10C.1.4).
15 Annually Ongoing Up to $25,000 if
consultant is used
EMPG SHSP HMEP
Local Funding
BCEMA
Brooke County LEPC Brooke County Planning Commission
B3
Ensure all lifeline agencies or departments have a comprehensive understanding of flood hazard risks and are coordinating efforts with other flood mitigation activities. (2012 Project 10C.2.1).
9 Annually Ongoing N/A N/A Brooke County Floodplain Coordinator
BCEMA
B4
Continue to participate in acquisition / demolition, relocation, mitigation reconstruction, and elevation. (2012 Project 10C.1.3).
10 Unknown Ongoing Unknown Unknown Brooke County All Municipalities County Commission
MAS
S M
OVE
MEN
TS
No county projects were identified for this goal; see regional and municipal projects.
HAZ
MAT
B5
Contact commercial rail lines to ensure that measures are being taken to address hazard risks. (2012 Project 9C.2.2).
12 Every 6 months Ongoing N/A N/A Brooke County LEPC
BCEMA
B6
Identify strategies to mitigate risks from the transportation and/or storage of hazardous materials in Brooke County in the Hazmat Plan. (2012 Project 9C.3.1).
3 Every 6 months Ongoing
Included in cost of LEPC primary
mission
HMEP SERC
Local Funding
Brooke County LEPC
BCEMA

152
Region 11 Hazard Mitigation Plan Project Implementation
TABLE 3.5 BROOKE COUNTY PROJECTS
Goal Project # Projects Priority Time Frame Status Cost Estimate Funding Source
Coordinating Agency
Support Agencies
B7 Review the extent of damage of fall-out areas that would be affected by hazmat incidents. (2012 Project 9C.6.1).
5 Annually Ongoing N/A N/A BCEMA
Beaver Valley NPS Hancock County OEM WVDHSEM
EDU
CAT
ION
B8
Utilize the media for the distribution and publication of hazard information to encourage participation by including public notices in newspapers and involve the mass media of the area as well as hold a series of public meetings yearly, after every annual evaluation from the planning committee. (2012 Consolidated Projects 5C.1.3, 4C.2.1, 4C.3).
1 As needed Ongoing N/A N/A BCEMA BCLEPC
B9
Conduct annual tabletop disaster exercises with local law enforcement, emergency managers, city and county officials, and other disaster response agencies. (2012 Project 5C.4.3).
2 Annually Ongoing Up to $5,000 per
exercise
SHSP EMPG HMEP
Local Funding
BCEMA Local emergency services agencies
B10
Provide information about local, regional, state, and federal training opportunities to fire departments, Emergency Medical Services (EMS), ambulance services, and other emergency responders. (5C.4.4).
5 As information is
available Ongoing N/A N/A BCEMA N/A
B11
Secure additional training and education for local land use planners, zoning administrators, and related officials for proper floodplain management techniques, NFIP requirements, and other flood prevention activities. (2012 Consolidated Projects 6C.1.2, 6C.2.1).
3 Ongoing Ongoing Unknown N/A BC Floodplain Coordinator
Municipal floodplain coordinators WVDHSEM FEMA

153
Region 11 Hazard Mitigation Plan Project Implementation
TABLE 3.5 BROOKE COUNTY PROJECTS
Goal Project # Projects Priority Time Frame Status Cost Estimate Funding Source
Coordinating Agency
Support Agencies
B12
Encourage all local governments to adopt and enforce building codes and other regulations which require new construction activities to conform to applicable snow load specifications. (2012 Project 6C.3.1)
12 Ongoing Ongoing N/A N/A BC Planning Commission
N/A
B13
Conduct drills, exercises, and other training events to ensure that the county's emergency response forces are properly trained for hazard events. (2012 Project 7C.3.1)
5 Twice a year Ongoing Up to $10,000 per exercise
SHSP EMPG HMEP
Local Funding
BCEMA Local emergency services agencies BCLEPC
B14
Maintain meetings with local critical facilities to ensure they develop and maintain response plans for all hazards that are compatible with the county's EOP. (2012 Project 9C.4.1)
10 Every 6 months Ongoing Included in cost of LEPC primary
mission
HMEP SERC
Local Funding
BCLEPC BCEMA Facility representatives
B15
Develop a public outreach all-hazards program to reach residents, students, NGOs and tourists in Brooke County using methods such as holding town hall meetings, distributing information, creating pamphlets, integrating education into school curriculum and participating in community events. (2012 Consolidated projects 5C.1.1, 5C.1.2, 5C.1.4, 5C.1.6, 5C.1.7).
12 As needed Ongoing Up to $2,500 for the creation of
materials
PDM EMPG SHSP
Local Funding
BCEMA
Ohio Valley Business Convention and Visitors Bureau BCLEPC WV Community College BC Board of Education

154
Region 11 Hazard Mitigation Plan Project Implementation
TABLE 3.6 HANCOCK COUNTY PROJECTS
Goal Project # Projects Priority Time Frame Status Cost Estimate Funding Source Coordinating Agency Support Agencies
FLO
OD
ING
C1 Determine if citizens are eligible for flood insurance and ensure participation. (2012 Project 3F.1.2).
1 Ongoing Ongoing N/A N/A Hancock County Floodplain Coordinator
N/A
C2
Continue to participate in acquisition / demolition, relocation, mitigation reconstruction, and elevation. (2012 Project 3F.2.4).
5 As funding becomes available
Ongoing Up to $84,700 per property
HMPG Hancock County Floodplain Coordinator
Hancock County Commission Hancock County OEM
MAS
S M
OVE
MEN
TS
No county projects were identified for this goal; see regional and municipal projects.
HAZ
MAT
C3 Update the Hancock County Hazmat plan. 4 1 year New $5,000 HMEP Hancock County OEM
LEPC County Emergency Response Agencies
EDU
CAT
ION
C4 Include Storm Ready in public outreach campaigns. Identify funding sources and cost.
2 3 years New Unknown Unknown Hancock County OEM
LEPC County Commission
C5 Update shelter location database and educate public through mailers. (2012 Project 5F.1.1) (Revised).
2 1 year Ongoing N/A N/A Hancock County OEM
N/A

155
Region 11 Hazard Mitigation Plan Project Implementation
TABLE 3.7 BEECH BOTTOM PROJECTS
Goal Project # Project Priority Project Time
Frame Status Cost Estimate Funding Source
Coordinating Agency
Support Agencies
FLO
OD
ING
D1 Replace and/or upgrade the current storm sewer pipe that traverses the village.
5 As funding becomes available
New 500,000 Not identified Village of Beech
Bottom
WVDOH DEP BHJ
D2 Continue to participate in acquisition / demolition, relocation, mitigation reconstruction, and elevation.
6 5 years New N/A N/A Village of Beech
Bottom Floodplain Manager
MAS
S M
OVE
MEN
TS
D3 Implement Phase II of the sidewalk replacement project at the Hill Street and 4th street location.
1 2 years New 180K total,
village needs to pay 20%
Transportation Enhancement
Grants
Village of Beech Bottom N/A
HAZ
MAT
D4 Update and maintain emergency contacts for hazardous materials facilities in the area.
2 1 year New None None Village of Beech Bottom
Brooke County EMA
EDU
CAT
ION
D5 Integrate hazard awareness training into current school programs to educate students.
2 2 years New None None Village of Beech Bottom
Brooke County EMA Brooke County Department of
Education
D6 Create a social media page to feed information to the public about events and alerts in the community.
2 1 year New None None Village of Beech Bottom
N/A

156
Region 11 Hazard Mitigation Plan Project Implementation
TABLE 3.8 BETHANY PROJECTS
Goal Project # Projects Priority Project Time
Frame Status Cost Estimate Funding Source
Coordinating Agency
Support Agencies
FLO
OD
ING
E1 Identify possibilities of addressing flooding near the community center and Bethany College baseball field.
2 5 years New Unknown Unknown Town of Bethany Unknown
E2 Continue to participate in acquisition / demolition, relocation, mitigation reconstruction, and elevation.
3 5 years New N/A N/A Town of Bethany Floodplain Manager
MAS
S M
OVE
MEN
TS
No municipal projects were identified for this goal; see other municipal projects.
HAZ
MAT
No municipal projects were identified for this goal; see other municipal projects.
EDU
CAT
ION
E3
Identify and implement a public notification system that sends information regarding emergencies at the schools and weather, security, and health related hazards within the municipality.
1 5 years New Unknown Unknown Town of Bethany Unknown

157
Region 11 Hazard Mitigation Plan Project Implementation
TABLE 3.9 CHESTER PROJECTS
Goal Project # Projects (Original Description) Priority Project Time
Frame Status Cost Estimate Funding Source
Coordinating Agency
Support Agencies
FLO
OD
ING
F1 Determine if citizens are eligible for flood insurance and ensure participation. (2012 Project 1D.1.1).
4 4 years Ongoing N/A N/A Chester Floodplain Coordinator
Hancock County Floodplain Coordinator
F2
Continue to participate in acquisition / demolition, relocation, mitigation reconstruction, and elevation. (2012 Project 1D.1.2).
3 5 years Ongoing N/A N/A Chester City Council
Hancock County Floodplain Coordinator
F3 Clean and remove debris from Meadow Run Creek that causes flooding. 1 3 years New 25k
State Grants Federal Funds
Hancock County OEM Unknown
F4 Repair and maintain sewage pump stations that back-up due to heavy rains.
2 1 year New Unknown Unknown City of Chester Unknown
MAS
S M
OVE
MEN
TS
No municipal projects were identified for this goal; see other municipal projects.
HAZ
MAT
No municipal projects were identified for this goal; see other municipal projects.
EDU
CAT
ION
No municipal projects were identified for this goal; see other municipal projects.

158
Region 11 Hazard Mitigation Plan Project Implementation
TABLE 3.10 FOLLANSBEE PROJECTS
Goal Project # Projects Priority Project Time
Frame Status Cost Estimate Funding Source
Coordinating Agency
Support Agencies
FLO
OD
ING
G1
Reduce flooding in downtown Follansbee by cleaning out the sediment pond and removing trees and brush from Allegheny Creek. Reconstruct sanitary sewer line and repair and replace collapsed gabion wall.
1 2 years New $495,408 Need to identify funding source City of Follansbee
DNR, Soil conservation, Division of Agriculture, WVDOH
G2
Continue to participate in acquisition / demolition, relocation, mitigation reconstruction, and elevation of previously identified residences.
2 6 months New Minimal N/A City of Follansbee
G3 Replace box culvert under Route 2 at the intersection of Main Street and Allegheny Street.
7 2 years New N/A WVDOH WVDOH City of Follansbee
G4
Replace four catch basins at the intersection of Raymond and Virginia with larger catch basins and replace existing 12” inlet pipe with a 60” pipe.
2 years New N/A HMGP WVDOH City of Follansbee
G5 Separate sanitary and storm water piping at Broad street to State and Ducane to State. and Raymond Street to Mill Alley
3 5 years New N/A
Infrastructure Jobs
Development council, ARC.
BHJ City of Follansbee
G6
Identify different cost effective options for acquiring and demolishing and rebuilding the firehouse in a different location and addressing the wall collapse into Alleghany Creek.
3 1 year New Minimal HMGP City of Follansbee BHJ
MAS
S M
OVE
MEN
TS
G7 Identify different cost effective solutions to fixing land subsidence at City Park which affects Parkview subdivision.
7 1 year New N/A N/A City of Follansbee BHJ

159
Region 11 Hazard Mitigation Plan Project Implementation
TABLE 3.10 FOLLANSBEE PROJECTS
Goal Project # Projects Priority Project Time
Frame Status Cost Estimate Funding Source
Coordinating Agency
Support Agencies
HAZ
MAT
No municipal projects were identified for this goal; see other municipal projects.
EDU
CAT
ION
G8 Create a website and social media page to feed information to the public about events and alerts in the community.
3 6 months New Minimal. Less than $3000
City General Fund
City of Follansbee N/A

160
Region 11 Hazard Mitigation Plan Project Implementation
TABLE 3.11 NEW CUMBERLAND PROJECTS
Goal Project # Projects Priority Project Time
Frame Status Cost Estimate Funding Source
Coordinating Agency
Support Agencies
FLO
OD
ING
H1
Continue to participate in acquisition / demolition, relocation, mitigation reconstruction, and elevation. (2012 Project 1G.2.1).
4 As funding becomes available
Ongoing Up to $84,700 per property HMPG
New Cumberland Floodplain Coordinator
New Cumberland Municipal Council
H2
Identify the location for relocation of fire and EMS services outside of the floodplain zone. (2012 Project 1G.2.2) (Revised).
3 5 years Ongoing Minimal N/A Hancock County OEM
City of New Cumberland Floodplain Coordinator New Cumberland Municipal Council
MAS
S M
OVE
MEN
TS
No municipal projects were identified for this goal; see other municipal projects.
HAZ
MAT
No municipal projects were identified for this goal; see other municipal projects.
EDU
CAT
ION
H3
Identify partners for implementation of public education and awareness about availability and cost of flood insurance for their homes.
2 2 years New Minimal In-kind
donations City of New Cumberland
Insurance Companies NFIP
H4 Create a social media page to feed information to the public about events and alerts in the community.
1 2 years New N/A N/A City of New Cumberland
Hancock County OEM

161
Region 11 Hazard Mitigation Plan Project Implementation
TABLE 3.12 WEIRTON PROJECTS
Goal Project # Projects Priority Project Time
Frame Status Cost Estimate Funding Source
Coordinating Agency
Support Agencies
FLO
OD
ING
I1
Continue to participate in acquisition / demolition, relocation, mitigation reconstruction, and elevation. (2012 Project 4H.1.4).
3 1-2 years Ongoing N/A N/A City of Weirton Planning Department
I2
Establish zoning districts and land use regulations that will allow only appropriate activities and uses in the village's floodplain and flood prone areas. (2012 Project 3H.2.1).
4 6 months - 1 year Ongoing $45-50K City Budget City of Weirton N/A
MAS
S M
OVE
MEN
TS
I3
Work with the West Virginia Division of Highways (WVDOH) to identify areas of frequent roadway flooding and develop mitigation strategies. (2012 Project 5H.1.1).
6 Ongoing Ongoing N/A N/A City of Weirton DOH
HAZ
MAT
No municipal projects were identified for this goal; see other municipal projects.
EDU
CAT
ION
I4
Review all existing regulations, capital improvements, and comprehensive plans to ensure that infrastructure improvements are not directed towards hazardous areas. (2012 Consolidated Projects 3H.1.1, 3H.1.2, 3H.1.3, 3H.2.2) (Revised).
5 As needed Ongoing N/A N/A Weirton Water Board
City of Weirton
I5
Establish a Community Emergency Response Team (CERT to increase the number of trained citizen emergency responders. (2012 Projects 2H.3.1, 2H.3.2).
7 1-3 years Ongoing N/A N/A Weirton Fire City of Weirton

162
Region 11 Hazard Mitigation Plan Project Implementation
TABLE 3.12 WEIRTON PROJECTS
Goal Project # Projects Priority Project Time
Frame Status Cost Estimate Funding Source
Coordinating Agency
Support Agencies
I6 Create a social media page to feed information to the public about events and alerts in the community.
1 Within 6 months New N/A N/A City of Weirton N/A
I7
Develop an all-hazard information system in the Mayor's Office to provide public information on disasters to citizens. (2012 Project 2H.1.1).
1 Within 6 months New N/A N/A City of Weirton N/A

163
Region 11 Hazard Mitigation Plan Project Implementation
TABLE 3.13 WELLSBURG PROJECTS
Goal Project # Projects Priority Project Time
Frame Status Cost Estimate Funding Source
Coordinating Agency
Support Agencies
FLO
OD
ING
J1
Continue to address storm water flooding caused by 14 tributaries in the area by working with an engineering firm on a 6 phase project.
3 1 year New Unknown WVDEP
Storm Water Management
City of Wellsburg Water and Sewer Department
N/A
J2 Identify measures to reduce and control the floodplain
5 10 years New Unknown Unknown City of Wellsburg N/A
J3 Continue to participate in acquisition / demolition, relocation, mitigation reconstruction, and elevation.
6 5 years New N/A N/A City of Wellsburg Floodplain Manager
MAS
S M
OVE
MEN
T
No municipal projects were identified for this goal; see other municipal projects.
HAZ
MAT
No municipal projects were identified for this goal; see other municipal projects.
EDU
CAT
ION
J4 Increase the number of trained citizen emergency responders. (2012 Project 2I.3.2).
4 Ongoing Ongoing Unknown USDHS BCEMA Wellsburg Municipal Council
J5 Educate the public on storm water management through postings on the city website, town hall meetings, etc.
2 2 years New Unknown Storm water Management
Plan City of Wellsburg
J6 Create a social media page to feed information to the public about events and hazard alerts in the community.
1 1 year New N/A N/A City of Wellsburg Brooke County EMA

164
Region 11 Hazard Mitigation Plan Project Implementation
TABLE 3.14 WINDSOR HEIGHTS PROJECTS
Goal Project # Projects Priority Project Time
Frame Status Cost Estimate Funding Source
Coordinating Agency
Support Agencies
FLO
OD
ING
K1 Continue to participate in acquisition / demolition, relocation, mitigation reconstruction, and elevation.
5 5 years New N/A N/A Windsor Heights Floodplain Manager
K2 Consider participation in the National Flood Insurance Program at the municipal level
4 5 years Ongoing N/A N/A Windsor Heights Floodplain Manager
MAS
S M
OVE
MEN
TS
K3 Repair roadway damage due to land subsidence to ensure continued accessibility to the town.
3 5 Years New Unknown State or federal Windsor Heights DOT
K4 Consider upgrades such as widening roads to allow better access by large emergency vehicles
2 5 Years New Unknown State or federal Windsor Heights DOT
HAZ
MAT
No municipal projects were identified for this goal; see other municipal projects.
EDU
CAT
ION
K5
Create a website and social media page to feed information to the public about events and alerts in the community. Provide public information on disasters to citizens (2012 Project 2J.1.1, Revised)
1 1 Year New None N/A Windsor Heights N/A

165
Region 11 Hazard Mitigation Plan 4.0 Plan Maintenance
4.0 PLAN MAINTENANCE PROCESS
§201.6(c)(4)(i)
[The plan maintenance process shall include a] section describing the method and schedule of monitoring, evaluating, and updating the mitigation plan within a five-year cycle.
§201.6(c)(4)(ii)
[The plan shall include a] process by which local governments incorporate the requirements of the mitigation plan into other planning mechanisms such as comprehensive or capital improvement plans, when appropriate.
§201.6(c)(4)(iii)
[The plan maintenance process shall include a] discussion on how the community will continue public participation in the plan maintenance process.
4.1 Monitoring, Evaluating, and Updating the Plan
The Brooke-Hancock-Jefferson Metropolitan Planning Commission (BHJ) and the
steering committee have established a method for the systematic and periodic review of this
document. BHJ, as the custodial agency, assumes responsibility for scheduling committee
meetings and also serves as the point of contact for the committee and WVDHSEM during
the 5-year period.
The formal updating process will consist of a series of meetings to review mitigation
projects, the risk assessment, and to compare the two. Region 11 will convene the steering
committee annually (for a total of three meetings between formal updating processes).
BHJ feels it is most beneficial to link the annual mitigation review with other recurring
planning efforts. The council must also update its comprehensive economic development
strategy (CEDS) document annually. As such, BHJ will ensure completion of the CEDS and
mitigation annual reviews simultaneously. The CEDS meetings are scheduled quarterly and
hazard mitigation plan updates will be added to the meeting agenda every summer quarter.
Topics for discussion at annual meetings include determining the effectiveness of
any implemented mitigation strategies as well as evaluating the on-going performance of the
plan based on several criteria. Within the risk assessment, the committee will evaluate how
accurately the hazard profile and development trends sections predicted impact areas and
losses (contingent on hazard occurrences).
YEAR 5
Formal revision
meetings
YEAR 4
Annual committee meeting 3
YEAR 3
Annual committee meeting 2
YEAR 2
Annual committee meeting 1
YEAR 1
Approval & adoption

166
Region 11 Hazard Mitigation Plan 4.0 Plan Maintenance
Additionally, the steering committee will update one another on any completed or
underway mitigation projects. Each project listed in this plan includes resources that may aid
in implementation; such resources may include potential funding sources. Many of these
funding sources require stringent project administration tasks (including performance
measures and close-out procedures), all of which would be followed by the jurisdiction
implementing a project. Adherence to these requirements will ensure the successful
implementation of projects funded by such programs. For projects funded locally, existing
purchasing policies will be followed, including competitive bidding, maintenance of invoice
copies, regular departmental budget reviews, etc. All files associated with purchasing at the
local level are maintained. This procedure has been successful while implementing
mitigation projects since the original development of this plan and will continue to be
followed.
The committee will evaluate the performance of the plan based on several criteria.
For instance, the committee should consider revising mitigation strategies if it appears that
the plan is failing according to one of the following measures.
Cost Effectiveness: Is sufficient funding available to implement the project at a cost
manageable by the local government? If not, is funding available? Will the costs of
implementing the project be significantly less than the cumulative future costs
potentially incurred by an un-corrected situation?
Property Protection: How significant will the action be at eliminating or reducing
damage to structures and infrastructure?
Life Safety: How effectively will the action protect lives and prevent injuries?
Environmental Impacts: Will implementing the project adversely affect the
environment in any way? Will implementing the project actually benefit the
environment?
Social Impacts: Will the public perceive the project as positively lessening hazard-
related losses? Will implementing the project adversely affect any segment of the
population?
Legal Impacts: Do your governmental organizations and/or partner agencies have
the authority to implement the actions?
Political Impacts: Will implementing the project create negative political issues?
Overall Feasibility: Do local policies and capabilities currently allow for the
implementation of the project? Are programs available to assist in funding the

167
Region 11 Hazard Mitigation Plan 4.0 Plan Maintenance
implementation of the project? Do local leaders generally agree that implementing
the project will be beneficial to the community?
4.2 Planning Addendums
Addendums to this plan may become necessary during its life cycle as programs and
priorities change. Addendums that are requested and approved at the local level may be
passed through the Brooke-Hancock-Jefferson Metropolitan Planning Commission (BHJ) to
the West Virginia Division of Homeland Security and Emergency Management
(WVDHSEM) and to FEMA Region 11.
4.3 Implementation through Existing Programs / Capabilities Assessment
The members of the committee are leaders within the communities and agencies
that they represent. They are often involved in the overall community, economic
development, and capital improvements planning efforts of their jurisdictions. As members of
the mitigation planning team, these individuals will carry mitigation concepts into other
planning areas.
To date, local policies have not hindered hazard mitigation efforts. The jurisdictions
participating in this planning process have used a variety of funding to complete mitigation
projects in the past, including the Hazard Mitigation Grant Program, Homeland Security
Grant Program, Emergency Management Performance Grant, Community Development
Block Grant, and local funding. Local government policies and programs have supported the
use of this funding and, thus, the implementation of mitigation projects. Further, all
participating government jurisdictions have demonstrated a capability to successfully
implement and administer mitigation projects.
Opportunities for hazard mitigation plan integration with other plans and ordinances
within Region 11 can include the plans outlined in Table 4.1. The method or opportunity for
each type of plan’s integration with the hazard mitigation plan is described in the second
column.

168
Region 11 Hazard Mitigation Plan 4.0 Plan Maintenance
TABLE 4.1 OTHER PLAN INTEGRATION WITH HAZARD MITIGATION Plan Integration with HMP
Comprehensive Plans Hazard mapping comparison with maps of targeted development areas
Hazard profiles inform risks at development areas Plan development outside high risk hazard areas and
redirect to low hazard areas Support mitigation strategies for assets and events
Emergency Operations Plans Identify and plan for operations in hazard areas Hazard mapping informs high risk areas
Transportation Planning Identification of high risk hazard areas that affect transportation
Encourage sustainable and resilient construction Floodplain Management Identification of floodplains and at-risk buildings
Directing development to non-flood hazard areas Encouraging protection of green spaces Minimize impacts of flooding from rivers and streams
Infrastructure Development Plans Guide development away from hazard areas Improve infrastructure affected by hazards Encourage sustainable and resilient construction
Commercial and Economic Development Identify suitable development or redevelopment areas Encourage responsible land use according to area
hazards Storm Water Management Identify hazards relating to storm water management
Minimize impacts of flooding due to storm water
4.4 Continued Public Involvement
The Region 11 committee understands that the general public must be involved in
the initial planning process, as well as the updates to the completed plan. As such, BJH and
the committee will invite the public to participate as the plan is updated through a variety of
formats including:
commission and other pre-planned public meetings,
social media update posts,
jurisdictions’ websites,
CEDS,
schools education and mailings, and
online surveys.
Further, as the updated plan is adopted, the public will be given the chance to
comment on the updated plan prior to its adoption by passage resolution or ordinance.
BHJ, at a minimum, will maintain file copies of the Hazard Mitigation Plan that are
available for review and inspection during routine business hours. BHJ intends to log all
comments received regarding the mitigation plan. Members of the public are invited to

169
Region 11 Hazard Mitigation Plan 4.0 Plan Maintenance
contact BHJ with comments regarding hazard events, etc. Local officials are also invited to
review the plan’s effectiveness at determining hazard susceptibility based on data from
hazard events as they occur.

Region 11 Hazard Mitigation Plan 5.0 Appendices
170
5.0 APPENDICES
The following is a list of appendices included in the Region 11 hazard mitigation plan.
Appendix 1: Meeting Documentation
Appendix 2: Survey Data
Appendix 3: Citations
Appendix 4: Inactive Projects
Appendix 5: Hazmat and Health
Appendix 6: NFIP Surveys
Appendix 7: Adopting Resolutions (to be included following plan approval)

171
Region 11 Hazard Mitigation Plan 5.0 Appendices
APPENDIX 1
MEETING DOCUMENTATION
Committee Involvement
Brooke-Hancock Regional Council Members Regional Council minutes for meeting on November 9, 2016 Regional Council minutes for meeting on May 3, 2017 Email from BHJ MPC to counties and jurisdictions Signed letters of interest from jurisdictions Steering committee meeting attendance Steering committee email log Steering committee phone log
Meeting 1
Meeting 1 sign in sheet Meeting 1 agenda Meeting 1 presentation Risk assessment matrix exercise
Meeting 2
Meeting 2 sign in sheet Meeting 2 agenda Meeting 2 presentation Hazards perception exercise Setting goals Project updates New projects
Meeting 3
Meeting 3 sign in sheet Meeting 3 agenda Meeting 3 presentation Project prioritization matrix exercise Hazards mapping exercise
Meeting 4
Meeting 4 sign in sheet Meeting 4 agenda Project review and approval Asset review and approval Jurisdictional capabilities exercise
Public meeting
Public meeting advertisement invoice Public meeting sign in sheet Public meeting presentation Public participation in meetings

172
Region 11 Hazard Mitigation Plan 5.0 Appendices
Hancock County LEPC meeting
January 11, 2017 meeting announcement January 11, 2017 meeting minutes

BROOKE‐HANCOCK REGIONAL COUNCIL MEMBERS
Name Position OrganizationJim Andreozzi Commissioner Brooke County CommissionJoe Barnabei Commissioner Hancock County CommissionTravis Blosser City Manager WeirtonJim BrockmanJames Bush Program Manager Appalachian Regional CommissionHampton Cokeley Representative Senator Capito's OfficeJeff Davis Commissioner Hancock County CommissionJohn DeStefano City Manager FollansbeePhil Diserio Delegate Brooke CountyTim EnnisRyan Ferns SenatorPat Ford Executive Director Business Development CorporationDan GreathouseMary Jo Guidi Representative Joe Manchin's OfficeMark Henne Weirton Transit Corp.Dennis JonesPat Kirby Director Northern WV Brownfields Assistance CenterLarry Forsythe Mayor ChesterSteve Maguschak City Manager WellsburgPat McGeehan Delegate Hancock CountyLinda McNeil Mayor New CumberlandBubba MillerBrenda Mull Weirton Chamber of CommerceLibby ReasbeckRichard Rekowski Director Mary H Weir Public LibraryNorm Schwertfeger WVU Extension OfficeEric Sherrard Project Engineer Thrasher EngineersSue Simonetti Mayor WellsburgMarvin Six Assistant Director Business Development CorporationJim Smith Mayor Windsor HeightsPat Sutherland Mayor BethanyRebecca Uhlly Mayor Beech BottomDavid Velegol Mayor FollansbeeMichael WehrRyan Weld Assistant Prosecuter Brooke CountyStacey WiseMark Zatezalo Delegate Hancock CountyBarb Zimnox BHJ-MPC
TABLE 5.1 BROOKE-HANCOCK REGIONAL COUNCIL
173

Un-Adopted Minutes
Brooke-Hancock Regional Planning and Development Council
November 9, 2016
Present were:
Mark Henne, Weirton Transit Corporation Mike Paprocki, Region XI PDC Barb Zimnox, Region XI PDC Sue Simonetti, Mayor, City of Wellsburg Linda McNeil, Mayor, City of New Cumberland Marvin Six, BDC James Smith, Mayor, Windsor Heights Gary Pitcock, Weirton Transit Corporation Rik Rekowski, Mary H. Weir Public Library Steve Maguschak, Wellsburg City Manager Patrick Sutherland, Mayor, Town of Bethany W. Duane Heck, Route 2/168 Authority Jeffrey Wargo, Weirton Transit Corporation Eric Sherrard, The Thrasher Group Mark Henne called the meeting to order at 4:30 pm. He asked for a motion to adopt the minutes of the August 10th meeting. Sue made the motion. Steve seconded. Motion carried. Mark also asked for a motion to adopt the 2017 meeting schedule which was provided by Mike Paprocki (attached). Linda McNeil made the motion. Sue seconded. Motion carried. The next meeting will be February 1, 2017. Mark asked for volunteers to be on the committee for new officers for the next calendar year. Committee members are Pat Sutherland, Jim Smith and Sue Simonetti. Mike will set up a meeting with them sometime, probably after the holidays. Mark then asked Mike for his director’s report. Mike listed several meetings and conversations that he had recently been a part of, including the TAC and full commission meetings at BHJ, conversations with Tracey Rowan of US EDA regarding Youngstown State University’s POWER grant application and a potential project in Beech Bottom, and conversations with Gus Sewaid regarding the traffic light at Birch Drive and Freedom Way and redesigning of that intersection. Mike also told the group that he is still looking for a student intern for BHJ. Mark thanked WV DOT for the repair work on Route 22 through Weirton. He also discussed Pennsylvania Avenue and the need to get it repaired as soon as possible.
174

He also talked about how disappointed he was with this year’s political candidates. None of them made much of an effort to come to the northern panhandle to talk to any of our community groups. He stated that we need an effective voice in Charleston, which he feels we do not have at present. Discussed was a roundtable meeting with our elected officials in Charleston with local officials. We need to prioritize our projects and make the officials in Charleston aware of what we need. Mike was asked to reach out to these legislators to set up the roundtable no later than mid January. Duane Heck from the Route 2/68 Authority gave an update on his group and what they’ve accomplished since its beginning in 1997. He also discussed the New Ohio River Bridge and the fact that is will land on a 2 lane road in Wellsburg, and that needs to be upgraded to a 4 lane road. This project needs to be placed on the TIP. The 4 lane will add to the safety for traffic coming off the bridge and for usage by the oil and gas industry. He also stated that the Authority had received no funding for this current fiscal year. Rik Rekowski informed the group that the Mary H. Weir Public Library was able to help get projects off the ground by being an excellent resource of Census Data, and for their business data base in the northern panhandle. This information will be useful for grant submittals for project funding. Mike told the group that a bridge update would be presented at the next MPO meeting. He also addressed the need by every municipality and county for a full ADA transition plan. The State is looking for everyone to have one. He also addressed the CEDS update; to make sure that all the needed projects are on the plan and that an update is required mid 2017. Marvin gave an update on what is going on with the BDC. He informed the group that we have procured a contractor for the $600,000 EPA assessment grant, and work should begin on it in the first quarter of next year. The Phase II in part of the Beech Bottom site is almost complete and will receive a certificate of completion after some minimal cleanup. The have awarded a bid to demo a building and are completing an RFQ for the hazardous substances in the ground. They also have completed an RFQ for demo of part of the building and for hazardous material at the Brooke Glass site. They recently purchased the Follansbee Steel Plant. They will do a Phase II on the site and start the cleanup process. The Lodge at Williams Country Club and the Jimmy Carey Stadium are each completing an RFQ for remediation. The Newell Porcelain site has a local buyer. The BDC is coordinating the assessment and cleanup and redevelopment of the site. The TS&T building is under construction, and the riverbank remediation has been completed. The BDC will soon receive a certificate of completion for the site. Barb gave an update on the Community Development projects to the group. She told them that the Hazard Mitigation Plan update will begin soon. Everyone needs to be involved in this. The State will look at these documents when FEMA funds are
175

requested for disaster relief. If the municipality/ county didn’t participate, it might be more difficult to receive funding. With no further business to bring before the group, Mark asked for a motion to adjourn the meeting. Jim made the motion. Sue seconded. Motion carried. The meeting was adjourned at 5:40 pm. Submitted by Barb Zimnox, recorder.
176

Un-Adopted Minutes
Brooke-Hancock Regional and Development Council
May 3, 2017
Present were:
Mark Henne, Weirton Transit Corp.
Linda Mcneil, Mayor of New Cumberland
Barb Zimnox, Region XI PDC
Adrienne Ward, BHJ
Mike Paprocki, Executive Director, BHJ
Mary Jo Guidi, Representative of Senator Joe Manchin’s Office
Patrick Sutherland, Mayor of Bethany
Sue Simonetti, Mayor of Wellsburg
Hampton Cokeley, Senator Capito’s Office
Jessicah Cross, Senator Capito’s Office
Rick Rekowski, City of Weirton- Mary H. Weir Library
Mark Henne called the meeting to order at 4:40 PM. He asked for a motion to adopt the minutes of the February 1, 2017 meeting. Sue made a motion. Linda seconded. Motion carried.
Pat Sutherland gave his report on the town of Bethany. He gave a handout to everyone and he asked if everyone would take time to look it over. He said they are trying to enhance safety and making some progress on pedestrian crossing. He brought some infrastructure improvements to show everyone what is happening on campus.
Mike then gave his Director’s Report. He said May 8 Dave and Mike will go to Open House at ODOT. May 9 contractors for Wellsburg Bridge will be having a meeting at BHJ office. May 11 Mike said he will be going up to Regional Freight Conference in Cranberry Township, PA. May 15-17 he will be at the West Virginia Association of Regional Planning & Development Councils Annual Conference in Vienna, WV. May 17 BHJ TAC and Full Commission Meeting at BHJ. June 5 Executive Meeting at BHJ then on June 14 Brownfield Task Force Meeting at BHJ.
Mark then gave the Chairman’s Report he started out by saying it was unfortunate that we lost the legislators back to Charleston at this time due to them trying to get a budget. He also wanted to welcome Rick back to the meetings.
Next Mike went over the (CEDS) report. He said we did pick up some more projects. Over next 18 months more projects will be coming. Rick then talked about comprehensive plan for the city of Weirton. They came up with four goals and the objectives under each of them and they will be having another meeting May 11.
177

Transportation update, Linda McNeil said they had a failure on a part route 2 that goes through New Cumberland. She said WVDOT did respond quickly and it was poorly done and she said they are going to smooth it out. She said the latest communication with the new secretary that an environmental study is being done and it should take two years but she said they don’t have two years. She said federally these environmental studies have to be done on all 5 plans. Mike said in Follansbee they have the project program. Mark then gave his update and said the traffic is getting worse in Follansbee due to this project. He and Mike talked about this and maybe they should take on a comprehensive study of route 2 and pursue through DOH to get these dollars. Sue gave her Wellsburg update and said she talked to some people about getting box on poles getting fixed. Then Linda talked about weigh limits for trucks passing through and if they could do random checks to check weight limit. US/22 Weirton joint pavement repairs Main St. to PA state line.
Mike went over the Brownfields Task Force Newsletter thanked Adrienne for writing it. NARC put out feeler for Brownfields Development values and he sent the newsletter and that led the lady from NARC to get in touch with Pat Ford to get some info on projects to send to Congressmen Ranking members in those communities. Then Mike said he got to attend a meeting with McKinley and he is rewriting the authorization for Brownfields. Mike then mentioned the National Brownfields Conference in Pittsburgh and how they will be doing a lounge presentation for the task force.
Barb gave her update on spending. Mary Jo then gave an update on senator Manchin and mentioned that major committees proportions good for WV. May 22-26 commonsense connections week and mentioned the upcoming job fairs they will be attending around the state.
Hampton then introduced Jessicah Cross, she will be taking over his job at the end of the June.
Barb then gave her update and status report which was enclosed in the packet. She mentioned the New Cumberland water/sewer project and then Hazard Mitigation Meeting on May 4th in the Blue Room at Milsop Community Center. She mentioned that this is the last meeting and then they will send draft to the state for review. She was pleased with the participation with the counties. She said if anyone had any questions they can contact her.
The next meeting is scheduled for August 2, 2017 at 4:30 PM.
With no further business to bring before the group Mark asked for a motion to adjourn the meeting. Sue approved and the meeting was adjourned at 5:37 PM.
178

Region 11 Hazard Mitigation Plan 5.0 Appendices
COMMITTEE INVOLVEMENT
Barb Zimnox, BHJ MPC representative for the Region 11 PDC sent the
following email to invite counties and jurisdictions to participate in the Hazard
Mitigation Plan Update.
From: Barb Zimnox [mailto:[email protected]] Sent: Thursday, September 15, 2016 10:22 AM
To: Jim Andreozzi ([email protected]); Travis Blosser; Sutherland, Pat; 'Sue Simonetti'; 'Barnabei,
Joe'; 'Davis, Jeff'; 'DeStefano, John'; 'Larry Forsythe'; 'McNeil, Linda'; 'Miller, Bubba'; 'Swartzmiller, Michael'; 'Uhlly, Rebecca'; 'Wise, Stacey'; 'Maguschak, Steve'; James Smith ([email protected])
Cc: 'Michael Paprocki' Subject: Hazard Mitigation Plan Update
All, Our State required Regional Hazard Mitigation Plan done in 2012 is due to be updated this year. I am in the process of submitting the grant application to Homeland Security to get the funds to do the mandated update. Region XI has contracted with Jeff Harvey to do the update. This is the consultant that did the original plan. As part of the application process, I need each entity to submit a letter stating that you plan to participate in the hazard mitigation plan update. I’m attaching the letters to this email. Please print out the letter specific to your community on your letterhead, sign it, and either scan and send it back to me, or fax it to me at the number below. There will be no cost to anyone for this update. WV Division of Homeland Security is providing funding. This plan is necessary for each community to be eligible to receive FEMA assistance in certain instances, so please plan to participate. If you have any questions regarding the letter or the plan update, please let me know. We will be scheduling meetings with everyone who participates to collect information and inform the public in the near future. Thank you all for your attention to this matter, Barb Zimnox Community Development Specialist WV Region XI Planning & Development Council P.O. Box 82 Weirton, WV 26062 Ph: (304) 797-9666 ext. 204 Fax: (740) 282-1821 Physical Address: 124 North 4th Street, 2nd Floor Steubenville, OH 43952
179

180

181

182

183

184

185

186

187

188

Contact Name Agency PositionAttended
30 Nov 2016Meeting
Attended 19 Dec 2016
Meeting
Attended 06 Feb 2017
Meeting
Attended 04 May 2017 Meeting
Committee Meetings Attended
04 May 2017 Public Meeting
Total Meetings Attended
Blackwell, Richard New Cumberland Floodplain Manager Yes Yes Yes Yes 4 No 4
DeStefano, John Follansbee City Manager Yes Yes Yes No 3 No 3
Forsythe, Larry Chester Mayor No No No No 0 No 0
Fowler, Robert Brooke County EMA EM Director Yes No No No 1 No 1
Hoffman, Cindy Bethany Recorder No No Yes No 1 No 1
Maguschak, Steve Wellsburg City Manager Yes Yes Yes No 3 No 3
Miller, Mark Weirton Planning Director No No Yes Yes 2 Yes 3
Nickerson, Andy Brooke County EMA Deputy Director Yes No No Yes 2 No 2
Ober, Jeremy Hancock County EMA EM Director Yes Yes Yes Yes 4 No 4
Paprocki, Mike BHJ Region 11 Region 11 Director Yes No No No 1 No 1
Sadler, Robert Beech Bottom Vice-Mayor No Yes Yes No 2 No 2
Smith, James Windsor Heights Mayor No Yes No No 1 No 1
Uhlly, Becky Beech Bottom Mayor No Yes Yes No 2 No 2
Vidas, Bob Hancock County Director Tech & Comm Yes Yes Yes Yes 4 No 4
Zimnox, Barb BHJ Region 11 Region 11 Planner Yes Yes Yes Yes 4 Yes 5
TABLE 5.2 STEERING COMMITTEE MEMBER MEETING ATTENDANCE
189

Contact Name Agency Position Date JHC Sent/Received Subject Outcome/Status
Barb Zimnox BHJ Region 11 Region 11 Planner 12/12/2016 Sent Public survey link to distribute to committee members N/A
Jeremy Ober Hancock County EMA EM Director 12/14/2016 Received Project and asset list review Phone call 12/16/2016 @10:30 am
Barb Zimnox BHJ Region 11 Region 11 Planner 12/14/2017 Received Received Follansbee Assets list N/A
Bob Vidas Hancock County Director Tech. 12/14/2017 Received Questions about asset list Replied 12/14/2016
Barb Zimnox BHJ Region 11 Region 11 Planner 12/15/2016 Received Asset list for Region 11 N/A
To All members 1/21/2016 Sent 1st Attempt to set up phone call for project list Five members responded - need second attempt to schedule
Barb Zimnox BHJ Region 11 Region 11 Planner 1/21/2016 Received 1st Attempt to set up phone call for project list Scheduled phone call
Jeremy Ober Hancock County EMA EM Director 1/21/2016 Received 1st Attempt to set up phone call for project list Scheduled phone call
Richard Blackwell New Cumberland City Mayor 1/21/2016 Received 1st Attempt to set up phone call for project list Scheduled phone call
Steve Mabuschak Wellsburg City Manager 1/21/2016 Received 1st Attempt to set up phone call for project list Scheduled phone call
Cindy Hoffman Bethany Recorder 1/21/2016 Received 1st Attempt to set up phone call for project list Called 1/21/16 at 9am - needs info on homework
Cindy Hoffman Bethany Recorder 1/21/2016 Sent Committee Homework instructions N/A
Becky Uhlly Beech Bottom Mayor 1/10/2017 Sent 2nd Attempt to set up phone call for project list Replied 1/18/2017. New email contact, phone call set up
John DeStefano Follansbee City Manager 1/10/2017 Sent 2nd Attempt to set up phone call for project list No response as of 1/20/2017
Robert Fowler Brooke County EMA EM Director 1/10/2017 Sent 2nd Attempt to set up phone call for project list No response as of 1/20/2017
James Smith Windsor Heights Mayor 1/10/2017 Sent 2nd Attempt to set up phone call for project list No response as of 1/20/2017
Larry Forsythe Chester Mayor 1/10/2017 Sent 2nd Attempt to set up phone call for project list No response as of 1/20/2017
John DeStefano Follansbee City Manager 1/20/2017 Sent Will call 1/23/2017 @ 10:00 am No response as of 1/23/2017
Robert Fowler Brooke County EMA EM Director 1/20/2017 Sent Will call 1/23/2017 @ 11:00 am No response as of 1/23/17
James Smith Windsor Heights Mayor 1/20/2017 Sent Will call 1/23/2017 @ 3:00pm No response as of 1/23/17
Larry Forsythe Chester Mayor 1/20/2017 Sent Will call 1/23/2017 @ 4:00pm Called back 1/21/2017 @2:30pm
Mark Miller Weirton Planning Director 1/20/2017 Sent 1st Attempt to set up phone call for project list No response as of 1/31/17
James Smith Windsor Heights Mayor 1/23/2017 Sent Need contact phone number - not in service No response as of 2/2/17
Andy Nickerson Brooke County EMA Deputy Director 2/1/2017 Sent Will call 2/1/2017 @3:00pm Requested phone call on 2/2/2017
Mark Miller Weirton Planning Director 2/2/2017 Sent Will call 2/2/2017 @ 2:pm No response required
Cindy Hoffman Bethany Recorder 2/2/2017 Sent Will call 2/2/2017 @ 1:15pm No response required
James Smith Windsor Heights Mayor 2/2/2017 Sent Will call 2/2/2017 @ 3pm No response
Jeremy Ober Hancock County EMA EM Director 3/8/2017 Sent Tier II facility information request Received Tier II info 3/17/2017
Andy Nickerson Brooke County EMA Deputy Director 3/8/2017 Sent Tier II facility information request Received Tier II info 3/17/2018
Mark Miller Weirton Planning Director 3/9/2017 Sent Project Lists and Asset List Received projects and assets list 3/16/2017To All members 3/17/2017 Sent Jurisdictional capabilities All but two members responded - will distribute next meeting
Andy Nickerson Brooke County EMA Deputy Director 3/20/2017 Received Responded to jurisdictional capabilities request N/A
Richard Blackwell New Cumberland City Mayor 3/20/2017 Received Responded to jurisdictional capabilities request N/A
Barb Zimnox BHJ Region 11 Region 11 Planner 3/27/2017 Sent Sent profiles for distribution and review N/ATo All members 4/6/2017 Sent Reminder of hazard review request All but three members responded - approved
Barb Zimnox BHJ Region 11 Region 11 Planner 4/6/2017 Sent Request for 4th committee and public mtgs. Called to set date of 5/4/2017
Becky Uhlly Beech Bottom Mayor 4/6/2017 Received Received scanned pictures of land subsidence N/A
Jeremy Ober Hancock County EMA EM Director 4/7/2017 Received Responded to hazard profile review - nothing to add N/A
TABLE 5.3 STEERING COMMITTEE EMAIL LOG FOR HAZARD MITIGATION PLAN
Meeting 1 - 30 Nov 2016
Meeting 2 - 19 Dec 2016
Meeting 3 - 6 Feb 2017
190

Contact Name Agency Position Date JHC Sent/Received Subject Outcome/Status
TABLE 5.3 STEERING COMMITTEE EMAIL LOG FOR HAZARD MITIGATION PLAN
Steve Mabuschak Wellsburg City Manager 4/7/2017 Received Responded to hazard profile review - nothing to add N/A
John DeStefano Follansbee City Manager 5/4/2017 Received Allegheny Creek Report received N/A
Jeremy Ober Hancock County EMA EM Director 5/24/2017 Sent Request LEPC agenda and minutes Received LEPC agenda minues
Andy Nickerson Brooke County EMA Deputy Director 6/5/2017 Sent Project prioritization - respond by 6/8 No response - approved
Larry Forsythe Chester Mayor 6/5/2017 Sent Project prioritization - respond by 6/9 No response - approved
James Smith Windsor Heights Mayor 6/5/2017 Sent Project prioritization - respond by 6/10 No response - approved
To All members 9/1/2017 Sent FEMA review and revision requirements N/A
Bob Vidas Hancock County Director Tech. 9/1/2017 Received Would be best to talk to Jeremy N/A
Jeremy Ober Hancock County EMA EM Director 9/5/2017 Received A call on Friday would work best Called, left messaje on Friday 9/8. Spoke on 9/12
Cindy Hoffman Bethany Recorder 9/6/2017 Received A call on Friday would work best Spoke to her on Friday
Becky Uhlly Beech Bottom Mayor 9/6/2017 Received A call on Friday would work best Spoke to her on Friday
Becky Uhlly Beech Bottom Mayor 9/12/2017 Received NFIP Survey N/A
Jeremy Ober Hancock County EMA EM Director 9/18/2017 Received NFIP Survey N/A
Andy Nickerson Brooke County EMA Deputy Director 9/19/2017 Sent Complete NFIP survey and return No response as of 9/25
Robert Fowler Brooke County EMA EM Director 9/19/2017 Sent Complete NFIP survey and return No response as of 9/25
Larry Forsythe Chester Mayor 9/19/2017 Sent Complete NFIP survey and return No response as of 9/25
John DeStefano Follansbee City Manager 9/19/2017 Sent Complete NFIP survey and return No response as of 9/25
Richard Blackwell New Cumberland Floodplain Manager 9/19/2017 Sent Complete NFIP survey and return No response as of 9/25
Steve Maguschak Wellsburg City Manager 9/19/2017 Sent Complete NFIP survey and return No response as of 9/25
James Smith Windsor Heights Mayor 9/19/2017 Sent Complete NFIP survey and return No response as of 9/25
Mark Miller Weirton Planning Director 9/19/2017 Sent Complete NFIP survey and return No response as of 9/25
Andy Nickerson Brooke County EMA Deputy Director 9/25/2017 Sent Complete NFIP SurveyLarry Forsythe Chester Mayor 9/25/2017 Sent Complete NFIP SurveyJohn DeStefano Follansbee City Manager 9/25/2017 Sent Complete NFIP SurveyRichard Blackwell New Cumberland Floodplain Manager 9/25/2017 Sent Complete NFIP Survey Returned via fax 9/25Steve Maguschak Wellsburg City Manager 9/25/2017 Sent Complete NFIP Survey Returned via fax 9/26James Smith Windsor Heights Mayor 9/25/2017 Sent Complete NFIP SurveyMark Miller Weirton Planning Director 9/25/2017 Sent Complete NFIP SurveyRichard Blackwell New Cumberland Floodplain Manager 9/25/2017 Received Faxed completed surveySteve Maguschak Wellsburg City Manager 9/26/2017 Received Faxed completed surveyJohn DeStefano Follansbee City Manager 10/5/2017 Received Has questions about NFIP survey Called office and left message to helpLarry Forsythe Chester Mayor 10/10/2017 In-person NFIP Survey Dropped off NFIP survey at the office, he was not there. New phone #Mark Miller Weirton Planning Director 10/10/2017 In-person NFIP Survey Delivered completed NFIP surveyJohn DeStefano Follansbee City Manager 10/10/2017 In-person NFIP Survey Dropped off NFIP survey at the office, he was not there.Andy Nickerson Brooke County EMA Deputy Director 10/10/2017 In-person NFIP Survey Attempted to locate office, courthouse and police did not know locationJohn DeStefano Follansbee City Manager 10/11/2017 Received NFIP Survey, has questions about survey Called him on 10/11 to clarify and complete surveyJohn DeStefano Follansbee City Manager 10/11/2017 Sent Updated projects according to phone conversation.Larry Forsythe Chester Mayor 10/19/2017 Received Completed NFIP Survey photosAndy Nickerson Brooke County EMA Deputy Director 10/23/2017 Sent Complete NFIP Survey and return by 10/27
FEMA Review
Meeting 4 - 4 May 2017
191

Contact Name Agency Position Date JHC Sent/Received Subject Outcome/Status
TABLE 5.3 STEERING COMMITTEE EMAIL LOG FOR HAZARD MITIGATION PLAN
Robert Fowler Brooke County EMA EM Director 10/23/2017 Sent Complete NFIP Survey and return by 10/27James Smith Windsor Heights Mayor 10/23/2017 Sent Complete NFIP Survey and return by 10/27
Grace Davis Windsor Heights Mayor 10/25/2017 Sent Complete NFIP survey and info on HMPAndy Nickerson Brooke County EMA Deputy Director 10/27/2017 Received Sent NFIP survey completed
Grace Davis Windsor Heights Mayor 11/15/2017 Sent Reminder of NFIP survey
192

Contact Name Agency Position Date SubjectJeremy Ober Hancock County EMA EM Director 12/16/2016 Reviewed hazardsCindy Hoffman Bethany Recorder 12/21/2016 Went over homework from previous meetingsBarb Zimnox BHJ Region 11 Region 11 Planner 1/4/2017 Reviewed hazards and project listRichard Blackwell New Cumberland City Mayor 1/4/2017 Called, left messageRichard Blackwell New Cumberland City Mayor 1/5/2017 Reviewed hazards and project listJeremy Ober Hancock County EMA EM Director 1/6/2017 Reviewed project listSteve Mabuschak Wellsburg City Manager 1/10/2017 Reviewed hazards and project listBecky Uhlly Beech Bottom Mayor 1/19/2017 Reviewed hazards and project list
Larry Forsythe Chester Mayor 1/20/2017Reviewed project list and discussed projects. Unable to make it to the meetings. Provided new projects.
John DeStefano Follansbee City Manager 1/23/2017 Called, left messageRobert Fowler Brooke County EMA EM Director 1/23/2017 Called, left messageJames Smith Windsor Heights Mayor 1/23/2017 Phone number is not in serviceJohn DeStefano Follansbee City Manager 2/1/2017 Reviewed hazards and project listAndy Nickerson Brooke County EMA Deputy Director 2/2/2017 Reviewed hazards and project listCindy Hoffman Bethany Recorder 2/2/2017 Phone number is incorrectCindy Hoffman Bethany Recorder 2/2/2017 She called, reviewed project listMark Miller Weirton Planning Director 2/2/2017 Called, left messageJames Smith Windsor Heights Mayor 2/2/2017 Called, no answerMark Miller Weirton Planning Director 2/2/2017 He called, talked about identifying hazards, needs helpBarb Zimnox BHJ Region 11 Region 11 Planner 4/14/2017 Called, left message - Planning a public meetingMark Miller Weirton Planning Director 5/25/2017 Weirton Comprehensive Plan and developmentJeremy Ober Hancock County EMA EM Director 9/8/2017 Left messageBecky Uhlly Beech Bottom Mayor 9/8/2017 Talked about FEMA updates and sent NFIP surveyCindy Hoffman Bethany Recorder 9/8/2017 Talked about FEMA updates and filled out NFIP surveyJeremy Ober Hancock County EMA EM Director 9/12/2017 Talked about FEMA updates and sent NFIP surveyJohn DeStefano Follansbee City Manager 10/5/2017 Called, left message. Help with NFIP surveyAndy Nickerson Brooke County EMA Deputy Director 10/5/2017 Called, left message. Need NFIP survey returnedLarry Forsythe Chester Mayor 10/5/2017 Called, left message. Need NFIP survey returnedJames Smith Windsor Heights Mayor 10/5/2017 Called, no answer. Can't leave message.Mark Miller Weirton Planning Director 10/5/2017 Called, left message. Need NFIP survey returnedJohn DeStefano Follansbee City Manager 10/11/2017 Talked about and completed NFIP survey. Updated projectsAndy Nickerson Brooke County EMA Deputy Director 10/18/2017 Called, left message about NFIP survey neededLarry Forsythe Chester Mayor 10/18/2017 Called, left message about NFIP survey neededLarry Forsythe Chester Mayor 10/18/2017 Called to talk about NFIP, scheduled phone call for 10/20
TABLE 5.4 STEERING COMMITTEE PHONE LOG
193

Region 11 Hazard Mitigation Plan 5.0 Appendices
MEETING 1
November 30, 2016
194

195

1
Region 11 Planning & Development Council Multi-Jurisdictional Hazard Mitigation Plan
REGION 11 PLANNING & DEVELOPMENT COUNCIL MULTI-JURISDICTIONAL HAZARD MITIGATION PLAN
STEERING COMMITTEE #1 MEETING
AGENDA
Date: November 30, 2016
Time: 12:00 p.m.
Estimated Duration: 90-120 minutes
Location: Mary H. Weir Public Library
1. Welcome & Introductions
2. Brief Overview of Process
Mitigation Planning Process
CRS Additions?
Steering Committee Roles & Responsibilities
Steering Committee Meeting Schedule
3. Hazard Review
Hazards in the Existing Plan
Hazards to Add?
Committee Member Homework!
4. Asset Inventorying
Review of Existing List
Parameters for Updates
5. Survey for Public Involvement
6. Mitigation Reconstruction Amendment to Existing Plan
7. Questions & Answers
8. Adjournment
196

Meeting 1 Presentation 11/30/2016
1
Region 11Hazard Mitigation Plan
2016 Update
Planning Meeting #1
November 30th, 2016 ~ 12:00 p.m.
Hazard Mitigation Planning Process
197

Meeting 1 Presentation 11/30/2016
2
Hazard Review: Acts of Violence
• Active Assailant
• Domestic & International Terrorism
• School Violence
SOURCES:• National consortium for the Study of Terrorism and
Responses to Terrorism (START)
Hazard Review: Dam Failure
• 14 dams in the region:
– 9 in Brooke County
– 4 in Hancock County
– 1 in Beaver County, PA
• All classified as either ‘High’ or ‘Significant’ hazard dams
• No incidents
SOURCES:• Stanford University National Performance of Dams Program• National Inventory of Dams (USACE)
198

Meeting 1 Presentation 11/30/2016
3
Hazard Review: Drought1999 ‐ 2016
• 2 events listed by NOAA NCEI (in reality, one single event) :
– August 01‐31, 1999
– September 01‐30, 1999
SOURCES:• NOAA National Centers for Environmental Information
Hazard Review: Earthquake1925 ‐ 2016
• No epicenters identified in Region 11
SOURCES:• WV Geological
and Economic Survey
• NOAA National Centers for Environmental Information
199

Meeting 1 Presentation 11/30/2016
4
Hazard Review: Extreme Temperatures2009 ‐ 2016
• Heat & Cold
• 7 events listed by NOAA NCEI:
– 0 hot
– 7 cold
SOURCES:• NOAA National Centers for Environmental Information
Hazard Review: Flooding
• Historical events:
– 1936 “The Big One”
– 1985 “Election Day Floods”
– 2016 Follansbee Flood
SOURCES:• NOAA National Centers for Environmental Information
County Flash Floods Floods Totals
Brooke 16 12 28
Hancock 10 12 22
Totals 26 24 50
1996 - 2016
200

Meeting 1 Presentation 11/30/2016
5
Hazard Review: HazMat
• Type of information included in HazMat analysis:
– Tier II reporting facilities
– Commodity Flow Studies (CFSs)
– Fracking
– Pipelines
• Incidents: 209 (sheens, spills, leaks, discharges, etc.)
SOURCES:• Pipeline and Hazardous Materials Safety Administration• Fractracker Alliance• USCG National Response Center
Hazard Review: Land Subsidence1950 ‐ 2016
• No incidents recorded
SOURCES:• NOAA National Centers for Environmental Information
201

Meeting 1 Presentation 11/30/2016
6
Hazard Review: Radiological
• No nuclear power plants located within Region 11, but the Beaver Valley Nuclear Power Station is located in Shippingport, PA.
• No incidents
SOURCES:• First Energy• Beaver County EMA
Hazard Review: Severe Weather
• The term ‘Severe Weather’ shall include the following conditions:
SOURCES:• NOAA National Centers for Environmental Information
• Severe Thunderstorms
• Winter Storms
• Hailstorms• Lightning• Tornadoes• Wind
• Blizzards• Ice Storms
SEVERE WEATHER
EventOccurrences
Brooke CountyOccurrences
Hancock CountyTotal
OccurrencesTimeframe
Blizzard 6 7 13 1999-2016
Hailstorm 13 28 41 1980-2016
Ice Storm 8 6 14 1997-2016
Lightning 0 2 2 1996-2016
Thunderstorm 84 85 169 1957-2016
Tornado 0 0 0 1950-2016
Wind 12 13 25 1999-2016
Totals 123 141 264
202

Meeting 1 Presentation 11/30/2016
7
Hazard Review: Wildfire• Low hazard probability
• No incidents
SOURCES:• NOAA National Centers for Environmental Information• WV Division of Forestry
Hazard Additions
• Based on your knowledge of the area, is there a hazard that we should consider adding?
203

Meeting 1 Presentation 11/30/2016
8
Hazard Exercises
• Risk Assessment Matrix
• Hazard Perceptions
• Acts of Violence• Dam Failure• Drought• Earthquake• Extreme Temperatures• Flood• Land Subsidence• Radiological• Severe Weather• Wildfire• Other…
IMPACTPROBABILITY
Frequent Probable Occasional Remote Improbable
SEVER
ITY
Catastrophic High High High Moderate Moderate
Critical High High Moderate Moderate Moderate
Marginal Moderate Moderate Moderate Moderate Low
Negligible Moderate Moderate Low Low Low
Committee Member Homework!• Asset Inventory Pages
– Confirm
– Add
– Delete
• Project Discussions
– Lists will be emailed
– Note projects for:
• Completion (Specify what was done, how it was completed)
• Deletion (If deleting, reason?)
204

205

206

207

208

209

210

211

212

213

214

Region 11 Hazard Mitigation Plan 5.0 Appendices
MEETING 2
December 19, 2016
215

216

1
Region 11 Planning & Development Council Multi-Jurisdictional Hazard Mitigation Plan
REGION 11 PLANNING & DEVELOPMENT COUNCIL MULTI-JURISDICTIONAL HAZARD MITIGATION PLAN
STEERING COMMITTEE #2 MEETING
AGENDA
Date: December 19th, 2016
Time: 12:00 p.m.
Estimated Duration: 90-120 minutes
Location: Mary H. Weir Public Library
1. Welcome & introductions
2. Survey for public involvement
3. Hazard perceptions - individual exercise
4. Hazard mitigation and goal definition
5. Hazard mitigation goals - group exercise
Set regional goals
Prioritize goals
6. Hazard mitigation projects - individual exercise
7. Questions & Answers
8. Adjournment
217

Meeting 2 Presentation 12/19/2016
1
Region 11Hazard Mitigation Plan
2017 Update
Planning Meeting #2
December 19, 2016 ~ 12:00 p.m.
Public Involvement Survey
https://www.surveymonkey.com/r/Region11HazardMitigation
• Share by posting on governmental/agency websites, social media pages, including in newsletters, press releases, work with utilities to include in mailings, creating fact sheets for distribution in schools, etc…
• Encourage coworker, friend, family, and community participation
218

Meeting 2 Presentation 12/19/2016
2
Hazard Perception Exercise
• List of hazards for Region 11:• Acts of Violence• Dam Failure• Drought• Earthquake• Extreme Temperatures• Flood• HazMat• Land Subsidence• Radiological• Severe Weather• Wildfire
Asset List Review
• As accurate as possible
• Additions & Deletions
• Deliver to Amy via email
219

Meeting 2 Presentation 12/19/2016
3
Mitigation
“Mitigation is the effort to reduce loss of life and property by lessening the impact of disasters. In order for mitigation to be effective we need to take action now—before the next disaster—to reduce human and financial consequences later (analyzing risk, reducing risk, and insuring against risk)”.
www.FEMA.gov
Goals
A goal is the end toward which projects are directed – the reason for doing something. These should relate to the hazards discussed for the plan.
Example Goal:
Minimize velociraptor‐human interaction in Region 11.
220

Meeting 2 Presentation 12/19/2016
4
Region 11 Goals Exercise
• Create 2 groups
• In each group, discuss and record 6 goals for Region 11
• Create unified list of top 5 goals
• Rate the goals in order of priorityHigh
Medium
Low
Jurisdictional Projects Exercise
Projects relate back to the goals set forth by the committee and should be S.M.A.R.T.:
S…specific
M…measurable
A…achievable
R…realistic
T…time sensitive
Example Project:• Create a velociraptor refuge in the
New Manchester area within the next year.
Primary agency: Hancock County Animal ControlFunding: ASPCA Endangered Species Protection Block Grant
221

Meeting 2 Presentation 12/19/2016
5
Questions & Answers
THANK YOU!
Contact:
Amy Heimberger
304‐473‐1009
222

223

224

225

226

227

228

229

230

231

MEETING 2, SETTING GOALS
During the meeting on December 19, 2016, the committee participated in an activity to set the goals for the Region 11 HMP update. There were two groups in which members identified the goals they would focus on for the plan update.
After each group came up with their own goals, they agreed upon six primary goals.
232

233

234

235

236

237

238

239

240

241

242

243

244

245

246

247

Region 11 Hazard Mitigation Plan 5.0 Appendices
MEETING 3
February 6, 2017
248

249

1
Region 11 Planning & Development Council Multi-Jurisdictional Hazard Mitigation Plan
REGION 11 PLANNING & DEVELOPMENT COUNCIL MULTI-JURISDICTIONAL HAZARD MITIGATION PLAN
STEERING COMMITTEE #3 MEETING
AGENDA
Date: February 6th, 2017
Time: 12:30 p.m.
Estimated Duration: 90-120 minutes
Location: Mary H. Weir Public Library
1. Welcome & introductions
2. Survey for public involvement
3. Hazard mitigation goals and projects
Review goals
Review projects
Prioritize projects
4. Mapping exercise
5. Questions & Answers
6. Adjournment
250

Meeting 3 Presentation 2/6/2017
1
Region 11Hazard Mitigation Plan
2017 Update
Planning Meeting #3
February 6, 2017~ 12:30 p.m.
Public Involvement Surveyhttps://www.surveymonkey.com/r/Region11HazardMitigation
1
2
15
1
31
12
11
0
0
0
Results as of Thursday, February 2nd, 2017 at 4:00pm
251

Meeting 3 Presentation 2/6/2017
2
Hazard Mitigation GoalsThese were the topics for the goals set by the committee in meeting #2. By vote, the priority is as follows:1. Flooding 17 points
2. Water sources 14 points
3. Accessibility 11 points
4. Land subsidence 10 points
5. HazMat & Education 8 points (tie)
High - 3 Medium - 2 Low - 1
Hazard Mitigation Goals
GOAL 1 Mitigate effects of flooding and flash flooding in Region 11 by reducing costs and loss of property.
GOAL 2* Protect and secure water sources within Region 11.GOAL 3 Promote safety by increasing public road accessibility in
Region 11.GOAL 4 Minimize occurrences of land subsidence and property loss.GOAL 5 Reduce impact of Hazardous Materials on the environment
through awareness and planning.GOAL 6 Minimize effects of all hazards affecting Region 11 by
increasing awareness and preparation through education and notification.
252

Meeting 3 Presentation 2/6/2017
3
Hazard Mitigation Projects
• Review your projects
• Prioritization exerciseSCALE
5 4 3 2 1
EASE OF IMPLEMENTATION EASY DIFFICULTCOST EFFECTIVENESS INEXPENSIVE EXPENSIVESOCIAL IMPACTS GOOD BADPOLITICAL IMPACTS GOOD BADECONOMIC IMPACTS GOOD BADOVERALL POSITIVE IMPACT GOOD BAD
Mapping Exercise
• Divide into 2 groups
• Use the maps on the tables to identify problem areas relating to the following hazards in your jurisdiction.
Use colorsMake notes
Drought HazMat Land Subsidence Severe Weather
253

Meeting 3 Presentation 2/6/2017
4
Questions & Answers
THANK YOU!
Contact:
Amy Heimberger
304-473-1009
254

1
2
3
4
5
The highest score is the highest-priority project. (NOTE: Multiple projects may have the same ranking.)
REGION 11 HAZARD MITIGATIONPLAN UPDATE
Prioritization Matrix InstructionsList your projects across the top row of the matrix.
On a scale of 1 to 5 (5 being the best), score each project according to the criteria in the left-hand column. Score each project according to your opinion of its merit. No comparison is made during the initial scoring.Tally the score for each project by adding the numbers in the column under the project. Place the answer in the same column of the "Total" row.
Definition of Scoring Criteria:
Ease of Implementation:
Do local policies and capabilities currently allow for the implementation of the project? Are programs available to assist in funding the implementation of the project?
Do local leaders generally agree that implementing the project will be beneficial to the community?
Overall Positive Impact:
Is sufficient funding available to implement the project at a cost manageable by the local government? If not, is funding available? Will the costs of implementing the project be significantly less than the cumulative future costs potentially incurred by an un-corrected situation?
Will the public perceive the project as positively lessening hazard-related losses? Will implementing the project adversely affect any segment of the population?
Will implementing the project create negative political issues?
Is the cost/benefit ratio of implementing the project acceptable? Will implementing the project adversely affect the local economy?
Cost Effectiveness:
Social Impacts:
Political Impacts:
Economic Impacts:
255

256

257

258

259

260

261

262

263

MEETING 3, HAZARDS MAPPING
During the meeting on February 6, 2017, the committee participated in an activity to map the hazards in the region. There were two groups in which members identified four hazards on maps provided: land subsidence, drought, hazardous materials incidents, and severe weather.
264

Hazard mapping (continued).
265

Region 11 Hazard Mitigation Plan 5.0 Appendices
MEETING 4
May 4, 2017
266

267

1
Region 11 Planning & Development Council Multi-Jurisdictional Hazard Mitigation Plan
REGION 11 PLANNING & DEVELOPMENT COUNCIL MULTI-JURISDICTIONAL HAZARD MITIGATION PLAN
STEERING COMMITTEE #4 MEETING
AGENDA
Date: May 4, 2017
Time: 5:30 p.m.
Estimated Duration: 45-60 minutes
Location: Weirton Millsop Community Center
1. Welcome & overview
2. Project review and approval
3. Assets review and approval
4. Jurisdictional capabilities
5. Plan Maintenance
Strategy for plan maintenance
Integration through existing programs
Continued public involvement
6. Questions & Answers
7. Adjournment
268

269

270

271

272

273

274

275

276

277

278

279

280

281

282

283

284

285

286

287

288
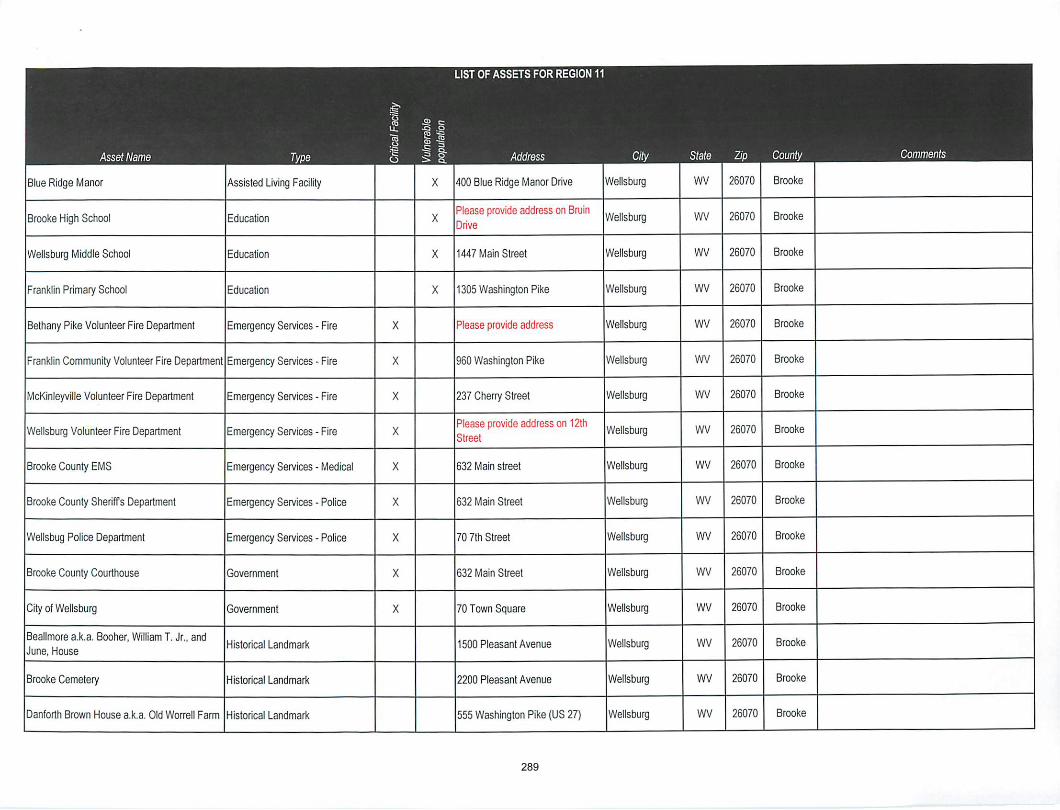
289

290

291

292

293

294

295

296

297

298

299

Region 11 Hazard Mitigation Plan 5.0 Appendices
PUBLIC MEETING
May 4, 2017
300

301

302

303

304

305

Public Meeting Presentation 5/4/2017
1
Region 11 Hazard Mitigation Plan
2017 Update
Public Meetings – Weirton, WV
04 May 2017
Agenda
• ‘Hazard Mitigation’ Overview• Risk vs. Vulnerability• The Flood Risk• Region 11 Hazard Mitigation Plan Overview• Discussion
306

Public Meeting Presentation 5/4/2017
2
‘Hazard Mitigation’ Overview
• Hazard mitigation is the effort to reduce loss of life and property by lessening the impact of disasters.
Risk vs. VulnerabilityRISK VULNERABILITY
Exposure to danger, harm, or loss The quality or state of being exposed to the possibility of danger, harm, or loss
With hazard mitigation, we assess risk.
We also identify projects that can lessen vulnerability.
307

Public Meeting Presentation 5/4/2017
3
The Flood Risk• A flood is a general and temporary condition where two or more acres of
normally dry land or two or more properties are inundated by water or mudflow.
• Causes of Flooding• Dams and levees• New development• Flood after fire• Heavy rains• Winter flooding
• Flash Flooding vs. Flooding
FLOOD RISKS
What Causes Flooding
Coastal Flooding
Understanding Your Risk
Undergoing a Map Change
Real Flood Stories
The Levee Simulator
308

Public Meeting Presentation 5/4/2017
4
Region 11 Hazard Mitigation Plan• Purpose of the Hazard Mitigation Plan
• Assess risks and vulnerabilities• Increase awareness around threats, hazards, and vulnerabilities• Build partnerships for risk reduction• Identify broad, long-term strategies for risk reduction• Align risk reduction with other community objectives• Identify implementation approaches
• Jurisdictions: Brooke and Hancock Counties (including municipalities)
• Scope: All hazard
Discussion
309

Contact Name Agency Position Email Meeting Attended
Rik Rekowski Mary H Weir Public Library Director [email protected] 11/30/2016Paula Rogers Citizen 12/19/2016Linda McNeil New Cumberland Mayor [email protected] 5/4/2017Larry Rea Follansbee Fire Chief [email protected] 5/4/2017
TABLE 5.5 PUBLIC ATTENDANCE AT MEETINGS
310

Region 11 Hazard Mitigation Plan 5.0 Appendices
HANCOCK COUNTY LEPC MEETING
January 11, 2017
311

312

313

314
Region 11 Hazard Mitigation Plan Appendix 2
APPENDIX 2
PUBLIC SURVEY
This appendix contains evidence of public participation initiatives by including
announcements that jurisdictions have posted on social media or published on their website
or by any other method.
Beech Bottom newsletter
Beech Bottom website
Hancock County Facebook post
Hancock County website
Following the survey announcements are the raw data results from the survey as
printed directly from the Survey Monkey website.

315

316

BEECH BOTTOM WEBSITE SURVEY ANNOUNCEMENT
317

HANCOCK COUNTY HOMELAND SECURITY & EMERGENCY MANAGEMENT FACEBOOK SURVEY ANNOUNCEMENT
318

HANCOCK COUNTY WEBSITE SURVEY ANNOUNCEMENT
319
Q1 Please indicate how concerned you areabout the following hazards, specifically
where you live.Answered: 120 Skipped: 0
46.15%54
33.33%39
16.24%19
4.27%5
117
1.79
50.00%58
35.34%41
12.93%15
1.72%2
116
1.66
61.61%69
28.57%32
8.93%10
0.89%1
112
1.49
27.35%32
37.61%44
29.91%35
5.13%6
117
2.13
22.03%26
30.51%36
32.20%38
15.25%18
118
2.41
Dam Failure
Drought
Earthquake
ExtremeTemperatures...
Flooding
HazardousMaterials...
LandSubsidence...
Nuclear/Radiological Incidents
Severe Weather(Includes...
Terrorism(Foreign &...
Wildfire
0 1 2 3 4 5 6 7 8 9 10
Not at allconcerned
Somewhatconcerned
Concerned Veryconcerned
Total WeightedAverage
Dam Failure
Drought
Earthquake
Extreme Temperatures (Hot & Cold)
Flooding
1 / 30
Region 11 Hazard Mitigation Survey
320

7.69%9
25.64%30
35.04%41
31.62%37
117
2.91
11.97%14
35.90%42
31.62%37
20.51%24
117
2.61
15.97%19
26.89%32
29.41%35
27.73%33
119
2.69
7.63%9
34.75%41
42.37%50
15.25%18
118
2.65
15.13%18
33.61%40
31.09%37
20.17%24
119
2.56
26.96%31
46.09%53
19.13%22
7.83%9
115
2.08
# Please add any comments here, or list any hazards that you are concerned about that are not included on thelist.
Date
1 Hancock County WV has a huge heroin problem that no one is completely and honestly will to address and theproblem will only continue to get worse. You cannot have people involve in the problem in positions trying to solve theproblem.
3/19/2017 3:58 AM
2 Abandoned mines and sinkholes 2/8/2017 11:34 AM
3 Terrorism specifically at the nuke plant and how it would affect us 1/11/2017 3:15 AM
Hazardous Materials Incidents
Land Subsidence (Landslides, Sinkholes, etc.)
Nuclear/Radiological Incidents
Severe Weather (Includes thunderstorms, tornadoes, winterstorms, etc.)
Terrorism (Foreign & Domestic)
Wildfire
2 / 30
Region 11 Hazard Mitigation Survey
321

4.17% 5
12.50% 15
6.67% 8
55.00% 66
70.00% 84
30.00% 36
Q2 In the past 10 years, which hazards doyou recall having occurred in yourcommunity? (Check all that apply)
Answered: 120 Skipped: 0
Dam Failure
Drought
Earthquakes
ExtremeTemperatures...
Flooding
HazardousMaterials...
LandSubsidence...
Nuclear/Radiological Incidents
Severe Weather
Terrorism(Foreign &...
Wildfire
Other (pleasespecify)
0% 10% 20% 30% 40% 50% 60% 70% 80% 90% 100%
Answer Choices Responses
Dam Failure
Drought
Earthquakes
Extreme Temperatures (Hot & Cold)
Flooding
Hazardous Materials Incidents
3 / 30
Region 11 Hazard Mitigation Survey
322

45.00% 54
3.33% 4
63.33% 76
2.50% 3
8.33% 10
6.67% 8
Total Respondents: 120
# Other (please specify) Date
1 litter :( 4/6/2017 12:32 AM
2 Heroin and opioid epidemic 3/19/2017 3:58 AM
3 incompetence in Public office, mismanagement of Public assets, causing a large part of the above experiences 3/18/2017 11:59 PM
4 Water crisis 1/30/2017 6:05 AM
5 Power Loss 1/22/2017 5:52 AM
6 I believe we just felt the tremor of an earthquake. 1/19/2017 6:02 AM
7 Only heavy snows and ice storms 1/18/2017 7:13 AM
8 none 1/18/2017 5:58 AM
Land Subsidence (Landslides, Sink holes, etc)
Nuclear/Radiological Incidents
Severe Weather
Terrorism (Foreign & Domestic)
Wildfire
Other (please specify)
4 / 30
Region 11 Hazard Mitigation Survey
323

9.48% 11
42.24% 49
36.21% 42
7.76% 9
4.31% 5
Q3 Think back to a recent hazardoccurrence (any from questions 1 or 2.)How would you rate your community’s
ability to handle the hazard event?Answered: 116 Skipped: 4
Total 116
Excellent
Good
Average
Poor
Horrible
0% 10% 20% 30% 40% 50% 60% 70% 80% 90% 100%
Answer Choices Responses
Excellent
Good
Average
Poor
Horrible
5 / 30
Region 11 Hazard Mitigation Survey
324

62.07% 72
37.93% 44
Q4 During this event did you receiveinformation or warnings from local media
(TV, Radio, Text) or social media(Facebook/Twitter) that was either from orforwarded from your local public officials /
emergency management officials?Answered: 116 Skipped: 4
Total 116
Yes
No
0% 10% 20% 30% 40% 50% 60% 70% 80% 90% 100%
Answer Choices Responses
Yes
No
6 / 30
Region 11 Hazard Mitigation Survey
325

70.83% 51
13.89% 10
22.22% 16
37.50% 27
44.44% 32
11.11% 8
12.50% 9
1.39% 1
Q5 How did you receive this information?Answered: 72 Skipped: 48
Total Respondents: 72
# Other (please specify) Date
1 Fire dispatch 1/12/2017 1:45 AM
Television
Newspaper
Radio
Media website(TV, print o...
Social Media
Text message
Other (pleasespecify)
0% 10% 20% 30% 40% 50% 60% 70% 80% 90% 100%
Answer Choices Responses
Television
Newspaper
Radio
Media website (TV, print or radio)
Social Media
Text message
Other (please specify)
7 / 30
Region 11 Hazard Mitigation Survey
326

56.94% 41
56.94% 41
61.11% 44
5.56% 4
Q6 Was this information timely, accurateand helpful? (choose as many as apply)
Answered: 72 Skipped: 48
Total Respondents: 72
Timely
Accurate
Helpful
None of theabove
0% 10% 20% 30% 40% 50% 60% 70% 80% 90% 100%
Answer Choices Responses
Timely
Accurate
Helpful
None of the above
8 / 30
Region 11 Hazard Mitigation Survey
327

15.52% 18
12.93% 15
2.59% 3
68.97% 80
Q7 Do you / does your household have a72-hour kit? (http://www.ready.gov/build-a-
kit )Answered: 116 Skipped: 4
Total 116
Yes
Yes, but notcomplete
Yes, but outof date
No
0% 10% 20% 30% 40% 50% 60% 70% 80% 90% 100%
Answer Choices Responses
Yes
Yes, but not complete
Yes, but out of date
No
9 / 30
Region 11 Hazard Mitigation Survey
328

93.97% 109
6.03% 7
Q8 Do you have homeowners/rentersinsurance?
Answered: 116 Skipped: 4
Total 116
Yes
No
0% 10% 20% 30% 40% 50% 60% 70% 80% 90% 100%
Answer Choices Responses
Yes
No
10 / 30
Region 11 Hazard Mitigation Survey
329

25.69% 28
61.47% 67
12.84% 14
Q9 Does your homeowner/renters insuranceinclude flood insurance?
Answered: 109 Skipped: 11
Total 109
Yes
No
Don't Know
0% 10% 20% 30% 40% 50% 60% 70% 80% 90% 100%
Answer Choices Responses
Yes
No
Don't Know
11 / 30
Region 11 Hazard Mitigation Survey
330

7.76% 9
47.41% 55
37.93% 44
6.90% 8
Q10 If you live in a Special Flood HazardArea (SFHA), do you have floodplain
insurance?Answered: 116 Skipped: 4
Total 116
Yes
No
Don't know ifI live in an...
Don't know ifI have...
0% 10% 20% 30% 40% 50% 60% 70% 80% 90% 100%
Answer Choices Responses
Yes
No
Don't know if I live in an SFHA
Don't know if I have floodplain insurance
12 / 30
Region 11 Hazard Mitigation Survey
331

65.79% 75
34.21% 39
Q11 Are you willing to spend your moneyon mitigation activities for your home?
Answered: 114 Skipped: 6
Total 114
Yes
No
0% 10% 20% 30% 40% 50% 60% 70% 80% 90% 100%
Answer Choices Responses
Yes
No
13 / 30
Region 11 Hazard Mitigation Survey
332
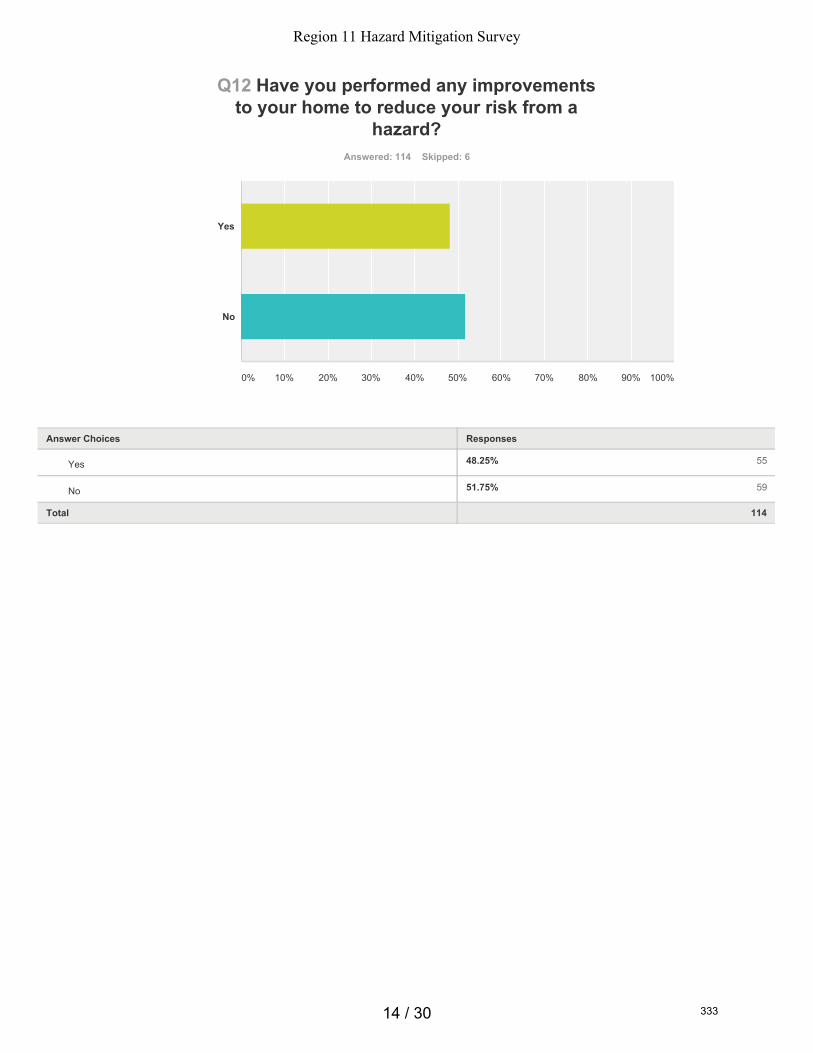
48.25% 55
51.75% 59
Q12 Have you performed any improvementsto your home to reduce your risk from a
hazard?Answered: 114 Skipped: 6
Total 114
Yes
No
0% 10% 20% 30% 40% 50% 60% 70% 80% 90% 100%
Answer Choices Responses
Yes
No
14 / 30
Region 11 Hazard Mitigation Survey
333

3.64% 2
72.73% 40
67.27% 37
34.55% 19
20.00% 11
Q13 Please indicate what improvementsyou have made:Answered: 55 Skipped: 65
Total Respondents: 55
# Other (please specify) Date
1 drainage on property 4/6/2017 12:35 AM
2 reducing all dependency on Public and/or Government support. Failed miserably over the last 20 years, utilities havedegraded to beyond repair in many areas, public officials hiding moist of the problems from us
3/19/2017 12:01 AM
3 Strengthened the foundation. 2/11/2017 9:35 AM
4 Using spring water. 2/9/2017 6:06 AM
5 insulation, fire extinguishers, smoke detectors, outside fuel storage 1/20/2017 12:21 AM
6 made my house safe for the elderly 1/19/2017 10:35 PM
7 Sump Pumps 1/19/2017 12:43 AM
8 Sewer Line cleanup and raised materials in basement for flooding 1/18/2017 10:59 PM
9 Firearm 1/18/2017 5:58 AM
10 bought generator 1/16/2017 4:16 PM
11 Basement drainage/sump pumps, about 15 years ago 1/11/2017 6:31 AM
Elevating thestructure
Treemaintenance/...
Roofrepair/repla...
Clearingunderbrush
Other (pleasespecify)
0% 10% 20% 30% 40% 50% 60% 70% 80% 90% 100%
Answer Choices Responses
Elevating the structure
Tree maintenance/removal
Roof repair/replacement
Clearing underbrush
Other (please specify)
15 / 30
Region 11 Hazard Mitigation Survey
334

Q14 Please provide your ageAnswered: 103 Skipped: 17
18
19
20
21
22
23
24
25
26
27
28
29
30
31
32
33
34
35
36
16 / 30
Region 11 Hazard Mitigation Survey
335

37
38
39
40
41
42
43
44
45
46
47
48
49
50
51
52
53
54
55
56
57
17 / 30
Region 11 Hazard Mitigation Survey
336

58
59
60
61
62
63
64
65
66
67
68
69
70
71
72
73
74
75
76
77
78
18 / 30
Region 11 Hazard Mitigation Survey
337

78
79
80
81
82
83
84
85
86
87
88
89
90
91
92
93
94
95
96
97
98
19 / 30
Region 11 Hazard Mitigation Survey
338

0.97% 1
0.00% 0
0.00% 0
0.00% 0
0.00% 0
0.00% 0
0.00% 0
0.00% 0
0.97% 1
0.00% 0
0.00% 0
1.94% 2
99
100
101
102
103
104
105
106
107
108
109
110
0% 10% 20% 30% 40% 50% 60% 70% 80% 90% 100%
Answer Choices Responses
18
19
20
21
22
23
24
25
26
27
28
29
20 / 30
Region 11 Hazard Mitigation Survey
339

0.97% 1
0.97% 1
1.94% 2
1.94% 2
1.94% 2
0.97% 1
4.85% 5
0.00% 0
1.94% 2
0.00% 0
1.94% 2
1.94% 2
3.88% 4
4.85% 5
2.91% 3
2.91% 3
1.94% 2
0.97% 1
3.88% 4
2.91% 3
0.97% 1
1.94% 2
1.94% 2
0.00% 0
1.94% 2
1.94% 2
3.88% 4
0.97% 1
4.85% 5
0.97% 1
2.91% 3
1.94% 2
0.97% 1
4.85% 5
30
31
32
33
34
35
36
37
38
39
40
41
42
43
44
45
46
47
48
49
50
51
52
53
54
55
56
57
58
59
60
61
62
63
21 / 30
Region 11 Hazard Mitigation Survey
340

4.85% 5
2.91% 3
2.91% 3
1.94% 2
0.97% 1
0.97% 1
1.94% 2
0.97% 1
0.97% 1
0.00% 0
1.94% 2
0.97% 1
0.97% 1
0.00% 0
0.00% 0
0.00% 0
0.00% 0
0.00% 0
0.00% 0
0.00% 0
0.00% 0
0.00% 0
0.00% 0
0.00% 0
0.00% 0
0.00% 0
0.00% 0
0.00% 0
0.00% 0
0.00% 0
0.00% 0
0.00% 0
0.00% 0
0.00% 0
0.00% 0
64
65
66
67
68
69
70
71
72
73
74
75
76
77
78
79
80
81
82
83
84
85
86
87
88
89
90
91
92
93
94
95
96
97
98
22 / 30
Region 11 Hazard Mitigation Survey
341

0.00% 0
0.00% 0
0.00% 0
0.00% 0
0.00% 0
0.00% 0
0.00% 0
0.00% 0
0.00% 0
0.00% 0
0.00% 0
0.00% 0
Total 103
99
100
101
102
103
104
105
106
107
108
109
110
23 / 30
Region 11 Hazard Mitigation Survey
342

56.31% 58
43.69% 45
Q15 GenderAnswered: 103 Skipped: 17
Total 103
Male
Female
0% 10% 20% 30% 40% 50% 60% 70% 80% 90% 100%
Answer Choices Responses
Male
Female
24 / 30
Region 11 Hazard Mitigation Survey
343

1.94% 2
17.48% 18
30.10% 31
22.33% 23
13.59% 14
14.56% 15
Q16 Please indicate your householdincome:
Answered: 103 Skipped: 17
Total 103
<$20,000
$20,001 -$40,000
$40,001 -$60,000
$60,001 -$80,000
$80,001 -$100,000
>$100,000
0% 10% 20% 30% 40% 50% 60% 70% 80% 90% 100%
Answer Choices Responses
<$20,000
$20,001 - $40,000
$40,001 - $60,000
$60,001 - $80,000
$80,001 - $100,000
>$100,000
25 / 30
Region 11 Hazard Mitigation Survey
344

0.00% 0
22.33% 23
31.07% 32
10.68% 11
22.33% 23
13.59% 14
0.00% 0
Q17 Please indicate your level of educationAnswered: 103 Skipped: 17
Total 103
Less than ahigh school...
High schooldiploma/GED
Somecollege/trad...
Associatesdegree
Bachelor’sdegree
Graduate degree
PhD
0% 10% 20% 30% 40% 50% 60% 70% 80% 90% 100%
Answer Choices Responses
Less than a high school diploma
High school diploma/GED
Some college/trade school
Associates degree
Bachelor’s degree
Graduate degree
PhD
26 / 30
Region 11 Hazard Mitigation Survey
345

9.71% 10
0.97% 1
5.83% 6
15.53% 16
0.97% 1
35.92% 37
13.59% 14
15.53% 16
1.94% 2
0.00% 0
Q18 Which municipality do you reside in? (Ifyou live outside of municipal limits, please
select the county you reside in)Answered: 103 Skipped: 17
Beech Bottom
Bethany
Brooke County
Chester
Follansbee
Hancock County
New Cumberland
Weirton
Wellsburg
Windsor Heights
0% 10% 20% 30% 40% 50% 60% 70% 80% 90% 100%
Answer Choices Responses
Beech Bottom
Bethany
Brooke County
Chester
Follansbee
Hancock County
New Cumberland
Weirton
Wellsburg
Windsor Heights
27 / 30
Region 11 Hazard Mitigation Survey
346

Total 103
28 / 30
Region 11 Hazard Mitigation Survey
347

1.94% 2
9.71% 10
9.71% 10
14.56% 15
64.08% 66
Q19 How long have you resided in yourcommunity?
Answered: 103 Skipped: 17
Total 103
Less than ayear
1-5 years
6-10 years
11-20 years
More than 20years
0% 10% 20% 30% 40% 50% 60% 70% 80% 90% 100%
Answer Choices Responses
Less than a year
1-5 years
6-10 years
11-20 years
More than 20 years
29 / 30
Region 11 Hazard Mitigation Survey
348

Q20 Please share any other comments youhave
Answered: 12 Skipped: 108
# Responses Date
1 Just the litter. It's gotta stop. 4/6/2017 12:35 AM
2 Elected officials only spend tax money for their own personal gain and enrichment. 3/19/2017 4:02 AM
3 Complete collapse of Government, no honesty to us, no transparency, terrible management of the public money,infrastructure, small groups controilling everything for personal gain
3/19/2017 12:14 AM
4 Question 8 was poorly written. There should have been an N/A choice for those that are NOT in a flood plain and knowthat fact.
3/7/2017 12:57 PM
5 We must keep our drinking water safe. 2/9/2017 6:07 AM
6 There is an area that has a reoccurring sinkhole in the alley by Beech Bottom Church. 2/8/2017 11:39 AM
7 Very concerned about old culvert in the alley on 2nd street. It runs under my church and runs down and runs underRoute 2. It has sunk before. Water from old coal mines from 49 hill is running through the culvert. This culvert was laidby masonry men back 100 years ago before this village was established.
2/8/2017 11:39 AM
8 Beech Bottom council and members of this small community are always willing to help! 2/7/2017 2:07 PM
9 I live in Ohio and work in Newell 2/6/2017 11:11 PM
10 I work in Hancock County but live in Columbiana County, OH 1/18/2017 7:17 AM
11 what happened to the"heads up Hancock" app 1/16/2017 4:18 PM
12 Downtown Follansbee flooded about 6 months ago. No advance warning to my knowledge. I don't live in the floodarea of Follansbee so I wasn't directly affected.
1/11/2017 3:08 AM
30 / 30
Region 11 Hazard Mitigation Survey
349

350
Region 11 Hazard Mitigation Plan 5.0 Appendices
APPENDIX 3
CITATIONS
AirNav. (2017, March 2). 2G2 - Jefferson County Airpark. Retrieved from
http://www.airnav.com/airport/2G2 AirNav. (2017, March 2). 7G1 - Herron Airport. Retrieved from
http://www.airnav.com/airport/7G1 AirNav. (2017, March 2). KHLG - Wheeling Ohio County Airport. Retrieved from
http://www.airnav.com/airport/khlg American Academy of Pediatrics. (n.d.). Extreme temperatures: heat and cold.
Retrieved March 20, 2017, from https://www.aap.org/en-us/advocacy-and-policy/aap-health-initiatives/Children-and-Disasters/Pages/Extreme-Temperatures-Heat-and-Cold.aspx
American Lung Association. (n.d.). Report card: West Virginia. Retrieved February 22, 2017,
from http://www.lung.org/our-initiatives/healthy-air/sota/city-rankings/states/west-virginia/
American Lung Association. (n.d.). State of the air 2015: Pittsburgh-New Castle-Weirton, PA-
OH-WV. Retrieved February 22, 2017, from http://www.stateoftheair.org/2015/msas/pittsburgh-new-castle-weirton-pa-oh-wv.html#pmann
Army Public Health Center. (n.d.). Cold weather casualties and injuries. Retrieved from
https://phc.amedd.army.mil/topics/discond/cip/Pages/ColdCasualtiesInjuries.aspx BHJ Metropolitan Planning Commission. (n.d.). Regional access mobility partnership.
Retrieved March 21, 2017, from http://www.bhjmpc.org/regional-access-mobility-partnership/
Board, G. (2016, December 19). Three new developments to watch along the Ohio River.
Retrieved from http://wesa.fm/post/three-new-developments-watch-along-ohio-river#stream/0
Brooke County Planning Commission. (2014). Comprehensive plan. Retrieved from Brooke
County website: http://www.brookewv.org/complan2014.pdf Brooke County Sheriff's Department. (n.d.). Brooke County Sheriff's Department pictures.
Retrieved February 1, 2017, from http://www.brookecountysheriff.com/pictures/pics.htm Business Development Corporation. (n.d.). Life in the panhandle. Retrieved May 11, 2017, from
http://www.bhbdc.com/ Business Development Corporation. (n.d.). The business development corporation.
Retrieved April 25, 2017, from http://www.bhbdc.com/

351
Region 11 Hazard Mitigation Plan 5.0 Appendices
Center for Disease Control. (n.d.). Climate change and extreme heat events. Retrieved from https://www.cdc.gov/climateandhealth/pubs/ClimateChangeandExtremeHeatEvents.pdf
City of Weirton. (n.d.). Weirton transit corporation. Retrieved March 21, 2017, from
http://www.cityofweirton.com/221/Weirton-Transit-Corporation Clements, B. W. (2009). Disasters and public health. Burlington, MA: Butterworth-Heinemann. Keller, E. A., & DeVecchio, D. E. (2015). Natural hazards. Earth's processes as hazards,
disasters, and catastrophes (4th ed.). Santa Barbara, CA: Pearson. Crimmins, A., Balbus, J., Gamble, L., Beard, C. B., Bell, J. E., Dodgen, D., … Ziska, L.
(2016). The impacts of climate change on human health in the United States: a scientific assessment. Retrieved from U.S. Global Change Research Program website: https://health2016.globalchange.gov/downloads#climate-change-and-human-health
Drilling Maps. (n.d.). West Virginia map of oil & gas wells. Retrieved November 8, 2016, from http://www.drillingmaps.com/West-Virginia.html#.WK2x2m8rLRZ
Federal Regulatory Commission. (2017, February 2). Order issuing certificates (Docket Nos.
CP15-93-000, CP-15-93-001, CP15-94-000, CP15-96-000). Retrieved from https://www.ferc.gov/CalendarFiles/20170202210009-CP15-93-000a.pdf
FEMA. (2017, February 22). The National Flood Insurance Program. Retrieved March 7, 2017,
from https://www.fema.gov/national-flood-insurance-program Funk, J. (2017, February 22). FirstEnergy Corp. to sell or close its nuclear power plants.
Retrieved from http://www.cleveland.com/business/index.ssf/2017/02/firstenergy_corp_to_sell_or_cl.html
Grothaus, N. (n.d.). Causes of Terrorism. Retrieved March 15, 2017, from
http://handofreason.com/2011/featured/causes-of-terrorism Homefacts.com. (n.d.). West Virginia environmental hazards. Retrieved March 9, 2017, from
http://www.homefacts.com/environmentalhazards/West-Virginia.html Huba, S. (2016, October 15). Chester talks riverfront’s future. Retrieved from
http://www.heraldstaronline.com/news/local-news/2016/10/chester-talks-riverfronts-future/
The Intelligencer. (2014, September 17). Ten years later, effects of flood are still felt. Retrieved
from http://www.theintelligencer.net/news/top-headlines/2014/09/ten-years-later-effects-of-flood-are-still-felt/
JH Consulting. Site visit photos. 6 February, 2017. Li, A., Board, G., & Grant, J. (2017, January 13). Three new developments to watch along the
Ohio River. Retrieved from http://wvpublic.org/post/three-new-developments-watch-along-ohio-river#stream/0
Miller, M. (2016, August 4). Brooke County Commissioner: flooded creek in Follansbee
contained manmade debris. Retrieved from

352
Region 11 Hazard Mitigation Plan 5.0 Appendices
http://www.theintelligencer.net/news/top-headlines/2016/08/brooke-county-commissioner-flooded-creek-in-follansbee-contained-manmade-debris/
National Park Service. (n.d.). Wildfire causes. Retrieved March 20, 2017, from
https://www.nps.gov/fire/wildland-fire/learning-center/fire-in-depth/wildfire-causes.cfm National Pipeline Mapping System. (n.d.). NPMS Public Viewer. Retrieved November 7, 2016,
from https://pvnpms.phmsa.dot.gov/PublicViewer/ Nichols, D. (2015, January 27). Ethane Pipeline Explosion in Brooke County WV Affects PA &
TX. Retrieved from http://www.frackcheckwv.net/2015/01/27/ethane-pipeline-explosion-in-brooke-county-wv-affects-pa-tx/
Noji, E. K. (2000). The public health consequences of disasters. Prehospital and Disaster
Medicine, 21-31. Ohio County Public Library Archives. (2015, March 12). "The Big One" - The flood of 1936:
archiving Wheeling. Retrieved from http://www.archivingwheeling.org/blog/the-big-one Ohl, C. A., & Tapsell, S. (2000). Flooding and human health, the dangers posed are not always
obvious. British Medical Journal, 321, 1167-1168. Retrieved from https://www.ncbi.nlm.nih.gov/pmc/articles/PMC1118941/pdf/1167.pdf
Peterson, M. (2014, June 11). 44 toxic chemicals used in local oil and gas operations, report
says. Retrieved from http://www.scpr.org/news/2014/06/11/44660/report-lists-toxic-chemicals-used-in-local-oil-and/
Pipeline and Hazardous Materials Safety Administration. (n.d.). Pipeline serious incident 20
year trend. Retrieved February 21, 2017, from http://www.phmsa.dot.gov/portal/site/PHMSA
Pipeline and Hazardous Materials Safety Administration. (n.d.). Pipeline significant incident 20
year trend. Retrieved February 21, 2017, from http://www.phmsa.dot.gov/portal/site/PHMSA
Post, J. M. (2009). Killing in the name of other gods. In The mind of the terrorist: the
psychology of terrorism from the IRA to al-Qaeda (pp. 211-212). New York, NY: Palgrave Macmillan.
The Reivew. (2016, March 29). Hancock County brush fires on the rise. Retrieved February 17,
2017, from http://www.reviewonline.com/news/local-news/2016/03/hancock-county-brush-fires-on-the-rise/
Trade and Industry Development. (2017, January 18). Pietro Fiorentini to invest $9M, create up
to 150 Jobs in West Virginia. Retrieved from http://www.tradeandindustrydev.com/industry/manufacturing/news/wv-pietro-fiorentini-invest-9m-create-150-jobs-nor-12442Riobinson, D. Storm Highway. West Virginia Severe Weather FAQ. Retrieved on 17/02/2017 from: http://stormhighway.com/strikedata.php

353
Region 11 Hazard Mitigation Plan 5.0 Appendices
Rubinstein, J. L., & Mahani, A. B. (2015). Myths and facts on wastewater injection, hydraulic fracturing, enhanced oil recovery, and induced seismicity. Seismological Research Letters, 84(4), 1-8. doi:10.1785/0220150067
Scott, W. (2016, July 31). Building collapses into creek causing flooding in Follansbee.
Retrieved from http://www.theintelligencer.net/news/top-headlines/2016/07/building-collapses-into-creek-causing-flood-in-follansbee/
Shoaf, K. L., & Rottman, S. J. (2000). Public health impact f disasters. Australian Journal of
Emergency Management, 58-63. Spencer, N. (2010, December 11). West Virginia chemical plant explosion kills two. Retrieved
from https://www.wsws.org/en/articles/2010/12/acci-d11.html University of Wisconsin Population Health Institute (UWPHI). (2017). County health rankings
and road maps. Retrieved May 23, 2017, from http://www.countyhealthrankings.org/ USDA. Soil Conservation Service.“Buffalo Creek Flood Logan County West Virginia February
26 1972” USCG National Response Center. (n.d.). 2010 to 2016 reports. Retrieved November 29, 2016,
from http://nrc.uscg.mil/ USDHS. (2013). Local mitigation planning handbook. Retrieved from FEMA website:
http://www.fema.gov USGS. (2016, December 2). Droughts: questions and answers. Retrieved March 15, 2017,
from https://water.usgs.gov/edu/qadroughts.html USGS. (2016, December 9). Floods: recurrence intervals and 100-year floods.
Retrieved February 24, 2017, from https://water.usgs.gov/edu/100yearflood.html Washoe County Sheriff's Department. (n.d.). Active assailant preparedness: what you can do.
Retrieved February 24, 2017, from https://www.washoesheriff.com/sub.php?page=active-assailant-preparedness:-what-you-can-do
Weather Underground. (n.d.). Major Hurricane Ivan. Retrieved from
https://www.wunderground.com/hurricane/atlantic/2004/Major-Hurricane-Ivan Weirton Daily Times. (2016, November 1). BDC purchases former Follansbee Steel site for
future redevelopment. Retrieved from http://wvbrownfields.org/bdc-purchases-former-follansbee-steel-site-for-future-redevelopment/
Weirton Museum. (n.d.). Ohio River flood 1936. Retrieved from
http://www.weirtonmuseum.com/1936flood.html Willis, J. A. (2015, January 27). ATEX ethane pipeline explodes, burns in Brooke County, WV.
Retrieved from http://marcellusdrilling.com/2015/01/atex-ethane-pipeline-explodes-burns-in-brooke-county-wv/

354
Region 11 Hazard Mitigation Plan 5.0 Appendices
WHO. (n.d.). Drought, technical hazard sheet. Retrieved March 15, 2017, from http://www.who.int/hac/techguidance/ems/drought/en/
WHO. (n.d.). Flooding and communicable diseases fact sheet. Retrieved March 14, 2017, from
http://www.who.int/hac/techguidance/ems/flood_cds/en/ WHO. (n.d.). Landslides, technical hazard sheet. Retrieved March 15, 2017, from
http://www.who.int/hac/techguidance/ems/landslides/en/ WVAlways.com. (2015, November 15). Weirton brush fire information released, no structures
damaged. Retrieved February 17, 2017, from http://www.wvalways.com/story/30514214/crews-battling-hillside-fire-in-weirton
WV Division of Forestry. (n.d.). Causes of wildfire in West Virginia. Retrieved February 17,
2017, from http://www.wvforestry.com/fire_prev.cfm?menucall=fire WV Geological and Economic Survey. Earthquake epicenters of West Virginia (1824-2016) WV Geological and Economic Survey. Geologic Map of West Virginia WTOV9 Fox. 17 October, 2016. Snapshot from video report on website retrieved from:
http://wtov9.com/news/local/developing-road-slip-in-weirton

355
Region 11 Hazard Mitigation Plan Appendix 4
APPENDIX 4 INACTIVE PROJECTS
This appendix contains all jurisdictions’ inactive (completed, deleted or deferred)
projects from the 2012 Hazard Mitigation Plan.
If the project was completed or deleted in 2012, in 2017 the project was removed.
Some jurisdictions’ 2017 status description of a project is “under Brooke/Hancock
County” which means that the county is responsible for these types of projects as
part of regular activities and therefore is deleted as a jurisdictional project, but not
added to county projects.
Projects that are “Complete with 2017 update” mean that the update of this hazard
mitigation plan will render the project completed.
Many projects listed in this section have become part of normal day-to-day agency
mitigation activities and therefore have been deleted as a one-time project. These
are noted as “Deleted – Ongoing responsibility”.

356
Region 11 Hazard Mitigation Plan Appendix 4
TABLE 5.6 REGION 11 INACTIVE PROJECTS 2012 Completed, Deferred, or Deleted Project 2017 Updated Status
Goals Objective Projects 2012 Status 2017 Status
GOAL 2: Enhance mitigation efforts through public education and engaging in cooperative preparedness efforts
OBJECTIVE 2.1: Educate the public on hazard mitigation and preparedness
PROJECT 2.1.1: Prepare public information campaigns regarding risks and family preparedness for such hazards as thunderstorms, high winds, hailstorms, earthquakes, and winter storms.
New Deferred
GOAL 4: Better identify hazard areas and the vulnerabilities within them
OBJECTIVE 4.1: Fully identify risk areas with respect to the dam failure hazard
PROJECT 4.1.1: Coordinate, as appropriate, with partners throughout the region to identify the location of privately-owned dams as well as contact information for the owners of those structures.
New Deferred

357
Region 11 Hazard Mitigation Plan Appendix 4
TABLE 5.7 BROOKE COUNTY INACTIVE PROJECTS
2012 Completed, Deferred, or Deleted Project 2017 Updated Status
Goals Objective Projects 2012 Status 2017 Status
GOAL 1C: Develop and implement a hazard mitigation planning committee.
OBJECTIVE 1C.1: Involve all stakeholders, governmental organizations, and emergency management personnel in the planning process.
PROJECT 1C.1.1: Identify planning team involved in every aspect of the planning process, in all future endeavors. Ongoing Completed
OBJECTIVE 1C.2: Achieve multi-jurisdictional participation.
PROJECT 1C.2.1: Organize cooperation between the participating municipalities in Brooke County.
Ongoing Completed
OBJECTIVE 1C.3: Establish a core team.
Completed
Deleted – Project purpose unclear.
OBJECTIVE 1C.4: Review current Brooke County Hazard Mitigation Plan
PROJECT 1C.4.1: Review risk assessment, and update accordingly Ongoing Complete with 2017 update
PROJECT 1C.4.2: Review risk rankings and update accordingly Ongoing Complete with 2017 update
OBJECTIVE 1C.5: Perform comprehensive loss estimate calculations.
PROJECT 1C.5.1: Obtain current property value estimates from the Brooke County Assessor
Completed Deleted
PROJECT 1C.5.2: Create geospatial databases that can be used to calculate an accurate loss estimate for future revisions of this plan.
Deferred Deleted - Ongoing
responsibility
PROJECT 1C.5.3: Generate property value estimates from non-residential (commercial, governmental, etc.) structures in the county.
Completed Deleted
PROJECT 1.C.5.4: With obtained data from above, provide losses for each specific hazard. Ongoing Complete with 2017 update
OBJECTIVE 1C.6: Update critical facilities listing and mapping (See GOAL 7 for mapping objectives).
PROJECT 1C.6.1: Work with critical facilities and local entities to create revised listings of critical facilities within the county on a regular basis.
Ongoing Completed
OBJECTIVE 1C.7: Update asset inventory with input from various local governments and private companies.
PROJECT 1C.7.1: Work with all stakeholders to develop comprehensive listings of all assets potentially affected by each hazard.
Ongoing Complete with 2017 update

358
Region 11 Hazard Mitigation Plan Appendix 4
TABLE 5.7 BROOKE COUNTY INACTIVE PROJECTS
2012 Completed, Deferred, or Deleted Project 2017 Updated Status
Goals Objective Projects 2012 Status 2017 Status
Continued OBJECTIVE 1C.8: Update the capabilities assessment.
PROJECT 1C.8.1: Obtain data to support both countywide and local mitigation plans and programs.
Ongoing Delete - not relevant
PROJECT 1C.8.2: Reassess the rating system provided and update, if needed. On-going Delete - not relevant
GOAL 2C: Obtain mitigation strategies from each of the participating local governments.
OBJECTIVE 2C.1: Encourage participation from each jurisdiction in Brooke County.
Ongoing Deleted - Ongoing
responsibility
OBJECTIVE 2C.2: Provide guidance about the preparation of mitigation plans.
Ongoing
Deleted - Ongoing responsibility
GOAL 3C: Develop an implementation strategy.
OBJECTIVE 3C.1: Identify responsible parties, funding sources, and cost estimates.
PROJECT 3C.1.1: Include parties responsible for the monitoring and evaluation of mitigation and other projects in an "after-Action Review" (AAR) process to include an Improvement Plan (IP) with a schedule for implementation and completion.
Ongoing Complete
OBJECTIVE 3C.2: Develop schedule and timeframe for strategy.
Ongoing Delete - project unclear
GOAL 4C: Develop a public outreach program.
OBJECTIVE 4C.1: Prepare an exhaustive list of potential stakeholders.
PROJECT 4C.1.1: Make list available to public, via email and letter. Ongoing Complete
GOAL 5C: Improve upon the protection of citizens of Brooke County from all natural and man-made hazards.
OBJECTIVE 5C.1: Develop and distribute public awareness materials about natural hazard risks, preparedness, and mitigation.
PROJECT 5C.1.3: Utilize the media for the distribution and publication of hazard information. Ongoing Complete
PROJECT 5C.1.5: Ensure that the American Red Cross "Citizens' Disaster course" is held on a frequent basis.
Deleted Deleted

359
Region 11 Hazard Mitigation Plan Appendix 4
TABLE 5.7 BROOKE COUNTY INACTIVE PROJECTS
2012 Completed, Deferred, or Deleted Project 2017 Updated Status
Goals Objective Projects 2012 Status 2017 Status
Continued PROJECT 5C.1.8: Develop an Emergency Public Information (EPI) program that will provide critical information to the general public in the event of an emergency, particularly as it relates to flooding.
Ongoing Complete, using Facebook,
website, app
OBJECTIVE 5C.2: Target owners of properties within identified hazard areas for additional outreach regarding mitigation and disaster preparedness.
PROJECT 5C.2.1: Distribute letters to all property owners in the county regarding potential flood hazards as required for participation in the Community Rating System (CRS).
Deferred Deleted - Ongoing
responsibility
Continued PROJECT 5C.2.2: Hold a local course on the National Flood Insurance Program (NFIP) for realtors, bankers, insurance professionals, and homeowners.
Deferred Deleted - Ongoing
responsibility
PROJECT 5C.2.3: Make the most current Flood Insurance Rate Map (FIRM) data and information available to the general public on an open and accessible basis.
Completed Deleted
OBJECTIVE 5C.3: Evaluate existing shelters to determine adequacy for current and future populations.
PROJECT 5C.3.1: Ensure that all shelters have adequate emergency power resources. Ongoing Complete
PROJECT 5C.3.2: Develop adequate emergency shelter and evacuation plans for animals (domestic pets, livestock, and wildlife).
Ongoing Complete
OBJECTIVE 5C.4: Ensure adequate training and resources for emergency organizations and personnel.
PROJECT 5C.4.1: Teach Community Emergency Response Team (CERT) classes in Brooke County
Completed Deleted
PROJECT 5C.4.2: Increase the number of trained citizen emergency responders. Completed Deleted
GOAL 6C: Reduce the current and future risks from hazards in Brooke County
OBJECTIVE 6C.1: Evaluate and update existing floodplain ordinances to meet or exceed the NFIP standards.
PROJECT 6C.1.1: Work with the municipalities to update all floodplain ordinances adopted prior to 1987.
Completed Deleted – ongoing
responsibility

360
Region 11 Hazard Mitigation Plan Appendix 4
TABLE 5.7 BROOKE COUNTY INACTIVE PROJECTS
2012 Completed, Deferred, or Deleted Project 2017 Updated Status
Goals Objective Projects 2012 Status 2017 Status
GOAL 7C: Improve emergency preparedness in Brooke County and its incorporated municipalities by implementing comprehensive emergency management activities.
OBJECTIVE 7C.1: Improve coordination and communication among disaster response organizations, local, and county governments.
PROJECT 7C.1.1: Utilize the Brooke County Emergency Management Agency (BCEMA) to facilitate communication and coordination between emergency teams in the county.
Completed Deleted
OBJECTIVE 7C.2: Regularly update the Emergency Operations Plan (EOP) for Brooke County.
PROJECT 7C.2.1: Redefine roles, responsibilities, and tasks of emergency response agencies and other tasked organizations, if needed
Ongoing Complete
GOAL 8C: Reduce the potential impact of natural and man-made disasters on private property.
OBJECTIVE 8C.1: Encourage participation in the National Flood Insurance Program (NFIP).
PROJECT 8C.1.1: All local units of government will continue to maintain their membership in the NFIP
Combined with Objective 6C.1
Deleted – ongoing responsibility
PROJECT 8C.1.2: Obtain updated information on the number of NFIP policyholders in Brooke County and its municipalities
Combined with Objective 6C.1
Deleted – ongoing responsibility
PROJECT 8C.1.3: Conduct outreach efforts to educate the public about the NFIP and its requirements
Combined with Objective 6C.1
Deleted – ongoing responsibility
OBJECTIVE 8C.2: Identify all repetitive loss structures throughout the county.
PROJECT 8C.2.1: Collect updated information of the number and location of all repetitive loss properties throughout the county and the municipalities
Completed Deleted – ongoing
responsibility
PROJECT 8C.2.2: Develop a database of information on all repetitive loss properties including maps.
Completed Deleted – ongoing
responsibility
PROJECT 8C.2.3: Identify owners of repetitive loss properties that may be willing to participate in future property acquisition and relocation projects.
On-going Deleted - Ongoing
responsibility

361
Region 11 Hazard Mitigation Plan Appendix 4
TABLE 5.7 BROOKE COUNTY INACTIVE PROJECTS
2012 Completed, Deferred, or Deleted Project 2017 Updated Status
Goals Objective Projects 2012 Status 2017 Status
GOAL 9C: Develop better hazard data for Brooke County and the municipalities.
OBJECTIVE 9C.1: Update flood hazard mapping.
PROJECT 9C.1.1: Work with the Federal Emergency Management Agency (FEMA) and West Virginia Division of Homeland Security and Emergency Management (WVDHSEM) on the Map Modernization Program to improve FIRMs.
Completed Deleted – ongoing
responsibility
PROJECT 9C.1.2: Local planning organizations should delineate the 100-year (base) floodplain on all planning and zoning maps.
Completed Deleted – ongoing
responsibility
OBJECTIVE 9C.5: Improve knowledge of landslide hazard areas and understanding of vulnerability and risk to life and property in these hazard-prone areas.
PROJECT 9C.5.1: Encourage construction and subdivision design that can be applied to steep slopes to reduce the potential adverse impacts from development
Deferred Deleted – ongoing
responsibility
OBJECTIVE 9C.7: Prepare comprehensive listing of special needs populations in Brooke County
Ongoing Complete with 2017 update
GOAL 10C: Reduce flood damages to flood-prone properties and protect the safety of people by encouraging the implementation of flood protection activities.
OBJECTIVE 10C.1: Identify and map all areas and structures located within the 100-year floodplain according to the most recent FIRM data.
PROJECT 10C.1.1: Identify specific structures that are prime subjects for either acquisition or relocation.
Deferred Deleted – ongoing
responsibility
PROJECT 10C.1.2: Segregate all such properties between commercial, residential, industrial, agricultural, recreational, and lther uses.
Deferred Deleted - Ongoing
responsibility
PROJECT 10C.1.5: Develop cost estimates and project budgets for all of the identified properties and the selected strategies.
Ongoing Deleted - Ongoing
responsibility
PROJECT 10C.1.6: Prioritize all acquisition and/or relocation mitigation projects for implementation.
Ongoing Deleted - Ongoing
responsibility

362
Region 11 Hazard Mitigation Plan Appendix 4
TABLE 5.7 BROOKE COUNTY INACTIVE PROJECTS
2012 Completed, Deferred, or Deleted Project 2017 Updated Status
Goals Objective Projects 2012 Status 2017 Status
GOAL 11C: Pursue natural resource protection measures to protect the environment and its people from hazardous events.
OBJECTIVE 11C.1: Encourage all units of local government to enact and enforce appropriate regulations to control erosion and sedimentation.
Deleted Deleted
OBJECTIVE 11C.2: Prepare local wetland and identification maps using information from the National Wetlands Inventory.
PROJECT 11C.2.1: Integrate data into Brooke County's Wetland Inventory.
Deleted Deleted

363
Region 11 Hazard Mitigation Plan Appendix 4
TABLE 5.8 HANCOCK COUNTY INACTIVE PROJECTS
2012 Completed, Deferred, or Deleted Project 2017 Updated Status
Goals Objective Projects 2012 Status 2017 Status
GOAL 1F: Identify strategies to mitigate the negative effects of droughts.
OBJECTIVE 1F.1: Provide water to drought areas.
PROJECT 1F.1.1: procure water buffalos for drinking water for humans Deleted Deleted
PROJECT 1F.1.2: Procure water buffalos for drinking water for animals. Deleted Deleted
PROJECT 1F.1.3: Work with local fire departments to obtain water. Completed Deleted
PROJECT 1F.1.4: Install additional waterlines as long-term strategy. Ongoing
Deleted – no specific information, project unclear.
OBJECTIVE 1F.2: Provide water to drought areas for crops.
PROJECT 1F.2.1: Procure water buffalos for crops. Deleted Deleted
OBJECTIVE 1F.3: Prevent and identify contamination of water systems.
PROJECT 1F.3.1: Identify funding and cost associated with buying water-testing equipment Deleted Deleted
PROJECT 1F.3.2: Identify and work with water treatment facilities in the county to implement testing
Completed Deleted
PROJECT 1F.3.3: Make list of the people who may be able to assist in the prevention of contamination.
Completed Deleted
OBJECTIVE 1F.4: Correlate capital improvement projects for municipal water departments and Public Service Districts (PSDs)
PROJECT 1F.4.1: Assist with funding the cost of water improvement and new construction with water lines and plants.
Deleted Deleted
PROJECT 1F.4.2: Reduce the costs of new water projects. Deleted Deleted
OBJECTIVE 1F.4: Correlate capital improvement projects for municipal water departments and Public Service Districts (PSDs)
PROJECT 1F.4.3: Reduce costs for the water customer.
On-going Deleted - Ongoing
responsibility
PROJECT 1F.4.4: Identify grants for federal funding. On-going Complete with 2017 update

364
Region 11 Hazard Mitigation Plan Appendix 4
TABLE 5.8 HANCOCK COUNTY INACTIVE PROJECTS
2012 Completed, Deferred, or Deleted Project 2017 Updated Status
Goals Objective Projects 2012 Status 2017 Status
Continued OBJECTIVE 1F.5: Connect water departments to allow water to be moved from one jurisdiction to another.
PROJECT 1F.5.1: Identify funding sources to support connectivity. On-going
Deleted - Ongoing responsibility
GOAL 2F: Reduce the loss of life and property during an earthquake by determining probability and evaluating buildings and building codes.
OBJECTIVE 2F.1: Determine the probability of an earthquake.
PROJECT 2F.1.1: Examine the effects of the earthquake in Sharon, PA (5.2 on the Richter Scale) Completed Deleted
PROJECT 2F.1.2: Provide public education via a handout concerning earthquake unpredictability.
On-going Complete with social media
and website updates
OBJECTIVE 2F.2: Evaluate buildings and building codes.
PROJECT 2F.2.1: Identify critical facilities throughout the county. On-going Complete with 2017 update
PROJECT 2F.2.2: Work with other counties and cities to look at establishing responsibilities for building codes.
Deferred Deleted - Ongoing
responsibility
PROJECT 2F.2.3: Involve the state government in a lead agency role to draft laws to force builders to develop contractor and homeowner rules for construction.
Deferred Deleted - Ongoing
responsibility
GOAL 3F: Mitigate, to the extent possible, the negative effects of flooding.
OBJECTIVE 3F.1: Reduce the potential loss of life and property due to flooding.
PROJECT 3F.1.1: Evacuate citizens. On-going Delete - project unclear
OBJECTIVE 3F.2: Prevent an increase in the depth of floodwater.
PROJECT 3F.2.1: Coordinate with partners to establish up-stream monitoring points. Completed Deleted
PROJECT 3F.2.2: Conduct an engineering study to see if flood control can be placed on the Ohio River and small streams.
Deferred Deferred
PROJECT 3F.2.3: Identify funding sources for a warning system. Deferred
Deleted - Ongoing responsibility
OBJECTIVE 3F.3: Clearly identify the 100-year floodplains in Hancock County.
PROJECT 3F.3.1: Partner with the Boy Scouts of America (BSA) to mark the 100-year floodplain.
Deleted Deleted

365
Region 11 Hazard Mitigation Plan Appendix 4
TABLE 5.8 HANCOCK COUNTY INACTIVE PROJECTS
2012 Completed, Deferred, or Deleted Project 2017 Updated Status
Goals Objective Projects 2012 Status 2017 Status
Continued Continued PROJECT 3F.3.2: Educate local developers in Hancock County through maps and flyers developed by the planning committee.
Deferred Deleted - Ongoing
responsibility
GOAL 4F: Lessen the negative effects of land subsidence.
OBJECTIVE 4F.1: Prevent landslides. PROJECT 4F.1.1: Develop long-term funding for a new road versus road maintenance. For example, in a 12-month period, Hancock County could spend $100,000 a month cleaning up landslides ($1M annually in road maintenance vs. a new road at $3M). In three (3) years’ time, Hancock County could spend the same amount of money and solve the problem.
Deferred Deleted - Ongoing
responsibility
PROJECT 4F.1.2: In the short-term, identify ways to re-open roadways after a landslide as quickly as possible.
Deferred Deleted - Ongoing
responsibility
PROJECT 4F.1.3: Collect additional information on loggers, including having them post a cash bond.
Deleted Deleted
PROJECT 4F.1.4: Solicit on-going input from the WV Department of Natural Resources (WVDNR) so that after the loggers start a project, if a problem comes up (e.g., water runoff causing road damage), someone may be able to fix the problem before the trees are cut or sold off.
Deferred Deleted - Ongoing
responsibility
PROJECT 4F.1.5: Access the WVDHSEM or WVDOH funding and/or plans. Deferred
Deleted - Ongoing responsibility
PROJECT 4F.1.6: Identify water paths based on the rain water table. Deferred
Deleted - Ongoing responsibility
PROJECT 4F.1.7: Plant vegetation and trees in areas that are prone to landslide problems.
Deleted Deleted
PROJECT 4F.1.8: Construct steel barricades to prevent landslides. Deferred Deferred

366
Region 11 Hazard Mitigation Plan Appendix 4
TABLE 5.8 HANCOCK COUNTY INACTIVE PROJECTS
2012 Completed, Deferred, or Deleted Project 2017 Updated Status
Goals Objective Projects 2012 Status 2017 Status
Continued Continued PROJECT 4F.1.9: New road and paving projects need to be correlated between the WVDOH and WVDNR.
Deferred Deleted - Ongoing
responsibility
OBJECTIVE 4F.2 Develop a map of detours to use in case of an emergency and inform the public of the alternate routes.
PROJECT 4F.2.1: Work with the WVDOH to install signs on the roadways.
On-going Deleted - Ongoing
responsibility
PROJECT 4F.2.2: Use law enforcement to alleviate the problem on roadway "pinch points".
On-going Deleted – ongoing
responsibility
GOAL 5F: Reduce losses from winter storms.
OBJECTIVE 5F.1: Institute policies to protect life and property when telephones are out of service.
PROJECT 5F.1.2: Estimate cost for a mobile command unit. Completed Delete
Continued PROJECT 5F.1.3: Identify funding for necessary equipment. On-going
Deleted - using alternative methods of
communications
OBJECTIVE 5F.2: Reduce injuries and property damage to the public during winter storms.
PROJECT 5F.2.1: Examine traffic studies that have already been completed to identify if there is a section of roadway that has more snow and ice than any other.
Deleted Deleted
PROJECT 5F.2.2: Assess roadside hazards such as stop signs, telephone poles, sidewalks, etc.
Deleted Deleted
PROJECT 5F.2.3: Be pre-involved in planning new highways throughout the county Deleted Deleted
OBJECTIVE 5F.3: Assess road snow plow conditions (years of service, replacement, enough equipment, etc.)
PROJECT 5F.3.1: Check with the WVDOH for projected replacement of snow plow equipment. Completed Deleted
PROJECT 5F.3.2: Upgrade communications between the WVDOH and 911. Completed Deleted
OBJECTIVE 5F.4: Evaluate and update shelters in the county.
PROJECT 5F.4.1: Update shelters with pet rooms and power heat operated on emergency power systems.
Completed Deleted

367
Region 11 Hazard Mitigation Plan Appendix 4
TABLE 5.8 HANCOCK COUNTY INACTIVE PROJECTS
2012 Completed, Deferred, or Deleted Project 2017 Updated Status
Goals Objective Projects 2012 Status 2017 Status
GOAL 6F: Mitigate the negative effects of severe wind and/or tornadoes.
OBJECTIVE 6F.1: Educate and provide early warning to the public.
PROJECT 6F.1.1: Evaluate if additional publications beyond the "Getting Ready" booklet is necessary.
On-going Deleted – using social
media for public education
PROJECT 6F.1.2: Request an inventory list of the power plant's equipment and available human resources.
Deferred Deleted - Ongoing
responsibility
PROJECT 6F.1.3: Update the power companies' emergency plans. Deferred
Deleted - Ongoing responsibility
PROJECT 6F.1.4: Identify funding for and replacement of sirens and radios. Deleted Deleted
PROJECT 6F.1.5: Designate the Hancock County Office of Emergency Management (HCOEM) as the responsible agency for sirens.
Deleted Deleted
PROJECT 6F.1.6: Utilize early warning devices, such as radios, to update citizens for early warning.
Completed Deleted
PROJECT 6F.1.7: Check electrical companies' plans and equipment. Promote the use of underground cables where possible.
Deferred Deleted - Ongoing
responsibility
OBJECTIVE 6F.2: Improve construction standards to include tornado resistance.
PROJECT 6F.2.1: Evaluate building codes and the use of different building materials, including wood frame versus brick construction, basement versus no basement, and the construction of safe rooms.
Deferred Deleted - Ongoing
responsibility
PROJECT 6F.2.2: Ensure building inspectors are on hand to inspect buildings. Deferred
Deleted - Ongoing responsibility
OBJECTIVE 6F.3: Look at the past history of wind storms in the county.
PROJECT 6F.3.1: Coordinate with the National Weather Service (NWS) regarding access to records of historical wind events.
Deferred Deleted - Ongoing
responsibility
PROJECT 6F.3.2: Mon Power has information available for first responders and the public on problems with high winds.
Deferred Deleted - no project stated

368
Region 11 Hazard Mitigation Plan Appendix 4
TABLE 5.8 HANCOCK COUNTY INACTIVE PROJECTS
2012 Completed, Deferred, or Deleted Project 2017 Updated Status
Goals Objective Projects 2012 Status 2017 Status
GOAL 7F: Reduce losses from wildfires.
OBJECTIVE 7F.1: Prevent wildfires. PROJECT 7F.1.1: Examine wildfires as a weather-related condition. On-going Complete with 2017 update
PROJECT 7F.1.2: Provide public information about campfires. On-going
Deleted - Ongoing responsibility
PROJECT 7F.1.3: Identify ways to get firefighters in wildfire areas to extinguish the fire as quickly as possible.
Deferred Deleted - Ongoing
responsibility
OBJECTIVE 7F.2: Inventory wildfire equipment and replace outdated equipment.
PROJECT 7F.2.1: The HCOEM should send out for an inventory list from the county. Completed Deleted
PROJECT 7F.2.2: Examine human resources versus existing equipment. On-going
Deleted - Ongoing responsibility
OBJECTIVE 7F.3: Install flags at fire departments and/or courthouses to inform the public of wildfire conditions.
PROJECT 7F.3.1: Identify funding resources for the flags and training for the public on their use. On-going
Deleted - Ongoing responsibility
OBJECTIVE 7F.4: Evaluate the cost of human resources required to fight wildfires.
PROJECT 7F.4.1: Obtain records from te fire departments on wildfires. Deferred Deleted
PROJECT 7F.4.2: Study the labor saved versus the labor cost, wildfire and livestock. Deferred Deleted - not a priority
OBJECTIVE 7F.5: Review the history of past wildfires in Hancock County to predict, if possible, the areas that are at risk.
PROJECT 7F.5.1: Predict what may happen if wildfires occur in Hancock County.
Deferred Deleted - Ongoing
responsibility
PROJECT 7F.5.2: Tomlinson Run Park Ranger will help with conditions on ground cover. Deferred Deleted - no project stated
PROJECT 7F.5.3: The NWS can help with weather coverage information regarding the amount of humidity.
Deferred Deleted - no project stated
GOAL 8F: Undertake general mitigation projects.
OBJECTIVE 8F.1: Improve assistance to special populations in Hancock County.
PROJECT 8F.1.1: Identify funding sources to include Weirton in the "special needs card" program.
Completed Deleted

369
Region 11 Hazard Mitigation Plan Appendix 4
TABLE 5.8 HANCOCK COUNTY INACTIVE PROJECTS
2012 Completed, Deferred, or Deleted Project 2017 Updated Status
Goals Objective Projects 2012 Status 2017 Status
OBJECTIVE 8F.2: Improve loss estimation capabilities.
PROJECT 8F.2.1: Improve mapping capabilities. Completed Deleted
PROJECT 8F.2.2: Determine which assets are located in hazard areas. On-going Complete with 2017 update
Continued PROJECT 8F.2.3: Collect content and operational values for critical facilities. On-going Deferred
PROJECT 8F.2.4: Calculate loss estimates based on the formula provided in FEMA's "how-to" guides.
On-going Complete with 2017 update
OBJECTIVE 8F.3: Develop mitigation goals, objectives, and strategies that address dam failures, extreme heat, hailstorms, and technological hazards/hazardous materials.
PROJECT 8F.3.1: Hold additional meetings of the core planning team.
Completed Deleted
PROJECT 8F.3.2: Consider the inclusion of additional agencies in future planning efforts. Completed Deleted

370
Region 11 Hazard Mitigation Plan Appendix 4
TABLE 5.9 BEECH BOTTOM INACTIVE PROJECTS
2012 Completed, Deferred, or Deleted Project 2017 Updated Status
Goals Objective Projects 2012 Status 2017 Status
GOAL 1A: Review and comment on the Brooke County Hazard Mitigation Plan
OBJECTIVE 1A.1: Work with Brooke County Hazard Mitigation Planning Committee to periodically update the plan.
On-going Complete with 2017 update
OBJECTIVE 1A.2: Provide input into mitigation goals of the county, including review of risk rankings, calculation of loss estimates, and production of critical facilities listing.
PROJECT 1A.2.1: Work with the Brooke County Emergency Management Agency (BCEMA) and critical facilities to create revised listings of critical facilities within municipal boundaries.
On-going Deleted – ongoing
responsibility
GOAL 2A: Improve upon the protection of the citizens of Beech Bottom from all natural and man-made hazards.
OBJECTIVE 2A.1: Develop and distribute public awareness materials about natural hazard risks, preparedness, and mitigation.
PROJECT 2A.1.1: Develop an all-hazard information system in the Mayor's Office to provide public information on disasters to citizens.
On-going Deleted – ongoing
responsibility
OBJECTIVE 2A.2: Evaluate existing shelters to determine adequacy for current and future populations.
PROJECT 2A.2.1: Ensure that all current shelters have adequate resources for use as a Mass Care Shelter.
On-going Deleted – ongoing
responsibility
Continued PROJECT 2A.2.2: Establish a protocol for the sharing of annual shelter survey information between the local Red Cross chapter, the BCEMA, and local emergency responders.
On-going Deleted - Under Brooke
County
OBJECTIVE 2A.3: Ensure adequate training and resources for emergency organizations and personnel.
PROJECT 2A.3.1: Establish a Community Emergency Response Team (CERT). On-going
Deleted - Under Brooke County
PROJECT 2A.3.2: Increase the number of trained citizen emergency responders. On-going
Deleted – Under Brooke County
PROJECT 2A.3.3: Conduct National Weather Service Storm Spotter classes. On-going
Deleted - Under Brooke County

371
Region 11 Hazard Mitigation Plan Appendix 4
TABLE 5.9 BEECH BOTTOM INACTIVE PROJECTS
2012 Completed, Deferred, or Deleted Project 2017 Updated Status
Goals Objective Projects 2012 Status 2017 Status
GOAL 3A: Reduce the current and future risks from hazards in Beech Bottom
OBJECTIVE 3A.1: Direct new development away from high hazard areas.
PROJECT 3A.1.1: Review existing regulations to ensure adequacy in reducing the amount of future development in identified hazard areas.
On-going Deleted – ongoing
responsibility
PROJECT 3A.1.2: Review all comprehensive plans to ensure that designated growth areas are not in hazard areas.
On-going Deleted – ongoing
responsibility
PROJECT 3A.1.3: Review all capital improvements plans to ensure that infrastructure improvements are not directed towards hazardous areas.
On-going Deleted – ongoing
responsibility
OBJECTIVE 3A.2: Establish proper land development legislation.
PROJECT 3A.2.1: Establish zoning districts and land use regulations that will allow only appropriate activities and uses in the village's floodplain and flood prone areas.
On-going Deleted – ongoing
responsibility
PROJECT 3A.2.2: Review existing comprehensive plans, land use plans, and planning and zoning ordinances to determine if any revisions are necessary to better protect against hazard damage.
On-going Deleted – ongoing
responsibility
GOAL 4A: Reduce the potential impact of natural and man-made disasters on private property.
OBJECTIVE 4A.1: Identify all repetitive loss structures throughout the county.
PROJECT 4A.1.1: Collect updated information on the number and location of all repetitive loss properties throughout the village. Completed Deleted
PROJECT 4A.1.2: Develop a database of information on all repetitive loss properties including maps.
Deleted Deleted
PROJECT 4A.1.3: Identify owners of repetitive loss properties that may be willing to participate in future property acquisitions and relocation projects.
Deleted Deleted

372
Region 11 Hazard Mitigation Plan Appendix 4
TABLE 5.9 BEECH BOTTOM INACTIVE PROJECTS
2012 Completed, Deferred, or Deleted Project 2017 Updated Status
Goals Objective Projects 2012 Status 2017 Status
GOAL 5A: Develop better hazard data for Beech Bottom.
OBJECTIVE 5A.1: Assess vulnerability of transportation systems and assets located in hazard areas.
PROJECT 5A.1.1: Work with the West Virginia Division of Highways (WVDOH) to identify areas of frequent roadway flooding and develop mitigation strategies.
On-going Deleted – ongoing
responsibility
PROJECT 5A.1.2: Conduct a Hazardous Materials Survey to better understand the nature and extent of hazardous materials risks throughout the village.
On-going Deleted - Under Brooke
County
PROJECT 5A.1.3: Implement the National Fire Protection Agency (NFPA) 704 M System to identify all facilities that store hazardous materials.
On-going Deleted - Under Brooke
County
GOAL 6A: Develop and implement a local hazard mitigation plan.
OBJECTIVE 6A.1: Form a local Hazard Mitigation Planning Committee.
PROJECT 6A.1.1: Contact local stakeholders, including the general public, for input and assistance in developing the local plan.
Completed Deleted
OBJECTIVE 6A.2: Distribute local plans countywide.
Completed Deleted

373
Region 11 Hazard Mitigation Plan Appendix 4
TABLE 5.10 BETHANY INACTIVE PROJECTS
2012 Completed, Deferred, or Deleted Project 2017 Updated Status
Goals Objective Projects 2012 Status 2017 Status
GOAL 1B: Review and comment on the Brooke County Hazard Mitigation Plan.
OBJECTIVE 1B.1: Work with Brooke County Hazard Mitigation Planning Committee to periodically update plan.
On-going Completed with 2017
update
OBJECTIVE 1B.2: Provide input into mitigation goals of the county, including review of risk rankings, calculation of loss estimates, and production of critical facilities listing.
PROJECT 1B.2.1: Work with BCEMA and critical facilities to create revised listings of critical facilities within municipal boundaries. On-going
Deleted – ongoing responsibility
GOAL 2B: Improve upon the protection of the citizens of Bethany from all natural and man-made hazards.
OBJECTIVE 2B.1: Develop and distribute public awareness materials about natural hazard risks, preparedness, and mitigation.
PROJECT 2B.1.1: Develop an all-hazard information system in the Mayor's Office to provide public information on disasters to citizens.
On-going Deleted – ongoing
responsibility
OBJECTIVE 2B.2: Evaluate existing shelters to determine adequacy for current and future populations.
PROJECT 2B.2.1: Ensure that all current shelters have adequate resources for use as a Mass Care Shelter.
On-going Deleted – ongoing
responsibility
PROJECT 2B.2.2: Establish a protocol for the sharing of annual shelter survey information between the local Red Cross chapter, the BCEMA, and the local emergency responders.
On-going Deleted - Under Brooke
County
OBJECTIVE 2B.3: Ensure adequate training and resources for emergency organizations and personnel.
PROJECT 2B.3.1: Establish a Community Emergency Response Team (CERT). On-going
Deleted - Under Brooke County
PROJECT 2B.3.2: Increase the number of trained citizen emergency responders. On-going
Deleted - Under Brooke County
PROJECT 2B.3.3: Conduct National Weather Service Storm Spotter classes. On-going
Deleted - Under Brooke County
GOAL 3B: Reduce the current and future risks from hazards in Bethany.
OBJECTIVE 3B.1: Direct new development away from high hazard areas.
PROJECT 3B.1.1: Review existing regulations to ensure adequacy in reducing the amount of future development in identified hazard areas.
On-going Deleted – ongoing
responsibility
PROJECT 3B.1.2: Review all comprehensive plans to ensure that designated growth areas are not in hazard areas.
On-going Deleted – ongoing
responsibility

374
Region 11 Hazard Mitigation Plan Appendix 4
TABLE 5.10 BETHANY INACTIVE PROJECTS
2012 Completed, Deferred, or Deleted Project 2017 Updated Status
Goals Objective Projects 2012 Status 2017 Status
Continued PROJECT 3B.1.3: Review all capital improvements plans to ensure that infrastructure improvements are not directed towards hazardous areas.
On-going Deleted – ongoing
responsibility
OBJECTIVE 3B.2: Establish proper land development legislation.
PROJECT 3B.2.1: Establish zoning districts and land use regulations that will allow only appropriate activities and uses in the village's floodplain and flood prone areas.
On-going Deleted - Under Brooke
County
Continued PROJECT 3B.2.2: Review existing comprehensive plans, land use plans, and planning and zoning ordinances to determine if any revisions are necessary to better protect against hazard damage.
On-going Deleted – ongoing
responsibility
GOAL 4B: Reduce the potential impact of natural and man-made disasters on private property.
OBJECTIVE 4B.1: Identify all repetitive loss structures throughout the county.
PROJECT 4B.1.1: Collect updated information on the number and location of all repetitive loss properties throughout the village. Completed Deleted
PROJECT 4B.1.2: Develop a database of information on all repetitive loss properties including maps.
Completed Deleted
PROJECT 4B.1.3: Identify owners of repetitive loss properties that may be willing to participate in furure property acquisitions and relocation projects.
Completed Deleted
GOAL 5B: Develop better hazard data for Bethany.
OBJECTIVE 5B.1: Assess vulnerability of transportation systems and assets located in hazard areas.
PROJECT 5B.1.1: Work with the West Virginia Division of Highways (WVDOH) to identify areas of frequent roadway flooding and develop mitigation strategies.
On-going Deleted – ongoing
responsibility
PROJECT 5B.1.2: Conduct a Hazardous Materials Survey to better understand the nature and extent of hazardous materials risks throughout the village.
On-going (5 years)
Deleted - Under Brooke County

375
Region 11 Hazard Mitigation Plan Appendix 4
TABLE 5.10 BETHANY INACTIVE PROJECTS
2012 Completed, Deferred, or Deleted Project 2017 Updated Status
Goals Objective Projects 2012 Status 2017 Status
Continued
Continued PROJECT 5B.1.3: Implement the National Fire Protection Agency (NFPA) 704 M System to identify all facilities that store hazardous materials.
On-going Deleted - Under Brooke
County
GOAL 6B: Develop and implement a local hazard mitigation plan.
OBJECTIVE 6B.1: Form a local Hazard Mitigation Planning Committee.
PROJECT 6B.1.1: Contact local stakeholders, including the general public, for input and assistance in developing the local plan.
Completed Deleted
OBJECTIVE 6B.2: Distribute local plans countywide.
Completed Deleted

376
Region 11 Hazard Mitigation Plan Appendix 4
TABLE 5.11 FOLLANSBEE INACTIVE PROJECTS
2012 Completed, Deferred, or Deleted Project 2017 Updated Status
Goals Objective Projects 2012 Status 2017 Status
GOAL 1E: Review and comment on the Brooke County Hazard Mitigation Plan.
OBJECTIVE 1E.1: Work with Brooke County Hazard Mitigation Planning Committee to periodically update plan.
On-going Complete with 2017 Update
OBJECTIVE 1E.2: Provide input into mitigation goals of the county, including review of risk rankings, calculation of loss estimates, and production of critical facilities listing.
PROJECT 1E.2.1: Work with BCEMA and critical facilities to create revised listings of critical facilities within municipal boundaries. On-going Completed December 2016
GOAL 2E: Improve upon the protection of the citizens of Follansbee from all natural and man-made hazards.
OBJECTIVE 2E.1: Develop and distribute public awareness materials about natural hazard risks, preparedness, and mitigation.
PROJECT 2E.1.1: Develop an all-hazard information system in the Mayor's Office to provide public information on disasters to citizens.
On-going Deleted – ongoing
responsibility
OBJECTIVE 2E.2 Evaluate existing shelters to determine adequacy for current and future populations.
PROJECT 2E.2.1: Ensure that all current shelters have adequate resources for use as a Mass Care Shelter
On-going
Deleted – ongoing responsibility,added
electrical connection for portable generator
PROJECT 2E.2.2: Establish a protocol for the sharing of annual shelter survey information between the local Red Cross chapter, the BCEMA, and local emergency responders.
On-going Deleted - Under Brooke
County
OBJECTIVE 2E.3: Ensure adequate training and resources for emergency organizations and personnel.
PROJECT 2E.3.1: Establish a Community Emergency Response Team (CERT). On-going
Completed. CERT has been established
PROJECT 2E.3.2: Increase the number of trained citizen emergency responders. Ongoing
Completed – CERT program was established.
PROJECT 2E.3.3: Conduct National Weather Service Storm Spotter classes. On-going
Deleted - Under Brooke County
GOAL 3E: Reduce the current and future risks from hazards in Follansbee
OBJECTIVE 3E.1: Direct new development away from high hazard areas.
PROJECT 3E.1.1: Review existing regulations to ensure adequacy in reducing the amount of future development in identified hazard areas.
On-going Deleted – ongoing
responsibility

377
Region 11 Hazard Mitigation Plan Appendix 4
TABLE 5.11 FOLLANSBEE INACTIVE PROJECTS
2012 Completed, Deferred, or Deleted Project 2017 Updated Status
Goals Objective Projects 2012 Status 2017 Status
Continued Continued PROJECT 3E.1.2: Review all comprehensive plans to ensure that designated growth areas are not in hazard areas.
On-going Deleted – ongoing
responsibility
PROJECT 3E.1.3: Review all capital improvements plans to ensure that infrastructure improvements are not directed towards hazardous areas.
On-going Deleted – ongoing
responsibility
OBJECTIVE 3E.2: Establish proper land development legislation.
PROJECT 3E.2.1: Establish zoning districts and land use regulations that will allow only appropriate activities and uses in the village's floodplain and flood prone areas.
On-going Deleted - Under Brooke
County
PROJECT 3E.2.2: Review existing comprehensive plans, land use plans, and planning and zoning ordinances to determine if any revisions are necessary to better protect against hazard damage.
On-going Deleted – ongoing
responsibility
GOAL 4E: Reduce the potential impact of natural and man-made disasters on private property.
OBJECTIVE 4E.1: Identify all repetitive loss structures throughout the county.
PROJECT 4E.1.1: Collect updated information on the number and location of all repetitive loss properties throughout the village.
Completed Deleted
PROJECT 4E.1.2: Develop a database of information on all repetitive loss properties including maps.
Completed Deleted
PROJECT 4E.1.3: Identify owners of repetitive loss properties that may be willing to participate in furure property acquisitions and relocation projects.
Completed Deleted
GOAL 5E: Develop better hazard data for Follansbee
OBJECTIVE 5E.1: Assess vulnerability of transportation systems and assets located in hazard areas.
PROJECT 5E.1.1: Work with the West Virginia Division of Highways (WVDOH) to identify areas of frequent roadway flooding and develop mitigation strategies.
On-going Deleted – ongoing
responsibility

378
Region 11 Hazard Mitigation Plan Appendix 4
TABLE 5.11 FOLLANSBEE INACTIVE PROJECTS
2012 Completed, Deferred, or Deleted Project 2017 Updated Status
Goals Objective Projects 2012 Status 2017 Status
Continued Continued PROJECT 5E.1.2: Conduct a Hazardous Materials Survey to better understand the nature and extent of hazardous materials risks throughout the village.
On-going (5 years)
Deleted - Under Brooke County
PROJECT 5E.1.3: Implement the National Fire Protection Agency (NFPA) 704 M System to identify all facilities that store hazardous materials.
On-going Deleted - Under Brooke
County
GOAL 6E: Develop and implement a local hazard mitigation plan.
OBJECTIVE 6E.1: Form a local Hazard Mitigation Planning Committee.
PROJECT 6E.1.1: Contact local stakeholders, including the general public, for input and assistance in developing the local plan.
Completed Deleted
OBJECTIVE 6E.2: Distribute local plans countywide.
Completed Deleted

379
Region 11 Hazard Mitigation Plan Appendix 4
TABLE 5.12 NEW CUMBERLAND INACTIVE PROJECTS
2012 Completed, Deferred, or Deleted Project 2017 Updated Status
Goals Objective Projects 2012 Status 2017 Status
GOAL 1G: Keep floodwaters out of the City of New Cumberland.
OBJECTIVE 1G.1: Install a floodwall. PROJECT 1G.1.1: Determine if floodwalls are an acceptable strategy in West Virginia. Deleted Deleted
PROJECT 1G.1.2: Assess the cost of building floodwalls. Deleted Deleted
OBJECTIVE 1G.2: Remove homes from the flood area through "buy outs", elevations, or relocations. Get critical facilities out of hazard areas.
PROJECT 1G.2.2: Fire department personnel and city government needs to move to other areas, as State Route (SR) 2 becomes blocked with high water. Fire department and ambulances currently have a hard time reaching victims.
On-going Completed. Moved May 2016 and Revised for
current update
OBJECTIVE 1G.3: Identify an evacuation route out of New Cumberland.
PROJECT 1G.3.1: Explore potential cost sharing between departments for floodplain relocation and the relocation of houses due to the construction of a four (4) lane highway.
Deferred Deleted - not a priority
PROJECT 1G.3.2: Map and identify evacuation routes and develop maps to detour traffic around the flooded area.
Completed Deleted

380
Region 11 Hazard Mitigation Plan Appendix 4
TABLE 5.13 WEIRTON INACTIVE PROJECTS
2012 Completed, Deferred, or Deleted Project 2017 Updated Status
Goals Objective Projects 2012 Status 2017 Status
GOAL 1H:Review and comment on the Brooke County Hazard Mitigation Plan
OBJECTIVE 1H.1: Work with Brooke County Hazard Mitigation Planning Committee to periodically update plan.
On-going Completed with 2017
update
OBJECTIVE 1H.2: Provide input into mitigation goals of the county, including review of risk rankings, calculation of loss estimates, and production of critical facilities listing.
PROJECT 1H.2.1: Work with BCEMA and critical facilities to create revised listings of critical facilities within municipal boundaries. On-going
Deleted – ongoing responsibility
GOAL 2H: Improve upon the protection of the citizens of Weirton from all natural and man-made hazards.
OBJECTIVE 2H.1: Develop and distribute public awareness materials about natural hazards, risks, preparedness, and mitigation.
PROJECT 2H.2.2: Establish a protocol for the sharing of annual shelter survey information between the local Red Cross chapter, the BCEMA, and the local emergency responders.
On-going Deleted - Under Brooke
County
OBJECTIVE 2H.2: Evaluate existing shelters to determine adequacy for current and future populations.
PROJECT 2H.2.1: Ensure that all current shelters have adequate resources for use as a Mass Care Shelter.
On-going Deleted – ongoing
responsibility
PROJECT 2H.2.2: Establish a protocol for the sharing of annual shelter survey information between the local Red Cross chapter, the BCEMA, and the local emergency responders.
On-going Deleted - Under Brooke
County
OBJECTIVE 2H.3: Ensure adequate training and resources for emergency organizations and personnel.
PROJECT 2H.3.3: Conduct National Weather Service Storm Spotter classes. On-going
Deleted - Under Brooke County
GOAL 4H: Reduce the potential impact of natural and man-made disasters on private property.
OBJECTIVE 4H.1: Identify all repetitive loss structures throughout the county.
PROJECT 4H.1.1: Collect updated information on the number and location of all repetitive loss properties throughout the city.
Completed Deleted
PROJECT 4H.1.2: Develop a database of information on all repetitive loss properties including maps.
On-going (5 years)
Deleted – ongoing responsibility
PROJECT 4H.1.3: Identify owners of repetitive loss properties that may be willing to participate in future property acquisitions and relocation projects.
Completed Deleted

381
Region 11 Hazard Mitigation Plan Appendix 4
TABLE 5.13 WEIRTON INACTIVE PROJECTS
2012 Completed, Deferred, or Deleted Project 2017 Updated Status
Goals Objective Projects 2012 Status 2017 Status
GOAL 5H: Develop better hazard data for Weirton.
OBJECTIVE 5H.1: Assess vulnerability of transportation systems and assets located in hazard areas.
PROJECT 5H.1.2: Conduct a Hazardous Materials Survey to better understand the nature and extent of hazardous materials risks throughout the city.
On-going (5years)
Deleted - Under Brooke County
PROJECT 5H.1.3: Implement the National Fire Protection Agency (NFPA) 704 M System to identify all facilities that store hazardous materials.
On-going Deleted - Under Brooke
County
GOAL 6H: Develop and implement a local hazard mitigation plan.
OBJECTIVE 6H.1: Form a local Hazard Mitigation Planning Committee.
PROJECT 6H.1.1: Contact local stakeholders, including the general public, for input and assistance in developing the local plan.
Completed Deleted
OBJECTIVE 6H.2: Distribute local plans countywide.
Completed Deleted

382
Region 11 Hazard Mitigation Plan Appendix 4
TABLE 5.14 WELLSBURG INACTIVE PROJECTS
2012 Completed, Deferred, or Deleted Project 2017 Updated Status
Goals Objective Projects 2012 Status 2017 Status
GOAL 1I: Review and comment on the Brooke County Hazard Mitigation Plan.
OBJECTIVE 1I.1: Work with Brooke County Hazard Mitigation Planning Committee to periodically update plan.
On-going Completed with 2017
Update
OBJECTIVE 1I.2: Provide input into mitigation goals of the county, including review of risk rankings, calculation of loss estimates, and production of critical facilities listing.
PROJECT 1I.2.1: Work with BCEMA and critical facilities to create revised listings of critical facilities within municipal boundaries. On-going
Deleted – ongoing responsibility
GOAL 2I: Improve upon the protection of the citizens of Wellsburg from all natural and man-made hazards.
OBJECTIVE 2I.1: Develop and distribute public awareness materials about natural hazards, risks, preparedness, and mitigation.
PROJECT 2I.1.1: Develop an all-hazard information system in the Mayor's Office to provide public information on disasters to citizens.
On-going Deleted – ongoing
responsibility
OBJECTIVE 2I.2: Evaluate existing shelters to determine adequacy for current and future populations.
PROJECT 2I.2.1: Ensure that all current shelters have adequate resources for use as a Mass Care Shelter.
On-going Deleted – ongoing
responsibility
PROJECT 2I.2.2: Establish a protocol for the sharing of annual shelter survey information between the local Red Cross chapter, the BCEMA, and the local emergency responders.
On-going Deleted - Under Brooke
County
OBJECTIVE 2I.3: Ensure adequate training and resources for emergency organizations and personnel.
PROJECT 2I.3.1: Establish a Community Emergency Response Team (CERT). On-going
Deleted - Under Brooke County
PROJECT 2I.3.3: Conduct National Weather Service Storm Spotter classes. On-going
Deleted - Under Brooke County
GOAL 3I: Reduce the current and future risks from hazards in Wellsburg.
OBJECTIVE 3I.1: Direct new development away from high hazard areas.
PROJECT 3I.1.1: Review existing regulations to ensure adequacy in reducing the amount of future development in identified hazard areas.
On-going Deleted – ongoing
responsibility
PROJECT 3I.1.2: Review all comprehensive plans to ensure that designated growth areas are not in hazard areas.
On-going Deleted – ongoing
responsibility

383
Region 11 Hazard Mitigation Plan Appendix 4
TABLE 5.14 WELLSBURG INACTIVE PROJECTS
2012 Completed, Deferred, or Deleted Project 2017 Updated Status
Goals Objective Projects 2012 Status 2017 Status
Continued Continued PROJECT 3I.1.3: Review all capital improvements plans to ensure that infrastructure improvements are not directed towards hazardous areas.
On-going Deleted – ongoing
responsibility
OBJECTIVE 3I.2: Establish proper land development legislation.
PROJECT 3I.2.1: Establish zoning districts and land use regulations that will allow only appropriate activities and uses in the village's floodplain and flood prone areas.
On-going Deleted - Under Brooke
County
PROJECT 3I.2.2: Review existing comprehensive plans, land use plans, and planning and zoning ordinances to determine if any revisions are necessary to better protect against hazard damage.
On-going Deleted – ongoing
responsibility
GOAL 4I: Reduce the potential impact of natural and man-made disasters on private property.
OBJECTIVE 4I.1: Identify all repetitive loss structures throughout the county.
PROJECT 4I.1.1: Collect updated information on the number and location of all repetitive loss properties throughout the town.
Completed Deleted
PROJECT 4I.1.2: Develop a database of information on all repetitive loss properties including maps.
On-going Deleted – ongoing
responsibility
PROJECT 4I.1.3: Identify owners of repetitive loss properties that may be willing to participate in future property acquisitions and relocation projects.
Completed Deleted
PROJECT 4I.1.4: Continue to research mitigation projects in the Kings Creek area. New Deleted - Not in Wellsburg
PROJECT 4I.1.5: Complete the requirements necessary for participation in the CRS. New Deferred
GOAL 5I: Develop better hazard data for Wellsburg.
OBJECTIVE 5I.1: Assess vulnerability of transportation systems and assets located in hazard areas.
PROJECT 5I.1.1: Work with the West Virginia Division of Highways (WVDOH) to identify areas of frequent roadway flooding and develop mitigation strategies.
On-going Deleted – ongoing
responsibility

384
Region 11 Hazard Mitigation Plan Appendix 4
TABLE 5.14 WELLSBURG INACTIVE PROJECTS
2012 Completed, Deferred, or Deleted Project 2017 Updated Status
Goals Objective Projects 2012 Status 2017 Status
Continued
Continued
PROJECT 5I.1.2: Conduct a Hazardous Materials Survey to better understand the nature and extent of hazardous materials risks throughout the village.
On-going (5 years)
Deleted - Under Brooke County
PROJECT 5I.1.3: Implement the National Fire Protection Agency (NFPA) 704 M System to identify all facilities that store hazardous materials.
On-going Deleted - Under Brooke
County
GOAL 6I: Develop and implement a local hazard mitigation plan.
OBJECTIVE 6I.1: Form a local Hazard Mitigation Planning Committee.
PROJECT 6I.1.1: Contact local stakeholders, including the general public, for input and assistance in developing the local plan.
Completed Deleted
OBJECTIVE 6I.2: Distribute local plans countywide.
Completed Deleted

385
Region 11 Hazard Mitigation Plan Appendix 4
TABLE 5.15 WINDSOR HEIGHTS INACTIVE PROJECTS
2012 Completed, Deferred, or Deleted Project 2017 Updated Status
Goals Objective Projects 2012 Status 2017 Status
GOAL 1J: Review and comment on the Brooke County Hazard Mitigation Plan.
OBJECTIVE 1J.1:Work with Brooke County Hazard Mitigation Planning Committee to periodically update the plan
Ongoing Complete with 2017 update
OBJECTIVE 1J.2: Provide input into mitigation goals of the county, including review of risk rankings, calculation of loss estimates, and production of critical facilities listing.
PROJECT 1J.2.1: Work with BCEMA and critical facilities to create revised listings of critical facilities within municipal boundaries. Ongoing Complete with 2017 update
GOAL 2J: Improve upon the protection of citizens of Windsor Heights from all natural and man-made hazards.
OBJECTIVE 2J.2: Evaluate existing shelters to determine adequacy for current and future populations.
PROJECT 2J.1.2: Ensure that all current shelters have adequate resources for use as a Mass Care Shelter. Ongoing
Deleted – ongoing responsibility
PROJECT 2J.1.2: Establish a protocol for the sharing of annual shelter survey information between the local Red Cross Chapter, the BCEMA, and local emergency responders.
Ongoing Deleted – under Brooke
County
OBJECTIVE 2J.3: Ensure adequate training and resources for emergency organizations and personnel.
PROJECT 2J.3.1: Establish a Community Emergency Response Team (CERT). Ongoing
Deleted – under Brooke County
PROJECT 2J.3.2: Increase the number of trained citizen emergency responders. Ongoing
Deleted – under Brooke County
PROJECT 2J.3.3: Conduct National Weather Service Storm Spotter classes. Ongoing
Deleted – under Brooke County
GOAL 3J: Reduce the current and future risks from hazards in Windsor Heights.
OBJECTIVE 3J.1: Direct new development away from high hazard areas.
PROJECT 3J.1.1: Review existing regulations to ensure adequacy in reducing the amount of future development in identified hazard areas.
Ongoing Deleted – ongoing
responsibility
PROJECT 3J.1.2: Review all comprehensive plans to ensure that designated growth areas are not in hazard areas.
Ongoing Deleted – ongoing
responsibility

386
Region 11 Hazard Mitigation Plan Appendix 4
TABLE 5.15 WINDSOR HEIGHTS INACTIVE PROJECTS
2012 Completed, Deferred, or Deleted Project 2017 Updated Status
Goals Objective Projects 2012 Status 2017 Status
Continued Continued PROJECT 3J.1.3: Review all capital improvements plans to ensure that infrastructure improvements are not directed towards hazardous areas.
Ongoing Deleted – ongoing
responsibility
OBJECTIVE 3J.2: Establish proper land development legislation.
PROJECT 3J.2.1: Establish zoning districts and land use regulations that will allow only appropriate activities and uses in the village’s floodplain and flood prone areas.
Deleted Deleted
PROJECT 3J.2.2: Review existing comprehensive plans, land use plans, and planning and zoning ordinances to determine if any revisions are necessary to better protect against hazard damage
Ongoing Deleted – ongoing
responsibility
GOAL 4J: Reduce the potential impact of natural and man-made disasters on private property.
OBJECTIVE 4J.1: Identify all repetitive loss structures throughout the county.
PROJECT 4J.1.1: Collect updated information on the number and location of all repetitive loss properties throughout the village.
Completed Deleted
PROJECT 4J.1.2: Develop a database of information on all repetitive loss properties including maps.
Deleted Deleted
PROJECT 4J.1.3: Identify owners of repetitive loss properties that may be willing to participate in future property acquisitions and relocation projects.
Completed Deleted
GOAL 5J: Develop better hazard data for Windsor Heights.
OBJECTIVE 5J.1: Assess vulnerability of transportation systems and assets located in hazard areas
PROJECT 5J.1.1 Work with WVDOH to identify areas of frequent roadway flooding and develop mitigation strategies.
Ongoing Compete with 2017 update
PROJECT 5J.1.2: Conduct a Hazardous Materials Survey to better understand the nature and extent of hazardous materials risks throughout the village.
Ongoing Deleted – under Brooke
County
PROJECT 5J.1.3: Implement the National Fire Protection Agency (NFPA) 704 M System to identify all facilities that store hazardous materials.
Ongoing Deleted – under Brooke
County

387
Region 11 Hazard Mitigation Plan Appendix 4
TABLE 5.15 WINDSOR HEIGHTS INACTIVE PROJECTS
2012 Completed, Deferred, or Deleted Project 2017 Updated Status
Goals Objective Projects 2012 Status 2017 Status
GOAL 6J: Develop and implement a local hazard mitigation plan.
OBJECTIVE 6J.1: Form a local Hazard Mitigation Planning Committee.
PROJECT 6J.1.1: Contact local stakeholders, including the general public, for input and assistance in developing the local plan.
Completed Deleted
OBJECTIVE 6J.2: Distribute local plans countywide.
Completed Deleted

Fayette County Source Water Risk Assessment 5.0 Appendices
388
APPENDIX 5
HAZMAT AND HEALTH
TABLE 5.16 INORGANIC CONTAMINANTS FOUND IN GROUNDWATER
Contaminant Sources to groundwater Potential health and other effects
Aluminum Occurs naturally in some rocks and drainage from mines.
Can precipitate out of water after treatment, causing increased turbidity or discolored water.
Antimony Enters environment from natural weathering, industrial production, municipal waste disposal, and manufacturing of flame retardants, ceramics, glass, batteries, fireworks, and explosives.
Decreases longevity, alters blood levels of glucose and cholesterol in laboratory animals exposed at high levels over their lifetime.
Arsenic Enters environment from natural processes, industrial activities, pesticides, and industrial waste, smelting of copper, lead, and zinc ore.
Causes acute and chronic toxicity, liver and kidney damage; decreases blood hemoglobin. A carcinogen.
Barium Occurs naturally in some limestones, sandstones, and soils in the eastern United States.
Can cause a variety of cardiac, gastrointestinal, and neuromuscular effects. Associated with hypertension and cardiotoxicity in animals.
Beryllium Occurs naturally in soils, groundwater, and surface water. Often used in electrical industry equipment and components, nuclear power and space industry. Enters the environment from mining operations, processing plants, and improper waste disposal. Found in low concentrations in rocks, coal, and petroleum.
Causes acute and chronic toxicity; can cause damage to lungs and bones. Possible carcinogen.
Cadmium Found in low concentrations in rocks, coal, and petroleum and enters the groundwater and surface water when dissolved by acidic waters. May enter the environment from industrial discharge, mining waste, metal plating, water pipes, batteries, paints and pigments, plastic stabilizers, and landfill leachate.
Replaces zinc biochemically in the body and causes high blood pressure, liver and kidney damage, and anemia. Destroys testicular tissue and red blood cells. Toxic to aquatic biota.
Chloride May be associated with the presence of sodium in drinking water when present in high concentrations. Often from saltwater intrusion, mineral dissolution, industrial and domestic waste.
Deteriorates plumbing, water heaters, and municipal water-works equipment at high levels. Above secondary maximum contaminant level, taste becomes noticeable
Chromium Enters environment from old mining operations runoff and leaching into groundwater, fossil-fuel combustion, cement-plant emissions, mineral leaching, and waste incineration. Used in metal plating and as a cooling-tower water additive.
Chromium III is a nutritionally essential element. Chromium VI is much more toxic than Chromium III and causes liver and kidney damage, internal hemorrhaging, respiratory damage, dermatitis, and ulcers on the skin at high concentrations.

Fayette County Source Water Risk Assessment 5.0 Appendices
389
TABLE 5.16 INORGANIC CONTAMINANTS FOUND IN GROUNDWATER
Contaminant Sources to groundwater Potential health and other effects
Copper Enters environment from metal plating, industrial and domestic waste, mining, and mineral leaching.
Can cause stomach and intestinal distress, liver and kidney damage, anemia in high doses. Imparts an adverse taste and significant staining to clothes and fixtures. Essential trace element but toxic to plants and algae at moderate levels.
Cyanide Often used in electroplating, steel processing, plastics, synthetic fabrics, and fertilizer production; also from improper waste disposal.
Poisoning is the result of damage to spleen, brain, and liver.
Dissolved solids Occur naturally but also enters environment from man-made sources such as landfill leachate, feedlots, or sewage. A measure of the dissolved "salts" or minerals in the water. May also include some dissolved organic compounds.
May have an influence on the acceptability of water in general. May be indicative of the presence of excess concentrations of specific substances not included in the Safe Water Drinking Act, which would make water objectionable. High concentrations of dissolved solids shorten the life of hot water heaters.
Fluoride Occurs naturally or as an additive to municipal water supplies; widely used in industry.
Decreases incidence of tooth decay but high levels can stain or mottle teeth. Causes crippling bone disorder (calcification of the bones and joints) at very high levels.
Hardness Result of metallic ions dissolved in the water; reported as concentration of calcium carbonate. Calcium carbonate is derived from dissolved limestone or discharges from operating or abandoned mines.
Decreases the lather formation of soap and increases scale formation in hot-water heaters and low-pressure boilers at high levels.
Iron Occurs naturally as a mineral from sediment and rocks or from mining, industrial waste, and corroding metal.
Imparts a bitter astringent taste to water and a brownish color to laundered clothing and plumbing fixtures.
Lead Enters environment from industry, mining, plumbing, gasoline, coal, and as a water additive.
Affects red blood cell chemistry; delays normal physical and mental development in babies and young children. Causes slight deficits in attention span, hearing, and learning in children. Can cause slight increase in blood pressure in some adults. Probable carcinogen.
Manganese Occurs naturally as a mineral from sediment and rocks or from mining and industrial waste.
Causes aesthetic and economic damage, and imparts brownish stains to laundry. Affects taste of water, and causes dark brown or black stains on plumbing fixtures. Relatively non-toxic to animals but toxic to plants at high levels.
Mercury Occurs as an inorganic salt and as organic mercury compounds. Enters the environment from industrial waste, mining, pesticides, coal, electrical equipment (batteries, lamps, and switches), smelting, and fossil-fuel combustion.
Causes acute and chronic toxicity. Targets the kidneys and can cause nervous system disorders.
Nickel Occurs naturally in soils, groundwater, and surface water. Often used in electroplating, stainless steel and alloy products, mining, and refining.
Damages the heart and liver of laboratory animals exposed to large amounts over their lifetime.

Fayette County Source Water Risk Assessment 5.0 Appendices
390
TABLE 5.16 INORGANIC CONTAMINANTS FOUND IN GROUNDWATER
Contaminant Sources to groundwater Potential health and other effects
Nitrate (as nitrogen) Occurs naturally in mineral deposits, soils, seawater, freshwater systems, the atmosphere, and biota. More stable form of combined nitrogen in oxygenated water. Found in the highest levels in groundwater under extensively developed areas. Enters the environment from fertilizer, feedlots, and sewage.
Toxicity results from the body's natural breakdown of nitrate to nitrite. Causes "bluebaby disease," or methemoglobinemia, which threatens oxygen-carrying capacity of the blood.
Nitrite (combined nitrate/nitrite)
Enters environment from fertilizer, sewage, and human or farm-animal waste.
Toxicity results from the body's natural breakdown of nitrate to nitrite. Causes "bluebaby disease," or methemoglobinemia, which threatens oxygen-carrying capacity of the blood.
Selenium Enters environment from naturally occurring geologic sources, sulfur, and coal.
Causes acute and chronic toxic effects in animals--"blind staggers" in cattle. Nutritionally essential element at low doses but toxic at high doses.
Silver Enters environment from ore mining and processing, product fabrication, and disposal. Often used in photography, electric and electronic equipment, sterling and electroplating, alloy, and solder. Because of great economic value of silver, recovery practices are typically used to minimize loss.
Can cause argyria, a blue-gray coloration of the skin, mucous membranes, eyes, and organs in humans and animals with chronic exposure.
Sodium Derived geologically from leaching of surface and underground deposits of salt and decomposition of various minerals. Human activities contribute through de-icing and washing products.
Can be a health risk factor for those individuals on a low-sodium diet.
Sulfate Elevated concentrations may result from saltwater intrusion, mineral dissolution, and domestic or industrial waste.
Forms hard scales on boilers and heat exchangers; can change the taste of water, and has a laxative effect in high doses.
Thallium Enters environment from soils; used in electronics, pharmaceuticals manufacturing, glass, and alloys.
Damages kidneys, liver, brain, and intestines in laboratory animals when given in high doses over their lifetime.
Zinc Found naturally in water, most frequently in areas where it is mined. Enters environment from industrial waste, metal plating, and plumbing, and is a major component of sludge.
Aids in the healing of wounds. Causes no ill health effects except in very high doses. Imparts an undesirable taste to water. Toxic to plants at high levels.

Fayette County Source Water Risk Assessment 5.0 Appendices
391
TABLE 5.17 ORGANIC CONTAMINANTS FOUND IN GROUNDWATER
Contaminant Sources to groundwater Potential health and other effects
Volatile organic compounds
Enter environment when used to make plastics, dyes, rubbers, polishes, solvents, crude oil, insecticides, inks, varnishes, paints, disinfectants, gasoline products, pharmaceuticals, preservatives, spot removers, paint removers, degreasers, and many more.
Can cause cancer and liver damage, anemia, gastrointestinal disorder, skin irritation, blurred vision, exhaustion, weight loss, damage to the nervous system, and respiratory tract irritation.
Pesticides Enter environment as herbicides, insecticides, fungicides, rodenticides, and algaecides.
Cause poisoning, headaches, dizziness, gastrointestinal disturbance, numbness, weakness, and cancer. Destroys nervous system, thyroid, reproductive system, liver, and kidneys.
Plasticizers, chlorinated solvents, benzo[a]pyrene, and dioxin
Used as sealants, linings, solvents, pesticides, plasticizers, components of gasoline, disinfectant, and wood preservative. Enters the environment from improper waste disposal, leaching runoff, leaking storage tank, and industrial runoff.
Cause cancer. Damages nervous and reproductive systems, kidney, stomach, and liver.
TABLE 5.18 MICROBIOLOGICAL CONTAMINANTS FOUND IN GROUNDWATER
Contaminant Sources to groundwater Potential health and other effects
Coliform bacteria Occur naturally in the environment from soils and plants and in the intestines of humans and other warm-blooded animals. Used as an indicator for the presence of pathogenic bacteria, viruses, and parasites from domestic sewage, animal waste, or plant or soil material.
Bacteria, viruses, and parasites can cause polio, cholera, typhoid fever, dysentery, and infectious hepatitis.
TABLE 5.19 PHYSICAL CHARACTERISTICS OF GROUNDWATER
Contaminant Sources to groundwater Potential health and other effects
Turbidity Caused by the presence of suspended matter such as clay, silt, and fine particles of organic and inorganic matter, plankton, and other microscopic organisms. A measure how much light can filter through the water sample.
Objectionable for aesthetic reasons. Indicative of clay or other inert suspended particles in drinking water. May not adversely affect health but may cause need for additional treatment. Following rainfall, variations in groundwater turbidity may be an indicator of surface contamination.
Color Can be caused by decaying leaves, plants, organic matter, copper, iron, and manganese, which may be objectionable. Indicative of large amounts of organic chemicals, inadequate treatment, and high disinfection demand. Potential for production of excess amounts of disinfection byproducts.
Suggests that treatment is needed. No health concerns. Aesthetically unpleasing.

Fayette County Source Water Risk Assessment 5.0 Appendices
392
TABLE 5.19 PHYSICAL CHARACTERISTICS OF GROUNDWATER
Contaminant Sources to groundwater Potential health and other effects
pH Indicates, by numerical expression, the degree to which water is alkaline or acidic. Represented on a scale of 0-14 where 0 is the most acidic, 14 is the most alkaline and 7 is neutral.
High pH causes a bitter taste; water pipes and water-using appliances become encrusted; depresses the effectiveness of the disinfection of chlorine, thereby causing the need for additional chlorine when pH is high. Low-pH water will corrode or dissolve metals and other substances.
Odor Certain odors may be indicative of organic or non-organic contaminants that originate from municipal or industrial waste discharges or from natural sources.
Taste Some substances such as certain organic salts produce a taste without an odor and can be evaluated by a taste test. Many other sensations ascribed to the sense of taste actually are odors, even though the sensation is not noticed until the material is taken into the mouth.
Source: USGS Contaminants Found in Groundwater. Information available at: https://water.usgs.gov/edu/groundwater-contaminants.html

Fayette County Source Water Risk Assessment 5.0 Appendices
393
PETROLEUM CONSTITUENTS IN GROUNDWATER PUBLIC HEALTH FACT SHEET
People can be exposed to chemicals in petroleum products (ex. Gasoline or diesel
fuel) in a number of different ways: through direct skin contact or by breathing, eating or
drinking them.
Sources of these chemicals in groundwater can include underground gasoline
storage tanks, home heating fuel storage tanks, and improper handling or disposal of
gasoline or fuel oil on a property. Private well water can be affected. The Environmental
Protection Agency (EPA) has set Maximum Contaminant Levels (MCL) in drinking water for
many of these chemicals. Information about some of the chemicals that have been found in
groundwater is below:
TABLE 5.20 PETROLEUM CONSTITUENTS IN GROUNDWATER
Chemical Name What is it? MCL (ppb*) How can it affect health?
1,2-Dichloroethane It is a solvent used to remove lead from leaded gasoline. It has also been used to make plastics and vinyl. It has a pleasant smell and sweet taste.
5 ppb If large amounts are inhaled or swallowed, it can cause nervous system, liver and kidney disease in humans. Longer-term exposure to lower amounts has caused kidney disease in animals. While it has not been shown to cause cancer in humans, animals fed large amounts have developed cancer. It has been determined to be a probable human carcinogen.
Benzene It is a colorless liquid with a sweet smell. It is made from petroleum and can be found in gasoline. It is used to make other chemicals.
5 ppb It is not known what health effects might happen after long-term exposure to low levels of benzene in food or water. In laboratory animals, exposure to benzene can cause anemia, depress the immune system and cause cancer. Eating or drinking very high levels of benzene can cause vomiting, stomach irritation, dizziness, sleepiness, seizures, coma or death. People who breathe in high levels of benzene over long periods of time can have problems with their blood and immune systems and are at higher risk for leukemia.
Methyl tertiary butyl ether (MTBE)
It is a gasoline additive intended to reduce gasoline emissions. It has an unpleasant taste and strong turpentine-like odor.
EPA action level is 20 ppb
The EPA has determined that MTBE has a potential to cause hazardous effects in humans. However, there is no scientific evidence to indicate MTBE is a human carcinogen or a serious health threat. Laboratory studies of animals exposed to high doses of MTBE showed stomach irritation, liver and kidney damage, and nervous system effects. Other studies involving rats and mice breathing high levels of MTBE showed an increased risk of kidney and liver cancer.
Naphthalene It is a white solid found in mothballs, tobacco products, wood and petroleum. It is also used in making plastics.
MDE action level is 10 ppb
Eating large amounts can damage red blood cells, causing a severe anemia. Some people of Mediterranean or African origin may be at higher risk for anemia. In animals, cataracts have developed after exposure to high levels of naphthalene. Cancer developed in some laboratory animals that breathed naphthalene every day of their lives. The EPA has determined that it is a possible human carcinogen.

Fayette County Source Water Risk Assessment 5.0 Appendices
394
TABLE 5.20 PETROLEUM CONSTITUENTS IN GROUNDWATER
Chemical Name What is it? MCL (ppb*) How can it affect health?
Tetrachloroethene It is a solvent often used in dry cleaning or degreasing metals. It is also used to make other chemicals. It has a sweet odor.
5 ppb It is not known what health effects might happen after long-term exposure to low levels of tetrachloroethene in food or water. In animals, exposure at high concentrations can damage the liver and kidney and cause liver and kidney cancers. It has been determined to be a probable human carcinogen. People who breathe in high levels of tetrachloroethene can get dizziness, headache, sleepiness, confusion, nausea, unconsciousness or death.
*ppb = parts per billion. The EPA has an action level for MTBE. The Maryland Department of the Environment has set an action level for naphthalene. Source: Agency for Toxic Substances and Disease Registry. Centers for Disease Control and Prevention. Information available at
http://www.atsdr.cdc.gov/toxpro2.html

Fayette County Source Water Risk Assessment 5.0 Appendices
395
EXTREMELY HAZARDOUS SUBSTANCES HEALTH EFFECTS
TABLE 5.21 HEALTH EFFECTS OF EXTREMELY HAZARDOUS SUBSTANCES
Substance Health Hazard
Ammonia Vapors cause irritation of eyes and respiratory tract. Liquid will burn skin and eyes. Poisonous; may be fatal if inhales. Contact may cause burns to skin and eyes. Contact with liquid may cause frostbite.
Chlorine Poisonous; may be fatal if inhaled. Contact may cause burns to skin and eyes. Bronchitis or chronic lung conditions
Hydrochloric acid Inhalation of fumes results in coughing and choking sensation, and irritation of nose and lungs. Liquid causes burns
Hydrogen peroxide Inhalation, ingestion or contact (skin, eyes) with vapor sor substance may cause severe injury, burns or death. Fire may produce irritating, corrosive and/or toxic gases. Runoff from fire control or dilution water may cause pollution
Sulfuric acid Corrosive to all body tissues. Inhalation of vapor may cause serious lung damage. Contact with eyes may result in total loss of vision. Skin contact may produce severe necrosis. Fatal amount for adult: between 1 teaspoonful and one-half ounce of he concentrated chemical. Even a few drops may be fata if the acid gains access to the trachea. Chronic exposure may cause tracheobronchitis, stomatitis, conjunctivitis, and gastritis. Gastric perforation and peritonitis may occur and may be followed by circulatory collapse. Circulatory shock is often the immediate cause of death. Those with chronic respiratory, gastrointestinal, or nervous diseases and any eye and skin diseases are at greater risk.
Source: CAMEO Chemicals database

Fayette County Source Water Risk Assessment 5.0 Appendices
396
APPENDIX 6
NFIP SURVEYS
Each jurisdiction in Region 11 was asked to complete the FEMA National Flood
Insurance Program survey. The results of those surveys are included herein.

397

398

399

400

401

402

NATIONAL FLOOD INSURANCE PROGRAM SURVEY
1
NATIONAL FLOOD INSURANCE PROGRAM (NFIP) SURVEY
JURISDICTION: ______________________________BROOKE COUNTY__________________
1. FLOODPLAIN IDENTIFICATION AND MAPPING
Requirement Recommended Action Yes/No Comments
a. Does the municipality maintain accessible copies of an effective Flood Insurance Rate Map (FIRM)/Digital Flood Insurance Rate Map (DFIRM)? Does the municipality maintain accessible copies of the most recent Flood Insurance Study (FIS)?
Place these documents in the local libraries or make available publicly.
YES
b. Has the municipality adopted the most current DFIRM/FIRM and FIS?
State the date of adoption, if approved.
YES 8-2015
c. Does the municipality support request for map updates?
If yes, state how. YES Through The website
d. Does the municipality share with Federal Emergency Management Agency (FEMA) any new technical or scientific data that could result in map revisions within 6 months of creation or identification of new data?
If yes, specify how. NO
e. Does the municipality provide assistance with local floodplain determinations?
If yes, specify how. YES SITE INSPECTIONS, & WV FLOOD PLAIN TOOLS
f. Does the municipality maintain a record of approved Letters of Map Change?
If yes, specify the responsible office.
NO
403

NATIONAL FLOOD INSURANCE PROGRAM SURVEY
2
2. FLOODPLAIN MANAGEMENT
Requirement Recommended Action Yes/No Comments
a. Has the municipality adopted a compliant floodplain management ordinance that, at a minimum, regulates the following:
If yes, answer questions (1) through (4) below.
YES
(1) Does the municipality issue permits for all proposed development in the Special Flood Hazard Areas (SFHAs)?
If yes, specify the office responsible.
YES EMA PROVIDES THEM WITH THE PROPER PAPERWORK & DOCUMENTS NEEDED
(2) Does the municipality obtain, review, and utilize any Base Flood Elevation (BFE) and floodway data, and/or require BFE data for subdivision proposals and other development proposals larger than 50 lots or 5 acres?
If yes, specify the office responsible.
NO
(3) Does the municipality identify measures to keep all new and substantially improved construction reasonably safe from flooding to or above the BFE, including anchoring, using flood-resistant materials, and designing or locating utilities and service facilities to prevent water damage?
If yes, specify the office responsible.
YES EMERGENCY MANAGEMENT & PUBLIC SERVICE UTILITIES
(4) Does the municipality document and maintain records of elevation data that document lowest floor elevation for new or substantially improved structures?
If yes, specify the office responsible.
YES EMERGENCY MANAGEMENT
b. If a compliant floodplain ordinance was adopted, does the municipality enforce the ordinance by monitoring compliance and taking remedial action to correct violations?
If yes, specify how. YES DO REGULAR INSPECTIONS & ADRESS ANY ISSUES
404

NATIONAL FLOOD INSURANCE PROGRAM SURVEY
3
2. FLOODPLAIN MANAGEMENT
Requirement Recommended Action Yes/No Comments
c. Has the municipality considered adopting activities that extend beyond the minimum requirements? Examples include:
Participation in the Community Rating System
Prohibition of production or storage of chemicals in SFHA
Prohibition of certain types of structures, such as hospitals, nursing homes, and jails in SFHA
Prohibition of certain types of residential housing (manufactured homes) in SFHA
Floodplain ordinances that prohibit any new residential or nonresidential structures in SFHA
If yes, specify activities. NO
3. FLOOD INSURANCE
Requirement Recommended Action Yes/No Comments
a. Does the municipality educate community members about the availability and value of flood insurance?
If yes, specify how. YES THROUGH MEETINGS & SEMINARS
b. Does the municipality inform community property owners about changes to the DFIRM/FIRM that would impact their insurance rates?
If yes, specify how. NO
c. Does the municipality provide general assistance to community members regarding insurance issues?
If yes, specify how. NO
405

406

407

408

409

410

411

412

413

414

415

416

417

418

419

420

421

422

423

Region 11 Hazard Mitigation Plan 5.0 Appendices
424
APPENDIX 7
ADOPTING RESOLUTIONS
Adopting Resolutions will be included following plan approval.
Copyright © 2022 FDOKUMEN