Reduction of measurement uncertainty by experimental design in high-order (double, triple, and...
16
Published in Analytical and Bioanalytical Chemistry (2013) 405:2879–2887 [DOI: 10.1007/s00216-013-6724-5] Received: 30 September 2012 / Revised: 12 December 2012 / Accepted: 11 January 2013 / Published online: 1 February 2013 © Her Majesty the Queen in Right of Canada 2013 REDUCTION OF MEASUREMENT UNCERTAINTY BY EXPERIMENTAL DESIGN IN HIGH- ORDER (DOUBLE, TRIPLE, AND QUADRUPLE) ISOTOPE DILUTION MASS SPECTROMETRY: APPLICATION TO GC-MS MEASUREMENT OF BROMIDE Enea Pagliano a,b , Zoltán Mester a and Juris Meija a, * (a) National Research Council Canada; Ottawa, Ontario K1A 0R6, Canada (b) Scuola Normale Superiore, Piazza dei Cavalieri 7, Pisa 56126, Italy * Corresponding author: [email protected] ABSTRACT Since its introduction a century ago, isotope dilution analysis has played a central role in developments of analytical chemistry. This method has witnessed many elaborations and developments over the years. To date we have single, double and even triple isotope dilution methods. In this manuscript we summarize the conceptual aspects of isotope dilution methods and introduce the quadruple dilution, and the concept of exact-matching triple and quadruple dilutions. The comparison of isotope dilution methods is performed by determination of bromide ions in groundwater using novel ethyl-derivatization chemistry in conjunction with GC/MS. We show that the benefits of higher-order isotope dilution methods are countered with a greater need for careful experimental design of the isotopic blends. Just as for ID 2 MS, ID 3 MS and ID 4 MS perform best when isotope ratio of one sample/spike blend is matched with that of a standard/spike blend (exact-matching). r A r B r AB r A*B SAMPLE +SPIKE SAMPLE SPIKE ID 2 MS ID 3 MS ID 4 MS STANDARD +SPIKE KEYWORDS Isotope dilution analysis, Double dilution, Triple dilution, Quadruple dilution, Exact-matching, Bromide, Triethyloxonium tetrafluoroborate, GC/MS
-
Upload
independent -
Category
Documents
-
view
3 -
download
0
Transcript of Reduction of measurement uncertainty by experimental design in high-order (double, triple, and...

Published in Analytical and Bioanalytical Chemistry (2013) 405:2879–2887 [DOI: 10.1007/s00216-013-6724-5]
Received: 30 September 2012 / Revised: 12 December 2012 / Accepted: 11 January 2013 / Published online: 1 February 2013
© Her Majesty the Queen in Right of Canada 2013
REDUCTION OF MEASUREMENT UNCERTAINTY BY EXPERIMENTAL DESIGN IN HIGH-
ORDER (DOUBLE, TRIPLE, AND QUADRUPLE) ISOTOPE DILUTION MASS
SPECTROMETRY: APPLICATION TO GC-MS MEASUREMENT OF BROMIDE
Enea Paglianoa,b
, Zoltán Mestera and Juris Meija
a,*
(a) National Research Council Canada; Ottawa, Ontario K1A 0R6, Canada
(b) Scuola Normale Superiore, Piazza dei Cavalieri 7, Pisa 56126, Italy
* Corresponding author: [email protected]
ABSTRACT
Since its introduction a century ago, isotope dilution analysis has played a central role in developments of
analytical chemistry. This method has witnessed many elaborations and developments over the years. To
date we have single, double and even triple isotope dilution methods. In this manuscript we summarize the
conceptual aspects of isotope dilution methods and introduce the quadruple dilution, and the concept of
exact-matching triple and quadruple dilutions. The comparison of isotope dilution methods is performed by
determination of bromide ions in groundwater using novel ethyl-derivatization chemistry in conjunction
with GC/MS. We show that the benefits of higher-order isotope dilution methods are countered with a
greater need for careful experimental design of the isotopic blends. Just as for ID2MS, ID
3MS and ID
4MS
perform best when isotope ratio of one sample/spike blend is matched with that of a standard/spike blend
(exact-matching).
rA rBrAB rA*B
SAMPLE+SPIKE
SAMPLE
SPIKE
ID2MS
ID3MS
ID4MS
STANDARD+SPIKE
KEYWORDS
Isotope dilution analysis, Double dilution, Triple dilution, Quadruple dilution, Exact-matching, Bromide,
Triethyloxonium tetrafluoroborate, GC/MS
Pagliano, Meija and Mester / Reduction of measurement uncertainty by experimental design
Published in Analytical and Bioanalytical Chemistry (2013) 405:2879–2887 [DOI: 10.1007/s00216-013-6724-5]
2
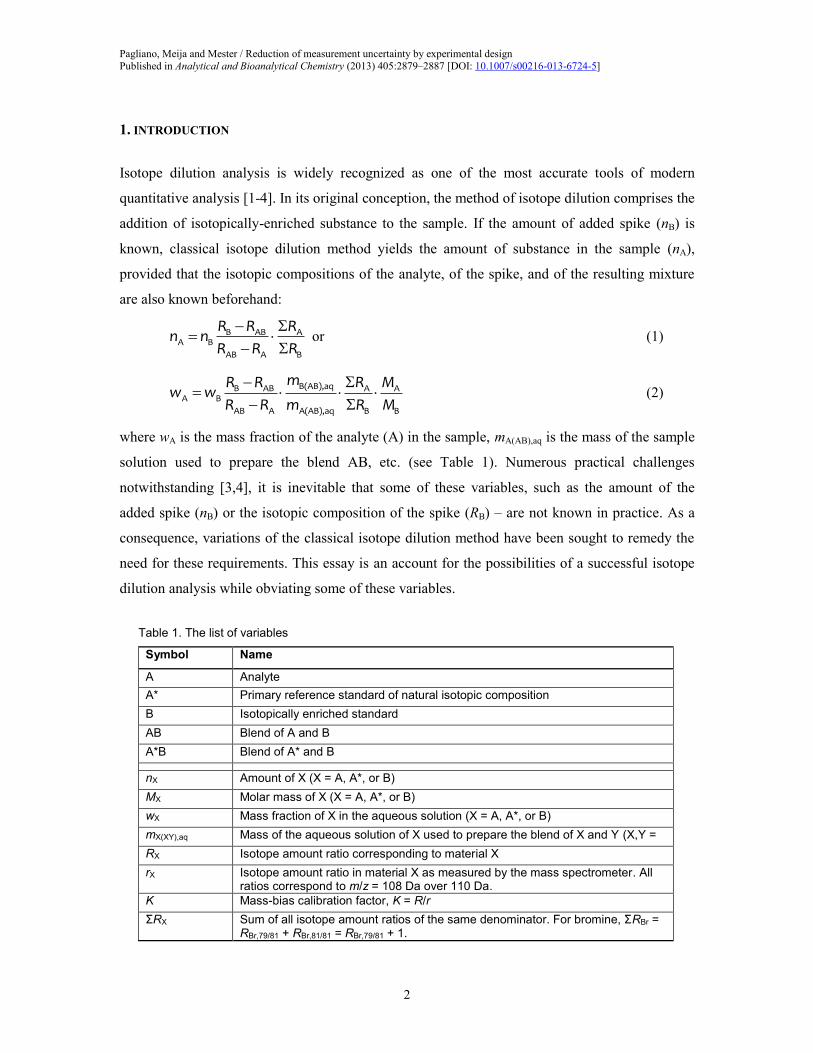
1. INTRODUCTION
Isotope dilution analysis is widely recognized as one of the most accurate tools of modern
quantitative analysis [1-4]. In its original conception, the method of isotope dilution comprises the
addition of isotopically-enriched substance to the sample. If the amount of added spike (nB) is
known, classical isotope dilution method yields the amount of substance in the sample (nA),
provided that the isotopic compositions of the analyte, of the spike, and of the resulting mixture
are also known beforehand:
B AB AA B
AB A B
R R Rn n
R R R
or (1)
B(AB),aqB AB A AA B
AB A A(AB),aq B B
mR R R Mw w
R R m R M
(2)
where wA is the mass fraction of the analyte (A) in the sample, mA(AB),aq is the mass of the sample
solution used to prepare the blend AB, etc. (see Table 1). Numerous practical challenges
notwithstanding [3,4], it is inevitable that some of these variables, such as the amount of the
added spike (nB) or the isotopic composition of the spike (RB) – are not known in practice. As a
consequence, variations of the classical isotope dilution method have been sought to remedy the
need for these requirements. This essay is an account for the possibilities of a successful isotope
dilution analysis while obviating some of these variables.
Table 1. The list of variables
Symbol Name
A Analyte
A* Primary reference standard of natural isotopic composition
B Isotopically enriched standard
AB Blend of A and B
A*B Blend of A* and B
nX Amount of X (X = A, A*, or B)
MX Molar mass of X (X = A, A*, or B)
wX Mass fraction of X in the aqueous solution (X = A, A*, or B)
mX(XY),aq Mass of the aqueous solution of X used to prepare the blend of X and Y (X,Y =
A, A*, or B) RX Isotope amount ratio corresponding to material X
rX Isotope amount ratio in material X as measured by the mass spectrometer. All ratios correspond to m/z = 108 Da over 110 Da.
K Mass-bias calibration factor, K = R/r
ΣRX Sum of all isotope amount ratios of the same denominator. For bromine, ΣRBr = RBr,79/81 + RBr,81/81 = RBr,79/81 + 1.

Pagliano, Meija and Mester / Reduction of measurement uncertainty by experimental design
Published in Analytical and Bioanalytical Chemistry (2013) 405:2879–2887 [DOI: 10.1007/s00216-013-6724-5]
3
In this work we perform the determination of bromide ions in a groundwater reference material,
BCR-611, in order to support a critical discussion of the various isotope dilution quantitation
approaches. For this purpose, triethyloxonium tetrafluoroborate, Et3O+[BF4]
−, derivatization was
used. This chemistry has only recently been introduced in analytical chemistry for the ethylation
of various inorganic anions in aqueous media [5,6]. The ethyl-derivatives of many anions, such as
bromoethane, are volatile, can be sampled in the headspace, and subsequently separated by gas
chromatography, which offers high separation power in comparison to the traditional ion
chromatography approach.
2. VARIATIONS
Because the results of mass spectrometry measurements are almost inevitably biased,
determination of instrumental bias forms an integral part of any mass spectrometric measurement,
including isotope dilution. For the majority of mass spectrometers, the isotope amount ratio
response (ri) is directly proportional to the actual (true) amount ratio (Ri), a feature commonly
known as the linearity of response. Consequently, the measured isotope amount ratio can be
linked to the actual amount ratio as follows:
R K r (3)
Here K is the mass-bias calibration factor. Note, however, that the above expression is not a
definition. Rather, it is a statement which may or may not be valid for a particular measuring
device (see for example [7]).
2.1. Single dilution. In the classical single dilution method the least number of variables is
measured (rAB, in fact) while leaving the maximum number of variables to be known in advance
(wB, RB, RA, K, ΣRA, ΣRB, MA, and MB):
B(AB),aqB AB A AA B
AB A A(AB),aq B B
mR K r R Mw w
K r R m R M
(4)
This is a remarkably simple method for routine laboratories when all the necessary information
regarding the concentration and the isotopic composition of the enriched spike is known
beforehand.

Pagliano, Meija and Mester / Reduction of measurement uncertainty by experimental design
Published in Analytical and Bioanalytical Chemistry (2013) 405:2879–2887 [DOI: 10.1007/s00216-013-6724-5]
4
As the first variation of Eq. 4, the isotopic composition of the spike and that of the analyte can be
measured alongside the isotopic composition of the mixture. Assuming identical mass bias over
the course of measuring ratios rA, rB, and rAB, i.e., RA = KrA, RB = KrB, and RAB = KrAB, the mass
bias correction factor, K, cancels out and we obtain the following:
B(AB),aqB AB A AA B
AB A A(AB),aq B B
mr r R Mw w
r r m R M
(5)
Equation 5 forms the basis of all isotope dilution methods. In addition to the isotope amount ratio
in the blend of the analyte and the spike, rAB, it contains many other variables – wB, rB, rA, ΣRA,
ΣRB, MA, and MB. Some of these variables are hard to establish in practice and they could be
eliminated altogether if additional independent equations – just like the Eq. 5 – can be obtained.
This can be achieved by producing and measuring additional blends AB or A*B. This gives rise
to multiple dilution methods.
2.2. Double dilution. Isotopically-enriched materials are usually available in small quantities thus
making the direct weighing a difficult task. In addition, the chemical purity of enriched materials
is not always on par with primary standards of natural isotopic composition. For these reasons
alone, the mass fraction of the spike in the primary spike solution (wB) is the one variable whose
elimination from the isotope dilution equation is the most sought-after variation of the traditional
isotope dilution. This task is achieved by the coupling of two single isotope dilution
measurements if the same solution of enriched spike (wB) is used for both dilutions.
Consider the single dilution equation (Eq. 2). If the mass fraction of the enriched spike is
measured in the same fashion, i.e., from a “reverse” isotope dilution of the enriched spike (B)
with natural standard (A*), i.e.,
A*(A*B),aqA* A*B B BB A*
A*B B B(A*B),aq A* A*
mR R R Mw w
R R m R M
(6)
This expression, when combined with Eq. 2, yields the complete double dilution equation:
A*(A*B),aq B(AB),aqA* A*B B AB A AA A*
A*B B AB A B(A*B),aq A(AB),aq A* A*
m mR R R R R Mw w
R R R R m m R M
(7)
Evidently, the two variables concerning the enriched spike – i.e., ΣRB and MB – have been
eliminated. This creates the first important advantage of the double spike method. In addition, if
the natural standard (A*) and the analyte (A) are identical in their isotopic composition (i.e., MA =
MA* and RA = RA*), which is usually the case, the double isotope dilution equation simplifies to
the following:

Pagliano, Meija and Mester / Reduction of measurement uncertainty by experimental design
Published in Analytical and Bioanalytical Chemistry (2013) 405:2879–2887 [DOI: 10.1007/s00216-013-6724-5]
5
A*(A*B),aq B(AB),aqA A*B B ABA A*
A*B B AB A B(A*B),aq A(AB),aq
m mR R R Rw w
R R R R m m
(8)
Although it is a common practice to assume that the isotopic composition of the analyte is
identical to that of the natural standard, this might be not the case for elements such as lithium or
lead. The isotope amount ratio n(207
Pb)/n(206
Pb) in common materials, for example, varies in a
10% range. Therefore care must be taken when these elements are determined at high-levels of
precision.
One can distinguish two strategies to apply Eq. 8 in practice. First, if RA, RB, RAB and RA*B are all
measured in the same sequence in order to attain identical mass bias, i.e, Ri = K.ri (i = A, B, AB,
A*B) the mass bias factors cancel-out and the Eq. 8 becomes:
A*(A*B),aq B(AB),aqA A*B B ABA A*
A*B B AB A B(A*B),aq A(AB),aq
m mr r r rw w
r r r r m m
(9)
Alternatively, if the double dilution is designed so that rAB ≈ rA*B by ensuring that
A*(A*B),aq B(AB),aq A*(A*B),aq B(AB),aq
B(A*B),aq A(AB),aq A(AB),aq B(A*B),aq
1m m m m
m m m m
(10)
then Eq. 8 becomes:
A A*w w (11)
In practice, the condition given in Eq. 10 is attained by taking equal amounts of sample and
primary standard, which is prepared to match the estimated mass fraction of the analyte in the
sample, and followed by addition of equal amounts of enriched spike to both of these materials.
This particular experimental design is called exact-matching double isotope dilution [8]. As it is
evident from Eq. 11, the exact-matching creates a situation where mass spectrometer acts as a
null-indicator. Therefore, all isotope ratio measurements become largely irrelevant to the resulting
value of wA when rAB ≈ rA*B. In particular, albeit rB does enter in the double dilution equation (Eq.
9), its precise value does not need to be known.
2.3. Triple dilution. The robustification of double dilution into exact-matching double dilution
obviates the need for the precise value of the isotopic composition of the enriched spike, rB. An
alternative means to avoid direct measurement of enriched spike is the triple isotope dilution
method [9,10]. Here, double dilution is augmented with an additional blend of natural standard
and enriched spike, A*B-2. Consider a set of two double dilution equations (Eq. 9):

Pagliano, Meija and Mester / Reduction of measurement uncertainty by experimental design
Published in Analytical and Bioanalytical Chemistry (2013) 405:2879–2887 [DOI: 10.1007/s00216-013-6724-5]
6
A*(A*B-1),aq B(AB),aqA A*B-1 B ABA A*-1
A*B-1 B AB A B(A*B-1),aq A(AB),aq
m mr r r rw w
r r r r m m
and (12)
A*(A*B-2),aq B(AB),aqA A*B-2 B ABA A*-2
A*B-2 B AB A B(A*B-2),aq A(AB),aq
m mr r r rw w
r r r r m m
(13)
From here it is possible to exclude rB analytically:
B(AB),aqA*-2 1 A*-1 2A
3 A(AB),aq
mm r m rw
r m
(14)
where
A*(A*B- ),aq
A*- A*-
B(A*B- ),aq
i
i i
i
mm w
m and
1 AB A*B-1 A A*B-2
2 AB A*B-2 A*B-1 A
3 AB A A*B-1 A*B-2
( )( ),
( )( ),
( )( ).
r r r r r
r r r r r
r r r r r
We have obtained the model equation for the triple dilution method, which comprises a single
blend of sample and spike (AB), and two blends of (natural) standard and spike (A*B). Note that
triple dilution can also be performed using two blends of AB and one blend of A*B. In such case
we obtain the following triple dilution equation:
A*(A*B),aq3*
A
A-2 1* A-1 2* B(A*B),aq
mrw
m r m r m
(15)
where
A(AB- ),aq
A-
A* B(AB- ),aq
1 i
i
i
mm
w m and
1* A*B AB-1 A AB-2
2* A*B AB-2 AB-1 A
3* A*B A AB-1 AB-2
( )( ),
( )( ),
( )( ).
r r r r r
r r r r r
r r r r r
For sake of brevity, we will not consider this variation of ID3MS in this manuscript.
Similar to the double dilution, triple dilution can be designed so that rAB ≈ rA*B-1. Akin to the
exact-matching double dilution, Eq.14 simplifies to
A A*-1w w (16)
Although the exact-matching triple dilution (Eq. 16) appears identical to the exact-matching
double dilution (Eq. 11), the two approaches differ conceptually. The exact-matching double
dilution eliminates quantity rB numerically via the intelligent experimental design
(robustification) thereby rendering the numerical value of rB largely irrelevant. The exact-
matching triple spike, however, builds from the exact-matching double dilution and, in addition,
eliminates the variable rB analytically via the expanse in the measurement complexity whereby rB
no longer appears as a variable.

Pagliano, Meija and Mester / Reduction of measurement uncertainty by experimental design
Published in Analytical and Bioanalytical Chemistry (2013) 405:2879–2887 [DOI: 10.1007/s00216-013-6724-5]
7
2.4. Quadruple dilution. The isotopic composition of the natural standard (and the analyte) can
further be eliminated from isotope dilution equations using quadruple dilution. Since the natural
isotopic composition of elements is well-known, such a move might appear of no advantage in
atomic spectrometry. However, mass-bias correction in isotope dilution methods can be obviated
only when rA, rB and rAB or rA*B are all measured (as per Eq. 9 and alike). Direct measurement of
rA, however, is not necessarily a straightforward task, especially when minor isotopes are
involved (rA > 50), which is often the case in molecular spectrometry.
Quadruple dilution equation is obtained by combining three double dilution equations. This can
be achieved in three different ways: (1) either by using two blends of AB and two blends of A*B,
(2) by using three blends of AB and one blend of A*B or (3) by using one blend of AB and three
blends of A*B. The latter approach yields the following quadruple dilution equation (assuming
RA = RA*):
B(AB),aqA*-2 A*-3 4 A*-1 A*-3 5 A*-1 A*-2 6
A
A*-1 4 A*-2 5 A*-3 6 A(AB),aq
mm m r m m r m m rw
m r m r m r m
(17)
where
A*(A*B- ),aq
A*- A*-
B(A*B- ),aq
i
i i
i
mm w
m , and
4 AB A*B-1 A*B-2 A*B-3
5 AB A*B-2 A*B-3 A*B-1
6 AB A*B-3 A*B-1 A*B-2
( )( ),
( )( ),
( )( ).
r r r r r
r r r r r
r r r r r
As with the previous variations of isotope dilution, the situation rAB ≈ rA*B-1 leads to the exact-
matching quadruple dilution.
In a sense, the quadruple dilution is the epitome of the indirect measurements. Here, neither the
sample, natural standard, nor the enriched spike is measured directly. Rather, only mixtures are
measured. Such a strategy was also followed in the recent Avogadro project, where atomic weight
of the highly-enriched silicon-28 was established without the direct measurement of the silicon-
28 isotope [11-13].
3. EXPERIMENTAL
3.1. Reagents and materials. Standard solutions of bromide were prepared from a primary
standard solution of bromide (NIST SRM-3184; Gaithersburg MA, USA). Triethyloxonium
tetrafluoroborate was sourced from Fluka (w > 0.97 g/g) and an aqueous solution of ammonia
(Tamapure AA-100; w(NH3) = 0.2 g/g) was used for sample preparation. Groundwater reference

Pagliano, Meija and Mester / Reduction of measurement uncertainty by experimental design
Published in Analytical and Bioanalytical Chemistry (2013) 405:2879–2887 [DOI: 10.1007/s00216-013-6724-5]
8
material certified for bromide content was obtained from the Institute for Reference Materials and
Measurements (BCR-611, Individual identification No. 0049; Geel, Belgium). Isotopically
labeled potassium bromide (K79
Br, x(79
Br) ≥ 0.94 mol/mol) was sourced from Trace Sciences
International (Richmond Hill ON, Canada). MilliQ water was used to prepare all solutions.
3.2. Safety considerations. Triethyloxonium tetrafluoroborate is a strong ethylating agent and
must be handled in a fume-hood with appropriate personal protective equipment avoiding the
exposure to fumes which arise from its decomposition (such as diethyl ether and hydrofluoric
acid). Exposure to this reagent is minimized as it is a nonvolatile crystalline salt, which undergoes
complete hydrolysis within 3 h of its dissolution in water. Et3O+[BF4]
− is highly hygroscopic so it
is important to limit its exposure to moisture. It should be kept in a freezer.
3.3. Sample preparation. A 2 mL volume of the aqueous sample was introduced without
pretreatment into a 4 mL vial and the K79
Br solution was then added. The resulting blend was
alkalized with a 50 µL volume of w(NH3) = 0.2 g/g solution, and then spiked with 100 µL of
freshly prepared aqueous Et3O+[BF4]
− solution (x g of the solid salt dissolved in 1.5x g of water)
in order to convert bromide ions into the ethyl derivative:
Et3O+(aq) + Br
−(aq) → EtBr(g) + Et2O
Sample vials were immediately sealed with a screw-cap containing an unpunctured poly-(tetra-
fluoroethylene)/silicone septum and were kept in the dark at room temperature for at least 3 h
before the analysis. Alkaline conditions (pH = 10) were chosen in order to avoid any potential
interference with bromate ions present as a result of the bromide/bromate disproportionation:
BrO3– + 5Br
− + 6H
+ → 3Br2 + 3H2O
Br– + Br2
→← Br3–
3.4. GC/MS. A Hewlett-Packard 6890 gas chromatograph equipped with a Hewlett-Packard 5973
mass selective detector was operated at constant flow of helium (0.9 mL /min) with a 60 m DB-
624 capillary column (94% dimethyl polysiloxane with 6% cyanopropyl-phenyl groups). A
narrow inlet liner designed for SPME (internal diameter of 0.75 mm) was used and a headspace
volume of 250 µL was injected into the GC/MS. The GC was operated in pulsed split mode (5:1)
with the pulse pressure of 172 kPa for 1 min. The inlet temperature was 100 oC and the oven was
heated as follows: 30 oC for 7 min and then 20
oC/min to 200
oC. Transfer line temperature of 230
oC was chosen. Under these conditions the analyte elutes at 8.8 min (as bromoethane). Working

Pagliano, Meija and Mester / Reduction of measurement uncertainty by experimental design
Published in Analytical and Bioanalytical Chemistry (2013) 405:2879–2887 [DOI: 10.1007/s00216-013-6724-5]
9
conditions of MS were standard (EI at 70 eV, ion source temperature at 250 oC, and quadrupole
temperature at 150 oC). Detection of these two compounds was performed in single-ion
monitoring mode at m/z = 108 and 110 Da (C2H5Br+) with a 100 ms dwell time for each ion.
Background-subtracted peak areas were used as analytical signals. All isotope ratios in this work
are the ratios of m/z = 108 Da over 110 Da, which represent the amount ratio of C2H579
Br over
C2H581
Br. Instrumental limit of detection obtained by processing calibration solutions is w(Br−)DL
= 0.25 ng/g. This value is based on the signal-to-noise ratio calculated from the standard
deviation of the baseline in the proximity of the analyte peak (i.e., detection limit corresponds to a
signal-to-noise-ratio of three). Standard solution of w(Br−) = 2 ng/g gives a signal-to-noise ratio
of 26:1.
4. RESULTS AND DISCUSSION
To demonstrate the kinship between the variants of the isotope dilution methods, we have
performed measurements of bromide ions in a certified groundwater reference material using a
gamut of isotope dilution approaches: (1) double dilution, (2) exact-matching double dilution, (3)
triple dilution, (4) exact-matching triple dilution, (5) quadruple dilution, and (6) exact-matching
quadruple dilution. Figure 1 summarizes the assumptions and the input variables inherent to the
each variant.
Figure 1. Variations of isotope dilution approaches from single to quadruple dilution.

Pagliano, Meija and Mester / Reduction of measurement uncertainty by experimental design
Published in Analytical and Bioanalytical Chemistry (2013) 405:2879–2887 [DOI: 10.1007/s00216-013-6724-5]
10
Variables in white ellipses are determined experimentally (isotope amount ratios and mass-bias
correction coefficient) whereas those in grey ellipses are known (such as the mass fraction of
spike, or primary standard). Successive elimination of difficult-to-measure variables shows the
kinship between all dilution methods: double dilution (ID2MS) eliminates wB, triple dilution
(ID3MS) further eliminates rB, and quadruple dilution (ID
4MS), in turn, eliminates rA. In all cases,
the difficult-to-measure variables are replaced by easy-to-measure isotope amount ratios from
additional standard/spike blends (rA*B-i). All dilutions become exact-matched when rAB = rA*B-1.
In this work we performed 42 isotope amount ratio measurements – of standard (A*) and
enriched spike (B), both in sextuplicate, of three different sample/spike blends (AB), each in
quintuplicate, and of fifteen sample/spike blends (A*B). Figure 2 summarizes the isotopic
composition of the blends used in this work and all experimental data pertinent to the preparation
and measurement of all blends AB and A*B are given in Table 2. In addition, the following
average results were obtained from six replicate measurements over a three-day period: rA* =
1.018(6)k=1 and rB = 15.81(10)k=1, where the numbers in parentheses are the combined standard
uncertainties referred to the last applicable digits of the quoted value. Throughout this work we
assume RA = RA* (and ipso facto MA = MA*).
0.0
2.0
4.0
6.0
8.0
10.0
12.0
14.0
16.0
Iso
top
e am
ou
nt
rati
o, r
BA*B
AB
A1-5
6-10
11-15
1617,1819,20
21,2223
24,2526
2728
29
30
Figure 2. Isotopic composition of blends AB and A*B prepared in this work for determination of
bromide. Throughout this manuscript the individual blends are numbered for reference.

Pagliano, Meija and Mester / Reduction of measurement uncertainty by experimental design
Published in Analytical and Bioanalytical Chemistry (2013) 405:2879–2887 [DOI: 10.1007/s00216-013-6724-5]
11
Table 2. Determination of bromide ions in groundwater sample (BCR-611) using double, triple
and quadruple isotope dilution methods: experimental dataa
Preparation and measurement
of blends AB
Preparation and measurement
of blends A*B
mA(AB),aq/g mB(AB),aq/g rAB/(V/V) mA*(A*B),aq/g mB(A*B),aq/g wA*/(ng/g) rA*B/(V/V)
2.007 58(3) 0.026 60(3) 2.642(1)[1] 2.004 65(3) 0.059 93(3) 25.00(2) 8.681(4)[28]
2.002 70(3) 0.026 65(3) 2.637(1)[2] 2.001 68(3) 0.059 92(3) 49.97(4) 6.143(3)[26]
2.000 57(3) 0.026 62(3) 2.645(1)[3] 2.003 12(3) 0.060 13(3) 97.44(8) 4.125(2)[23]
1.995 64(3) 0.026 66(3) 2.653(1)[4] 2.001 14(3) 0.059 89(3) 199.9(2) 2.764(1)[20]
2.000 00(3) 0.026 67(3) 2.646(1)[5] 2.000 05(3) 0.059 89(3) 400.0(3) 1.945(1)[18]
2.007 86(3) 0.059 52(3) 4.208(2)[6] 2.007 30(3) 0.026 53(3) 25.00(2) 5.736(3)[25]
2.011 24(3) 0.060 02(3) 4.230(2)[7] 2.003 47(3) 0.026 70(3) 49.97(4) 3.849(2)[22]
2.008 81(3) 0.059 90(3) 4.225(2)[8] 1.999 54(3) 0.026 57(3) 97.44(8) 2.620(1)[19]
2.008 11(3) 0.060 02(3) 4.226(2)[9] 2.004 29(3) 0.026 54(3) 199.9(2) 1.849(1)[17]
2.010 44(3) 0.060 15(3) 4.241(2)[10] 1.998 10(3) 0.026 67(3) 400.0(3) 1.450(1)[16]
2.005 03(3) 0.186 18(3) 7.819(4)[11] 1.995 80(3) 0.185 06(3) 25.00(2) 12.354(6)[30]
2.009 22(3) 0.186 24(3) 7.839(4)[12] 1.997 15(3) 0.186 06(3) 49.97(4) 10.257(5)[29]
2.008 41(3) 0.186 80(3) 7.825(4)[13] 1.987 76(3) 0.185 78(3) 97.44(8) 7.827(4)[27]
2.009 94(3) 0.186 12(3) 7.842(4)[14] 1.992 06(3) 0.186 52(3) 199.9(2) 5.398(3)[24]
2.007 27(3) 0.185 62(3) 7.803(4)[15] 1.992 78(3) 0.185 13(3) 400.0(3) 3.555(2)[21]
a. The subscripted numbers in the brackets refer to the numbering of rAB and rA*B values (as per Fig. 2) while
values in parentheses are uncertainties referring to the applicable digits (with coverage factor k = 1).
4.1. Multiplicity in triple and quadruple dilution. Given one blend AB and NA*B blends A*B, the
number of distinct double isotope dilution results is NA*B. Triple dilution, however, considers a
pair of A*B blends and there are C(NA*B,2) = NA*B(NA*B – 1)/2 unique pairs in NA*B blends A*B.
Likewise, quadruple dilution considers a trio of A*B blends and there are C(NA*B,3) = NA*B(NA*B
– 1)(NA*B – 2)/6 unique triplets in NA*B blends A*B. When NA*B ≥ 5, the number of unique triple
and quadruple dilution results exceeds the number of unique double dilution results – a situation
that leads to combinatorial ‘explosion’ in the number of triple and quadruple dilution results as
NA*B increases.
Given the multiplex nature of our experimental design, it is possible to establish a large number
of distinct isotope dilution results. In this dataset of 15 blends AB and 15 blends A*B there are
15×C(15,1) = 225 double dilutions (such as A-1-16-B and A-11-30-B from Fig. 2), 15×C(15,2) =
1575 triple dilutions (such as A-6-19-30), and 15×C(15,3) = 6825 quadruple dilutions (such as 1-
16-26-30). Note that we have only considered dilutions with one blend AB and multiple blends

Pagliano, Meija and Mester / Reduction of measurement uncertainty by experimental design
Published in Analytical and Bioanalytical Chemistry (2013) 405:2879–2887 [DOI: 10.1007/s00216-013-6724-5]
12
A*B. Within these ‘dilutions’ we also distinguish the results of exact-matching dilution. In this
work, we consider a situation as ‘exact-matching’ when |rAB/rA*B – 1| < 3%. Unlike the traditional
‘one-analysis-one-result’ approach, the multiplex strategy provides not only with better
understanding of the uncertainties of the results but also of the robustness of the model equations
themselves.
Due to a large number of possible combinations, the uncertainty of the grand average for each
isotope dilution method was obtained using Monte Carlo simulation [14]. All calculations were
executed with Mathematica 8 (Wolfram Research; Champaign IL, USA).
Not all isotope ratio combinations are good choices. For example, the A-1-20-B combination for
ID2MS yields a two times smaller uncertainty of wA than the A-1-30-B combination owing to the
fact that A-1-20-B design is exact-matched (rAB[1] = rA*B[20]) whereas A-1-30-B is not. For these
reasons, combinations that lead to extremely large uncertainties were omitted. The results of
bromide determination in BCR-611 are shown in Table 3. It is important to stress that the results
quoted in Table 3 represent only the best performance in all isotope dilution methods; inspection
of Figure 4 shows that many results of ID3MS and ID
4MS have extreme uncertainties and this
aspect has to be taken into consideration when IDMS methods are compared with one another.
Table 3. Determination of bromide ions in groundwater sample (BCR-611) using double, triple
and quadruple isotope dilution methods: best results.
Method
wA/(ng/g)a
Number of isotope ratio
combinationsb, N
ID2MS 96.28 ± 0.81k=1 105 (half)
ID3MS 96.25 ± 0.76k=1 735 (half)
ID4MS 96.21 ± 0.76k=1 3193 (half)
ID2=
MS 96.25 ± 0.53k=1 10 (most)
ID3=
MS 96.23 ± 0.43k=1 94 (most)
ID4=
MS 96.28 ± 0.42k=1 435 (most)
Certified value 93(4)k=2 n/a
a. Uncertainty of the results is obtained from Monte Carlo simulations whereby uncertainty (i.e., normal
distribution with a half-width equal to the uncertainty of the corresponding variable) was added to all
appropriate variables, i.e., rAB, rA*B, rA, rB, wB, wA*, mA(AB),aq, mB(AB),aq, mA*(A*B),aq, and mB(A*B),aq. Number of Monte
Carlo simulations is 1000×N (ID2=
MS) and 100×N (ID2MS, ID
3=MS, ID
4=MS), and 30×N (ID
3MS, ID
4MS)
where N is the number of isotope ratio combinations used.
b. Number of unique combinations used to calculate the grand-average of wA. For example, A-3-23-B (see
Fig. 2) is one of the fifteen ID2=
MS combinations. “Half” refers to all results with uncertainty below the
median value (this corresponds to results displayed in the right-half of all plots of Fig. 4). “Most” refers to the
majority of combinations with few isotope ratio combinations omitted due to large uncertainty.

Pagliano, Meija and Mester / Reduction of measurement uncertainty by experimental design
Published in Analytical and Bioanalytical Chemistry (2013) 405:2879–2887 [DOI: 10.1007/s00216-013-6724-5]
13
4.2. Isotopic composition of spike. In 1994 Henrion introduced double-exact matching isotope
dilution concluding that “for [this] method to work it is not necessary to exactly know the isotopic
pattern or concentration of the spike” [8]. This statement is evident from Eq. 11. In practice,
however, the matching of rAB and rA*B can be achieved only to a certain degree. In line with the
analysis of Milton and Wielgosz [15], Figure 3 shows the consequence of choosing various values
for rB in Eq. 9 when matching is not exact. This demonstrates the important role of exact-
matching in eliminating the need for the precise value of rB.
Figure 3. Unlike in double dilution (ID2MS, grey lines), it is not necessary to know the precise
value of isotopic composition of spike in exact-matching double dilution (ID2=
MS, black line).
Note that the crossing of all three curves corresponds to the correct value of rB.
Here the open circles correspond to ID2MS with 10-15% mismatch between rAB and rA*B (rAB =
4.208–4.230, rA*B = 3.555 and rAB = 7.803–7.842, rA*B = 8.681) whereas black diamonds are the
average of all exact-matching combinations.
4.3. Robustness of the dilution methods. Consider a set of isotope amount ratios from a single
mixture of sample and spike (AB) and two mixtures of standard and spike (A*B-1 and A*B-2).
This yields a single result of triple dilution (provided that rA is also measured), or two results of
double dilution (given rA and rB):
(ID2MS) rA-rAB-rA*B-1-rB and rA-rAB-rA*B-2-rB
(ID3MS) rA-rAB-rA*B-1-rA*B-2
The question arises: is it better, in general, to subject the obtained dataset to a single ID3MS
equation or two ID2MS equations? The same question can be formulated with quadruple dilution
in play. To answer this question, all possible combinations of isotope amount ratios were selected

Pagliano, Meija and Mester / Reduction of measurement uncertainty by experimental design
Published in Analytical and Bioanalytical Chemistry (2013) 405:2879–2887 [DOI: 10.1007/s00216-013-6724-5]
14
for double, triple and quadruple dilutions using the dataset in Table 2. Then, the mass fraction of
bromide was calculated for each combination along with the corresponding uncertainty. Results
are shown in Figure 4.
Figure 4. Robustness of isotope dilution methods.
Mass fraction of bromide in BCR-611 was calculated for every possible isotope amount ratio
combination from dataset of Table 2. This means 210 combinations for ID2MS, 15 for ID
2=MS,
2940 for ID3MS, and so forth. The resulting mass fractions of bromide (blue for ID
2MS, ID
3MS,
ID4MS and black for ID
2=MS, ID
3=MS, ID
4=MS) are ordered by their respective uncertainties,
which were calculated using Monte Carlo simulations.
It is clear from these results that triple and quadruple dilutions can yield results with large
uncertainty. On the contrary, double dilution is considerably more robust, and so are all methods
that implement exact-matching. Such a conclusion is not surprising and can be explained.
For single isotope dilution to work, rA and rB need to different from rAB. In particular, the
optimum conditions are reached when rAB is the geometric average between rA and rB [15,16].
Same applies to rA*B in double dilution. In triple dilution, however, an additional condition for the
isotope amount ratio of blends arises: rA*B-1 and rA*B-2 must not coincide since Eq. 14 becomes
indeterminate when rA*B-1 = rA*B-2. Consequently, if rA*B-1 ≈ rA*B-2 Eq. 14 leads to large
uncertainty in wA. Likewise, quadruple dilution experiments must be designed so to avoid rA*B-1 =
rA*B-2 = rA*B-3. Although these examples are trivial, they illustrate the great importance of
experimental design in triple and quadruple dilutions. A schematic atlas of possible experimental
designs for various isotope dilution methods is given in Figure 5. As an alternative to exact-
matching designs, lowest measurement uncertainty is achieved when the isotopic composition of
the sample/spike blend (rAB) is bracketed with the isotopic compositions of standard/spike blends
(rA*B-i) as shown in Fig. 5 for ID3MS and ID
4MS.

Pagliano, Meija and Mester / Reduction of measurement uncertainty by experimental design
Published in Analytical and Bioanalytical Chemistry (2013) 405:2879–2887 [DOI: 10.1007/s00216-013-6724-5]
15
Figure 5. Atlas of possible experimental designs for isotope dilution methods. For ID3MS to
work rA*B-1 ≠ rA*B-2, and for ID4MS to work, rA*B-1 ≠ rA*B-2 ≠ rA*B-3.
5. CONCLUSIONS
Variables that are most difficult to assess in isotope dilution practice are the mass fraction of
enriched spike (wB), isotopic composition of spike (rB) and analyte (rA). Variations of the classical
single isotope dilution method have been sought to avoid direct measurements of these variables.
ID2MS avoids direct measurement of wB, ID
3MS avoids direct measurement of wB and rB, and
ID4MS furthers the elimination of wB, rB and rA. However, the robustness of isotope dilution
methods decreases significantly with the rise in the order of dilution, thus placing significant
emphasis on suitable experimental design. Consequently, ID3MS or ID
4MS methods can yield
poor-precision results when sample/spike blends are not chosen properly whereas the exact-
matching design has proven to yield robust and precise results in all variants of IDMS.

Pagliano, Meija and Mester / Reduction of measurement uncertainty by experimental design
Published in Analytical and Bioanalytical Chemistry (2013) 405:2879–2887 [DOI: 10.1007/s00216-013-6724-5]
16
6. REFERENCES
[1] Heumann KG (1992) Mass Spectrom Rev 11: 41–67
[2] Roth E (1997) Pure Appl Chem 69: 1753–1828
[3] Meija J, Mester Z (2008) Anal Chim Acta 607:115-125
[4] Rodriguez-Gonzalez P, Marchante-Gayon JM, Garcia Alonso JI, Sanz-Medel A (2005)
Spectrochim Acta B 60: 151–207
[5] D’Ulivo A, Pagliano E, Onor M, Pitzalis E, Zamboni R (2009) Anal Chem 81:6399-6406
[6] Pagliano E, Meija J, Sturgeon RE, Mester Z, D’Ulivo A (2012) Anal Chem 84:2592-2596
[7] Ouerdane L, Meija J, Bakirdere S, Yang L, Mester Z (2012) Anal Chem 84: 3958–3964
[8] Henrion A (1994) Fres J Anal Chem 350: 657–658
[9] Vogl J (2012) Rapid Comm Mass Spectrom 26: 275–281
[10] Milton MJT, Wang J (2002) Intl J Mass Spectrom 218: 63–73
[11] Rienitz O, Pramann A, Schiel D (2010) Intl J Mass Spectrom 289: 47–53
[12] Pramann A, Rienitz O, Schiel D, Schlote J, Güttler B, Valkiers S (2011) Metrologia 48: 20–25
[13] Yang L, Mester Z, Sturgeon RE, Meija J (2012) Anal Chem 84:2321-2327
[14] Patterson KY, Veillon C, O’Haver TCO (1994) Anal Chem 66: 2829–2834
[15] Milton MJT, Wielgosz RI (2000) Metrologia 37: 199–206
[16] Riepe W, Kaiser H (1966) Fres Z Anal Chem 287: 121–127