Reducing losses to maize stored on farms in East Africa using ...
270
Iowa State University Digital Repository @ Iowa State University Graduate eses and Dissertations Graduate College 2012 Reducing losses to maize stored on farms in East Africa using hermetic storage Ali Yakubu Iowa State University Follow this and additional works at: hp://lib.dr.iastate.edu/etd Part of the Bioresource and Agricultural Engineering Commons , Entomology Commons , and the Epidemiology Commons is Dissertation is brought to you for free and open access by the Graduate College at Digital Repository @ Iowa State University. It has been accepted for inclusion in Graduate eses and Dissertations by an authorized administrator of Digital Repository @ Iowa State University. For more information, please contact [email protected]. Recommended Citation Yakubu, Ali, "Reducing losses to maize stored on farms in East Africa using hermetic storage" (2012). Graduate eses and Dissertations. Paper 12532.
-
Upload
khangminh22 -
Category
Documents
-
view
3 -
download
0
Transcript of Reducing losses to maize stored on farms in East Africa using ...

Iowa State UniversityDigital Repository @ Iowa State University
Graduate Theses and Dissertations Graduate College
2012
Reducing losses to maize stored on farms in EastAfrica using hermetic storageAli YakubuIowa State University
Follow this and additional works at: http://lib.dr.iastate.edu/etd
Part of the Bioresource and Agricultural Engineering Commons, Entomology Commons, andthe Epidemiology Commons
This Dissertation is brought to you for free and open access by the Graduate College at Digital Repository @ Iowa State University. It has been acceptedfor inclusion in Graduate Theses and Dissertations by an authorized administrator of Digital Repository @ Iowa State University. For moreinformation, please contact [email protected].
Recommended CitationYakubu, Ali, "Reducing losses to maize stored on farms in East Africa using hermetic storage" (2012). Graduate Theses andDissertations. Paper 12532.
Reducing losses to maize stored on farms in East Africa using hermetic storage
by
Ali Yakubu
A dissertation submitted to graduate faculty
in partial fulfillment of the requirements for the degree of
DOCTOR OF PHILOSOPHY
Major: Industrial and Agricultural Technology
Program of Study Committee Carl Bern, Major Professor
Brian Steward Glen Rippke Joel Coats
Lester Wilson Thomas Brumm Theodore Bailey
Iowa State University
Ames, Iowa
2012
Copyright © Ali Yakubu, 2012. All rights reserved
ii
TABLE OF CONTENTS LIST OF TABLES………………………….…………………………………….……..….xi
LIST OF FIGURES...……………………..……………………...….....….…...….…….xiv
ACKNOWLEDGEMENTS..………………………………………………..….….….....xvii
DEDICATION..……………………………………………………….……..……….…..xviii
ABSTRACT………………..………………………………………………...….…….…..xix
CHAPTER 1: GENERAL INTRODUCTION…….………...………………..…….…......1
1.1 THESIS ORGANIZATION……………………..………………………….…..1
1.2 LITERATURE REVIEW……….…..…………………………………………...1
1.2.1 East Africa…..……………….………………….…………………..1
1.2.1.1 Geography…..………………………………………………3
1.2.1.2 Agroecological zones……..…….….……………………...3
1.2.1.3 Maize statistics………………...………………..……….....5
1.2.1.4 Climates of East Africa…………………..…………….…..6
1.2.1.5 Climate in individual East African countries…….…….....9
1.3 OPTIMAL CONDITIONS FOR MAIZE CULTIVATION…………………..16
1.3.1 Precipitation and Maize……..……………………………………...16
1.3.2 Temperature and maize….…….…………………………………..17
1.3.3 Drought and maize…………………………………..…………...…17
1.3.4 Maize farming and agronomic conditions……………….………..18
1.4 POST HARVEST MAIZE LOSSES…….................………….………….…19
1.5 MAIZE HARVEST AND STORAGE ….......…………………….…………..20

iii
1.6 MAIZE STORAGE IN THE TROPICS...…………………………………….21
1.7 HERMETIC CONTAINER TYPES AND SIZES …….……..………………23
1.8 TYPES OF HERMETIC STORAGE..……………………………………….25
1.9 HERMETIC STORAGE ECONOMICS.…..…………………………….......27
1.10 FACTORS INFLUENCING HERMETIC STORAGE……………………..27
1.10.1 Temperature………….…………………………………...…........29
1.10.2 Maize moisture and hermetic storage……………………..…...30
1.10.2.1 Laboratory hermetic study………….…………………..30
1.10.2.2 Field hermetic studies....………………………………..42
1.11 RODENTS AND HERMETIC STORAGE…….………………………......42
1.12 HERMETIC STORAGE AND SEED DORMANCY …………………….43
1.13 SEEDS.…..…………………………………………………………….........43
1.13.1 Maize seed and germination…………………………………….44
1.13.2 Oxygen and temperature...……………………………………....46
1.13.3 Maize moisture content and germination…...……………….....46
1.13.4 Phases of germination…………………………………………...47
1.13.5 Regulation of seed germination……….………………………..49
1.13.6 Hermetic storage and seed dormancy…………………..……..49
1.13.7 Seed dormancy and abscisic acid………………………..……..50
1.13.8 Primary and secondary seed stress….…………………..……..51
1.13.9 Hypoxia…………………………………………………..…...........51
1.13.10 Seed sourcing by subsistence farmers.……… …..…………..51
1.14 RECYCLED CONTAINERS AND HERMETIC STORAGE.…..…..........52
iv
1.14.1 Cross contamination…………………...…………………..…......52
1.14.2 Cross-contamination and oxidation in fats and oils……..……..53
1.14.3 Free radicals and cellular damage………………………..……..54
1.14.4 Edible oil container cleaning……………………………..………55
1.14.5 Estimating molar mass…………………………………………...56
1.14.6 Estimating molar equivalents...…………………………. ….......57
1.14.7 20-L HDPE containers…………………………………….….…..57
1.14.8 Soybean oil…………………………………………………..…….58
1.14.9 Soybean oil and smoke point………………………………….…58
1.14.10 Saponification……………………………………………..……..58
1.14.11 Saponification and temperature..……………………… ……...59
1.14.12 Cleaning with soap….…………………………………..…........60
1.14.13 Recycling treatment definition….………………………..…….60
1.15 RESEARCH NEED…..…………………………………….………….........61
1.16 GENERAL OBJECTIVES…….……………..……………………….…......62
1.17 REFERENCES………….………………………..……………………........63
CHAPTER 2: TIME TO COMPLETE ADULT WEEVIL MORTALITY IN HERMETICALLY STORED MAIZE……………………………………………………..76
2.1 ABSTRACT…..………………..………………………………………………76
2.2 INTRODUCTION…………………….………….…………………………….77
2.2.1 Staple food……………………….…….……………………………77
2.2.2 Post-harvest storage losses………….…………….……………...77
v
2.2.3 Research need…….…………………..……………………………79
2.3 OBJECTIVES.………………………………………………………………...80
2.4 MATERIALS AND METHODS……….……………………………………..80
2.4.1 Experimental maize…….…….…………………………………..81
2.4.2 Experimental weevils……….…………………………………….81
2.4.3 Laboratory scale testing…………..….…………………………..82
2.4.3.1 Objective…………………………………..…………..…..82
2.4.3.2 Experimental containers………………..…………….....82
2.4.3.3 Treatment design………………………..……………….82
2.4.3.4 Field scale testing….…………………………………….84
2.4.3.5 Objective…….……………….………………………..…..84
2.4.3.6 Experimental containers….……………………………..84
2.4.3.7 Treatment design…………………………………….......85
2.4.3.8 Procedure………………………………………………....85
2.4.3.9 Maize quantity and percent fill..…………………………86
2.4.3.10 Example calculations………….………………..……....86
2.4.3.11 Sealing hermetic 20-L HDPE containers…..…………88
2.4.3.12 Experimental chamber………..……………..………....88
2.4.3.13 Post experiment weevil count.…………….…….….....89
2.5 RESULTS AND DISCUSSION………………..……………………………..89
2.5.1 Laboratory scale test study results………..……………...89
2.5.2 Mortality prediction shortfalls………………………………………89
2.5.3 Adjusting predicted time to mortality……..………………….……90
vi
2.5.4 Interactions………………………………………..…………………92
2.5.5 Hermetic storage……………………………………..……………..93
2.5.6 Field scale study…………………………………………..……......96
2.5.6.1 Weevil reproduction and temperature. .……….……….96
2.5.6.2 Packing density…..……………………………………….98
2.6 CONCLUSIONS…………………………..……………………………..……98
2.7 REFERENCES…………….……………………………………………….….99
CHAPTER 3: EFFECTS OF STORAGE AND WEEVILS ON MAIZE SEED……………………………………….…..……..…………………………………..105
3.1 ABSTRACT…….…………………………………………………………….105
3.2 INTRODUCTION…………………………………………………………….106
3.2.1 Maize storage………………………………………………………107
3.2.2 Seeds and hermetic storage……………………………………..107
3.2.3 Research need…………………………………………………….109
3.3 OBJECTIVES……………….………………………………………………..109
3.4 METHODS AND MATERIALS………………….…………………….........109
3.4.1 Experimental maize seed….………………..………………........110
3.4.2 Initial germination tests………………………….…………..........110
3.4.3 Treatment design……………….…………………………………111
3.4.4 Experimental weevils….……….……………………………........113
3.4.5 Experimental chamber……………………………………………113
3.4.6 Experimental containers…………………………………….........113
3.4.7 Seed priming……….………………………………………………114
vii
3.4.8 Germination seed preparation……………………………………114
3.4.9 Germination medium………………….…………………………..115
3.4.10 Standard germination test…………………………………........116
3.4.11 Statistics…………………………………………………………..116
3.5 RESULTS AND DISCUSSION……………….…………………………….117
3.5.1 Germination study results ……………….………………............117
3.5.2 Hermetic by month interactions……………………………….…120
3.5.3 Weevil by month interaction…………….………………………..121
3.5.4 Hermetic by weevil by month interaction………………….........122
3.5.5 Predicting percent maize germination……….…………….........123
3.5.5.1 Main effects………………………………………………124
3.5.5.2 Interaction effects…………………...…………………..124
3.5.6 Sample size determination…...….……………….………….......126
3.5.7 Seed germination rates…………….…………………………….127
3.6 CONCLUSIONS………….………………………………………………….128
3.7 REFERENCES…………….…………………………………………………129
CHAPTER 4: RECYCLED CONTAINERS AND MAIZE STORAGE IN EAST AFRICA…………………………………………..…………………………………….....136
4.1 ABSTRACT……………………………………………………………..........136
4.2 INTRODUCTION….…………………………………………………………137
4.2.1 Epidemiology of food borne illnesses……………..…………….138
4.2.2 Research need……………………………………….……………140
4.3 OBJECTIVES…………………….…………………………………….........140
viii
4.4 METHODS AND MATERIALS………………………….…………….........140
4.4.1 Market Survey ……………………………………………….........140
4.4.2 Laboratory research……………………….………………………141
4.4.3 Treatment definition……………………….………………………141
4.4.4 Experimental 20-L HDPE containers……..……………………..142
4.4.5 Quantification of vegetable oil remnants.....…………………….144 4.4.6 Experimental soap ………………………………………………..145
4.4.7 Water………………………………………………………………..145
4.4.8 Oil removal treatments………….………………………………...146
4.4.9 Oil residue measurements……..…………………………………146
4.5 RESULTS AND DISCUSSION……………….…………………………....147
4.5.1 Survey results……………………………………………..............147
4.5.2 Laboratory research results…….….…………………………….147
4.5.3 Method by container interaction...……………………………….157
4.6 CONCLUSIONS………………..……………………………………...........160
4.7 REFERENCES……..……………………………………………………......162
CHAPTER 5: GENERAL CONCLUSIONS….…………..……………………...........170
5.1 MARKET SURVEY RESULTS.………….…………………………………170
5.2 LABORATORY CONTAINER RECYCLING RESULTS…......................172
5.3 STUDIES’ IMPACT.……….………………………………..………............173
5.4 RECOMMENDATIONS FOR FUTURE RESEARCH …..………………174
APPENDIX A: PREDICTED TIME TO COMPLETE WEEVIL MORTALITY…......175
ix
A.1 ANALYSIS OF VARIANCE…….…….……………………………............176
A.2 INTERACTION ANALYSIS...…….………………………………………..177
APPENDIX B: SEEDS…………...…………………………………………….............179
B.1 GERMINATION ANALYSIS OF VARIANCE KEY OUT.…...…………...179
B.2 ANALYSIS OF VARIANCE …...………………………………..………….180
B.3 TRAYS AND GERMINATION SHELVES…..………………...…………..181
B.4 TREATMENT SAMPLES RANDOMIZATION TO TRAYS…….………..181
B.5 SEED PLANTING ARRANGEMENT ……..........………………..……….183
B.6 FURTHER HERMETIC SEED GERMINATION ANALYSIS ….……….187
APPENDIX C: RECYCLED CONTAINERS AND HERMETIC STORAGE…….....189
C.1 TREATMENT DESIGN ………………………..…………………..............189
C.2 EXPERIMENTAL DESIGN ………………………………………………..189
C.3 ANOVA DESIGN KEY OUT…….…………………………...………….....189
C.4 METHODS AND MATERIALS……………………………………………..190
C.4.1 Soap quantification………………………………..…………......190
C.5 RESULTS AND DISCUSSION……………...……………………………..191
C.5.1 Steel canister cleaning results……….…………………………..191
C.5.2 Trial run….…………………………………………………………195
C.5.3 Conclusion…….………………………….……………..…………196
C.5.4 Research analysis of variance………..……..…………...…......197
APPENDIX D: RECYCLED CONTAINER SURVEY………………………………..198
x
D.1 KENYA…….………………………………………………………………....198
D.2 TANZANIA…………………………………………………………..............208
D.3 UGANDA……….…………………………………………………………....214
APPENDIX E: SAS CODES……………………………………...……………………225
E.1 SEED GERMINATION RESEARCH ANALYSIS……….……….............225
E.2 PREDICTED TIME TO COMPLETE MORTALITY……..………………..238
E.3 RECYCLED CONTAINERS RESEARCH ANALYSIS………………..…243
xi
LIST OF TABLES
Table 1.1: 2008 maize statistics for East Africa …….………………………………..…6
Table 1.2: Mean precipitation and temperatures ( Bujumbura)….…..………………10
Table 1.3: Mean precipitation and temperatures (Djibouti) …..……...………............11
Table 1.4: Mean precipitation and temperatures (Eritrea). …....……..………………11
Table 1.5: Mean precipitation and temperatures (Ethiopia). …….…….……………..12
Table 1.6: Mean precipitation and temperatures (Uganda) …….……….……………13
Table 1.7: Mean precipitation and temperatures (Kenya) …..………………...……...13
Table 1.8: Mean precipitation and temperatures. (Tanzania) …………….................14
Table 1.9: Mean precipitation and temperatures (Rwanda) ...………..……………...15
Table 1.10: Mean precipitation and temperatures …………………………………….15
Table 1.11: Mean precipitation and temperatures (Sudan) …..……………….……..16
Table 1.12: Comparison of hermetic to conventional storage ….……...............22
Table 1.13. Ethanoland acetic acid contents in maize under hermetic storage….....37
Table 1.14. Ethanol in the headspace of moist maize under hermetic storage….…38
Table 1.15. Mold numbers in maize under hermetic storage ………………………...38
Table 1.16. Yeast numbers in maize under hermetic storage………………………..39
Table 1.17. Bacteria numbers in maize under hermetic storage. …...……………….40
Table 2.1: Days to complete weevil mortality (laboratory scale). ……………………91
Table 2.2: Mean adult weevil mortality (laboratory-scale) ……………..……………..91
Table 2.3: Day by storage type (hermetic) interaction (laboratory-scale..…………..93
Table 2.4: Days to complete weevil mortality (field-scale). …..………..……………..96
Table 2.5: Mean adult weevil mortality (Field-scale) …………………......…………...96
xii
Table 3.1: Treatment means and standard errors (seed germination) ……………119
Table 3.2: Hermetic by weevil by month interactions (seed germination).…………125
Table 3.3: Hermetic by weevil by month interactions (seed germination) …………126
Table 3.4: Prediction equations for treatments groups (seed germination). ………..27
Table 4.1: Edible oil containers in Tanzania, Kenya and Uganda markets………..150
Table 4.2: Method effect for the recycling research …………....……………………152
Table 4.3: Container effect for the recycling research ………...…………………….152
Table 4.4: Method by container interactions for the recycling research…………...157
Table 5.1: Edible oil containers in Tanzania, Kenya and Uganda markets…….....171
Appendix A-Table 1.1: Predicted time to adult weevil (laboratory research) ……..175
Appendix A-Table 1.2: Anova key out for (laboratory research) …...……………....175
Appendix A-Table 1.3: Treatments for 20-L containers (field research) ….............176
Appendix A-Table 1.4: Anova (Laboratory scale) weevil mortality study …………176
Appendix A-Table 1.5: Days to complete weevil mortality (laboratory scale)..…...177
Appendix B-Table 1.1: Seed germination research treatment design…………….179
Appendix B-Table 1.2: Germination anova key ……………….……….…………….180
Appendix B-Table 1.3: Germination analysis of variance (anova) ……..................180
Appendix B-Table 1.4: Seed (treatment) samples randomization ……….…………181
Appendix B-Table 1.5: Example planting arrangement (seed germination) …...….183
Appendix C-Table 1.1: Recycled container research treatment design..................189
Appendix C-Table 1. 2: Anova design key out (recycled container) ….……………190
Appendix C-Table 1.3: Steel canister cleaning with Ivory soap at 45°C……….......192
Appendix C-Table 1.4: Steel canister cleaning with Ivory soap at 100°C……........192
xiii
Appendix C-Table 1.5: Steel canister cleaning with sodium palmitate at 45°C.......193
Appendix C-Table 1.6: Steel canister cleaning with sodium palmitate at 100°C….193
Appendix C-Table 1.7: Results summary for Ivory soap and Sodium palmitate…..194
Appendix C: Table 1. 8: Analysis of variance (recycling container research).…….197
Appendix D: Table 1.1-Market survey form (recycled container research)…….….199
Appendix D: Table 1. 2- Market survey form (recycled container research).……...204
Appendix D: Table 1.3- Market survey form (recycled container research)…….…206
Appendix D: Table 1.4- Market survey form (recycled container research)…….…214
Appendix D: Table 1.5- Market survey form (recycled container research)…….…218
Appendix D: Table 1.6: Market survey form (recycled container research)……..…220
Appendix D: Table 1.7: Market survey form (recycled container research)…….....224
xiv
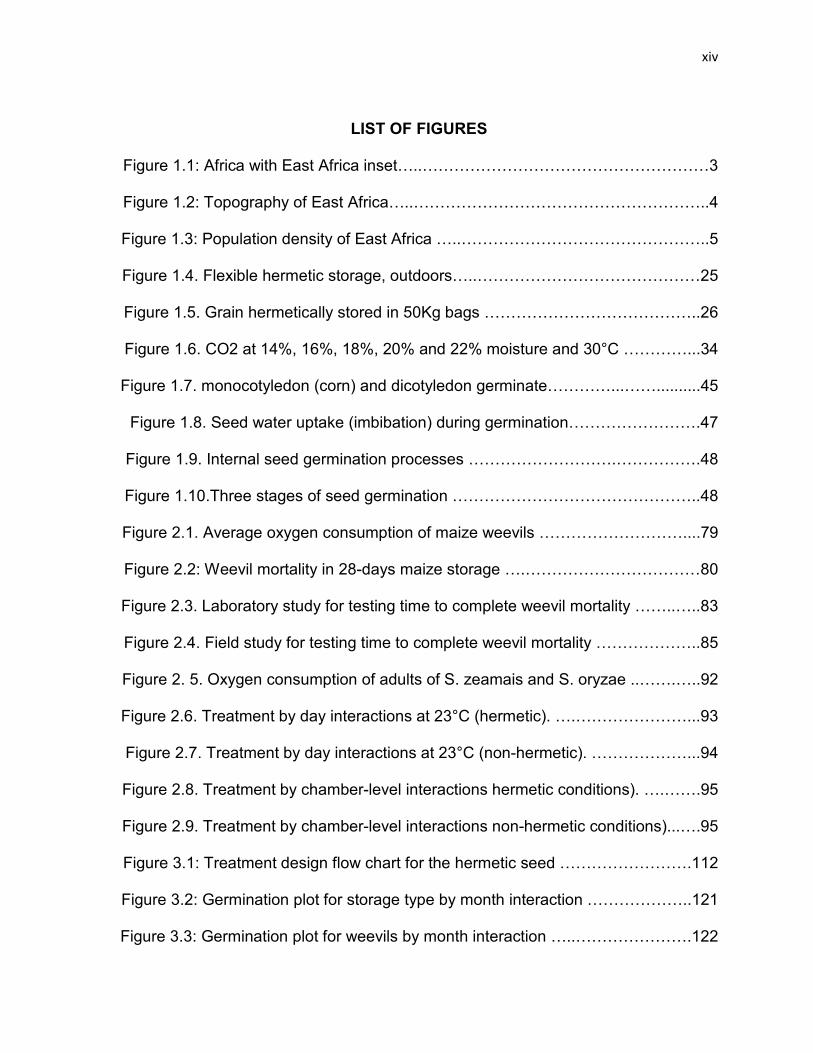
LIST OF FIGURES
Figure 1.1: Africa with East Africa inset…..………………………………………………3
Figure 1.2: Topography of East Africa…..………………………………………………..4
Figure 1.3: Population density of East Africa …..………………………………………..5
Figure 1.4. Flexible hermetic storage, outdoors…..……………………………………25
Figure 1.5. Grain hermetically stored in 50Kg bags …………………………………..26
Figure 1.6. CO2 at 14%, 16%, 18%, 20% and 22% moisture and 30°C …………...34
Figure 1.7. monocotyledon (corn) and dicotyledon germinate…………...……..........45
Figure 1.8. Seed water uptake (imbibation) during germination…………………….47
Figure 1.9. Internal seed germination processes ……………………….…………….48
Figure 1.10.Three stages of seed germination ………………………………………..48
Figure 2.1. Average oxygen consumption of maize weevils ………………………....79
Figure 2.2: Weevil mortality in 28-days maize storage ….……………………………80
Figure 2.3. Laboratory study for testing time to complete weevil mortality ……..…..83
Figure 2.4. Field study for testing time to complete weevil mortality ………………..85
Figure 2. 5. Oxygen consumption of adults of S. zeamais and S. oryzae ..…….…..92
Figure 2.6. Treatment by day interactions at 23°C (hermetic). ….…………………...93
Figure 2.7. Treatment by day interactions at 23°C (non-hermetic). ………………...94
Figure 2.8. Treatment by chamber-level interactions hermetic conditions). ….…….95
Figure 2.9. Treatment by chamber-level interactions non-hermetic conditions)...….95
Figure 3.1: Treatment design flow chart for the hermetic seed …………………….112
Figure 3.2: Germination plot for storage type by month interaction ………………..121
Figure 3.3: Germination plot for weevils by month interaction …..………………….122
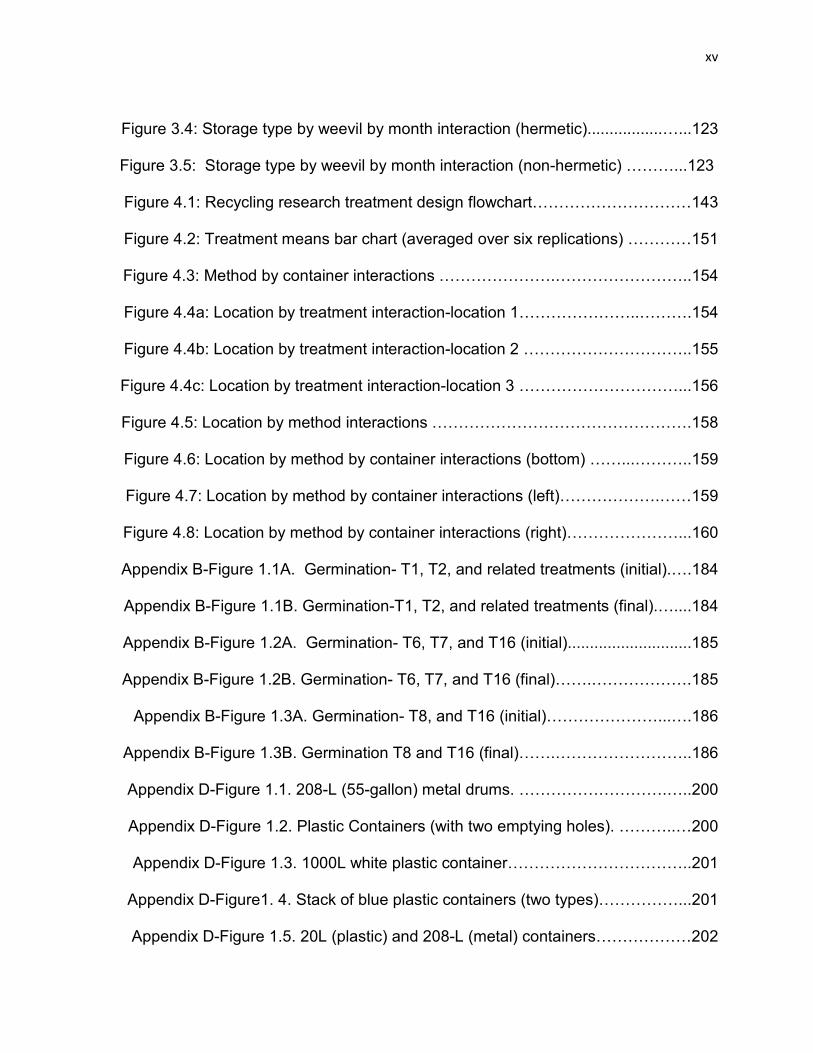
xv
Figure 3.4: Storage type by weevil by month interaction (hermetic).................…...123
Figure 3.5: Storage type by weevil by month interaction (non-hermetic) ………...123
Figure 4.1: Recycling research treatment design flowchart…………………………143
Figure 4.2: Treatment means bar chart (averaged over six replications) …………151
Figure 4.3: Method by container interactions ………………….……………………..154
Figure 4.4a: Location by treatment interaction-location 1…………………..……….154
Figure 4.4b: Location by treatment interaction-location 2 …………………………..155
Figure 4.4c: Location by treatment interaction-location 3 …………………………...156
Figure 4.5: Location by method interactions ………………………………………….158
Figure 4.6: Location by method by container interactions (bottom) ……...………..159
Figure 4.7: Location by method by container interactions (left)……………….……159
Figure 4.8: Location by method by container interactions (right)…………………...160
Appendix B-Figure 1.1A. Germination- T1, T2, and related treatments (initial).….184
Appendix B-Figure 1.1B. Germination-T1, T2, and related treatments (final).…....184
Appendix B-Figure 1.2A. Germination- T6, T7, and T16 (initial)............................185
Appendix B-Figure 1.2B. Germination- T6, T7, and T16 (final)…….……………….185
Appendix B-Figure 1.3A. Germination- T8, and T16 (initial)…………………...….186
Appendix B-Figure 1.3B. Germination T8 and T16 (final)…….……………………..186
Appendix D-Figure 1.1. 208-L (55-gallon) metal drums. ……………………….…..200
Appendix D-Figure 1.2. Plastic Containers (with two emptying holes). ………..…200
Appendix D-Figure 1.3. 1000L white plastic container……………………………..201
Appendix D-Figure1. 4. Stack of blue plastic containers (two types)……………...201
Appendix D-Figure 1.5. 20L (plastic) and 208-L (metal) containers………………202
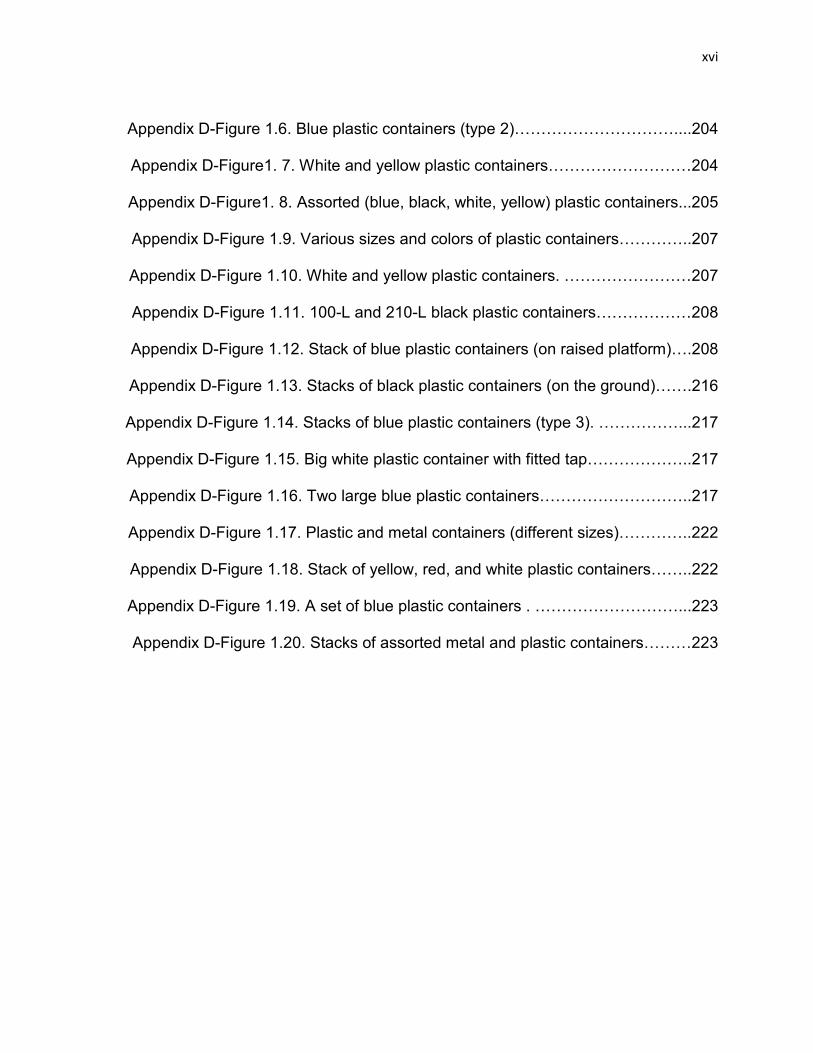
xvi
Appendix D-Figure 1.6. Blue plastic containers (type 2)…………………………....204
Appendix D-Figure1. 7. White and yellow plastic containers………………………204
Appendix D-Figure1. 8. Assorted (blue, black, white, yellow) plastic containers...205
Appendix D-Figure 1.9. Various sizes and colors of plastic containers…………..207
Appendix D-Figure 1.10. White and yellow plastic containers. ……………………207
Appendix D-Figure 1.11. 100-L and 210-L black plastic containers………………208
Appendix D-Figure 1.12. Stack of blue plastic containers (on raised platform)….208
Appendix D-Figure 1.13. Stacks of black plastic containers (on the ground)…….216
Appendix D-Figure 1.14. Stacks of blue plastic containers (type 3). ……………...217
Appendix D-Figure 1.15. Big white plastic container with fitted tap………………..217
Appendix D-Figure 1.16. Two large blue plastic containers………………………..217
Appendix D-Figure 1.17. Plastic and metal containers (different sizes)…………..222
Appendix D-Figure 1.18. Stack of yellow, red, and white plastic containers……..222
Appendix D-Figure 1.19. A set of blue plastic containers . ………………………...223
Appendix D-Figure 1.20. Stacks of assorted metal and plastic containers………223

xvii
ACKNOWLEDGEMENTS
I am grateful to my major professor, Dr. Carl Bern, and to Dr. Brian Steward, Dr. Joel
Coats, Dr. Lester Wilson, Dr. Thomas Brumm, Dr. Theodore Bailey and Glen
Rippke, for serving on my committee as well as for providing resources that helped
get us to this point. I also thank Dr. Rameshwar Kanwar, for his visionary leadership
in the Department of Agricultural and Biosystems Engineering.
Above all, I am grateful to God for making this possible, and I thank my family and
friends, for their patience and constant support.

xviii
DEDICATION This dissertation is dedicated to my sister-Mrs Amina Aladi Osagie, and her family (Dr. Austin A. Osagie, Austin. S. Osagie, Rabi. F. Osagie and Amira. E. Osagie)
xix
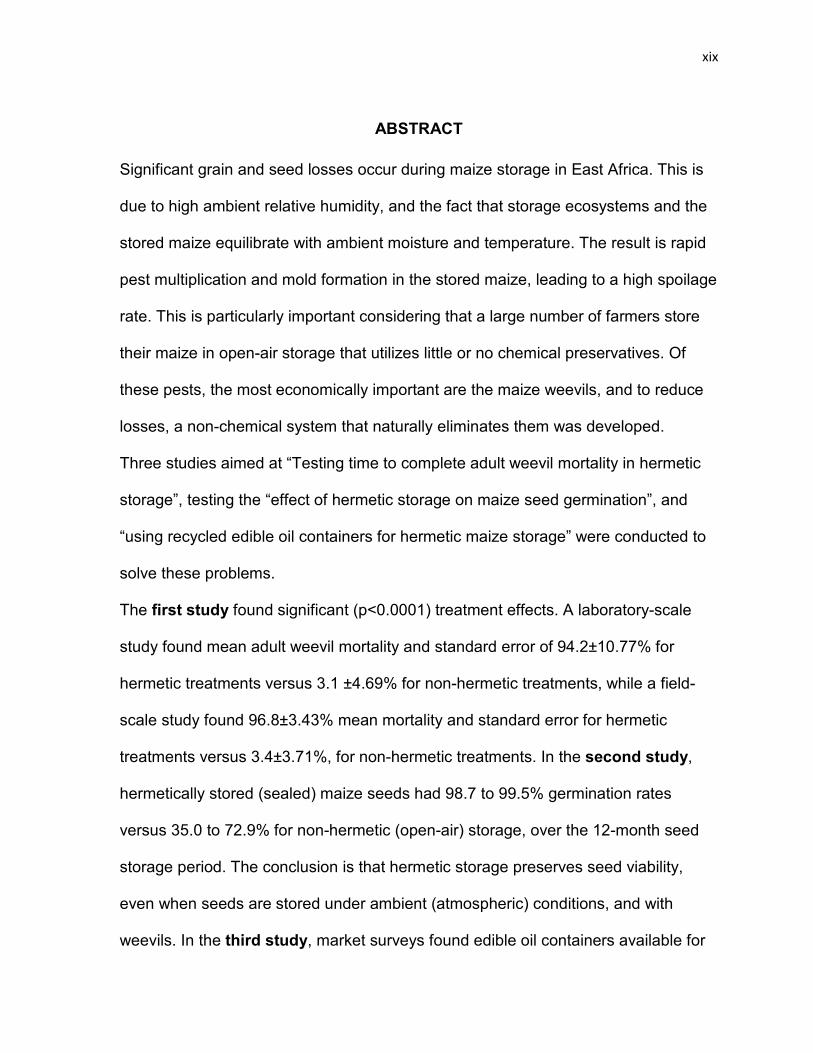
ABSTRACT Significant grain and seed losses occur during maize storage in East Africa. This is
due to high ambient relative humidity, and the fact that storage ecosystems and the
stored maize equilibrate with ambient moisture and temperature. The result is rapid
pest multiplication and mold formation in the stored maize, leading to a high spoilage
rate. This is particularly important considering that a large number of farmers store
their maize in open-air storage that utilizes little or no chemical preservatives. Of
these pests, the most economically important are the maize weevils, and to reduce
losses, a non-chemical system that naturally eliminates them was developed.
Three studies aimed at “Testing time to complete adult weevil mortality in hermetic
storage”, testing the “effect of hermetic storage on maize seed germination”, and
“using recycled edible oil containers for hermetic maize storage” were conducted to
solve these problems. The first study found significant (p<0.0001) treatment effects. A laboratory-scale
study found mean adult weevil mortality and standard error of 94.2±10.77% for
hermetic treatments versus 3.1 ±4.69% for non-hermetic treatments, while a field-
scale study found 96.8±3.43% mean mortality and standard error for hermetic
treatments versus 3.4±3.71%, for non-hermetic treatments. In the second study,
hermetically stored (sealed) maize seeds had 98.7 to 99.5% germination rates
versus 35.0 to 72.9% for non-hermetic (open-air) storage, over the 12-month seed
storage period. The conclusion is that hermetic storage preserves seed viability,
even when seeds are stored under ambient (atmospheric) conditions, and with
weevils. In the third study, market surveys found edible oil containers available for
xx
sale and reuse as hermetic storage containers, in East African markets, and a
comparison of three cleaning methods showed that oil-drain plus water at 90
to100°C plus soap is the most effective, as well as the only one that met our
cleaning objectives. Leftover oils following cleaning with oil-drain plus water at 45°C,
oil-drain plus water at 90 to100°C, and oil-drain plus water at 90 to100°C plus soap
were 0.249g, 0.142g, and 0.004g, respectively. The 0.004g from the oil-drain plus
water at 90 to100°C plus soap treatment compares favorably with 0.005 to 0.006
from the control (unused experimental units (20-L HDPE containers), which had no
oil contaminants. Research results, therefore, indicate that using 3g of 99.44% pure
Ivory soap and hot water per gram of soybean oil contaminant is enough to clean
and sanitize soybean oil contaminated 20-L HDPE containers, for safe hermetic
maize storage.
1
CHAPTER 1: GENERAL INTRODUCTION
1.1 THESIS ORGANIZATION
The information in this dissertation is organized into five chapters. The first chapter
is the general introduction, with sections on thesis organization, literature review,
and general objectives. The second chapter contains a paper entitled “Testing time
to complete adult weevil mortality in hermetic storage”, the third chapter contains a
paper entitled “Effects of hermetic storage on maize seed germination” and the
fourth chapter contains a paper entitled “Using recycled edible oil containers for
hermetic maize storage”. The fifth chapter is the “General conclusions” chapter,
based on the information contained in chapters two, three, and four, and answering
objectives from chapter one.
Chapters two, three, and four are prepared for publication in journals and are
formatted according to the guidelines for papers submitted to those journals for
publication.
1.2 LITERATURE REVIEW 1.2.1 East Africa Most maize storage, by subsistence farmers, in East Africa involves the use of
open-air storage facilities (Lindblad and Druben, 1980; Wiley-Blackwell, 2004;
Akaninwor and Sodje, 2005). This allows for re-wetting and related pest (weevil,
mold, birds, and rodent) activities, resulting in damage to stored maize. And studies
2
have shown that the combined effect of maize weevils and molds alone is capable of
causing up to 100% maize damage (Demissie et al., 2008; Weinberg, et al., 2008).
This is of economic importance, considering that weevil activity introduces molds,
especially since subsistence farmers lack adequate drying equipment and maize
may be stored while relatively moist and warm (Mendoza et al., 1982; Bankole, et
al., 2005). Also important is the fact that agriculture employs 60 to 80% of the
population (Bett and Nguyo, 2007; Minot, 2008), maize accounts for 50% of caloric
intake (Sinha, 2007), at least 70% of maize seeds are sourced from prior year’s
harvest (Gemeda, et al., 2001; Dhliwayo, et al., 2003), and chemical maize
preservatives used in post-harvest storage are toxic, costly, and often do not work
(Korunic, 1998; IRRI, 2008). For these reasons, a natural and effective method
capable of reducing losses in post-harvest storage is needed. This is especially
important if it allows for the reuse of containers available in the local culture, for
effective storage, while preventing the economic (quantitative and qualitative) losses
associated with existing pests, and if it eliminates the use of toxic chemicals, and
preserves food supply.
The non-chemical, natural and effective method chosen for reducing losses to maize
stored on farms in East Africa is hermetic storage. Hermetic storage is a safe, cost-
effective storage method that eliminates insects and molds through the synergistic
effect of O2 depletion and CO2 accumulation in the storage ecosystem.
3
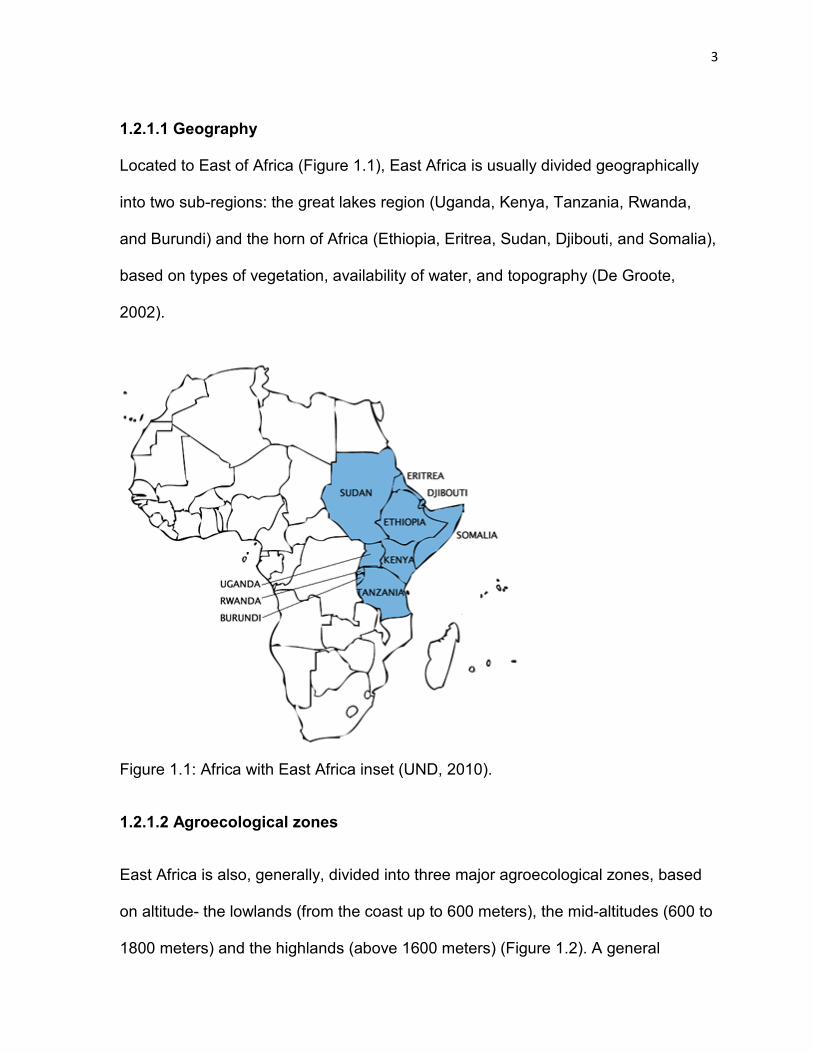
1.2.1.1 Geography Located to East of Africa (Figure 1.1), East Africa is usually divided geographically
into two sub-regions: the great lakes region (Uganda, Kenya, Tanzania, Rwanda,
and Burundi) and the horn of Africa (Ethiopia, Eritrea, Sudan, Djibouti, and Somalia),
based on types of vegetation, availability of water, and topography (De Groote,
2002).
Figure 1.1: Africa with East Africa inset (UND, 2010).
1.2.1.2 Agroecological zones
East Africa is also, generally, divided into three major agroecological zones, based
on altitude- the lowlands (from the coast up to 600 meters), the mid-altitudes (600 to
1800 meters) and the highlands (above 1600 meters) (Figure 1.2). A general
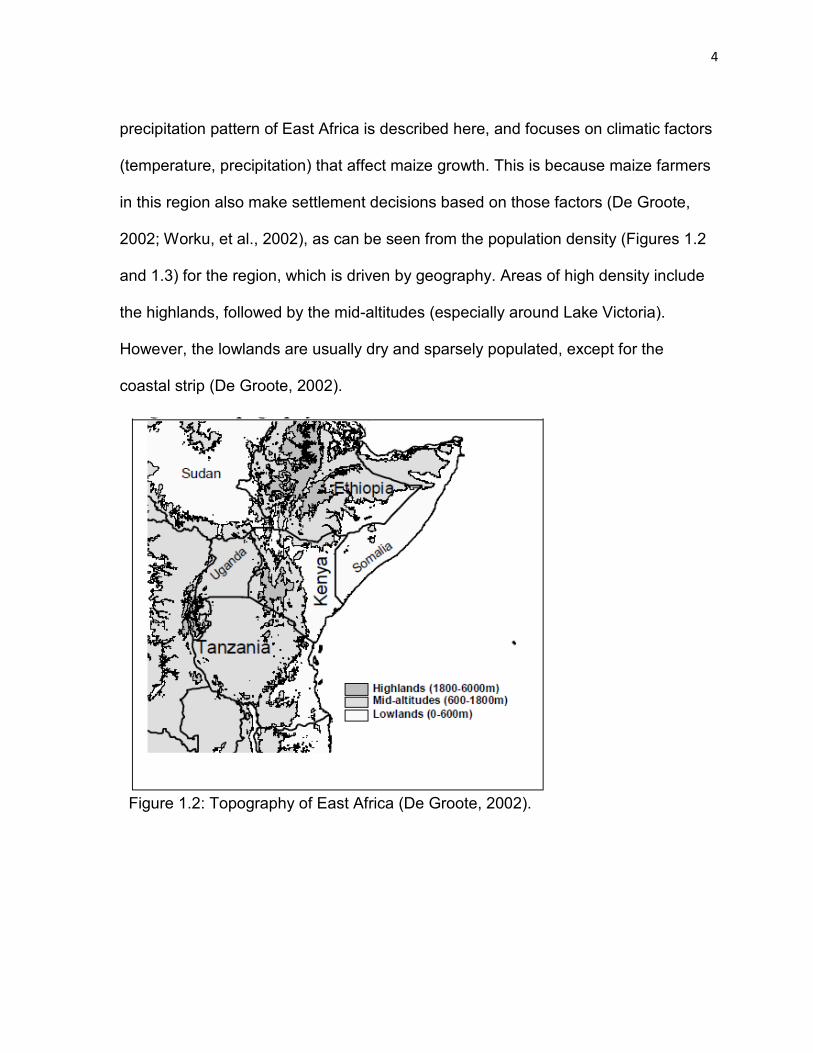
4
precipitation pattern of East Africa is described here, and focuses on climatic factors
(temperature, precipitation) that affect maize growth. This is because maize farmers
in this region also make settlement decisions based on those factors (De Groote,
2002; Worku, et al., 2002), as can be seen from the population density (Figures 1.2
and 1.3) for the region, which is driven by geography. Areas of high density include
the highlands, followed by the mid-altitudes (especially around Lake Victoria).
However, the lowlands are usually dry and sparsely populated, except for the
coastal strip (De Groote, 2002).
Figure 1.2: Topography of East Africa (De Groote, 2002).
5
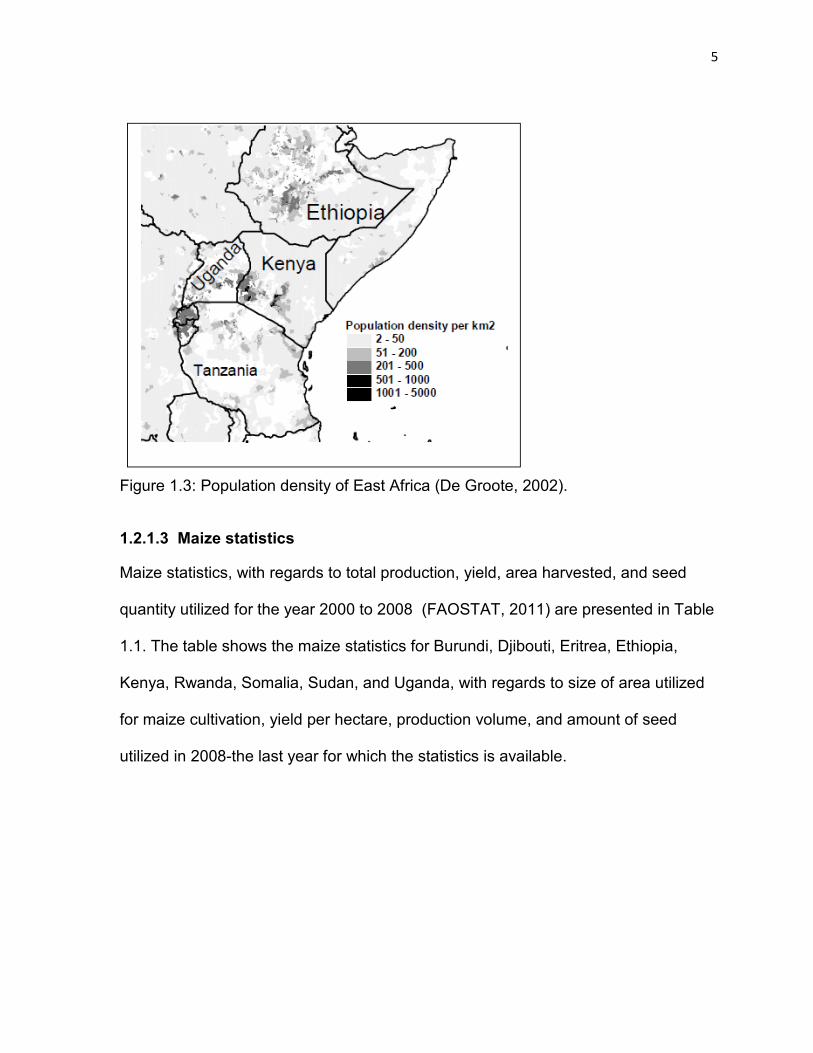
Figure 1.3: Population density of East Africa (De Groote, 2002).
1.2.1.3 Maize statistics
Maize statistics, with regards to total production, yield, area harvested, and seed
quantity utilized for the year 2000 to 2008 (FAOSTAT, 2011) are presented in Table
1.1. The table shows the maize statistics for Burundi, Djibouti, Eritrea, Ethiopia,
Kenya, Rwanda, Somalia, Sudan, and Uganda, with regards to size of area utilized
for maize cultivation, yield per hectare, production volume, and amount of seed
utilized in 2008-the last year for which the statistics is available.
6
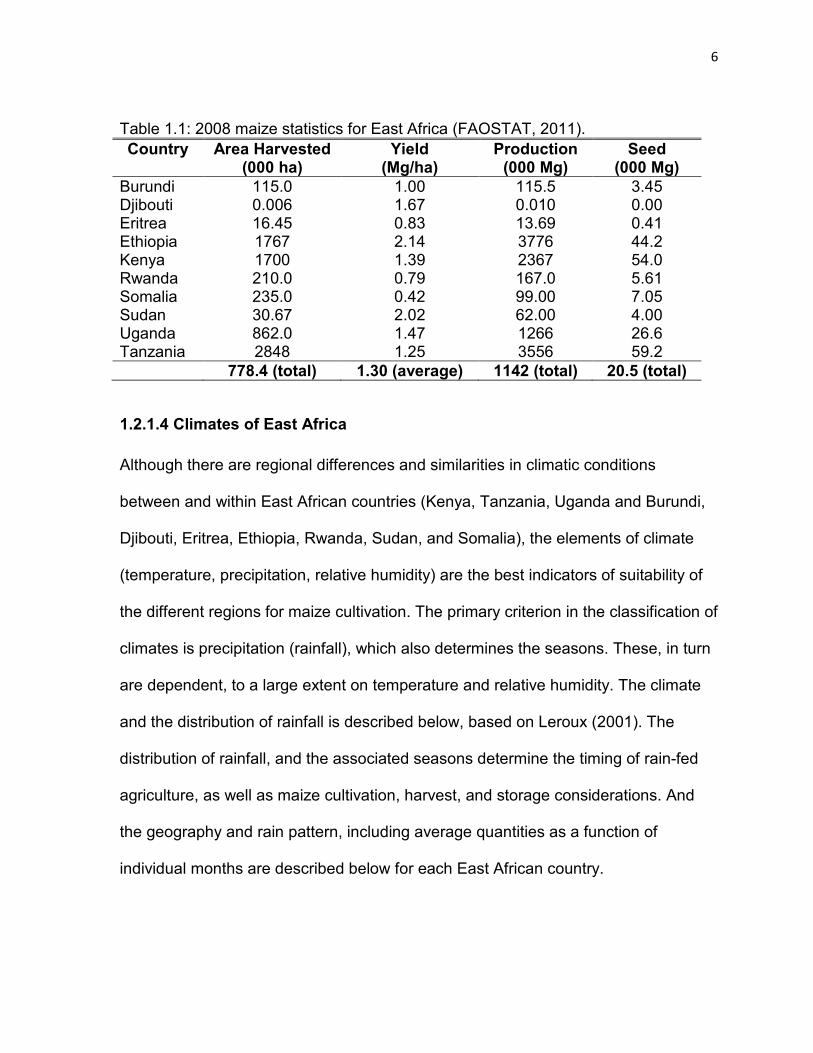
Table 1.1: 2008 maize statistics for East Africa (FAOSTAT, 2011). Country Area Harvested
(000 ha) Yield
(Mg/ha) Production
(000 Mg) Seed
(000 Mg) Burundi 115.0 1.00 115.5 3.45 Djibouti 0.006 1.67 0.010 0.00 Eritrea 16.45 0.83 13.69 0.41 Ethiopia 1767 2.14 3776 44.2 Kenya 1700 1.39 2367 54.0 Rwanda 210.0 0.79 167.0 5.61 Somalia 235.0 0.42 99.00 7.05 Sudan 30.67 2.02 62.00 4.00 Uganda 862.0 1.47 1266 26.6 Tanzania 2848 1.25 3556 59.2 778.4 (total) 1.30 (average) 1142 (total) 20.5 (total)
1.2.1.4 Climates of East Africa
Although there are regional differences and similarities in climatic conditions
between and within East African countries (Kenya, Tanzania, Uganda and Burundi,
Djibouti, Eritrea, Ethiopia, Rwanda, Sudan, and Somalia), the elements of climate
(temperature, precipitation, relative humidity) are the best indicators of suitability of
the different regions for maize cultivation. The primary criterion in the classification of
climates is precipitation (rainfall), which also determines the seasons. These, in turn
are dependent, to a large extent on temperature and relative humidity. The climate
and the distribution of rainfall is described below, based on Leroux (2001). The
distribution of rainfall, and the associated seasons determine the timing of rain-fed
agriculture, as well as maize cultivation, harvest, and storage considerations. And
the geography and rain pattern, including average quantities as a function of
individual months are described below for each East African country.
7
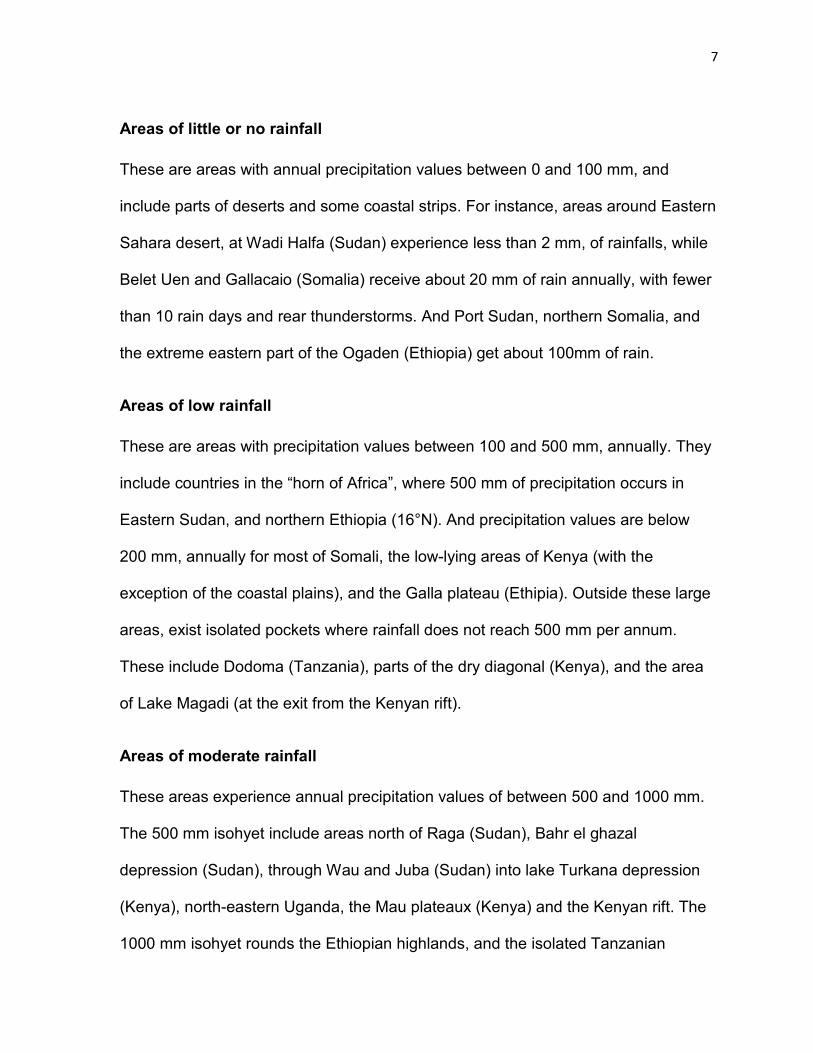
Areas of little or no rainfall
These are areas with annual precipitation values between 0 and 100 mm, and
include parts of deserts and some coastal strips. For instance, areas around Eastern
Sahara desert, at Wadi Halfa (Sudan) experience less than 2 mm, of rainfalls, while
Belet Uen and Gallacaio (Somalia) receive about 20 mm of rain annually, with fewer
than 10 rain days and rear thunderstorms. And Port Sudan, northern Somalia, and
the extreme eastern part of the Ogaden (Ethiopia) get about 100mm of rain.
Areas of low rainfall
These are areas with precipitation values between 100 and 500 mm, annually. They
include countries in the “horn of Africa”, where 500 mm of precipitation occurs in
Eastern Sudan, and northern Ethiopia (16°N). And precipitation values are below
200 mm, annually for most of Somali, the low-lying areas of Kenya (with the
exception of the coastal plains), and the Galla plateau (Ethipia). Outside these large
areas, exist isolated pockets where rainfall does not reach 500 mm per annum.
These include Dodoma (Tanzania), parts of the dry diagonal (Kenya), and the area
of Lake Magadi (at the exit from the Kenyan rift).
Areas of moderate rainfall
These areas experience annual precipitation values of between 500 and 1000 mm.
The 500 mm isohyet include areas north of Raga (Sudan), Bahr el ghazal
depression (Sudan), through Wau and Juba (Sudan) into lake Turkana depression
(Kenya), north-eastern Uganda, the Mau plateaux (Kenya) and the Kenyan rift. The
1000 mm isohyet rounds the Ethiopian highlands, and the isolated Tanzanian
8
highlands, from where it passes through the plateau of Tanzania, then through lake
Victoria (eastern African plateau-Tanzania, Uganda, Kenya), before forming a
narrow corridor below the highlands of Rwanda and Burundi. Also included are
areas along the Kipengere range, and the Mguru and Uluguru mountains
(Tanzania), and the coast of Kenya, south of Lamu.
Areas of adequate rainfall
These areas experience precipitation values of between 1000 to less than 1500 mm,
annually. They include southern-western Sudan, Rwanda, Burundi, two spurs
passing around the Tanzanian plateau-one extending through Uganda alongside
Lake Victoria into the western highlands and another, which lies across south-
eastern Tanzania. This spur reaches the cost between Lamu (Kenya) and Lindi
(Tanzania), and passes into the western side of Lake Nyasa (Tanzania, Malawi,
Mozambique). The Ethiopian bastion is located, to the north, within the first spur and
stands out from its surroundings.
Areas of high to very high rainfall
These areas experience annual precipitation exceeding 1500 mm. This threshold
delimits the boundary of well-watered tropical Africa, where the essential minimum
for maintaining the rainforest is 1500-2000 mm of annual rainfall, as occurs in the
Congo Basin.
The Bukoba region on the western shores of Lake Victoria (Tanzania), and
surrounding areas receive about 2081 mm of rainfall and experiences more than 200
storm days. The area of higher rainfall extends into the Kenyan highlands and
9
Tanzania. And storm activity declines eastwards from the lake, but annual rainfall
amount again rises above 2000 mm within the bastion of the Ethiopian massif, at its
highest, southern elevation. Annual rainfalls above 1500 mm are also associated
with Rungwe massif (Tanzania), the Iringa horst (Tanzania-Mbinga district), the
livingston (Tanzania) mountain and inyange range (Rwanda).
1.2.1.5 Climate in individual East African countries
Due to climate variations, between countries, in East Africa, a single city (the largest
city), within each country has been chosen as a typical example (MSN weather,
2011b) of the country’s climatic condition. Tables 1 to 10, below describe the
temperature and precipitation of the largest city (capital) for each East African
country, as a measure of how each city’s climatic conditions fit the needs of maize
during the growing season. The climate of each city is representative of the country
in which it is located, although regional differences due to modification by relief and
other climatic factors may produce slight variations, within countries, as described
above. Rainfall is irregular, in lots of places, especially in countries located in the
horn of Africa. Besides, reliable data is not available for some places.
Burundi-geography and climate
Burundi is an East African country located on the great lakes region, at latitude 3°
16’ S and longitude 29° 18’ E (MapXL, 2000). It is bordered by Rwanda, to the north
and west, Congo, to the west and Tanzania to the East and south. Its capital is
10
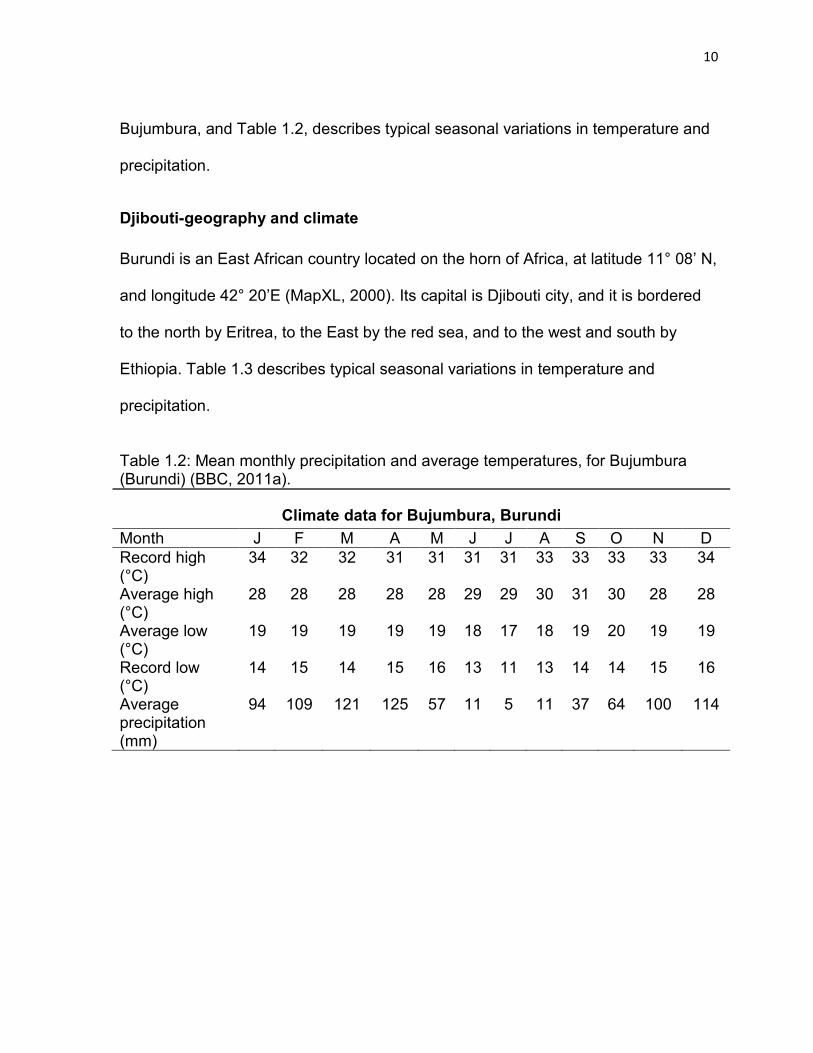
Bujumbura, and Table 1.2, describes typical seasonal variations in temperature and
precipitation.
Djibouti-geography and climate
Burundi is an East African country located on the horn of Africa, at latitude 11° 08’ N,
and longitude 42° 20’E (MapXL, 2000). Its capital is Djibouti city, and it is bordered
to the north by Eritrea, to the East by the red sea, and to the west and south by
Ethiopia. Table 1.3 describes typical seasonal variations in temperature and
precipitation.
Table 1.2: Mean monthly precipitation and average temperatures, for Bujumbura (Burundi) (BBC, 2011a).
Climate data for Bujumbura, Burundi Month J F M A M J J A S O N D Record high (°C)
34 32 32 31 31 31 31 33 33 33 33 34
Average high (°C)
28 28 28 28 28 29 29 30 31 30 28 28
Average low (°C)
19 19 19 19 19 18 17 18 19 20 19 19
Record low (°C)
14 15 14 15 16 13 11 13 14 14 15 16
Average precipitation (mm)
94 109 121 125 57 11 5 11 37 64 100 114

11
Table 1.3: Mean monthly precipitation and average temperatures, for Djibouti City (Djibouti) (BBC, 2011b).
Climate data for Djibouti city, Djibouti Month J F M A M J J A S O N D Record high (°C) 34 34 37 38 44 47 47 47 44 39 36 34 Average high (°C) 29 29 31 32 34 37 41 39 36 33 31 29 Average low (°C) 23 24 25 26 28 30 31 29 29 27 25 23 Record low (°C) 19 18 21 21 21 23 22 22 23 21 18 17 Average precipitation (mm)
10 13 25 13 5 0 3 8 8 10 23 13
Eritrea-geography and climate
Eritrea is an East African country located in the horn of Africa, at latitudes 15° 19’N
and longitudes 38° 55’ E (MapXL, 2000). Its capital is Asmara, and it is bordered by
Sudan and the red sea, in the north, Djibouti and red sea in the east and south, and
mountains in the west. Table 1.4 describes typical seasonal variations in
temperature and precipitation.
Table 1.4: Mean monthly precipitation, and average temperature for Asmara (Eritrea) (MSN weather, 2011a).
Climate data for Asmara, Eritrea Month J F M A M J J A S O N D
Average high (°C)
31 31 33 36 38 38 38 38 38 37 34 32
Average low (°C)
22 22 24 26 28 30 30 30 28 26 24 22
Average precipitation (mm)
2.3 2.1 0.0 0.9 1.7 0.0 0.0 1.2 0.1 0.0 0.0 2.9
12
Ethiopia-geography and climate
Ethiopia is a country in the Horn of Africa, at latitudes 09° 02 N, and longitude 38°
42’ E (MapXL, 2000). Its capital is Addis Ababa, and it is bordered by Eritrea to the
north and north-east, Djibouti and Somalia to the East, Kenya to the south, and
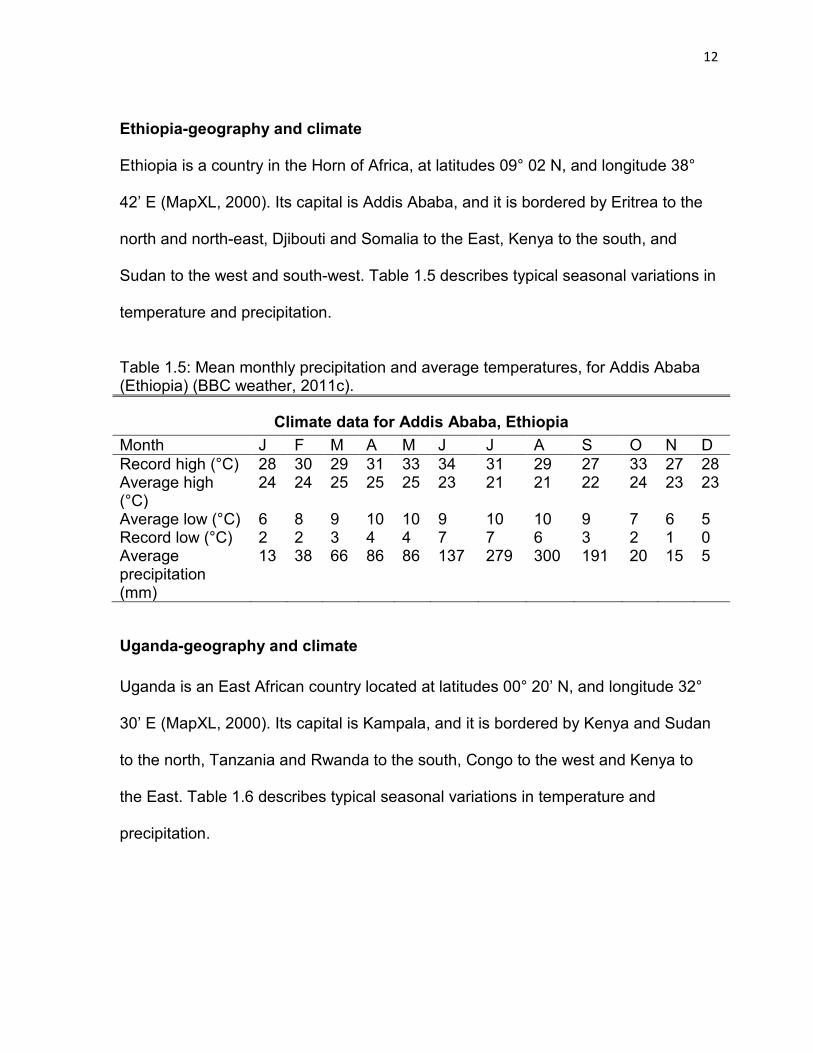
Sudan to the west and south-west. Table 1.5 describes typical seasonal variations in
temperature and precipitation.
Table 1.5: Mean monthly precipitation and average temperatures, for Addis Ababa (Ethiopia) (BBC weather, 2011c).
Climate data for Addis Ababa, Ethiopia Month J F M A M J J A S O N D Record high (°C) 28 30 29 31 33 34 31 29 27 33 27 28 Average high (°C)
24 24 25 25 25 23 21 21 22 24 23 23
Average low (°C) 6 8 9 10 10 9 10 10 9 7 6 5 Record low (°C) 2 2 3 4 4 7 7 6 3 2 1 0 Average precipitation (mm)
13 38 66 86 86 137 279 300 191 20 15 5
Uganda-geography and climate
Uganda is an East African country located at latitudes 00° 20’ N, and longitude 32°
30’ E (MapXL, 2000). Its capital is Kampala, and it is bordered by Kenya and Sudan
to the north, Tanzania and Rwanda to the south, Congo to the west and Kenya to
the East. Table 1.6 describes typical seasonal variations in temperature and
precipitation.
13
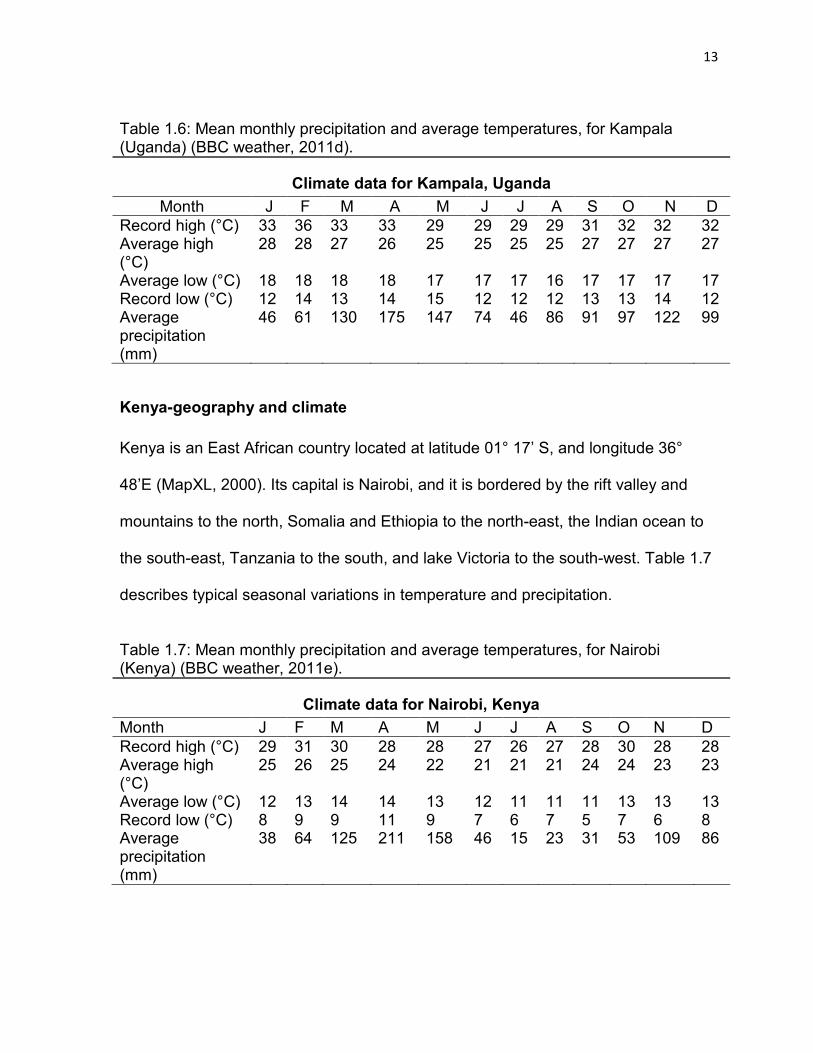
Table 1.6: Mean monthly precipitation and average temperatures, for Kampala (Uganda) (BBC weather, 2011d).
Climate data for Kampala, Uganda Month J F M A M J J A S O N D
Record high (°C) 33 36 33 33 29 29 29 29 31 32 32 32 Average high (°C)
28 28 27 26 25 25 25 25 27 27 27 27
Average low (°C) 18 18 18 18 17 17 17 16 17 17 17 17 Record low (°C) 12 14 13 14 15 12 12 12 13 13 14 12 Average precipitation (mm)
46 61 130 175 147 74 46 86 91 97 122 99
Kenya-geography and climate
Kenya is an East African country located at latitude 01° 17’ S, and longitude 36°
48’E (MapXL, 2000). Its capital is Nairobi, and it is bordered by the rift valley and
mountains to the north, Somalia and Ethiopia to the north-east, the Indian ocean to
the south-east, Tanzania to the south, and lake Victoria to the south-west. Table 1.7
describes typical seasonal variations in temperature and precipitation.
Table 1.7: Mean monthly precipitation and average temperatures, for Nairobi (Kenya) (BBC weather, 2011e).
Climate data for Nairobi, Kenya Month J F M A M J J A S O N D Record high (°C) 29 31 30 28 28 27 26 27 28 30 28 28 Average high (°C)
25 26 25 24 22 21 21 21 24 24 23 23
Average low (°C) 12 13 14 14 13 12 11 11 11 13 13 13 Record low (°C) 8 9 9 11 9 7 6 7 5 7 6 8 Average precipitation (mm)
38 64 125 211 158 46 15 23 31 53 109 86
14
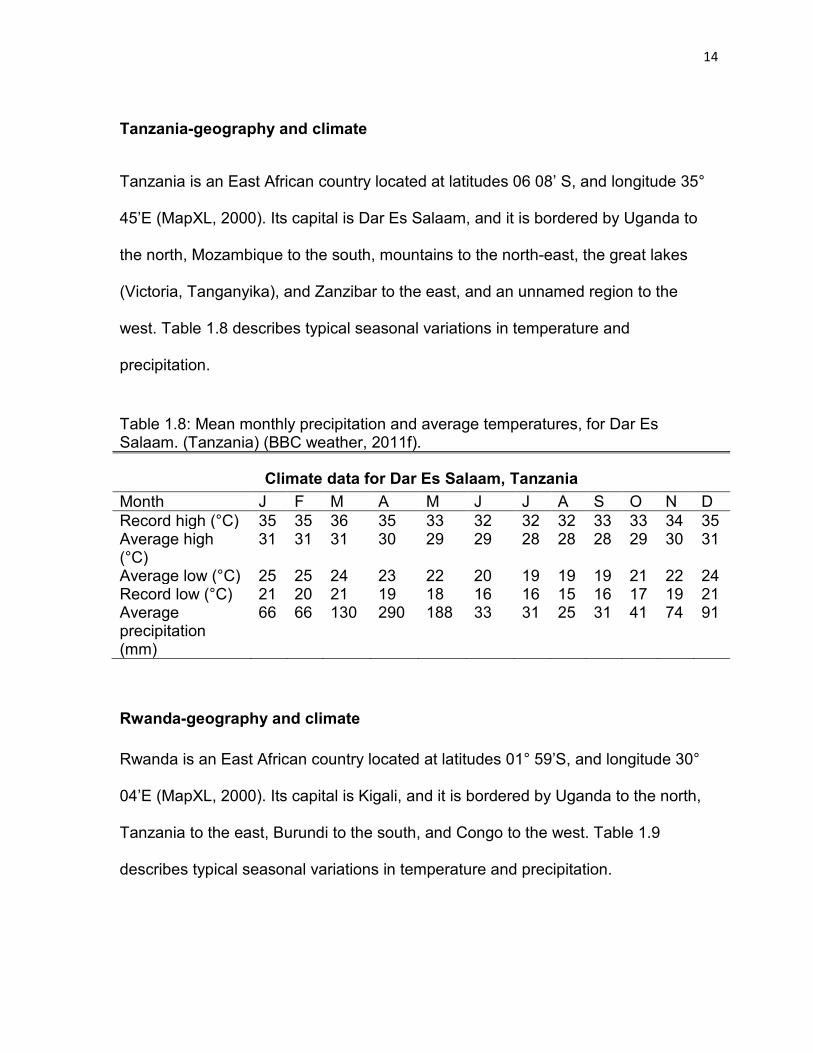
Tanzania-geography and climate
Tanzania is an East African country located at latitudes 06 08’ S, and longitude 35°
45’E (MapXL, 2000). Its capital is Dar Es Salaam, and it is bordered by Uganda to
the north, Mozambique to the south, mountains to the north-east, the great lakes
(Victoria, Tanganyika), and Zanzibar to the east, and an unnamed region to the
west. Table 1.8 describes typical seasonal variations in temperature and
precipitation.
Table 1.8: Mean monthly precipitation and average temperatures, for Dar Es Salaam. (Tanzania) (BBC weather, 2011f).
Climate data for Dar Es Salaam, Tanzania Month J F M A M J J A S O N D Record high (°C) 35 35 36 35 33 32 32 32 33 33 34 35 Average high (°C)
31 31 31 30 29 29 28 28 28 29 30 31
Average low (°C) 25 25 24 23 22 20 19 19 19 21 22 24 Record low (°C) 21 20 21 19 18 16 16 15 16 17 19 21 Average precipitation (mm)
66 66 130 290 188 33 31 25 31 41 74 91
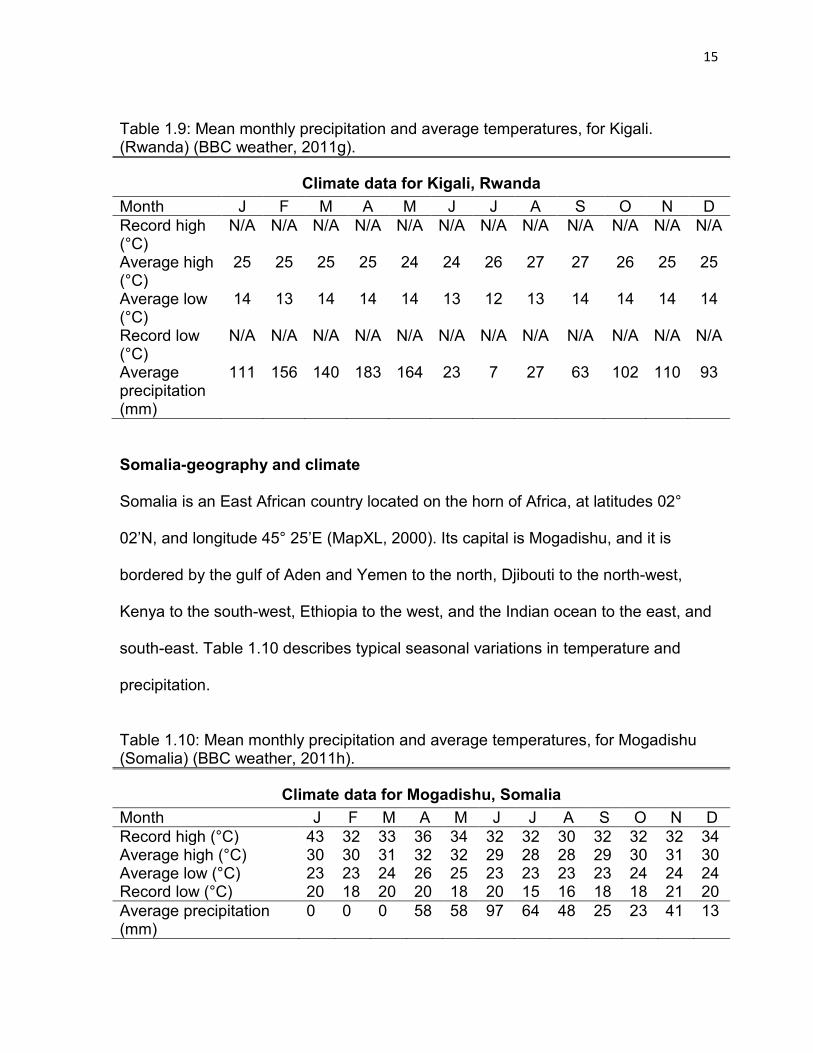
Rwanda-geography and climate
Rwanda is an East African country located at latitudes 01° 59’S, and longitude 30°
04’E (MapXL, 2000). Its capital is Kigali, and it is bordered by Uganda to the north,
Tanzania to the east, Burundi to the south, and Congo to the west. Table 1.9
describes typical seasonal variations in temperature and precipitation.
15
Table 1.9: Mean monthly precipitation and average temperatures, for Kigali. (Rwanda) (BBC weather, 2011g).
Climate data for Kigali, Rwanda Month J F M A M J J A S O N D Record high (°C)
N/A N/A N/A N/A N/A N/A N/A N/A N/A N/A N/A N/A
Average high (°C)
25 25 25 25 24 24 26 27 27 26 25 25
Average low (°C)
14 13 14 14 14 13 12 13 14 14 14 14
Record low (°C)
N/A N/A N/A N/A N/A N/A N/A N/A N/A N/A N/A N/A
Average precipitation (mm)
111 156 140 183 164 23 7 27 63 102 110 93
Somalia-geography and climate
Somalia is an East African country located on the horn of Africa, at latitudes 02°
02’N, and longitude 45° 25’E (MapXL, 2000). Its capital is Mogadishu, and it is
bordered by the gulf of Aden and Yemen to the north, Djibouti to the north-west,
Kenya to the south-west, Ethiopia to the west, and the Indian ocean to the east, and
south-east. Table 1.10 describes typical seasonal variations in temperature and
precipitation.
Table 1.10: Mean monthly precipitation and average temperatures, for Mogadishu (Somalia) (BBC weather, 2011h).
Climate data for Mogadishu, Somalia Month J F M A M J J A S O N D Record high (°C) 43 32 33 36 34 32 32 30 32 32 32 34 Average high (°C) 30 30 31 32 32 29 28 28 29 30 31 30 Average low (°C) 23 23 24 26 25 23 23 23 23 24 24 24 Record low (°C) 20 18 20 20 18 20 15 16 18 18 21 20 Average precipitation (mm)
0 0 0 58 58 97 64 48 25 23 41 13
16
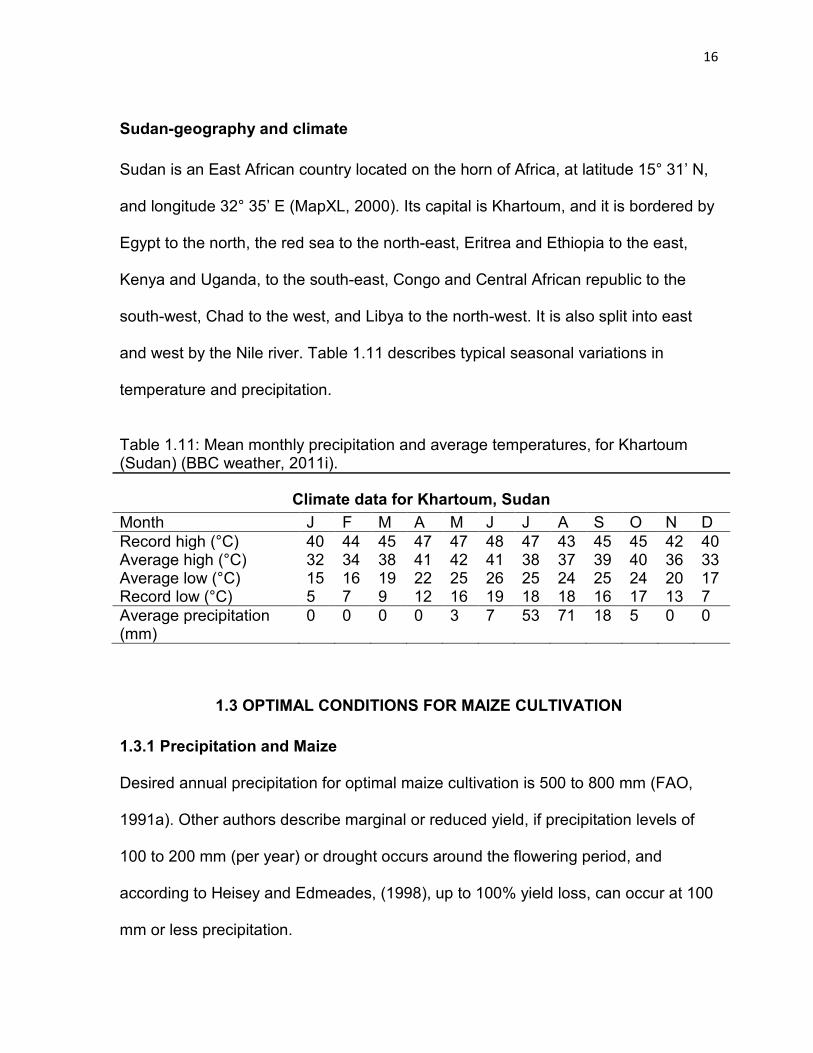
Sudan-geography and climate
Sudan is an East African country located on the horn of Africa, at latitude 15° 31’ N,
and longitude 32° 35’ E (MapXL, 2000). Its capital is Khartoum, and it is bordered by
Egypt to the north, the red sea to the north-east, Eritrea and Ethiopia to the east,
Kenya and Uganda, to the south-east, Congo and Central African republic to the
south-west, Chad to the west, and Libya to the north-west. It is also split into east
and west by the Nile river. Table 1.11 describes typical seasonal variations in
temperature and precipitation.
Table 1.11: Mean monthly precipitation and average temperatures, for Khartoum (Sudan) (BBC weather, 2011i).
Climate data for Khartoum, Sudan Month J F M A M J J A S O N D Record high (°C) 40 44 45 47 47 48 47 43 45 45 42 40 Average high (°C) 32 34 38 41 42 41 38 37 39 40 36 33 Average low (°C) 15 16 19 22 25 26 25 24 25 24 20 17 Record low (°C) 5 7 9 12 16 19 18 18 16 17 13 7 Average precipitation (mm)
0 0 0 0 3 7 53 71 18 5 0 0
1.3 OPTIMAL CONDITIONS FOR MAIZE CULTIVATION
1.3.1 Precipitation and Maize
Desired annual precipitation for optimal maize cultivation is 500 to 800 mm (FAO,
1991a). Other authors describe marginal or reduced yield, if precipitation levels of
100 to 200 mm (per year) or drought occurs around the flowering period, and
according to Heisey and Edmeades, (1998), up to 100% yield loss, can occur at 100
mm or less precipitation.
17
1.3.2 Temperature and maize
According to Bella, et al (2007), maize is grown most intensively in the northern
hemisphere where the isotherm of July is between 21.1 and 26.7ºC, and can be
grown everywhere, except for places where the growing period is too short or too
cold. They described 19ºC-21ºC (June-August) as the lower threshold of the
temperature optimum, as well as 24-26ºC as the optimum for the tassel phase and
milk stage. And concluded that maize is not sensitive to temperature above 15ºC,
during the ripening stage.
Campos, et al (2004) agrees that maize may be grown at 10 to 30ºC and at
precipitation conditions as low as 200 mm, depending on variety. Since growing
maize at the two ends of the temperature spectrum (10 and 30ºC) and low
precipitation (200 mm), produces marginal, instead of optimal yield, it is important to
recognize that growing maize under those temperature conditions require the use of
abundant precipitation or the use of irrigation to prevent the exacerbation of
temperature stress and stress associated with drought (Campos, et al., 2004; Lobell,
et al., 2011).
1.3.3 Drought and maize
Drought refers to extended periods (months or years) when a region experiences
shortage of rainfall. Regions, such as the horn of Africa, experience drought
because of rainfall that is consistently below average precipitation, and also because
the growing season is usually short. Drought is a normal, recurring feature of
climates in parts of the world, and which often has substantial impact on the
18
ecosystem and agriculture of the affected region. Secondary effects include health,
economic and social consequences. It usually causes reduced water quality, mass
migration, internal displacement, international refugees crises, diminished crop yield
and carrying capacity for livestock, desertification and erosion, famine (due to lack of
water for irrigation), habitat damage (affecting both terrestrial and aquatic wildlife),
malnutrition, dehydration, diseases, as well as significant damage and harm to local
economies (Walker, 2004; Mengesha, 2010).
Maize is thought to be more susceptible to drought (FAO, 1991a) at flowering than
other crops. According to Bella, et al (2007) maize plants are able to endure water
stress associated with less than 200 mm of precipitation in places were
groundwater, storage precipitation, or moisture condensation exists. But this may not
be the case in drought regions, of East Africa.
1.3.4 Maize farming and agronomic conditions
The chances of complete germination and crop establishment increase under
favorable soil moisture and temperature conditions. However, wherever the length of
the growing season is limited by the duration of the rainy season, as occurs in the
horn of Africa, early planting reduces the probability of drought during the late grain–
filling stage, and delayed planting (frequently caused by labor and land preparation
constraints) exacerbates agronomic problems. This often results in maize plants that
are tall, prone to lodging, but having relatively fewer kernels per plant. These effects,
along with the increased possibility of terminal drought stress, often result in
significant yield losses (Banziger, et al., 2000, 2002). Breeding of drought-resistant
19
maize varieties that have only half the growing duration of the 140 days (FAO,
1991a) of regular varieties is one approach that has been utilized in the past, to
overcome poor yield due to agronomic stress.
Another proven approach, aimed at improving percent seedling emergence and
establishment, as well as increased yield is seed priming. Seed priming is especially
beneficial for seeds that are hermetically stored, to allow for long-term, safe storage
of maize seeds under harsh (hot, humid, drought) conditions, without the need for
refrigeration and chemical preservatives.
1.4 POST HARVEST MAIZE LOSSES
In general, post-harvest maize losses may be classified into measurable decreases
of maize grain, described as quantitative, qualitative, germinative, nutritive, and
economic losses, while maize kernel damage usually describes superficial evidence
of deterioration, such as insect pest holes or broken kernels. Quantitative losses
refer to reduction in weight, usually resulting from pests (insects, molds, rodents),
and qualitative losses include damage to or contamination of maize, usually
described by comparison with quality standards. Nutritional (qualitative and
quantitative) losses refer to reduction of the food value of maize, germinative losses
describe a reduction in maize germination ability, while economic losses refers to a
reduction in the monetary value of maize (FAO, 1991b; Bern, et al., 2008). Although
Grolleaud (2002) puts post-harvest losses of food grains, due to insect infestation
and mold activity, conservatively at 10–15%, combined insect and mold activity can
result in up to 100% maize loss in East Africa (Demissie et al., 2008).
20
1.5 MAIZE HARVEST AND STORAGE
Maize is usually dried immediately after harvest, and is usually treated with chemical
preservatives such as propionic acid, to prevent molding and rotting, before cold or
warehouse storage (Villers, et al., 2008). However, several authors have proposed
the use of hermetic storage, in place of chemical preservatives and cold storage,
considering its many advantages (Table 1.12), which include being cost-effective,
adaptable to local cultures, and environmentally friendly. It works by the synergistic
effect of O2 depletion and CO2 accumulation, from the respiration of its contents
(Yakubu, et al., 2011). This is because hermetic storage involves storage of
commodities in an airtight and watertight or low permeability environment, that
provides negligible or no gas exchange between the hermetic environment and
external environment. And which creates a modified storage atmosphere that is
lethal to storage insects and molds, maintains constant moisture and preserves
stored commodity (Villers, et al., 2004; Navarro, et al., 2007; IRRI, 2004).
The increasing demand for chemical-, contaminant-, and pathogen-free, high quality
maize, worldwide requires adequate maize preservation, including drying and
protection from insect and microbial damage (Sinha, 1995; Weinberg, et al., 2008),
in post-harvest storage. And encourages maize storage using an effective natural
preservation method, such as hermetic storage.
Hermetic storage has been proven to be effective under hot and humid, tropical
conditions, similar to East African storage conditions, which promote rapid grain
deterioration. This is helpful to subsistence farmers, in these countries since they
lack adequate equipment for drying grains (Mendoza et al., 1982), and harvested
21
maize is often stored while still relatively moist and warm, resulting in rapid
deterioration, due to mold growth. Even where the maize is properly dried before
storage, rewetting due to rain or hygroscopic maize moisture uptake from the humid
environment, resulting from open-air maize storage promotes deterioration (Landers
and Davis, 1986).
The use of hermetic storage, which creates a modified atmosphere, that naturally
controls post-harvest stored maize pests solve these problems.
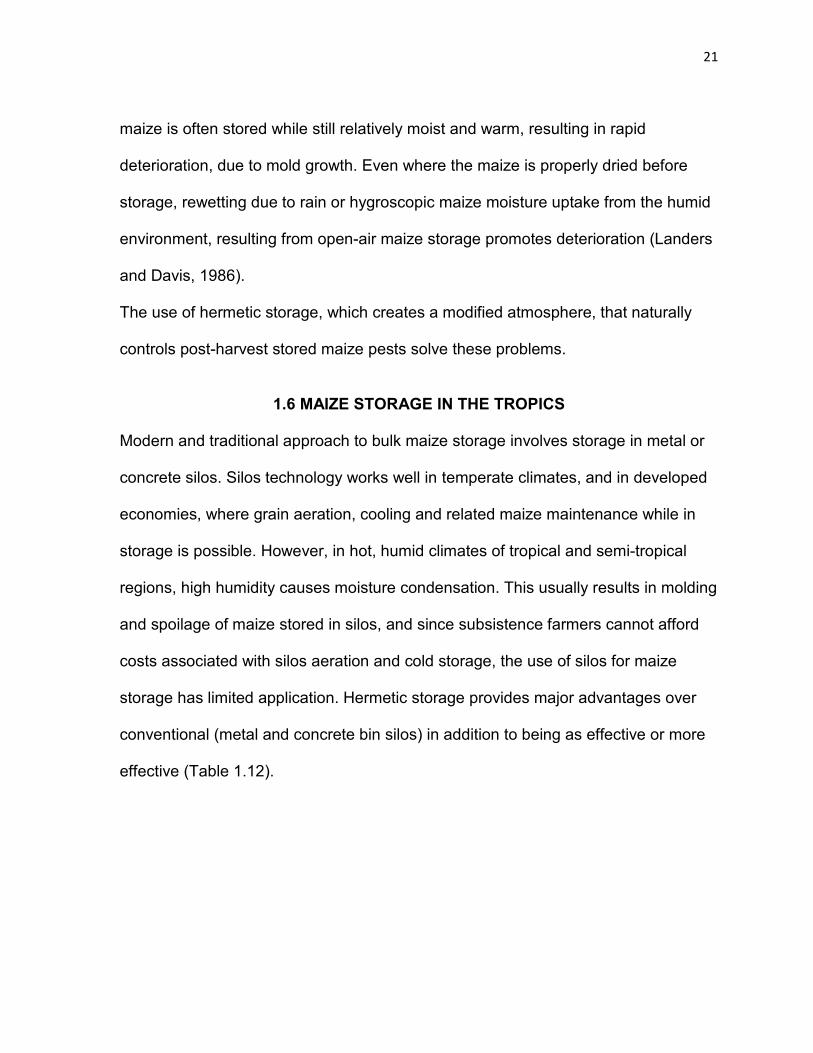
1.6 MAIZE STORAGE IN THE TROPICS
Modern and traditional approach to bulk maize storage involves storage in metal or
concrete silos. Silos technology works well in temperate climates, and in developed
economies, where grain aeration, cooling and related maize maintenance while in
storage is possible. However, in hot, humid climates of tropical and semi-tropical
regions, high humidity causes moisture condensation. This usually results in molding
and spoilage of maize stored in silos, and since subsistence farmers cannot afford
costs associated with silos aeration and cold storage, the use of silos for maize
storage has limited application. Hermetic storage provides major advantages over
conventional (metal and concrete bin silos) in addition to being as effective or more
effective (Table 1.12).
22
Table 1.12: Comparison of hermetic to conventional (metal and concrete bin silos) storage (Villers, et al., 2008). Item of comparison Hermetic
(“Cocoon™”) storage Conventional metal or concrete bin silos
Control measures if infestation occurs
Control by depleted O2. Gas analyzer enables follow up on infestation level, detection of leak
Grain will have to be unloaded and treated with phosphine (PH3)
Fumigation Not needed Required every 6-12 weeks
Condensation at 14% MC
No, if shade is used properly
High risk storage if above 1 month and grain does not remain sufficiently dry (low moisture content (MC)
Protection from rodents
Protected Protected
Moisture level of commodity
Remains constant Moisture content will rise significantly
Length of storage 1 to 5 years 1-3 months depending on climate, silo material (metal or concrete), the extent of the exposure of the roof to absorb solar energy, and initial MC of the commodity
Aeration Not needed Required in temperate climates. Ineffective in tropics due to lack of cold nights
Life span of the structure
10-15 years 20-25 years (if metal is painted periodically against corrosion, and concrete with adequate maintenance)
Set up
Can be quickly set up at any location, indoors or outdoors
Needs concrete floor, access road, construction time

23
Table 1.12: Comparison of hermetic to conventional (metal and concrete bin silos) storage (Villers, et al., 2008)-continued. Item of comparison Hermetic
(“Cocoon™”) storage Conventional metal or concrete bin silos
Mobility (ability to move/dismantle silos and move them to another area)
Excellent Impossible once set up
Hazards
Rodents (but can
easily be prevented)
Dust explosion, caking due to excess of moisture content, condensation
Safe storage duration
Proven for tropical, long term storage
Storage may not be safely extended above 1-3 months
Price per MT or Mg (investment)
US$5-US$80
US $100-250 (including infrastructure and handling equipment)
Auxiliary equipment None Bucket elevator, fans, “sweeper” auger
Infrastructure required None Road, electricity
According to Villers, et al (2008), even when commodities sufficiently dried to safe
moisture contents are stored in silos, in tropical climates, they usually experience
moisture condensation leading to fungal and insect growth, susceptibility to external
humidity, which raises the moisture content to unsafe levels, and cross-
contamination with chemical insecticides used to prevent insect infestation.
1.7 HERMETIC CONTAINER TYPES AND SIZES
Hermetic storage media utilized for storage include rigid containers (cans, 55-gallon
drums, glass-canning jars), as well as flexible materials (polyethylene, polyester,
laminate, cellophane, cloth, and paper) (Copeland and Mcdonald, 1995; Villers, et
24
al., 2008; Yakubu et al., 2011). Most rigid containers have relatively small sizes,
compared to flexible (Figure 1.4 and 1.5) hermetic storage. Common, flexible
storage container sizes include 60 kg to 1 tonne SuperGrainbags™, as well as large
flexible storage Cocoons™ (5 to 1000 tonnes), TranSafeliners™ and Bunkers™,
with sizes ranging from 5 tonnes to 30,000 tonnes (Villers, et al., 2008). The
MegaCocoon™, an upgrade of the Cocoons™, has also been introduced for larger
scale storage of up to 1050 tonnes. According to Villers, et al (2008), Cocoons are
the most widely used form of hermeic storage, and are made from specially
formulated flexible PVC, sealed with special zipper originally developed for use by
astronauts. And their oxygen permeability, at 23ºC, ranges from 3 to 55 cm3 m-2
day-1. SuperGrainbags have served as liners for either polypropylene or jute outer
bags, and hermetic storage of wheat stored at or below its critical moisture content
of 12.5 %, provides storage without significant degradation of quality, and
maintained baking qualities, for up to 4 years. Also, according to the authors, the use
of Bunkers in Cyprus, allowed quality preservation of barley for 3 years, with total
losses of 0.66% to 0.98%, and germination rates above 88%, while storage of wheat
in Cocoons and/or Bunkers reduced losses due to insects or molds to a small
fraction of 1% per year. Grainpro products and other forms of hermetic storage have
been utilized for successful, multiyear storage in several countries, including
Australia, Bangladesh, Botswana, Brazil, Cambodia, China, Costa Rica, Cyprus,
Dominican Republic, East Timor, El Salvador, Ghana, Guatemala, Honduras, Israel,
India, Indonesia, Jamaica, Laos, Pakistan, Peru, Philippines, Rwanda, Sri Lanka,
Sudan, Thailand, Turkey, Uganda, United States, Vietnam, and Zimbabwe.
25
1.8 TYPES OF HERMETIC STORAGE
Hermetic storage can be sub-classified based on how anaerobic condition in the
modified hermetic storage environment is achieved. A biomodified storage
environment is achieved by allowing the natural respiration of insects, molds, and
store grain to use up O2 and produce CO2, making the hermetic environment lethal
to the insects and molds (Navarro, et al., 2007; Yakubu, et al., 2011). Other
implementations of hermitic storage involve rapid withdrawal of O2 from the storage
environment using a vacuum system, or rapidly flooding the environment with
external CO2 or N2 (Villers, 2004). The ability to create a low-oxygen
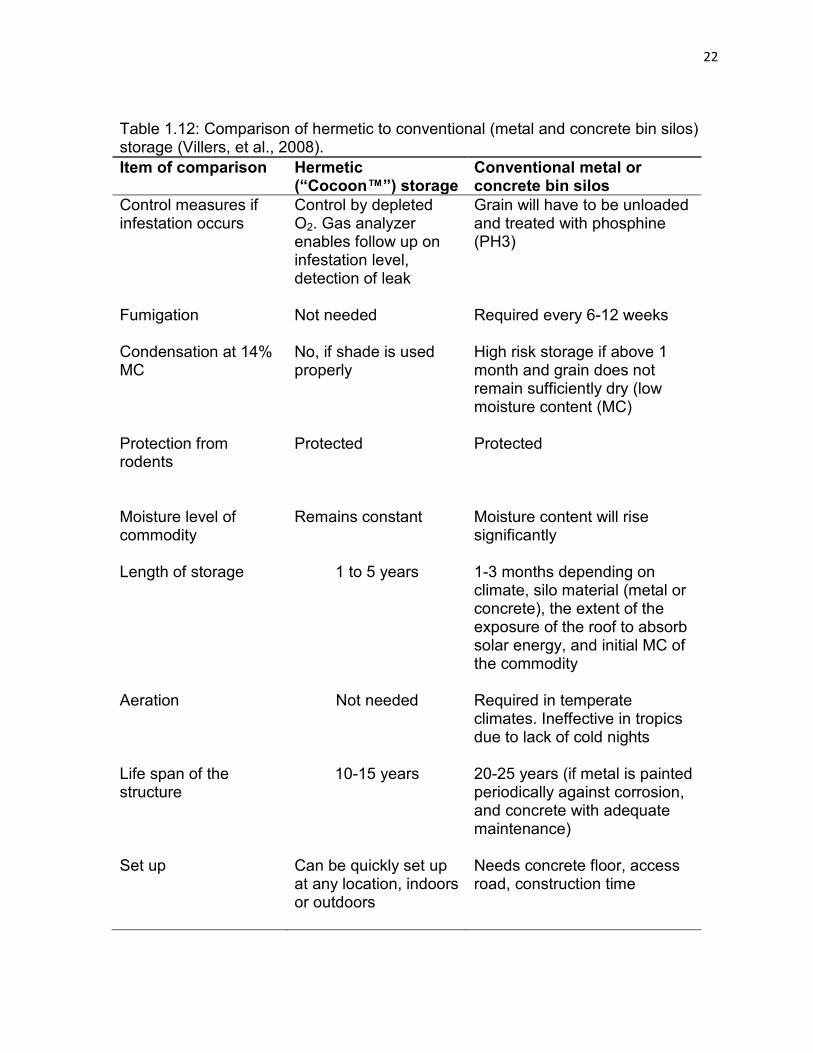
Figure 1.4. Flexible hermetic storage, outdoors (Villers, et al., 2006).
modified atmosphere within a short time (few minutes to two weeks) that results in
100% insect mortality of all life stages and suppresses mold development have other
advantages in addition to the ones already described. Suppressing mold
development protects the stored food from contamination by cancer causing
26
mycotoxins (aflatoxin, ochratoxin A (OTA)) produced by molds. Hermetic storage
also prevents quality losses associated with the release of free fatty acids (FFAs) in
relatively high fat content commodity storage, as occurs in rice bran, brown rice,
peanuts, and cocoa beans (Montemayor, 2004), due to oxidation. And the ability to
store commodities in hermetic storage without the use of chemical pesticides in
post-harvest storage, means reduced storage cost, as well as reduced chemical
toxicity (Murdock, et. al, 2007). Yakubu, et al (2011) discovered that low-oxygen
modified atmospheres can be created in biomodified atmospheres, as rapidly as
necessary, through the manipulation of storage factors (number of weevils,
temperature, maize moisture, container percent fill). Therefore, the choice of
hermetic storage type may be dependent on type and quantity of commodity being
stored, as well as cost of storage. And biogenerated, modified atmosphere is more
likely to be utilized in storing non-crushable, previously dried, commodities (grains)
than crushable commodities (dried fruit, tomatoes).
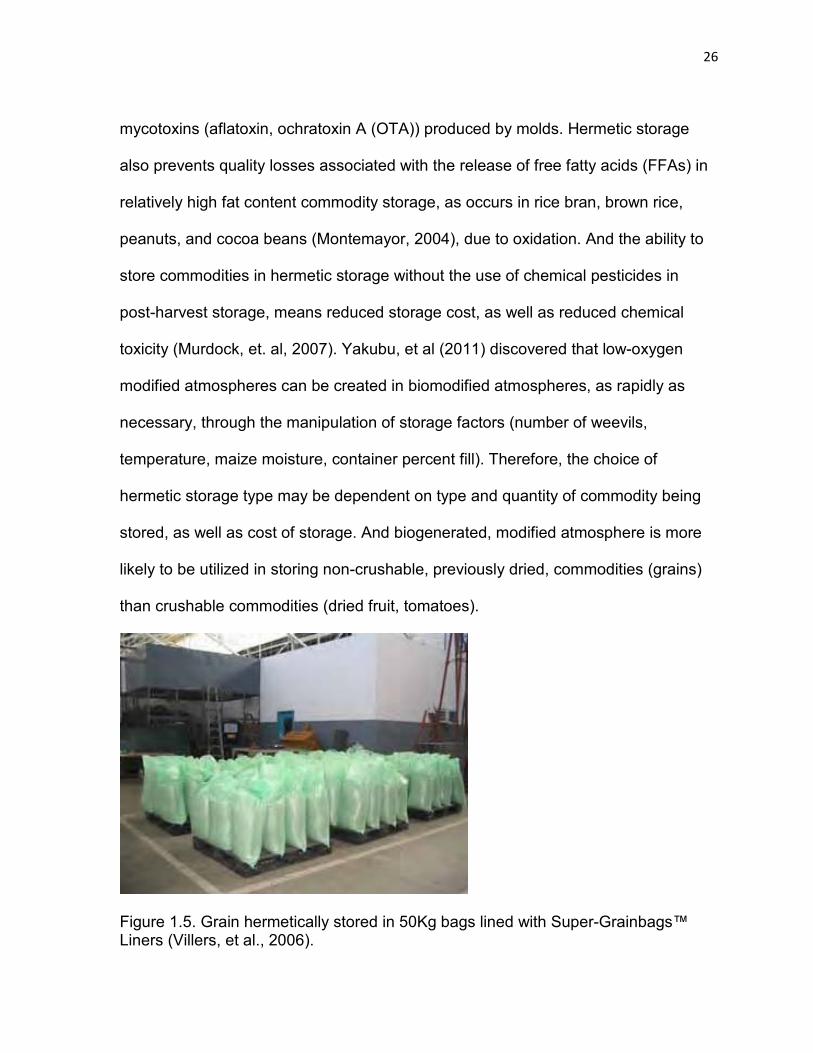
Figure 1.5. Grain hermetically stored in 50Kg bags lined with Super-Grainbags™ Liners (Villers, et al., 2006).
27
In general, hermetic storage has been used for long-term storage of cereal grains
(rice, corn, barley, and wheat), long-term storage of a variety of seeds to preserve
germination potential and vigor, as well as quality preservation of high-value
commodities, such as cocoa and coffee.
1.9 HERMETIC STORAGE ECONOMICS
In addition to preserving seed germination at a favorable rate, hermetic storage is
the cheapest form of storage compared to cold or bin silos storage, when grain or
seed needs to be stored for six months or more (Villers, et al., 2008; Sabio, et al.,
2009).
1.10 FACTORS INFLUENCING HERMETIC STORAGE
Factors influencing the hermetic storage environments include temperature,
moisture and pests. The relative humidity, determined by the temperature and
moisture is usually maintained at 60% and below (Harris and Miller, 2008), to
suppress mold activity, and hermetic storage containers are usually shaded from
direct sunlight, to prevent temperature buildup and the associated moisture
condensation that results from increased relative humidity and water activity. This is
because temperature increases cause increased relative humidity within the
hermetic container, especially at higher maize moisture. Weevils are controlled by a
combination of suppressing relative humidity and O2 within the hermetic
environment, while weevil mortality is aided by increased CO2 or N2. Mechanical
fencing, which usually involves physical separation of the storage environment from
the environment in which rodents live is a common approach utilized in controlling
28
rodent activity. Utilizing metallic containers, such as 55-gallon drums (Seck et al.,
1996; Adhikarinayake, 2005), or placing double- and triple-bagged grain in such a
container fences out the rodents. Double bagging involves placing grain within an
airtight bag, which is tied or sealed and placed in a second bag that is also sealed,
or triple bagging (Fulton, et al., 2009) involves placing the airtight grain-containing
bag in two other airtight bags that sealed separately.
Most descriptions of hermetic storage are qualitative, and do not provide ways to
calculate how long it takes for the O2 within enclosed hermetic environment to be
used up. The study by Yakubu, et al (2011) provided a way to quantify the remnant
O2 in a hermetic container and how long it would take for it to be used up by maize
weevils, microflora, and maize respiration. The prediction takes into account, the
weevil infestation level, as well as temperature and maize moisture, which are
predominant factors in the rate of weevil oxygen consumption and mortality. This
ability to predict time to complete mortality of adult maize weevils, which are the
predominant pests (Holst, et al, 2000; Jacobs and Calvin, 2001; Demissie et al.,
2008) means that factors involved in hermetic storage can be manipulated
successfully for faster weevil mortality and reduced maize spoilage. The study
looked at temperature (10 and 27°C) and maize moisture (8 and16%) extremes
associated with common maize storage, and which favors optimal as well as slow
weevil development. It therefore simulates hot and humid tropical conditions, as well
as cold and dry temperate conditions.
29
1.10.1 Temperature
Temperature has a direct effect on hermetic maize storage as described above.
However, the mortality effect of temperature on weevil mortality is not consistent
across temperature spectrum. Nakakita and Ikenaga (1997) conducted research that
involved measuring the rate of oxygen utilization of ten pre-weighed 2-week old
adults of either S. zeamais or S. Oryzae released in a 15 ml respirometer flask. The
flasks contained a piece of filter paper soaked in 0.1 ml of 10% KOH solution in the
central cell and were covered with brass mesh. Oxygen consumption was measured
at 1-hour intervals, in a Gibson respirometer placed in a temperature-controlled bath,
following pre-conditioning at each temperature (30, 25, 20, 15, 10 and 5°C), for a
maximum of 12 hours. The test insects were obtained from S. zeamais or S. Oryzae
maintained on brown rice for more than 20 years in a culture room at 25±0.5°C and
70±5% relative humidity. They discovered that low temperatures (15°C and below)
inhibited s. zeamais and s. orizae growth, while their population exploded at high
temperature (25 to 30°C).
Studies conducted by Yakubu, et al (2011) discovered similar results and concluded
that intermediate temperatures, which include room temperatures, have intermediate
effect on s. zeamais development. Other authors also noted that the rate of insect
mortality, respiration and reproduction is slower at low temperatures. And that rapid
insect development occurs within a fairly narrow range of 5 to10 degrees around the
optimal temperature, which, for most storage insects, is in the region of 25 to 35°C
(De Lima, 1990; FAO, 1994; IRRI, 2004; Arannilewa, et al., 2006).
30
1.10.2 Maize moisture and hermetic storage
Storage literature (FAO, 1994; De Bruin, 2005) and hermetic storage study involving
microbiological analyses (Weinberg et al., 2008) suggest rapid maize deterioration of
store maize under tropical conditions. The later study, which focused on examining
the effect of moisture content on the quality of maize grains in self-regulated
hermetic storage, concluded that anaerobic, hermetic storage provides an excellent
solution to preventing insect development. It is, therefore, capable of preventing
insect damage to stored maize (Navarro, et al., 1996; Yakubu, et al., 2011) as well
as mold development during storage.
1.10.2.1 Laboratory hermetic study
Overall, the hermetic study by Weinberg et al (2008) utilized maize samples at 14,
16, 18, 20 and 22% moisture contents, conditioned for 28 days in tightly wrapped
plastic bags and stored in sealed containers, at 30°C, for 75 days. And was aimed at
determining the effect of moisture content on the quality of maize stored under self-
regulated modified atmospheres during hermetic storage. Self-regulated hermetic
storage refers to storage in which combined metabolic activity of stored maize,
insects, and microflora present in the hermetic atmosphere utilize O2 and releases
CO2 that kills the insects and microflora, preserving maize quality. The research
concluded that at low moistures of 14% and below, the mold count was negligible,
following hermetic storage, and safe for consumption.
31
Experimental procedure
Maize samples preparation
Maize grain at about 14% moisture obtained from a local feed center was cleaned to
remove impurities and broken kernels. It was then divided into five batches and the
batches were moistened to 14, 16, 18, 20 and 22% moisture contents respectively.
This was done by spraying calculated amounts of distilled water over the grains,
which were spread in a thin layer on a 30-40 cm plastic tub, while thoroughly hand
mixing the grain and water. 8 kg of each moistened maize samples were tightly
wrapped in a plastic bag and stored for 4 weeks at 5±1°C and shaken for a few
minutes everyday.
Experimental maize
Maize at the same moisture content were removed from the bags, thoroughly mixed
and about 500 g was placed in each 1-L glass jars. Every jar was sealed with a
screw-cap gas-tight lid and special clamps, and stored at 30°C. Each moisture
content had 12 jars of maize, three of which were sampled for analysis after 15, 35,
55 and 75 days, respectively. Gas sampling was made possible by drilling a hole in
the jar lids fitted with silicon-rubber septum, while the exact jar volumes were pre-
determined by measuring the volume of distilled water that filled each.
Analytical procedure
Following storage, the percent germination of grains at each moisture content were
determined by placing them on damp filter paper at 18°C, for 10 days. Maize
samples moisture content were determined using the oven test method, by exposing
32
samples of maize to 105°C oven for 24 hours. Equilibrium relative humidity (e.r.h)
was determined at 25°C, and pH was measured in a 10-fold aqueous extraction of
20-g samples. Ethanol and volatile fatty acid (VFA) were determined in aqueous
extracts, over a temperature range of 40 to 230°C, and maize losses were evaluated
according to weight loss, expressed as gas loss (g kg_1), while headspace ethanol
was determined with a gas chromatograph. Headspaces atmospheric gas
composition was determined by withdrawing gas samples using a 3-ml gas-tight
syringe, and O2, N2 and CO2 concentrations.
Microbiological analysis
Microbiological evaluation involved enumeration of the total aerobic bacteria in plate
count agar (Scharlau Microbiology, Barcelona, Spain), and yeasts, as well as molds
on spread-plate malt extract agar (Difco, Detroit, MI, USA) acidified with lactic acid
to pH of 4.0. The plates were incubated for 3 days at 30°C.
Statistical analysis
GLM procedure (SAS Institute Inc.,100 SAS Campus Drive, Cary, NC 27513) was
utilized in the statistical analysis of the results, including analysis of variance and
Duncan’s multiple range test.
Results and discussion
The maize utilized in the research had initial moisture contents of 14%, 16%, 18%,
20% and 22%, corresponding to about 77.5±0.3, 85.2±0.3, 89.2±0.3, 91.5±0.4 and
92.5 ±1.2%, relative humidity respectively within hermetic storage. However,

33
moisture content increased, by 8-17 g kg_1 during hermetic storage, due to
respiratory activity within the hermetic ecosystem.
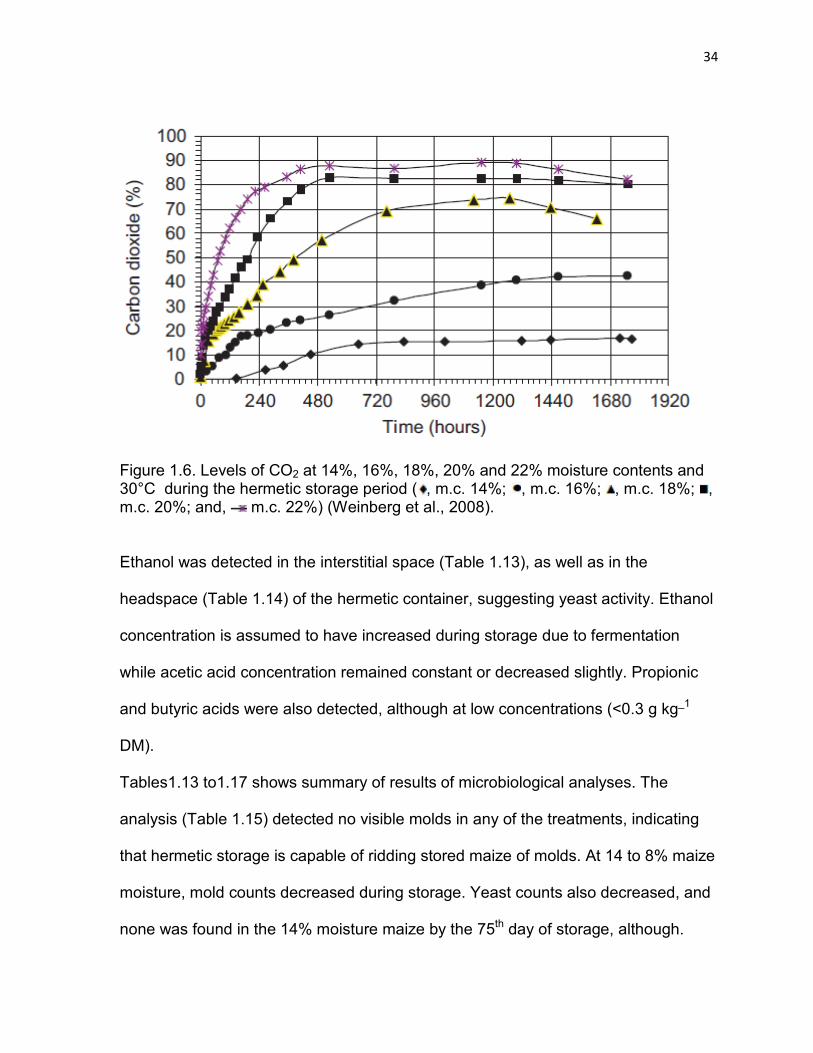
The authors demonstrated the change in various atmospheric gas contents that
occur within sealed maize containers at each moisture content, and suggested that
the higher the moisture content, the shorter the time it took for the O2 to be
consumed and replaced with CO2 during aerobic respiration (Yakubu, et al. 2011).
This is evident from hermetic containers, where most of the O2, in the containers
with 14, 16, 18, 20 and 22% moisture content was consumed after 600, 120, 48, 24
and 12 h, respectively. They also showed that in the maize with 14 to16% moisture
content CO2 replaced only the O2, and N2 level initially remained constant. However,
for the higher moisture maize, as more CO2 was produced, the percentage of N2
decreased in the sealed containers. Following the aerobic respiration phase,
anaerobic respiration continued to produce CO2. And they measured the levels of
anaerobic respiration after a plateau of CO2 level was reached and for up to 1776 h
(74 days) (Figure 1.6).
Changes in hermetically store maize
The pH of the 22% moisture maize decreased from 5.8 on day 0 to 5.5 on day 75,
while those of the other moisture maize remained around 6.0. Dry matter losses also
increased with increasing maize moisture content. The highest concentration of
major volatile products found in maize (ethanol and acetic acid) occurred in maize
with higher moisture contents (20 and 22%).
34
Figure 1.6. Levels of CO2 at 14%, 16%, 18%, 20% and 22% moisture contents and 30°C during the hermetic storage period ( , m.c. 14%; , m.c. 16%; , m.c. 18%; , m.c. 20%; and, m.c. 22%) (Weinberg et al., 2008).
Ethanol was detected in the interstitial space (Table 1.13), as well as in the
headspace (Table 1.14) of the hermetic container, suggesting yeast activity. Ethanol
concentration is assumed to have increased during storage due to fermentation
while acetic acid concentration remained constant or decreased slightly. Propionic
and butyric acids were also detected, although at low concentrations (<0.3 g kg_1
DM).
Tables1.13 to1.17 shows summary of results of microbiological analyses. The
analysis (Table 1.15) detected no visible molds in any of the treatments, indicating
that hermetic storage is capable of ridding stored maize of molds. At 14 to 8% maize
moisture, mold counts decreased during storage. Yeast counts also decreased, and
none was found in the 14% moisture maize by the 75th day of storage, although.
35
However, yeast were still present on the 55th day, although bacteria in various
treatments tended to decrease during storage. Overall, the population of these
microorganisms were within safe limits regarding freedom from substantial spoilage
(<log10/g=4.0). At 20 and 22% moisture content, yeasts and bacteria count were
higher, tended to increase during storage, reaching population levels (>log10/g=6.0)
usually associated with spoilage of vegetable food commodities. Interestingly, molds
counts decreased rapidly at these maize moistures, and no molds were found by the
55th day of storage. This is understandable, considering that the rate of oxygen
utilization and hence respiration is higher at higher maize moisture (Weinberg, et al.,
2008; Yakubu, et al., 2011).
Dry matter loss
Results from the research indicate that some respiration and microbiological activity
took place in intermediate moisture (15 to 18%) maize stored in hermetically sealed
containers.
At 14% moisture content, almost no biological activity took place, and the stored
maize retained their quality, as expected. The results indicate that the higher the
moisture content, the faster the CO2 build-up, in the hermetic containers. This CO2
build-up is accompanied by an increase in pressure, and from the gas exchange (O2
and CO2) observation (Weinberg et al., 2008), it appears that at 14 and 16%
moisture content, the respiration was aerobic and no excess of pressure occcured.
The CO2 concentration did not exceed 20% by volume, at those moistures.
However, above 18% moisture content, a gradual increase in CO2 concentrations
36
was observed that exceeded the volume of O2 consumed, indicating that anaerobic
respiration occurred (Zettler and Navarro, 2001). The jars used in these experiments
were equipped with septa through which periodic gas samples were taken. During
the gas sampling, pressure build-up was observed, particularly at 18-22% moisture
contents. This is evident from the levels of CO2 reaching 74%, 83% and 89% at 18,
20 and 22% moisture contents, respectively (Figure 1.6). The volume of N2 in a
completely sealed, hermetic environment was assumed by the authors to stay the
same, since it is an inert gas and should not take part in the aerobic or anaerobic
metabolic respiratory reactions. However, actual amount and proportion of N2
decreased due to losses during sampling. And since the amount and proportion of
CO2 increased due to anaerobic respiration, the percentages of N2 and CO2
measured changed continually during the research.
The starting hypothesis of this study was that in intermediate moisture contents,
maize under sealed storage conditions, had limited microbial activity resulting in the
production of VFAs, which inhibits yeasts and molds that are the major spoilage
microorganisms in such commodities (Moon, 1983). However, ethanol was found in
higher concentrations than VFAs, which might indicate yeast activity (Table 1.16).
Acetic acid was found in concentrations that were probably too low to inhibit yeasts
and molds. And at higher (20 and 22%) moisture levels, large numbers of yeast and
molds were found during the initial stages of storage, leading to higher dry matter
losses.

37
Pressure buildup and relief
Gas-tight containers with high moisture maize must be equipped with pressure
release valves, to reduce the pressure buildup associated with increased CO2
volume from respiratory activities. Since small experimental jars, have rigid walls,
and can withstand more pressure, the lack of a pressure release valve is not
expected to have as much impact on the walls of the storage containers. However,
such pressure build-up can cause the weak joints of large rigid or flexible structures
to explode.
Table 1.13. Ethanol (Et) and acetic acid (HAc) contents (g kg_1 DM) in maize under hermetic storage (Weinberg et al., 2008). Time (days) Moisture (%)
14 16 18 20 22
Et HAc Et HAc Et HAc Et HAc Et HAc
0 0 0.5 0 0.7 0 0.7 0 0.4 0 1.0
15 0d 0.2 0d 0.3 0.7c 0.4 1.5b 0.5 2.5a 0.5
35 0d 0.5 0.3c,d 0.6 1.3c 0.7 2.8b 0.4 3.7a 0.8
55 0.1d 0.5 0d 0.3 2.0c 0.5 2.8b 0.4 4.1a 0.6
75 0d 0.4 0.9c,d 0.4 2.0b,c 0.3 3.8a,b 0.4 5.0a 0.5
For ethanol, within a row, means followed by different letters are significantly
different (p<0.05). Propionic and butyric acids were detected at low concentrations
(<0.3 g kg_1 DM) in some samples, with no consistent pattern.
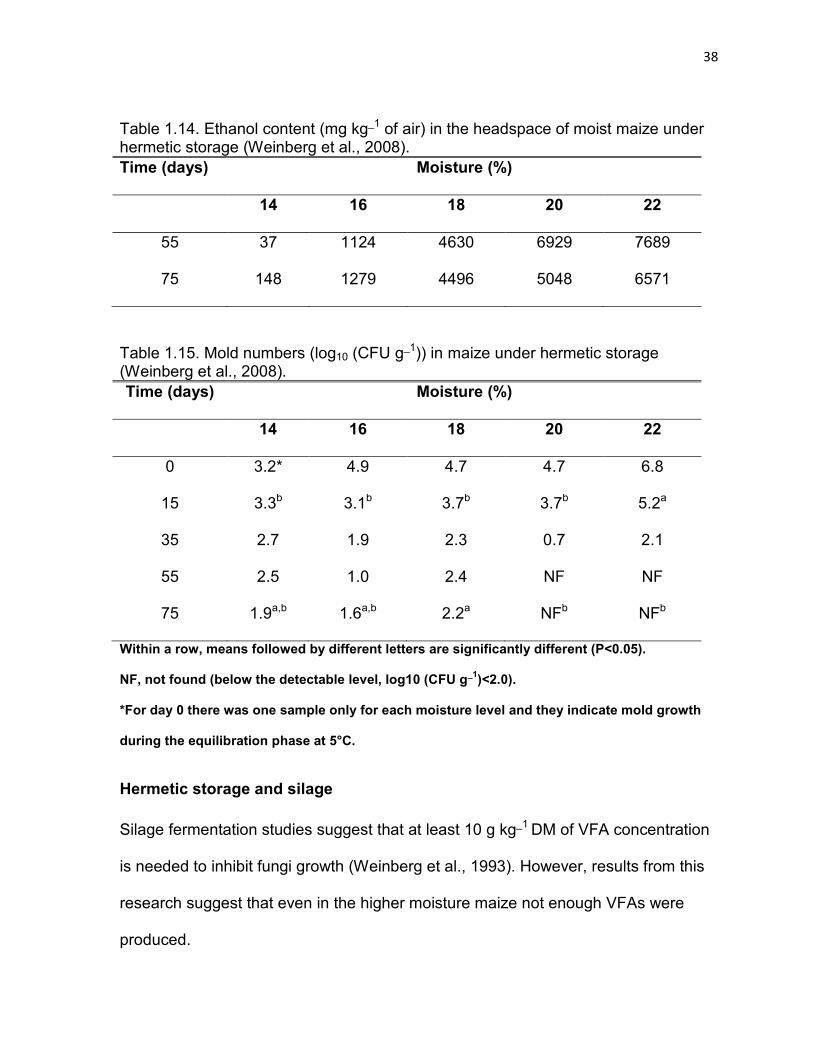
38
Table 1.14. Ethanol content (mg kg_1 of air) in the headspace of moist maize under hermetic storage (Weinberg et al., 2008). Time (days) Moisture (%)
14 16 18 20 22
55 37 1124 4630 6929 7689
75 148 1279 4496 5048 6571
Table 1.15. Mold numbers (log10 (CFU g_1)) in maize under hermetic storage (Weinberg et al., 2008). Time (days) Moisture (%)
14 16 18 20 22
0 3.2* 4.9 4.7 4.7 6.8
15 3.3b 3.1b 3.7b 3.7b 5.2a
35 2.7 1.9 2.3 0.7 2.1
55 2.5 1.0 2.4 NF NF
75 1.9a,b 1.6a,b 2.2a NFb NFb
Within a row, means followed by different letters are significantly different (P<0.05).
NF, not found (below the detectable level, log10 (CFU g_1)<2.0).
*For day 0 there was one sample only for each moisture level and they indicate mold growth
during the equilibration phase at 5°C.
Hermetic storage and silage
Silage fermentation studies suggest that at least 10 g kg_1 DM of VFA concentration
is needed to inhibit fungi growth (Weinberg et al., 1993). However, results from this
research suggest that even in the higher moisture maize not enough VFAs were
produced.
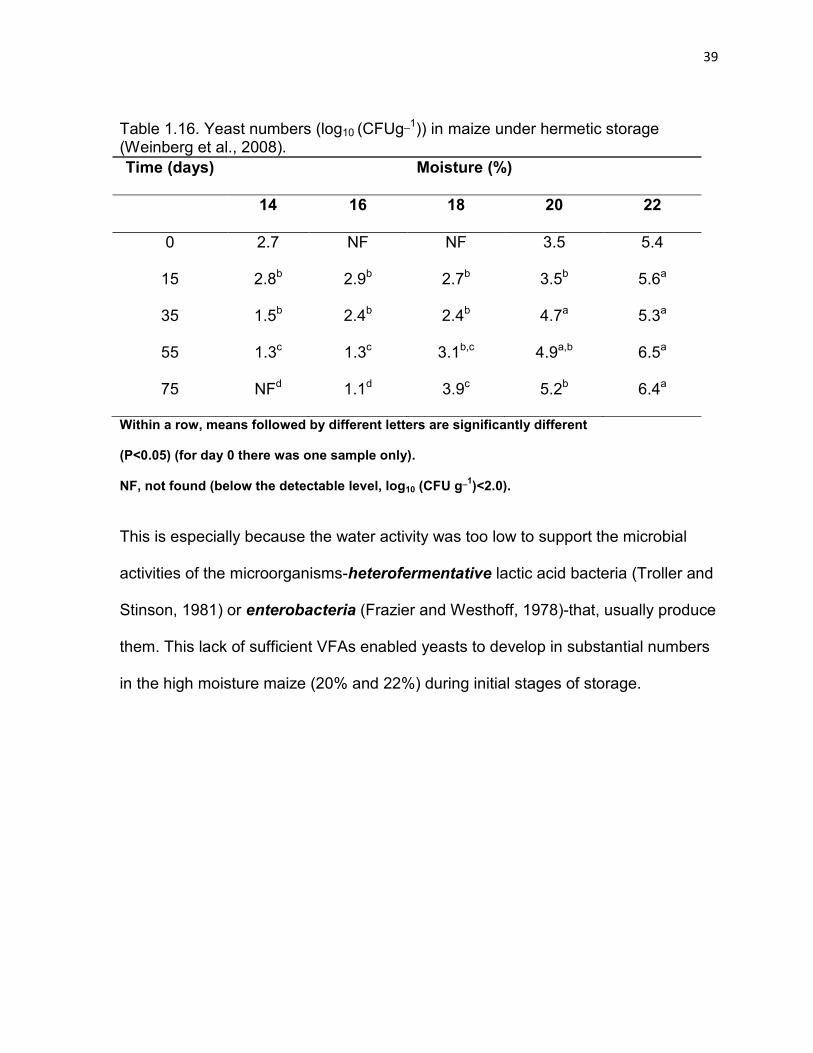
39
Table 1.16. Yeast numbers (log10 (CFUg_1)) in maize under hermetic storage (Weinberg et al., 2008). Time (days) Moisture (%)
14 16 18 20 22
0 2.7 NF NF 3.5 5.4
15 2.8b 2.9b 2.7b 3.5b 5.6a
35 1.5b 2.4b 2.4b 4.7a 5.3a
55 1.3c 1.3c 3.1b,c 4.9a,b 6.5a
75 NFd 1.1d 3.9c 5.2b 6.4a
Within a row, means followed by different letters are significantly different
(P<0.05) (for day 0 there was one sample only).
NF, not found (below the detectable level, log10 (CFU g_1)<2.0).
This is especially because the water activity was too low to support the microbial
activities of the microorganisms-heterofermentative lactic acid bacteria (Troller and
Stinson, 1981) or enterobacteria (Frazier and Westhoff, 1978)-that, usually produce
them. This lack of sufficient VFAs enabled yeasts to develop in substantial numbers
in the high moisture maize (20% and 22%) during initial stages of storage.
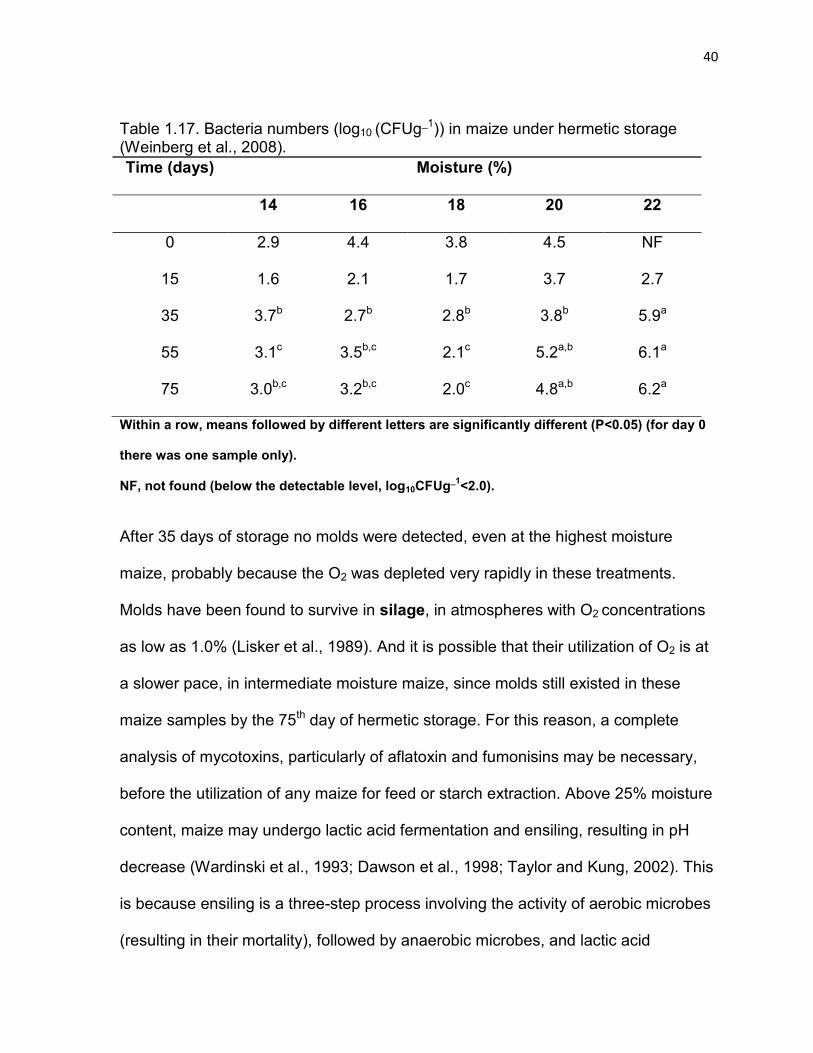
40
Table 1.17. Bacteria numbers (log10 (CFUg_1)) in maize under hermetic storage (Weinberg et al., 2008). Time (days) Moisture (%)
14 16 18 20 22
0 2.9 4.4 3.8 4.5 NF
15 1.6 2.1 1.7 3.7 2.7
35 3.7b 2.7b 2.8b 3.8b 5.9a
55 3.1c 3.5b,c 2.1c 5.2a,b 6.1a
75 3.0b,c 3.2b,c 2.0c 4.8a,b 6.2a
Within a row, means followed by different letters are significantly different (P<0.05) (for day 0
there was one sample only).
NF, not found (below the detectable level, log10CFUg_1<2.0).
After 35 days of storage no molds were detected, even at the highest moisture
maize, probably because the O2 was depleted very rapidly in these treatments.
Molds have been found to survive in silage, in atmospheres with O2 concentrations
as low as 1.0% (Lisker et al., 1989). And it is possible that their utilization of O2 is at
a slower pace, in intermediate moisture maize, since molds still existed in these
maize samples by the 75th day of hermetic storage. For this reason, a complete
analysis of mycotoxins, particularly of aflatoxin and fumonisins may be necessary,
before the utilization of any maize for feed or starch extraction. Above 25% moisture
content, maize may undergo lactic acid fermentation and ensiling, resulting in pH
decrease (Wardinski et al., 1993; Dawson et al., 1998; Taylor and Kung, 2002). This
is because ensiling is a three-step process involving the activity of aerobic microbes
(resulting in their mortality), followed by anaerobic microbes, and lactic acid
41
fermentation. The fermentation then produces pH decreases that result in the
mortality of the anaerobic microbes, and grain preservation (Bern, et al., 2008).
However, maize ensiled at this moisture contents, may only be suitable for animal
feeding purposes, because of the high bacterial count (Weinberg et al., 2008).
According to some authors, it is possible to ensile high-moisture maize at (25 to
28%) with and without microbial and chemical additives for use as animal feed. This
is because, during the ensiling fermentation of high-moisture maize, lactic acid
bacteria produce organic acids (mainly lactic and acetic acids), which decreases pH
to 4.0 to 4.5, to kill microbes. It is, however, necessary to protect this silage against
molds, using suitable antifungal agents, since they spoil quickly upon aerobic
exposure (Wardinski et al., 1993; Dawson et al., 1998; Taylor and Kung, 2002).
Conclusions
In this laboratory scale hermetic storage study, maize at intermediate and high
moisture contents was stored in hermetically sealed jars without spoilage. The
preservation was possible because of the synergistic effect of respired gases (O2,
CO2), involving decreases in O2 and accumulation of CO2, and not due to VFAs,
which were only present at very low levels. Considering that unintended
fermentation and alcohol production, at intermediate and high moisture hermetic
storage results in dry matter loss and increased CO2 production, it is safer to store
maize at below 14% moisture. This is also important considering that maize bacteria
count increases with increasing moisture content, while negligible microbial activity
occurred at 14% maize moisture.
42
Based on these research results, the authors proposed the avoidance of the cost
associated with drying to low moistures necessary for maize storage. They further
proposed the storage of maize at high moistures for ethanol production, where risk
of mycotoxin presence might not be a critical issue, as against the current practice of
first drying to safe storage moistures and adding water just before ethanol extraction.
The authors found the results sufficiently encouraging to justify further commercial
scale trials on high moisture storage of maize for ethanol production, accompanied
by economical feasibility studies. They also suggested the need to undertake further
studies regarding commercial scale utilization of hermetically sealed plastic
containers, in order to determine the maximal safe moisture content for hermetic
storage under field conditions, and to determine and justify its economical feasibility.
1.10.2.2 Field hermetic studies
Other authors have also conducted interesting and complementary studies regarding
field implementations of hermetic storage. These studies considered general
principles, but have also introduced other perspectives. Two of such studies were
described by Aronson, et al (2005) and Harris and Miller (2008).
1.11 RODENTS AND HERMETIC STORAGE
According to Villers, et al (2008), properly designed hermetic storage is highly rodent
resistant, and additional rodent resistance is provided in the case of large hermetic
enclosures such as Cocoons by using tough, slippery materials such as flexible PVC
(typically 0.83 mm thick), and tensioning straps, which prevent rodents from getting
a tooth hold. Another, common approach, is mechanical fencing, which involves
43
physical separation of the maize contained in a metallic can and the exterior
environment (Bern, et al., 2008).
1.12 HERMETIC STORAGE AND SEED DORMANCY
Seed dormancy is the effective delay of seed germination, under unfavorable
ecological conditions. Viable seeds may therefore undergo dormancy, which allows
them to preserve vigor and germinative power, while metabolically inactive-under
unfavorable conditions-until favorable conditions for germination are reintroduced
(Basra, 2006; Armitage and Woods, 1999; Sabio, et al., 2006). Following reversible
(hermetic) seed stress (such as hypoxia), dormancy must be broken using seed
conditioning techniques such as priming, to obtain seeds’ natural germination rates,
increase seedling stands, and crop yield (Spann, 1998; Armitage and Woods, 1999;
CRC, 2001).
1.13 SEEDS
Seeds usually develop as a result of pollination of the female part (stigma) of a plant
by the male part (anther) of a plant (Hill, 1995), and are an important food source
(Contreras, 2011). Among some of the most economically important species are
members of the Poaceae family (Maize, wheat, rice, etc), which contribute mostly
carbohydrate, and the Fabaceae family (soybean, peanut, beans), which contribute
mostly oil and protein to human diet.
Seeds of angiosperms (flowering plants) are generally classified into monocotyledon
and dicotyledon, based on nutrient storage organs (cotyledon). In monocotyledons,
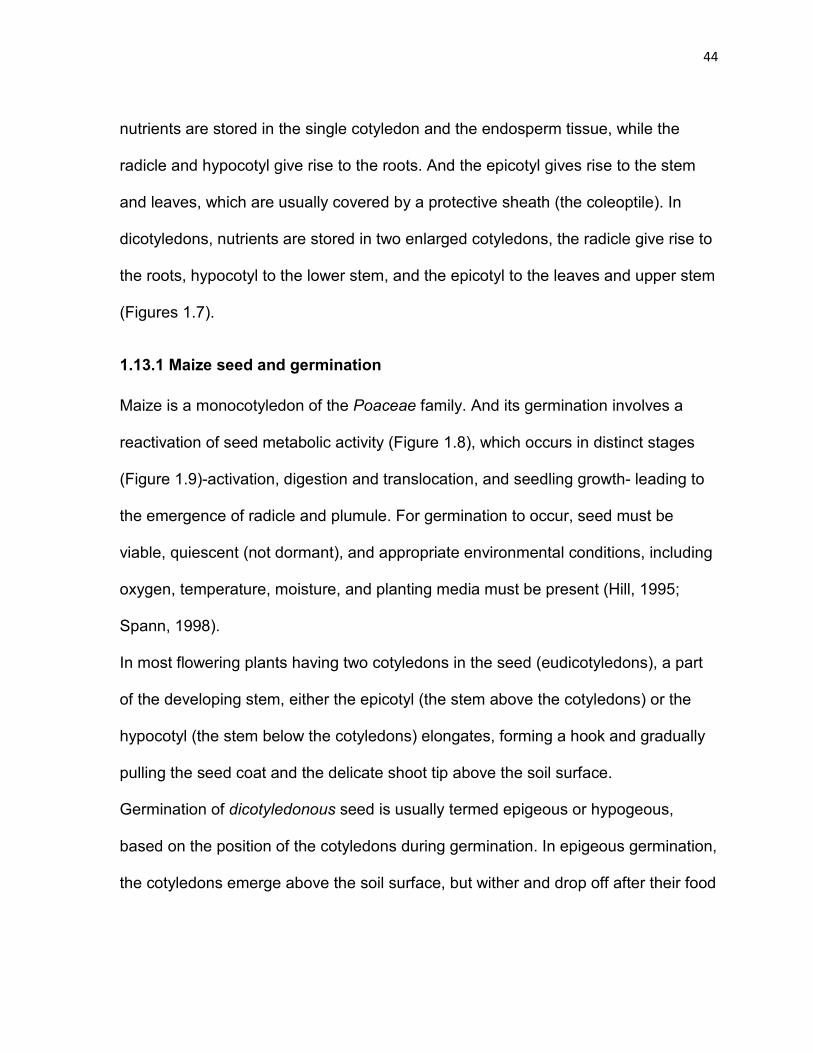
44
nutrients are stored in the single cotyledon and the endosperm tissue, while the
radicle and hypocotyl give rise to the roots. And the epicotyl gives rise to the stem
and leaves, which are usually covered by a protective sheath (the coleoptile). In
dicotyledons, nutrients are stored in two enlarged cotyledons, the radicle give rise to
the roots, hypocotyl to the lower stem, and the epicotyl to the leaves and upper stem
(Figures 1.7).
1.13.1 Maize seed and germination Maize is a monocotyledon of the Poaceae family. And its germination involves a
reactivation of seed metabolic activity (Figure 1.8), which occurs in distinct stages
(Figure 1.9)-activation, digestion and translocation, and seedling growth- leading to
the emergence of radicle and plumule. For germination to occur, seed must be
viable, quiescent (not dormant), and appropriate environmental conditions, including
oxygen, temperature, moisture, and planting media must be present (Hill, 1995;
Spann, 1998).
In most flowering plants having two cotyledons in the seed (eudicotyledons), a part
of the developing stem, either the epicotyl (the stem above the cotyledons) or the
hypocotyl (the stem below the cotyledons) elongates, forming a hook and gradually
pulling the seed coat and the delicate shoot tip above the soil surface.
Germination of dicotyledonous seed is usually termed epigeous or hypogeous,
based on the position of the cotyledons during germination. In epigeous germination,
the cotyledons emerge above the soil surface, but wither and drop off after their food
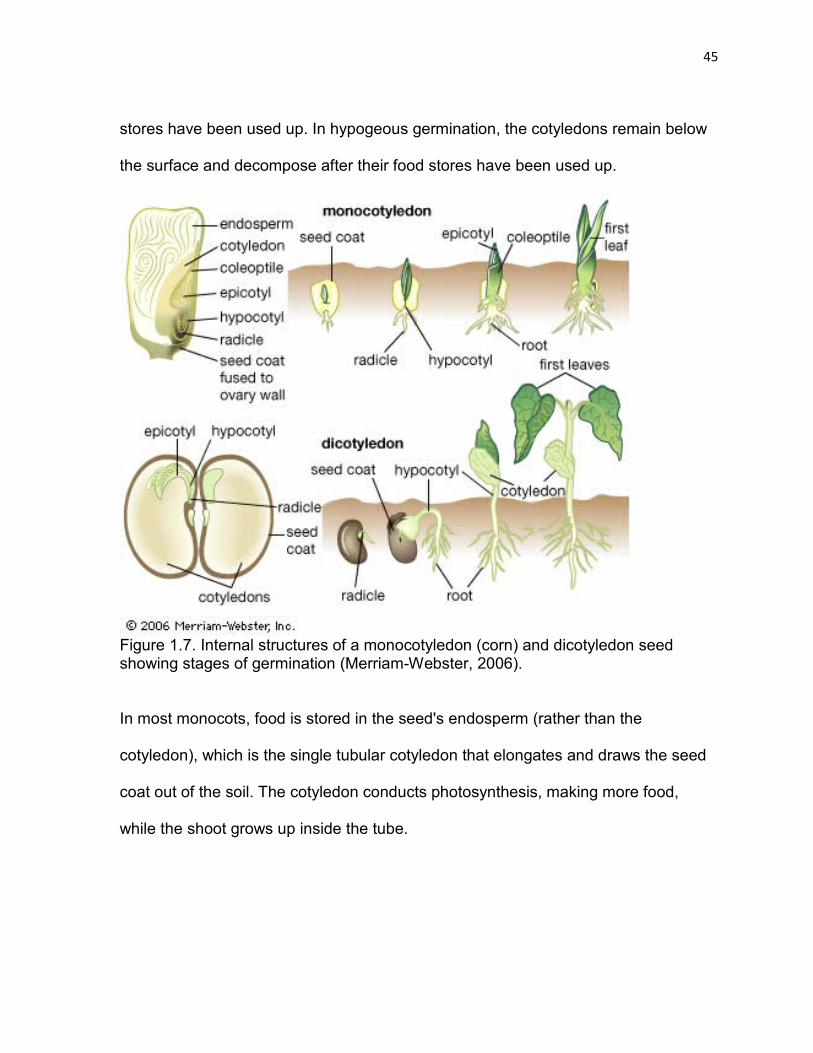
45
stores have been used up. In hypogeous germination, the cotyledons remain below
the surface and decompose after their food stores have been used up.
Figure 1.7. Internal structures of a monocotyledon (corn) and dicotyledon seed showing stages of germination (Merriam-Webster, 2006). In most monocots, food is stored in the seed's endosperm (rather than the
cotyledon), which is the single tubular cotyledon that elongates and draws the seed
coat out of the soil. The cotyledon conducts photosynthesis, making more food,
while the shoot grows up inside the tube.

46
When germination conditions are right, a radicle (embryonic root) emerges from the
seed coat, anchoring the seed to the soil then grows and outputs lateral roots.
1.13.2 Oxygen and temperature Seed germination requires the presence of sufficient O2, for respiration. For this
reason, soil water content must be such that it is sufficient, but does not produce
waterlog, that makes oxygen inaccessible. Germination also requires that soil
temperature be above freezing (0°C) but not greater than 45°C.
1.13.3 Maize moisture content and germination A minimum state of hydration, from imbibition (seed water uptake) is necessary,
within seeds for the mobilization of food, and their metabolism. This is termed
colloidal swelling and is necessary for germination (Gallardo, et al., 2001; Skene,
2008). Seed is usually dried to about 5-15% moisture content, for storage. However,
seeds must have 40 to 60% moisture content for germination to occur. Moisture,
therefore, usually increases from 5 to15%, in dry seeds, to about 50% after the initial
imbibition (Spann, 1998; Gallardo, et al., 2001). Imbibation (Figure 1.8) is a function
of soil and seed osmotic potential, as well as soil potential, which depends on the
presence of salts. Excess salt produces strong negative pressure, preventing water
from entering the seed. This can create water stress, leading to reduced percentage
germination. This situation is exacerbated when soil water supply is low, since soil
osmotic potential increases greatly, and can inhibit germination, to a larger extent.
And excessive water supply to the seed can result in the production of mucilage in
the seed, restricting oxygen supply to the embryo (Spann, 1998).
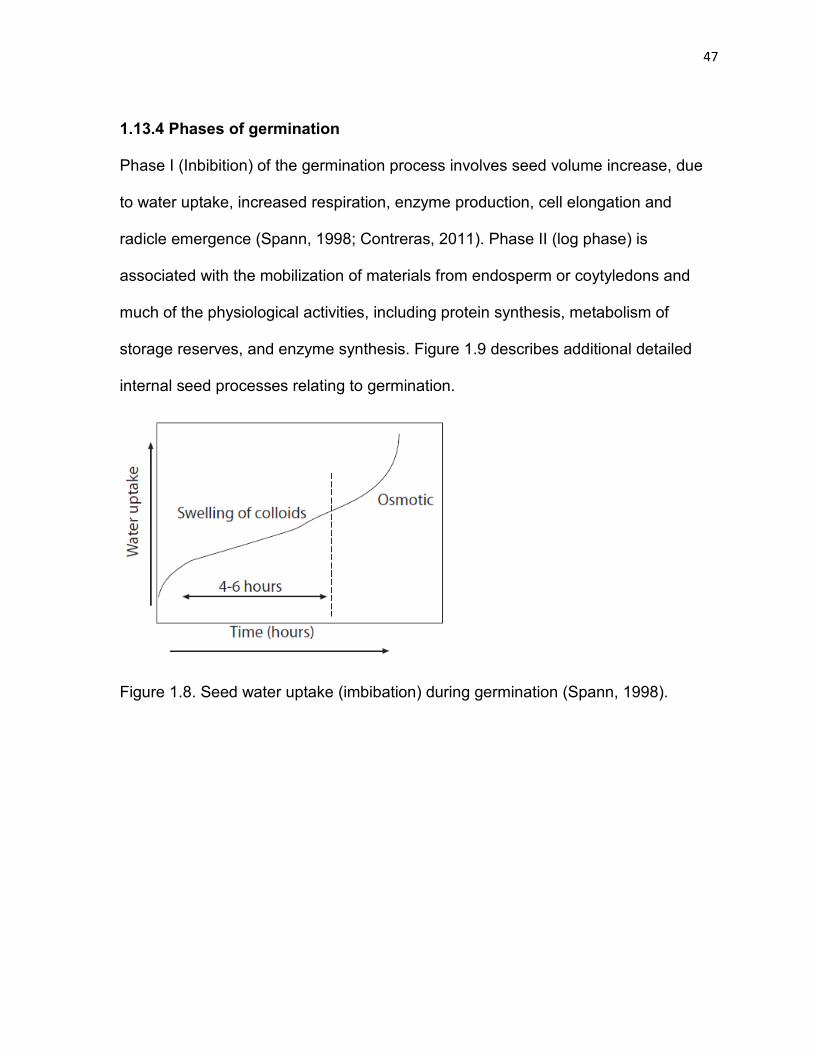
47
1.13.4 Phases of germination
Phase I (Inbibition) of the germination process involves seed volume increase, due
to water uptake, increased respiration, enzyme production, cell elongation and
radicle emergence (Spann, 1998; Contreras, 2011). Phase II (log phase) is
associated with the mobilization of materials from endosperm or coytyledons and
much of the physiological activities, including protein synthesis, metabolism of
storage reserves, and enzyme synthesis. Figure 1.9 describes additional detailed
internal seed processes relating to germination.
Figure 1.8. Seed water uptake (imbibation) during germination (Spann, 1998).
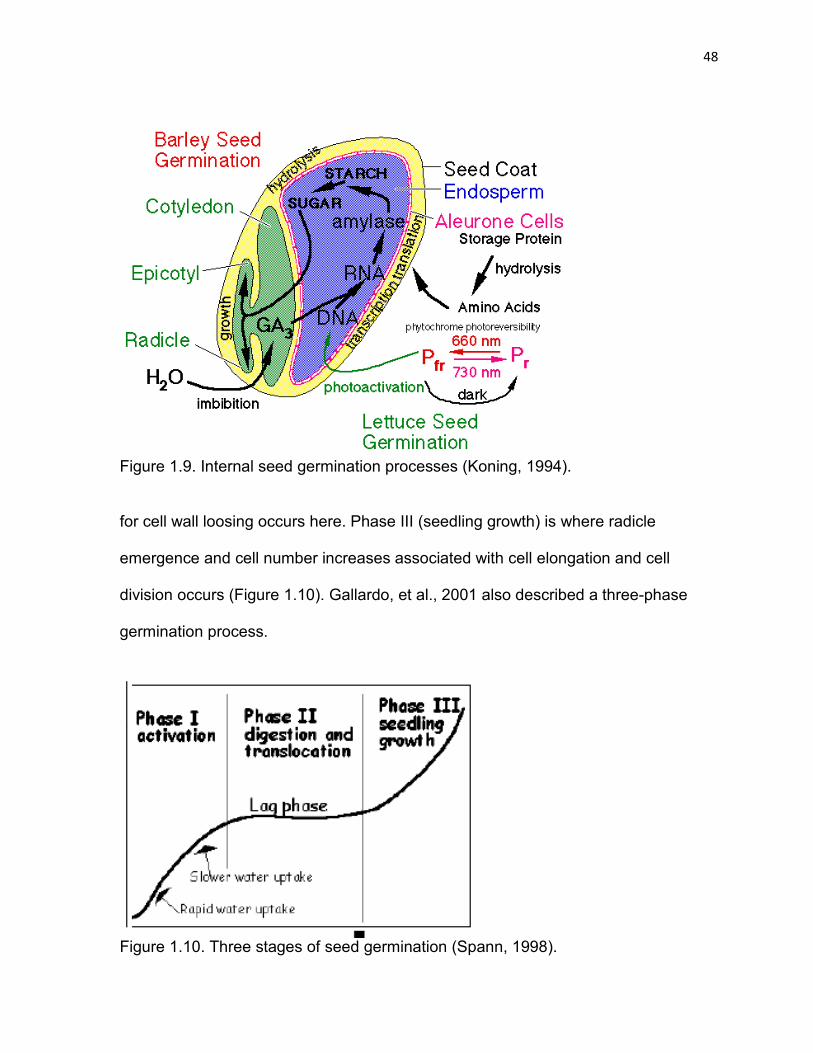
48
Figure 1.9. Internal seed germination processes (Koning, 1994). for cell wall loosing occurs here. Phase III (seedling growth) is where radicle
emergence and cell number increases associated with cell elongation and cell
division occurs (Figure 1.10). Gallardo, et al., 2001 also described a three-phase
germination process.
Figure 1.10. Three stages of seed germination (Spann, 1998).
49
1.13.5 Regulation of seed germination The timing of seed germination is controlled by hormones, which are organic
compounds that, in small concentrations, have important regulatory effects on plant
and animal metabolism. Plant hormones (phytohormones) are plant growth
regulators that regulate seed development, maturation, desiccation, dormancy and
germination. Phytohormones reported to have regulatory effects of different
physiological processes in seeds, include abscisic acid, gibberellins, ethylene,
cytokinins, auxins, and brassinosteroids (Gallardo, et al., 2001; Kucera et al., 2005).
1.13.6 Hermetic storage and seed dormancy Storage method appears to have an effect on the viability or germination rate of
maize seeds, stored over time. So do temperature, maize moisture, length of
storage, and genotype (texture, and pericarp characteristics).
Germination is dependent on relative humidity, which is dependent on ambient
temperature and maize moisture (Copeland and Mcdonald, 1995; Basra, 2006;
Desai, et al., 1997). And seeds often undergo dormancy, which allows them to
remain viable, but metabolically inactive, under unfavorable conditions until
favorable conditions for germination are reintroduced. Hence, even when seeds are
sourced from harvested maize, preserved under hermetic conditions, a certain
percentage of the seeds are still viable following lengthy periods of storage. This is
important considering that at least seventy percent of maize seeds are sourced from
prior year’s maize harvest in East Africa (Gemeda, et al., 2001; Dhliwayo and Pixley,
2003). According to Hill (1995), dormant seeds are often very dry seeds that require
50
water absorption, to initiate the metabolic process of respiration, which causes
digestion of stored food. Therefore, overcoming seed dormancy involves re-
introducing the seed to favorable conditions (water, light, temperature, planting
media, and oxygen).
1.13.7 Seed dormancy and abscisic acid
Most species of mother plants form seeds contain abscisic acid, which makes the
embryo dormant until environmental conditions are favorable, for seed germination.
Enzymes within the seed cause the acid to be broken down inside the embryo,
usually, post-harvest. The required, inactivating, enzymes are normally present in
the inactive form in the embryo until activated by seasonal or artificial low
temperature. For this reason, priming using cold treatment (stratification) involves
exposing seeds to four weeks of refrigeration or fall temperature of about 4°C, to
activate the enzyme that degrades abscisic acid (ABA) in the embryo. However,
because this temperature is too cold for germination to occur, the seed needs to be
exposed to warm, spring-like, conditions (~25 to 27°C) even after stratification, to
allow the germination process to begin. This process is termed vernalization. In
desert plants, phenolic compounds which are inactivated by cold weather, but are
also soluble in water replaces and plays the role of abscisic acid. For this reason,
they are usually leached out of seeds by repeated washing and or soaking rains, to
initiate germination (Spann, 1998).
51
1.13.8 Primary and secondary seed stress
Hermetic storage provides low-cost and viable alternative for seed storage, with
favorable germination rates comparable to or better than conventional seed storage
methods (De Bruin, 2005; IRRI, 2008; Sabio, et al., 2009). However, it often
produces secondary dormancy resulting from, usually reversible, environmental
stressors (oxygen and light), that can delay or prevent germination. Primary
dormancy occurring during development and maturation results from water and
salinity stress, as well as dehydration and desiccation, which can prevent
germination, altogether.
1.13.9 Hypoxia
Hypoxia (low oxygen) associated with hermetic seed storage interferes with ABA
metabolism and increases ABA sensitivity in embryos of dormant grains (Benech-
Arnold, 2006). However, the stress and dormancy, resulting from low oxygen levels
can be removed through seed priming (Rush, 1992; Spann, 1998; Taylora, et al.,
1998; Caprona, et al., 2000; CRC, 2001; Gallardo, et al., 2001; Harris, et al., 2001;
Hussain, et al., 2006; Bern, et al., 2008; Contreras, 2011), following hermetic
storage, before planting.
1.13.10 Seed sourcing by subsistence farmers According to Gemeda, et al (2001), up to 97% of farmers in Ethiopia sourced their
maize seed from prior year’s harvest. And according to Dhliwayo and Pixley (2003)
about 70% of farmers in Eastern and southern Africa obtained their seeds this way.
52
Quality considerations for seed selection include good grain filling, seed purity,
adaptation to local conditions, being disease free and high germination rate.
1.14 RECYCLED CONTAINERS AND HERMETIC STORAGE The use of recycled containers, which are often available for sale in the container
resale market following initial use, for hermetic maize storage is promising (Boys et
al., 2007; Baributsa, 2010). However, epidemiology of several food-borne
illnesesses have been traced to cross-contamination by pathogens and toxins, from
food contact surfaces (ASM, 2009), during storage.
The use of recycled containers for hermetic maize storage is promising (Boys et al.,
2007; Baributsa, 2010). These containers are often available for sale in the container
resale market, following initial use. However, epidemiology of several food-borne
illnesses has been traced to cross-contamination by pathogens and toxins, from
food contact surfaces (ASM, 2009), during storage. Container recycling and reuse
for food storage, therefore, requires proper selection and cleaning to exclude
containers with toxic contents (EPA, 2009a; 2009b).
1.14.1 Cross contamination According to food-grade sanitary requirements, all food contact surfaces need to be
smooth, impervious, free of cracks and crevices, nonporous, nonabsorbent, non-
contaminating, non-reactive, corrosion resistant, durable, maintenance-free,
nontoxic, and cleanable (Schmidt and Erickson, 2008). And International food laws
and hazardous substance acts, forbids the use of recycled containers of hazardous
substance for food packaging (Shachman, 2004) to prevent cross-contamination,
53
with food that may be stored within them. Based on these, the rule of thumb is to
store food in materials classified as “food grade” containers (Opies, 2011). Metallic
(stainless steel, titanium, platinum, and gold) and non- metallic (plastics, rubber,
rubber-like materials Ceramics, and glass) containers that meet 3A sanitary
standards (18-03 and 20-20) are classified as food grade containers (Schmidt and
Erickson, 2008). Therefore, only food grade container previously used for storage of
carbonated soft drinks and triglycerides, were considered for this recycling and
maize storage study. But since, recycled vegetable oil containers can be cleaned
using a uniform cleaning procedure (soap and saponification) worldwide, and they
are more readily available than soft-drink containers, the procedure discussed here
only focuses on cleaning procedures for edible oil-contaminated containers.
1.14.2 Cross-contamination and oxidation in fats and oils
The oxidation (rancidity) of fats and oils usually result from changes to their fatty
acids’ chemical properties, which reduces their nutritional value. Associated with this
are changes in color, taste, and smell. Factors that cause oil degradation through
oxidation, that produces free radical formation, include exposure to air, light, mixing
of different vegetable oil products, presence of salts, number of times oil is used,
length of time oil is heated, and temperature to which it is heated (Andrikopoulos et
al., 2002; Andrikopoulos, 2004; Fox and Stachowiak, 2007; Canals, et al., 2009).
Oxidation occurs both during vegetable oil processing and storage (Choe and Min,
2006) and since oil has low thermo-oxidative stability, influenced by energy from
factors previously described (Erhan, et al., 2006), this initiates the formation of free
54
radicals, which are easily formed by the removal of hydrogen atoms from
monounsaturated, and polyunsaturated oils. This is because monounsaturated oils
have a pair of missing hydrogen atoms and polyunsaturated oils are missing several
pairs of hydrogen atoms, making them very unstable and highly reactive to
oxidation. Saturated oils have a slightly higher degree of resistance to oxidation
since they are chemically more stable (Asadauskas, et al., 2007; Fox and
Stachowiak, 2007). Andrikopoulos et al (2002) also described the oxidative stress
and deterioration that occurs in fried oil and their potential (cytotoxic, hepatotoxic,
carcinogenic, mutagenic) effect(s) on health. For this reason some countries have
recommendations in place for the maximum number of times vegetable oil may be
used for frying in fast food and other restaurants (Andrikopoulos, 2004).
1.14.3 Free radicals and cellular damage
Free radicals are necessary for life, and play an important role in a number of
biological processes, some of which are necessary for life. These include
intracellular killing of bacteria by phagocytic cells, as well as cell signalling (redox)
processes.
The human body employs enzymes (superoxide dismutase, catalase, glutathione
peroxidase and glutathione reductase), as well as antioxidants (vitamin A, C, and E
plus polyphenol) to minimize the effect of free radicals. However, excessive amounts
of free radicals, such those from oxidized oil, cause cell injury, instability and death
(Wang, et al., 2000) and are involved in diseases such as cancer, stroke, myocardial
infarction, and diabetes. They are also implicated in other major disorders, including
55
arteriosclerosis, schizophrenia, alzheimer's disease, emphysema, psychosis,
pigmentary melanin abnormalities, DNA mutations, deafness, arthritis and many
aging and senile -related diseases (Wang, et al., 2000; Karthikeyan, et al., 2011).
To preserve maize quality, while preventing cross-contamination between the stored
maize and rancid, oxidized oil, a procedure was developed with the aim of cleaning
edible oil containers, such that 100% of the oil is removed.
1.14.4 Edible oil container cleaning
Two related decontamination methods (saponification and soap) were considered for
cleaning vegetable oil contaminated 20-L HDPE containers (“jerry cans”). In
cleaning, involving saponification of fats and oil, (equation 1.1) the rate-limiting step
is the alkali. Continual addition of alkali consumes all the oil, forming soap and
glycerol. Considering the possible, corrosive effect on humans, and the
environmental effect of alkali, as well as cost and availability, soap was employed as
the primary cleaning agent to which other treatments (hot water, and oil drain from
container) are compared. In addition to its already being commonly utilized for
similar cleaning worldwide, soap is directly related to alkali, and molar equivalents of
both can be established from saponification equations, in relation to the oil quantity
to be cleaned. Hot water was used as a treatment because it is a known cleaning
agent, traditionally utilized in East Africa for removing oil contaminants in containers
similar to the 20-L HDPE containers utilized as experimental units, for this study. Oil
drain serves as control treatment, while new 20-L HDPE container equivalents of
contaminated 20-L HDPE containers serve as the control for the experimental units.
56
Since soap is a product of saponification (equation 1.1), general saponification
principles and factors are described in detail, with a brief mention of “cleaning with
soap”.
Triglycerides+3 KOH (or NaOH) +Heat –> 3 Soap+glycerol-------------------------(1.1) Treatments can be applied as proportions of weight, volume or as molar equivalents.
Applying molar equivalents of treatments, when necessary, requires the ability to
calculate molar mass and molar equivalents of treatments, applied. The procedure
for achieving this is outlined below.
1.14.5 Estimating molar mass
According to Batt (2004), all the free fatty acids in oil are in the triglyceride form, the
molar mass of free fatty acids in oil is about 834 g (or 278*3), 3 moles of fatty acids
plus 1 mole of glycerol (molar mass=92.09) produces 1 mole of triglyceride, plus 3
moles of water. And average molar mass of soybean oil is 872.03g ((278*3)+92.09-
(3*18.02)).
Based on this, estimating molar equivalents from saponification equation (Bhatt,
2004; Vaso, et al 2010), is possible, considering that there is 98% purified soap yield
from soybean oil (Vaso, et al 2010), and the effective ratio of triglycerides, alkali,
glycerin and soap is 1:3:1:3.
Assuming that free fatty acid (FFA) composition in soybean oil or fat is 100 kg
(Bhatt, 2004), the quantity of soybean oil can be calculated as:
Quantity of soybean oil=(872.03*FFA (kg))/(278.00*3)
57
=(872.03*100)/(278.00*3) =104.56 kg 1.14.6 Estimating molar equivalents
According to ACS (2011), 10 mL 6M of NaOH was required for saponification of 20
mL fat (or oil). Since the ratio of oil to alkali is 1:3, and assuming 98% soap yield, as
well as 0.06 moles (6 M*0.01 liters) of NaOH, the number of moles of FFA equals
0.0588 moles ((0.06/3)*0.98 yield). This is equivalent to 49.0392g (0.0588 moles
*834). Also, assuming 98% purified soap yield from soybean oil, the quantity of
starting soybean can be calculated as:
=(872.03*0.049.0392)/(278.00*3)
= ~0.051 kg
And since density of distilled water equals about 1 g/cm3, the molar equivalent of
water can be calculated based on stoichiometry. However, distilled water, as
treatment, can also be applied based on volume or weight equivalent of the soap
treatment, since it has a 1:1 mass to volume ratio.
1.14.7 20-L HDPE containers
The 20-L HDPE containers utilized for this study have a net weight of 35 lbs (~16
kg) each, and contain 582 Fl. oz (15.88kg) 100% pure soybean oil (Columbus
Foods, Chicago, Illinois). They were made out of high-density polyethylene (HDPE)
plastic, with a resin classification/recycling code of 2 (ACC, 2007; Bakers & chefs,
608 S.W. 8th Street, Bentonville, AR), and which has a melting point of 130-135°C
as well as a tensile strength of 4550 psi. They can withstand temperatures of 120°C
58
for short periods or 110°C continuously (EOS/EDS, 2000; Antec, 2001; Dow 2009;
Dynalab, 2011).
1.4.8 Soybean oil
The computed average molar mass of soybean oil is 873.01 g·mol (Gonzalez, et al.
2006) or 872.03 g.mol, while the molar mass of free fatty acids in oil is about 834 g
(or 278*3) mol-1 (Bhatt, 2004). This is because when 3 moles of fatty acids react with
1 mole of glycerol (molar mass=92.09), 1 mole of triglyceride and 3 moles of water
are produced, giving an average molar mass of soybean oil equals 834 g
((278*3)+92.09-(3*18.02)) (Bhatt, 2004).
1.14.9 Soybean oil and smoke point
The temperature at which cooking oil or fat breaks down to form glycerol and free
fatty acids, and produces bluish smoke is referred to as the smoke point. Refined
soybean oil has a smoke point of about 257.2°C (~495°F) (Bader, 2010), while
oxidized, rancid, oils have lower smoke point (Erhan, et al., 2006).
1.14.10 Saponification
Vegetable oil and animal fats (triglycerides) have a chemical propensity to undergo
hydrolysis, yielding free fatty acids (FFA) and glycerols, naturally. And the addition of
either of or a combination of temperature, pressure, enzymes, and strong alkali or
strong acid catalysts speed up the hydrolysis (Yan, 2009). When alkalis are
employed, the liberated FFA is converted into the corresponding metallic salt (soap),
and the alkali catalyzed oil hydrolysis is termed saponification (soap formation). Oils
59
and fats also have a physical property consistent with being greasy to the touch
(Schwartz and Schwartz, 1987; Lippingcot Williams & Wilkins, 2005), the presence
or absence of which can be utilized in testing for complete or incomplete
saponification.
In the saponification and refining of oil, it is often necessary to use excess alkali, to
ensure complete saponification and coagulation of other impurities within the oil
(Markley, 1951). And in the saponification of triglycerides, using an alcoholic alkali,
transforms the triglyceride into the ethyl ester (alcoholysis or transesterification),
which is usually the first reaction, followed by saponification. Since alcoholysis
proceeds rapidly and can go to completion in minutes, at ordinary temperatures
(room temperature to 60°C), it speeds up the saponification reaction, producing
yields above 90% (ACS, 1920; Freedman, 1984; Vaso, et al, 2010). The soap yield
from saponification is rarely 100%, due to the unsaponifiable fractions of crude oil
(Yadav, 2002).
1.14.11 Saponification and temperature
Saponification can be done at both room temperature (cold saponification) and at
higher temperature (warm saponification). However, saponification performed at
room temperature takes relatively longer to complete. Carrying out saponification at
higher temperature not only makes it proceed at a faster rate, but is likely to produce
greater soap yield and cleaning effect. Researchers have demonstrated that every
10°C temperature increase increases the rate of reaction by a factor from 1.2 to 2
(Sebastião et al., 2006; ACS, 2011). And CRC (2005) successfully undertook
60
saponification in an enclosed container, at 80°C for 40 minutes, with occassional
shaking.
1.14.12 Cleaning with soap
This study discovered that soap is capable of producing the same amount of clean
as that hypothesized for alkali, when the right quantity is utilized in cleaning
vegetable oil contaminated containers. Utilizing 3g of soap for each gram of soybean
oil contaminant adequately decontaminated the contaminated soybean oil 20-L
HDPE containers utilized in the recycling research.
1.14.13 Recycling treatment definition
Cleaning of oil-contaminated containers using water, with or without soap is common
practice in East Africa (Yakubu, et al., 2011). Literature, however, suggests that
cleaning, disinfecting and sanitizing containers, to prevent cross-contamination of
contaminants with food stored within them is best done at high temperature, using
soap and mechanical action (Knoxa and Walkera. 1947; Gangneux, et al., 2004;
CRC, 2006; Helmenstine, 2011; MTL, 2011; Patwardhan and Kelkar, 2011), such as
scrubbing and shaking. According to FAO (2002) heat treatment destroys oil-splitting
enzymes, arrests hydrolytic rancidity and autoxidation, during vegetable oil
extraction and cause oil to leach out from its container. And the use of hot water
cleaning treatment is expected to produce similar advantages.
Factors considered for this research are (i) soap, at two water temperature extremes
(control (45°C) and hot/boiling (90 to100°C)), (ii) water at two temperature extremes
(control (45°C) and hot/boiling (90 to100°C)) and (iii) Container type (contaminated
61
and new). We hypothesize, therefore that cleaning with soap at high temperature (90
to100°C), with mechanical action would be enough to clean and sanitize vegetable
contaminated containers enough for maize quality preservation within them. Since
container surface just drained of oil gives us results to which we can compare the
results of other treatments with, it would be utilized as a treatment, and because
some of the oil in the 20-L HDPE containers had congealed, seemingly due to
rancidity, the oil would be drained at 45°C, which is fat’s melting temperature (ACS,
2011), to ensure free flow, but so as not to produce chemical changes in the oil.
However, soap treatment at 45°C would not be utilized as a treatment, since it does
not meet the cleaning objectives and increases cost.
1.15 RESEARCH NEED
The “weevil mortality” study was conducted to test earlier laboratory results, using
controlled environmental tests conducted under different conditions and in different
containers.
The “seed germination” study was undertaken because we needed to know if
hermetically stored maize, containing maize weevils would provide the benefit of
viable seeds, in addition to maize preservation, for food purposes. And the “recycled
container” study was conducted since little information was found on the availability
of used containers, in East Africa. A study was therefore needed on container sizes,
prices, and quantity available for sale, in East Africa, as well as to establish cleaning
standards, for reused edible oil containers to ensure food safety.

62
1.16 GENERAL OBJECTIVES
The dissertation objectives were to:
1) Test the integrity of hermetic storage and the validity of predicted time to
complete mortality (PTCM) of maize weevils.
2) To determine the effects of length of hermetic storage and maize weevil
infestation on maize seed germination. And to
3)
a) Assess availability of used vegetable oil containers in East Africa suitable for
hermetic storage of maize, as well as
b) Develop procedures for cleaning the containers

63
1.17 REFERENCES ACC (American Chemistry Council). 2007.Plastic Packaging Resins. Plastics Division.Plastic Packaging Resins. Arlington, VA (USA). Retrieved on January 17, 2011 from http://www.americanchemistry.com/s_plastics/bin.asp?cid=1102&did=4645&doc=file.pdf ACS (The American Chemical Society). 1920 . The Journal of industrial and engineering chemistry. 12(2). Herty,C.S., and Woodford, L.W.(Eds). NYC: ACS, pp. 130. ACS (American Chemical Society). 2011.Saponification. Division of organic chemistry (ORGN). Retrieved on January 9, 2011 from http://www.marshallschool.net/school/cours/course/dvosen/hchem/IndepProjects/Samples/2saponification.pdf. Adhikarinayake, T.B .2005. Thesis. Wageningen University. Chapter 7.Technical and economic feasibility of airtight ferrocement bin for on-farm storage of paddy in Sri Lanka. The Netherlands, UK. Akaninwor, J.O., and M. Sodje. 2005. The effect of storage on the nutrient composition of some Nigerian foodstuffs: banana and plantain. Journal of applied sciences & environmental management. 9(3), pp. 9-11. Andrikopoulos, N. K., Kalogeropoulos, N., Falirea, A., Barbagianni, M.N.2002.Performance of virgin olive oil and vegetable shortening during domestic deep-frying and pan-frying of potatoes. Int. J. Food Sci. Technol. 37(2), pg. 177–190. Andrikopoulos, N.K. 2004. Oxidative stressed frying fats and oils. Potential role for health.4th International symposium on deep-frying: “healthier and tastier deep fried foods”, January 11-13, Hagen, Germany. pp. 11-12. Retrieved on May 19, 2011 from http://www.dgfett.de/material/hagen2004/andrikopoulos.pdf. ANTEC.2001.Plastic. The lone star. Conference proceedings.Volume II. Materials. Society of Plastics Engineers Technical Conference. Boca Raton, FL: CRC.:pp.2705. Arannilewa, S. T., Ekrakene T. , and Akinneye, J. O. 2006. Laboratory evaluation of four medicinal plants as protectants against the maize weevil, Sitophilus zeamais (Mots). African Journal of Biotechnology Vol. 5 (21), pp. 2032-2036, 2 November 2006.
64
Aronson, S., Raudales, R., Trubey, R. and P. Villers. 2005. Breakthrough in storing high quality coffee. TCTO (Tea&Coffee trade online). 177 (11)., 1-4 Asadauskas, S.J., Griguceviciene, A., and A. Stoncius. 2007. Review of late stages of oxidation in vegetable oil lubricant basestocks. Proceedings of the international conference, BALTTRIB. ASM (American society for microbiology). 2009. Pathogens and toxins in foods: challenges and interventions. Juneja, V.K., and J. N. Sofos (Eds). Herndon, VA: ASM Press. p. 420. Bader, M.H. 2010. The wizard of food’s encyclopedia of kitchen & cooking secrets. Durham, CT: Strategic book publishing, p 211. Bankole, S.A., Osho, A., Joda, A.O., and O.A. Enikuomehin. 2005. Effect of drying method on the quality and storability of ‘egusi’ melon seeds (Colocynthis citrullus L.). African Journal of Biotechnology, 4 (8), p. 799-803. Bänziger, M., G.O. Edmeades, D. Beck, and M. Bellon. 2000. Breeding for Drought and Nitrogen Stress Tolerance in Maize: From Theory to Practice. Mexico, D.F.:CIMMYT. Banziger M., Edmeades G.O., and H.R. Lafitte. 2002. Physiological mechanisms contributing to the increased N stress tolerance of tropical maize selected for drought tolerance. Field Crops Research, 75 (2-3): 223-233. Baributsa, D., Lowenberg-DeBoer, J., Murdock, L., and B.Moussa. 2010. Profitable chemical-free cowpea storage technology for smallholder farmers in Africa: opportunities and challenges. 10th International Working Conference on Stored Product Protection Julius-Kühn-Archiv, 425, 2010. Basra, A. 2006. Handbook of seed science and technology. Binghamton: Haworth press.:200, 696, 526. BBC Weather. 2011a. Bujumbura. Average conditions. Retrieved on April 12, 2011 from http://news.bbc.co.uk/weather/forecast/619. BBC Weather.2011b. Djibouti City. Average conditions. Retrieved on April 12, 2011 from http://news.bbc.co.uk/weather/forecast/662? BBC Weather. 2011c. Addis Ababa. Average conditions. Retrieved on April 12, 2011 from http://news.bbc.co.uk/weather/forecast/526?&search=addis%20ababa&itemsPerPage=10®ion=world.
65
BBC Weather. 2011d.Kampala. Average conditions. Retrieved on April 12, 2011 from http://news.bbc.co.uk/weather/forecast/756?state=fo:D#fo:D. BBC weather. 2011e.Average conditions.Nairobi. Retrieved on April 12, 2011 from http://news.bbc.co.uk/weather/forecast/129. BBC weather. 2011f. Average conditions. Dar Es Salaam. Retrieved on April 12, 2011 from http://news.bbc.co.uk/weather/forecast/120. BBC weather. 2011g. Average conditions. Kigali. Retrieved on April 12, 2011 from http://news.bbc.co.uk/weather/forecast/782. BBC weather. 2011h. Average conditions. Mogadishu. Retrieved on April 12, 2011 from http://news.bbc.co.uk/weather/forecast/905. BBC weather. 2011i. Khartoum. Average conditions. Retrieved on April 12, 2011 from http://news.bbc.co.uk/weather/forecast/123. Bella, S., Szépszó, G., and S. Szalai. 2007. Changing climate and the spatial distribution of optimal production area of maize. Retrieved on April 13, 2011 from www.efita.net/apps/accesbase/bindocload.asp Benech-Arnold, R.L., Gualano, N., Leymarie,J., Coˆme, D and F. Corbineau. 2006. Hypoxia interferes with ABA metabolism and increases ABA sensitivity in embryos of dormant barley grains. Journal of Experimental Botany, 57 (6): 1423–1430. Bern, C. J., C.R.Hurburgh, T.J.Brumm. 2008. Managing grain after harvest. Duplicated textbook. Course Works. Ames: ISU Bookstore, p. 3-1, 3-3, 3-14. Bhatt, B.I.2004.Stoichiometry.India:Tata Mcgraw Hill Education, pp 127, pp. 178. Boys, K., Faye, M., Fulton, J., Lowenberg-DeBoer, J., 2007. The economic impact of cowpea research in Senegal: an ex-post analysis with disadoption. Agricultural Economics 36, 363-375. Bett, C., and R. Nguyo. 2007. Post-harvest storage practices and techniques used by farmers in semi-arid eastern and central Kenya.African crop science conference proceedings, 8. pp. 1023-1227. grain after harvest. Duplicated textbook. Ames: ISU Bookstore, p. 3-1, 3-3, 3-14. Canals, A., Grané, N., Martín , M.L., Román, I., Staykova, M., and C. Domini. 2009. Monitoring the oxidation of vegetable oil by ultrasound-assisted-ATR-FTIR spectroscopy. Retrieved on May 19, 2011 from http://www.science24.com/paper/7450.
66
Campos, H., Cooper,M., Habben,J.E., Edmeades,G.O., and J.R. Schussler. 2004. Improving drought tolerance in maize: a view from industry. Field Crops Research, 90:19–34. Caprona, I., Corbineaua, F., Dachera, F., Joba,C., Cômea, J., and D. Joba. 2000. Sugarbeet seed priming: effects of priming conditions on germination, solubilization of 11-S globulin and accumulation of LEA proteins. Seed Science Research. 10(03): 243-254. Choe, E and Min, D.B. 2006. Mechanisms and Factors for Edible Oil Oxidation. Comprehensive reviews in food science and food safety, 5, p.169. Contreras, S. 2011. The chemistry of seeds. Retrieved on October 12, 2011, from http://seedbiology.osu.edu/HCS631_files/7A%20Seed%20Chemistry.pdf Copeland, L.O and Mcdonald, M.B .1995.Principles of seed science and technology. 3rd edition. New York: Chapman & Hill: 197-198. CRC (CRC Press). 2001. Handbook of plant and crop physiology, 2nd edition. Pessarakli, M (Ed). New York: Marcel Dekker, inc., 111-2. CRC. 2005. Food Analysis by HPLC, Second Edition (Food Science and Technology). Leo, M., and L. Nollet (Eds). Boca Raton, Fl: CRC Press. p. 304. CRC (CRC press). 2006. Handbook of Lubrication and Tribology: Volume I. Application and Maintenance, Second Edition. George E. Totten (ed.). Boca Raton: CRC press. pp 1-11. Dawson, T.E., Rust, S.R., Yokoyama, M.T., 1998. Improved fermentation and aerobic stability of ensiled high moisture maize with the use of Propionibacterium acidipropionici. Journal of Dairy Science 81, 1015–1021. De Groote, H., Doss, C., Lyimo, S.D. and W. Mwangi. 2002. Adoption of Maize Technologies in East Africa – What Happened to Africa’s Emerging Maize Revolution?. Paper prepared for the FASID Forum V, “Green Revolution in Asia and its transferability to Africa”. Tokyo, December 8-10, 2002. Demissie G, Teshome A, Abakemal D, and A. Tadesse. 2008. Cooking oils and ‘‘Triplex’’ in the control of sitophilus zeamais motschulsky (coleoptera: curculionidae) in farm-stored maize. Journal of Stored Products Research. 44: 173–178. De Bruin T. 2005. Innovations in seed storage methods. Published in Asian seed and planting material. Philippines, January. Cited by Villers, et al., Development and applications of the hermetic storage technology. Alternative Methods to Chemical
67
Control. Proceedings of the 9th International Working Conference on Stored Product Protection. Campinas, São Paulo, Brazil. PS7-8 – 611:719. Dhliwayo, T., and K.V. Pixley. 2003. Divergent Selection for resistance to maize weevil in six maize populations. Crop Sci. 43: 2043-2049. De Lima, C.P.F. 1990. Airtight storage: principle and practice. In: Calderon, M. and Barkai-Golan, Rivka Ed., Food preservation by modified atmospheres, Chapter 2, CRC Press Inc., Boca Raton, Florida. p.9-19. Demissie G, Teshome A, Abakemal D, and A. Tadesse. 2008. Cooking oils and ‘‘Triplex’’ in the control of sitophilus zeamais motschulsky (coleoptera: curculionidae) in farm-stored maize. Journal of Stored Products Research. 44: 173–178. Desai. B.B, Kotecha, P.M, and Salunkhe, D.K. 1997. Seeds handbook. Biology, production Processing and storage. New York: Marcel dekker, inc., p. 33, 66 Devor, R.E., Chang, T., Suntherland, J.W. 2007. Statistical quality design and control. Contemporary concepts and methods. 2nd edition. Upper Saddle River: Pearson Education, Inc. Dow (The Dow Chemical Company). 2009. Product Safety Assessment. High Density Polyethylene (HDPE) Resins. Retrieved on January 17, 2011 from http://msdssearch.dow.com/PublishedLiteratureDOWCOM/dh_02c1/0901b803802c1c97.pdf?filepath=productsafety/pdfs/noreg/233-00577.pdf&fromPage=GetDoc Dynalab. 2011. Plastic Properties of High Density Polyethylene (HDPE).Retrieved on January 17, 2011 from http://www.dynalabcorp.com/technical_info_hd_polyethylene.asp. Dhliwayo, T., and K.V. Pixley. 2003. Divergent Selection for resistance to maize weevil in six maize populations. Crop Sci. 43: 2043-2049. EOS/EDS (Electrical Overstress - Electrostatic Discharge) symposium proceedings. Volume 22. 2000. ESD association in collaboration with IEEE. NY:Rome, p. 2B.1.3. EPA. 2009a. List of Contaminants & their Maximum Contaminant Level (MCLs). Retrieved on September 17, 2011, from http://water.epa.gov/drink/contaminants/index.cfm#List. EPA. 2009b. Food. Food Safety. Food Contaminants & Adulteration. Data on Benzene in Soft Drinks and Other Beverages. Data through May 16, 2007. Retrieved on September 17, 2011, from http://www.fda.gov/Food/FoodSafety/FoodContaminantsAdulteration/ChemicalContaminants/Benzene/ucm055815.htm.
68
Erhan, S.Z., Sharma, B. K., and J.M Perez. 2006.Oxidation and low temperature stability of vegetable oil-based lubricants. Industrial Crops and Products, 24:292–299. FAO. 1991a.Water harvesting. Water and soil requirements. Water requirements of crops.General estimates. Job number.U3160. Retrieved on April 12, 2011 from http://www.fao.org/docrep/u3160e/u3160e04.htm#2.1%20water%20requirements%20of%20crops and http://www.fao.org/docrep/U3160E/U3160E00.htm. FAO. 1991b. AGST. CHAPTER XXIII MAIZE: Post-Harvest Operation. In: Danilo Mejía (ed). Retrieved on May 21, 2011 from http://www.fao.org/inpho/content/compend/text/ch23_03.htm. FAO. 1994. Grain storage techniques. Evolution and trends in developing countries. In: Proctor. D.L. (ed). FAO agricultural services bulletin 109. Rome (Italy): Food and Agricultural Organization: 197-200, 211. FAO. 2002. Small scale palm oil processing in Africa. FAO agricultural services bulletin, 148. pp. 12. Retrieved on September 4, 2011 from ftp://ftp.fao.org/docrep/fao/005/y4355E/y4355E00.pdf, and http://www.fao.org/DOCREP/005/Y4355E/Y4355E00.HTM FAOSTAT. 2011. FAO Statistics Division. FAOSTAT. Production. ProdSTAT. Crops. Retrieved on May 20, 2011 from http://faostat.fao.org/site/567/default.aspx#ancor. Freedman, B., Pryde, E.H and T.L. Mounts. 1984.Variables affecting the yields of fatty esters from transesterified vegetable oils. JAOCS, 61(10). Fulton, J., Lowenberg-DeBoer, J., Moussa, B., and M. Otoo. 2009. Evaluating the effectiveness of alternative extension methods: Triple-bag storage of cowpeas by small-scale farmers in West Africa. Selected paper prepared for presentation at the Agricultural & Applied Economics Association, AAEA & ACCI joint annual meeting, Milwaukee, Wisconsin. Fox. N.J and G.W. Stachowiak. 2007. Vegetable oil-based lubricants—A review of oxidation. Tribology International. 40(7), Pp.1035-1046. Gallardo, K., Job, C., Groot, S. P.C., Puype, M., Demol, H.., Vandekerckhove, J., and D. Job. Proteomic Analysis of Arabidopsis Seed Germination and Priming. 2001. Plant Physiol, 126: 835-848. Gangneux, J., Noussair, L., Bouakline, A., Roux, N., Lacroix, C., and F. Derouin. 2004. Experimental assessment of disinfection procedures for eradication of Aspergillus fumigatus in food. Blood, 104 (7).

69
Gemeda, A., Aboma, G., Verkuijl, H., and W. Mwangi. 2001. Farmers’ Maize Seed Systems in Western Oromia, Ethiopia. Mexico, D.F.: International Maize and Wheat Improvement Center (CIMMYT) and Ethiopian Agricultural Research Organization (EARO). p. 27-28. Gonzalez,C., Resa,J. M., Lanz,J. Iglesias, M., and J. M. Goenaga. 2006. International Journal of Thermophysics. Measurements of Density and Refractive Index of Soybean Oil + Short Aliphatic Alcohols. 27(5), 1463-1481. Grolleaud, M. 2002. Post harvest losses; discovering the full story. FAO Corporate Document Repository, FAO Agro Industries and Post-harvest Management Service (AGSI). Retrieved on May 12, 2010 from http://www.fao.org/DORCEP/004/AC301E/AC301E00.htms. Harris, D., Pathan, A.K., Gothkar, P., Joshi, A., Chivasa. W., and P. Nyamudeza. 2001. On-farm seed priming: using participatory methods to revive and refine a key technology. Agricultural Systems, 69:151–164. Harris, R. L. and A. Miller. 2008. Keeping it real: storing & preserving green coffee, part 2 of 2. Roast magazine. July/August: 31-38. Document #: SL2350LH0608-2. Heisey, P.W and Edmeades, G.O. 1998. Part 1. Maize Production in Drought-Stressed Environments: Technical Options and Research Resource Allocation. World Maize Facts and Trends 1997/98. Helmenstine, M. A. 2011. How Do Detergents Clean? Retrieved on August 28, 2011 from http://chemistry.about.com/od/howthingswork/f/detergentfaq.htm. Holst, N., Meikle, W.G., and R. H. Markham. 2000. Grain injury models for Prostephanus truncatus (Coleoptera: Bostrichidae) and Sitophilus zeamais (Coleoptera: Curculionidae) in rural maize stores in West Africa. J. Econ. Entomol. 93(4): 1338-1346. Hill, L.1985. Secrets of plant propagation: starting your own flowers, vegetables, fruits. Secrets of plant propagation. North Adams: Storey Books, p. 26. Hussain, M., Farooq, M., Basra, S.M.A., and N. Ahmad. 2006. Influence of seed priming techniques on the Seedling establishment, yield and quality of hybrid sunflower. Int. J. Agri. Biol., 8(1): 2006. IRRI. 2004. Grain storage hermetically sealed systems. Rice fact sheets. Gummert , M., Rickman, J., and M.A Bell (eds). Retrieved on May 21, 2011 from http://www.knowledgebank.irri.org.
70
IRRI, 2008. Grain storage and pest management. Hermetic grain storage systems. Retrieved on December 20, 2008 from www.knowledgebank.irri.org/Storage/Training_Manual_Grain_Storage.doc, http://www.irri.org/ and http://www.knowledgebank.irri.org/postproductioncourse/factsheetsNRefences/Storage/Hermetic%20Storage%20Systems.doc. Jacobs, S., and D. Calvin. 2001. Weevils of stored grains. Entomological notes. The Pennsylvania State University College of Agricultural Sciences. Cooperative Extension. Retrieved on October 12, 2011 from http://ento.psu.edu/extension/factsheets/pdf/weevilsgrain.pdf Karthikeyan, R., Manivasagam, T., Anantharaman, P., Balasubramanian, T., and S. T. Somasundaram. 2011. Chemopreventive effect of Padina boergesenii extracts on ferric nitrilotriacetate (Fe-NTA)-induced oxidative damage in Wistar rats. Journal of Applied Phycology, 23 (2), 257-263. Knoxa, R., and J. Walkera. 1947. Bacteriological investigation of the washing and sterilization of food containers. Journal of Hygiene, 45: 151-158. Korunic, Z. 1998. Diatomaceous earth: a group of natural insecticides. Journal of Stored Products Research, 34(1): 87-97. Koning, Ross E. 1994. Seeds and seed germination. Seed structure. Plant physiology information website. Retrieved on 27, March, 2011 from http://plantphys.info/plants_human/seedgerm.shtml. Kucera, B., M.A. Cohn, and G. Leubner-Metzger. 2005. Plant hormone interactions during seed dormancy release and germination. Seed Science Research 15: 281- 307. Landers, K.E., Davis, N.D., 1986. Influence of atmospheric gases on aflatoxin production by Aspergillus flavus in peanuts. Phytopathology 57, 1086–1090. Leroux, M. 2001. The meteorology and climate of tropical Africa. New York: Springer-Praxis publishing, p. 331-336. Lindblad C, Druben L. 1980. Storage methods. Small farm grain storage. Volume III. Appropriate technologies for development. Manual M-2/ VITA publications manual series no. 35E. Arlington: VITA. Lippingcot Williams & Wilkins. 2005. Remington: the science and practice of pharmacy. 21 st edition.(Eds):Troy, D.B and M.J.Hauber. Baltimore, MD: Lippingcot Williams and Wilkins, p 425.
71
Lisker, N., Taari, E., Ashbell, G., Henis, Y., 1989. Chemical and microbiological changes occurring in wheat silage maintained under modified atmospheres. Journal of the Science of Food and Agriculture, 47: 125–127. Lobell, D.B., Bänziger, M., Magorokosho, C. and B. Vivek. 2011. Nonlinear heat effects on African maize asevidenced by historical yield trials. Nature climate change 1, 42-45. doi:10.1038/nclimate 1043. Retrieved on August 29, 2011 from http://iis-db.stanford.edu/pubs/23138/Lobell_2_11_NatureClimateChange.pdf. MapXL, ibc. 2000. Find latitude and Lonitude. CA: San Jose. Retrieved on April, 13, 2011 from www.mapsofworld.com/utilities/worl-latitude-longitude.htm. Markley, S. M. 1951. Soybeans and soybean products. Volume 2. NYC, NY: Interscience Publishers Inc., p 652. Mendoza, E., Rigor, A.C., Mordido Jr., C.C., Marajas, A.A., 1982. Grain quality deterioration in on-farm level of operation. In: Teter, N.C., Frio, A.S. (Eds.), Progress in Grain Protection. Proceedings of the Fifth Annual Grains Post-harvest Workshop, 19–21 January 1982, Chiang Mai, Thailand, pp. 107–117. Mengesha, B. 2010. Drought, Famine and Media: Analysis of how the Ethiopian print media framed the 2002-2003 drought and famine. Saarbrucken (Germany):VDM Verlag Dr. Müller GmbH & Co. KG. Merriam-Webster Inc. 2006. Monocotyledon: internal structures of a corn seed with stages of germination. Art. Encyclopædia Britannica Online. Retrieved on 27, March, 2011 from http://www.britannica.com/EBchecked/media/66034/Monocotyledon-Nutrients-are-stored-in-the-cotyledon-and-endosperm-tissue Minot, N. 2008. Implications of the Food Crisis for Long-term Agricultural Development. Retrieved May 11, 2008, from http://www.ifpri.org/pubs/testimony/minot20080605.asp Montemayor, R. 2004. Better Rice in Store. World Grain, November, 2004. Moon, N.J., 1983. Inhibition of the growth of acid tolerant yeasts by acetate, lactate and propionate and their synergistic mixtures. Journal of Applied Bacteriology 55, 453–460. MSN Weather. 2011a. Monthly averages (°C). Asmara. Eritrea. http://weather.uk.msn.com/monthly_averages.aspx?&wealocations=wc%3aERXX0001&q=Asmara%2c+ERI&setunit=F MSN weather.2011b.Daily temperature for selected cities. Tanzania. Retrieved April 10, 2011 http://weather.uk.msn.com/region.aspx?wealocations=Tanzania
72
Murdock, L. Forbes, B. and J. Fulton. 2007. Gates Foundation funds Purdue effort to protect food, enhance African economy. Retrieved on September 21, 2008 from http://www.entm.purdue.edu/news/murdock_gates.html. Nakakita, H., and H. Ikenaga. 1997. Action of low temperature on physiology of Sitophilus zeamais Motschulsky and Sitophilus orzae (L.) (Coleoptera: Curculionidae) in rice storage. J. Stored Prod. Res. 33(1): 31-38. Navarro, S., Donahaye, J., Caliboso, F.M., and Sabio, G.C. 1996. Application of modified atmospheres under plastic covers for prevention of losses in stored grain. Final Report submitted to U.S. Agency for International Development, CDR Project No. C7-053, August, 1990 – November 1995. p. 32. Navarro, S., DeBruin, T., Montemayor, A.R., Finkelman,S., Rindner, M., and R. Dias. 2007. Use of biogenerated atmospheres of stored commodities for quality preservation and insect control, with particular reference to cocoa beans. Integrated Protection of Stored Products IOBC/wprs Bulletin. 30 (2): 197-204. Opies (Opies transport, inc.). 2011.Our mission. Retrieved on October 12, 2011 from http://www.opiestransport.com/. Patwardhan N and U. Kelkar. 2011. Disinfection, sterilization and operation theater guidelines for dermatosurgical practitioners in India. Indian J Dermatol Venereol Leprol, 77(1): 83-93. Rush, C. M. 1992. Stand establishment of sugar beet seedlings in pathogen-infested soils as influenced by cultivar and seed-priming technique, 76(8): 800-805. Sabio, G.C., Dator, J.V., Orge, R.F., Julian, D.D.T., Alvindia, D.G., Miranda, G.C., Austria, M.C. 2009. preservation of Mestizo 1 (PSB Rc72H) seeds using hermetic and low temperature storage technologies. 9th International Working Conference on Stored Product Protection. PS7-40-6297. Seck, D., Haubruge, G., Marlier, E., C. Gaspar.1996. Alternative protection of cowpea seeds against Callosobruchus maculatus (F.) (Coleoptera: Bruchidae) using hermetic storage alone or in combination with Boscia senegalensis (Pers) Lam ex Poir. Journal of Stored Products Research 32, 39-44. Skene, M. 2008. Biology of Flowering Plants.New Delhi,India: Discovery Publishing House. p. 434. Sabio, G.C., Dator, J.V., Orge, R.F., Julian, D.D.T., Alvindia, D.G., Miranda, G.C., Austria, M.C. 2009. preservation of Mestizo 1 (PSB Rc72H) seeds using hermetic
73
and low temperature storage technologies. 9th International Working Conference on Stored Product Protection. PS7-40-6297. Sebastião, J., Pinto, S and F. M. Lanças.2006.Hydrolysis of corn oil using subcritical water. J. Braz. Chem. Soc., Vol. 17(1), 85-89. Shachman, M. 2004. The soft drinks companion: a technical handbook for the beverage industry. Boca Raton, FL: CRC Press, pp. xv, 33-4, 116. Schwartz, M., and N.F.Schwartz. 1987. Engineering evidence, Volume 1. Colorado Springs, Colo. : Shepard's/McGraw Hill. p. 493. Schmidt, R.H and Erickson, D. J. 2008. FSHN04-09. Sanitary Design and Construction of Food Equipment. University of Florida. IFAS extension. Florida Cooperative Extension Service, Institute of Food and Agricultural Sciences, University of Florida. Retrieved on May 2008 from http://edis.ifas.ufl.edu. Spann, T.M. 1998. UC Davis. Plant biology 171: Spring. 5-Seed_germination 1-3. Retrieved on January 2011, from http://www.coursehero.com/file/2025857/5-Seedgermination1-3/. Sinha, R.N., 1995. The stored-grain ecosystem. In: Jayas, D.S., White, N.D., Muir, W.E. (Eds.), Stored Grain Ecosystems. Marcel Dekker, New York, p. 1–32. Sinha, G. 2007. GM technology develops in the developing world. Science, 315, 182–183. Skene, M. 2008. Biology of Flowering Plants.New Delhi,India: Discovery Publishing House. p. 434. Spann, T.M. 1998. UC Davis. Plant biology 171: Spring. 5-Seed_germination 1-3. Retrieved on January 2011, from http://www.coursehero.com/file/2025857/5-Seedgermination1-3/. Taylor, C.C., Kung, L., 2002. The effect of Lactobacillus buchneri 40788 on the fermentation and aerobic stability of high moisture maize in laboratory silos. Journal of Dairy Science 85, 1526–1532. Taylora, A. G., Allena, P. S. , Bennetta, M. A. , Bradforda, K. J. , Burrisa, J. S. and M. K. Misraa.1998.Seed enhancements. Seed Science Research, 8: 245-256. Troller, J.A., Stinson, J.V., 1981. Moisture requirement for growth and metabolite production of lactic acid bacteria. Applied and Environmental Microbiology, 42: 682–687.
74
UND (University of Notre Dame). 2010. Kellogg Institute for International Studies. Outreach. Retrieved on March, 02, 2011 from http://kellogg.nd.edu/outreach/images/1eafrica.gif. Vaso, K., Dema, M., and J. Marku. 2010. Natura Montenegrina. Production of anionic surfuctants from feedstock. Podgorica. 9(3):773-783. Villers, P., De Bruin, T and S. Navarro. 2004. Advances in hermetic storage as a methyl bromide replacement. Donahaye, E.J., Navarro, S., Bell, C., Jayas, D., Noyes, R., Phillips, T.W. [Eds.]. Proceedings on international Conference on controlled atmosphere and fumigation in stored products. Gold-Coast, Australia. 8-13th August 2004. Israel: FTIC Ltd. Publishing, p. 207-223. Villers, P., De Bruin,T., and Shlomo Navarro, S. 2006. A comparison of hermetic storage in flexible silos versus rigid metal or concrete silos. Feed technology update, 1(3). Villers, P., Navarro, S., and T. De Bruin. 2008. Development of Hermetic Storage Technology in Sealed Flexible Storage Structures. Citation for Controlled Atmosphere and Fumigation (CAF) Conference in Chengdu, China, September, 2008, Session 9 (Achievements of CA and Fumigation, and development trends). CAF 2008 Conference Paper (Unabridged Version, Advanced Copy). Walker, J. 2004. Famine, Drought, and Plagues (Natural Disasters). Corona, CA: Stargazer publishing. Wang, A.M., Ma, C., Xie, Z. H., and F. Shen. 2000. Use of Carnosine as a Natural Anti-senescence Drug for Human Beings. Biochemistry (Moscow), 65( 7):869-871. Wilson, A., Parrott, K., and B. Ross, Blake. 1999. "Household water quality – water hardness". Retrieved on January 25, 2011 from http://www.ext.vt.edu/pubs/housing/356-490/356-490.html. Weinberg, Z.G., Yan, Y., Chen, Y., Finkelman, S., Ashbell, G., and S. Navarro. 2008. The effect of moisture level on high-moisture maize (Zea mays L.) under hermetic storage conditions—in vitro studies. Journal of Stored Products Research, 44: 136–144. Wardinski, F.A., Rust, S.R., Yokoyama, M.T., 1993. Effect of microbial inoculation of high moisture maize on fermentation characteristics, aerobic stability and cattle performance. Journal of Animal Science, 71: 2246–2252. Weinberg, Z.G., Yan, Y., Chen, Y., Finkelman, S., Ashbell, G., and S. Navarro. 2008. The effect of moisture level on high-moisture maize (Zea mays L.) under
75
hermetic storage conditions—in vitro studies. Journal of Stored Products Research, 44: 136–144. Wiley-Blackwell. 2004. Crop post-harvest: science and technology, Volume 2. Durables. Hodges, R., and G. Farrell (eds.). Hoboken: Wiley-Blackwell, p. 9. Worku, M.,Tuna, H., Nigussie, M., and A. Deressa. 2002. Maize production trends and research in Ethiopia. In: Mandefro Nigussie, D. Tanner, and S. Twumasi-Afriyie (eds.).Enhancing the Contribution of Maize to Food Security in Ethiopia: Proceedings of the Second National Maize Workshop of Ethiopia, 12-16 November, 2001. Addis Ababa, Ethiopia. Addis Ababa, Ethiopia: Ethiopian Agricultural Research Organization (EARO) and International Maize and Wheat Improment Centre (CIMMYT), p. 10-14. Yadav, S. 2002. Food chemistry. India: Anmol Publications Pvt Ltd. p. 27. Yan, S., Salley,S.O., and K.Y. Simon Ng.2009.Simultaneous transesterification and esterification of unrefined or waste oils over ZnO-La2O3 catalysts. Applied Catalysis A: General, 353: 203–212. Yakubu, A., Bern, C. J., Coats, J. R., and T. B. Bailey. 2011. Hermetic on-farm storage for maize weevil control in East Africa. African Journal of Agricultural Research, 6(14): 3311-3319. Zettler, J.L., Navarro, S., 2001. Effect of modified atmospheres on microflora and respiration of California prunes. In: Donahaye, E.J., Navarro, S., Leesch, J.G. (Eds.), Proceedings of the International Conference on Controlled Atmosphere and Fumigation in Stored Products, 29 October–3 November 2000, Fresno, CA. Executive Printing Services, Clovis, CA, USA, p. 169–177.
76
CHAPTER 2: TESTING PREDICTED TIME TO COMPLETE ADULT WEEVIL MORTALITY IN HERMETICALLY STORED MAIZE
Yakubua, A., C.J. Berna, T. J. Brumma, J.R. Coatsb, and T. B. Baileyc
aDepartment of Agricultural and Biosytems Engineering, [email protected] [email protected], [email protected] bDepartment of Entomology, [email protected] cDepartment of Statistics, [email protected] Iowa State University, Ames, Iowa 50011 USA
2.1 ABSTRACT
The ability to predict the time to 100% adult maize weevil mortality using hermetic
storage is useful for design and management of hermetic storage systems. This is
because the prediction, allows estimation of days until 100% adult weevil (Sitophilus
zeamais) mortality as a function of weevil infestation level, storage temperature and
maize moisture during hermetic storage. The study found significant (p<0.0001)
temperature-moisture interaction for hermetic treatments, with 100% weevil mortality
rates. The two studies presented here tests results of an earlier oxygen
measurement study, using different containers and conditions not tested in the
original study. The laboratory-scale study utilized maize at 12% moisture content,
216 canning jars, and 23°C chamber, and found a mean adult weevil mortality and
standard error of 94.2±10.77% for hermetic treatments versus 3.1 ±4.69% for non-
hermetic treatments. The field-scale study used 12 recycled 20-L HPDE containers,
maize at 12.5% moisture and 23°C storage room temperature and found 96.8±3.43
mean mortality and standard error for hermetic treatments versus 3.4±3.71%, for
non-hermetic. Both studies tested the results of the original study’s ability to predict
77
time to complete adult maize weevil mortality, as well as confirmed laboratory and
field efficacy of hermetic storage.
Keywords: Maize storage, Hermetic storage, Maize weevil, 20-L HDPE containers
2.2 INTRODUCTION
2.2.1 Staple food
Maize is a major staple food in many cultures, including East African countries,
where it is a cash crop and contributes to food security and provides a source of
livelihood for hundreds of thousands of farmers in the region’s agriculture driven
economies (Govereh, 2008; UGL, 2010). Maize accounts for at least 50% of caloric
intake for people in East Africa (Sinha, 2007).
2.2.2 Post-harvest storage losses Inadequate storage, such as open air storage in granaries leads to rapid insect
growth and damage to stored maize (Lindblad and Druben, 1980; Yigezu, 2009)
resulting in post-harvest storage losses (Amani, et al., 1992; Villers, et al., 2006;
Darby and Caddick, 2007). According to the PHL Network (2009), about 19% of total
annual maize production is lost in post-harvest storage in East Africa. And although
post-harvest pests (Montemayor, 2004; Villers, 2004; SGRL, 2007; Weinberg, et al.,
2008; Bern, et al., 2011) include insects, molds, birds and rodents, the most
economically important post-harvest storage pest is the maize weevil (Jacobs, 2004;
Dhliwayo and Pixley. 2003). Studies have shown that the combined effect of maize
weevils and molds is capable of causing up to 100% damage to stored maize
78
(Demissie et al., 2008). According to Villers, et al., (2008), in tropical climates, even
commodities that are initially sufficiently dried suffer from susceptibility to external
humidity and moisture condensation leading to fungal and insect growth, which
raises the moisture content to unsafe levels (Darby and Caddick, 2007; FAO, 2001;
Weinberg, et al., 2008). These factors as well as the cost and toxicity of chemicals
(Navarro, et al., 1994; Korunic, 1998; Villers, et al., 2004; 2006; Murdock, et. al,
2007; EPA, 2011) make natural insect control (such as hermetic storage) an
attractive option (Daly, et al. 1998; Chapman, 1998; De Bruin, 2002; Villers, et al.,
2006; Navarro, et al., 2007). Hermetic storage (Donahaye, et al., 1991; Copeland
and Mcdonald, 1995; Johnson, et al., 2005; Fulton, et al., 2009) has several
implementations (Donahaye, et al., 2007; Christopher, et al., 2008; IRRI, 2008), and
the recycling of edible oil contaminated 55-gallon drums, for example, for long term
use in hermetic storage of grains is common practice (Seck, et al., 1996; Lindblad
and Druben, 1980; Murdock, et al., 2003; Adhikarinayake, 2005; Harris and Miller.
2008).
The research on which the predicted time to complete mortality (PTCM) research is
based (Figure 2.1) was conducted at fixed temperatures (10°C and 27°C), maize
moistures (8% and 16%), and time (4 to 28 days) (Yakubu, 2009; Yakubu et al.,
2011). A field study, based on Yakubu, et al., (2011) stored maize (13.7 %), with
about 90 weevils/kg, in six 10-L recycled edible oil containers at ambient
temperature (~20°C), and shaded from direct sun rays. Three containers were
sealed, and three had screening to allow air circulation without allowing weevils to
escape. The study conducted in Uganda (East Africa) produced 100% weevil
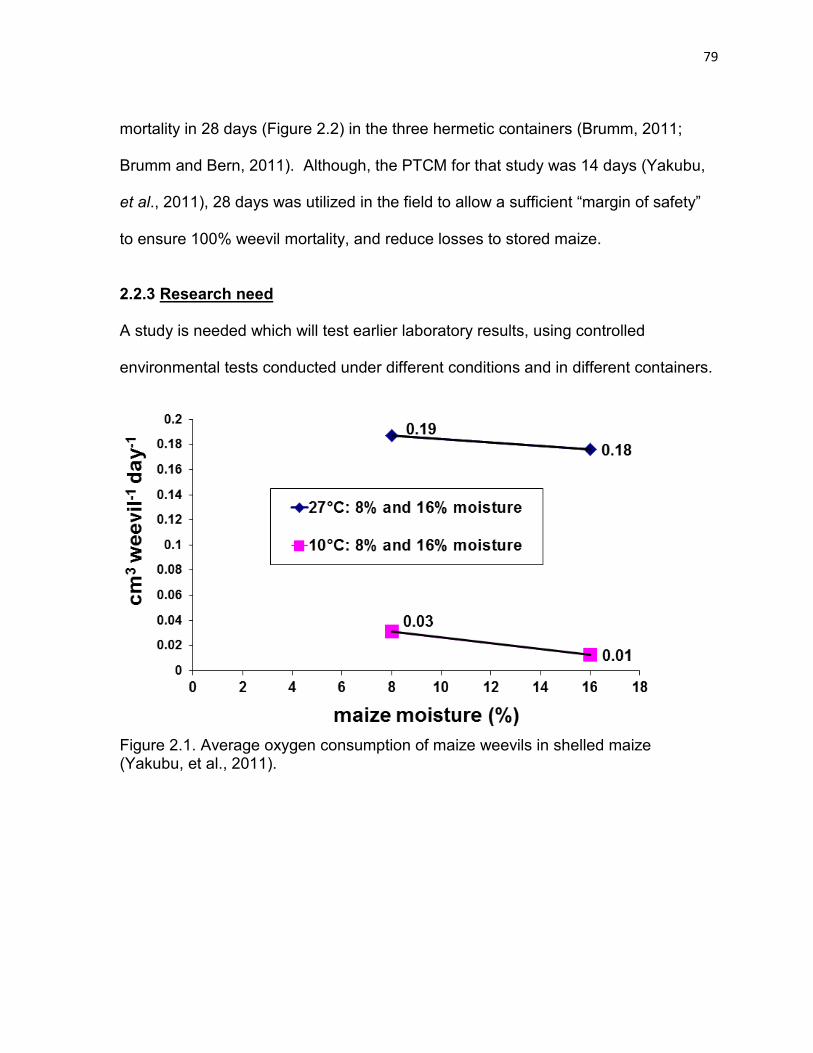
79
mortality in 28 days (Figure 2.2) in the three hermetic containers (Brumm, 2011;
Brumm and Bern, 2011). Although, the PTCM for that study was 14 days (Yakubu,
et al., 2011), 28 days was utilized in the field to allow a sufficient “margin of safety”
to ensure 100% weevil mortality, and reduce losses to stored maize.
2.2.3 Research need A study is needed which will test earlier laboratory results, using controlled
environmental tests conducted under different conditions and in different containers.
Figure 2.1. Average oxygen consumption of maize weevils in shelled maize (Yakubu, et al., 2011).
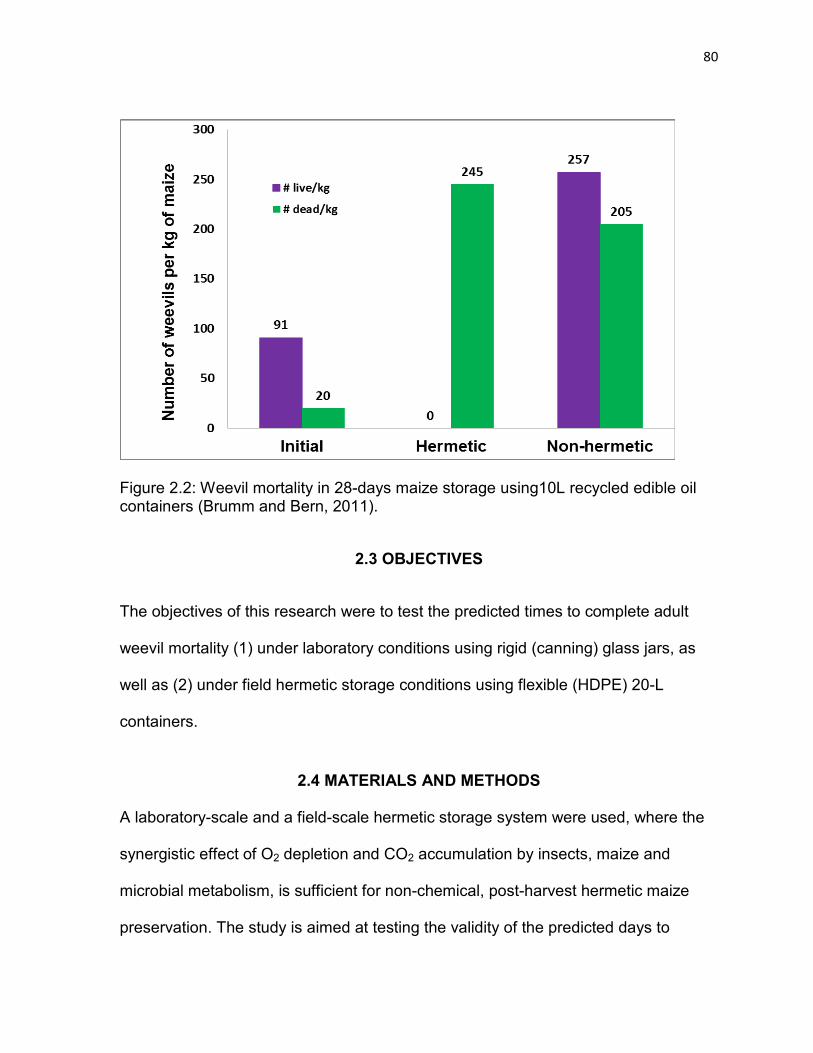
80
Figure 2.2: Weevil mortality in 28-days maize storage using10L recycled edible oil containers (Brumm and Bern, 2011).
2.3 OBJECTIVES
The objectives of this research were to test the predicted times to complete adult
weevil mortality (1) under laboratory conditions using rigid (canning) glass jars, as
well as (2) under field hermetic storage conditions using flexible (HDPE) 20-L
containers.
2.4 MATERIALS AND METHODS
A laboratory-scale and a field-scale hermetic storage system were used, where the
synergistic effect of O2 depletion and CO2 accumulation by insects, maize and
microbial metabolism, is sufficient for non-chemical, post-harvest hermetic maize
preservation. The study is aimed at testing the validity of the predicted days to
81
mortality of a previous study that defined a procedure for predicting time to complete
adult weevil mortality (Yakubu, et al., 2011).
2.4.1 Experimental maize Maize grain of the commercial hybrid Fontanelle 6T672 was harvested at about
14.5%1 moisture using a 4420 Deere combine. Following harvest, maize was
cleaned (Yakubu, et al., 2011) to remove broken maize and foreign material and
stored at 4°C until use. Experimental maize moistures were measured using the
103oC, 72 h oven method (ASABE, 2008). The maize which lost 2.5 moisture points
during storage was used as is, for this research.
2.4.2 Experimental weevils A stock culture of 100 adult S. zeamais Motschulsky (unsexed) obtained from the
Iowa State University Entomology Departmental laboratory were placed in five
unsterilized 3.74-L glass jars, with screen lids, half full of 12% moisture Fontanelle
6T672 maize. Weevils were allowed to oviposit on the maize to develop a colony.
This was achieved by placing maize weevils in a growth chamber at about 27°C and
at interstitial relative humidity determined by maize moisture, for two months
(Arannilewa, et al., 2006). Weevils from this colony were used in the hermetic
storage studies.
1 All moistures are % wet basis
82
2.4.3 Laboratory scale testing
2.4.3.1 Objective
To test time to complete adult weevil mortality, in a laboratory scale hermetic storage
study, using glass-canning jars.
2.4.3.2 Experimental containers Each of 216, 473-mL (one-pint) Kerr canning jars (Mason Jar 61000, Jarden Home
Brands, 14611 W. Commerce Road, Daleville, IN) was loaded to 90% capacity, with
0.337 kg of maize at 12% moisture and stored at 23°C along with the number of
weevils (21, 17, and 14) necessary to bring about 100% weevil mortality at the
desired number of days (17, 21, and 26, respectively). Hermetic tests utilized
canning jars with sealed lids, while non-hermetic tests utilized jars fitted with
aluminum screen lids, which allowed air passage but not weevil escape. Jars were
stored in a model 13-988-126 GW, Fisher Scientific Isotemp refrigeration chamber
(Thermo Fisher Scientific Inc., Waltham, MA 02454), maintained at 23oC.
2.4.3.3 Treatment design
The completely randomized block treatment design had four factors (days, maize
moisture, temperature, and storage type). Days (storage time) had 3 levels (17days,
21 days, and 26 days), moisture had one level (12%), temperature had one level
(23°C), storage type had two levels (hermetic and non-hermetic), and there were
eighteen replications (Figure 2.3).
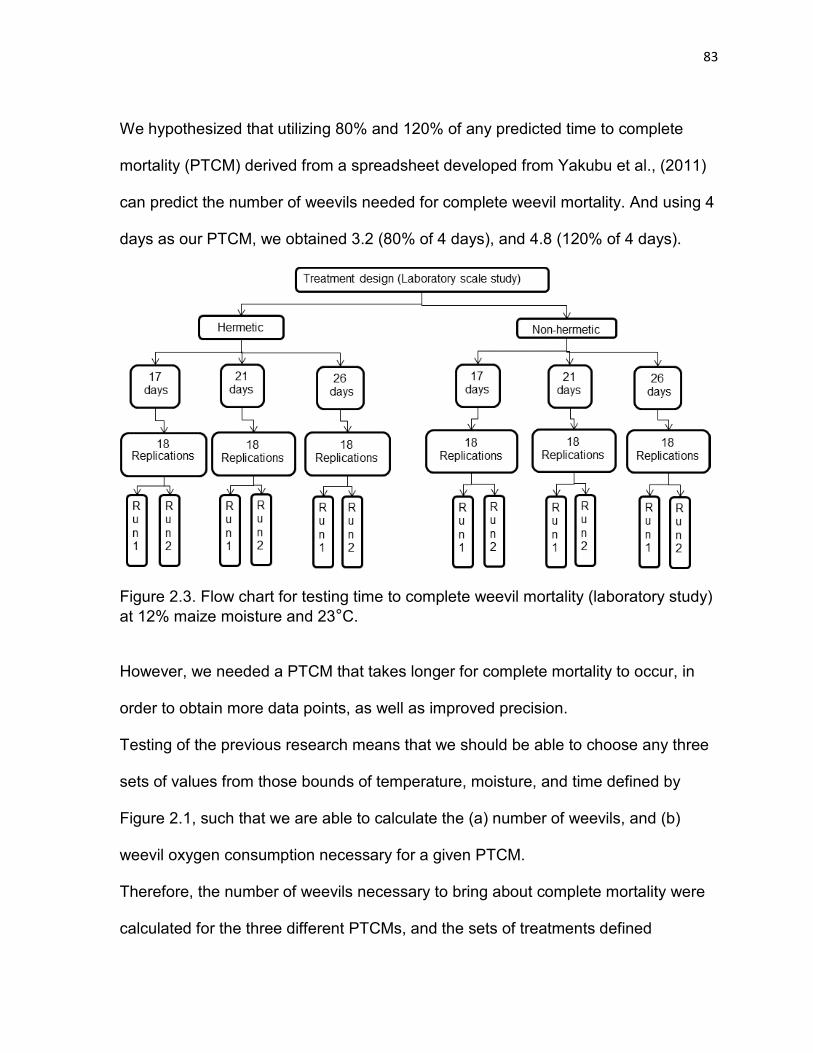
83
We hypothesized that utilizing 80% and 120% of any predicted time to complete
mortality (PTCM) derived from a spreadsheet developed from Yakubu et al., (2011)
can predict the number of weevils needed for complete weevil mortality. And using 4
days as our PTCM, we obtained 3.2 (80% of 4 days), and 4.8 (120% of 4 days).
Figure 2.3. Flow chart for testing time to complete weevil mortality (laboratory study) at 12% maize moisture and 23°C.
However, we needed a PTCM that takes longer for complete mortality to occur, in
order to obtain more data points, as well as improved precision.
Testing of the previous research means that we should be able to choose any three
sets of values from those bounds of temperature, moisture, and time defined by
Figure 2.1, such that we are able to calculate the (a) number of weevils, and (b)
weevil oxygen consumption necessary for a given PTCM.
Therefore, the number of weevils necessary to bring about complete mortality were
calculated for the three different PTCMs, and the sets of treatments defined

84
previously were replicated 18 times, in two runs and randomly assigned to positions
in the 23°C temperature laboratory chambers. Runs represent the number of times
the storage chamber was filled with experimental units during the conduct of this
research.
2.4.4 Field scale testing
2.4.4.1 Objective
To test time to complete adult weevil mortality, in a field scale hermetic storage
study.
2.4.4.2 Experimental containers
Plastic (HDPE) 20-L containers designed to hold 15.88 kg (582 fl. oz) soybean oil
(Columbus Foods, Chicago, Illinois 60622) were collected from Chinese fast food
restaurants in Ames and Des Moines, Iowa and cleaned using a “soak-shake-rinse”
approach. This involved adding 1 L of tap water to each 20-L HDPE container,
adding about 57g (2.0 oz) of ultra concentrated soap (Dawn, Procter and Gamble,
Cincinnati, OH) dish soap and shaking for 5 min, until the lather filled the 20-L HDPE
container interior. The containers were then covered with lids, left standing for 24 h
and shaken for 5 min, at the end of the 24 h period. Their contents were emptied,
thereafter, and they were each rinsed thrice. Following this, they cans were inverted
and allowed to dry for 24 h before use for this research. The lids were also
scrubbed, with the dish soap and sponge, upon opening before being left to dry, for
the same length of time.
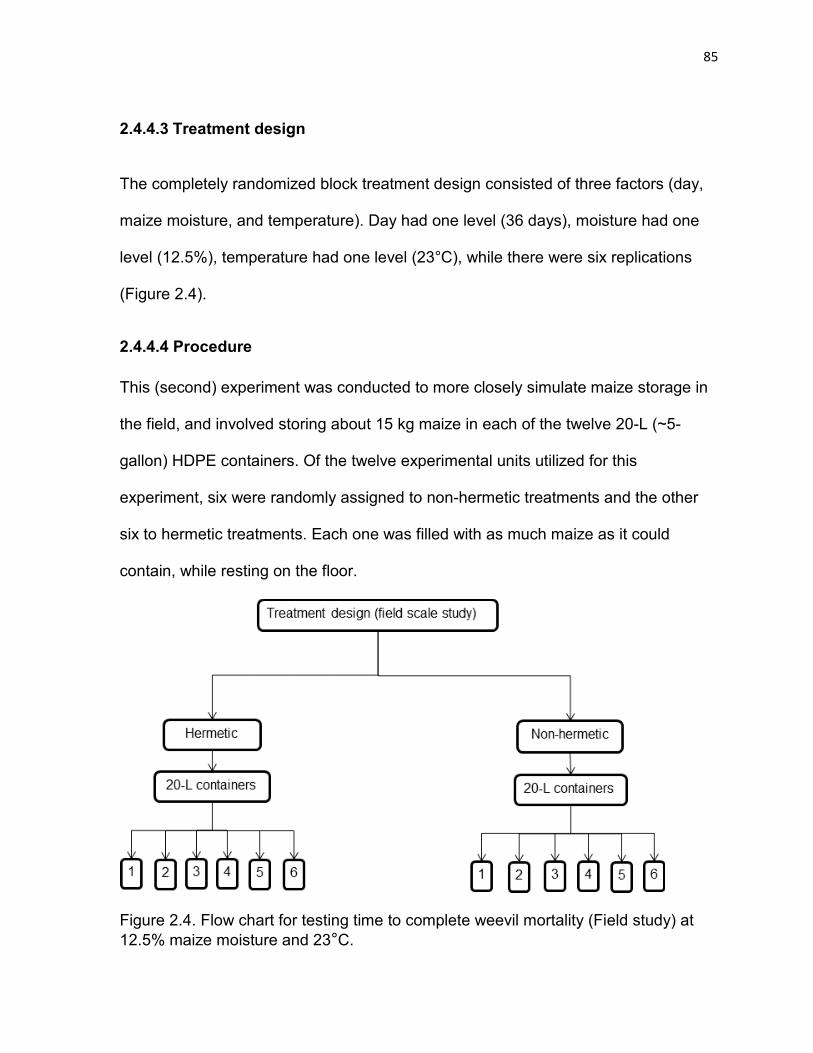
85
2.4.4.3 Treatment design
The completely randomized block treatment design consisted of three factors (day,
maize moisture, and temperature). Day had one level (36 days), moisture had one
level (12.5%), temperature had one level (23°C), while there were six replications
(Figure 2.4).
2.4.4.4 Procedure
This (second) experiment was conducted to more closely simulate maize storage in
the field, and involved storing about 15 kg maize in each of the twelve 20-L (~5-
gallon) HDPE containers. Of the twelve experimental units utilized for this
experiment, six were randomly assigned to non-hermetic treatments and the other
six to hermetic treatments. Each one was filled with as much maize as it could
contain, while resting on the floor.
Figure 2.4. Flow chart for testing time to complete weevil mortality (Field study) at 12.5% maize moisture and 23°C.
86
2.4.4.5 Maize quantity and percent fill
It was noted that container volume increased when filled 20-L HDPE containers
were lifted off the floor or tapped against the floor, increasing available headspace
(Beals, et al., 2000; Roylance, 2001; Langer, 2008). Considering EU volume
expansion, it was estimated that an extra 2 kg would be required to fill the EU.
Based on estimated total quantity of maize (17.50 kg) required to fill this EU, a
percent fill was calculated for individual EU, and the number of weevils required to
use up the remainder of the oxygen was calculated, according to percent fill and
maize quantity in each 20-L HDPE container. This is based on the preference for
filling containers to the brim in field hermetic storage practices (Markley, 1951;
Umaine, 2007; De Jaeger, et al., 2003; Devor, et al., 2007; Sohb, 2008). This
provided a basis for determining the total number of weevils required to use up the
O2 and to cause complete weevil mortality. The number of weevils required to cause
complete mortality was also applied to non-hermetic 20-L HDPE container, used as
control treatments.
2.4.4.6 Example calculations Step 1 Estimated additional 20L HDPE container space to be filled (kg) = A1 Estimated 100% 20L HDPE container=17.52 kg Initial weight of maize in 20L HDPE container (kg) = A2 Estimated percent 20L HDPE container space left to fill=A3= (A1/A2)*100 Estimated percent 20L HDPE container fill=100-A3
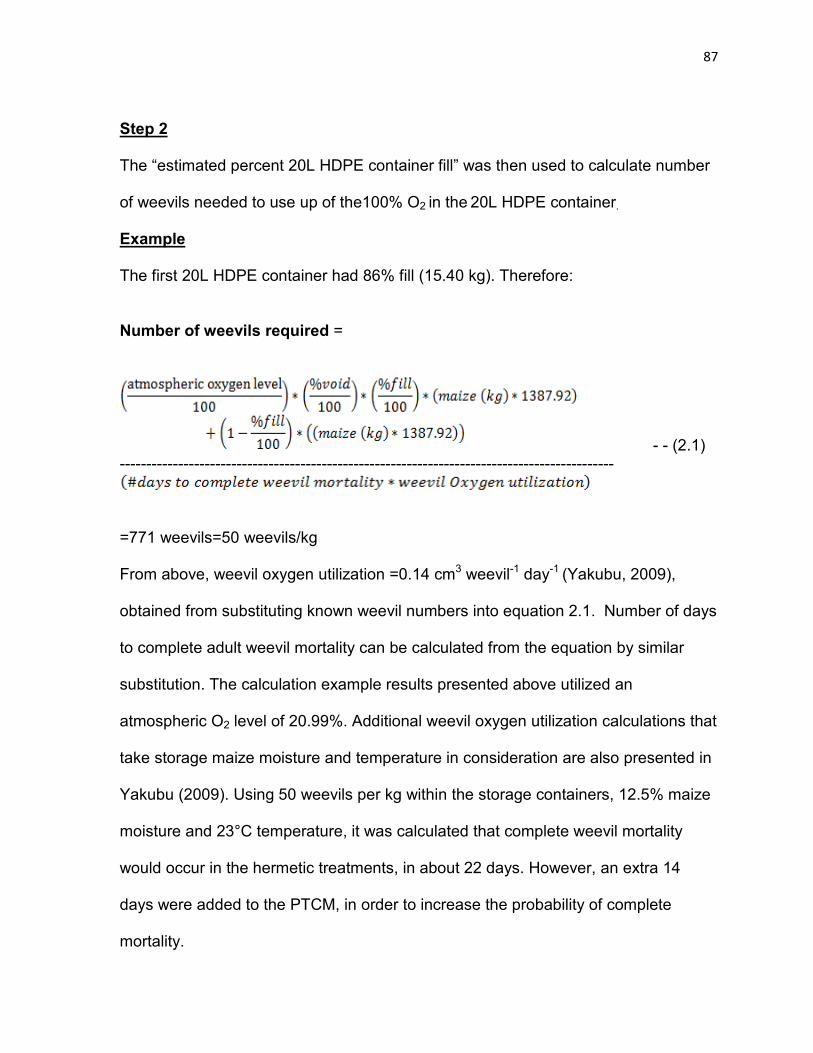
87
Step 2 The “estimated percent 20L HDPE container fill” was then used to calculate number of weevils needed to use up of the100% O2 in the 20L HDPE container.
Example The first 20L HDPE container had 86% fill (15.40 kg). Therefore: Number of weevils required =
- - (2.1) ---------------------------------------------------------------------------------------------
=771 weevils=50 weevils/kg From above, weevil oxygen utilization =0.14 cm3 weevil-1 day-1 (Yakubu, 2009),
obtained from substituting known weevil numbers into equation 2.1. Number of days
to complete adult weevil mortality can be calculated from the equation by similar
substitution. The calculation example results presented above utilized an
atmospheric O2 level of 20.99%. Additional weevil oxygen utilization calculations that
take storage maize moisture and temperature in consideration are also presented in
Yakubu (2009). Using 50 weevils per kg within the storage containers, 12.5% maize
moisture and 23°C temperature, it was calculated that complete weevil mortality
would occur in the hermetic treatments, in about 22 days. However, an extra 14
days were added to the PTCM, in order to increase the probability of complete
mortality.
88
Non-hermetic treatment involved filling each assigned EU with maize and weevil as
above and using an aluminum screened lid. This is to simulate open-air storage,
without allowing weevil escape. Therefore, using two treatments types (hermetic,
non-hermetic) with six replications for each treatment type gave a total of 12
experimental units (EUs), with the total number of weevils for each 20-L HDPE
container calculated according to Yakubu (2009) and counted manually.
2.4.4.7 Sealing hermetic 20-L HDPE containers
2 ply plastic bags (Iowa Prison Industries, Plastics division, Mitchellville, IA. Bag
size: 33X39, MIL: 0.7; Gallon: 33; PCS: 300; LOT #: 04212009), folded 5 times were
placed over the mouth of each hermetic treatment’s EU, and covered with a screw-
on lid, to prevent air escape, but not so tight as to damage the plastic bag. After
this, one #64, crepe colored, 31/2 *1/4 in rubber band (“@ the office”, 00564WM,
distributed by Wal-mart stores, inc. Bentonville, AR) was wrapped around the part of
the bag extending beneath the lid, four times. This was done to push the bag tightly
against the neck of the EU, and prevent air exchange between the storage and
external environment. A similar bag as the first one was then placed over the lid, to
extend beneath it and another rubber band was used to bind the part of the bag
beneath the lid tightly to the neck of the 20-L HDPE container.
2.4.4.8 Experimental chamber
The recycled 20-L HDPE containers containing maize were stored on a pallet in a
room maintained at 23°C.
89
2.4.4.9 Post experiment weevil count
To determine number of dead weevils at the termination of the research, two empty
non-hermetic jars, labeled “dead (D)” and “alive (A)”, and covered with screen and
lid (with hole) where setup and assigned to each EU. Each set had the number of
the 20-L HDPE container to which they were assigned written on them. And
destructive sampling of EUs was used, where one EU was opened at a time and
tipped over to empty its content into a 4.8-mm (12/64-in) round hole sieve, sitting
over a pan, a little at a time. The sieve was then shaken to dislodge (Navarro, et al.,
2007) the weevils into the pan, and the weevils were counted into their assigned jar,
according to whether they were dead or alive (Yakubu, et al., 2011).
2.5 RESULTS AND DISCUSSION 2.5.1 Laboratory scale test results This study is a follow-up laboratory-scale study of the original research (Yakubu, et
al., 2011), which involved “predicting time to complete mortality (PTCM)”. That study
found significant effects of day, storage type, temperature, moisture and oxygen on
weevil mortality, for hermetically stored maize (complete data are shown in Appendix
A).
2.5.2 Mortality prediction shortfalls Weevil mortality for hermetic treatments (Table 2.2) shows a major advantage over
open-air storage (non-hermetic), although weevil mortalities were not 100%. Weevil
oxygen utilization rates are greater at higher temperatures (25 to 33°C) than at lower
temperatures (Figures 2.1 and 2.5) and weevil mortality rate follows the same trend
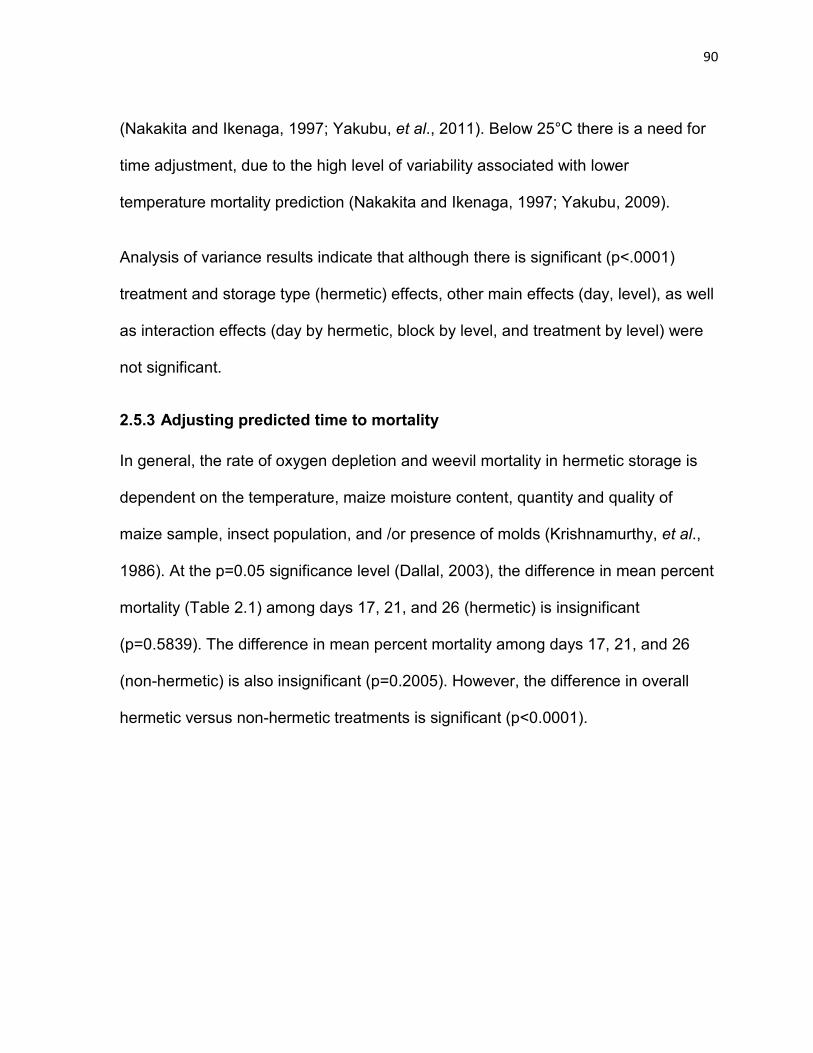
90
(Nakakita and Ikenaga, 1997; Yakubu, et al., 2011). Below 25°C there is a need for
time adjustment, due to the high level of variability associated with lower
temperature mortality prediction (Nakakita and Ikenaga, 1997; Yakubu, 2009).
Analysis of variance results indicate that although there is significant (p<.0001)
treatment and storage type (hermetic) effects, other main effects (day, level), as well
as interaction effects (day by hermetic, block by level, and treatment by level) were
not significant.
2.5.3 Adjusting predicted time to mortality In general, the rate of oxygen depletion and weevil mortality in hermetic storage is
dependent on the temperature, maize moisture content, quantity and quality of
maize sample, insect population, and /or presence of molds (Krishnamurthy, et al.,
1986). At the p=0.05 significance level (Dallal, 2003), the difference in mean percent
mortality (Table 2.1) among days 17, 21, and 26 (hermetic) is insignificant
(p=0.5839). The difference in mean percent mortality among days 17, 21, and 26
(non-hermetic) is also insignificant (p=0.2005). However, the difference in overall
hermetic versus non-hermetic treatments is significant (p<0.0001).
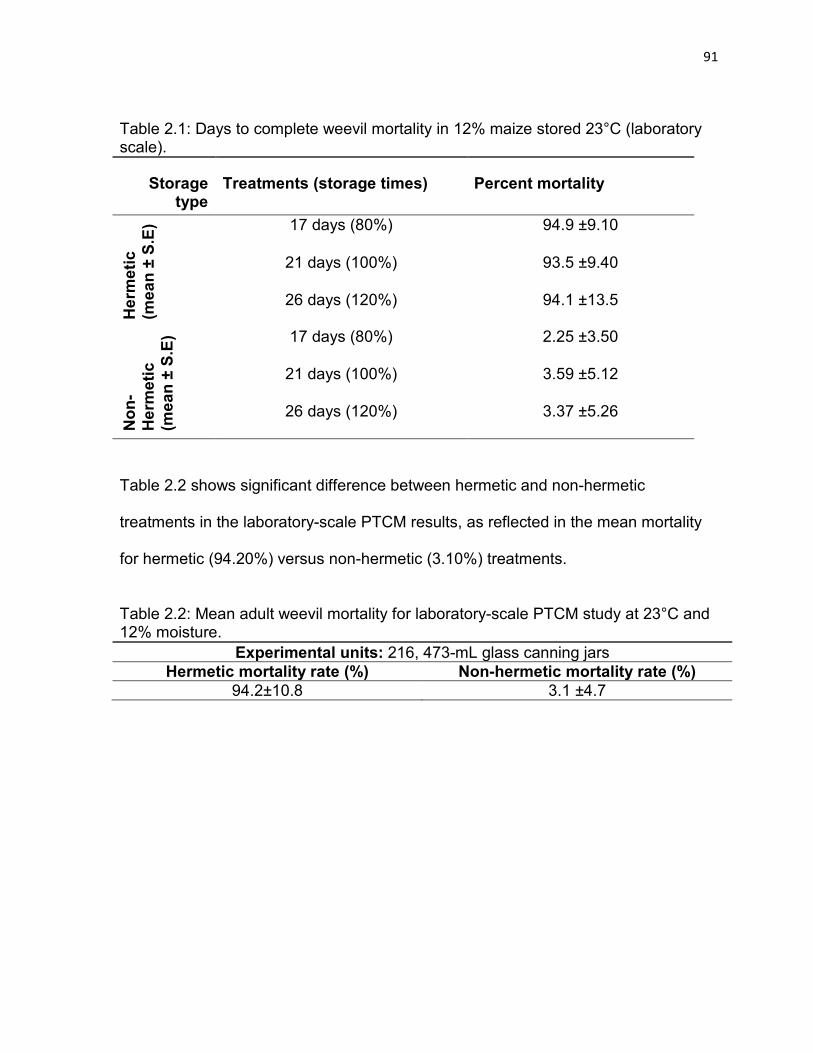
91
Table 2.1: Days to complete weevil mortality in 12% maize stored 23°C (laboratory scale).
Storage type
Treatments (storage times) Percent mortality
Her
met
ic
(mea
n ±
S.E)
17 days (80%) 94.9 ±9.10
21 days (100%) 93.5 ±9.40
26 days (120%) 94.1 ±13.5
Non
-H
erm
etic
(m
ean
± S.
E) 17 days (80%) 2.25 ±3.50
21 days (100%) 3.59 ±5.12
26 days (120%) 3.37 ±5.26
Table 2.2 shows significant difference between hermetic and non-hermetic
treatments in the laboratory-scale PTCM results, as reflected in the mean mortality
for hermetic (94.20%) versus non-hermetic (3.10%) treatments.
Table 2.2: Mean adult weevil mortality for laboratory-scale PTCM study at 23°C and 12% moisture.
Experimental units: 216, 473-mL glass canning jars Hermetic mortality rate (%) Non-hermetic mortality rate (%)
94.2±10.8 3.1 ±4.7
92
Figure 2.5. Oxygen consumption of adults of S. zeamais and S. oryzae at different temperatures (Nakakita and Ikenaga, 1997).
2.5.4 Interactions
The percentage mean adult weevil mortality differences (hermetic main effect)
between hermetic and non-hermetic treatments is significant (p<0.0001), with an
estimated mean difference of 91.1 (94.2-3.1). However, the interaction (differences
of differences) result across days (Table 2.3), suggest no clear hermetic by day
interaction (p<0.5734). This indicates that the mortality differences in hermetic
treatments for all three levels of days (17, 21, and 26) are insignificant (Figure 2.6
and 2.7).
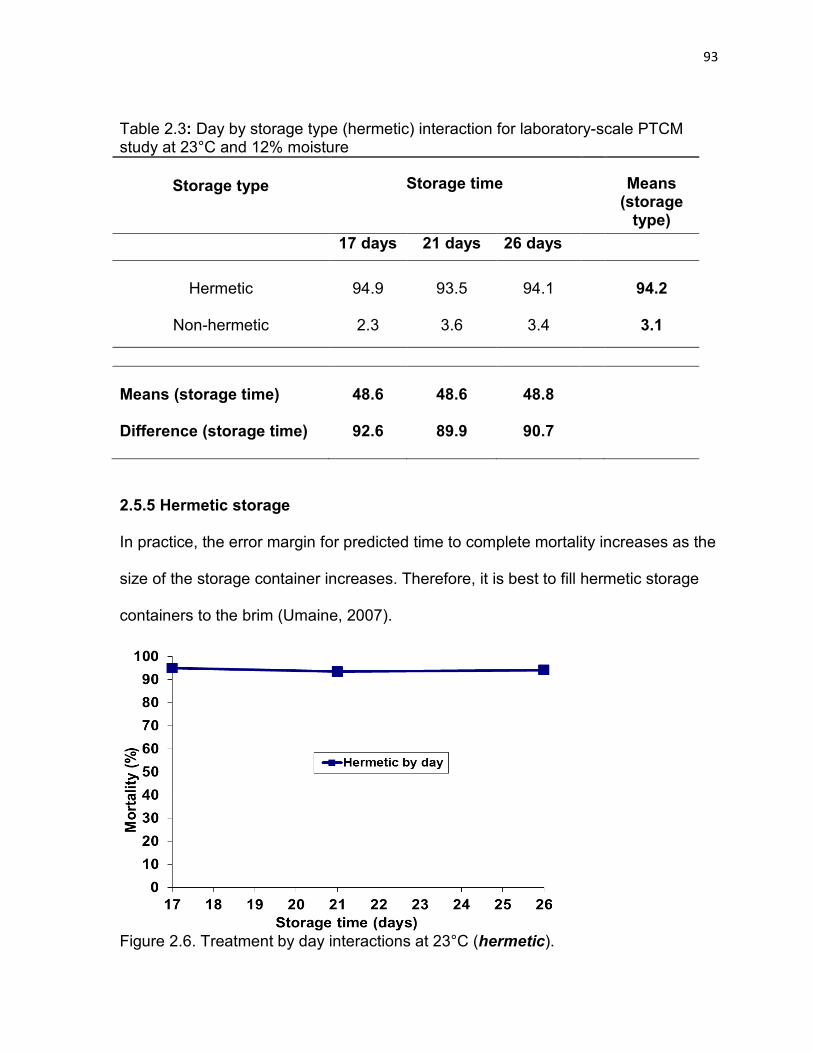
93
Table 2.3: Day by storage type (hermetic) interaction for laboratory-scale PTCM study at 23°C and 12% moisture
Storage type Storage time Means
(storage type)
17 days 21 days 26 days
Hermetic
94.9
93.5
94.1
94.2
Non-hermetic
2.3
3.6
3.4
3.1
Means (storage time)
48.6
48.6
48.8
Difference (storage time)
92.6
89.9
90.7
2.5.5 Hermetic storage
In practice, the error margin for predicted time to complete mortality increases as the
size of the storage container increases. Therefore, it is best to fill hermetic storage
containers to the brim (Umaine, 2007).
Figure 2.6. Treatment by day interactions at 23°C (hermetic).
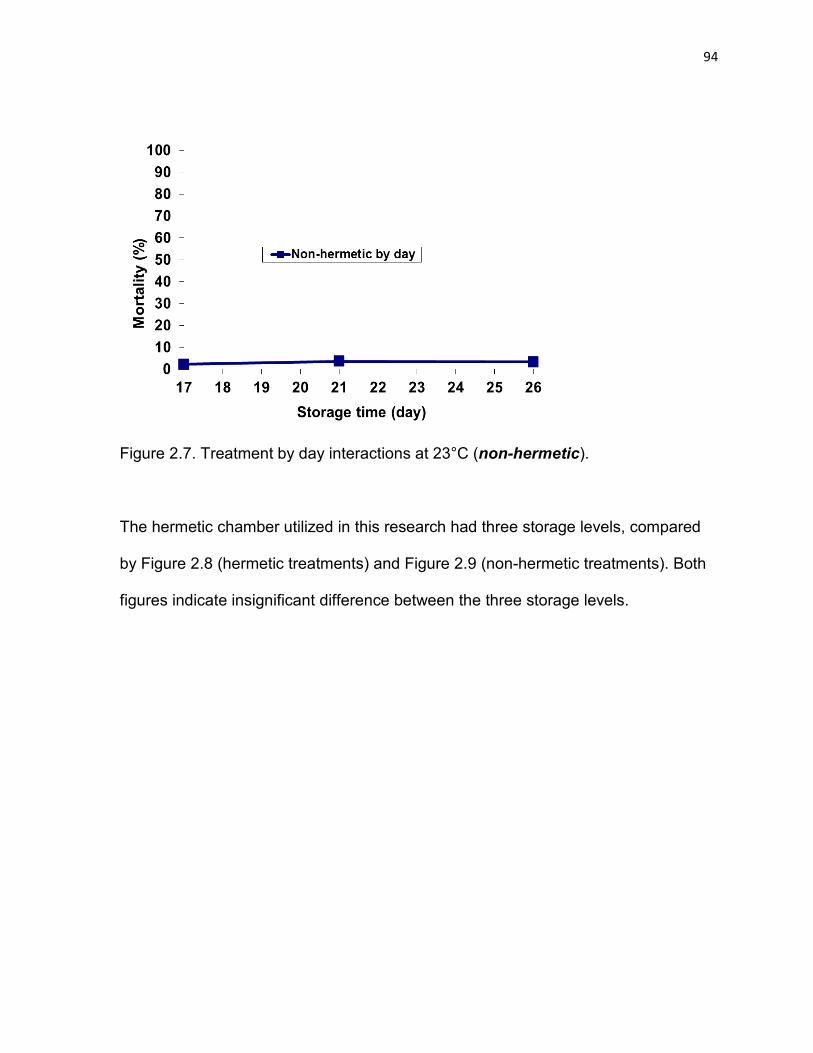
94
Figure 2.7. Treatment by day interactions at 23°C (non-hermetic).
The hermetic chamber utilized in this research had three storage levels, compared
by Figure 2.8 (hermetic treatments) and Figure 2.9 (non-hermetic treatments). Both
figures indicate insignificant difference between the three storage levels.
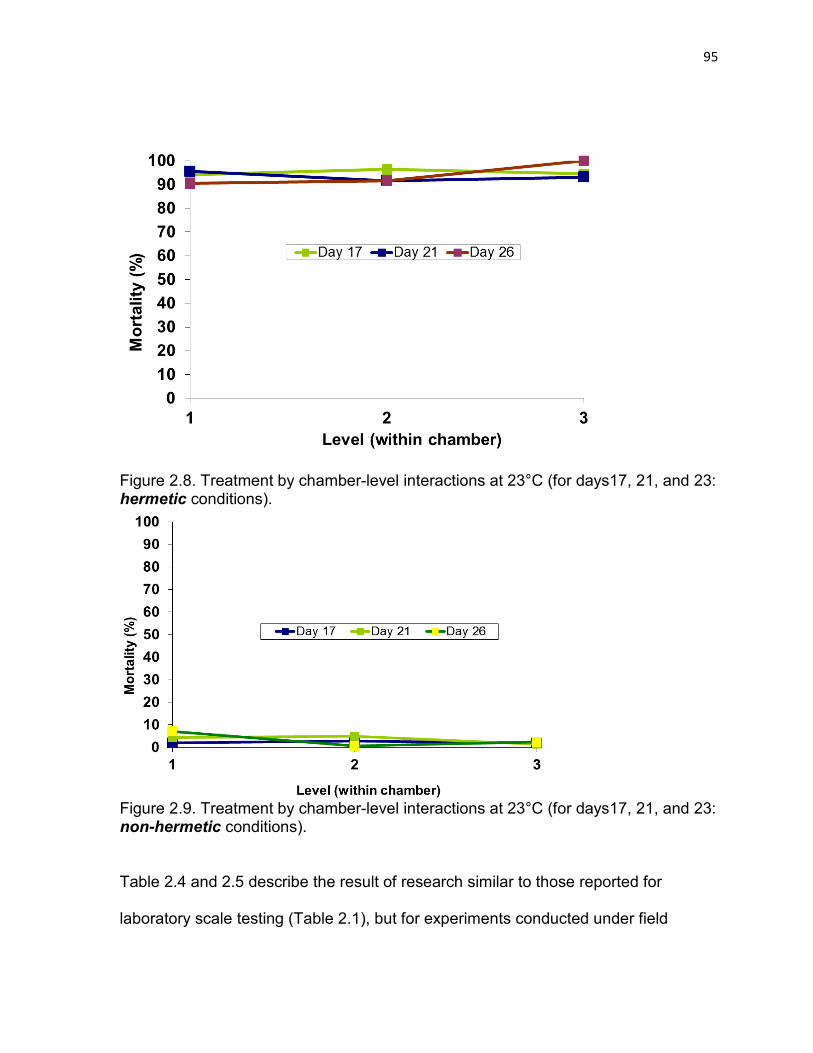
95
Figure 2.8. Treatment by chamber-level interactions at 23°C (for days17, 21, and 23: hermetic conditions).
Figure 2.9. Treatment by chamber-level interactions at 23°C (for days17, 21, and 23: non-hermetic conditions).
Table 2.4 and 2.5 describe the result of research similar to those reported for
laboratory scale testing (Table 2.1), but for experiments conducted under field
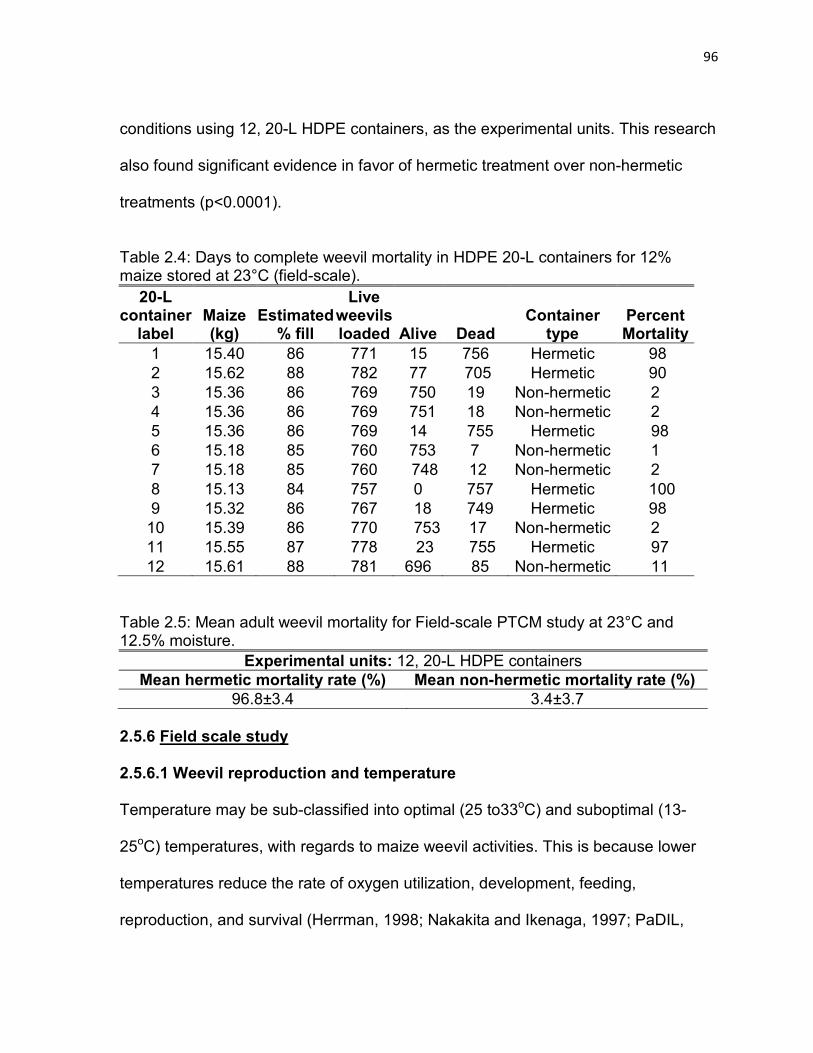
96
conditions using 12, 20-L HDPE containers, as the experimental units. This research
also found significant evidence in favor of hermetic treatment over non-hermetic
treatments (p<0.0001).
Table 2.4: Days to complete weevil mortality in HDPE 20-L containers for 12% maize stored at 23°C (field-scale).
20-L container
label Maize (kg)
Estimated % fill
Live weevils loaded Alive Dead
Container type
Percent Mortality
1 15.40 86 771 15 756 Hermetic 98 2 15.62 88 782 77 705 Hermetic 90 3 15.36 86 769 750 19 Non-hermetic 2 4 15.36 86 769 751 18 Non-hermetic 2 5 15.36 86 769 14 755 Hermetic 98 6 15.18 85 760 753 7 Non-hermetic 1 7 15.18 85 760 748 12 Non-hermetic 2 8 15.13 84 757 0 757 Hermetic 100 9 15.32 86 767 18 749 Hermetic 98
10 15.39 86 770 753 17 Non-hermetic 2 11 15.55 87 778 23 755 Hermetic 97 12 15.61 88 781 696 85 Non-hermetic 11
Table 2.5: Mean adult weevil mortality for Field-scale PTCM study at 23°C and 12.5% moisture.
Experimental units: 12, 20-L HDPE containers Mean hermetic mortality rate (%) Mean non-hermetic mortality rate (%)
96.8±3.4 3.4±3.7 2.5.6 Field scale study 2.5.6.1 Weevil reproduction and temperature Temperature may be sub-classified into optimal (25 to33oC) and suboptimal (13-
25oC) temperatures, with regards to maize weevil activities. This is because lower
temperatures reduce the rate of oxygen utilization, development, feeding,
reproduction, and survival (Herrman, 1998; Nakakita and Ikenaga, 1997; PaDIL,
97
2009; Yakubu, et al., 2011). According to PaDIL (2009), complete development time
for the life cycle of S. zeamais averaged 36 days (range 33 to 45) at 27 ± 1oC, and
69 ± 3% RH.
The life cycle involves the female drilling a hole into the kernel, depositing the egg,
and secreting a mucilaginous plug to enclose the egg as the ovipositor is withdrawn.
However, this external evidence that the kernel is infested was negligible in both the
hermetically and non-hermetically stored maize, for our research, suggesting that
sub-optimal temperature may have slowed or suppressed insect reproduction.
PaDIL (2009) also discovered that the maximum daily rate of fecundity, duration of
development, and numbers of progeny produced were optimal at 30oC and 75% RH.
Since, we conducted our research at suboptimal temperature (23oC) it seems like
the existing eggs may require more time to hatch.
Hermetic treatments, for our research had 97 to 100% weevil mortality versus 1 to
11% mortality for non-hermetic treatments (Table 2.4). Therefore, few live weevils
were remaining in the 20-L HDPE containers to which hermetic treatments were
applied. Other researchers (De Bruin, 2002; Villers et al., 2004; Villers and
Gummert, 2009) also found the presence of live insects following 12 months of
hermetic storage. Villers and Gummert (2009) showed about 154 (at month zero) to
39 live insects (at month 12) or 73% decrease in live insect population in hermetic
storage for 20L container (17.50 kg maize) equivalent. This may be because of late-
hatching eggs, which produced weevils that were not yet dead or it may be due to
residual oxygen, within hermetic containers that continued to sustain some weevil
98
life and prevented complete mortality (De Lima; Nakakita and Ikenaga, 1997; Fields,
2006). This seems to agree with previous authors’ findings that the rate of adult
insect mortality, respiration and reproduction in hermetic storage is slower at sub-
optimal temperatures (De Lima; Nakakita and Ikenaga, 1997; Fields, 2006).
2.5.6.2 Packing density
Variability in 20-L HDPE container packing produced different filling rates and
weights because 20-L HDPE container volume expanded with maize load and when
lifted off the ground (Tsai, 1999; Roylance, 2001; Langer, 2008). Achieving packing
densities close to those of farm-scale silos, to create anaerobic conditions, requires
packing considerable maize kernels into a relatively small volume (Johnson, et al.,
2005), in plastic containers.
2.6 CONCLUSIONS Based on this research:
• Significant (p<0.0001) differences in mean mortality rates were recorded in
hermetic (94.2%) versus non-hermetic (3.1%) laboratory scale treatments,
conducted at 23°C with 12% moisture maize in 473-mL jars.
• Significant (p<0.0001) differences in mean mortality rates were also recorded
in hermetic (96.8%)) versus non-hermetic (3.4%) field scale treatments,
conducted at 23°C with 12.5% moisture maize in 20-L HDPE container.
• Insignificant interactions exist in day by hermetic (p=0.5734) and treatment by
level (p=0.1311) interactions.
99
2.7 REFERENCES Adhikarinayake, T. B. 2005. Thesis. Wageningen University. Chapter 7.Technical and economic feasibility of airtight ferrocement bin for on-farm storage of paddy in Sri Lanka. The Netherlands. Amani, H.K.R., Brink, R.V.D, and W.E. Maro. 1992. Tolerating the private sector: grain trade in Tanzania after adjustment. Cornell food and nutrition policy program. Ithaca, NY: Cornell University. Arannilewa, S.T, Ekrakene. T and J.O. Akinneye. 2006. Laboratory evaluation of four medicinal plants as protectants against the maize weevil, sitophilus zeamais (Mots). African Journal of Biotechnology. 5 (21): 2032-2036. ASABE. 2008. ASABE standards, 43rd Ed. S352.1: Moisture measurement unground grain and seeds. St. Joseph, Mich.: ASABE. Beals, M., Gross, L. and S. Harrell. 2000. Cell aggregation and sphere packing.Retrieved on January 29, 2011 from http://www.tiem.utk.edu/~gross/bioed/webmodules/spherepacking.htm. Bern, C., A Yakubu, T. Brumm. 2011. Hermetic maize storage systems for subsistence farmers. Proceedings of XXXIV CIOSTA CIGR V Conference 2011, University of Natural Resources and Applied Life Sciences, Vienna, Austria, June 29-July 1. Brumm, T.J. 2010. Hermetic (air-tight) storage of grain to prevent insect damage. A demonstration project. Project procedure manual. Iowa State University. VEDCO, Uganda Brumm, T. J., and C.J. Bern. 2011. Grain Storage In Uganda 2010 CSRL Annual report. Department of Agricultural and Biosystems Engineering Iowa State University. Chapman, R.F. 1998. The insects. Structure and function, 4th edition. New York: Cambridge University Press. p. 456-457. Christopher, L.B., Dorner, J.W., Lamb, M.C., Sorensen, R.B., and T. H. Sanders. 2008. Storing Peanuts in Flexible Hermetically Sealed Containers. An ASABE Meeting Presentation. Paper Number: 084198. Copeland, L.O and Mcdonald, M.B .1995.Principles of seed science and technology. 3rd edition. New York: Chapman & Hill: 197-198.
100
Darby, J.A and L.P. Caddick. 2007. Review of grain harvest bag technology under Australian conditions. A comprehensive analysis and field evaluation of harvest bag technology: incorporating a review of hermetic and temporary storage, control of insects and fungi, and preservation of grain quality, under typical Australian storage and handling conditions. CSIRO Entomology, Technical Report – No. 105. Dallal, G.E. 2003. Why P=0.05? Retrieved on December 9, 2011 from http://www.webpages.uidaho.edu/~brian/why_significance_is_five_percent.pdf. Daly, H.V., Doven, J.T., A.H. Purcell III. 1998. Introduction to insect biology and diversity. New York: Oxford University Press. De Bruin T. 2002. A user’s introduction to hermetic storage – how it works. (Unpublished - GrainPro document #SL2322TDB0506-4). GrainPro, Inc., Concord, Mass., USA. Data from Philippines (2002. Cited by Villers, P and Gummert, M. 2009. Seal of approval. Rice Today: 36. De Jaeger, K., Hoogeman,M.S., Engelsman,M. Seppenwoolde,Y., Damen,E.M.F., Mijnheer,B.J. and Boersma,L. J., and J.V. Lebesque. 2003. Dose-effect relations should be refitted when more accurate dose data is available. Radiotherapy and oncology : journal of the European Society for Therapeutic Radiology and Oncology. 69(1):1-10. De Lima, C.P.F. 1990. Airtight storage: principle and practice. In: Calderon, M. and Barkai-Golan, Rivka Ed., Food preservation by modified atmospheres, Chapter 2, CRC Press Inc., Boca Raton, Florida. p. 9-19. Demissie G, Teshome A, Abakemal D, Tadesse A. 2008. Cooking oils and ‘‘Triplex’’ in the control of sitophilus zeamais motschulsky (coleoptera: curculionidae) in farm-stored maize. Journal of Stored Products Research. 44: 173–178. Devor, R.E., Chang, T., Suntherland, J.W. 2007. Statistical quality design and control. Contemporary concepts and methods. 2nd edition. Upper Saddle River: Pearson Education, Inc. Dhliwayo, T., K.V. and Pixley. 2003. Divergent Selection for resistance to maize weevil in six maize populations. Crop Sci. 43: 2043-2049. Donahaye, E., Ziv, A., Blauschild, Y., Navarro, S. and Weerasinghe, D. 1991. Storage of paddy in hermetically sealed plastic liners in Sri Lanka. Trop. Sci., 31, 109-121. Donahaye, E.J., Navarro, S., Bell, C., Jayas, D., Noyes, R., Phillips, T.W. [Eds.] 2007. Proc. Int. Conf. Controlled Atmosphere and Fumigation in Stored Products, Gold-Coast Australia. 8-13th August 2004. FTIC Ltd. Publishing, Israel. pp 207-223.

101
EPA. 20011.Ozone layer protection-regulatory programs. Methyl bromide questions & answers. Retrieved on May 26, 2011 from www.epa.gov/ozone/mbr/qa.html
FAO. 2001. Manual on the application of the HAACP system in Mycotoxin prevention and control. FAO/IAEA training and reference center for food and pesticide control. FAO (ROME). Fields, P. 2006. Alternatives to chemical control of stored-product insects in temperate regions. KPS7-1. I. Lorini, B. Bacaltchuk, H. Beckel, D. Deckers, E. Sundfeld, J. P. dos Santos, J. D. Biagi, J. C. Celaro, L. R. D'A. Faroni, L.de O. F. Bortolini, M. R. Sartori, M. C. Elias, R. N. C. Guedes, R. G. da Fonseca, V. M. Scussel (eds.) Proceedings of the 9th International Working Conference on Stored-Product Protection. Campinas, São Paulo, Brazil. Brazilian Post-harvest Association - ABRAPOS, Passo Fundo, RS, Brazil, p. 653, 681. Fulton, J., Lowenberg-DeBoer, J., Moussa, B., and M. Otoo. 2009. Evaluating the effectiveness of alternative extension methods: Triple-bag storage of cowpeas by small-scale farmers in West Africa. Selected paper prepared for presentation at the Agricultural & Applied Economics Association, AAEA & ACCI joint annual meeting, Milwaukee, Wisconsin. Govereh, J., Haggblade, S., Nielson, H., and D. Tschirley. 2008. Report 1. Maize market sheds in Eastern and Southern Africa. A report prepared by Michigan State University for the world bank under conta=ract No. 7144132. Strengthening food security in sub-saharan Africa through trade liberalization and regional integration. Herrman, T.J. 1998. Integrated pest management in grain storage and feed mills. ASA Tecnical Bulletin, FT47, 4-5. IRRI, 2008. Grain storage and pest management. Hermetic grain storage systems. Retrieved on December 20, 2008 from www.knowledgebank.irri.org/Storage/Training_Manual_Grain_Storage.doc, http://www.irri.org/ and http://www.knowledgebank.irri.org/postproductioncourse/factsheetsNRefences/Storage/Hermetic%20Storage%20Systems.doc. Jacobs, S. 2004. Entomological notes. Weevils of stored grains. The Pennsylvania State University college of Agricultural Sciences. Cooperative extension. Retrieved on December 12, 2011 from http://ento.psu.edu/extension/factsheets/pdf/cerealPantryPests.pdf Johnson, H.E. Merry, R. J., Davies, D.R., Kell, D.B., Theodorou, M.K., and G.W. Griffith.2005.Vacuum packing: a model system for laboratory-scale silage fermentations. Journal of Applied Microbiology 2005, 98, 106–113.
102
Krishnamurthy, T.S., Spratt, E.C., and C.H. Bell. 1986. The toxicity of carbon dioxide to adult beetles in low oxygen atmospheres. Journal of Stored Products Research 22, 145±151. Korunic, Z. 1998. Diatomaceous earth: a group of natural insecticides. Journal of Stored Products Research, v. 34, n. 1, p. 87-97, 1998. Langer, J.S. 2008. Shear-transformation-zone theory of plastic deformation near the glass transition. Physical review E77, 021502. Lindblad, C. and L. Druben. 1980. Storage methods. Small farm grain storage. Volume III. Appropriate technologies for development. Manual M-2/ VITA publications manual series no. 35E. Arlington: VITA. Markley, S. M. 1951. Soybeans and soybean products: Volume 2. NYC, NY: Interscience Publishers Inc. Montemayor, R., 2004. Better Rice in Store. World Grain, November, 2004. Murdock, L.L., Dogo, S.D, Ntoukam, G., Kitch, L., and R.E. Shade. 2003. Preservation of cowpea grain in sub-Saharan Africa—Bean/Cowpea CRSP contributions. Field Crops Research, 82:169–178. Murdock, L. Forbes, B., and J. Fulton. 2007. Gates Foundation funds Purdue effort to protect food, enhance African economy. Retrieved on September 21, 2008 from http://www.entm.purdue.edu/news/murdock_gates.html. Nakakita, H and H. Ikenaga. 1997. Action of Low Temperature on Physiology of Sitophilus zeamais Motschulsky and Sitophilus oryzae (L.) (Coleoptera: Curculionidae) in Rice Storage. J. stored Prod. Res., 33(1): 31-38. 1997. Navarro, S., Donahaye, J.E. and S. Fishman. 1994. The future of hermetic storage of dry grains in tropical and subtropical climates. Proceedings of the 6th International Working Conference on Stored-Product Protection. by Highley, E., Wright, E.J., Banks, H.J. and Champ, B.R. (Eds), Canberra, Australia, 17-23 April 1994, CAB International, Wallingford, Oxon, UK, p. 130-138. Navarro, S., DeBruin, T., Montemayor, A.R., Finkelman, S., Rindner, M., and R. Dias. 2007. Use of biogenerated atmospheres of stored commodities for quality preservation and insect control, with particular reference to cocoa beans. Integrated Protection of Stored Products IOBC/wprs Bulletin. 30 (2): 197-204. PaDIL. 2009. Plant Biosecurity Toolbox. Maize weevil - Sitophilus zeamais. Diagnostic Methods for Maize weevil Sitophilus zeamais Retrieved on February 24, 2012 from http://www.padil.gov.au/pbt.
103
PHL Network (2009). Post harvest losses information system. Retrieved on March 27, 2010 from http://www.phlosses.net/index.php?form=losses_estimates&c_id=1. And http://www.aphlis.net/ Roylance, D. 2001. Yield and Plastic flow. Retrieved on January 21, 2011 from http://ocw.mit.edu/courses/materials-science-and-engineering/3-11-mechanics-of-materials-fall-1999/modules/yield.pdf.pp 7 Seck, D., Haubruge, G., Marlier, E., C. Gaspar.1996. Alternative protection of cowpea seeds against Callosobruchus maculatus (F.) (Coleoptera: Bruchidae) using hermetic storage alone or in combination with Boscia senegalensis (Pers) Lam ex Poir. Journal of Stored Products Research 32, 39-44. SGRL. 2007. The use of harvest bags on Australian farms. Retrieved on March 19, 2009 from http://www.sgrl.csiro.au/storage/stores_equipment/harvest_bags_recommendations.html Sinha, G. 2007. GM technology develops in the developing world. Science, 315: 182–183. Sohb, T.2008. Advances in computer and information sciences and engineering. New York, NY: Springer, p.277. Tsai, J., Taylor, R., Chothia, C., and M. Gerstein.1999.The Packing Density in Proteins: Standard Radii and Volumes. J. Mol. Biol. (1999) 290, 253±266. p. 256. UGL (Unga Group Limited). 2010. Jogoo. Nairobi Municipality (Kenya). www.superbrandseastafrica.com/assets/Featured-Brands/PDFs/116-jogoo.pdf Umaine. 2007. Extension Publications catalog. Let’s preserve. Steps to success in home canning. Bulletin #4079. Retrieved on December 21, 2008 from www.umext.maine.edu. Villers, P., De Bruinn, T and S. Navarro. 2004. Advances in hermetic storage as a methyl bromide replacement. Donahaye, E.J., Navarro, S., Bell, C., Jayas, D., Noyes, R., Phillips, T.W. [Eds.] (2007) Proceedings of international conference on controlled atmosphere and fumigation in stored products. Gold-Coast Australia. 8-13th August 2004.. pp 207-223. Villers, P., De Bruin, T., Navarro, S. 2006. Development and applications of the hermetic storage technology. Alternative methods to chemical control. Proceedings of the 9th international working conference on stored product protection. Campinas, São Paulo, Brazil. PS7-8 – 611:719.
104
Villers, P., Navarro, S., and T. De Bruin. 2008. Development of Hermetic Storage Technology in Sealed Flexible Storage Structures. Controlled Atmosphere and Fumigation (CAF) Conference (Unabridged Version, Advanced Copy). Achievements of CA and Fumigation, and development trends. Chengdu, China, September, 2008, Session 9. Villers, P and Gummert, M. January-March, 2009. Seal of approval. Rice Today. Weinberg, Z.G.,Yan, Y., Chen, Y., Finkelman, S., Ashbell, G., and S. Navarro. 2008. The effect of moisture level on high-moisture maize (Zea mays L.) under hermetic storage conditions—in vitro studies. Journal of Stored Products Research 44 (2008) 136–144. Walker, J. 2004. Famine, Drought, and Plagues (Natural Disasters). Corona, CA: Stargazer publishing. Yakubu, A. 2009. Thesis. Non-chemical on-farm hermetic maize storage in East Africa. Iowa State University. Ames(USA).
Yakubu, A., Bern, C. J., Coats, J. R., and T. B. Bailey. 2011. Hermetic on-farm storage for maize weevil control in East Africa. African Journal of Agricultural Research, 6(14): 3311-3319. Yigezu, Y. A. 2009. The Economics of Integrated Insect Pest Management in Stored Corn. Selected Paper prepared for presentation at the Agricultural & Applied Economics Association’s 2009 AAEA & ACCI Joint Annual Meeting, Milwaukee, WI, July 26-28, 2009.
105
CHAPTER 3: EFFECT OF HERMETIC STORAGE AND MAIZE WEEVILS ON MAIZE SEED GERMINATION
Yakubua, A., C.J. Berna, T. J. Brumma, J.R. Coatsb , and T. B. Baileyc aDepartment of Agricultural and Biosytems Engineering, [email protected], [email protected], [email protected] bDepartment of Entomology, [email protected] cDepartment of Statistics, [email protected] Iowa State University, Ames, Iowa 50011 USA
3.1 ABSTRACT
Up to 100% seed germination loss is possible during storage by subsistence
farmers. This is mostly due to high relative humidity and pest damage. Tropical
relative humidity, for instance, is usually above 90% for most of the year. This is
above the officially recommended seed storage relative humidity of 70% (14%
moisture content) and below, and limits the ability to store seeds for extended
periods in the tropics. The resulting high seed loss is due to the interaction among
temperature, maize moisture content, insects and molds which accelerate seed
damage. Maize weevils (Sitophilus zeamais (Motsch.)) cause heavy damage to
maize (Zea mays L.) during open-air storage, and although some farmers utilize
insecticides for the control of the weevils, with some success, others rarely use
conventional insecticides to protect their grain. Varoious authors have determined
hermetic storage to be as effective as cold storage, but cheaper, in addition to being
adaptable to local cultures. Therefore, this study utilized hermetic storage for the
control of maize weevils, and conducted seed germination tests, following storage.
The objective of the study was to determine the effectiveness of hermetic on-farm

106
seed storage from a seed quality preservation perspective. Laboratory studies were
conducted where maize seeds in storage jars were stored in a controlled
temperature (27°C) chamber for various time periods (0,4, 8, 12 months), and
germination tests were conducted on the seeds under optimal growth conditions
(800 mL hydration, 25°C, fluorescent lighting) in the laboratory. Hermetically stored
maize seeds had 98.7 to 99.5% germination rates versus 35.0 to 72.9 for non-
hermetic (open-air) storage, over the 12-month seed storage period. Treatments of
particular interest are hermetic treatments with weevils, which had mean germination
rates of 99.1% (at month 0), 98.7% (at month 4), 99.6% (at month 8), and 99.3% (at
month 12), respectively. The conclusion is that hermetic storage preserves maize
seed viability, even when seeds are stored under ambient conditions, and with
weevils.
Keyword: Maize, weevils, hermetic seed storage, open-air, germination, seed storage.
3.2 INTRODUCTION
Agriculture, in countries such as Ethiopia, and Somalia (East Africa) is mostly rain-
fed. And post-harvest maize storage structures, such as cribs and granaries, usually
made from simple materials such as wood, thatch, and mud (Lindblad and Druben,
1980; Metzeger and Muir, 1983; Vincent, et. al., 2001; Betuco. 2012) allow re-
wetting of stored maize seeds. That and unreliable rainfalls (Hatibu, et al., 2003),
creates a need for reliable seed storage and preservation systems to accommodate
the once-a-year seed storage cycle of 8 to 9 months (De Bruin, 2005; Villers, et al.,
107
2008). This is important considering that at least 70 percent of maize seeds in
developing countries are sourced from prior year’s maize harvest (Gemeda, et al.,
2001; Dhliwayo and Pixley, 2003), 50 percent of caloric intake is maize-based
(Yakubu, et al., 2011), and environmental factors can easily destroy seeds (Fong
and Standifer, 1969; Copeland and Mcdonald, 1995; Desai, et al., 1997; De Bruin,
2005; Basra, 2006).
3.2.1 Maize storage
Following maize harvest, subsistence farmers usually clean, dry and store seeds in
woven jute or woven propylene bags in ordinary warehouses, since most of them
cannot afford cold storage (Burden, 2003; Villers, et al., 2008). This practice usually
causes rapid drop below the 85-90% “certified seed” germination rate within six
months (De Bruin, 2005; Villers, et al., 2008). The use of hermetic storage has been
proposed, in place of cold storage and other storage systems involving chemical
preservatives, considering the many advantages of hermetic storage (Villers, et al.,
2008).
3.2.2 Seeds and hermetic storage
Hermetic storage is a safe, cost-effective storage method that controls insect
infestations in addition to preserving the quality of grains (Calderon and Navarro,
1980; De Bruin, 2005; Lewis, et al., 2005; RSAS, 2000; Villers, 2004; De Bruin,
2005; Lewis, et al., 2005; Sabio, et al., 2006; Villers, et al., 2006; Navarro, et al.,
2007; Villers, et al., 2008; Weinberg et al., 2008), while allowing for pesticide-free,
short-term and long-term qualitative and quantitative seed preservation, without
108
refrigeration, maintaining seed vigor (De Bruin, 2005; Calderon and Navarro, 1980;
FAO/IPGRI, 1994; De Bruin, 2005; Sabio, et al., 2006; Pérez-García et al., 2006;
Villers, et al., 2006; Daniel, 2007; Yakubu, et al., 2011) and pest control.
Storage at low temperature (4°C (Pant and Susheela, 1977; Hernández-Muñoz, et
al., 2006)) ensures greater safety margins between insect development time and
break of dormancy, although hermetic storage, even at ambient temperatures,
naturally eliminates insect development altogether (Yakubu, et al., 2011), and
preserves germination rates (Daly, et al., 1998; Armitage and Woods, 1999; Moreno-
Martinez, et al., 2000; Demissie et al., 2008a Poethke and Liebig, 2008;Gregg and
Billups, 2009; Basra, 2006; SAFgerm, 2011). For seed germination and vigor to be
maintained at close to germination rates at the unset of storage , it is important that
seed moisture levels be maintained at 10-12%, regardless of storage temperature
(Calderon and Navarro, 1980; Tang and Sokhansanj, 1993; FAO, 1994; Copeland
and Mcdonald, 1995;;Spann, 1998; Armitage and Woods, 1999; Copeland and
Mcdonald, 1995; ASAE, 2001; CRC, 2001; Basra, 2006; Armitage and Woods,
1999; Bankole, et al., 2005; De Bruin, 2005; Sabio, et al., 2006). Hermetic storage is
capable of maintaining relative humidity that preserves seed moisture (ASTM, 1997;
Lindblad and Druben, 1980; Vertucci and Roos, 1993; Walters, 1998; Smith, 1992;
ASAE, 2001; Kung'u, et al., 2003; Adhikarinayake, 2005; Rickman and Aquino,
2003; De Bruin, 2005) and prevents mold growth (IBPGR, 1976; FAO, 1988;
FAO/IPGRI, 1994; IPGRI, 2004; Daniel, 2007; Harris and Miller, 2008; Weinberg, et
al., 2008).
109
3.2.3 Research need
This study was undertaken because of a need to know if hermetically stored maize
containing maize weevils can preserve maize seed viability.
3.3 OBJECTIVES
The objective of this study was to determine the effects of weevils (weevils vs. no
weevils), time, and storage type (hermetic vs. non-hermetic) on maize seed viability.
3.4 METHODS AND MATERIALS To determine the effect of hermetic storage and weevils on maize seeds, the seeds
were stored under hermetic and non-hermetic conditions for varying time periods,
with and without weevils. Following hermetic storage, the seeds were tested for
percent germination. A laboratory scale hermetic storage system employing glass-
canning jars was utilized, and treatment conditions of temperature (27°C) typical of
tropical maize storage temperature and safe seed storage moisture (10%), were
selected. A laboratory scale seed germination system employing trays (De Geus, et
al., 2008) covered with planting media (Versapak, crepe-paper), watering table, and
treatment conditions of water and temperature (25°C), favorable for optimal seed
germination were also selected. The randomization of treatment assignment to jars
and the hermetic storage chamber, as well as the warm germination chambers was
done using PROC PLAN, and PROC GLM (SAS Institute Inc., 100 SAS Campus
Drive, Cary, NC).
110
3.4.1 Experimental maize seed
Maize seed of the commercial hybrid 66H54 (Blue River, 27087 Timber Road,
Kelley, Iowa 50134) was utilized. Maize moisture (10%) was measured using the
103oC, 72-h oven method (ASABE, 2008).
3.4.2 Initial germination tests
The initial germination test for the experimental maize seed involved placing four 50
seed samples on Versapak paper laid on a tray, followed by wetting and incubation
at 25°C, at the Iowa State University Seed Science Center. The 6A planting board
(Hamilton, 2011), with holes matching the hybrid Blue River maize seeds, was
selected and utilized in planting multiple (50) seeds at once, with equal spacing on
the crepe paper. At the end of 7 days, germination rate was determined by counting
the number of normal seedlings (Desai, et al., 1997; AOSA, 2010) within each 50
seed sample planted, dividing by 50, multiplying by 100, and finding the average
percent germination for the four samples.
The initial germination rate for the seed (66H54, Blue river hybrids, 27087 Timber
Road, Kelley, Iowa 50134) utilized in this research was 99.5%. This is because 200
(4 samples of 50) seeds were evaluated, and 199 germinated. This is impressive,
considering that the seed had a grower listed germination rate of 95%, overall, and
99.5% germination rate, for pure seed (uncontaminated with other seeds).
111
3.4.3 Treatment design
The completely randomized block hermetic storage experimental treatment design
consisted of four factors (time, maize moisture, storage temperature, and weevils).
Time had four levels (0, 4, 8, and 12 months), maize moisture had one level (10%),
temperature had one level (27oC), and 6 replications were used. Twenty-four (4
treatments*6 replications) jars were placed in the 27oC chamber during each of
months 0, 4, 8, and 12 (Figure 3.1).
These conditions approximate normal seed storage moisture and East African
average ambient temperature. Overall, each replication had 16 (four (hermetic, non-
hermetic, weevils, no weevils) by four (0, 4, 8, 12 months)) treatment combinations,
where the jars were randomly assigned to positions within a 27oC chamber. It
involved placing jars in the chamber at the respective months with their assigned
treatments, and maintaining the chamber relative humidity at 45±2%. All jars had
about 170 g of maize seeds, and jars with weevils also had 100 weevils, stored with
the maize.
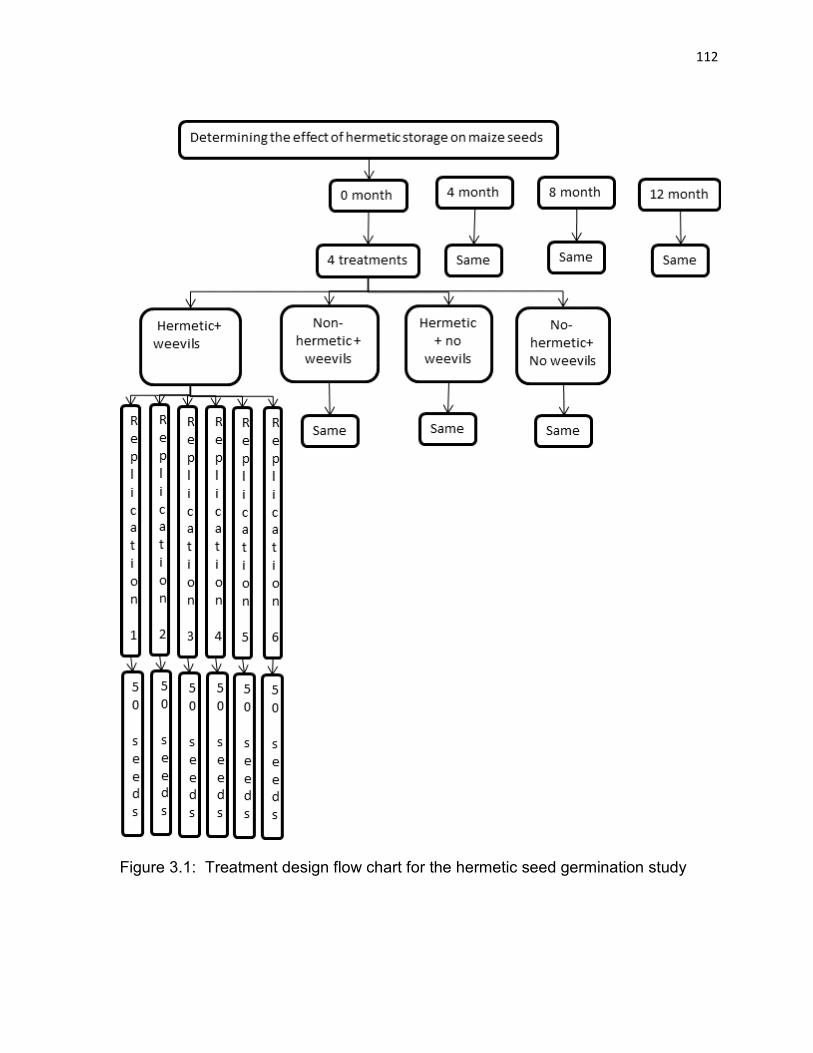
112
Figure 3.1: Treatment design flow chart for the hermetic seed germination study
113
3.4.4 Experimental weevils
A stock culture of 100 adult maize weevils (S. zeamais Motschulsky, unsexed),
obtained from the Iowa State University Entomology Departmental laboratory were
placed in five unsterilized 3.74-L glass jars, with screen lids, half full of 16.5%
moisture Fontanelle 6T672 maize. Weevils were allowed to oviposit on the maize to
develop a colony. This was achieved by placing jars in a rearing chamber at about
27°C and at interstitial relative humidity determined by maize moisture, for two
months (Arannilewa, et al., 2006). Weevils from this colony were utilized in this
storage study.
3.4.5 Experimental chamber
A chamber maintained at 27oC was utilized in this storage experiment. A fan created
air circulation within the chamber that prevents the buildup of humidity (ASAE, 1998;
ASHRAE 1999; Prenger and Ling, 2010).
A humidifier controller (Dayton 1UHG3, Dayton Electric Mfg Co, 14441 W Il Route
60, Lake Forest, Ill), set at 45±2% relative humidity controlled a humidifier (RCM-
832N, Kaz, Inc., 250 Turnpike Road, Southborough, MA) utilized in maintaining the
seed moisture content at 10%.
3.4.6 Experimental containers
One-pint (473-mL) Kerr canning jars (Mason Jar 61000, Jarden Home Brands,
14611 W. Commerce Road, Daleville, IN) were utilized as experimental units. Jars
with weevils contained 100 weevils each, so that in hermetic jars all weevils were
114
dead within about two days, while jars without weevils mostly retain their O2 level.
Hermetic tests utilized canning jars, as is using the hermetic canning jar lids, while
non-hermetic tests utilized jars fitted with aluminum screen lids only, which allowed
air passage but not weevil escape.
3.4.7 Seed priming
Following hermetic storage, seeds were preserved in cold storage (4°C), until the
beginning of the germination study. This also helps to overcome dormancy, common
in hermetic storage, which may prevent otherwise viable seeds from germinating.
This is because pre-chilling seeds as a priming method is inferior to hydration
(Cromarty, et.al., 1982; Hussain, et al., 2006), utilized in the germination tests.
3.4.8 Germination seed preparation All germination tests were done at the end of the 12 months’ storage period. For this
reason the 24 treatment jars assigned to each of the four months (12, 8, 4, and 0)
were randomly assigned to positions within the hermetic chamber at the specified
months (Figure 3.1). Jars to be stored for twelve months were placed in the chamber
at the onset followed by those for 8 months, four months, and 0 months, at month
12, 8, 4, and 0 respectively. At the termination of the 12-month hermetic storage
period, each of the 96 storage jars was emptied onto a 4.8-mm (12/64-in) round hole
sieve, one at a time. This was done to remove debris and insects before the
germination tests. Following this, each jar was emptied into a pre-numbered gallon
(Hefty® bag, OneZip freezer bags, 1900 West Field CT., Lake Forest, IL), and four
115
50-seed, samples were then counted into sterile, pre-punctured and pre-numbered
bags (Whirl-Pak®, B01009WA, Nasco, 901 Janesville Avenue, Fort Atkinson, WI)
sample collection bags, from each of the gallon bags. The four samples from each
jar were placed in a pre-numbered Hefty bag (OneZip Freezer Bags, quart, 1900
West Field CT., Lake Forest, IL) bearing the number of the jar from which seeds
were emptied. Pre-labeling 384 (96*4) sample collection bags, with their treatments
and replication designations, and assigning four to each numbered quart freezer bag
allowed for transfer of the hermetic storage structure to germination trays. This is
because exactly 96 trays were utilized in the germination experiment, and each was
labeled with the hermetic storage jar from which its samples were derived. The
samples were stored in a cold-room (~4oC), under airtight conditions (to prevent
moisture loss), for about two weeks before planting (on crepe paper) to allow
germination test logistics to be worked out.
3.4.9 Germination medium Two, 12-ply and edge-embossed high absorbency crepe (Versa-pak, k-24, Kimberly-
Clark Corporation, Neenah, WI 54957-2020; NPS Corporation Green Bay, WI
54304) germination paper was utilized as the sterile (CRC, 2007) planting media
placed on the germination tray, and upon which the seeds germination tests were
conducted. This is a 0.24-in-thick, crepe cellulose paper with a 5 to 7 ph range
specification (ISU, 2011).
The germination study, aimed at studying seed viability, following hermetic storage
involved a standard germination test.
116
3.4.10 Standard germination test Germination tests were conducted at the Iowa State University Seed Science
Center.The seeds were germinated on fiberglass trays (De Geus, et al., 2008), with
two sheets of crepe celullose paper (k-24, Kimberly-Clark Corporation, Neenah,
WI 54957-2020; NPS Corporation Green Bay, WI) moistened with about 800 mL of
water (FAO, 1991; Campos, et al., 2004; Lobell, et al., 2011) on top of them. The
crepe papers were moistened using a watering table (De Geus, et al., 2008) and
four samples of 50 seeds, from each treatment jar (Tang and Sokhansanj, 1993;
CFS, 2011), were planted on each tray. Samples were assigned to trays at random,
and trays were placed inside germination carts (De Geus, et al., 2008) separated by
approximately 10 cm. Carts with the trays were placed inside a growth chamber at
constant 25°C, for the warm germination test (AOSA, 2010). A total of 384 (96
canning jars*4 samples of 50 seeds each) samples involving 19200 (16 treatments*4
samples*50 seeds*6 replications) seeds were evaluated using a randomized
complete block design.
3.4.11 Statistics
The allocation of treatments to experimental units, in the hermetic storage setup and
of sampling units to planting media in the germination test was done using a
completely randomized block design. Randomization and results analysis was
performed using PROC GLM (SAS version 9.0, SAS Institute Inc., 100 SAS Campus
Drive, Cary, NC 27513).
117
3.5 RESULTS AND DISCUSSION Germination studies were conducted at the termination of hermetic storage. The
research tested the hypothesis that a hermetic storage system is effective for viable
maize seed storage, while providing weevil control on farm, for subsistence farmers.
3.5.1 Germination study results
Hermetically stored maize seeds, with and without weevils, as well as non-
hermetically stored maize without weevils have germination rates comparable to the
initial maize germination rate (Table 3.1). These are also comparable to those of, or
better than, maize seeds stored in cold rooms, but superior to open-air storage (De
Bruin, 2005; Villers, et al., 2008; Sabio, et al., 2009).
The analysis of variance from the germination study (complete data are shown in
Appendix B) shows that the six treatment replications, utilized in the research are not
significantly different (Dallal, 2003) from each other (p=0.1467), and that the 16
treatments, within each replication, are significantly different from one another
(p<0.0001). Significant (p<0.0001) main effects (hermetic, weevil, month), as well as
interaction effects (hermetic by weevil, hermetic by month, weevil by month, and
hermetic by weevil by month) were also recorded. Similarly, the 384 samples
showed significant differences (p<0.0001).
This research confirmed the safety and superiority of hermetic storage (with weevils)
over non-hermetic storage (with weevils) for maize seeds preservation. This is
because hermetically stored maize seeds, with weevils, had 98.7 to 99.5%
germination rates versus 35.0 to 72.9 for non-hermetic (open-air) storage, over the
118
12-months seed storage period. Treatments of particular interest are hermetic
treatments with weevils (month 0), hermetic treatment with weevils (month 4),
hermetic treatment with weevils (month 8), and hermetic treatment with weevils
(month 12), which had mean germination rates of 99.1%, 98.7%, 99.6%, and 99.3%,
respectively. These confirmed that hermetic storage preserves seed viability, even
when seeds are stored under ambient (atmospheric) conditions.
Non-hermetic treatments with weevils at months 0, 4, 8, and 12 (Table 3.1) are
open-air storage treatments, with conditions that are most conducive to weevil
damage. Their percent germination means, along with standard errors are
99.2±0.25, 72.3±1.29, 72.9±1.28, and 35.0±1.38, respectively. At month zero (the
experimental control, for “month”), no significant weevil damage occurred, due to
lack of time, while weevil damage for months 4 and 8 are significant but not
significantly different from each other. Non-hermetic treatment at month 12 produced
the most significant weevil damage, as reflected in the low percent seed germination
for that treatment. Means with the same letter (Table 3.1) are not significantly
different.
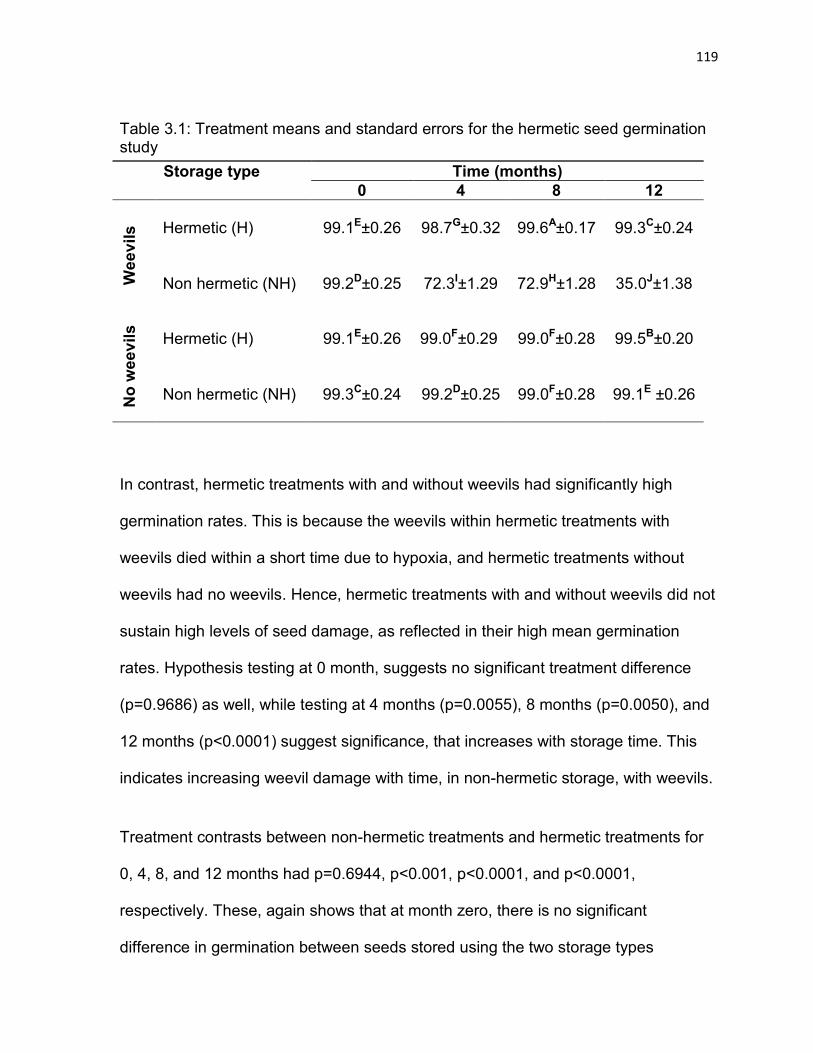
119
Table 3.1: Treatment means and standard errors for the hermetic seed germination study
Storage type Time (months) 0 4 8 12
Wee
vils
Hermetic (H)
99.1E±0.26
98.7G±0.32
99.6A±0.17
99.3C±0.24
Non hermetic (NH)
99.2D±0.25
72.3I±1.29
72.9H±1.28
35.0J±1.38
No
wee
vils
Hermetic (H)
99.1E±0.26
99.0F±0.29
99.0F±0.28
99.5B±0.20
Non hermetic (NH)
99.3C±0.24
99.2D±0.25
99.0F±0.28
99.1E ±0.26
In contrast, hermetic treatments with and without weevils had significantly high
germination rates. This is because the weevils within hermetic treatments with
weevils died within a short time due to hypoxia, and hermetic treatments without
weevils had no weevils. Hence, hermetic treatments with and without weevils did not
sustain high levels of seed damage, as reflected in their high mean germination
rates. Hypothesis testing at 0 month, suggests no significant treatment difference
(p=0.9686) as well, while testing at 4 months (p=0.0055), 8 months (p=0.0050), and
12 months (p<0.0001) suggest significance, that increases with storage time. This
indicates increasing weevil damage with time, in non-hermetic storage, with weevils.
Treatment contrasts between non-hermetic treatments and hermetic treatments for
0, 4, 8, and 12 months had p=0.6944, p<0.001, p<0.0001, and p<0.0001,
respectively. These, again shows that at month zero, there is no significant
difference in germination between seeds stored using the two storage types
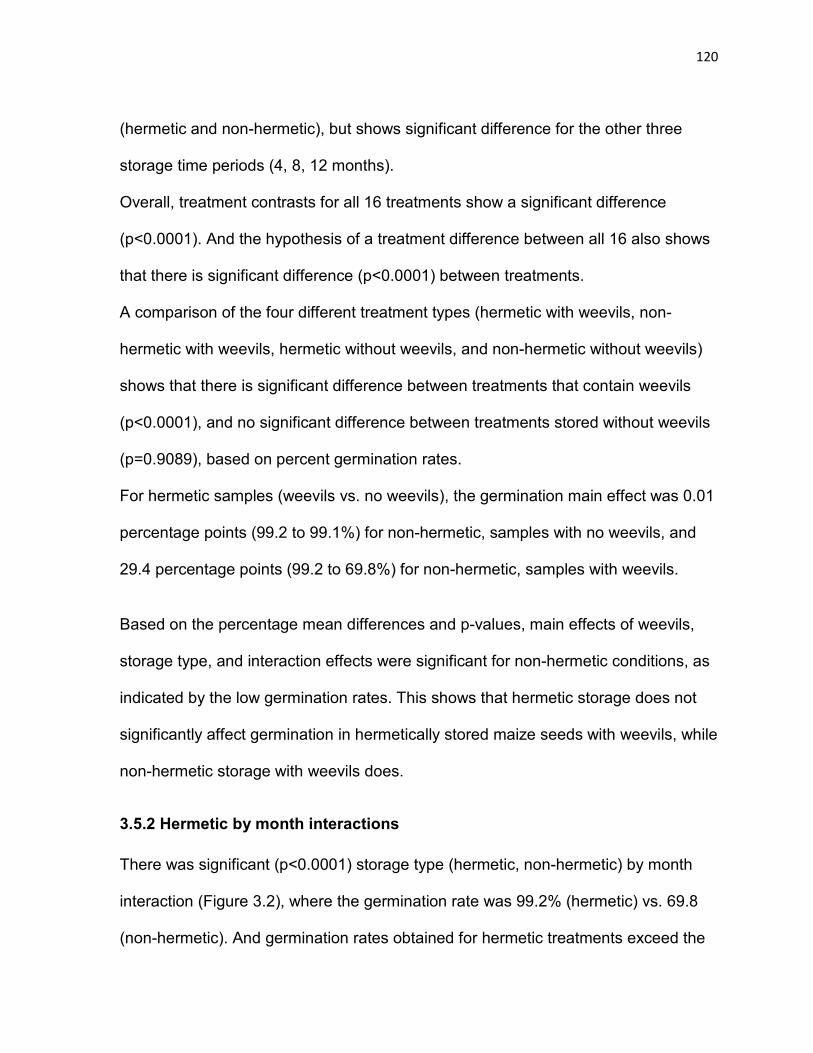
120
(hermetic and non-hermetic), but shows significant difference for the other three
storage time periods (4, 8, 12 months).
Overall, treatment contrasts for all 16 treatments show a significant difference
(p<0.0001). And the hypothesis of a treatment difference between all 16 also shows
that there is significant difference (p<0.0001) between treatments.
A comparison of the four different treatment types (hermetic with weevils, non-
hermetic with weevils, hermetic without weevils, and non-hermetic without weevils)
shows that there is significant difference between treatments that contain weevils
(p<0.0001), and no significant difference between treatments stored without weevils
(p=0.9089), based on percent germination rates.
For hermetic samples (weevils vs. no weevils), the germination main effect was 0.01
percentage points (99.2 to 99.1%) for non-hermetic, samples with no weevils, and
29.4 percentage points (99.2 to 69.8%) for non-hermetic, samples with weevils.
Based on the percentage mean differences and p-values, main effects of weevils,
storage type, and interaction effects were significant for non-hermetic conditions, as
indicated by the low germination rates. This shows that hermetic storage does not
significantly affect germination in hermetically stored maize seeds with weevils, while
non-hermetic storage with weevils does.
3.5.2 Hermetic by month interactions There was significant (p<0.0001) storage type (hermetic, non-hermetic) by month
interaction (Figure 3.2), where the germination rate was 99.2% (hermetic) vs. 69.8
(non-hermetic). And germination rates obtained for hermetic treatments exceed the
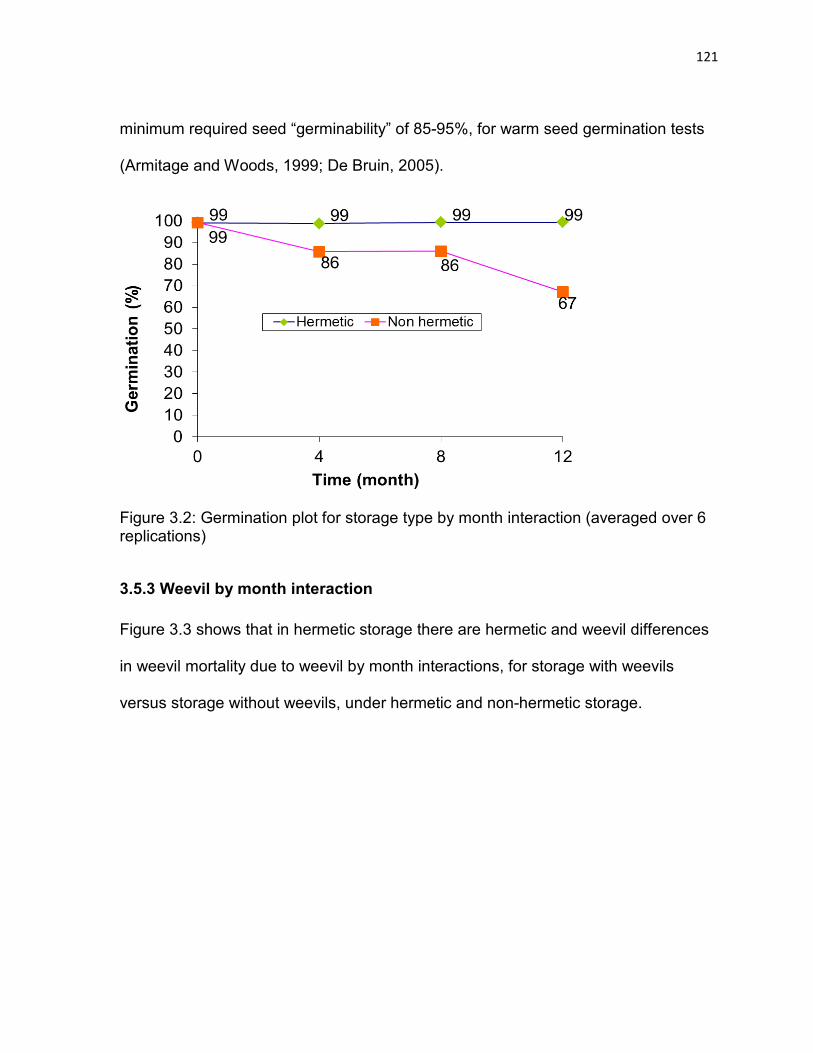
121
minimum required seed “germinability” of 85-95%, for warm seed germination tests
(Armitage and Woods, 1999; De Bruin, 2005).
Figure 3.2: Germination plot for storage type by month interaction (averaged over 6 replications)
3.5.3 Weevil by month interaction
Figure 3.3 shows that in hermetic storage there are hermetic and weevil differences
in weevil mortality due to weevil by month interactions, for storage with weevils
versus storage without weevils, under hermetic and non-hermetic storage.
122
Figure 3.3: Germination plot for weevils by month interaction (averaged over 6 replications). Figure 3.4 shows insignificant hermetic by weevil by month interaction, for hermetic
treatments, while Figure 3.5 shows significant hermetic by weevil by month
interaction, for non-hermetic treatments. The difference in significance, between the
two, is reflected in the prediction equations (Table 3.4).
3.5.4 Hermetic by weevil by month interaction In hermetic storage, there are hermetic, moisture and temperature differences in
weevil mortality, and hence difference in maize germination rate for maize stored at
27°C, for different lengths of time (months) (Figures 3.4 and 3.5). This is due to
temperature, moisture, and weevil interactions under hermetic versus non-hermetic
storage. Therefore, mean percent mortality and germination rates were not the same
for the different treatment combinations.
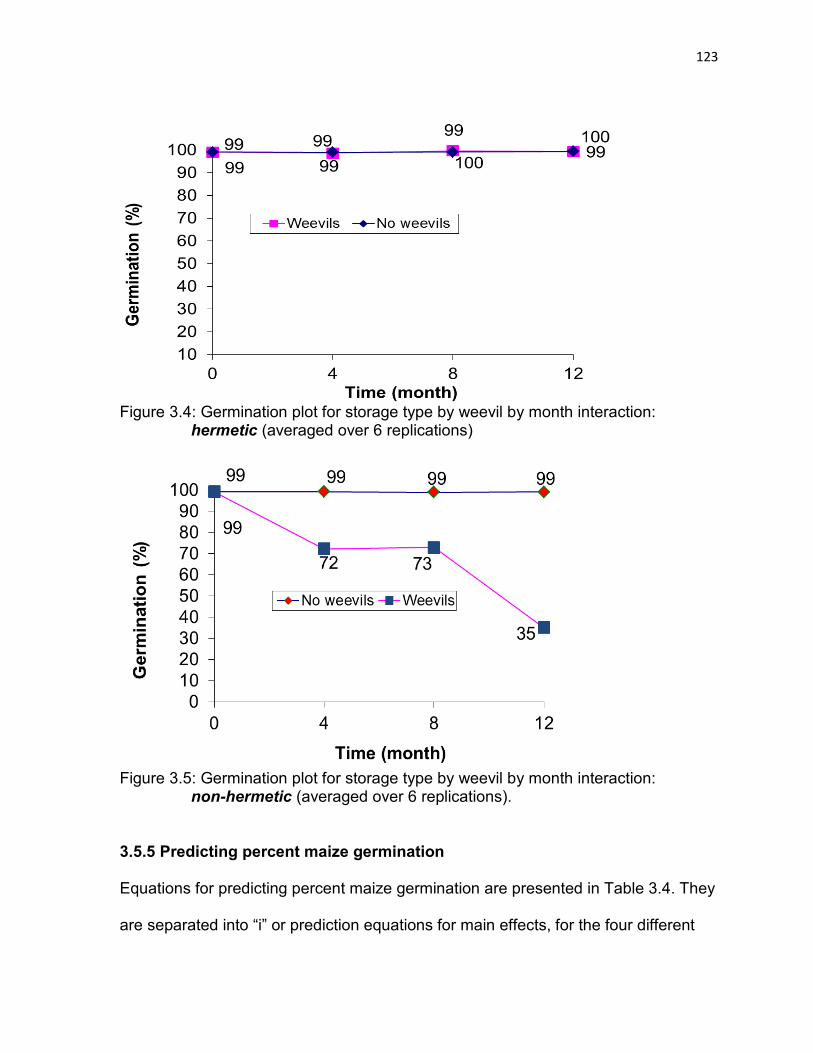
123
Figure 3.4: Germination plot for storage type by weevil by month interaction: hermetic (averaged over 6 replications)
Figure 3.5: Germination plot for storage type by weevil by month interaction: non-hermetic (averaged over 6 replications). 3.5.5 Predicting percent maize germination Equations for predicting percent maize germination are presented in Table 3.4. They
are separated into “i” or prediction equations for main effects, for the four different
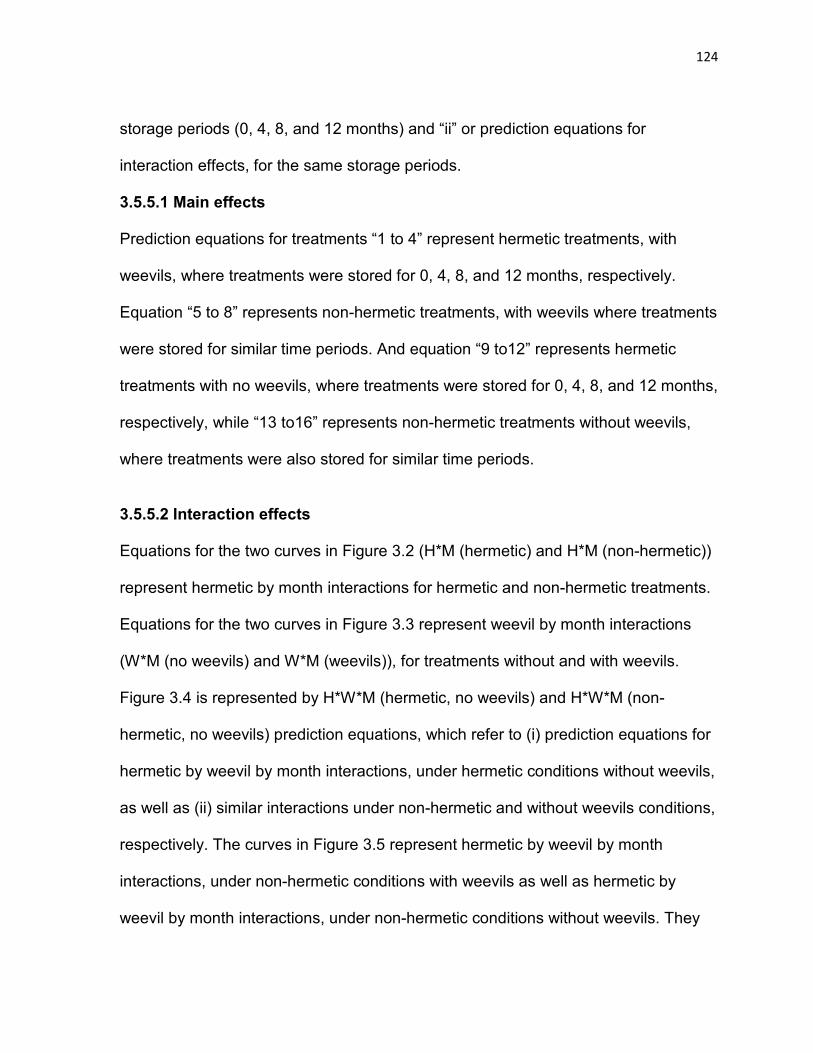
124
storage periods (0, 4, 8, and 12 months) and “ii” or prediction equations for
interaction effects, for the same storage periods.
3.5.5.1 Main effects Prediction equations for treatments “1 to 4” represent hermetic treatments, with
weevils, where treatments were stored for 0, 4, 8, and 12 months, respectively.
Equation “5 to 8” represents non-hermetic treatments, with weevils where treatments
were stored for similar time periods. And equation “9 to12” represents hermetic
treatments with no weevils, where treatments were stored for 0, 4, 8, and 12 months,
respectively, while “13 to16” represents non-hermetic treatments without weevils,
where treatments were also stored for similar time periods.
3.5.5.2 Interaction effects
Equations for the two curves in Figure 3.2 (H*M (hermetic) and H*M (non-hermetic))
represent hermetic by month interactions for hermetic and non-hermetic treatments.
Equations for the two curves in Figure 3.3 represent weevil by month interactions
(W*M (no weevils) and W*M (weevils)), for treatments without and with weevils.
Figure 3.4 is represented by H*W*M (hermetic, no weevils) and H*W*M (non-
hermetic, no weevils) prediction equations, which refer to (i) prediction equations for
hermetic by weevil by month interactions, under hermetic conditions without weevils,
as well as (ii) similar interactions under non-hermetic and without weevils conditions,
respectively. The curves in Figure 3.5 represent hermetic by weevil by month
interactions, under non-hermetic conditions with weevils as well as hermetic by
weevil by month interactions, under non-hermetic conditions without weevils. They
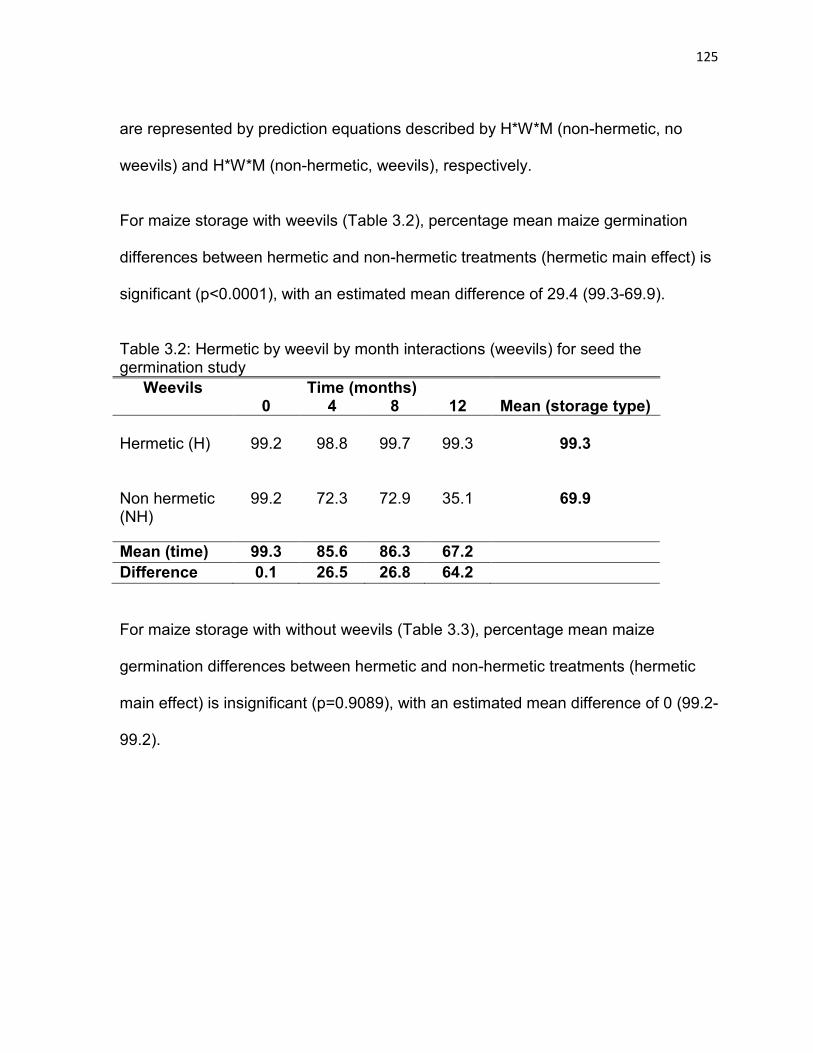
125
are represented by prediction equations described by H*W*M (non-hermetic, no
weevils) and H*W*M (non-hermetic, weevils), respectively.
For maize storage with weevils (Table 3.2), percentage mean maize germination
differences between hermetic and non-hermetic treatments (hermetic main effect) is
significant (p<0.0001), with an estimated mean difference of 29.4 (99.3-69.9).
Table 3.2: Hermetic by weevil by month interactions (weevils) for seed the germination study
Weevils Time (months) 0 4 8 12 Mean (storage type)
Hermetic (H)
99.2
98.8
99.7
99.3
99.3
Non hermetic (NH)
99.2
72.3
72.9
35.1
69.9
Mean (time) 99.3 85.6 86.3 67.2 Difference 0.1 26.5 26.8 64.2
For maize storage with without weevils (Table 3.3), percentage mean maize
germination differences between hermetic and non-hermetic treatments (hermetic
main effect) is insignificant (p=0.9089), with an estimated mean difference of 0 (99.2-
99.2).

126
Table 3.3: Hermetic by weevil by month interactions (without weevils) for seed the germination study
No weevils Time (months) 0 4 8 12 Mean (storage type)
Hermetic (H)
99.2
99.0
99.1
99.5
99.2
Non hermetic (NH)
99.3
99.3
99.1
99.2
99.2
Mean (time) 99.3 99.2 99.1 99.4 Difference 0.1 0.3 0 0.3
3.5.6 Sample size determination Germination tests involving four replications of 100 seeds per treatment, where
treatment refers to each experimental unit or storage container, and four replications
of 50 seeds per treatment is standard practice in the determination of seed viability
(Tang, and Sokhansanj, 1993; CFS, 2011). However, using 4 replications of 100
seeds per container in large seed samples as is the case for this study (with 19200
seeds) produces lower experimental error, and reduces the accuracy of the test for
treatment differences. It also produces huge sampling error, which does not go into
testing for treatment differences. We, therefore, utilized four samples of 50 seeds for
each of the 16 treatments, which produced smaller sampling error and higher
experimental error, increasing testing accuracy for establishing treatment
differences.
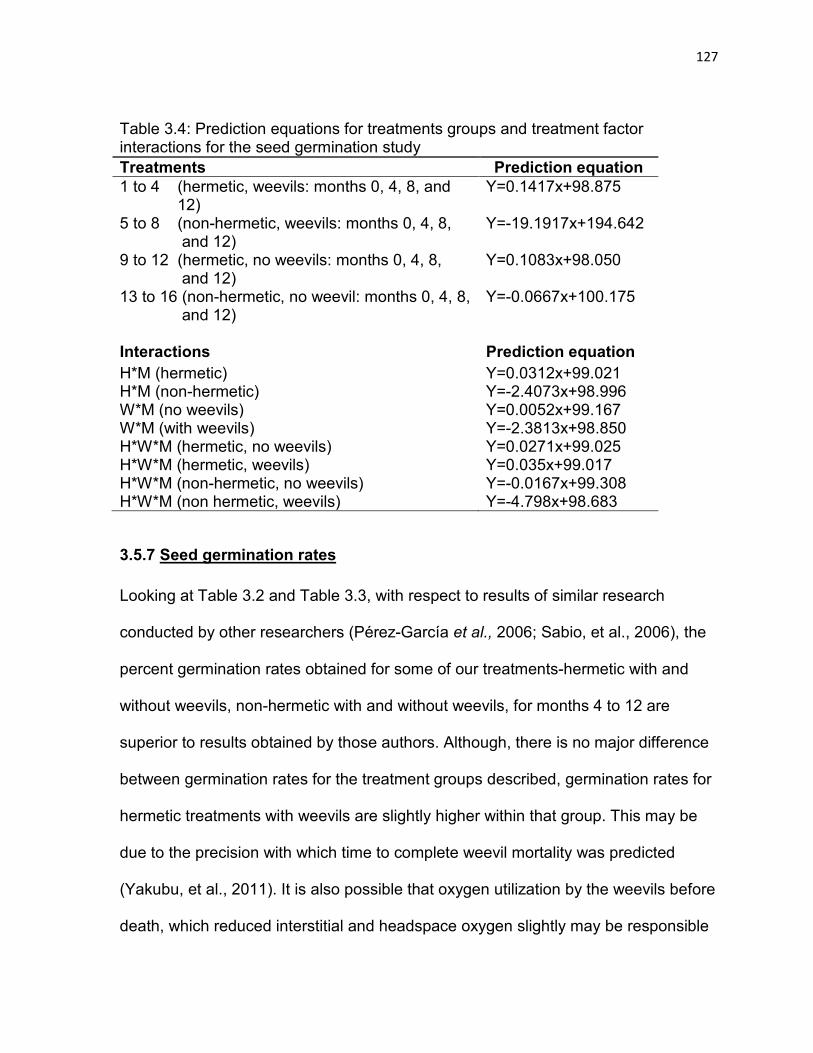
127
Table 3.4: Prediction equations for treatments groups and treatment factor interactions for the seed germination study Treatments Prediction equation 1 to 4 (hermetic, weevils: months 0, 4, 8, and 12)
Y=0.1417x+98.875
5 to 8 (non-hermetic, weevils: months 0, 4, 8, and 12)
Y=-19.1917x+194.642
9 to 12 (hermetic, no weevils: months 0, 4, 8, and 12)
Y=0.1083x+98.050
13 to 16 (non-hermetic, no weevil: months 0, 4, 8, and 12)
Y=-0.0667x+100.175
Interactions Prediction equation H*M (hermetic) Y=0.0312x+99.021 H*M (non-hermetic) Y=-2.4073x+98.996 W*M (no weevils) Y=0.0052x+99.167 W*M (with weevils) Y=-2.3813x+98.850 H*W*M (hermetic, no weevils) Y=0.0271x+99.025 H*W*M (hermetic, weevils) Y=0.035x+99.017 H*W*M (non-hermetic, no weevils) Y=-0.0167x+99.308 H*W*M (non hermetic, weevils) Y=-4.798x+98.683
3.5.7 Seed germination rates
Looking at Table 3.2 and Table 3.3, with respect to results of similar research
conducted by other researchers (Pérez-García et al., 2006; Sabio, et al., 2006), the
percent germination rates obtained for some of our treatments-hermetic with and
without weevils, non-hermetic with and without weevils, for months 4 to 12 are
superior to results obtained by those authors. Although, there is no major difference
between germination rates for the treatment groups described, germination rates for
hermetic treatments with weevils are slightly higher within that group. This may be
due to the precision with which time to complete weevil mortality was predicted
(Yakubu, et al., 2011). It is also possible that oxygen utilization by the weevils before
death, which reduced interstitial and headspace oxygen slightly may be responsible
128
for better seed preservation and slightly, higher germination rates in the hermetic
treatment group, with weevils.
3.6 CONCLUSIONS
Based on results from this research:
• Hermetic storage can safely preserve maize seed quality
• Hermetic storage produced seed germination rates above that recommended
by the “seed industry”
• Hermetically stored maize seeds, with weevils, had about 99.3% average
germination rates compared to 69.9%, for open air storage. While
hermetically stored maize, without weevils, had an average germination rate
of about 99.2% for both hermetic and non-hermetic systems.
• Compared to non-hermetic (open air) storage, hermetic storage preserved
quality for both seeds stored with and without weevils. Whereas, open-air
storage only maintained seed quality for seeds stored without weevils.
129
3.7 REFERENCES Adhikarinayake, T. B. 2005. Thesis. Wageningen University. Chapter 7.Technical and economic feasibility of airtight ferrocement bin for on-farm storage of paddy in Sri Lanka. The Netherlands, UK. Armitage, D.M., and J.L. Woods. 1999. The development of a storage strategy for malting barley. In: Zuxun, J., Quan, L., Yongsheng, L., Xianchang, T., and G. Lianghua (eds) Proceedings of the 7th International working conference on stored product protection. Beijing (China): Sichuan publishing house of science and technology. 2: 1358-1359. ASAE. 1998. ASAE Standards. EP406.2: Heating, Ventilating, and Cooling Greenhouses. American Society of Agricultural Engineering, St. Joseph, MI, USA. ASHRAE. ASHRAE Standard. 62.2P-1898. 1999: Ventilation and acceptable Indoor air quality in low-rise residential buildings, American Society of Heating, Refrigerating and Air-conditioning Engineers, Atlanta, GA, USA. ASABE. 2008. ASABE standards, 43rd Ed. S352.1: Moisture measurement. Unground grain and seeds. St. Joseph, Mich.: ASABE. ASTM (American Society for Testing and Materials). 1997. Standard Test Methods for Tension Testing of Metallic Materials [Metric] Standard Test Methods for Tension Testing of Metallic Materials [Metric]: 22. ASTM International, 100 Barr Harbor Drive, West Conshohocken, Pennsylvania, 19428-2959 USA. AOSA. (Association of Official Seed Analysts). 2010. AOSA rules for testing seeds. Volume 1. Principles and procedures. AOSA Inc., Ithaca, USA. p 6-59. Arannilewa, S.T, Ekrakene, T., and Akinneye, J.O. 2006. Laboratory evaluation of four medicinal plants as protectants against the maize weevil, sitophilus zeamais (Mots). African Journal of Biotechnology. 5 (21): 2032-2036. ASAE. 2001. Shelled corn equilibrium moisture curves modified Chung-Pfost isotherm equation. ASAE standards. D245.5. Bankole, S.A., Osho, A., Joda, A.O., and O.A. Enikuomehin. 2005. Effect of drying method on the quality and storability of ‘egusi’ melon seeds (Colocynthis citrullus L.). African Journal of Biotechnology, 4 (8), pp. 799-803. Basra, A. 2006. Handbook of seed science and technology. Binghamton: Haworth press.:200, 271-280, 526, 696.
130
Betuco. 2012. Post production economics. Retrieved on January 25, 2012 from http://www.betuco.be/rijst/Rice%20Post_Production.pdf
Burden, P. 2003. Cold storage feasibility analysis. Prepared for the conference on Building a public seafood processing and cold storage facility—is it right for your community?. Retrieved on August 29, 2011 from http://seagrant.uaf.edu/map/workshops/cold-storage/Burden.pdf. p. 2-3. Calderon, M., Navarro, S., 1980. Synergistic effect of CO2 and O2 mixtures on two stored grain insect pests. In: Shejbal (ed.) Proceedings of an international conference on controlled atmosphere storage of grains. Holland: Elsevier. p 79-84. Campos, H., Cooper,M., Habben,J.E., Edmeades,G.O., and J.R. Schussler. 2004. Improving drought tolerance in maize: a view from industry. Field Crops Research, 90:19–34. CFS (Canadian Forest Service). 2011. National tree seed centre. Retrieved August 18, 2011. from http://cfs.nrcan.gc.ca/subsite/seedcentre/seedtesting/3. Copeland, L.O and Mcdonald, M.B .1995.Principles of seed science and technology. 3rd edition. New York: Chapman & Hill: 127-146, 187, 188, 194-5, 198, 200-201. CRC (CRC Press). 2001. Handbook of plant and crop physiology, 2nd edition. Pessarakli, M (Ed). New York: Marcel Dekker, inc., p.111-2. CRC (CRC Press). 2007. Soil sampling and methods of analysis. 2nd edition. Carter, M. R., and E. G. Gregorich (eds). Boca Raton, FL: CRC Press, p. 385. Cromarty, A.S., Ellis, R.H., and Roberts, E.H. The design of seed storage facilities for genetic conservation. International board for plant genetic resources. Rome: IBPGR secretariat. p. 6-1, 6-2, 6-9, 6-9, 6-10, 6-57. Dallal, G.E. 2003. Why P=0.05? Retrieved on December 9, 2011 from http://www.webpages.uidaho.edu/~brian/why_significance_is_five_percent.pdf. Daly, H.V., Doven, J.T., and A.H. Purcell III. 1998. Introduction to insect biology and diversity. New York: Oxford University Press. Daniel, I.O. 2007. Longevity of maize (Zea mays L.) seeds during low input storage under ambient conditions of southwestern Nigeria. Journal of Tropical Agriculture, 45 (1-2): 42–48, 2007. De Bruin, T. 2005. Innovations in seed storage methods. Published in Asian seed and planting material. Philippines, Jan-Feb. Cited by Villers, et al., Development and applications of the hermetic storage technology. Alternative methods to chemical
131
control. Proceedings of the 9th International Working Conference on Stored Product Protection. Campinas, São Paulo, Brazil. PS7-8 – 611:719. http://www.grainpro.com/pdf/apsa.pdf, http://www.grainpro.com/speccommodityinfo.php, http://bru.gmprc.ksu.edu/proj/iwcspp/pdf2/9/6119.pdf, and http://bru.gmprc.ksu.edu/proj/iwcspp/iwcspp9.html. De Geus, Y.N., Goggi, A.S., Pollak, L.M. 2008. Seed quality of high protein corn lines in low input and conventionalfarming systems. Agron. Sustain. Dev., 28: 541-550. Demissie, G., Teshome. A., Abakemal, D., and A. Tadesse. 2008a. Cooking oils and ‘‘Triplex’’ in the control of sitophilus zeamais motschulsky (coleoptera: curculionidae) in farm-stored maize. Journal of Stored Products Research., 44: 173–178. Demissie, G., Tefera, T., and A., Tadesse. 2008b. Importance of husk covering on field infestation of maize by sitophilus zeamais motsch (coleoptera:curculionidea) at Bako, Western Ethiopia. African Journal of Biotechnology. 7 (20): 3777-3782. Desai. B.B, Kotecha, P.M, and Salunkhe, D.K. 1997. Seeds handbook. Biology, production Processing and storage. New York: Marcel dekker, inc..: 33, 66 Dhliwayo, T and K. V. Pixley. 2003. Divergent selection for resistance to maize weevil in six maize populations. Crop Sci. 43:2043-2049. FAO.1988.The nutrition and feeding of farmed fish and shrimp. A training manual 3. Feeding methods. Feeding methods-complete diet feeding. Manufacture and storage of complete pelleted diets. Rome (Italy): Rome (Italy), Food and Agricultural Organization: 216. FAO. 1991. AGST. CHAPTER XXIII MAIZE: Post-harvest operation. In: Danilo Mejía (ed). Retrieved on May 21, 2011 from http://www.fao.org/inpho/content/compend/text/ch23_03.htm. FAO. 1994. Grain storage techniques. Evolution and trends in developing countries. In: Proctor DL (ed). FAO agricultural services bulletin 109. Rome (Italy): Food and Agricultural Organization: 197-200, 211. FAO/IPGRI. 1994. Genebank Standards. Food and Agricultural Organization of the United Nations/International Plant Genetic Resources Institute, Rome. Fong, C.H and Standifer, L.C. 1969. Practical methods of maize storage on Farms. Proceedings of the conference on crop diversification in Malaysia.
132
Gemeda, A., Aboma, G., Verkuijl, H., and W. Mwangi. 2001. Farmers’ maize seed systems in western Oromia, Ethiopia. Mexico, D.F.: International Maize and Wheat Improvement Center (CIMMYT) and Ethiopian Agricultural Research Organization (EARO). p. 27-28. Gregg, B.R., and G.L. Billups. 2009. Seed conditioning. management. Enfield, NH: Science publishers. Volume 1. p. 184. Hamilton, G. 2011. Organic gardening. New York: DK Publishing. p. 260 Harris, R. L. and A. Miller. 2008. Keeping it real: storing & preserving green coffee, part 2 of 2. Roast magazine. July/August: 31-38. Document #: SL2350LH0608-2. Hatibu, N., Young, M.D.B., Gowing, J.W., Mahoo, H. F., and O. B. Mzirai. 2003. Developing improved dryland cropping systems for maize in semi-arid Tanzania. Part 1: experimental evidence for the benefits of rainwater harvesting. Expl Agric., 39, p. 279–292. Hernández-Muñoz, P., Almenar, E., Ocio, M.J., and R. Gavara. 2006.Effect of calcium dips and chitosan coatings on postharvest life of strawberries (Fragaria x ananassa). Postharvest Biology and Technology, 39(3): 247-253. Hussain, M., Farooq, M., Basra, S.M.A., and N. Ahmad. 2006. Influence of seed priming techniques on the Seedling establishment, yield and quality of hybrid sunflower. Int. J. Agri. Biol., 8(1), 2006. IBPGR .1976. Report of IBPGR Working Group on Engineering, Design and Cost Aspects of Long-term Seed Storage facilities. Rome, International Board for Plant Genetic Resources. IPGRI, 2004. Low-cost technologies for seed conservation. Annual Report. International Plant Genetic Resources Institute, Rome, p. 19–21. ISU (Iowa State University seed testing laboratory). 2011. Accurate testing. Exceptional service. Retrieved on August 29, 2011 from http://www.seeds.iastate.edu/seedtest/testing.html Kung'u, J.K., Muroki, N., and A. Omwega. 2003. Effects of storage on the quality and safety of grains in Tharaka district, Kenya. African Journal of Food, Agriculture, Nutrition and Development. Rural Outreach Program, 3 (2). Lewis, L., Onsongo, M., Njapau, H., Schurz-Rogers, H., Luber, G., Kieszak, S., Nyamongo, J., Backer, L., Dahiye, A.M., Misore,A., DeCock, K., Rubin, C., and Kenya Aflatoxicosis Investigation Group. 2005. Aflatoxin contamination of commercial maize products during an outbreak of acute aflatoxicosis in Eastern and
133
Central Kenya. Environmental Health Perspectives 113. Retrieved February 20, 2007 from http://www.ehponline.org/docs/2005/7998/abstract.html Lindblad, C. and L. Druben. 1980. Storage methods. Small farm grain storage. Volume III. Appropriate technologies for development. Manual M-2/ VITA publications manual series no. 35E. Arlington: VITA. Lobell, D.B., Bänziger, M., Magorokosho, C. and B. Vivek. 2011. Nonlinear heat effects on African maize asevidenced by historical yield trials. Nature climate change, 1:42-45. doi:10.1038/nclimate 1043. Retrieved on August 29, 2011 from http://iis-db.stanford.edu/pubs/23138/Lobell_2_11_NatureClimateChange.pdf.
Metzeger, J.F and W.E. Muir. 1983. Aeration of stored wheat in the Canadian Prairies. Can. Agric. Eng. 25: 127-137.
Moreno-Martinez, E., Jiménez, S., and M. E. Vázquez. 2000. Effect of Sitophilus zeamais and Aspergillus chevalieri on the oxygen level in maize stored hermetically. Journal of Stored Products Research. 36 (1): 25-36. Navarro, S., DeBruin, T., Montemayor, A.R., Finkelman,S., Rindner, M., and R. Dias. 2007. Use of biogenerated atmospheres of stored commodities for quality preservation and insect control, with particular reference to cocoa beans. Integrated Protection of Stored Products IOBC/wprs Bulletin, 30 (2): 197-204. Pant, K.C., and T. P. Susheela. 1977. Effect of storage and insect infestation on the chemical composition and nutritive value of grain sorghums. Journal of the Science of Food and Agriculture, 28(11): 963–970. Pérez-García, F., González-Benito, M.E. and Gómez-Campo, C. 2006. High viability recorded in ultra-dry seeds of 37 species of Brassicaceae after almost 40 years of storage. Seed Science and Technology. Prenger, J and J. and Ling, P.P. 2010. Greenhouse condensation control. Improving air circulation. AEX-803-00. Ohio State University Fact Sheet. Food, Agricultural and Biological Engineering. Ohio State University Fact Sheet. Food, Agricultural and Biological Engineering. Retrieved on July 26, 2010 from http://ohioline.osu.edu/aex-fact/0803.html. Poethke, H.J and J. Liebig. 2008. Risk-sensitive foraging and the evolution of cooperative breeding and reproductive skew. BMC Ecology: 8:2. Rickman, J.F., Aquino, E., 2003. Hermetically sealed grain storage systems. (unpublished), IRRI, Philippines, GrainPro Document Number SL2258PV0803, GrainPro, Inc. Concord, MA USA. Cited by Villers, et al., Development and applications of the hermetic storage technology. Alternative methods to chemical
134
control. Proceedings of the 9th International Working Conference on Stored Product Protection. Campinas, São Paulo, Brazil. PS7-8 – 611:719. Retrieved on August 29, 2011 from http://bru.gmprc.ksu.edu/proj/iwcspp/pdf2/9/6119.pdf. RSAS -Royal Swedish Academy of Sciences. 2000. Indigenous methods for storage and use of bioresources: Case Study, Indian Central Himalaya. Ambio. 29(6) : 356. http://www.ambio.kva.se. Sabio, G.C., Dator, J.V., Orge, R.F., Julian, D.D.T., Alvindia, D.G., Miranda, G.C., Austria, M.C. 2006. Preservation of Mestizo 1 (PSB Rc72H) seeds using hermetic and low temperature storage technologies. 9th International Working Conference on Stored Product Protection. Brazil: Sao Paulo. SAFgerm. 2011. Retrieved on August 17, 2011 from http://www.frsa.org/SAfacts/SAFgerm.html Smith, R.D. 1992. Seed storage, temperature and relative humidity. Seed Science Research. 2: 113-116. Spann, T.M. 1998. UC Davis. Plant biology 171: Spring. 5-Seed_germination 1-3. Retrieved on January 2011, from http://www.coursehero.com/file/2025857/5-Seedgermination1-3. Tang, J., and S. Sokhansanj. 1993. Drying parameter effects on lentil seed viability. Transactions of the ASAE. 36(3):855-861 - May-June 1993. Vertucci, C.W., and Roos, E.E. 1993. Theoretical basis of protocols for seed storage. II. The influence of temperature on optimal moisture levels. Seed Science Research. 3: 201-213. Villers, P., De Bruin, T. and S. Navarro. 2004. Advances in hermetic storage as a methyl bromide replacement. Donahaye, E.J., Navarro, S., Bell, C., Jayas, D., Noyes, R., Phillips, T.W. [Eds.] (2007) Proc. Int. Conf. controlled atmosphere and fumigation in stored products, Gold-Coast Australia. 8-13th August 2004. Israel: FTIC Ltd. Publishing. p. 207-223. Villers, P., De Bruin, T., Navarro, S. 2006. Development and applications of the hermetic storage technology. Alternative Methods to Chemical Control. Proceedings of the 9th International Working Conference on Stored Product Protection. Campinas, São Paulo, Brazil. PS7-8 – 611:719. Villers, P., Navarro, S., and T. De Bruin. 2008. Development of Hermetic Storage Technology in Sealed Flexible Storage Structures. Citation for controlled atmosphere and fumigation (CAF) conference in Chengdu, China, September, 2008,
135
Session 9 (Achievements of CA and Fumigation, and development trends). CAF 2008 Conference Paper (Unabridged Version, Advanced Copy).
Vincent, C., Panneton, B., and F. Fleurat-Lessard. 2001. Physical control methods in plant protection. 1st edition. New York, NY: Springer, p. 140.
Walters, C. 1998. Ultra-dry technology: perspective from the national Seed Storage Laboratory, USA. Seed Science Research 8, Supplement No. 1 11-14. Weinberg, Z.G., Yan, Y., Chen, Y., Finkelman, S., Ashbell, G., and S. Navarro. 2008. The effect of moisture level on high-moisture maize (Zea mays L.) under hermetic storage conditions—in vitro studies. Journal of Stored Products Research, 44: 136–144. Yakubu, A., Bern, C. J., Coats, J. R., and T. B. Bailey. 2011. Hermetic on-farm storage for maize weevil control in East Africa. African Journal of Agricultural Research, 6(14): 3311-3319.
136
CHAPTER 4: USE OF RECYCLED CONTAINERS FOR HERMETIC MAIZE STORAGE IN EAST AFRICA
Yakubua, A., L.A. Wilsonb, C.J. Berna, T. B. Baileyc, and T.J. Brumma aDepartment of Agricultural and Biosytems Engineering, [email protected], [email protected], [email protected] bDepartment of Food Science & Human Nutrition, [email protected] cDepartment of Statistics, [email protected]
Iowa State University, Ames, Iowa 50011 USA
4.1 ABSTRACT
Affordable, cost-effective, pesticide-free, and reliable maize storage containers for
seed and food purposes is lacking in many subsistence farming cultures. This often
results in rapid deterioration of maize, usually stored in the open-air. As a result
subsistence farmers are forced to dispose of their maize for a low price right after
harvest, robbing them of food for the rest of the year. The objective of the research
was to develop information to enable utilization of sanitary and hermetic maize
storage containers, free of edible oil and associated cancer-causing oil oxidation
products, and which allows farmers to preserve their maize for as long as they wish,
using locally available resources. It involved a market survey of recycled edible oil
containers, conducted in East Africa (Kenya, Tanzania, and Uganda) and laboratory
cleaning research, conducted at Iowa State University. The laboratory study utilized
three cleaning methods (oil-drain plus water at 45°C, oil-drain plus water at 90 to
100°C, and oil-drain plus water at 90 to100°C plus soap) were compared in cleaning
soybean oil contaminated 20-L HDPE containers. A comparison of these methods
shows that the soap and hot water treatment is the most effective, as well as the
only one that meets our cleaning objectives. Leftover oils following cleaning with oil
137
drain, hot water, and soap plus hot water were 0.249g, 0.142g, and 0.004g, per
container respectively. The 0.004g from the soap and hot water treatment compares
favorably with 0.005 to 0.006g per container from the control (unused) experimental
units (HDPE 20-L containers), which had no oil contaminants. Research results,
therefore, indicate that using 3g of 99.44% pure Ivory soap and hot water per gram
of soybean oil contaminant is enough to clean and sanitize soybean oil-
contaminated 20-L HDPE containers, for safe hermetic maize storage. This is an
encouraging result, since market surveys found edible oil containers available for
sale and reuse in East African markets.
4.2 INTRODUCTION
Maize preservation is aimed at prolonging its storage life. However, reliable and
affordable maize storage for subsistence farmers is often lacking (De Bruin, 2005;
Villers, et al., 2008). A usual alternative storage method is open-air (non-hermetic)
storage, which often leads to substantial loss to stored maize (O’Dowd and Dobie
1983; Holst, et al, 2000). These losses usually result from pest (insects, molds,
rodents, and birds) activities (Lindblad and Druben, 1980; Demissie et al., 2008a;
Demissie et al., 2008b; Gregg and Billups, 2009; PHL Network, 2009), with the most
significant of them being losses due to maize weevil (Sitophilus zeamais) activities
(Holst, et al, 2000; Demissie et al., 2008a). About 19% of total annual maize
production is lost in post-harvest storage, annually in East Africa (PHL Network,
2009). And since consumers desire food that is free of chemical contaminants
(Navarro, et al., 1994; CRC, 2003; Springer, 2007; Yakubu, et al., 2011), a storage
138
system, such as hermetic storage that provides mechanical fencing of the food
storage environments from birds and rodents as well providing chemical-free
hermetic insect control (Navarro, et al., 1994; CRC, 2003; Lewis, et al., 2005;
Navarro, et al., 2007; Springer, 2007; Weinberg, et al., 2008; Glevitzky, et al., 2009;
FAO, 2010; Yakubu, et al., 2011) would be beneficial to maize growers in
subsistence farming cultures (Lindblad and Druben, 1980; Moreno-Martinez, et al.,
2000; Gregg and Billups, 2009; Boys et al., 2007; ASM, 2009; Baributsa, 2010;
Demissie et al., 2008a). This is because they would no longer be forced to sell their
maize right after harvest, at low prices.
4.2.1 Epidemiology of food borne illnesses
Epidemiology of several food-borne illnesses have been traced to cross-
contamination with pathogens and toxins from food contact surfaces (Schmidt and
Rodrick, 2003) and toxic free radicals from oxidized edible oil (Wang, et al., 2000;
Andrikopoulos et al., 2002; Andrikopoulos, 2004; Choe and Min, 2006; Asadauskas,
et al., 2007; Fox and Stachowiak, 2007; Canals, et al., 2009). Container recycling
and reuse for food storage, therefore, requires proper selection and cleaning to
exclude containers with toxic contents (Shachman, 2004; Schmidt and Erickson,
2008; EPA, 2009a; 2009b), to protect the end-user of food products stored within
them from cross-contamination and the toxic side effects of prior container
contaminants (Erhan, et al., 2006; Fox and Stachowiak, 2007), and to prevent toxic
loads of effluents from recycled containers from ending up in public drinking water. A
139
reason for which their reuse is highly regulated (EPA, 2002; Shachman, 2004; EPA,
2010a; ACRC, 2006; EPA, 2010b).
Based on the use of 55-gallon drums (Seck et al., 1996; Adhikarinayake, 2005) and
other containers for long-term palm oil storage, establishing proper cleaning
procedure allows the right containers to be used interchangeably for maize storage.
However, due to legislation and the desire to prevent cross contamination between
stored maize and chemical contaminants, only food grade containers (Shachman,
2004) previously utilized for storage of carbonated soft drinks and triglycerides
(Bhatt, 2004; Ashaye and Olusoji, 2006), were considered for this recycling and
maize storage research. But since soft drinks do not have uniform chemical contents
(Cleveland, et al., 2001; EPA. 2006; Mercer, 2006; Malik, et al., 2006;
Tsimihodimos, et al., 2009; Wiley-Blackwell, 2006; EWG, 2010CRU, 2010) only
containers previously contaminated by edible oil (Lindblad and Druben,1980;
Adhikarinayake, 2005; Murdock, et al., 2003; EPA, 2009c) was utilized in this
research.
“Clean” refers to being free from dirt or pollution, unadulterated, sanitary or pure
(Merriam-Webster, Inc. 2010). However, according to Coats (2010) and other
authors (Cleveland, et al., 2001; EPA. 2006) the end-products of some chemicals
are more toxic than the starting chemicals, and some chemicals cannot be cleaned,
adequately. To preserve maize quality, while preventing cross-contamination
between stored maize and the associated rancid oil free radicals, as well as dirt, a
procedure is needed for cleaning edible oil containers such that nearly 100% of the
oil is removed. This gives subsistence farmers the benefits of effective hermetic
140
storage, as well as improved nutrition and economy (Carroll and Fulton, 2008;
Murdock, et.al., 2003).
4.2.2 Research need
Little information was found on the availability of used containers, in East Africa. A
study was therefore needed on container sizes, prices, and quantity available for
sale, in East Africa. A study was also needed to establish cleaning standards, for
reused edible oil containers to ensure food safety.
4.3 OBJECTIVES
• To determine the availability of used edible oil containers in East Africa,
suitable for hermetic maize storage
• To develop and test procedures for cleaning previously used edible oil
containers
4.4 METHODS AND MATERIALS
This study consisted of a market survey and laboratory research.
4.4.1 Market Survey
To explore recycled edible oil container availability for hermetic storage in East
Africa, a recycled container survey form (complete data are shown in Appendix E)
was designed and dispatched to contacts in Uganda, Kenya, and Tanzania. The
purpose of survey was for surveyors to identify containers available in selected East
African markets, which can be recycled for maize storage. Containers identified were
expected to be at least 5 L in capacity and airtight (no holes). Container properties to
141
be identified by the survey included previous or intended use (edible oil, soft drink
concentrate, etc.), volume (L), material (plastic, steel, etc.), how many were in each
market, as well as price. Each surveyor was expected to carry out the survey in at
least three markets.
4.4.2 Laboratory research
The laboratory part of the research conducted at Iowa State University was done in
two stages (Figure 4.1). The first stage involved applying three treatments (oil-drain
plus water at 45°C, oil-drain plus water at 90 to100°C, and oil-drain plus water at 90
to100°C plus soap) to randomly assigned experimental units (20-L HDPE
containers). Experimental units utilized were previously used (contaminated) and
new (uncontaminated) 20-L (~5 gallon) HDPE containers. The complementary
second stage utilized the goldfisch oil extraction method to measure leftover oil
quantities in the 20-L HDPE containers for use in statistical treatment analysis which
allowed comparison of the three cleaning treatments.
4.4.3 Treatment definition
Cleaning of oil-contaminated containers using water, with or without soap is common
practice in East Africa (Myers, 2006; Yakubu, et al., 2011). Literature, however,
suggests that cleaning, disinfecting and sanitizing containers to prevent cross-
contamination of food stored within them is best done at high temperature (Atlas and
Snyder, 2006; Sebastião, et al., 2006), using soap and mechanical action (Knoxa
and Walkera, 1947; Gangneux, et al., 2004; CRC, 2006; Helmenstine, 2011; MTL,
2011; Patwardhan and Kelkar, 2011), such as scrubbing and shaking. According to
142
FAO (2002) heat treatment destroys oil-splitting enzymes, arrests hydrolytic rancidity
and autoxidation, during vegetable oil extraction and causes oil to leach out from its
container. The use of soap plus hot water cleaning treatment is expected to produce
similar advantages.
Factors considered for this research were (i) soap and water, at two water
temperature extremes (control (45°C) and hot/boiling (90 to100°C)), and (ii)
container history (contaminated and new (control)). We hypothesize, therefore that
cleaning with soap at high temperature (90 to100°C), with mechanical action would
be enough to clean and sanitize vegetable contaminated containers for maize quality
preservation within them.
4.4.4 Experimental 20-L HDPE containers
The 36 experimental units (20-L HDPE containers) utilized for the research each
have a net weight of about 16 kg (35 lb), and normally contain 15.88kg of oil claimed
to be 100% pure soybean oil (Columbus Foods, Chicago, Illinois).

143
Figu
re 4
.1: R
ecyc
ling
rese
arch
treat
men
t des
ign
flow
char
t *C
lean
ing
met
hods
: (1
) oil
drai
n+ 4
5°C
wat
er, (
2) o
il dr
ain+
90-
100°
C w
ater
, and
(3) o
il dr
ain+
90-
100°
C w
ater
+soa
p
144
They are made of high density polyethylene (HDPE) plastic, with a resin
classification/recycling code of 2 (ACC, 2007; Bakers & Chefs, distributed by Sam's
West, Inc. 608 S.W. 8th Street, Bentonville, AR). HDPE has a melting point of 130-
135°C and tensile strength of 4550 psi, and can withstand temperatures of 120°C for
short periods or 110°C continuously (EOS/EDS, 2000; Antec, 2001; Dow 2009;
Dynalab, 2011).
4.4.5 Quantification of vegetable oil remnants
To obtain an estimate of the remnant quantity of oil contaminants in each of the
contaminated 20-L HDPE containers, the average weight of eighteen unused (new)
20-L HDPE containers (donated by Columbus Vegetable Oils, 30 E. Oakton Street,
Des Plaines, IL) was subtracted from the weight of each of the eighteen
contaminated 20-L HDPE containers (donated by Ames and Des Moines area
Chinese fast food restaurants).
Average weight of the new 20-L containers was 296.50 g. On average,
contaminated 20-L HDPE containers assigned to the oil drain+ 45°C water, oil
drain+ 90 to100°C water, and oil drain+ 90 to100°C water+soap lost weight equaling
10.45g, 14.23g, and 20.06g oil respectively before the wiping treatment application.
While, on average, the contaminated 20-L HDPE containers contained 0.249g of oil
(remnant oil quantity) after draining with water at 45°C, 0.142g of oil following
draining with water at 90 to100°C, and 0.004g oil after draining with 90 to100°C
water plus soap. In cleaning contaminated 20-L HDPE containers, to which soap
plus water at 90 to100°C was employed as treatment, enough soap was added to
145
remove all the oil, irrespective of whether leftover oil is free flowing or bound tightly
to the 20-L HDPE container internal surfaces. Therefore, the soap quantity
necessary to remove nearly 100% oil contaminant was based on that. Since water at
45°C was utilized in dissolving congealed oil before draining, the fluid nature of the
drained oil allowed the oil dissolved in the water to flow out, reducing the leftover oil
in the drained 20-L HDPE containers.
4.4.6 Experimental soap
The preliminary soap quantification involved determining the cleansing power of
Ivory soap, and quantifying the number of grams of the soap that effectively removes
each gram of the vegetable oil contaminant. From the initial soap quantification
experiment (complete data are shown in Appendix C), it was determined that 1g of
soap removed almost 1 g of oil, from oil contaminated experimental units. However,
three times that amount of soap (3g soap/gram oil) was utilized with hot water, for
cleaning the 20-L HDPE containers, in order to account for variability in the history of
20-L HDPE containers collected from the field.
4.4.7 Water The water utilized for this research was deionized (demineralized) water, which is
water from which impurities, including hard water-causing minerals had been
removed (Wilson, et al., 1999; Miller, et al., 2009; Lower, 2011).

146
4.4.8 Oil removal treatments
Stage one of the research (full run), involved adding the assigned and calculated
treatment quantities, followed by the application of 3.78L of deionized water to each
EU. The mixture was then shaken at the onset and at 5-minute intervals afterwards
for a total of 1.5 h, and emptied. Cans were then rinsed three times and turned
upside down for 48 h to allow water to flow out as well and allow drying of the 20-L
HDPE container interiors to occur. The oil drain treatment involved just adding water
at 45°C to assigned EUs, shaking at 5-minute intervals, and emptying at the end of
the treatment application period. The hot water treatment application utilized a
procedure similar to the oil drain treatment, except that only oil-drain plus water at
90-100°C was, while the soap treatment involved the addition of the calculated
quantities of soap to the assigned EUs, followed by addition of 3.78L of water at 90-
100°C.
4.4.9 Oil residue measurements
The second stage of the treatment involved tying about 1.7g of a disposable,
absorbent piece of cheesecloth (Prym Creative, Estopilla, Prym Consumer USA,
Inc., Spartanburg, SC), to the end of a wood stick and using the clothed end to wipe
each of three pre-assigned 229-mm x 229-mm areas of the interior of each
experimental unit (from stage one), in order to determine the level of oil still left on
the can interior following each treatment application from the initial cleaning process.
New cheesecloth was installed on the stick prior to each wiping. The remaining oil
levels were determined by quantifying the oil content of the cheesecloths, using the
147
goldfisch (35001-00, LABCONCO, Kansas City, MO. 1637) hexane oil extraction
method. The second stage was performed after the EUs had dried, following the
initial treatment application.
4.5 RESULTS AND DISCUSSION
4.5.1 Survey results East African Markets surveyed are Jua Kali Drum Dealers (Nairobi), Shadimum
Grocers, Frere Town (Mombasa) and Musila Enterprises (Kikambala Village), in
Kenya, and Mwembe (Same), Same Center (Same), Kwasakwasa (Same),
Tanzania. Other markets surveyed in Tanzania, include Saidi (Nkungi), and Singida,
while Markets surveyed in Uganda include Namanve Market (Mukono-Kampala),
Owino Market (Kampala), and Soko Mujinga Market (Kitale). The recycled container
survey identified a total of 55522 containers that met the survey criteria. However,
only 42, 208 (76%) (Table 4.1) of the containers had edible oil residue or were
earmarked for edible oil storage. These ranged in storage capacity from 5 to 20L,
with prices ranging from $0.72 to $2.08, based on size. On average, the number of
recyclable plastic containers per market were 1,142 (5-L), 967 (10-L), and 2,581 (20-
L), respectively.
4.5.2 Laboratory research results
Each treatment was assigned six 20-L HDPE containers, and three wipes (interior
bottom, right, and left) were taken from each of the 20-L HDPE containers.
148
Therefore, each of the bars in Figure 4.2 to Figure 4.8 represent the mean of the
wipes from 18 (six, 20-L containers*3 wipes) 20-L HDPE container locations
assigned to each of the treatments.
Figure 4.2 shows results obtained from cleaning recycled and new 20-L HPDE
containers with three treatments-oil-drain plus water at 45°C (lukewarm water), oil-
drain plus water at 90 to100°C, and oil-drain plus water at 90 to 100°C plus Ivory
soap. It indicates a strong treatment effect, and shows that while the oil drain plus
45°C water and oil drain plus 90 to100°C water treatments left behind significant
(p<.0001) amounts of oil, the oil-drain plus water at 90 to100°C plus soap as well as
the control treatments (oil drain plus 45°C water, oil drain plus 90 to100°C, and oil
drain plus 90 to100°C plus soap, applied to unused 20-L HDPE containers) had an
insignificant (p=0.8992, 0.8633, 0.8448, 0.8526 respectively) amount of oil leftover,
following cleaning treatment application.
Since analysis was done at the 0.05 significance level (Dallal, 2003), where p < 0.05
is sufficient evidence for accepting a hypothesis of treatment effect, the laboratory
results conclude that there is a treatment difference between the oil-drain plus water
at 45°C and oil-drain plus water at 90 to100°C (contaminated 20-L HDPE
containers) treatments versus the oil-drain plus water at 90 to 100°C plus soap
(contaminated 20-L HDPE containers) treatment and all the control treatments.
Any level of cross contamination between stored food and storage container surface
contaminants is not acceptable (Shachman, 2004; EPA, 2009a; 2009b). The
uncontaminated 20-L HDPE containers utilized in this research are reference

149
standards for clean 20-L containers. Based on the results, using 3g (0.031 moles) of
Ivory soap (99.4% pure) to clean each gram of soybean oil contaminated 20-L
HDPE containers will remove enough oil to prevent rancidity and cross-
contamination of soybean oil with maize that would be store in them. This is because
leftover oils from the 6 replications were not significantly different (p=0.9218),
although there were significant treatment (p<.0001) and location (p<.0001)
difference, and according to the table and Figures 4.3 to 4.6, all interactions were
significant.
A total of 108 (18 wipes*6 treatments) samples were analyzed using the goldfisch oil
extraction method. Therefore 54 (108/2) of the wipes were obtained from each of the
contaminated and unused 20-L HDPE containers. And the remnant oil quantity
(Chapter 4-Figure 2) shows the average of 18 (3 wipes/jerry*six 20-L HDPE
containers) wipes obtained from six 20-L HDPE containers obtained from each set
experimental units assigned to each treatment.
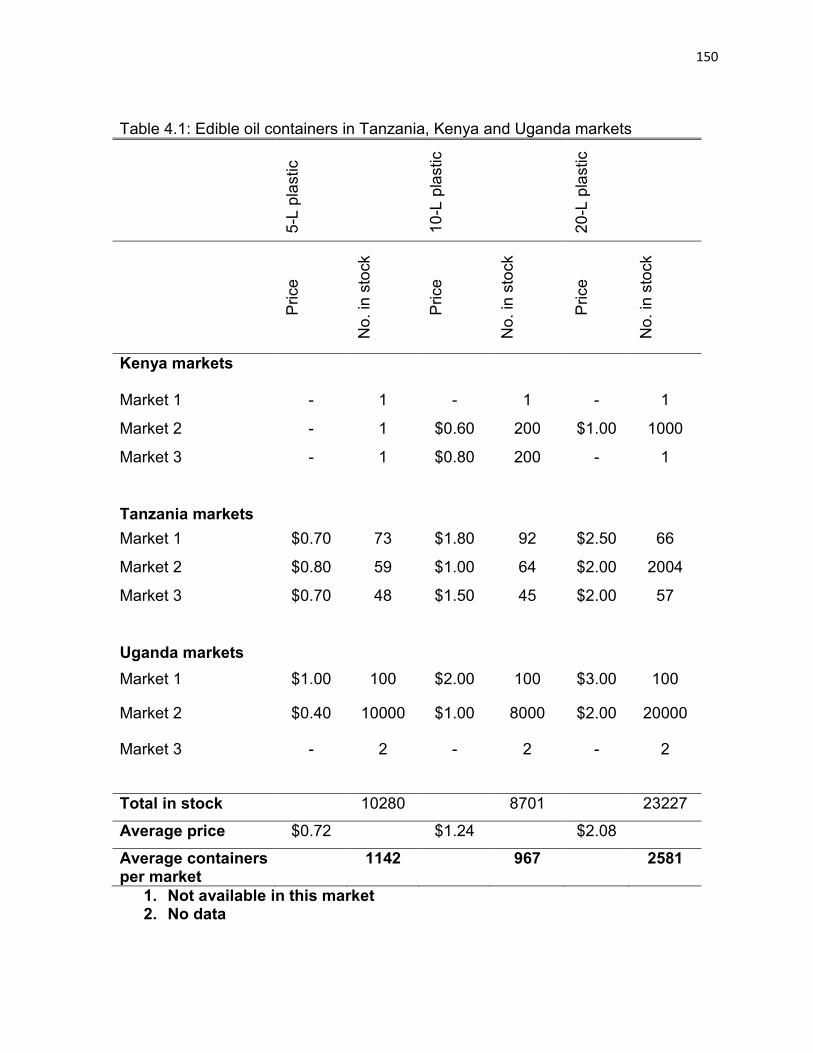
150
Table 4.1: Edible oil containers in Tanzania, Kenya and Uganda markets
5-L
plas
tic
10-L
pla
stic
20-L
pla
stic
Pric
e
No.
in s
tock
Pric
e
No.
in s
tock
Pric
e
No.
in s
tock
Kenya markets
Market 1 - 1 - 1 - 1
Market 2 - 1 $0.60 200 $1.00 1000
Market 3 - 1 $0.80 200 - 1
Tanzania markets Market 1 $0.70 73 $1.80 92 $2.50 66
Market 2 $0.80 59 $1.00 64 $2.00 2004
Market 3 $0.70 48 $1.50 45 $2.00 57
Uganda markets Market 1 $1.00 100 $2.00 100 $3.00 100
Market 2 $0.40 10000 $1.00 8000 $2.00 20000
Market 3 - 2 - 2 - 2
Total in stock 10280 8701 23227
Average price $0.72 $1.24 $2.08
Average containers per market
1142 967 2581
1. Not available in this market 2. No data
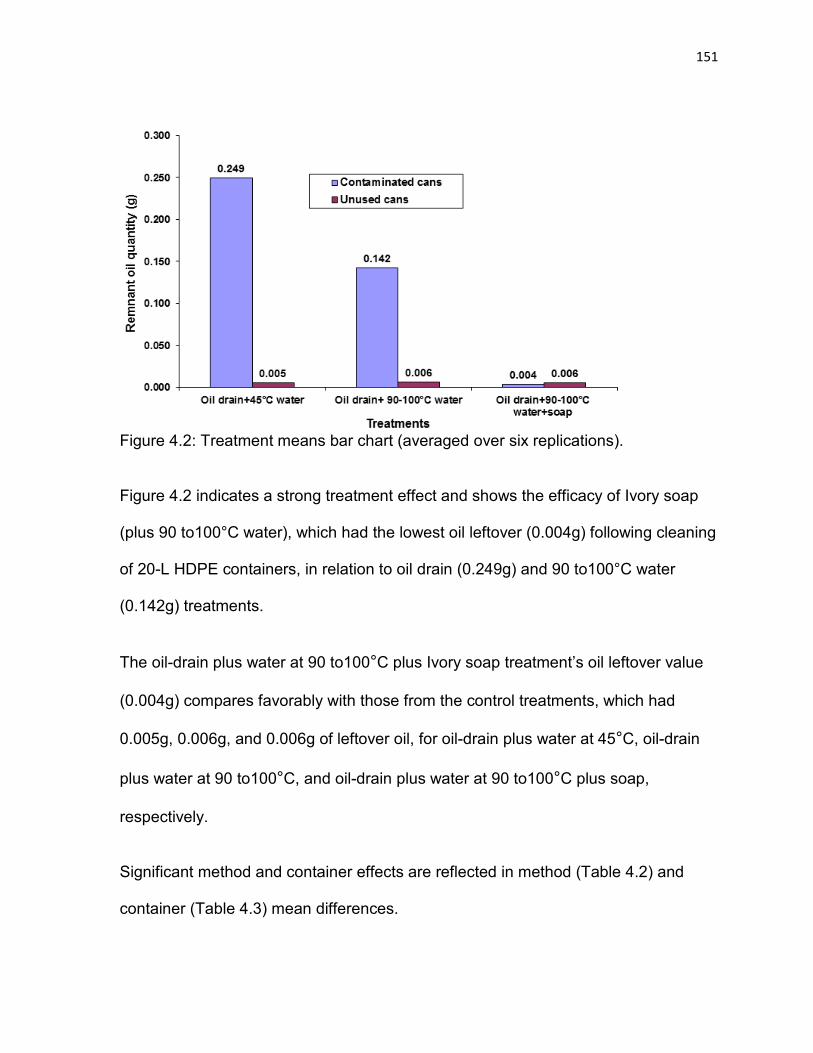
151
Figure 4.2: Treatment means bar chart (averaged over six replications).
Figure 4.2 indicates a strong treatment effect and shows the efficacy of Ivory soap
(plus 90 to100°C water), which had the lowest oil leftover (0.004g) following cleaning
of 20-L HDPE containers, in relation to oil drain (0.249g) and 90 to100°C water
(0.142g) treatments.
The oil-drain plus water at 90 to100°C plus Ivory soap treatment’s oil leftover value
(0.004g) compares favorably with those from the control treatments, which had
0.005g, 0.006g, and 0.006g of leftover oil, for oil-drain plus water at 45°C, oil-drain
plus water at 90 to100°C, and oil-drain plus water at 90 to100°C plus soap,
respectively.
Significant method and container effects are reflected in method (Table 4.2) and
container (Table 4.3) mean differences.
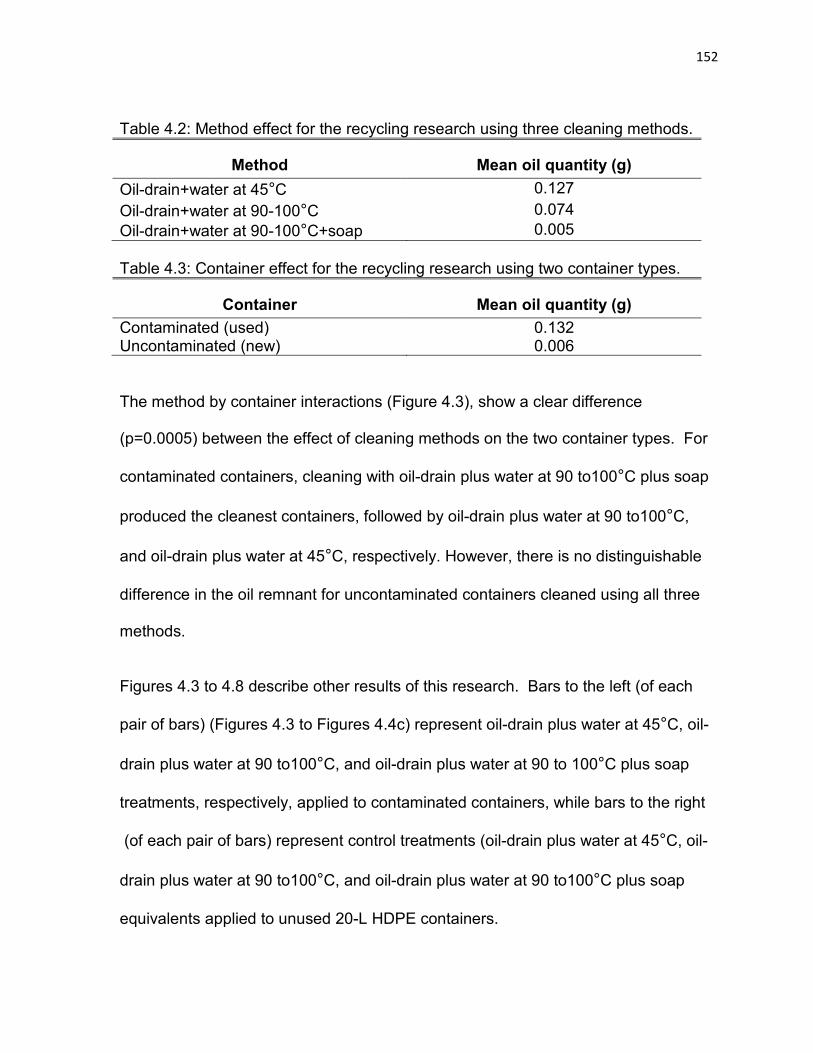
152
Table 4.2: Method effect for the recycling research using three cleaning methods.
Method Mean oil quantity (g) Oil-drain+water at 45°C 0.127 Oil-drain+water at 90-100°C 0.074 Oil-drain+water at 90-100°C+soap 0.005 Table 4.3: Container effect for the recycling research using two container types.
Container Mean oil quantity (g) Contaminated (used) 0.132 Uncontaminated (new) 0.006 The method by container interactions (Figure 4.3), show a clear difference
(p=0.0005) between the effect of cleaning methods on the two container types. For
contaminated containers, cleaning with oil-drain plus water at 90 to100°C plus soap
produced the cleanest containers, followed by oil-drain plus water at 90 to100°C,
and oil-drain plus water at 45°C, respectively. However, there is no distinguishable
difference in the oil remnant for uncontaminated containers cleaned using all three
methods.
Figures 4.3 to 4.8 describe other results of this research. Bars to the left (of each
pair of bars) (Figures 4.3 to Figures 4.4c) represent oil-drain plus water at 45°C, oil-
drain plus water at 90 to100°C, and oil-drain plus water at 90 to 100°C plus soap
treatments, respectively, applied to contaminated containers, while bars to the right
(of each pair of bars) represent control treatments (oil-drain plus water at 45°C, oil-
drain plus water at 90 to100°C, and oil-drain plus water at 90 to100°C plus soap
equivalents applied to unused 20-L HDPE containers.
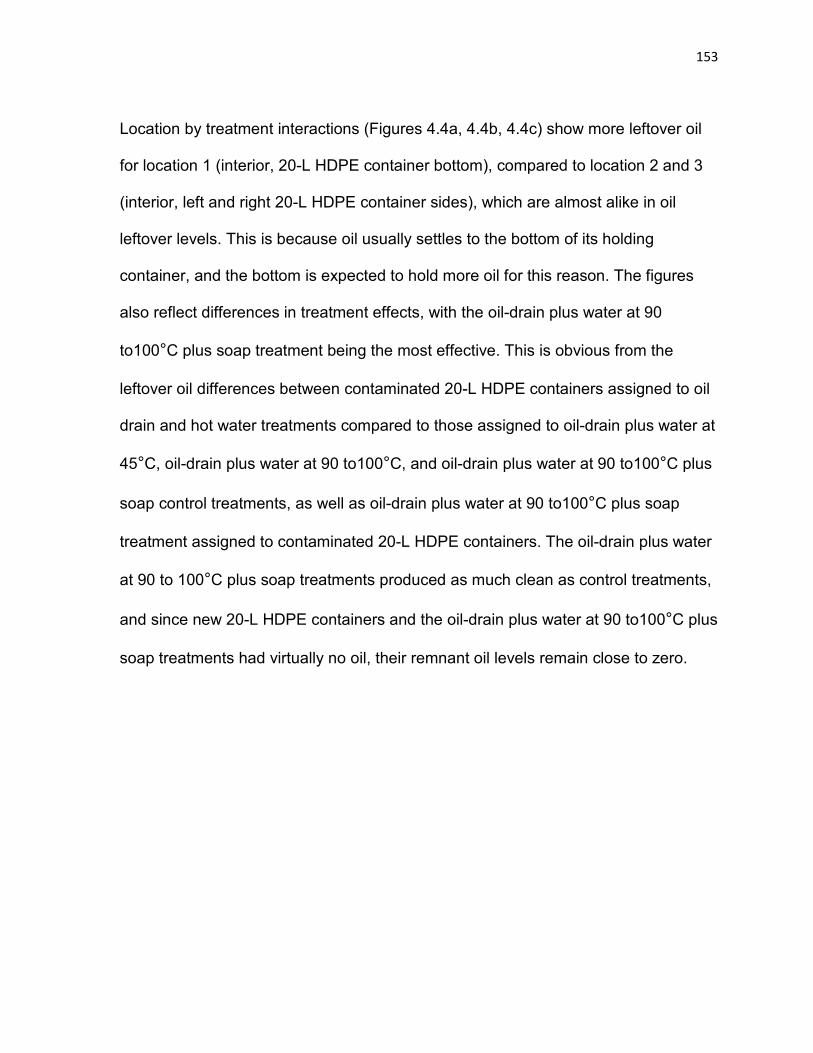
153
Location by treatment interactions (Figures 4.4a, 4.4b, 4.4c) show more leftover oil
for location 1 (interior, 20-L HDPE container bottom), compared to location 2 and 3
(interior, left and right 20-L HDPE container sides), which are almost alike in oil
leftover levels. This is because oil usually settles to the bottom of its holding
container, and the bottom is expected to hold more oil for this reason. The figures
also reflect differences in treatment effects, with the oil-drain plus water at 90
to100°C plus soap treatment being the most effective. This is obvious from the
leftover oil differences between contaminated 20-L HDPE containers assigned to oil
drain and hot water treatments compared to those assigned to oil-drain plus water at
45°C, oil-drain plus water at 90 to100°C, and oil-drain plus water at 90 to100°C plus
soap control treatments, as well as oil-drain plus water at 90 to100°C plus soap
treatment assigned to contaminated 20-L HDPE containers. The oil-drain plus water
at 90 to 100°C plus soap treatments produced as much clean as control treatments,
and since new 20-L HDPE containers and the oil-drain plus water at 90 to100°C plus
soap treatments had virtually no oil, their remnant oil levels remain close to zero.
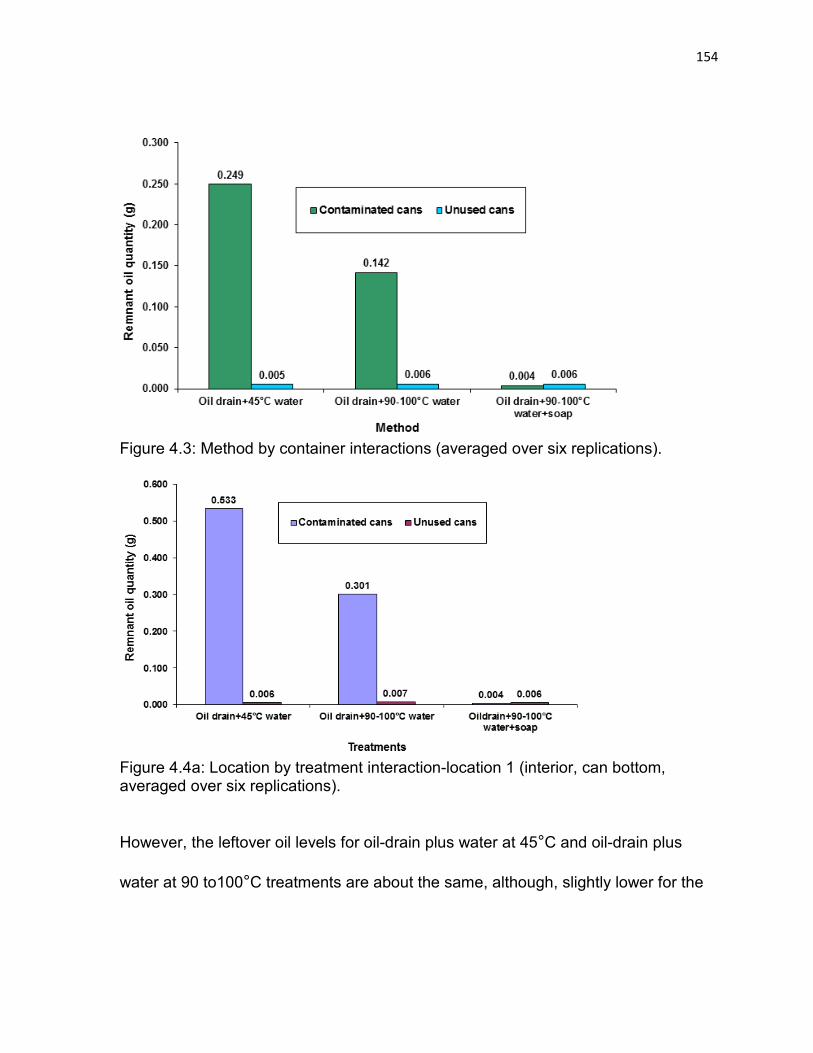
154
Figure 4.3: Method by container interactions (averaged over six replications).
Figure 4.4a: Location by treatment interaction-location 1 (interior, can bottom, averaged over six replications). However, the leftover oil levels for oil-drain plus water at 45°C and oil-drain plus
water at 90 to100°C treatments are about the same, although, slightly lower for the
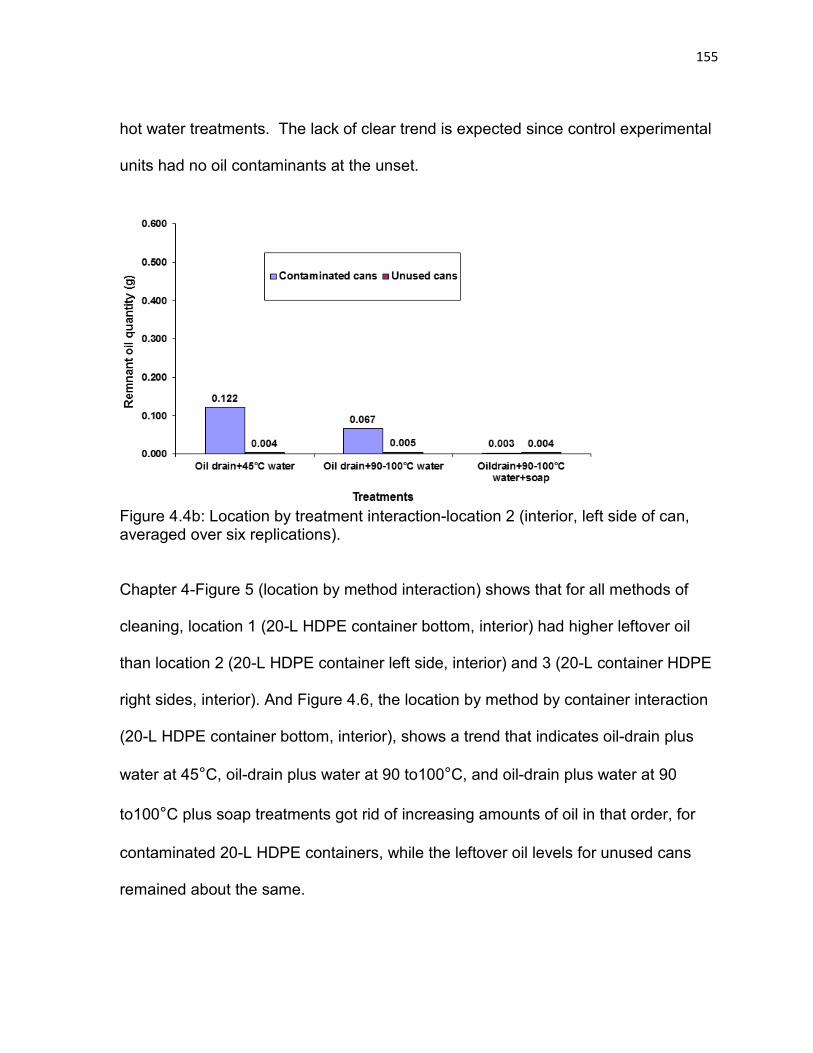
155
hot water treatments. The lack of clear trend is expected since control experimental
units had no oil contaminants at the unset.
Figure 4.4b: Location by treatment interaction-location 2 (interior, left side of can, averaged over six replications). Chapter 4-Figure 5 (location by method interaction) shows that for all methods of
cleaning, location 1 (20-L HDPE container bottom, interior) had higher leftover oil
than location 2 (20-L HDPE container left side, interior) and 3 (20-L container HDPE
right sides, interior). And Figure 4.6, the location by method by container interaction
(20-L HDPE container bottom, interior), shows a trend that indicates oil-drain plus
water at 45°C, oil-drain plus water at 90 to100°C, and oil-drain plus water at 90
to100°C plus soap treatments got rid of increasing amounts of oil in that order, for
contaminated 20-L HDPE containers, while the leftover oil levels for unused cans
remained about the same.

156
Location 2 (20-L HDPE container interior, left) and 3 (20-L container interior, right)
had similar remnant oil quantities for all cleaning types, for contaminated oil
containers. And the leftover oils for both locations were much lower than that for
location 1 (20-L HDPE container interior, bottom), when the cleaning method is oil-
drain plus water at 45°C or oil-drain plus water at 90 to 100°C. Figure 4.7 and Figure
4.8 represent oil leftover quantities for 20-L container interior (left) and 20-L HDPE
container interior (right), respectively for both contaminated and unused 20-L HDPE
containers. For all three locations, unused cans had about the same levels of
contamination.
Figure 4.4c: Location by treatment interaction-location 3 (interior, right side of can, averaged over six replications).
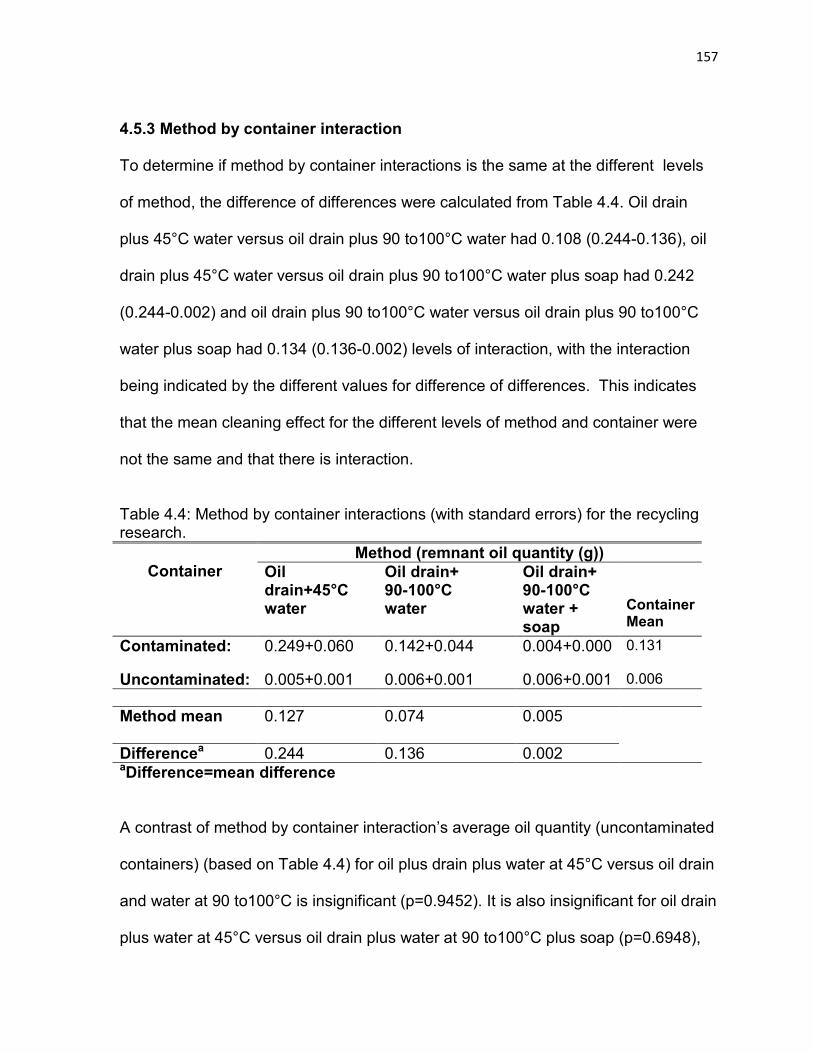
157
4.5.3 Method by container interaction To determine if method by container interactions is the same at the different levels
of method, the difference of differences were calculated from Table 4.4. Oil drain
plus 45°C water versus oil drain plus 90 to100°C water had 0.108 (0.244-0.136), oil
drain plus 45°C water versus oil drain plus 90 to100°C water plus soap had 0.242
(0.244-0.002) and oil drain plus 90 to100°C water versus oil drain plus 90 to100°C
water plus soap had 0.134 (0.136-0.002) levels of interaction, with the interaction
being indicated by the different values for difference of differences. This indicates
that the mean cleaning effect for the different levels of method and container were
not the same and that there is interaction.
Table 4.4: Method by container interactions (with standard errors) for the recycling research.
Container
Method (remnant oil quantity (g)) Oil drain+45°C water
Oil drain+ 90-100°C water
Oil drain+ 90-100°C water + soap
Container Mean
Contaminated: 0.249+0.060 0.142+0.044 0.004+0.000 0.131
Uncontaminated: 0.005+0.001 0.006+0.001 0.006+0.001 0.006 Method mean
0.127 0.074 0.005
Differencea 0.244 0.136 0.002 aDifference=mean difference A contrast of method by container interaction’s average oil quantity (uncontaminated
containers) (based on Table 4.4) for oil plus drain plus water at 45°C versus oil drain
and water at 90 to100°C is insignificant (p=0.9452). It is also insignificant for oil drain
plus water at 45°C versus oil drain plus water at 90 to100°C plus soap (p=0.6948),
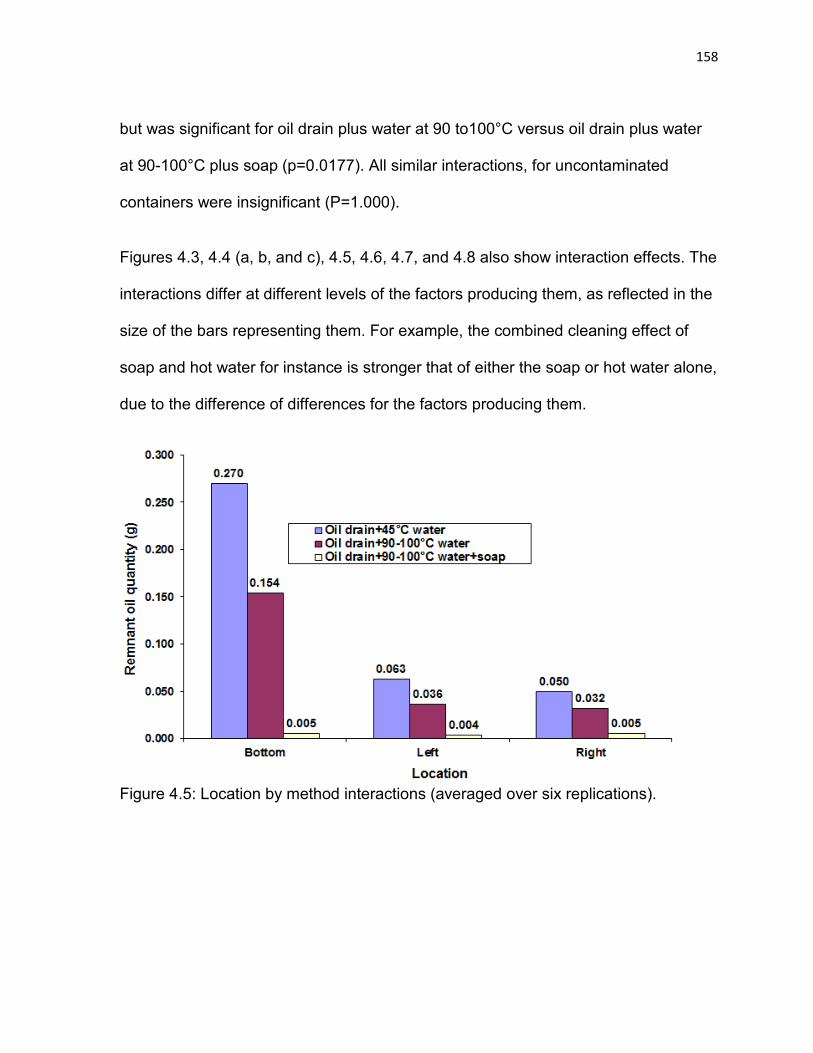
158
but was significant for oil drain plus water at 90 to100°C versus oil drain plus water
at 90-100°C plus soap (p=0.0177). All similar interactions, for uncontaminated
containers were insignificant (P=1.000).
Figures 4.3, 4.4 (a, b, and c), 4.5, 4.6, 4.7, and 4.8 also show interaction effects. The
interactions differ at different levels of the factors producing them, as reflected in the
size of the bars representing them. For example, the combined cleaning effect of
soap and hot water for instance is stronger that of either the soap or hot water alone,
due to the difference of differences for the factors producing them.
Figure 4.5: Location by method interactions (averaged over six replications).
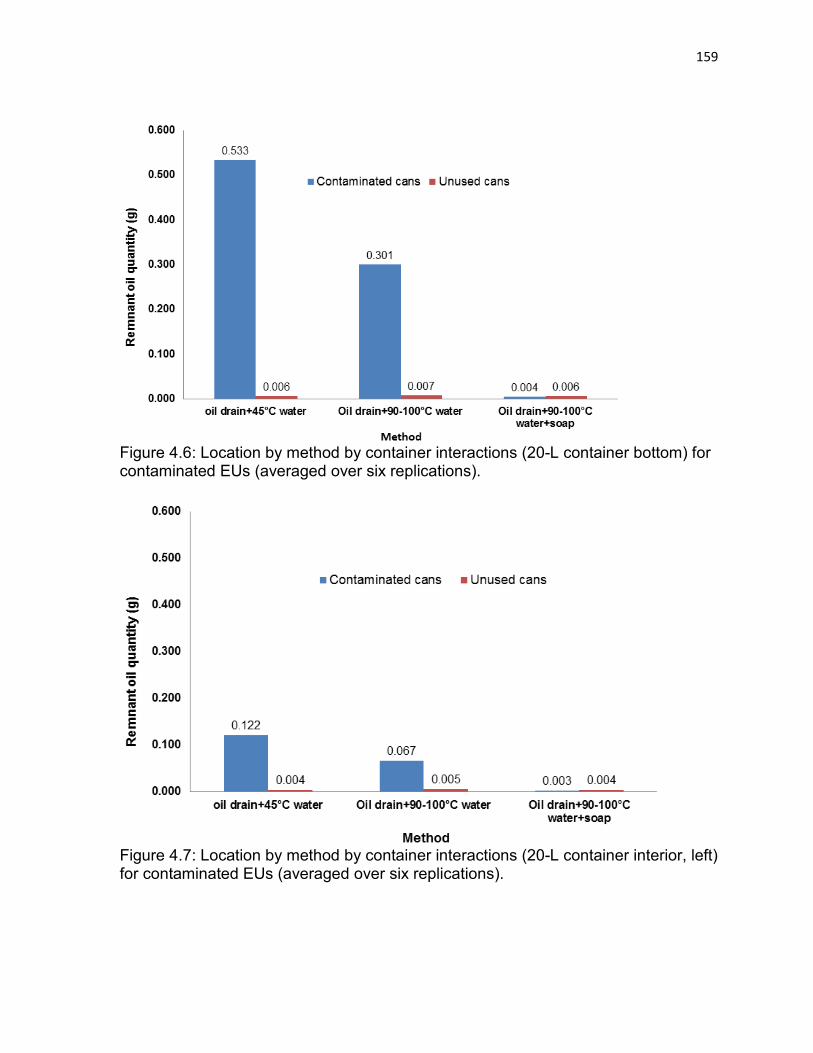
159
Figure 4.6: Location by method by container interactions (20-L container bottom) for contaminated EUs (averaged over six replications).
Figure 4.7: Location by method by container interactions (20-L container interior, left) for contaminated EUs (averaged over six replications).
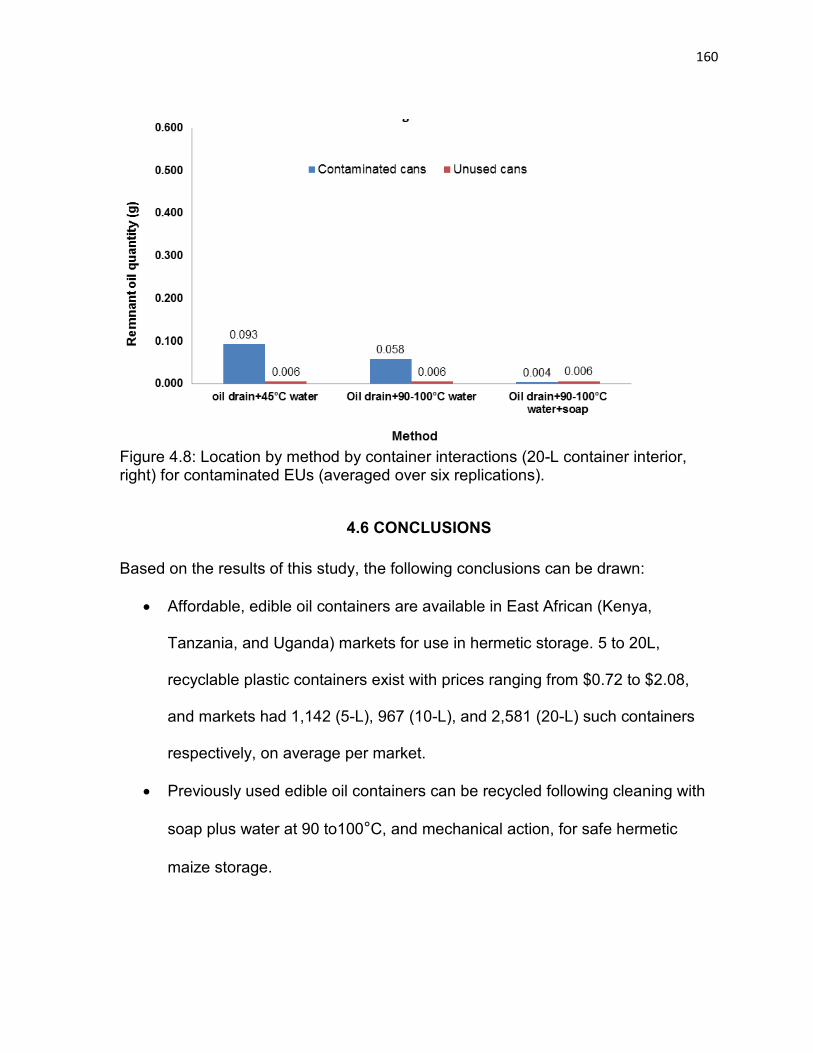
160
Figure 4.8: Location by method by container interactions (20-L container interior, right) for contaminated EUs (averaged over six replications).
4.6 CONCLUSIONS Based on the results of this study, the following conclusions can be drawn:
• Affordable, edible oil containers are available in East African (Kenya,
Tanzania, and Uganda) markets for use in hermetic storage. 5 to 20L,
recyclable plastic containers exist with prices ranging from $0.72 to $2.08,
and markets had 1,142 (5-L), 967 (10-L), and 2,581 (20-L) such containers
respectively, on average per market.
• Previously used edible oil containers can be recycled following cleaning with
soap plus water at 90 to100°C, and mechanical action, for safe hermetic
maize storage.

161
• Rancidity and associated negative health effects can be eliminated using the
cleaning procedures outlined in the research, while preserving maize quality
for the end-user.
162
4.7 REFERENCES
ACRC (Ag container recycling council). 2006.Triple Rinsing. Retrieved on March 20, 2010 from http://www.acrecycle.org/triple_rins.html. Adhikarinayake, T.B., 2005. Thesis. Wageningen University. Chapter 7.Technical and economic feasibility of airtight ferrocement bin for on-farm storage of paddy in Sri Lanka. The Netherlands. Andrikopoulos, N. K., Kalogeropoulos, N., Falirea, A., Barbagianni, M.N.2002.Performance of virgin olive oil and vegetable shortening during domestic deep-frying and pan-frying of potatoes. Int. J. Food Sci. Technol. 37(2): 177–190. Andrikopoulos, N.K. 2004. Oxidative stressed frying fats and oils. Potential role for health.4th International symposium on deep-frying: “healthier and tastier deep fried foods”, January 11-13, Hagen, Germany. p. 11-12. Retrieved on May 19, 2011 from http://www.dgfett.de/material/hagen2004/andrikopoulos.pdf. ASM (American society for microbiology). 2009. Pathogens and toxins in foods: challenges and interventions. Juneja, V.K., and J. N. Sofos (Eds). Herndon, VA: ASM Press, p. 420. Atlas, R.M., and J. W. Snyder. 2006.Handbook of media for clinical microbiology. CRC Press, p. 105. ACC (American Chemistry Council). 2007.Plastic packaging resins. Plastics division.Plastic packaging resins. Arlington, VA (USA). Retrieved on January 17, 2011 from http://www.americanchemistry.com/s_plastics/bin.asp?cid=1102&did=4645&doc=file.pdf. ACS (The American Chemical Society). 1920 . The Journal of industrial and engineering chemistry. 12(2). Herty,C.S., and Woodford, L.W.(Eds). 35 East 41st Street. NYC: ACS, p. 130. ACS (American Chemical Society). 2011.Saponification. Division of organic chemistry (ORGN). Retrieved on January 9, 2011 from http://www.marshallschool.net/school/cours/course/dvosen/hchem/IndepProjects/Samples/2saponification.pdf. ANTEC.200. Plastic: The lone star. Conference proceedings.Volume II. Materials. Society of Plastics Engineers Technical Conference. Boca Raton, FL: CRC.:pp.2705.
163
Asadauskas, S.J., Griguceviciene, A., and A. Stoncius. 2007. Review of late stages of oxidation in vegetable oil lubricant basestocks. Proceedings of the international conference, BALTTRIB. Ashaye, O.A., and O.C. Olusoji. 2006. Evaluation of some quality attributes of soybean oils in Ibadan. African Journal of Agricultural Research,1 (1), p. 017-019. Baributsa, D., Lowenberg-DeBoer, J., Murdock, L., and B.Moussa. 2010.Profitable chemical-free cowpea storage technology for smallholder farmers in Africa: opportunities and challenges. 10th International Working Conference on Stored Product Protection Julius-Kühn-Archiv, 425, 2010. Bhatt, B.I. 2004. Stoichiometry.India:Tata Mcgraw Hill Education, 127,178. Boys, K., Faye, M., Fulton, J., Lowenberg-DeBoer, J., 2007. The economic impact of cowpea research in Senegal: an ex-post analysis with disadoption. Agricultural Economics, 36: 363-375. Canals, A., Grané, N., Martín , M.L., Román, I., Staykova, M., and C. Domini. 2009. Monitoring the oxidation of vegetable oil by ultrasound-assisted-ATR-FTIR spectroscopy. Retrieved on May 19, 2011 from http://www.science24.com/paper/7450. Carroll NJ and Fulton J.R. 2008. Extension methods to teach hermetic storage in West-Central Africa. An ASABE meeting presentation. Paper Number: 084981. Written for presentation at the 2008 ASABE Annual International Meeting. Providence, Rhode Island. St. Joseph, Mich.: ASABE. Choe, E and Min, D.B. 2006. Mechanisms and factors for edible oil oxidation. Comprehensive reviews in food science and food safety, 5, p.169. Cleveland, C.B., Oliver, G.R., Chen, B and Joel Mattsson. 2001. Risk Assessment under FQPA: Case Study with Chlorpyrifos. NeuroToxicology. 22 (5), October 2001, p. 699-706. Coats, J.R. 2010. Toxicology 550. Pesticides in the environment. Iowa State University. Class notes. Spring 2010. CRC. 2003 (CRC Press). Handbook of postharvest technology: creals, fruits, vegetables, tea, and spices. In: Chakraverty, A., Mujumdar, A.S., and H.S. Ramaswamy (eds). Boca Raton, FL: CRC Press, p.188. CRC. 2006. Handbook of lubrication and tribology: Volume I. Application and maintenance, Second Edition. George E. Totten (ed.). Boca Raton: CRC press, p 1-11.

164
CRU. 2010. Clean water for Washington. Why the concern about agricultural contamination in groundwater? Retrieved on May 02, 2009 form http://cru.cahe.wsu.edu/CEPublications/eb1632/eb1632.html Dallal, G.E. 2003. Why P=0.05? Retrieved on December 9, 2011 from http://www.webpages.uidaho.edu/~brian/why_significance_is_five_percent.pdf. De Bruin, T. 2005. Innovations in seed storage methods. Published in Asian seed and planting material. Philippines, Jan-Feb. Cited by Villers, et al., Development and applications of the hermetic storage technology. Alternative Methods to Chemical Control. Proceedings of the 9th International Working Conference on Stored Product Protection. Campinas, São Paulo, Brazil. PS7-8 – 611:719. http://www.grainpro.com/pdf/apsa.pdf, http://www.grainpro.com/speccommodityinfo.php http://bru.gmprc.ksu.edu/proj/iwcspp/pdf2/9/6119.pdf http://bru.gmprc.ksu.edu/proj/iwcspp/iwcspp9.html Devor, R.E., Chang, T., Suntherland, J.W. 2007. Statistical quality design and control. Contemporary concepts and methods. 2nd edition. Upper Saddle River: Pearson Education, Inc. Demissie G, Teshome A, Abakemal D, Tadesse A. 2008a. Cooking oils and ‘‘Triplex’’ in the control of sitophilus zeamais motschulsky (coleoptera: curculionidae) in farm-stored maize. Journal of Stored Products Research. 44: 173–178. Demissie G, Tefera T, Tadesse A. 2008b. Importance of husk covering on field infestation of maize by sitophilus zeamais motsch (coleoptera:curculionidea) at Bako, Western Ethiopia. African Journal of Biotechnology. 7 (20): 3777-3782. EPA. 2002. Preliminary data summary for industrial container and drum cleaning industry. EPA-821-R-02-011. U.S. (Eds): Guilaran, Y and J. Tinger. Environmental Protection Agency. 4303T: Washington, DC. USA. EPA. 2006. Finalization of interim reregistration eligibility decisions (IREDs) and interim tolerance reassessment and risk management decisions (TREDs) for the organophosphate pesticides, and completion of the tolerance reassessment and reregistration eligibility process for the organophosphate pesticides, p. 44, 45, 53, 69. EPA. 2009a. List of contaminants & their maximum contaminant level (MCLs). Retrieved on September 17, 2011, from http://water.epa.gov/drink/contaminants/index.cfm#List.

165
EPA. 2009b. Food. Food safety. Food contaminants & adulteration. Data on Benzene in soft drinks and other beverages. Data through May 16, 2007. Retrieved on September 17, 2011, from http://www.fda.gov/Food/FoodSafety/FoodContaminantsAdulteration/ChemicalContaminants/Benzene/ucm055815.htm. EPA. 2009c. Sprill prevention, control and countermeasure (SPCC) Rule Amendments. Who is subject to the SPCC rule. Retrieved on April 05, 2009 from www. epa.gov/oem/docs/oil/spcc/SPCCFactsheet_FinalAmendments_Nov09.pdf EPA.2010a. EPA's regulated contaminant timeline. Contaminants regulated under the safe drinking water act. Benzene.1987.Phase I (VOCs). 7/87. New regs. benzene. Retrieved on April 05, 2009 from http://water.epa.gov/drink/contaminants/upload/2003_05_27_contaminants_contam_timeline.pdf. EPA. 2010b. Office of Pesticide Programs. Table 6: Container labeling. (40 CFR Part 156 Subpart H). Triple rinsing. Retrieved April 11, 2010 from http://www.epa.gov/opp00001/regulating/regulations-glance-table-6.pdf Erhan, S.Z., Sharma, B. K., and J.M Perez. 2006.Oxidation and low temperature stability of vegetable oil-based lubricants. Industrial Crops and Products, 24:292–299. EWG (Environmental working group). The power of information. Chemical index. Chemicals.Retrieved on October 20, 2011 from http://www.ewg.org/chemindex. Dow (The Dow Chemical Company). 2009. Product safety assessment. High density polyethylene (HDPE) resins. Retrieved on January 17, 2011 from http://msdssearch.dow.com/PublishedLiteratureDOWCOM/dh_02c1/0901b803802c1c97.pdf?filepath=productsafety/pdfs/noreg/233-00577.pdf&fromPage=GetDoc. Dynalab. 2011. Plastic properties of high density polyethylene (HDPE). Retrieved on January 17, 2011 from http://www.dynalabcorp.com/technical_info_hd_polyethylene.asp. Encyclo. Craft point. 2011. http://www.encyclo.co.uk/define/Krafft%20point EOS/EDS (Electrical Overstress - Electrostatic Discharge) symposium proceedings. 22(2000). ESD association in collaboration with IEEE. NY:Rome, p. 2B.1.3. FAO. 1994. Grain storage techniques. Evolution and trends in developing countries. In: Proctor DL (ed). FAO agricultural services bulletin 109. Rome (Italy): Food and Agricultural Organization: 197-200, 211.

166
FAO. 2002. Small scale palm oil processing in Africa. FAO agricultural services bulletin, 148. p.12. Retrieved on September 4, 2011 from ftp://ftp.fao.org/docrep/fao/005/y4355E/y4355E00.pdf, and http://www.fao.org/DOCREP/005/Y4355E/Y4355E00.HTM. FAO. 2010. Rice: Grain storage hermetically sealed systems.Technology for agriculture. Proven technologies for smallholders. Retrieved on April 05, 2009 from www.fao.org/teca/content/rice-grain-storage-hermetically-sealed-systems. Fox. N.J and G.W. Stachowiak. 2007. Vegetable oil-based lubricants—A review of oxidation. Tribology International. 40(7), p.1035-1046. Gangneux, J., Noussair, L., Bouakline, A., Roux, N., Lacroix, C., and F. Derouin. 2004. Experimental assessment of disinfection procedures for eradication of Aspergillus fumigatus in food. Blood, 104 (7). Glevitzky, M., Dumitrel, G.A., Perju, D., and M. Popa. 2009. Studies regarding the use of preservatives on soft drinks stability. Chem. Bull. "POLITEHNICA" Univ. (Timisoara). 54(68):1. Gregg, B.R., and G.L. Billups. 2009. Seed conditioning. management. Enfield, NH: Science publishers. Volume 1, p.184. Helmenstine, M. A. 2011. How Do Detergents Clean? Retrieved on August 28, 2011 from http://chemistry.about.com/od/howthingswork/f/detergentfaq.htm. Holst, N., Meikle, W.G., and R. H. Markham. 2000. Grain injury models for Prostephanus truncatus (Coleoptera: Bostrichidae) and Sitophilus zeamais (Coleoptera: Curculionidae) in rural maize stores in West Africa. J. Econ. Entomol. 93(4): 1338-1346. IEE. 1922. Science abstracts. Volume 25. Institute of electrical engineers. Institution of Electrical Engineers., 1922 - Science.
IUPAC . 2011. Krafft point. http://goldbook.iupac.org/K03415.html, and
IUPAC. Compendium of Chemical Terminology, 2nd ed. (the "Gold Book"). Compiled by A. D. McNaught and A. Wilkinson. Blackwell Scientific Publications, Oxford (1997). XML on-line corrected version: http://goldbook.iupac.org (2006-) created by M. Nic, J. Jirat, B. Kosata; updates compiled by A. Jenkins. doi:10.1351/goldbook. Knoxa, R., and J. Walkera. 1947. Bacteriological investigation of the washing and sterilization of food containers. Journal of Hygiene, 45: 151-158.
167
Lawrence. A.S.C. Soap micelles. Retrieved on December 24, 2011 from http://pubs.rsc.org/en/content/articlelanding/1935/tf/tf9353100189
Lewis, L., Onsongo, M., Njapau, H., Schurz-Rogers, H., Luber, G., Kieszak, S., Nyamongo, J., Backer, L., Dahiye, A.M., Misore,A., DeCock, K., Rubin, C., and Kenya Aflatoxicosis Investigation Group. 2005. Aflatoxin contamination of commercial maize products during an outbreak of acute aflatoxicosis in Eastern and Central Kenya. Environmental Health Perspectives 113. Retrieved February 20, 2007 from <http://www.ehponline.org/docs/2005/7998/abstract.html> Lindblad, C. and L. Druben. 1980. Storage methods. Small farm grain storage. Volume III. Appropriate technologies for development. Manual M-2/ VITA publications manual series no. 35E. Arlington: VITA. Lippingcot Williams & Wilkins. 2005. Remington: the science and practice of pharmacy. 21 st edition.(Eds):Troy, D.B and M.J.Hauber. Baltimore, MD: Lippingcot Williams and Wilkins, p. 425.
Lower, S. 2011. Hard water and water softening. Retrieved on October 20, 2011 from http://www.chem1.com/CQ/hardwater.html.
Miller, F.P., Vandome, A.F., and J. McBrewster .2009. Hard Water. Saarbrucken (Germany): VDM Publishing House Ltd .VDM Verlag Dr. Müller GmbH & Co. KG. 2009. Malik, V.S., Schulze, M.B., and Hu, F.B. 2006. Intake of sugar-sweetened beverages and weight gain: a systematic review. Am J Clin Nutr 2006, 84:274-88. Markley, S. M. 1951. Soybeans and soybean products. Volume 2. NYC, NY: Interscience Publishers Inc., p. 652. Merriam-webster. 2010. Retrieved on March 03, 2011 from http://www.merriam-webster.com/dictionary/clean. MTL (Mid-Continent Testing Laboratories, Inc). 2011. Limiting factors on a diesel engine’s oil life. Rapid City, SD (USA): 1. Retrieved on September 4, 2011 from http://www.thechemistrylab.com/oiltesting/pdf/oilfactors.pdf. Mercer, C. 2006. Cadbury's benzene secret recall. Retrieved on July 01, 2011 from http://www.foodqualitynews.com/Food-Alerts/Cadbury-s-secret-benzene-recall Moreno, M.E. A.S. Jimenez and M.E. 2000. Vazquez, Effect of Sitophilus zeamais and Aspergillus chevalieri on the oxygen level in maize stored hemetically, J. Stored Prod. Res. 36: 25–36.
168
Myers, D. 2006. Surfactant science and technology. Hoboken: John wiley & Sons, Inc., publishing, p. 122. Murdock LL, Dogo SD, Ntoukam G, Kitch L, Shade R.E. 2003. Preservation of cowpea grain in sub-Saharan Africa—Bean/Cowpea CRSP contributions. Field Crops Research, 82:169–178. Navarro S, Donahaye E, Fishman S.1994. The future of hermetic storage of dry grains in tropical and subtropical climates. In: Highley, E., Wright, E.J., Banks, H.J. and Champ, B.R. (eds). Proceeds of the 6th international working conference on stored product protection held at Canberra, Australia. Cambridge: CAB International, p. 130-138. Navarro, S., DeBruin, T., Montemayor, A.R., Finkelman,S., Rindner, M., and R. Dias. 2007. Use of biogenerated atmospheres of stored commodities for quality preservation and insect control, with particular reference to cocoa beans. Integrated Protection of Stored Products IOBC/wprs Bulletin. 30 (2): 197-204. O’Dowd, E.T., and Dobie, P .1983. Reducing viability losses in open seed stores in tropical climates. Seed Sci. Technol. 11: 57-75. Patwardhan N and U. Kelkar. 2011. Disinfection, sterilization and operation theater guidelines for dermatosurgical practitioners in India. Indian J Dermatol Venereol Leprol , 77(1):83-93. PHL Network (2009). Post harvest losses information system. Retrieved on March 27, 2010 from http://www.phlosses.net/index.php?form=losses_estimates&c_id=1. Shachman, M. 2004. The soft drinks companion: a technical handbook for the beverage industry. Boca Raton, FL: CRC Press, p. xv, 33-4, 116. Schmidt, R.H and G. E. Rodrick. 2003. Food Safety Handbook. John Wiley & Sons, Inc., Hoboken: New Jersey. p. 472-480. Schmidt, R.H and Erickson, D. J. 2008. FSHN04-09. Sanitary Design and Construction of Food Equipment. University of Florida. IFAS extension. Florida Cooperative Extension Service, Institute of Food and Agricultural Sciences, University of Florida. Retrieved on May 09, 2008 from http://edis.ifas.ufl.edu. Seck, D., Haubruge, G., Marlier, E., and C. Gaspar, 1996. Alternative protection of cowpea seeds against Callosobruchus maculatus (F.) (Coleoptera: Bruchidae) using hermetic storage alone or in combination with Boscia senegalensis (Pers) Lam ex Poir. Journal of Stored Products Research, 32: 39-44.
169
Springer .2007. Lentil: an ancient crop for modern times. In: Yadav, S.S., Mcneil, D and P.C. Stevenson (eds). New York, NY: Springer, pp. 407. Sebastião, J., Pinto, S and F. M. Lanças. 2006 .Hydrolysis of corn oil using subcritical water. J. Braz. Chem. Soc.,17(1): 85-89. Schwartz, M., and N.F.Schwartz. 1987. Engineering evidence, Volume 1. Colorado Springs, Colo. : Shepard's/McGraw Hill. p. 493. Truman. 2009. Saponification: Soap making, old fashion style. Retrieved on January 09, 2011 from chemlab.truman.edu/CHEM100Labs/SAPONIFICATION.pdf Tsimihodimos, V., Kakaidi, M., and M. Elisaf. 2009. Cola-induced hypokalaemia: pathophysiological mechanisms and clinical implications. Int J Clin Pract, 63:833-5. Unknown author. Retrieved on December 24, 2011 from Surfactant/Cosolvent Enhanced Recovery of NAPLs. http://www.clu-in.org/PRODUCTS/AATDF/chap4.htm Villers, P., Navarro, S., and T. De Bruin. 2008. Development of Hermetic Storage Technology in Sealed Flexible Storage Structures. Citation for Controlled Atmosphere and Fumigation (CAF) Conference in Chengdu, China, September, 2008, Session 9 (Achievements of CA and Fumigation, and development trends). CAF 2008 Conference Paper (Unabridged Version, Advanced Copy). Wang, A.M., Ma, C., Xie, Z. H., and F. Shen. 2000. Use of Carnosine as a Natural Anti-senescence Drug for Human Beings. Biochemistry (Moscow), 65( 7):869-871. Wiley-Blackwell. 2006. Carbonated soft drinks: formulation and manufacture. In: Ashurst, P. R. and Steen, P. (eds). Hoboken: Wiley-Blackwell, p 1-5, 57, 79. Weinberg, Z.G., Yan, Y., Chen, Y., Finkelman, S., Ashbell, G., and S. Navarro. 2008. The effect of moisture level on high-moisture maize (Zea mays L.) under hermetic storage conditions—in vitro studies. Journal of Stored Products Research, 44: 136–144. Wilson, A., Parrott, K., and B. Ross, Blake. 1999. "Household water quality – water hardness". Retrieved on January 25, 2011 from http://www.ext.vt.edu/pubs/housing/356-490/356-490.html. Yakubu, A., Bern, C. J., Coats, J. R., and T. B. Bailey. 2011. Hermetic on-farm storage for maize weevil control in East Africa. African Journal of Agricultural Research, 6(14): 3311-3319.
170
CHAPTER 5: GENERAL CONCLUSIONS
The results of the “Testing of predicted time to complete adult weevil mortality in
hermetically stored maize” research confirmed that hermetic treatment is effective in
field applications. This is evident in the significant (p<0.0001) differences between
hermetic (sealed) and non-hermetic (open-air) treatments.
The “Effect of length of hermetic storage on maize seed germination”, research
confirmed the safety and superiority of hermetic storage (with weevils) over non-
hermetic storage (with weevils) for maize seeds preservation. This is because
hermetically stored maize seeds had 98.7-99.5% germination rates versus 35.0-72.9
for non-hermetic (open-air) storage, over the 12-months seed storage period.
Treatments of particular interest are hermetic treatments with weevils (month zero),
hermetic treatment with weevils (month 4), hermetic treatment with weevils (month
8), and hermetic treatment with weevils (month 12), which had mean germination
rates of 99.1%, 98.7%, 99.6%, and 99.3%, respectively. This confirmed that
hermetic storage preserves seed viability, even when seeds are stored under
ambient conditions.
The “Recycled container research” produced positive results foe the “market survey” and “laboratory cleaning” studies
5.1 MARKET SURVEY RESULTS
East African Markets surveyed are Jua Kali Drum Dealers (Nairobi), Shadimum
Grocers, Frere Town (Mombasa) and Musila Enterprises (Kikambala Village), in
Kenya, and Mwembe (Same), Same Center (Same), Kwasakwasa (Same),
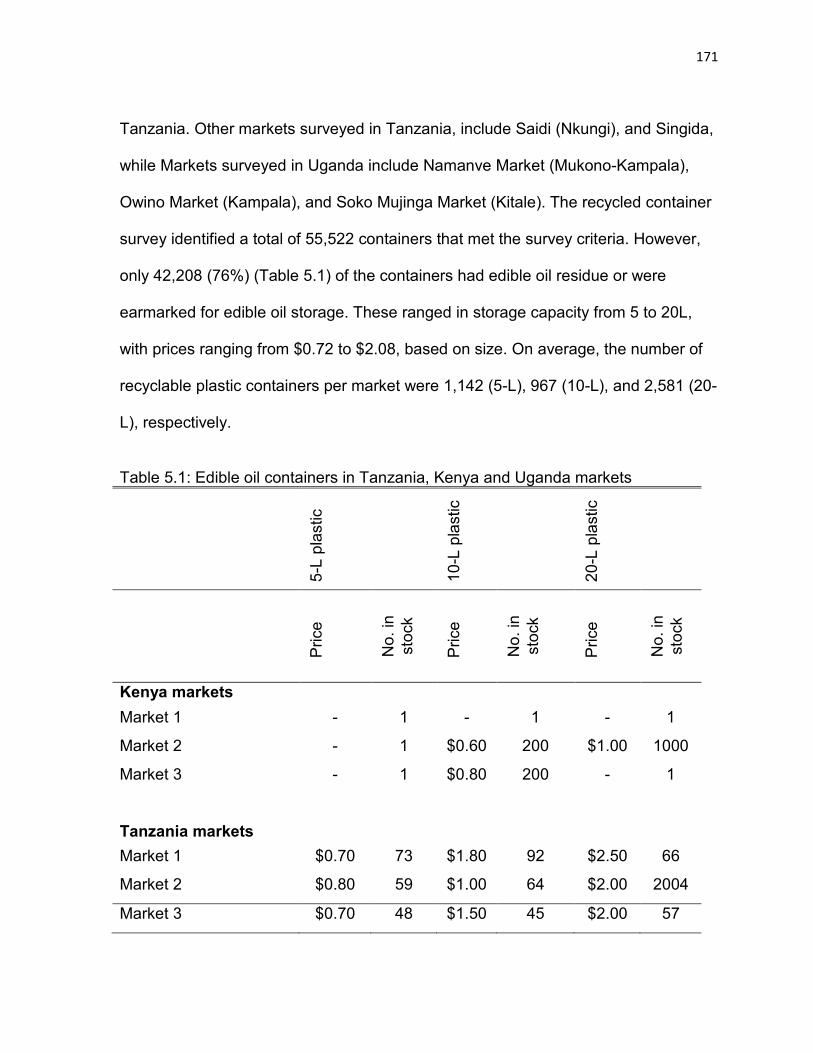
171
Tanzania. Other markets surveyed in Tanzania, include Saidi (Nkungi), and Singida,
while Markets surveyed in Uganda include Namanve Market (Mukono-Kampala),
Owino Market (Kampala), and Soko Mujinga Market (Kitale). The recycled container
survey identified a total of 55,522 containers that met the survey criteria. However,
only 42,208 (76%) (Table 5.1) of the containers had edible oil residue or were
earmarked for edible oil storage. These ranged in storage capacity from 5 to 20L,
with prices ranging from $0.72 to $2.08, based on size. On average, the number of
recyclable plastic containers per market were 1,142 (5-L), 967 (10-L), and 2,581 (20-
L), respectively.
Table 5.1: Edible oil containers in Tanzania, Kenya and Uganda markets
5-L
plas
tic
10-L
pla
stic
20-L
pla
stic
Pric
e
No.
in
stoc
k
Pric
e
No.
in
stoc
k
Pric
e
No.
in
stoc
k Kenya markets
Market 1 - 1 - 1 - 1
Market 2 - 1 $0.60 200 $1.00 1000
Market 3 - 1 $0.80 200 - 1
Tanzania markets Market 1 $0.70 73 $1.80 92 $2.50 66
Market 2 $0.80 59 $1.00 64 $2.00 2004
Market 3 $0.70 48 $1.50 45 $2.00 57
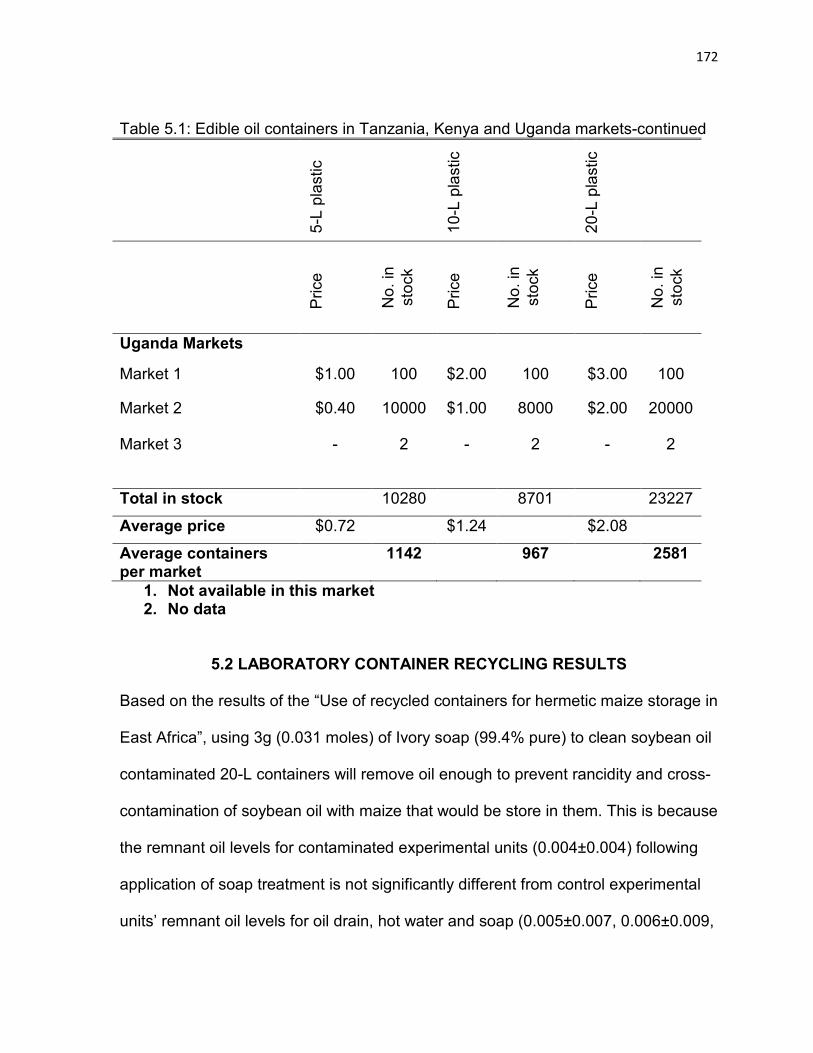
172
Table 5.1: Edible oil containers in Tanzania, Kenya and Uganda markets-continued
5-L
plas
tic
10-L
pla
stic
20-L
pla
stic
Pric
e
No.
in
stoc
k
Pric
e
No.
in
stoc
k
Pric
e
No.
in
stoc
k
Uganda Markets
Market 1 $1.00 100 $2.00 100 $3.00 100
Market 2 $0.40 10000 $1.00 8000 $2.00 20000
Market 3 - 2 - 2 - 2
Total in stock 10280 8701 23227
Average price $0.72 $1.24 $2.08
Average containers per market
1142 967 2581
1. Not available in this market 2. No data
5.2 LABORATORY CONTAINER RECYCLING RESULTS Based on the results of the “Use of recycled containers for hermetic maize storage in
East Africa”, using 3g (0.031 moles) of Ivory soap (99.4% pure) to clean soybean oil
contaminated 20-L containers will remove oil enough to prevent rancidity and cross-
contamination of soybean oil with maize that would be store in them. This is because
the remnant oil levels for contaminated experimental units (0.004±0.004) following
application of soap treatment is not significantly different from control experimental
units’ remnant oil levels for oil drain, hot water and soap (0.005±0.007, 0.006±0.009,
173
0.006±0.001), respectively. Besides, the remnant oil level following cleaning with
soap is within the margin of error. Therefore, it seems that the soap treatment
successfully removed all the oil in the contaminated containers to which they were
applied. For this reason it is safe to recommend that cleaning with soap (and hot
water) of about the same level of purity as the one utilized in this research anywhere
would successfully remove all the oil in a soybean oil contaminated container,
enough to prevent rancidity and the associated health hazards, as well as preserve
maize quality in storage.
These conclusions answer the dissertation’s objectives of testing the integrity of
hermetic storage and the validity of predicted time to complete mortality (PTCM) of
maize weevils, to determine the effects of time of hermetic storage and maize weevil
infestation on maize seed germination. And to (a) assess availability of used
vegetable oil containers in East Africa suitable for hermetic storage of maize, as well
as (b) develop procedures for cleaning the containers.
5.3 STUDIES’ IMPACT
The storage solutions identified through the studies presented in this dissertation
can protect food security, jobs, and local economies, using non-toxic and cost-
effective food storage technologies sustainable in the local culture. This is because
these technologies prevent weevil, mold, and rodent damage to stored maize,
preserving food and seed supply. The ability to prevent economic (quantitative and
qualitative) losses associated with existing maize pests, as demonstrated here
means that farmers no longer need to dispose of their maize right after harvest. And
174
considering that agriculture employs 60 to 80% of the population (Bett and Nguyo,
2007; Minot, 2008), maize accounts for 50% of caloric intake (Sinha, 2007), at least
70% of maize seeds are sourced from prior year’s harvest (Gemeda, et al., 2001;
Dhliwayo, et al., 2003), and chemical maize preservatives used in post-harvest
storage are toxic, costly, and often do not work (Korunic, 1998; IRRI, 2008), the
results of these studies may encourage increased farming in the region.
5.4 RECOMMENDATIONS FOR FUTURE RESEARCH
Possible future research related to those presented in this dissertation includes:
a) Testing the effect of hermetic storage on molds in food storage
b) The effect of other insects (such as larger and smaller brain borer) on food stored under hermetic conditions.
c) Applying cleaning methods presented here to other storage container types.
d) Using other types of soaps for cleaning recycled containers, under conditions similar to and different from those presented in this dissertation.
e) Testing the effect of storage of other crop types and seeds under hermetic conditions.
f) Compare germination rates for seeds primed using cold storage and those primed using hydropriming.

175
APPENDIX A: PREDICTED TIME TO COMPLETE WEEVIL MORTALITY
Appendix A contains information relating to the “predicted time to complete mortality
(PTCM)” research. Appendix A-Table 1.1 to Appendix A-Table 1.4 describes
treatment, experimental designs and analysis of variance for the PTCM research.
Appendix A-Table 1.1: Predicted time to adult weevil mortality treatment design (laboratory research) Storage type Storage time
17 days (80% of baseline)
21 days (baseline or 100%)
26 days (120% of baseline)
Hermetic T1 T2 T3 Non-hermetic T4 T5 T6 Appendix A-Table 1.2 shows arrows going from experimental errors to the factors they test. Appendix A-Table 1.2: Anova key out for Laboratory weevil mortality study at 23°C and 12% moisture
S.V DF Treatment Day Herm Day*Herm
5 2 1 2
Block Level Block (level)
35 2 33
Experimental error (EE): Treatment*block Treatment*level Treatment* block(level)
175 10 165
Corrected total 215
Total 216
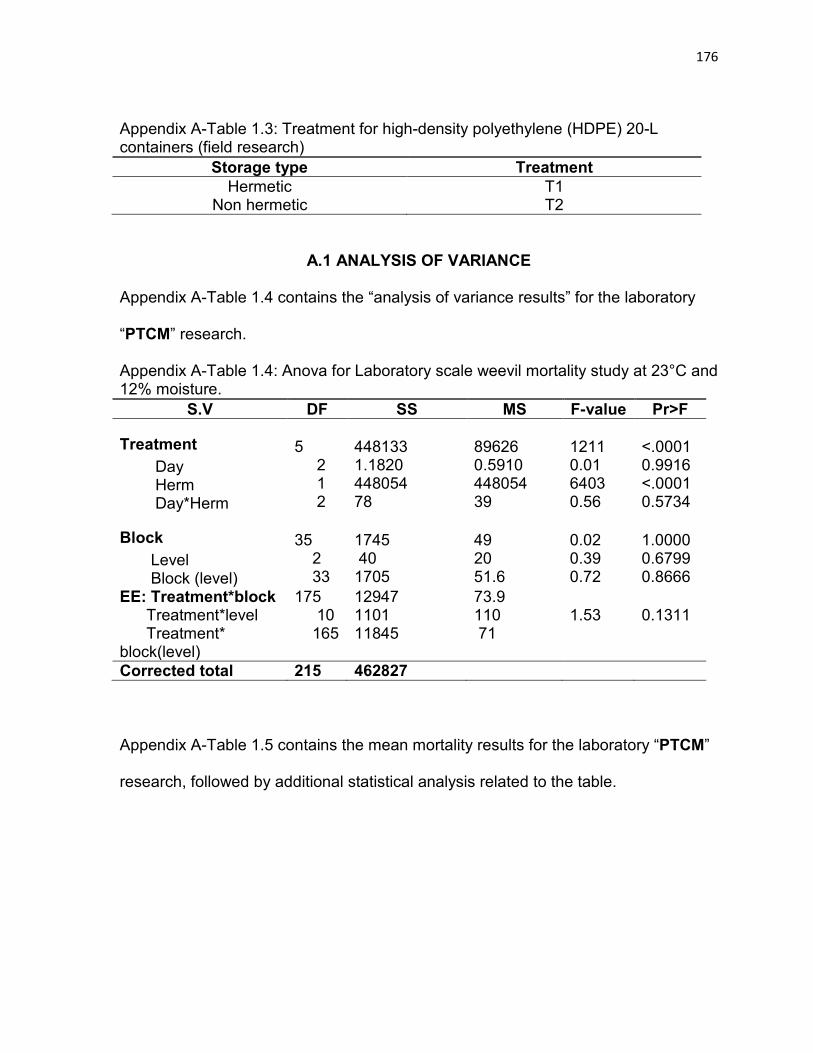
176
Appendix A-Table 1.3: Treatment for high-density polyethylene (HDPE) 20-L containers (field research)
Storage type Treatment Hermetic T1
Non hermetic T2
A.1 ANALYSIS OF VARIANCE
Appendix A-Table 1.4 contains the “analysis of variance results” for the laboratory
“PTCM” research.
Appendix A-Table 1.4: Anova for Laboratory scale weevil mortality study at 23°C and 12% moisture.
S.V DF SS MS F-value Pr>F
Treatment Day Herm Day*Herm
5 2 1 2
448133 1.1820 448054 78
89626 0.5910 448054 39
1211 0.01 6403 0.56
<.0001 0.9916 <.0001 0.5734
Block Level Block (level)
35 2 33
1745 40 1705
49 20 51.6
0.02 0.39 0.72
1.0000 0.6799 0.8666
EE: Treatment*block Treatment*level Treatment* block(level)
175 10 165
12947 1101 11845
73.9 110 71
1.53
0.1311
Corrected total 215 462827
Appendix A-Table 1.5 contains the mean mortality results for the laboratory “PTCM”
research, followed by additional statistical analysis related to the table.

177
Appendix A-Table 1.5: Days to complete weevil mortality in 12% maize stored 23°C (laboratory scale).
Storage type
Treatments (storage times) Percent mortality
Her
met
ic
(mea
n ±
S.E)
17 days (80%) 94.9 ±9.10
21 days (100%) 93.5 ±9.40
26 days (120%) 94.1 ±13.5
Non
-H
erm
etic
(m
ean
± S.
E) 17 days (80%) 2.25 ±3.50
21 days (100%) 3.59 ±5.12
26 days (120%) 3.37 ±5.26
A.2 INTERACTION ANALYSIS A breakdown of the interaction for hermetic treatments suggest insignificance
(p=0.5839, estimated difference= 0.99) for day 17 versus day 21 and 26. The
estimate was calculated as a difference of differences of day 17 versus the average
of days 21 and 26 or 94.97-((93.46+94.50)/2).
Interaction was also insignificant (p=0.5566, estimated difference=1.4) for day 17
versus 21, day 17 versus 26 (p=0.7182, estimated difference=0.8), and day 21
versus 26 (p=0.5566, estimated difference=0.6).
A breakdown of interactions for non-hermetic treatments among days, also suggests
insignificance (p=0. 2005, estimated difference=1.2) for day 17 versus day 21 and
26, as well as insignificant (p=0.2268, estimated difference=1.3),
day 17 versus 21, day 17 versus 26 (p=0.3122, estimated difference=1.1), and day
21 versus 26 (p=0.2268, estimated difference=0.2).

178
There are also no clear treatment by level interaction effects (p<0.1311), since
mortality for hermetic and non-hermetic interactions for all levels of days (17, 21, and
26) are insignificant.
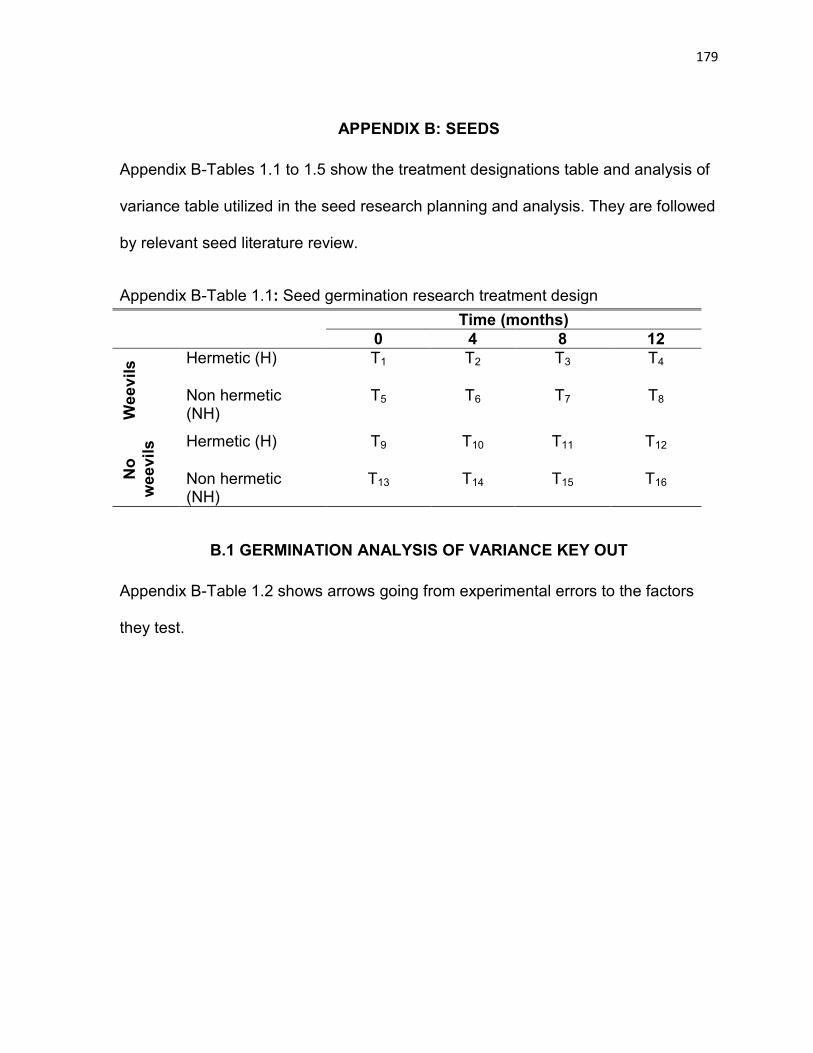
179
APPENDIX B: SEEDS Appendix B-Tables 1.1 to 1.5 show the treatment designations table and analysis of
variance table utilized in the seed research planning and analysis. They are followed
by relevant seed literature review.
Appendix B-Table 1.1: Seed germination research treatment design Time (months)
0 4 8 12
Wee
vils
Hermetic (H) T1 T2 T3 T4
Non hermetic (NH)
T5 T6 T7 T8
No
wee
vils
Hermetic (H) T9 T10 T11 T12
Non hermetic (NH)
T13 T14 T15 T16
B.1 GERMINATION ANALYSIS OF VARIANCE KEY OUT Appendix B-Table 1.2 shows arrows going from experimental errors to the factors they test.
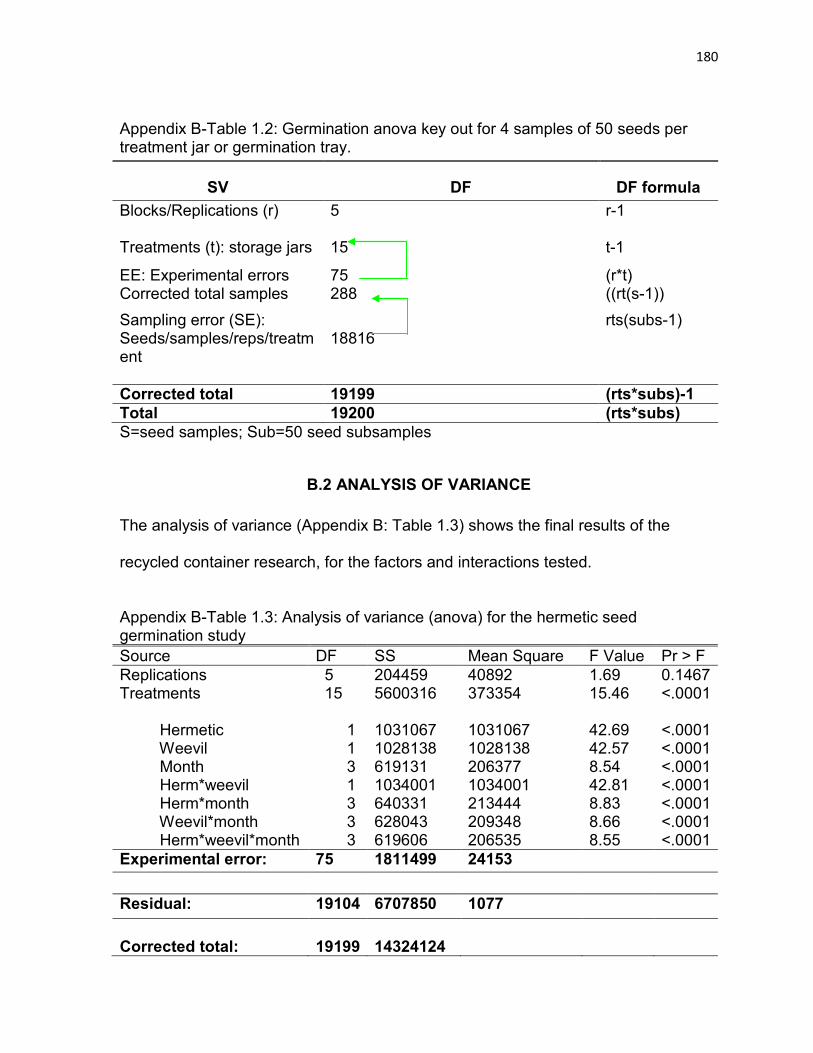
180
Appendix B-Table 1.2: Germination anova key out for 4 samples of 50 seeds per treatment jar or germination tray.
SV DF DF formula Blocks/Replications (r) 5
r-1
Treatments (t): storage jars 15 t-1
EE: Experimental errors 75 (r*t) Corrected total samples 288 ((rt(s-1)) Sampling error (SE): Seeds/samples/reps/treatment
18816
rts(subs-1)
Corrected total 19199 (rts*subs)-1 Total 19200 (rts*subs) S=seed samples; Sub=50 seed subsamples
B.2 ANALYSIS OF VARIANCE The analysis of variance (Appendix B: Table 1.3) shows the final results of the
recycled container research, for the factors and interactions tested.
Appendix B-Table 1.3: Analysis of variance (anova) for the hermetic seed germination study Source DF SS Mean Square F Value Pr > F Replications 5 204459 40892 1.69 0.1467 Treatments Hermetic Weevil Month Herm*weevil Herm*month Weevil*month Herm*weevil*month
15 1 1 3 1 3 3 3
5600316 1031067 1028138 619131 1034001 640331 628043 619606
373354 1031067 1028138 206377 1034001 213444 209348 206535
15.46 42.69 42.57 8.54 42.81 8.83 8.66 8.55
<.0001 <.0001 <.0001 <.0001 <.0001 <.0001 <.0001 <.0001
Experimental error: 75 1811499 24153 Residual: 19104 6707850 1077 Corrected total:
19199
14324124
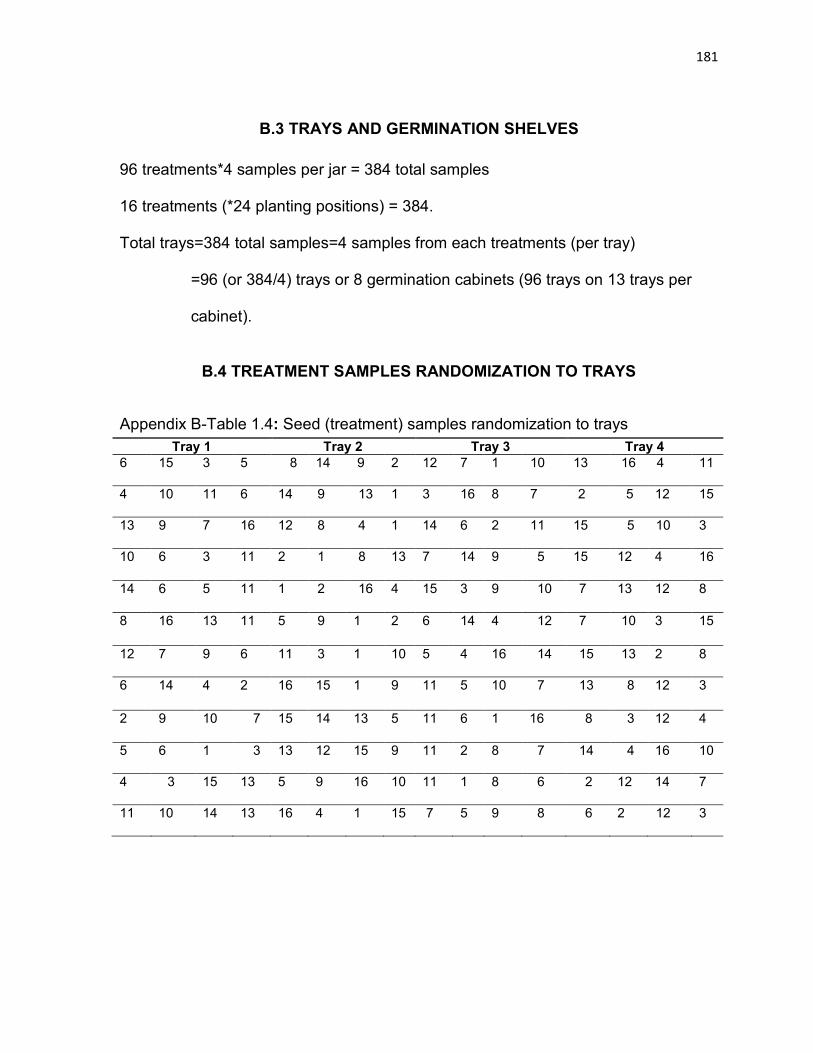
181
B.3 TRAYS AND GERMINATION SHELVES 96 treatments*4 samples per jar = 384 total samples
16 treatments (*24 planting positions) = 384.
Total trays=384 total samples=4 samples from each treatments (per tray)
=96 (or 384/4) trays or 8 germination cabinets (96 trays on 13 trays per
cabinet).
B.4 TREATMENT SAMPLES RANDOMIZATION TO TRAYS
Appendix B-Table 1.4: Seed (treatment) samples randomization to trays Tray 1 Tray 2 Tray 3 Tray 4
6 15 3 5 8 14
9
2 12 7 1 10 13 16 4 11
4 10 11 6 14 9 13 1 3 16 8 7 2 5 12 15
13 9 7 16 12 8 4 1 14 6 2 11 15 5 10 3
10 6 3 11 2
1
8
13 7 14 9 5 15 12 4 16
14 6 5 11 1
2
16
4 15 3 9 10 7 13 12 8
8 16 13 11 5
9
1
2 6 14 4 12 7 10 3 15
12 7 9 6 11 3 1 10 5 4 16 14 15 13 2 8
6 14 4 2 16 15
1
9 11 5 10 7 13 8 12 3
2 9 10 7 15 14
13
5 11 6 1 16 8 3 12 4
5 6 1 3 13 12
15
9 11 2 8 7 14 4 16 10
4 3 15 13 5 9 16 10 11 1 8 6 2 12 14 7
11 10 14 13 16 4 1 15 7 5 9 8 6 2 12 3

182
Appendix B-Table 1.4: Seed (treatment) samples randomization to trays-continued Tray 1 Tray 2 Tray 3 Tray 4
7 5 4 12 2 15 16
11 8 3 14 9 1 10 6 13
10 1 13 7 3 11 12 14 6 16 9 5 4 15 8 2
9 10 15 7 5 13 1 16
14
8
2
4
11
3
12
6
6 16 4 10 5 15 7 11 13 14 2 8 9 12 3 1
1 9 5 16 10 6 2 11
15
4
14
13
3
7
12
8
7 10 5 6 9 15 13 11
8
1
4
2
3
12
16
14
7 8 6 3 14 16 4 10
2
15
1
9
5
12
13
11
12 2 15 1 7 6 10 4
9
8
1
11
16
13
5
3
12 11 5 1 14 2 16 9
13
8
6
15
4
10
7
3
6 5 10 4 2 11 13 1
7
9
14
12
15
3
16
8
5 3 7 13 10 9 4 1
14
8
16
15
2
6
11
12
12 11 8 2 5 1 4 13
3
16
9
10
14
7
15
6
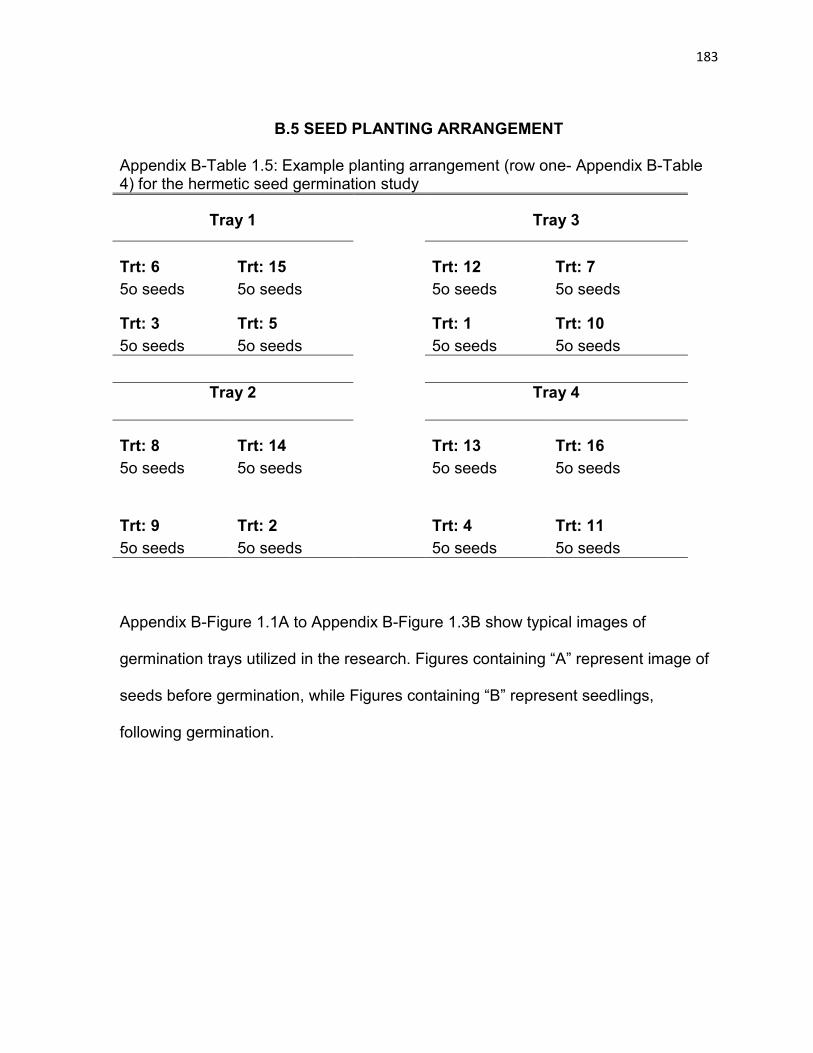
183
B.5 SEED PLANTING ARRANGEMENT Appendix B-Table 1.5: Example planting arrangement (row one- Appendix B-Table 4) for the hermetic seed germination study
Tray 1 Tray 3
Trt: 6 5o seeds
Trt: 15 5o seeds
Trt: 12 5o seeds
Trt: 7 5o seeds
Trt: 3 5o seeds
Trt: 5 5o seeds
Trt: 1 5o seeds
Trt: 10 5o seeds
Tray 2 Tray 4
Trt: 8 5o seeds
Trt: 14 5o seeds
Trt: 13 5o seeds
Trt: 16 5o seeds
Trt: 9 5o seeds
Trt: 2 5o seeds
Trt: 4 5o seeds
Trt: 11 5o seeds
Appendix B-Figure 1.1A to Appendix B-Figure 1.3B show typical images of
germination trays utilized in the research. Figures containing “A” represent image of
seeds before germination, while Figures containing “B” represent seedlings,
following germination.

184
Appendix B-Figure 1.1A. Typical initial germination result for treatments T1, T2, T3, T4, T5, T9, T10, T11, T12, T13, T14, T15, and T16 of the hermetic seed germination study.
Appendix B-Figure 1.1B. Typical final germination result for treatments T1, T2, T3, T4, T5, T9, T10, T11, T12, T13, T14, T15, and T16 of the hermetic seed germination study.
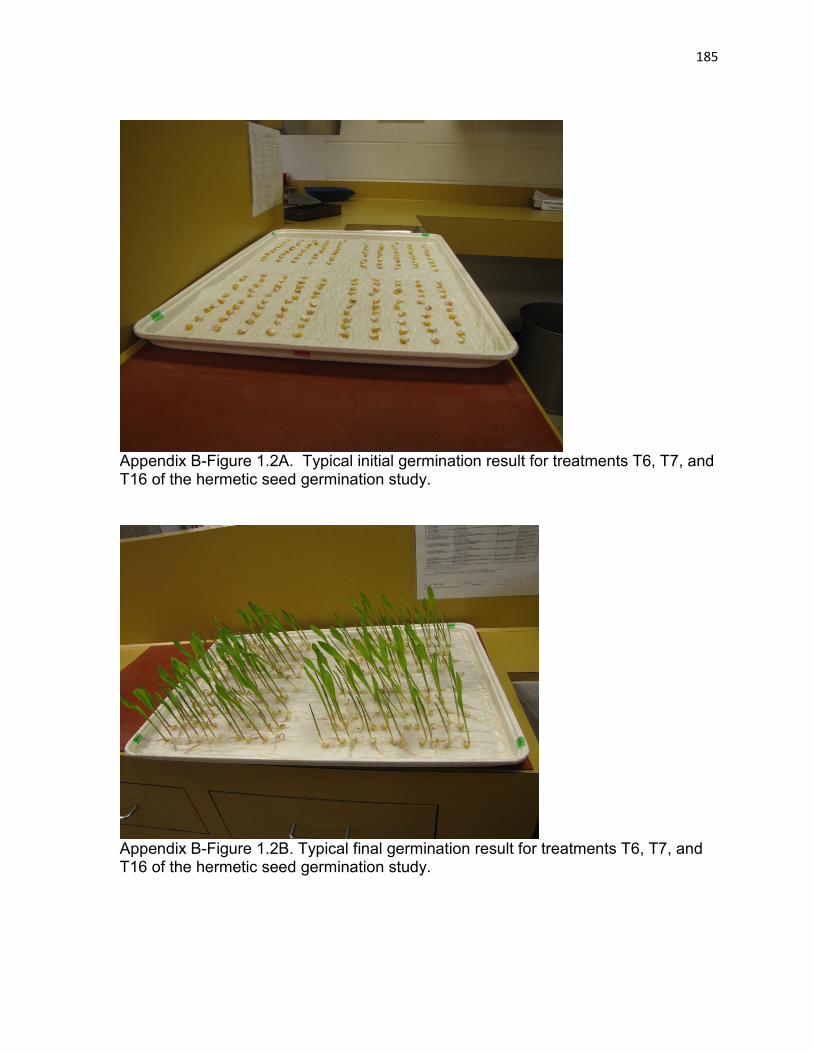
185
Appendix B-Figure 1.2A. Typical initial germination result for treatments T6, T7, and T16 of the hermetic seed germination study.
Appendix B-Figure 1.2B. Typical final germination result for treatments T6, T7, and T16 of the hermetic seed germination study.

186
Appendix B-Figure 1.3A. Typical initial germination result for treatment T8, and T16 of the hermetic seed germination study.
Appendix B-Figure 1.3B. Typical final germination result for treatment T8 and T16 of the hermetic seed germination study.
187
B.6 FURTHER HERMETIC SEED GERMINATION ANALYSIS
For hermetic treatments, a breakdown of hermetic by weevil by month interaction
effects with weevils suggests insignificance (p=0.7749, estimated difference= 0.07)
for month zero versus month 4, 8, and 12. The estimate was calculated as a
difference of differences of month zero versus the average of months 4, 8 and 12 or
92.2-((98.8+99.7+99.3)/3).
Interactions were also insignificant (p=0.2431, estimated difference=0.4) for month
zero versus 4, month zero versus 8 (p=0.1613, estimated difference=0.5), month
zero versus 12 (p=0.6406, estimated difference=0.2), month 4 versus 12 (p=0.1023,
estimated difference=0.6), and month 8 versus 12 (p=0.3504, estimated
difference=0.3). Interactions were, however, slightly significant for months 4 versus 8
(p=0.0103, estimated difference=0.92).
For non-hermetic treatments with weevils, a breakdown of hermetic by weevil by
month interaction effects suggest significance (p<.0001, estimated difference= 39.2)
for month 0 versus month 4, 8, and 12. Interaction were also significant (p<.0001,
estimated difference=26.9) for month zero versus 4, month zero versus 8 (p<.0001,
estimated difference=26.3), month zero versus 12 (p<.0001, estimated
difference=64.2), month 4 versus 12 (p<.0001, estimated difference=37.3), and
month 8 versus 12 (p<.0001, estimated difference=37.8). However interaction was
insignificant for month 4 versus 8 (p=0.7195, estimated difference=0.6).
For hermetic treatments, without weevils, a breakdown of hermetic by weevil by
month interaction effects suggest insignificance (p=0.9267, estimated difference=
188
0.03) for month zero versus month 4, 8, and 12. Interactions were also insignificant
(p=0.6494, estimated difference=0.2) for month zero versus 4, month zero versus 8
(p=0.8186, estimated difference=0.1), month zero versus 12 (p=0.3633, estimated
difference=0.3), month 4 versus 8 (p=0.8218, estimated difference=0.1), month 4
versus 12 (p=0.1727, estimated difference=0.5), and month 8 versus 12 (p=0.2550,
estimated difference=0.4).
For non-hermetic treatments, without weevils, a breakdown of hermetic by weevil by
month interaction effects, across months, suggests insignificance for month zero
versus month 4, 8, and 12 (p=0.5728, estimated difference= 0.2). Interactions were
also insignificant (p=0.8179, estimated difference=0.1) for month zero versus 4,
month zero versus 8 (p=0.4898, estimated difference=0.3), month zero versus 12
(p=0.6452, estimated difference=0.2), months versus 8 (p=0.6452, estimated
difference=0.2), month 4 versus 12 (p=0.8179, estimated difference=0.1), and month
8 versus 12 (p=0.8179, estimated difference=0.1).
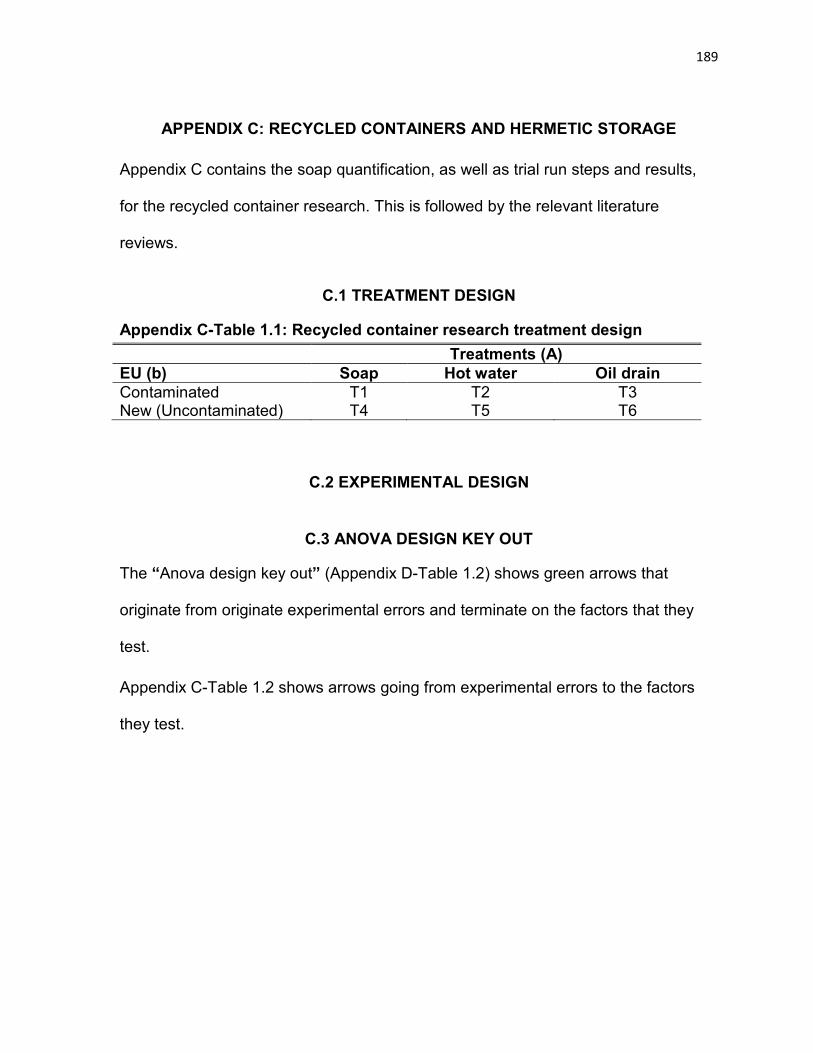
189
APPENDIX C: RECYCLED CONTAINERS AND HERMETIC STORAGE Appendix C contains the soap quantification, as well as trial run steps and results,
for the recycled container research. This is followed by the relevant literature
reviews.
C.1 TREATMENT DESIGN
Appendix C-Table 1.1: Recycled container research treatment design Treatments (A) EU (b) Soap Hot water Oil drain Contaminated T1 T2 T3 New (Uncontaminated) T4 T5 T6
C.2 EXPERIMENTAL DESIGN
C.3 ANOVA DESIGN KEY OUT
The “Anova design key out” (Appendix D-Table 1.2) shows green arrows that
originate from originate experimental errors and terminate on the factors that they
test.
Appendix C-Table 1.2 shows arrows going from experimental errors to the factors they test.

190
Appendix C-Table 1. 2: Anova design key out (Split plot) for the recycled container research
SV DF DF Blocks (B) (r-1) 5 Treatments (T) (t-1) 5 Method (m) (m-1) 2 Container (c) (c-1) 1 m*c (m-1)*(c-1) 2 Error A: Ea (r-1)*(t-1) 25 Location (l) (l-1) 2 Location*Treatment (l-1)*(t-1) 10 L*m (l-1)*(m-1) 4 w*c (w-1)*(c-1) 2 w*m*c (w-1)*(m-1)*(c-1) 4 Error B: Eb t(r-1)*(w-1) 60 Corrected total (samples) trw(s-1) 107 Total (# of samples) (abrw*1)-1 108
C.4 METHODS AND MATERIALS C.4.1 Soap quantification 0.1 gram Ivory soap was utilized in cleaning the oil-containated interior of three pint-
sized Kerr, glass canning jars, in a soap pre-quantification exercise. However, the
glass canning jars utilized in the soap prequantification excercise could only
withstand the soap and water at 45°C, but shattered when the soap and hot water
treatment (90-100°C) was applied. This made it impossible to obtain initial
knowledge of the soap and hot water treatment effect. Therefore, soap pre-
191
quantification was redone using steel canisters (MS10-039-390-14, Mainstays,
Bentonville, AR 72716) and both pre-quantification treatments.
The soap pre-quantification was done by weighing the canisters, pouring soybean oil
into each one, allowing the oil to soil their interior, then turning them upside down to
allow the excess oil to collect unto folded napkins. Once the oil had drained,
additional excess oil was wiped off and canisters were weighed again. Subtracting
both weights from each other gave an estimate of the weight of the oil, in the
canister. A small quantity of Ivory soap (0.1 g) that was not expected to completely
remove this quantity of oil was utilized in cleaning the canisters. At the end of the
cleaning, the percentage of oil removed was calculated (Appendix D-Table 3 to 7).
From the initial soap quantification experiment, it was determined that 1 g of soap
removed most almost 1 gram of oil, from the canister. But three times that amount of
soap (3 g) was utilized for cleaning the 20-L containers, to account for the variability
in the history of 20-L containers collected from the field. This helped rid the EU
interior completely of oil and is an acceptable practice, where a reasonable excess
of material (Markley, K.S, 1951; Truman, 2009; Devor, et al., 2007;
Sohb, 2008) may be utilized in cleaning oil remnants.
C.5 RESULTS AND DISCUSSION
C.5.1 Steel canister cleaning results
Using 0.1 g Ivory soap worked well in removing all the oil (~1g) from pint-sized Kerr,
glass canning jars. Appendix D-Tables 3 to 7 shows that this was not the case when
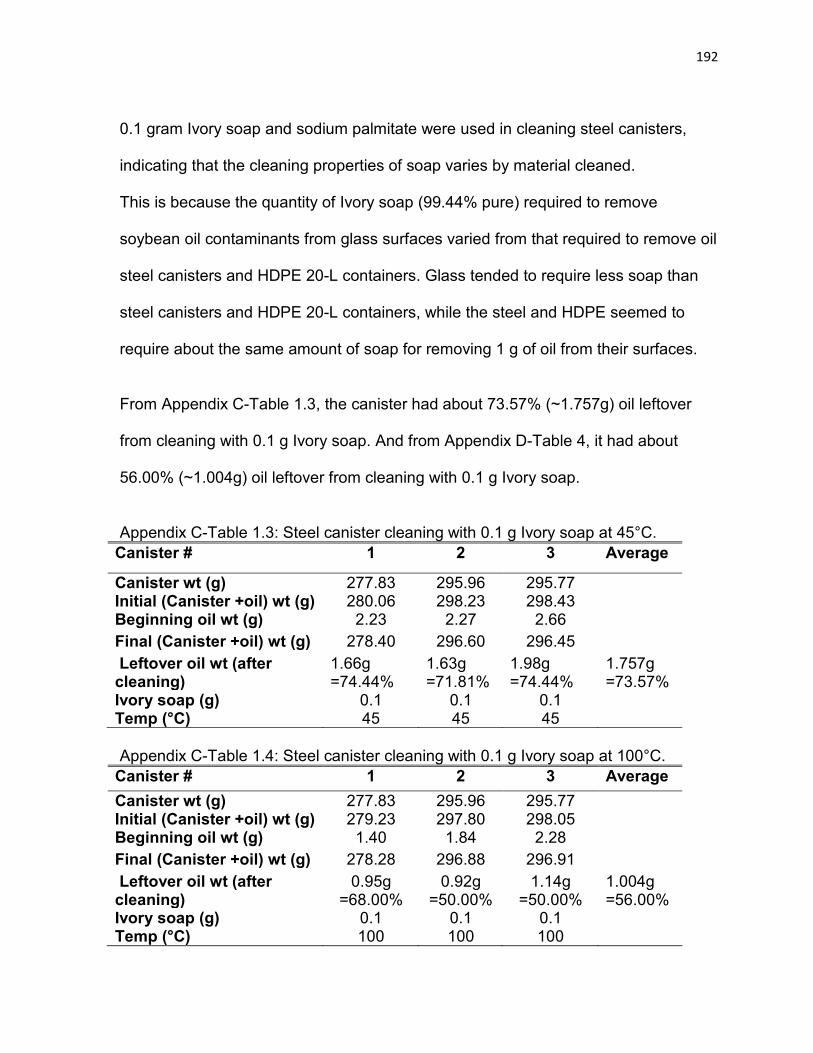
192
0.1 gram Ivory soap and sodium palmitate were used in cleaning steel canisters,
indicating that the cleaning properties of soap varies by material cleaned.
This is because the quantity of Ivory soap (99.44% pure) required to remove
soybean oil contaminants from glass surfaces varied from that required to remove oil
steel canisters and HDPE 20-L containers. Glass tended to require less soap than
steel canisters and HDPE 20-L containers, while the steel and HDPE seemed to
require about the same amount of soap for removing 1 g of oil from their surfaces.
From Appendix C-Table 1.3, the canister had about 73.57% (~1.757g) oil leftover
from cleaning with 0.1 g Ivory soap. And from Appendix D-Table 4, it had about
56.00% (~1.004g) oil leftover from cleaning with 0.1 g Ivory soap.
Appendix C-Table 1.3: Steel canister cleaning with 0.1 g Ivory soap at 45°C.
Canister # 1 2 3 Average
Canister wt (g) 277.83 295.96 295.77 Initial (Canister +oil) wt (g) 280.06 298.23 298.43 Beginning oil wt (g) 2.23 2.27 2.66 Final (Canister +oil) wt (g) 278.40 296.60 296.45 Leftover oil wt (after cleaning)
1.66g =74.44%
1.63g =71.81%
1.98g =74.44%
1.757g =73.57%
Ivory soap (g) 0.1 0.1 0.1 Temp (°C) 45 45 45 Appendix C-Table 1.4: Steel canister cleaning with 0.1 g Ivory soap at 100°C.
Canister # 1 2 3 Average Canister wt (g) 277.83 295.96 295.77 Initial (Canister +oil) wt (g) 279.23 297.80 298.05 Beginning oil wt (g) 1.40 1.84 2.28 Final (Canister +oil) wt (g) 278.28 296.88 296.91 Leftover oil wt (after cleaning)
0.95g =68.00%
0.92g =50.00%
1.14g =50.00%
1.004g =56.00%
Ivory soap (g) 0.1 0.1 0.1 Temp (°C) 100 100 100
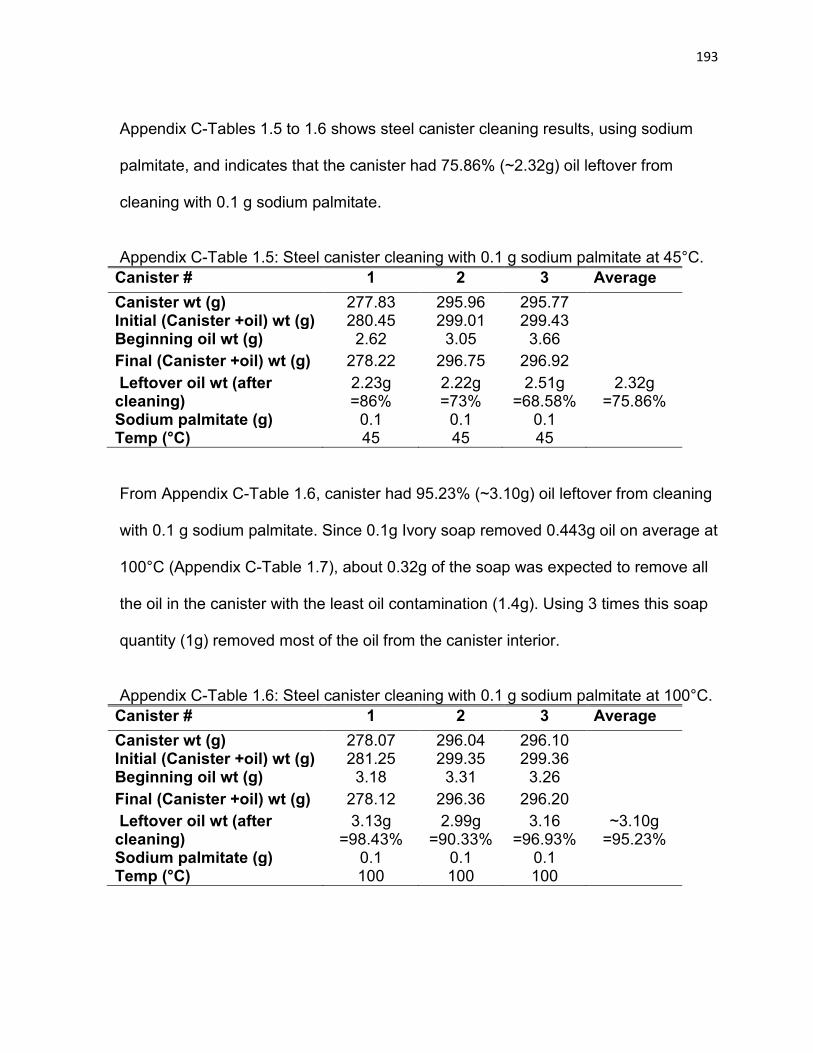
193
Appendix C-Tables 1.5 to 1.6 shows steel canister cleaning results, using sodium
palmitate, and indicates that the canister had 75.86% (~2.32g) oil leftover from
cleaning with 0.1 g sodium palmitate.
Appendix C-Table 1.5: Steel canister cleaning with 0.1 g sodium palmitate at 45°C.
Canister # 1 2 3 Average Canister wt (g) 277.83 295.96 295.77 Initial (Canister +oil) wt (g) 280.45 299.01 299.43 Beginning oil wt (g) 2.62 3.05 3.66 Final (Canister +oil) wt (g) 278.22 296.75 296.92 Leftover oil wt (after cleaning)
2.23g =86%
2.22g =73%
2.51g =68.58%
2.32g =75.86%
Sodium palmitate (g) 0.1 0.1 0.1 Temp (°C) 45 45 45 From Appendix C-Table 1.6, canister had 95.23% (~3.10g) oil leftover from cleaning
with 0.1 g sodium palmitate. Since 0.1g Ivory soap removed 0.443g oil on average at
100°C (Appendix C-Table 1.7), about 0.32g of the soap was expected to remove all
the oil in the canister with the least oil contamination (1.4g). Using 3 times this soap
quantity (1g) removed most of the oil from the canister interior.
Appendix C-Table 1.6: Steel canister cleaning with 0.1 g sodium palmitate at 100°C.
Canister # 1 2 3 Average Canister wt (g) 278.07 296.04 296.10 Initial (Canister +oil) wt (g) 281.25 299.35 299.36 Beginning oil wt (g) 3.18 3.31 3.26 Final (Canister +oil) wt (g) 278.12 296.36 296.20 Leftover oil wt (after cleaning)
3.13g =98.43%
2.99g =90.33%
3.16 =96.93%
~3.10g =95.23%
Sodium palmitate (g) 0.1 0.1 0.1 Temp (°C) 100 100 100
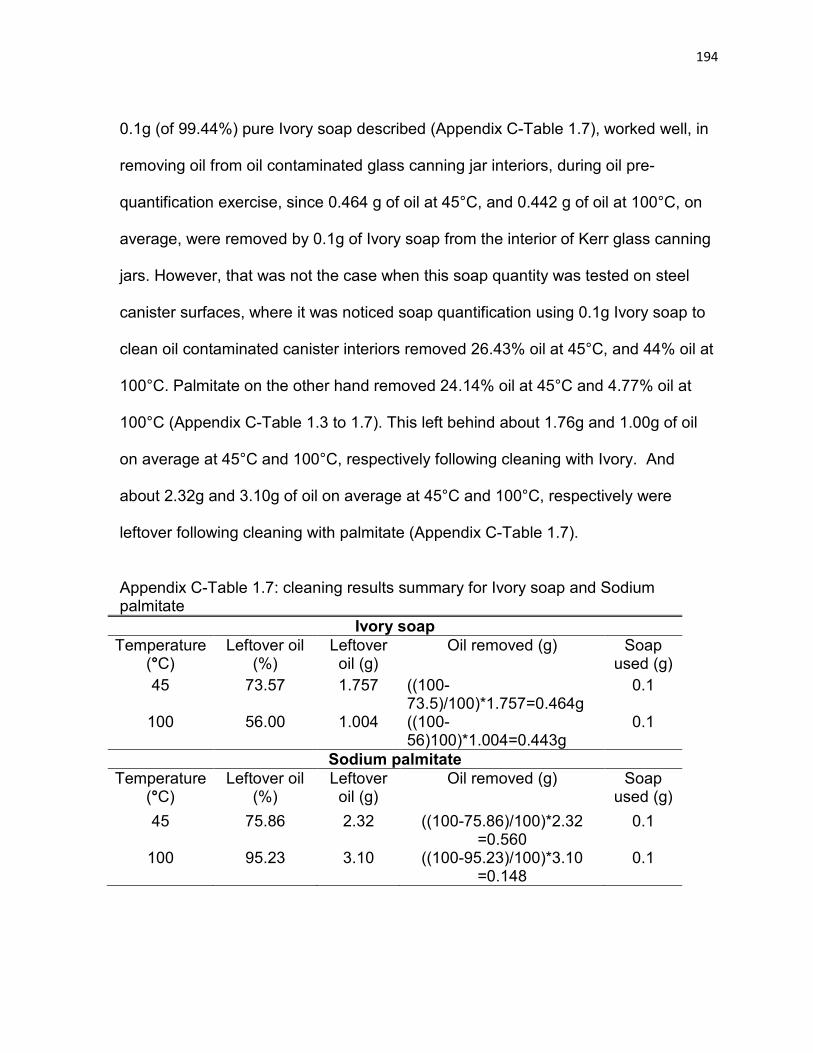
194
0.1g (of 99.44%) pure Ivory soap described (Appendix C-Table 1.7), worked well, in
removing oil from oil contaminated glass canning jar interiors, during oil pre-
quantification exercise, since 0.464 g of oil at 45°C, and 0.442 g of oil at 100°C, on
average, were removed by 0.1g of Ivory soap from the interior of Kerr glass canning
jars. However, that was not the case when this soap quantity was tested on steel
canister surfaces, where it was noticed soap quantification using 0.1g Ivory soap to
clean oil contaminated canister interiors removed 26.43% oil at 45°C, and 44% oil at
100°C. Palmitate on the other hand removed 24.14% oil at 45°C and 4.77% oil at
100°C (Appendix C-Table 1.3 to 1.7). This left behind about 1.76g and 1.00g of oil
on average at 45°C and 100°C, respectively following cleaning with Ivory. And
about 2.32g and 3.10g of oil on average at 45°C and 100°C, respectively were
leftover following cleaning with palmitate (Appendix C-Table 1.7).
Appendix C-Table 1.7: cleaning results summary for Ivory soap and Sodium palmitate
Ivory soap Temperature
(°C) Leftover oil
(%) Leftover oil (g)
Oil removed (g) Soap used (g)
45 73.57 1.757 ((100-73.5)/100)*1.757=0.464g
0.1
100 56.00 1.004 ((100-56)100)*1.004=0.443g
0.1
Sodium palmitate Temperature
(°C) Leftover oil
(%) Leftover oil (g)
Oil removed (g) Soap used (g)
45 75.86 2.32 ((100-75.86)/100)*2.32 =0.560
0.1
100 95.23 3.10 ((100-95.23)/100)*3.10 =0.148
0.1
195
C.5.2 Trial run
Six quart-sized canning jars were labeled 1 to 6 and assigned to the 20-L containers
that they were intended to be used with. Ivory soap was measured out based on the
derived soap to oil ratio and prior knowledge of the quantity of each 20-L container’s
oil remnant. The measured soaps were crushed before placing them in their
designated jars, following which each was filled half-way with distilled water, shaken
in a gentle swirl and left standing overnight to allow for mixing of the soap and water.
Three of the 20-L containers were assigned to 45°C temperature (and soap
treatment), while the other three were assigned to 100°C (and soap treatment), for
use in testing the cleaning effect of the derived oil to soap ratio at 45°C, as well as at
100°C (Sebastião et al., 2006, Bader, 2010, ACS, 2011).
Water was heated to 45°C and 100°C, respectively for use in the assigned 20-L
containers and temperatures were confirmed using a kitchen thermometer (GT100R,
TEL-TRU manufacturing company, Rochester, N.Y.). Prior to adding water to the 20-
L containers, the canning jar content assigned to each 20-L container was emptied
into it. 3.78L of water (at the desired temperature) was then added to each 20-L
container, capped lightly (to prevent pressure buildup) and shaken to force soap
lather to fill the entire 20-L container interior. Thereafter, gentle swirling motion was
utilized, every 5 minutes for 1.5h, to dislodge the oil. This is because 20-L HDPE
container interiors could not be scrubbed directly, due to their narrow opening. At the
end of 1.5h, the 20-L containers were filled with deionized water (Wilson, et al.,
1999) at the required temperature, for rinsing. Additional water was added
continually to make the water overflow, and force the soap lather out of the 20-L
196
HDPE container. Once all the lather had left the 20-L HDPE container, the water
was poured out, and 3.78L of deionized water was added to the 20-L HDPE
container, shaken and emptied. Another 3.78L of deionized water was added a
second time, and the 20-L container was again shaken and emptied to rinse out the
soap completely. Before rinsing each 20-L HDPE container, some of its soap was
used along with sponge to scrub the 20-L HDPE container’s neck and cover.
The trial run confirmed that 3g (0.031 mole) of 99.44% pure Ivory soap was enough
to adequately remove each gram (0.001 mole) of remnant soybean oil from their
assigned 20-L HDPE containers, at 100°C.
C.5.3 Conclusion Using about 1g of Ivory soap per gram of soybean oil contamination removed almost
1g oil from the canister interior, but to ensure complete clean, remove all the oil and
avoid rancidity that may result from leftover oil, three times that amount of Ivory soap
(3g) was hypothesized to completely remove each gram of oil from the steel canister
interior. It was also hypothesized that the same soap to oil ratio would apply to the
(HDPE) 20-L containers that needed to be cleaned in the trial and full runs of this
research. This soap quantity (3g/g oil) was also expected to account for the
variability associated with the history of 20-L containers collected from the field, and
help rid the EU interior completely of oil.
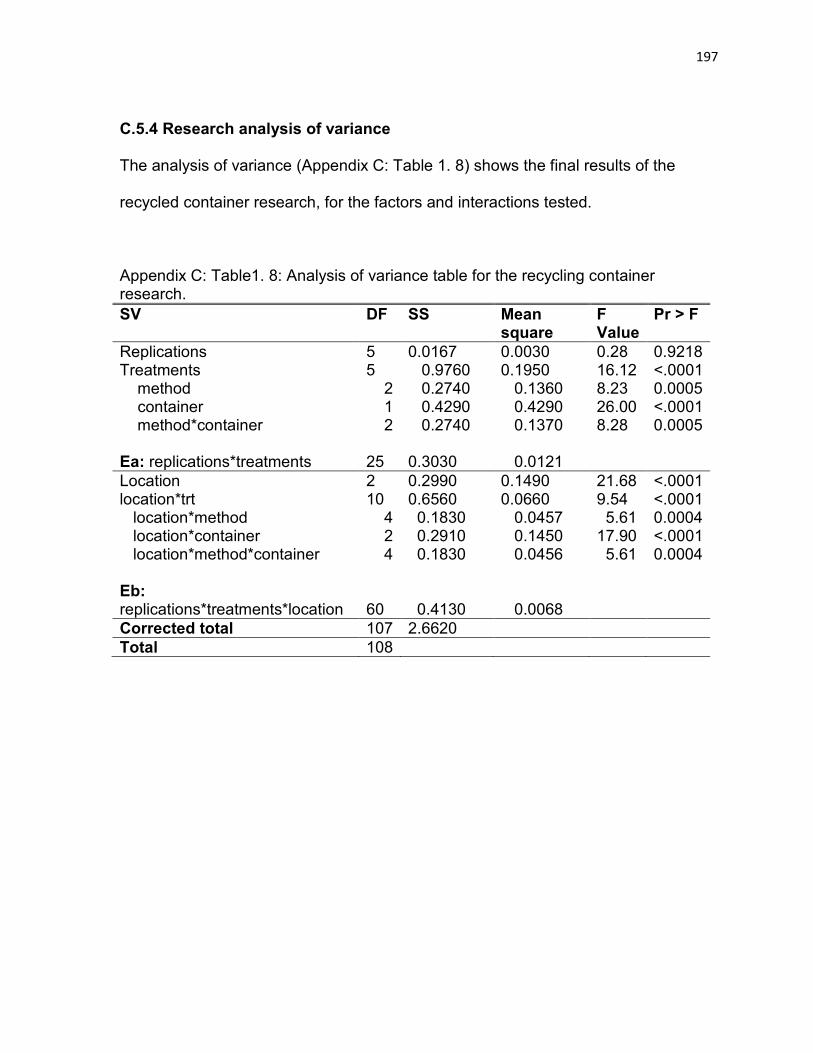
197
C.5.4 Research analysis of variance The analysis of variance (Appendix C: Table 1. 8) shows the final results of the
recycled container research, for the factors and interactions tested.
Appendix C: Table1. 8: Analysis of variance table for the recycling container research. SV DF SS Mean
square F Value
Pr > F
Replications Treatments method container method*container Ea: replications*treatments
5 5 2 1 2 25
0.0167 0.9760 0.2740 0.4290 0.2740 0.3030
0.0030 0.1950 0.1360 0.4290 0.1370 0.0121
0.28 16.12 8.23 26.00 8.28
0.9218 <.0001 0.0005 <.0001 0.0005
Location location*trt location*method location*container location*method*container Eb: replications*treatments*location
2 10 4 2 4 60
0.2990 0.6560 0.1830 0.2910 0.1830 0.4130
0.1490 0.0660 0.0457 0.1450 0.0456 0.0068
21.68 9.54 5.61 17.90 5.61
<.0001 <.0001 0.0004 <.0001 0.0004
Corrected total 107 2.6620 Total 108

198
APPENDIX D: RECYCLED CONTAINER SURVEY Presented below are survey forms and attachments (pictures), as presented by
various surveyors. They are organized in alphabetical order of the countries
surveyed. The contents of the survey table and comments have been left as
submitted by the surveyors.
D.1 KENYA
a) Recycled container survey form Ali Yakubu ([email protected]) Carl Bern ([email protected]) Agricultural and Biosystems Engineering, Iowa State University Date: 14th October 2011 Conducted by: Anne Mukudi Email: [email protected] Purpose of survey: to identify containers available in African markets that can be recycled and used for maize storage by subsistence farmers. Containers should be at least 5 L in capacity and airtight (no holes). (1) Please visit at least 3 markets (2) Please, attach extra sheets of paper as necessary (3)Please attach or email pictures, where possible.. Market or Store: Jua Kali Drum Dealers- Factory Street-City Stadium City: Nairobi-Kenya.
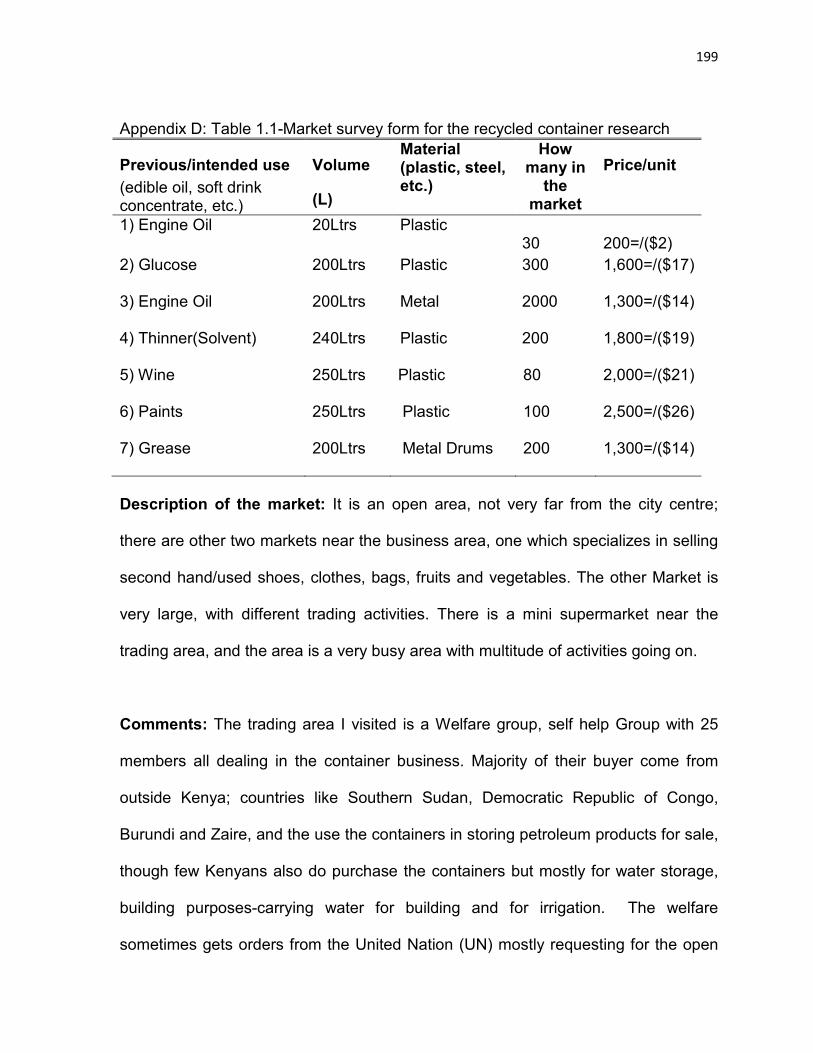
199
Appendix D: Table 1.1-Market survey form for the recycled container research
Previous/intended use (edible oil, soft drink concentrate, etc.)
Volume
(L)
Material (plastic, steel, etc.)
How many in
the market
Price/unit
1) Engine Oil 20Ltrs Plastic 30
200=/($2)
2) Glucose
200Ltrs Plastic 300 1,600=/($17)
3) Engine Oil
200Ltrs Metal 2000 1,300=/($14)
4) Thinner(Solvent) 240Ltrs Plastic 200 1,800=/($19)
5) Wine
250Ltrs Plastic 80 2,000=/($21)
6) Paints
250Ltrs Plastic 100 2,500=/($26)
7) Grease
200Ltrs Metal Drums 200 1,300=/($14)
Description of the market: It is an open area, not very far from the city centre;
there are other two markets near the business area, one which specializes in selling
second hand/used shoes, clothes, bags, fruits and vegetables. The other Market is
very large, with different trading activities. There is a mini supermarket near the
trading area, and the area is a very busy area with multitude of activities going on.
Comments: The trading area I visited is a Welfare group, self help Group with 25
members all dealing in the container business. Majority of their buyer come from
outside Kenya; countries like Southern Sudan, Democratic Republic of Congo,
Burundi and Zaire, and the use the containers in storing petroleum products for sale,
though few Kenyans also do purchase the containers but mostly for water storage,
building purposes-carrying water for building and for irrigation. The welfare
sometimes gets orders from the United Nation (UN) mostly requesting for the open
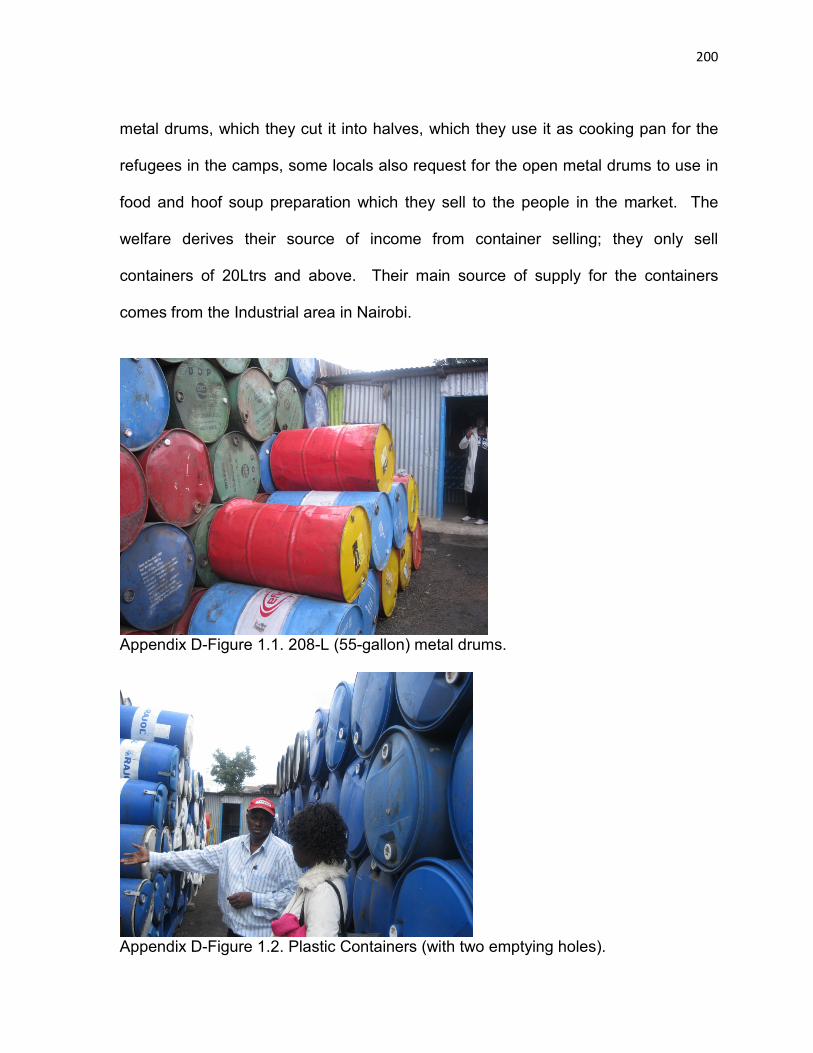
200
metal drums, which they cut it into halves, which they use it as cooking pan for the
refugees in the camps, some locals also request for the open metal drums to use in
food and hoof soup preparation which they sell to the people in the market. The
welfare derives their source of income from container selling; they only sell
containers of 20Ltrs and above. Their main source of supply for the containers
comes from the Industrial area in Nairobi.
Appendix D-Figure 1.1. 208-L (55-gallon) metal drums.
Appendix D-Figure 1.2. Plastic Containers (with two emptying holes).
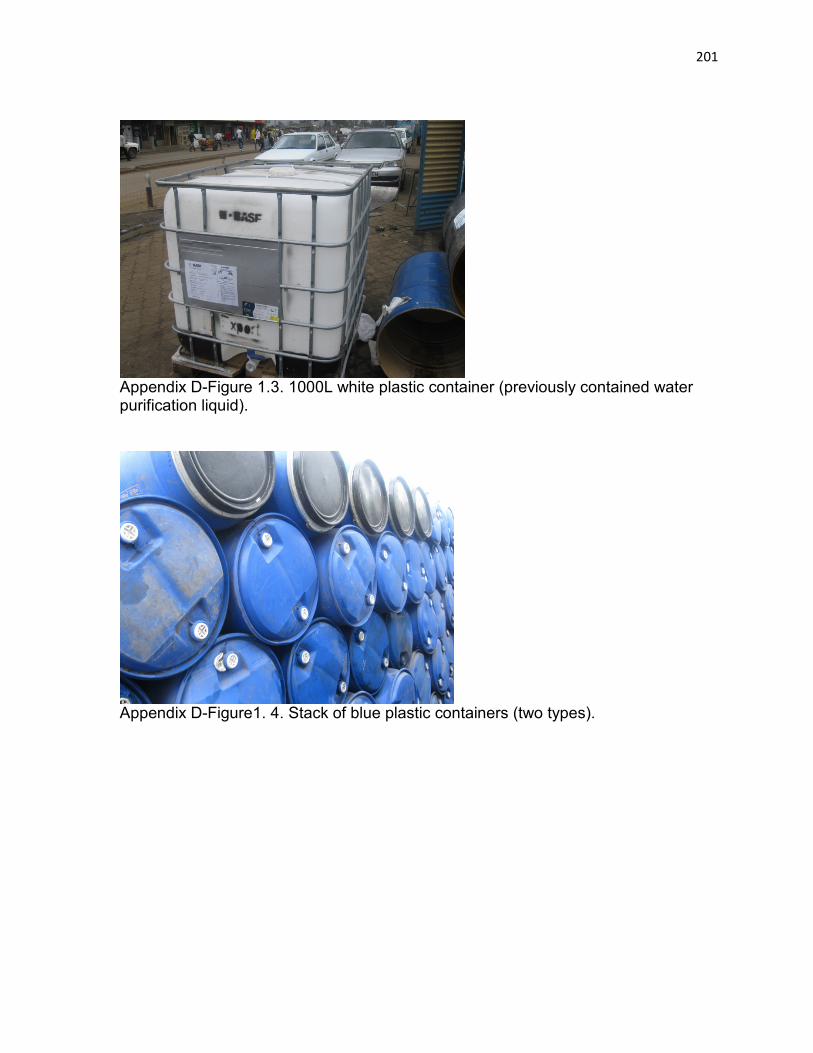
201
Appendix D-Figure 1.3. 1000L white plastic container (previously contained water purification liquid).
Appendix D-Figure1. 4. Stack of blue plastic containers (two types).
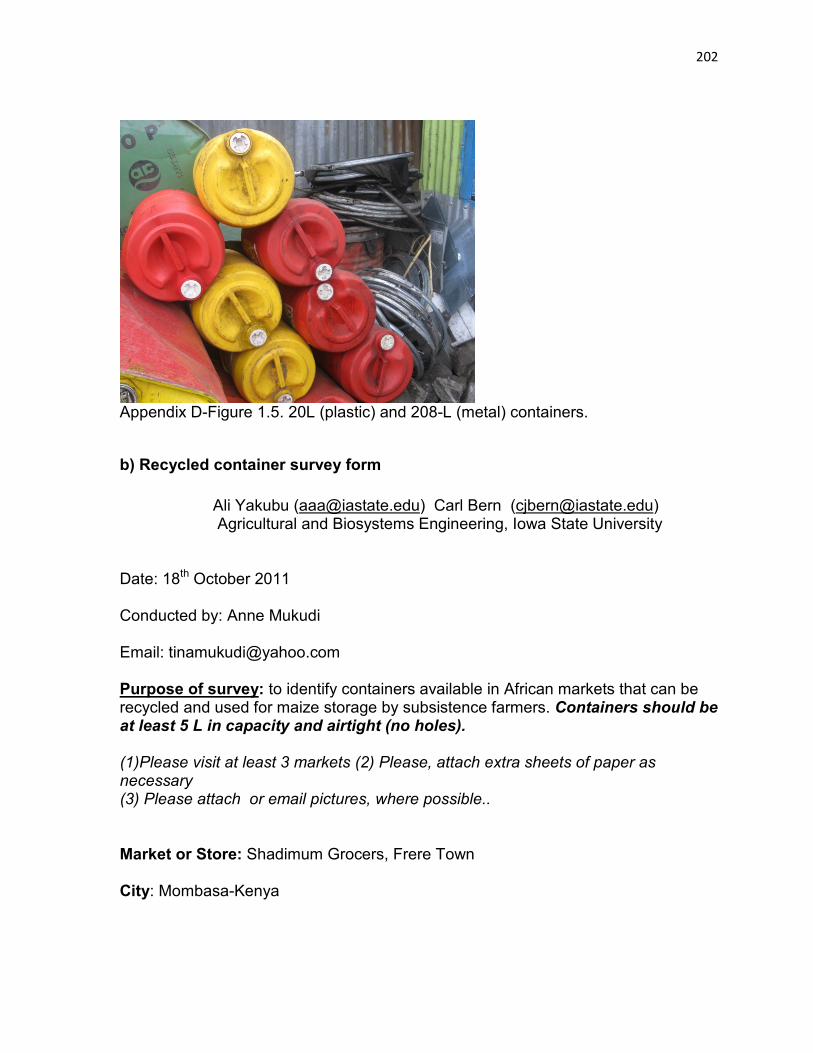
202
Appendix D-Figure 1.5. 20L (plastic) and 208-L (metal) containers.
b) Recycled container survey form Ali Yakubu ([email protected]) Carl Bern ([email protected]) Agricultural and Biosystems Engineering, Iowa State University Date: 18th October 2011 Conducted by: Anne Mukudi Email: [email protected] Purpose of survey: to identify containers available in African markets that can be recycled and used for maize storage by subsistence farmers. Containers should be at least 5 L in capacity and airtight (no holes). (1)Please visit at least 3 markets (2) Please, attach extra sheets of paper as necessary (3) Please attach or email pictures, where possible.. Market or Store: Shadimum Grocers, Frere Town City: Mombasa-Kenya
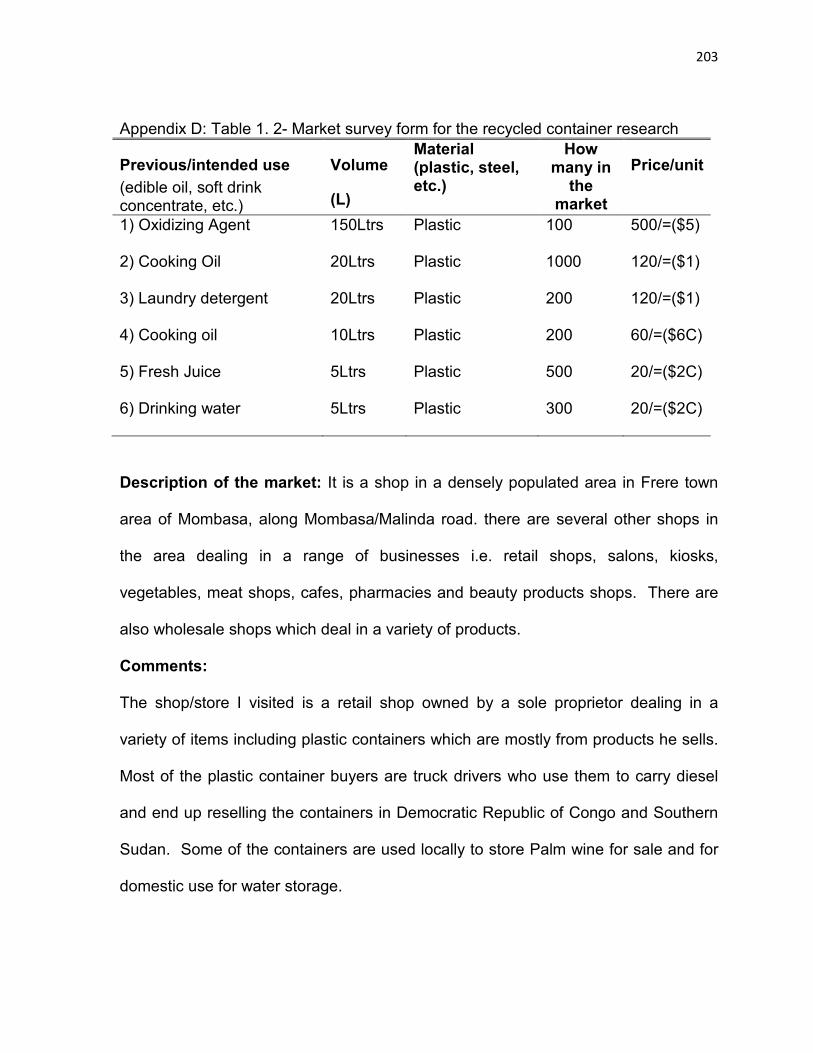
203
Appendix D: Table 1. 2- Market survey form for the recycled container research
Previous/intended use (edible oil, soft drink concentrate, etc.)
Volume
(L)
Material (plastic, steel, etc.)
How many in
the market
Price/unit
1) Oxidizing Agent 150Ltrs Plastic 100
500/=($5)
2) Cooking Oil
20Ltrs Plastic 1000 120/=($1)
3) Laundry detergent
20Ltrs Plastic 200 120/=($1)
4) Cooking oil 10Ltrs Plastic
200 60/=($6C)
5) Fresh Juice
5Ltrs Plastic 500 20/=($2C)
6) Drinking water
5Ltrs Plastic 300 20/=($2C)
Description of the market: It is a shop in a densely populated area in Frere town
area of Mombasa, along Mombasa/Malinda road. there are several other shops in
the area dealing in a range of businesses i.e. retail shops, salons, kiosks,
vegetables, meat shops, cafes, pharmacies and beauty products shops. There are
also wholesale shops which deal in a variety of products.
Comments:
The shop/store I visited is a retail shop owned by a sole proprietor dealing in a
variety of items including plastic containers which are mostly from products he sells.
Most of the plastic container buyers are truck drivers who use them to carry diesel
and end up reselling the containers in Democratic Republic of Congo and Southern
Sudan. Some of the containers are used locally to store Palm wine for sale and for
domestic use for water storage.
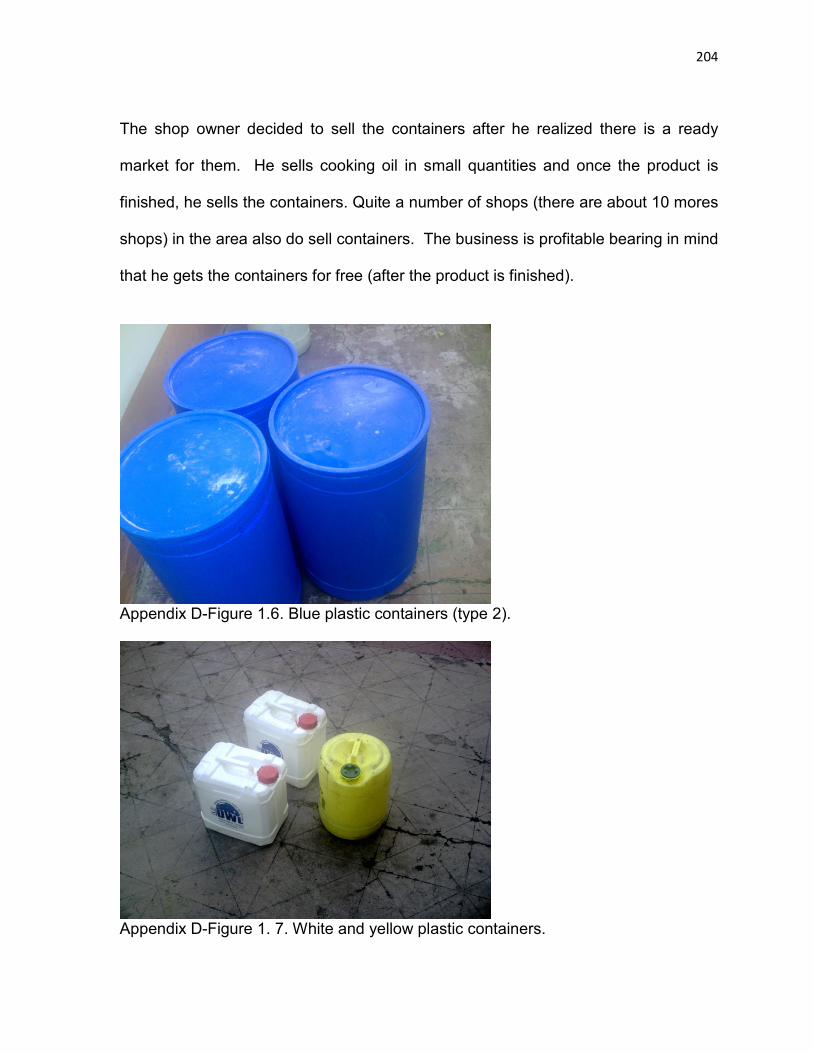
204
The shop owner decided to sell the containers after he realized there is a ready
market for them. He sells cooking oil in small quantities and once the product is
finished, he sells the containers. Quite a number of shops (there are about 10 mores
shops) in the area also do sell containers. The business is profitable bearing in mind
that he gets the containers for free (after the product is finished).
Appendix D-Figure 1.6. Blue plastic containers (type 2).
Appendix D-Figure 1. 7. White and yellow plastic containers.
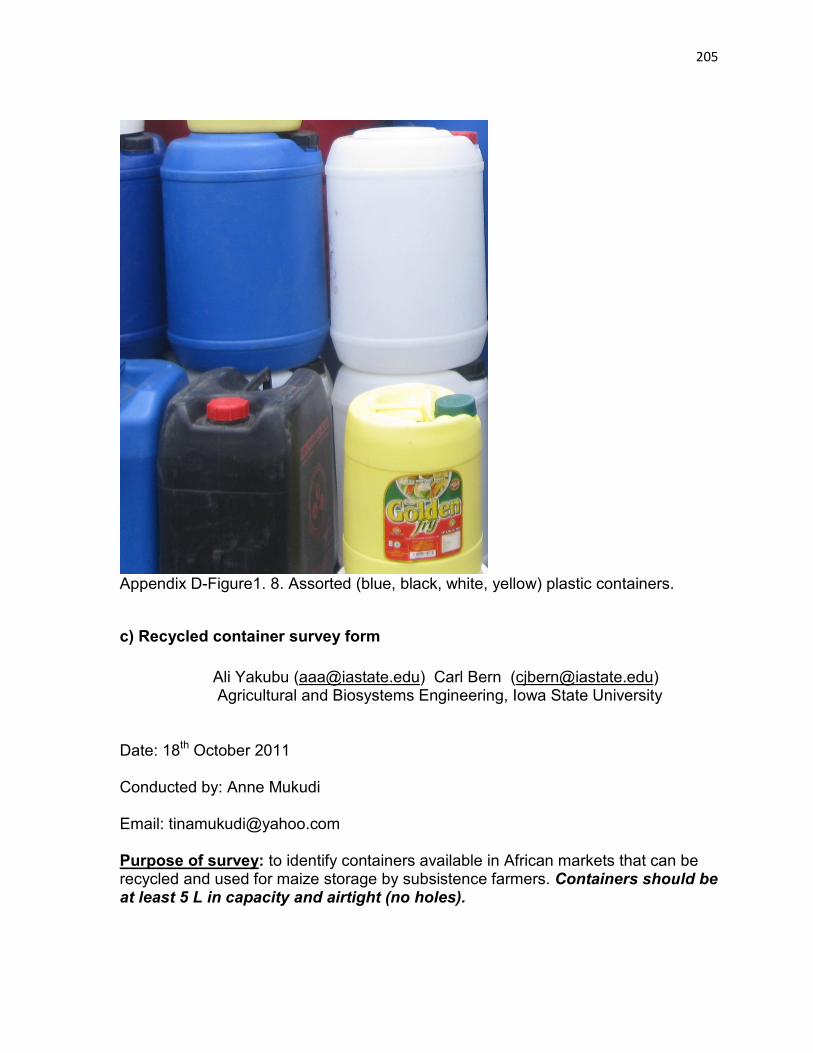
205
Appendix D-Figure1. 8. Assorted (blue, black, white, yellow) plastic containers.
c) Recycled container survey form Ali Yakubu ([email protected]) Carl Bern ([email protected]) Agricultural and Biosystems Engineering, Iowa State University Date: 18th October 2011 Conducted by: Anne Mukudi Email: [email protected] Purpose of survey: to identify containers available in African markets that can be recycled and used for maize storage by subsistence farmers. Containers should be at least 5 L in capacity and airtight (no holes).
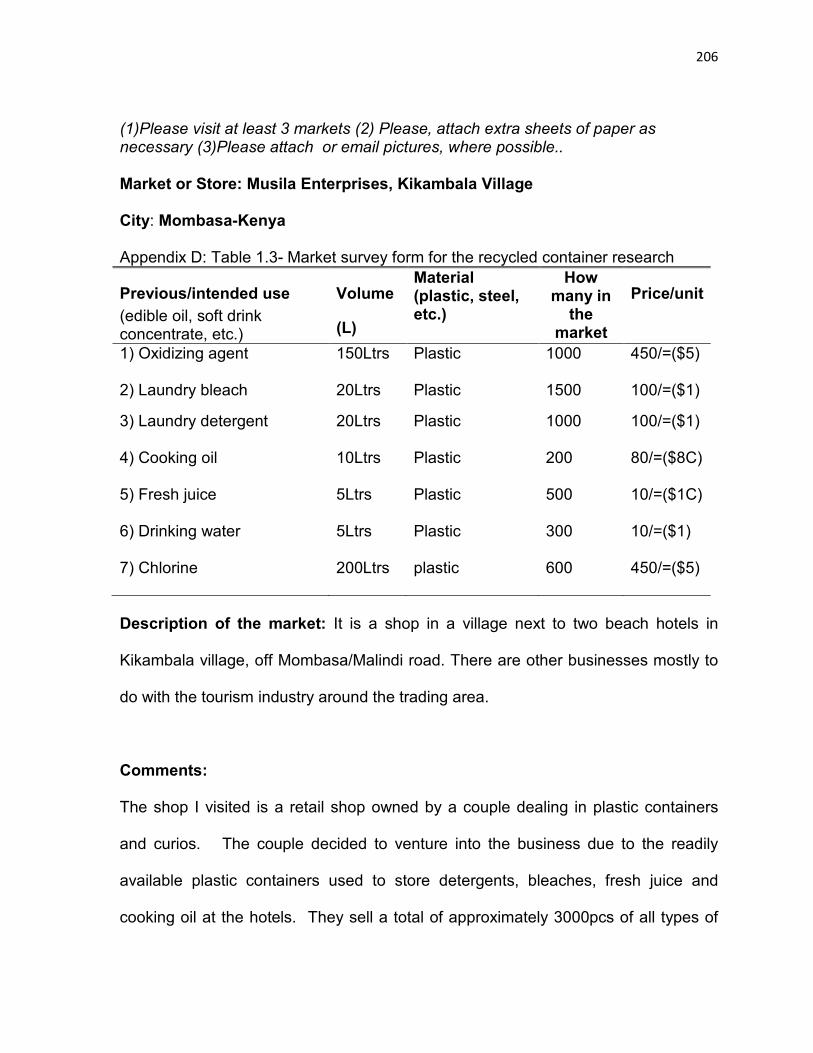
206
(1)Please visit at least 3 markets (2) Please, attach extra sheets of paper as necessary (3)Please attach or email pictures, where possible.. Market or Store: Musila Enterprises, Kikambala Village City: Mombasa-Kenya Appendix D: Table 1.3- Market survey form for the recycled container research
Previous/intended use (edible oil, soft drink concentrate, etc.)
Volume
(L)
Material (plastic, steel, etc.)
How many in
the market
Price/unit
1) Oxidizing agent 150Ltrs Plastic 1000
450/=($5)
2) Laundry bleach 20Ltrs Plastic 1500 100/=($1)
3) Laundry detergent
20Ltrs Plastic 1000 100/=($1)
4) Cooking oil
10Ltrs Plastic 200 80/=($8C)
5) Fresh juice
5Ltrs Plastic 500 10/=($1C)
6) Drinking water
5Ltrs Plastic 300 10/=($1)
7) Chlorine
200Ltrs plastic 600 450/=($5)
Description of the market: It is a shop in a village next to two beach hotels in
Kikambala village, off Mombasa/Malindi road. There are other businesses mostly to
do with the tourism industry around the trading area.
Comments:
The shop I visited is a retail shop owned by a couple dealing in plastic containers
and curios. The couple decided to venture into the business due to the readily
available plastic containers used to store detergents, bleaches, fresh juice and
cooking oil at the hotels. They sell a total of approximately 3000pcs of all types of
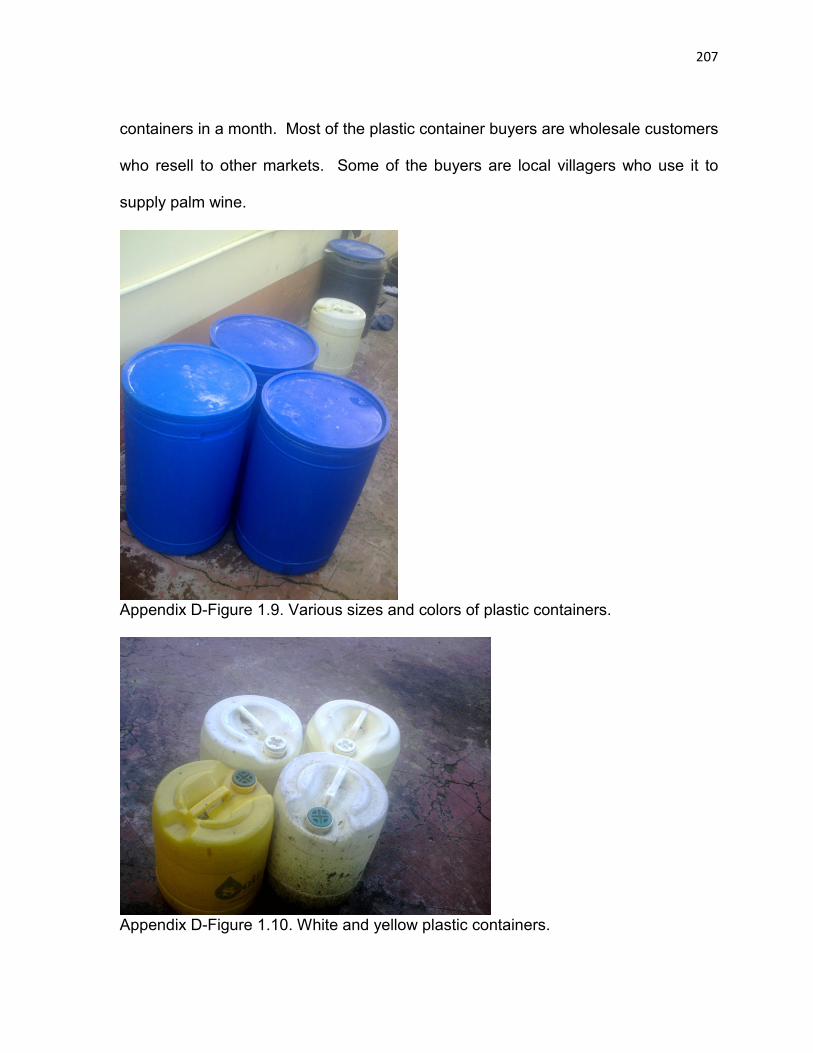
207
containers in a month. Most of the plastic container buyers are wholesale customers
who resell to other markets. Some of the buyers are local villagers who use it to
supply palm wine.
Appendix D-Figure 1.9. Various sizes and colors of plastic containers.
Appendix D-Figure 1.10. White and yellow plastic containers.
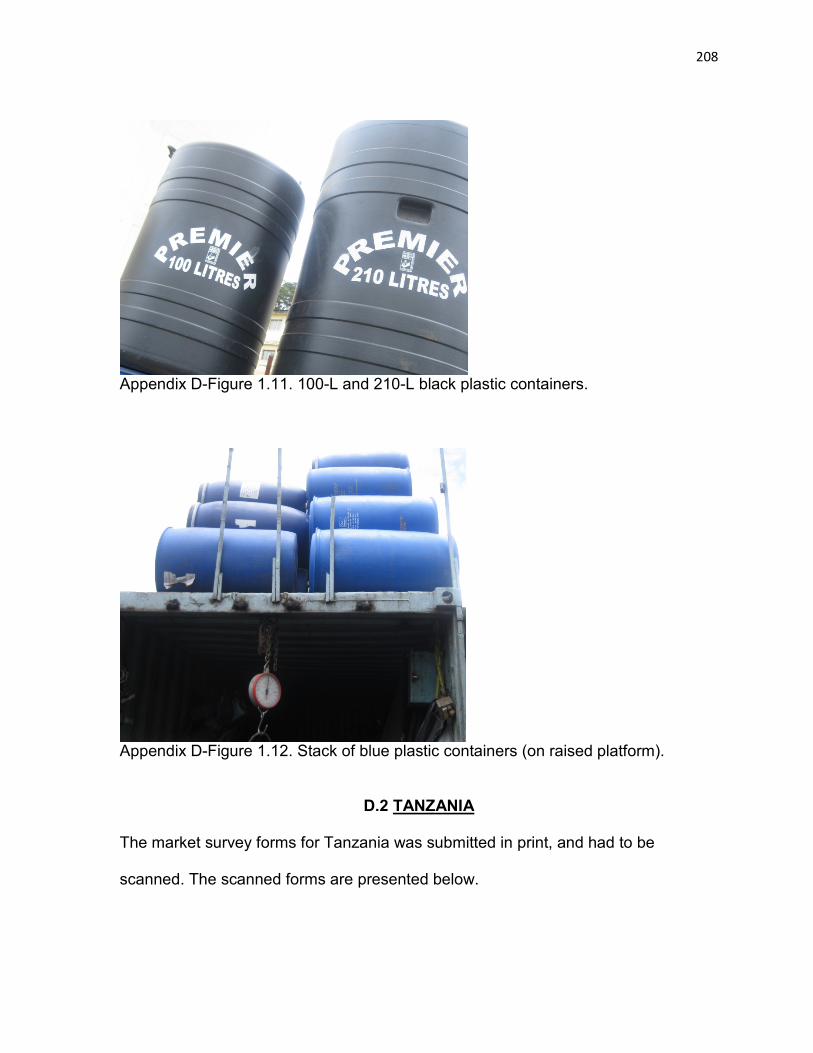
208
Appendix D-Figure 1.11. 100-L and 210-L black plastic containers.
Appendix D-Figure 1.12. Stack of blue plastic containers (on raised platform).
D.2 TANZANIA The market survey forms for Tanzania was submitted in print, and had to be
scanned. The scanned forms are presented below.

209

210
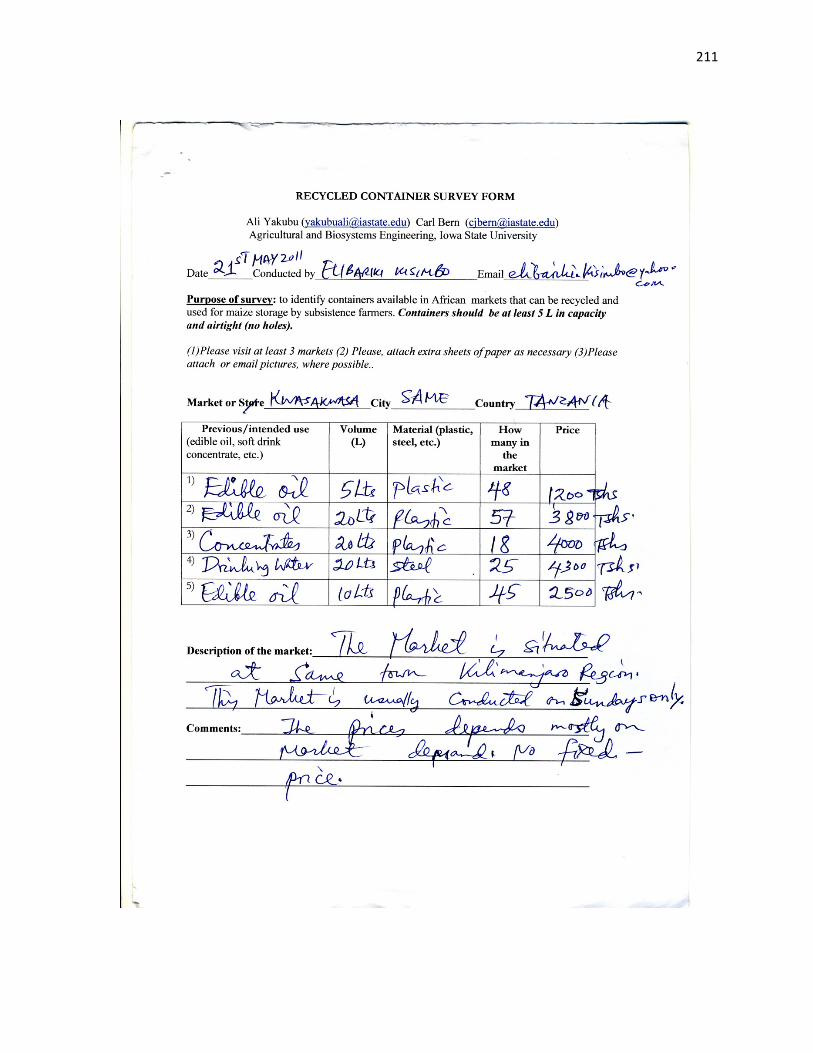
211

212

213
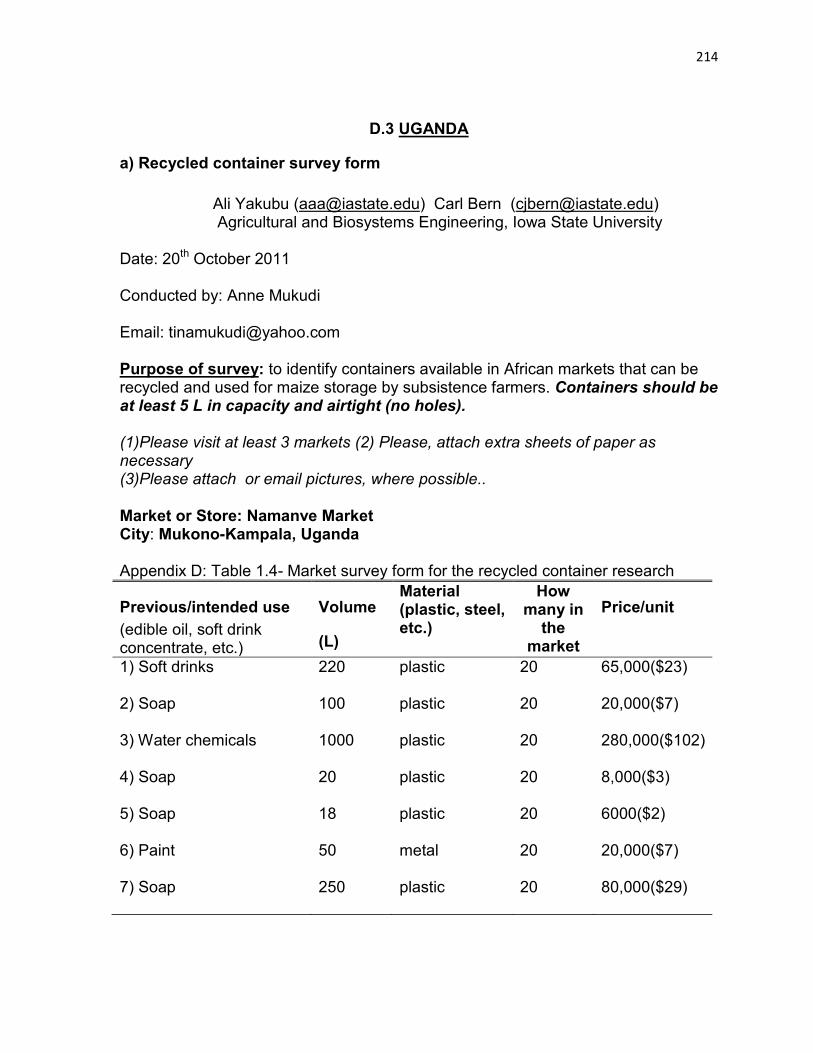
214
D.3 UGANDA
a) Recycled container survey form Ali Yakubu ([email protected]) Carl Bern ([email protected]) Agricultural and Biosystems Engineering, Iowa State University Date: 20th October 2011 Conducted by: Anne Mukudi Email: [email protected] Purpose of survey: to identify containers available in African markets that can be recycled and used for maize storage by subsistence farmers. Containers should be at least 5 L in capacity and airtight (no holes). (1)Please visit at least 3 markets (2) Please, attach extra sheets of paper as necessary (3)Please attach or email pictures, where possible.. Market or Store: Namanve Market City: Mukono-Kampala, Uganda Appendix D: Table 1.4- Market survey form for the recycled container research
Previous/intended use (edible oil, soft drink concentrate, etc.)
Volume
(L)
Material (plastic, steel, etc.)
How many in
the market
Price/unit
1) Soft drinks 220 plastic 20
65,000($23)
2) Soap
100 plastic 20
20,000($7)
3) Water chemicals
1000 plastic 20
280,000($102)
4) Soap
20 plastic 20
8,000($3)
5) Soap
18 plastic 20
6000($2)
6) Paint
50 metal 20
20,000($7)
7) Soap
250 plastic 20
80,000($29)
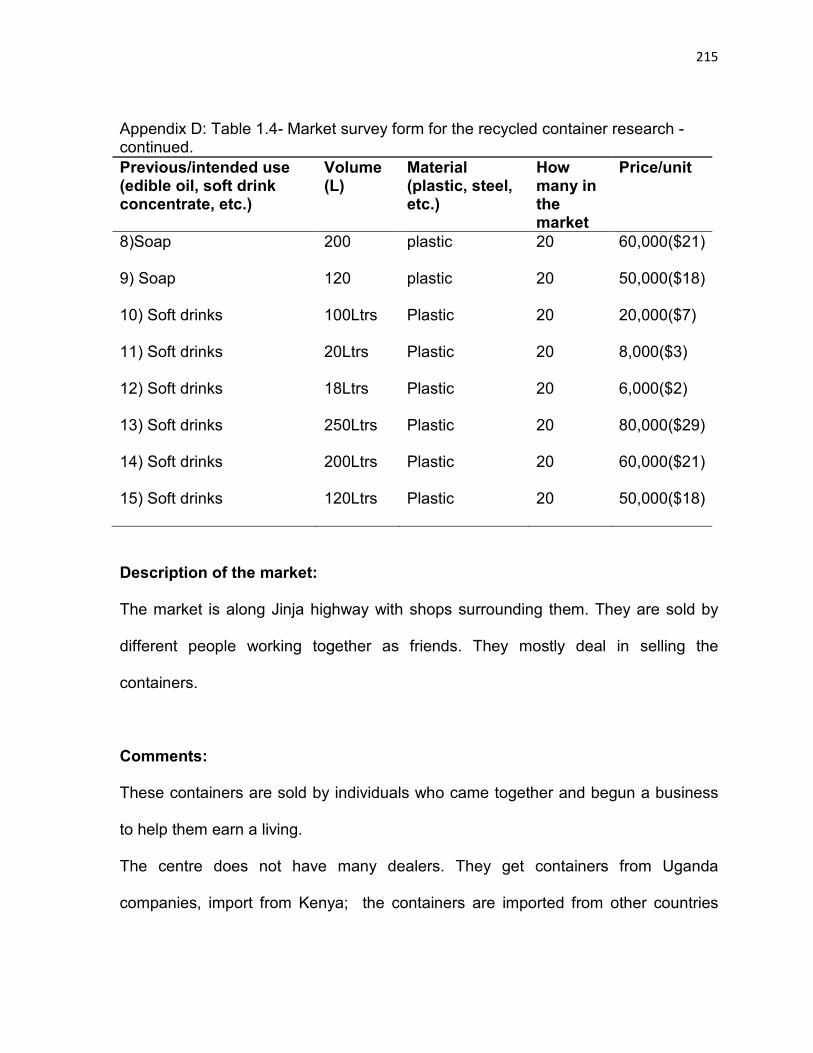
215
Appendix D: Table 1.4- Market survey form for the recycled container research -continued. Previous/intended use (edible oil, soft drink concentrate, etc.)
Volume (L)
Material (plastic, steel, etc.)
How many in the market
Price/unit
8)Soap 200 plastic 20
60,000($21)
9) Soap
120 plastic 20
50,000($18)
10) Soft drinks 100Ltrs Plastic
20 20,000($7)
11) Soft drinks 20Ltrs Plastic
20 8,000($3)
12) Soft drinks
18Ltrs Plastic 20 6,000($2)
13) Soft drinks
250Ltrs Plastic 20 80,000($29)
14) Soft drinks
200Ltrs Plastic 20 60,000($21)
15) Soft drinks
120Ltrs Plastic 20 50,000($18)
Description of the market:
The market is along Jinja highway with shops surrounding them. They are sold by
different people working together as friends. They mostly deal in selling the
containers.
Comments:
These containers are sold by individuals who came together and begun a business
to help them earn a living.
The centre does not have many dealers. They get containers from Uganda
companies, import from Kenya; the containers are imported from other countries
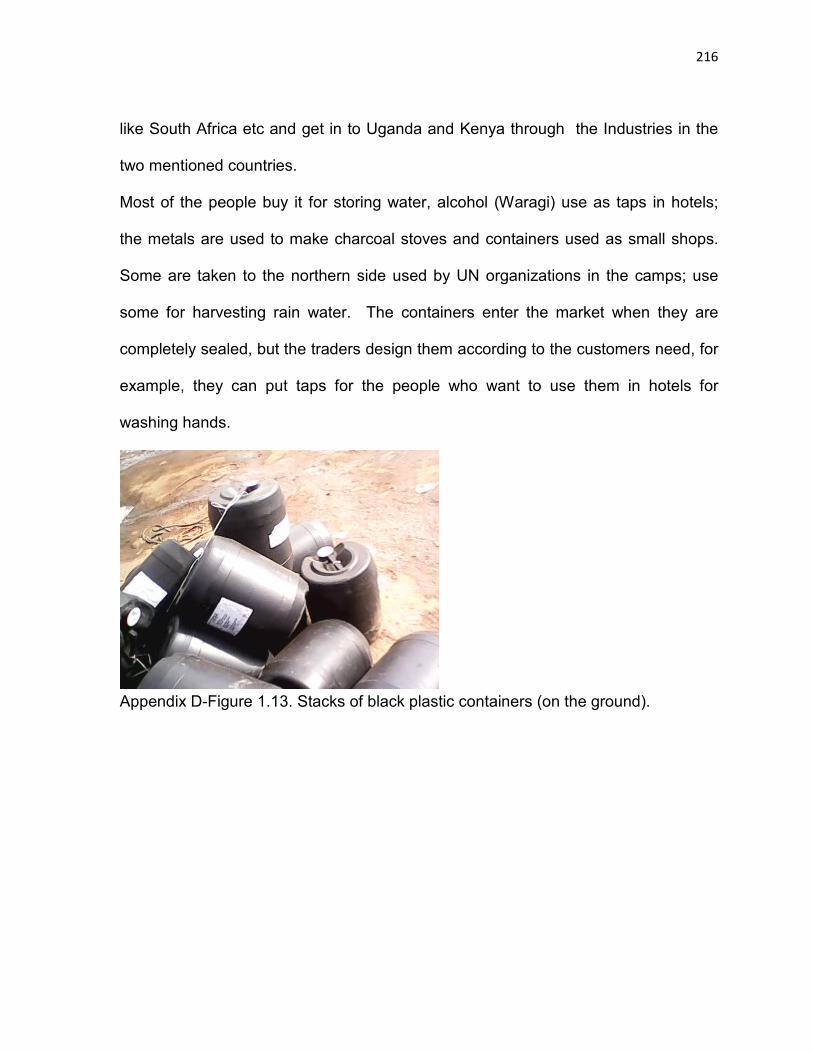
216
like South Africa etc and get in to Uganda and Kenya through the Industries in the
two mentioned countries.
Most of the people buy it for storing water, alcohol (Waragi) use as taps in hotels;
the metals are used to make charcoal stoves and containers used as small shops.
Some are taken to the northern side used by UN organizations in the camps; use
some for harvesting rain water. The containers enter the market when they are
completely sealed, but the traders design them according to the customers need, for
example, they can put taps for the people who want to use them in hotels for
washing hands.
Appendix D-Figure 1.13. Stacks of black plastic containers (on the ground).
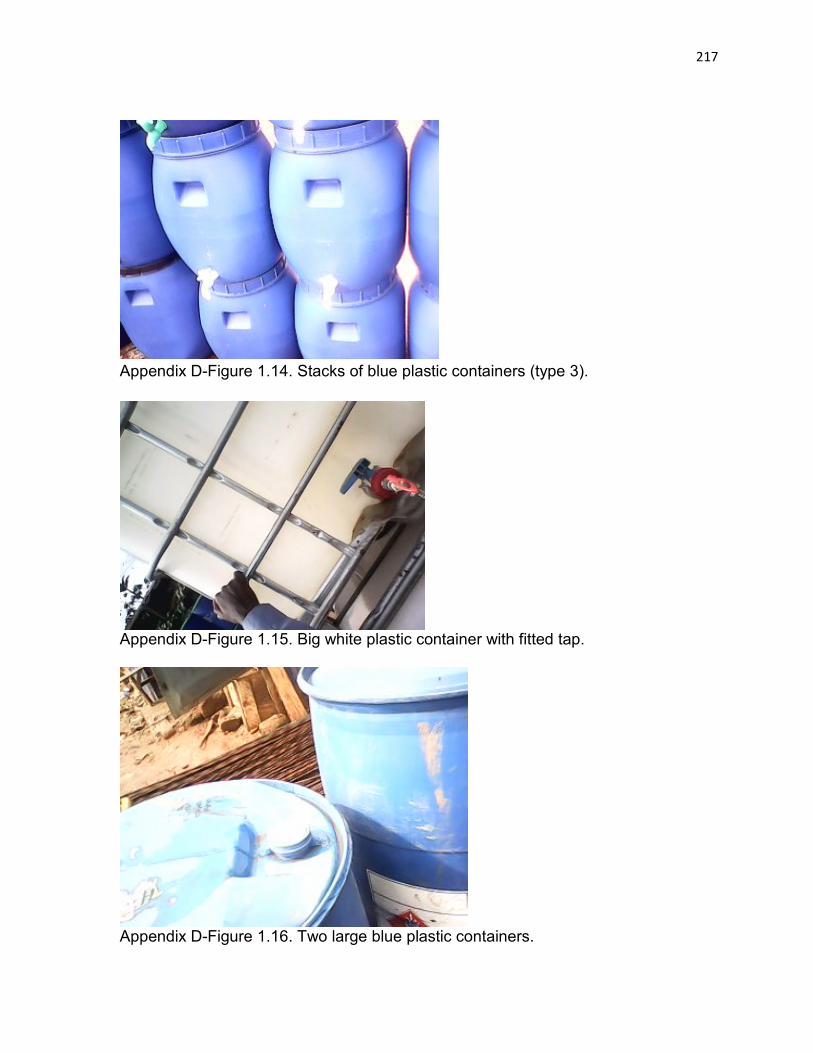
217
Appendix D-Figure 1.14. Stacks of blue plastic containers (type 3).
Appendix D-Figure 1.15. Big white plastic container with fitted tap.
Appendix D-Figure 1.16. Two large blue plastic containers.
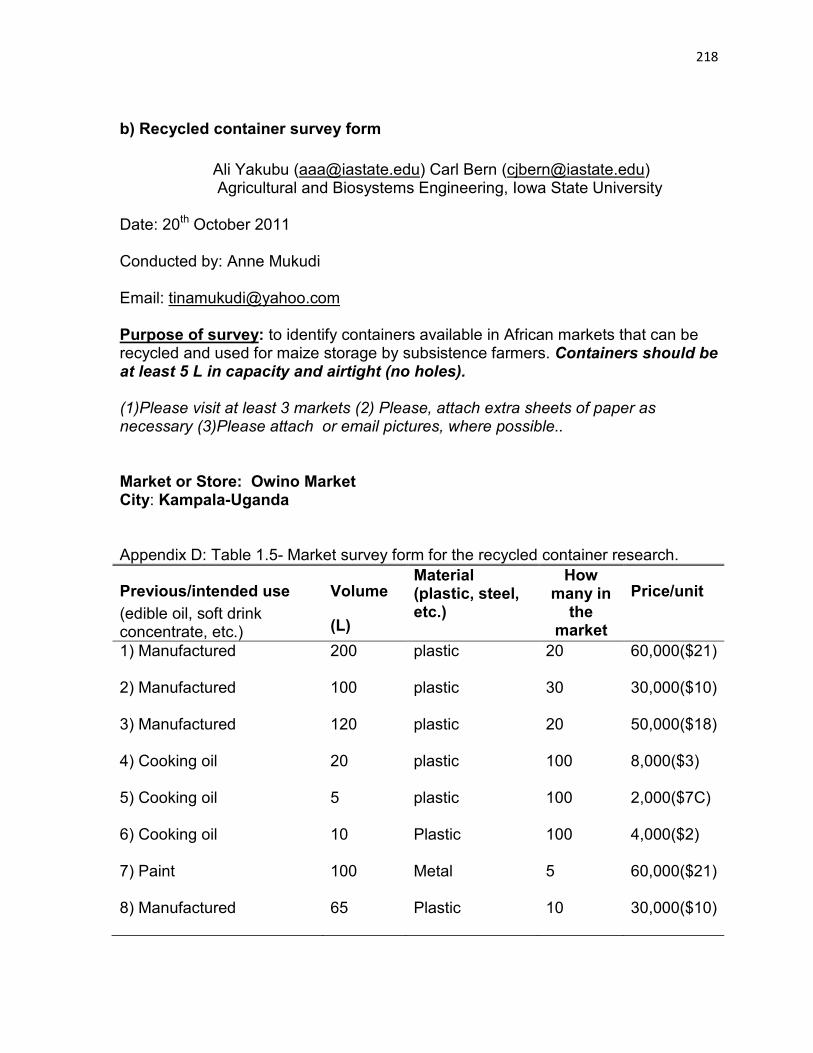
218
b) Recycled container survey form Ali Yakubu ([email protected]) Carl Bern ([email protected]) Agricultural and Biosystems Engineering, Iowa State University Date: 20th October 2011 Conducted by: Anne Mukudi Email: [email protected] Purpose of survey: to identify containers available in African markets that can be recycled and used for maize storage by subsistence farmers. Containers should be at least 5 L in capacity and airtight (no holes). (1)Please visit at least 3 markets (2) Please, attach extra sheets of paper as necessary (3)Please attach or email pictures, where possible.. Market or Store: Owino Market City: Kampala-Uganda Appendix D: Table 1.5- Market survey form for the recycled container research.
Previous/intended use (edible oil, soft drink concentrate, etc.)
Volume
(L)
Material (plastic, steel, etc.)
How many in
the market
Price/unit
1) Manufactured 200 plastic 20
60,000($21)
2) Manufactured
100 plastic 30
30,000($10)
3) Manufactured
120 plastic 20
50,000($18)
4) Cooking oil
20 plastic 100
8,000($3)
5) Cooking oil
5 plastic 100
2,000($7C)
6) Cooking oil
10 Plastic 100 4,000($2)
7) Paint
100 Metal 5 60,000($21)
8) Manufactured
65 Plastic 10 30,000($10)
219
Description of the market: The market is within the city with other items being sold, like clothes both new and
second hand, food stuff, new and second hand shoes.
It is the busiest market within the city with different people involved in the different
business. The 5- 20Ltrs containers are sold after being cleaned and sold by the
shopkeepers. The other containers are bought from the manufacturers within the
country crest company while others import from Kenya and India.
Comments:
These containers are sold by shopkeepers who aim at earning a living. They get
containers from Uganda companies, import from Kenya. Others are after using
cooking oil manufactured in the country, the black plastic containers are
manufactured in Uganda and their quality is far better than the Kenyan
manufactured plastic containers. They display the containers outside the shops or
put them on the shelf. Most of the people buy the containers for storing water,
alcohol (Waragi), and use as taps in hotels, most of the buyers get them for home
use not commercial. Some people use them for harvesting rain water.
Storage container pictures Containers sold at “Owino Market” are similar to those sold at “Namanve Market”,
therefore pictures have been omitted, here.
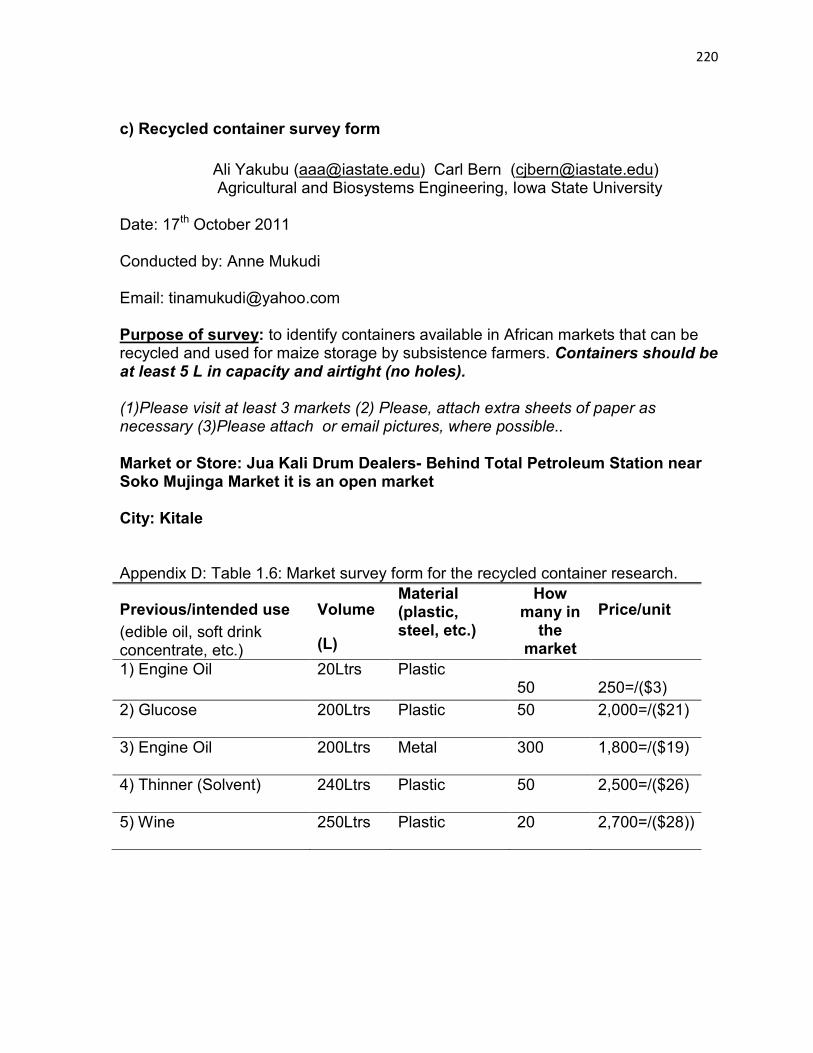
220
c) Recycled container survey form Ali Yakubu ([email protected]) Carl Bern ([email protected]) Agricultural and Biosystems Engineering, Iowa State University Date: 17th October 2011 Conducted by: Anne Mukudi Email: [email protected] Purpose of survey: to identify containers available in African markets that can be recycled and used for maize storage by subsistence farmers. Containers should be at least 5 L in capacity and airtight (no holes). (1)Please visit at least 3 markets (2) Please, attach extra sheets of paper as necessary (3)Please attach or email pictures, where possible.. Market or Store: Jua Kali Drum Dealers- Behind Total Petroleum Station near Soko Mujinga Market it is an open market City: Kitale Appendix D: Table 1.6: Market survey form for the recycled container research.
Previous/intended use (edible oil, soft drink concentrate, etc.)
Volume
(L)
Material (plastic, steel, etc.)
How many in
the market
Price/unit
1) Engine Oil 20Ltrs Plastic 50
250=/($3)
2) Glucose
200Ltrs Plastic 50 2,000=/($21)
3) Engine Oil
200Ltrs Metal 300 1,800=/($19)
4) Thinner (Solvent) 240Ltrs Plastic 50 2,500=/($26)
5) Wine
250Ltrs Plastic 20 2,700=/($28))
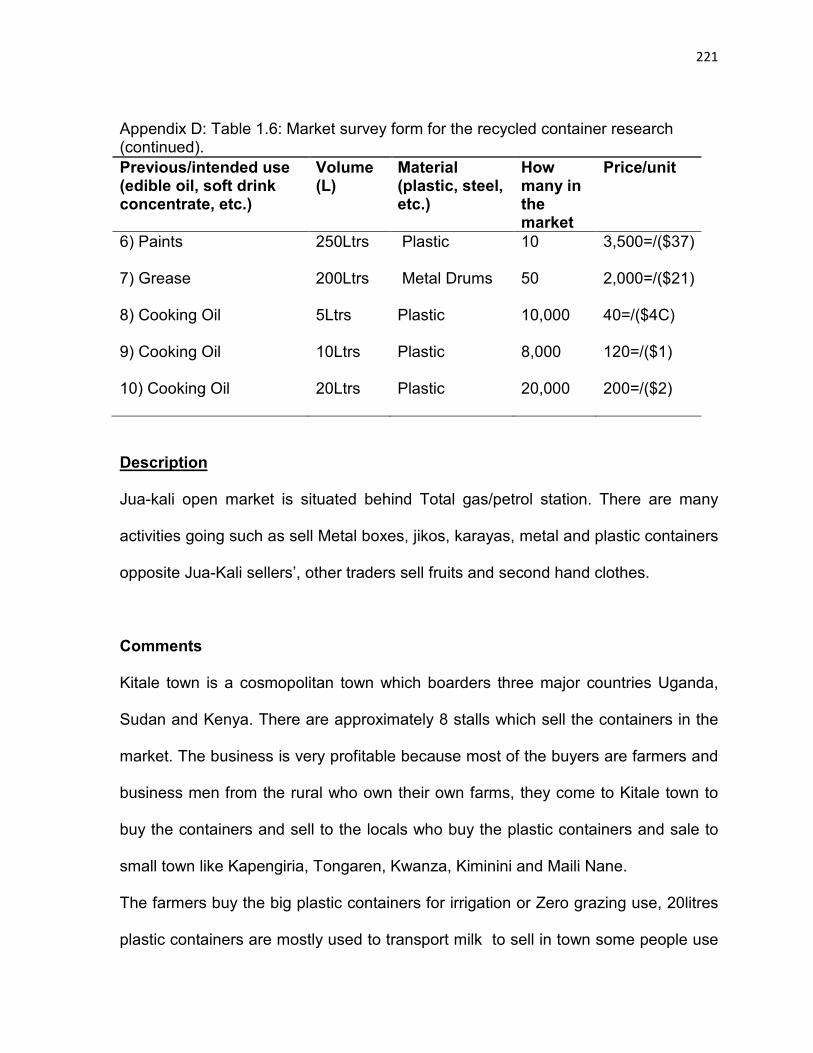
221
Appendix D: Table 1.6: Market survey form for the recycled container research (continued). Previous/intended use (edible oil, soft drink concentrate, etc.)
Volume (L)
Material (plastic, steel, etc.)
How many in the market
Price/unit
6) Paints
250Ltrs Plastic 10 3,500=/($37)
7) Grease
200Ltrs Metal Drums 50 2,000=/($21)
8) Cooking Oil
5Ltrs Plastic 10,000 40=/($4C)
9) Cooking Oil 10Ltrs Plastic 8,000 120=/($1)
10) Cooking Oil
20Ltrs Plastic 20,000 200=/($2)
Description Jua-kali open market is situated behind Total gas/petrol station. There are many
activities going such as sell Metal boxes, jikos, karayas, metal and plastic containers
opposite Jua-Kali sellers’, other traders sell fruits and second hand clothes.
Comments
Kitale town is a cosmopolitan town which boarders three major countries Uganda,
Sudan and Kenya. There are approximately 8 stalls which sell the containers in the
market. The business is very profitable because most of the buyers are farmers and
business men from the rural who own their own farms, they come to Kitale town to
buy the containers and sell to the locals who buy the plastic containers and sale to
small town like Kapengiria, Tongaren, Kwanza, Kiminini and Maili Nane.
The farmers buy the big plastic containers for irrigation or Zero grazing use, 20litres
plastic containers are mostly used to transport milk to sell in town some people use
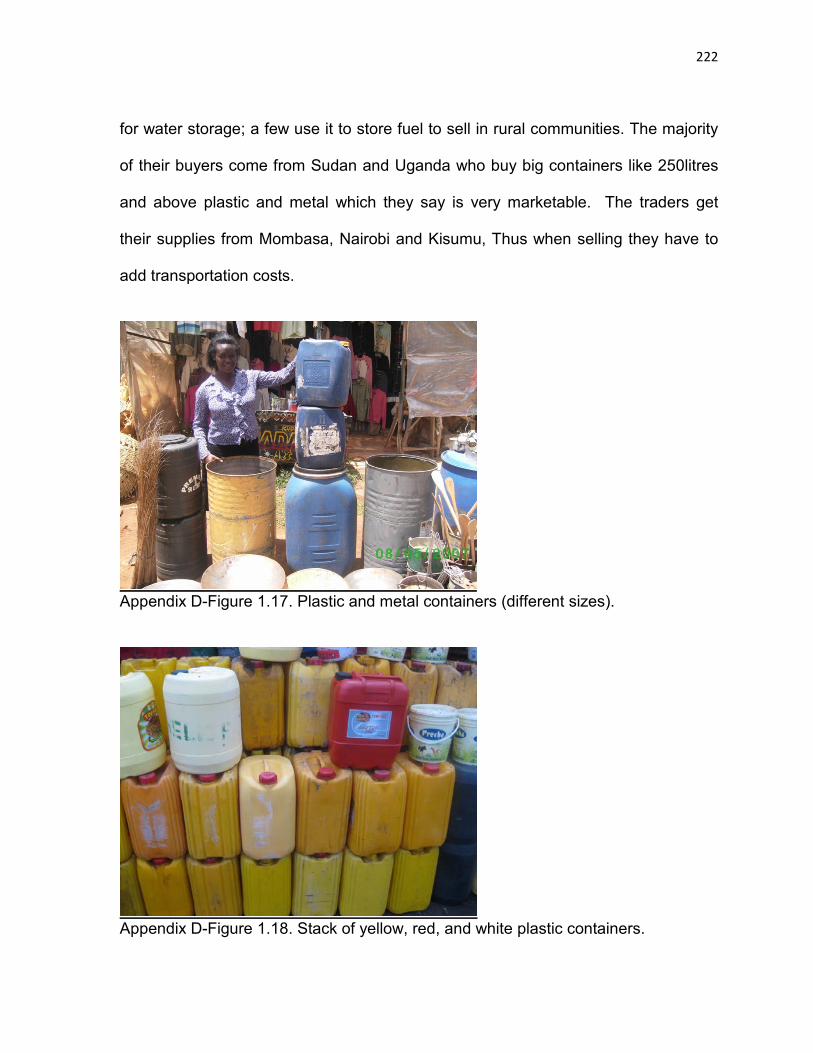
222
for water storage; a few use it to store fuel to sell in rural communities. The majority
of their buyers come from Sudan and Uganda who buy big containers like 250litres
and above plastic and metal which they say is very marketable. The traders get
their supplies from Mombasa, Nairobi and Kisumu, Thus when selling they have to
add transportation costs.
Appendix D-Figure 1.17. Plastic and metal containers (different sizes).
Appendix D-Figure 1.18. Stack of yellow, red, and white plastic containers.
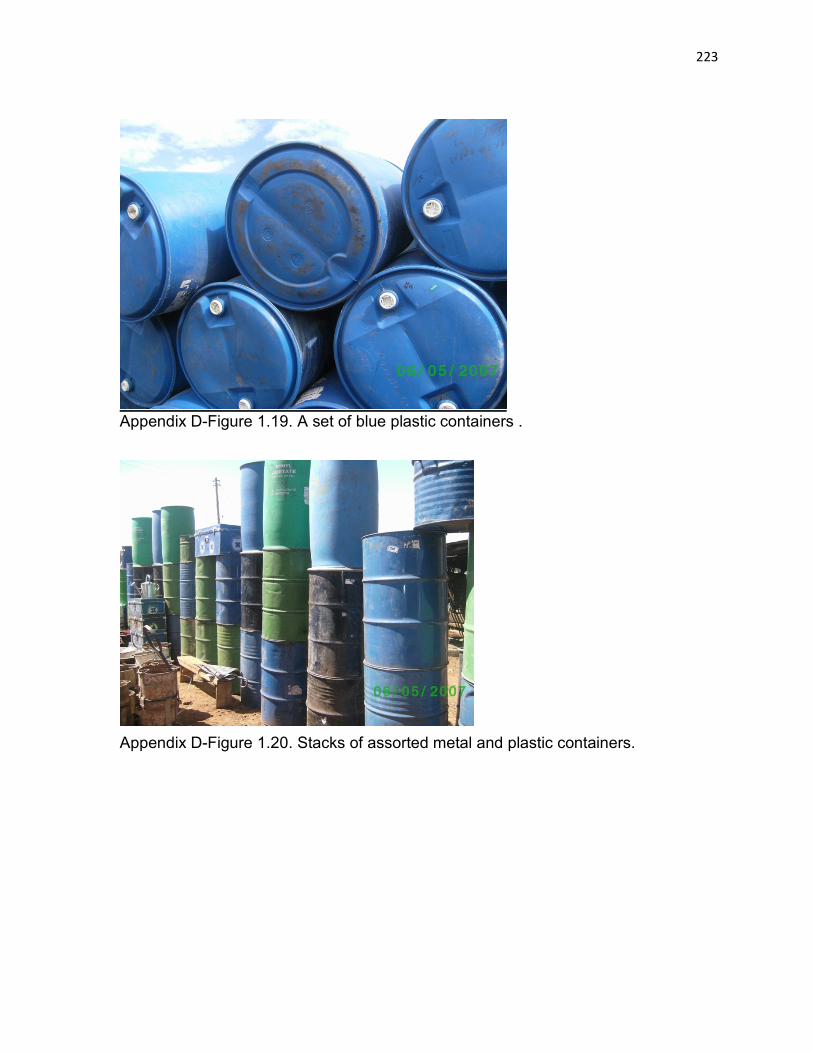
223
Appendix D-Figure 1.19. A set of blue plastic containers .
Appendix D-Figure 1.20. Stacks of assorted metal and plastic containers.
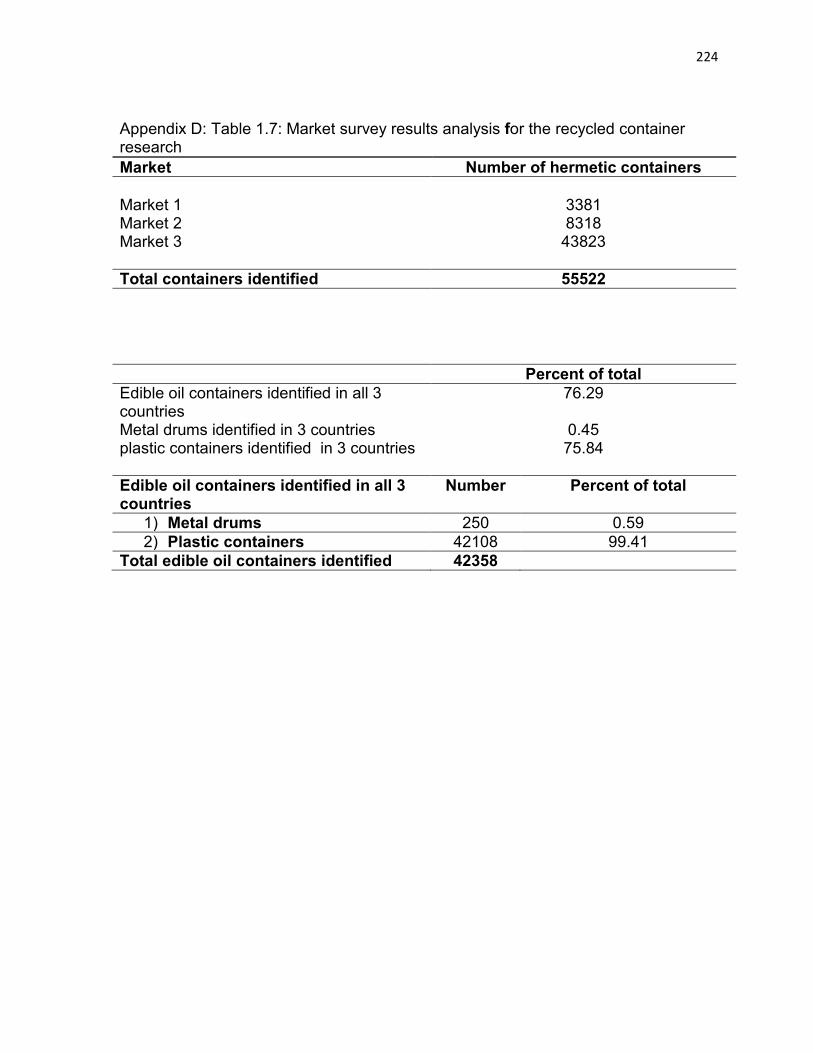
224
Appendix D: Table 1.7: Market survey results analysis for the recycled container research Market Number of hermetic containers Market 1
3381
Market 2 8318 Market 3 43823
Total containers identified 55522
Percent of total Edible oil containers identified in all 3 countries
76.29
Metal drums identified in 3 countries 0.45 plastic containers identified in 3 countries 75.84 Edible oil containers identified in all 3 countries
Number Percent of total
1) Metal drums 250 0.59 2) Plastic containers 42108 99.41
Total edible oil containers identified 42358
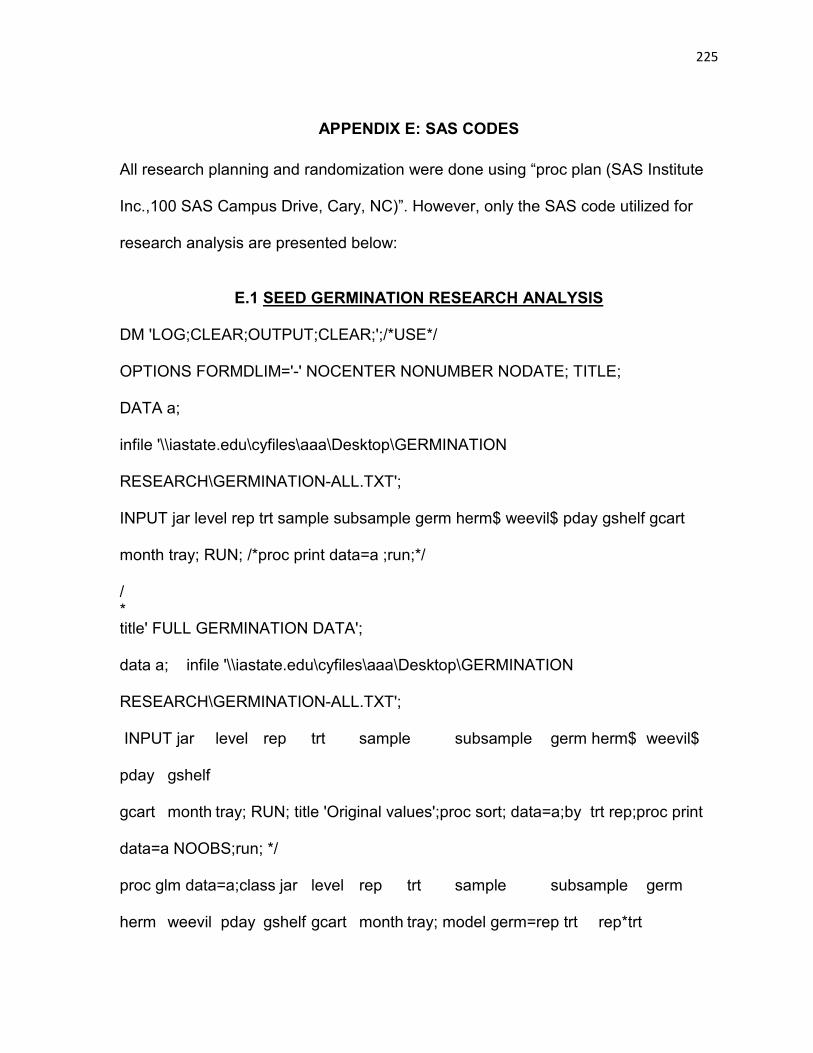
225
APPENDIX E: SAS CODES
All research planning and randomization were done using “proc plan (SAS Institute
Inc.,100 SAS Campus Drive, Cary, NC)”. However, only the SAS code utilized for
research analysis are presented below:
E.1 SEED GERMINATION RESEARCH ANALYSIS
DM 'LOG;CLEAR;OUTPUT;CLEAR;';/*USE*/ OPTIONS FORMDLIM='-' NOCENTER NONUMBER NODATE; TITLE; DATA a; infile '\\iastate.edu\cyfiles\aaa\Desktop\GERMINATION RESEARCH\GERMINATION-ALL.TXT'; INPUT jar level rep trt sample subsample germ herm$ weevil$ pday gshelf gcart month tray; RUN; /*proc print data=a ;run;*/ / * title' FULL GERMINATION DATA'; data a; infile '\\iastate.edu\cyfiles\aaa\Desktop\GERMINATION RESEARCH\GERMINATION-ALL.TXT'; INPUT jar level rep trt sample subsample germ herm$ weevil$ pday gshelf gcart month tray; RUN; title 'Original values';proc sort; data=a;by trt rep;proc print data=a NOOBS;run; */ proc glm data=a;class jar level rep trt sample subsample germ herm weevil pday gshelf gcart month tray; model germ=rep trt rep*trt

226
rep*sample(trt); lsmeans trt; run;quit; proc sort data=a; by month; run; proc glm data=a; by month; class jar level rep trt sample subsample germ herm weevil; model germ= rep trt rep*trt rep*sample(trt); lsmeans trt/stderr; MEANS trt; run;quit; PROC SORT data=a; BY month trt; run; PROC MEANS mean std n; BY month trt;VAR germ; by month trt;run; proc glm data=a; class rep trt germ herm weevil pday gshelf gcart month; model germ= herm weevil month herm*weevil herm*month weevil*month herm*weevil*month; lsmeans trt; run;quit; title 'Percent germination values'; data percentg; set a; germ=germ*100; run; proc sort; data=percentg; by rep trt;run;/*proc print data=percentg;run;*/ title 'General trt contrasts/GOOD'; proc glm data=percentg; class jar level rep trt sample subsample germ herm weevil; model germ= rep trt rep*trt rep*sample(trt); random rep trt rep*trt rep*sample(trt)/test; test h=trt e=rep*trt; lsmeans trt/stderr; lsmeans rep*trt; * trt 1 2 3 4 5 6 7 8 9 10 11 12 13 14 15 16; contrast ' trts avg: control (T5,T6, T7, T8) vs other (T1, T2,T3,T4, T9, T10, T11, T12, T13, T14, T15, T16)/3' trt -1 -1 -1 -1 3 3 3 3 -1 -1 -1 -1 -1 -1 -1 -1; run;quit; title 'XXXXXXXXXXXXXXXXXXXXXXXXXXXXXXXXXXX'; proc glm data=percentg; class rep trt germ herm weevil pday gshelf gcart month; model germ= herm weevil month herm*weevil herm*month weevil*month herm*weevil*month; random herm*weevil herm*month weevil*month herm*weevil*month/test; run;quit;

227
title 'TTTTTTTTTTTTTTTTTTTTTTTTTTTTTTT'; proc glm data=percentg; class rep trt germ herm weevil pday gshelf gcart month; model germ= herm weevil month herm*weevil herm*month weevil*month rep*trt herm*weevil*month; random herm weevil month herm*weevil herm*month weevil*month rep*trt herm*weevil*month/test; test h=herm e=rep*trt; lsmeans rep*trt; run;quit; title 'BY MONTHS'; PROC SORT data=percentg; BY trt; run; PROC MEANS mean std n; BY trt;VAR germ; by trt;run; proc sort data=percentg; by month; run; proc glm data=percentg; by month; class jar level rep trt sample subsample germ herm weevil; model germ= rep trt rep*trt rep*sample(trt); lsmeans trt/stderr; run;quit; PROC SORT data=percentg; BY month trt; run;PROC MEANS mean std n; BY month trt; VAR germ; by month trt;run; title 'trt contrasts'; proc sort data=percentg;by month; run; proc glm data=percentg; by month; where month=0; class jar level rep trt sample subsample germ herm weevil; model germ= rep trt rep*trt rep*sample(trt); random rep trt rep*trt rep*sample(trt)/test; test h=trt e=rep*trt; lsmeans trt/stderr; * trt 1 5 9 13; contrast 'month zero trts: control (T6) vs other (T1, T9,T13)/3:trt -1 3 -1 -1; run;quit; proc glm data=percentg; by month; where month=4; class jar level rep trt sample subsample germ herm weevil;
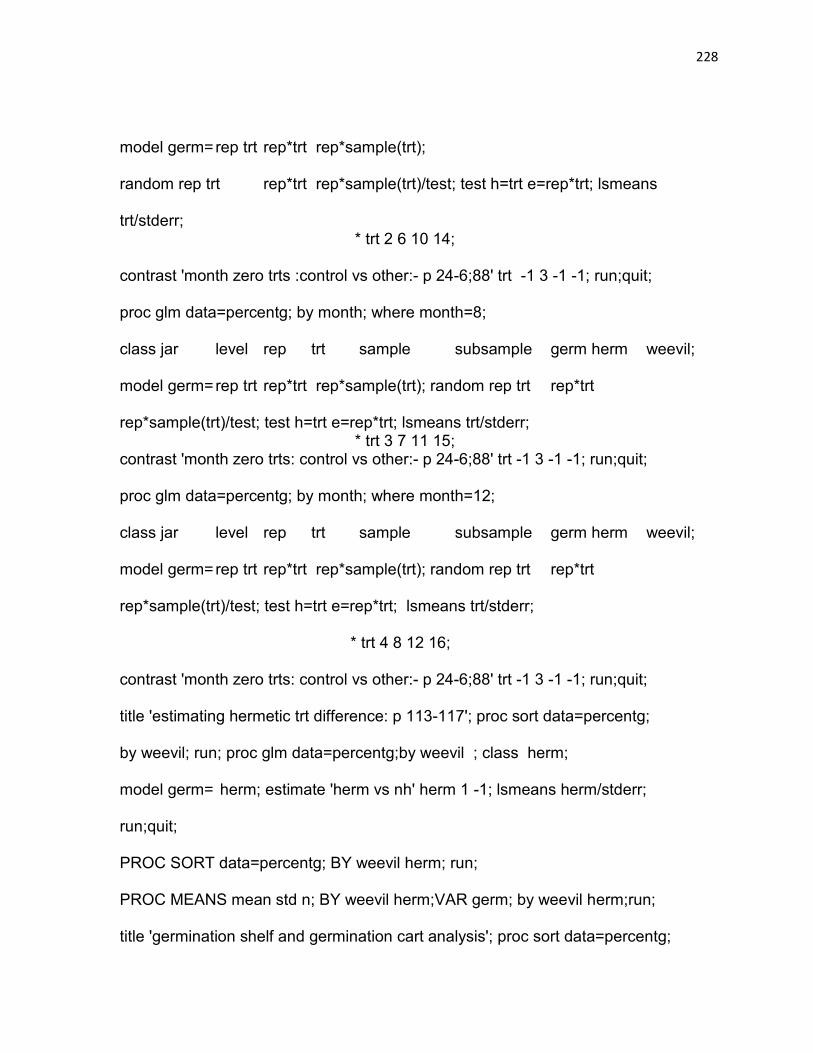
228
model germ= rep trt rep*trt rep*sample(trt); random rep trt rep*trt rep*sample(trt)/test; test h=trt e=rep*trt; lsmeans trt/stderr; * trt 2 6 10 14; contrast 'month zero trts :control vs other:- p 24-6;88' trt -1 3 -1 -1; run;quit; proc glm data=percentg; by month; where month=8; class jar level rep trt sample subsample germ herm weevil; model germ= rep trt rep*trt rep*sample(trt); random rep trt rep*trt rep*sample(trt)/test; test h=trt e=rep*trt; lsmeans trt/stderr; * trt 3 7 11 15; contrast 'month zero trts: control vs other:- p 24-6;88' trt -1 3 -1 -1; run;quit; proc glm data=percentg; by month; where month=12; class jar level rep trt sample subsample germ herm weevil; model germ= rep trt rep*trt rep*sample(trt); random rep trt rep*trt rep*sample(trt)/test; test h=trt e=rep*trt; lsmeans trt/stderr; * trt 4 8 12 16; contrast 'month zero trts: control vs other:- p 24-6;88' trt -1 3 -1 -1; run;quit; title 'estimating hermetic trt difference: p 113-117'; proc sort data=percentg; by weevil; run; proc glm data=percentg;by weevil ; class herm; model germ= herm; estimate 'herm vs nh' herm 1 -1; lsmeans herm/stderr; run;quit; PROC SORT data=percentg; BY weevil herm; run; PROC MEANS mean std n; BY weevil herm;VAR germ; by weevil herm;run; title 'germination shelf and germination cart analysis'; proc sort data=percentg;

229
by gshelf gcart; proc glm data=percentg; class gshelf gcart; model germ=gshelf gcart gshelf(gshelf); contrast 'gcart1 vs gcart2' gcart 1 -1; lsmeans gshelf gcart gshelf(gshelf);run;quit; title 'herm*month interaction:PLOTTING VALUES: '; proc sort data=percentg; by herm month; proc glm data=percentg; class germ herm month; model germ=herm month herm*month ; lsmeans herm herm*month; run; title 'herm or non-hermetic:PLOTTING VALUES: '; PROC SORT data=percentg; BY herm month; run; PROC MEANS mean std n; BY herm month;VAR germ; by herm month;run; title 'weevil or no weevil:PLOTTING VALUES: '; PROC SORT data=percentg; BY weevil month; run; PROC MEANS mean std n; BY weevil month;VAR germ; by weevil month;run; title 'INTERACTIONS:PLOTTING '; proc glm data=percentg; class rep trt germ herm weevil pday gshelf gcart month; model germ= herm weevil month herm*weevil herm*month weevil*month herm*weevil*month; lsmeans herm*weevil herm*month weevil*month/slice=month; lsmeans herm*weevil*month;run;quit; TITLE 'SLOPE ANALYSIS' title 'Regression (trts): treatments 1-4'; DATA l; input trt germ; datalines;
1 99.1666667
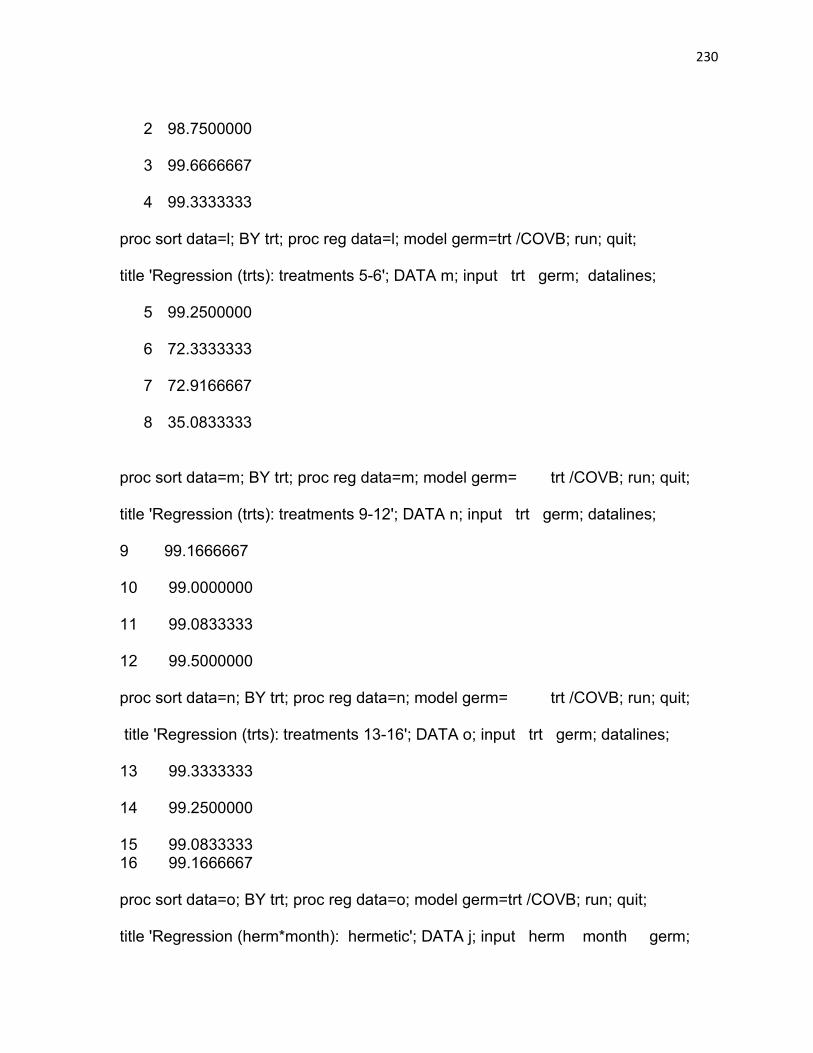
230
2 98.7500000
3 99.6666667
4 99.3333333
proc sort data=l; BY trt; proc reg data=l; model germ=trt /COVB; run; quit; title 'Regression (trts): treatments 5-6'; DATA m; input trt germ; datalines;
5 99.2500000
6 72.3333333
7 72.9166667
8 35.0833333
proc sort data=m; BY trt; proc reg data=m; model germ= trt /COVB; run; quit; title 'Regression (trts): treatments 9-12'; DATA n; input trt germ; datalines; 9 99.1666667 10 99.0000000 11 99.0833333 12 99.5000000 proc sort data=n; BY trt; proc reg data=n; model germ= trt /COVB; run; quit; title 'Regression (trts): treatments 13-16'; DATA o; input trt germ; datalines; 13 99.3333333 14 99.2500000 15 99.0833333 16 99.1666667 proc sort data=o; BY trt; proc reg data=o; model germ=trt /COVB; run; quit; title 'Regression (herm*month): hermetic'; DATA j; input herm month germ;

231
datalines; H 0 99.1666667 H 4 98.8750000 H 8 99.3750000 H 12 99.4166667 proc sort data=j; BY month; proc reg data=j; model germ= month /COVB; run; quit; title 'Regression (herm*month): nonhermetic'; DATA k; input herm month germ; datalines; NH 0 99.2916667 NH 4 85.7916667 NH 8 86.0000000 NH 12 67.1250000 proc sort data=k; BY month; proc reg data=k; model germ= month /COVB; run; quit; title 'Regression (weevil*month): no weevils'; DATA h; input weevil month germ; datalines; F 0 99.2500000 F 4 99.1250000 F 8 99.0833333 F 12 99.3333333 proc sort data=h; BY month; proc reg data=h; model germ= month /COVB; run; quit; title 'Regression (weevil*month): with weevils'; DATA i; input weevil month
232
germ; datalines; T 0 99.2083333 T 4 85.5416667 T 8 86.2916667 T 12 67.2083333 proc sort data=i; BY month; proc reg data=i; model germ= month /COVB;run; quit; title 'Regression (Herm*weevil*month): hermetic with no weevils'; DATA d; input herm weevil ; month germ; datalines; H F 0 99.1666667 H F 4 99.0000000 H F 8 99.0833333 H F 12 99.5000000 proc sort data=d; BY month; proc reg data=d; model germ=month /COVB; run; quit; title 'Regression(Herm*weevil*month):hermetic with weevils'; DATA e; input herm weevil month germ; datalines; H T 0 99.1666667 H T 4 98.7500000 H T 8 99.6666667 H T 12 99.3333333 proc sort data=e; BY month; proc reg data=e; model germ= month /COVB; run; quit; title 'Regression(Herm*weevil*month): nonhermetic with no weevils'; DATA f; input herm weevil month germ; datalines;

233
NH F 0 99.3333333 NH F 4 99.2500000 NH F 8 99.0833333 NH F 12 99.1666667 proc sort data=f; BY month; proc reg data=f; model germ= month /COVB; run; quit; title 'Regression(Herm*weevil*month): Nonhermetic with weevils'; DATA g; input herm weevil month germ; datalines; NH T 0 99.2500000 NH T 4 72.3333333 NH T 8 72.9166667 NH T 12 35.0833333 proc sort data=g; BY month; proc reg data=g; model germ= month /COVB; run; quit; title 'WEEVILS/NONHERMETIC'; data a1; infile '\\iastate.edu\cyfiles\aaa\Desktop\GERMINATION RESEARCH\WEEVILS- NH.TXT'; INPUT jar level rep trt sample subsample germ herm$ weevil$ pday gshelf gcart month tray; RUN; /*DATA aa(DROP=Obs);SET a1;RUN; */ proc sort data=a1; by trt ; proc print; run;/* data=a1 NOOBS; */ proc glm data=a1 class rep trt germ herm weevil pday gshelf gcart month; model germ= herm weevil month herm*weevil*month; /*rep trt rep*trt rep*sample(trt);*/ random herm*weevil*month/test; lsmeans herm*weevi*month/slice=month;

234
run;quit; proc glm data=a1; class rep trt germ herm weevil pday gshelf gcart month; model germ= herm*weevil*month; /*rep trt rep*trt rep*sample(trt);*/ random herm*weevil*month/test; lsmeans herm*weevil*month; contrast 'month: 0 month vs 4, 8, 12th month' herm*weevil*month 3 -1 -1 -1; estimate 'month: 0 month vs 4, 8, 12th month' herm*weevil*month 3 -1 -1 – 1/divisor=3 ; contrast 'month: 0 month vs 4th month' herm*weevil*month 1 -1 0 0; estimate 'month: 0 month vs 4th month' herm*weevil*month 1 -1 0 0; contrast 'month: 0 month vs 8th month' herm*weevil*month 1 0 -1 0; estimate 'month: 0 month vs 8th month' herm*weevil*month 1 0 -1 0; contrast 'month: 0 month vs 12th month' herm*weevil*month 1 0 0 -1; estimate 'month: 0 month vs 12th month' herm*weevil*month 1 0 0 -1 ; contrast 'month: 4 month vs 8th month' herm*weevil*month 0 1 -1 0; estimate 'month: 4 month vs 8th month' herm*weevil*month 0 1 -1 0; contrast 'month: 4 month vs 12th month' herm*weevil*month 0 1 0 -1; estimate 'month: 4 month vs 12th month' herm*weevil*month 0 1 0 -1 ; contrast 'month: 8 month vs 12th month' herm*weevil*month 0 0 1 -1; estimate 'month: 8 month vs 12th month' herm*weevil*month 0 0 1 -1; run;quit; title 'WEEVILS/HERMETIC'; data a2; infile '\\iastate.edu\cyfiles\aaa\Desktop\GERMINATION RESEARCH\WEEVILS-H.TXT';

235
INPUT jar level rep trt sample subsample germ herm$ weevil$ pday gshelf gcart month tray;RUN; /*DATA aa(DROP=Obs);SET a1;RUN; */ proc sort data=a2; by trt ; run;/* proc print data=a2 NOOBS;*/ proc glm data=a2; class rep trt germ herm weevil pday gshelf gcart month; model germ= herm weevil month herm*weevil*month; /*rep trt rep*trt rep*sample(trt);*/ random herm*weevil*month/test; lsmeans herm*weevil*month/slice=month; run;quit; proc glm data=a2; class rep trt germ herm weevil pday gshelf gcart month; model germ= herm*weevil*month; /*rep trt rep*trt rep*sample(trt);*/ random herm*weevil*month/test; lsmeans herm*weevil*month; contrast 'month: 0 month vs 4, 8, 12th month' herm*weevil*month 3 -1 -1 -1; estimate 'month: 0 month vs 4, 8, 12th month' herm*weevil*month 3 -1 -1 – 1/divisor=3 ; contrast 'month: 0 month vs 4th month' herm*weevil*month 1 -1 0 0; estimate 'month: 0 month vs 4th month' herm*weevil*month 1 -1 0 0; contrast 'month: 0 month vs 8th month' herm*weevil*month 1 0 -1 0; estimate 'month: 0 month vs 8th month' herm*weevil*month 1 0 -1 0; contrast 'month: 0 month vs 12th month' herm*weevil*month 1 0 0 -1; estimate 'month: 0 month vs 12th month' herm*weevil*month 1 0 0 -1 ; contrast 'month: 4 month vs 8th month' herm*weevil*month 0 1 -1 0; estimate 'month: 4 month vs 8th month' herm*weevil*month 0 1 -1 0;

236
contrast 'month: 4 month vs 12th month' herm*weevil*month 0 1 0 -1; estimate 'month: 4 month vs 12th month' herm*weevil*month 0 1 0 -1 ; contrast 'month: 8 month vs 12th month' herm*weevil*month 0 0 1 -1; estimate 'month: 8 month vs 12th month' herm*weevil*month 0 0 1 -1; run;quit; title 'NO WEEVILS/HERMETIC'; data a3; infile '\\iastate.edu\cyfiles\aaa\Desktop\GERMINATION RESEARCH\NOWEEVILS- H.TXT'; INPUT jar level rep trt sample subsample germ herm$ weevil$ pday gshelf gcart month tray; RUN; proc sort data=a3; by trt ; run;/* proc print data=a3 NOOBS;*/ proc glm data=a3; class rep trt germ herm weevil pday gshelf gcart month; model germ= herm weevil month herm*weevil*month; /*rep trt rep*trt rep*sample(trt);*/ random herm*weevil*month/test; lsmeans herm*weevil*month/slice=month; run;quit; proc glm data=a3; class rep trt germ herm weevil pday gshelf gcart month;model germ= herm*weevil*month; /*rep trt rep*trt rep*sample(trt);*/ random herm*weevil*month/test; lsmeans herm*weevil*month; contrast 'month: 0 month vs 4, 8, 12th month' herm*weevil*month 3 -1 -1 -1; estimate 'month: 0 month vs 4, 8, 12th month' herm*weevil*month 3 -1 -1 – 1/divisor=3 ; contrast 'month: 0 month vs 4th month' herm*weevil*month 1 -1 0 0; estimate 'month: 0 month vs 4th month' herm*weevil*month 1 -1 0 0;

237
contrast 'month: 0 month vs 8th month' herm*weevil*month 1 0 -1 0; estimate 'month: 0 month vs 8th month' herm*weevil*month 1 0 -1 0; contrast 'month: 0 month vs 12th month' herm*weevil*month 1 0 0 -1; estimate 'month: 0 month vs 12th month' herm*weevil*month 1 0 0 -1 ; contrast 'month: 4 month vs 8th month' herm*weevil*month 0 1 -1 0; estimate 'month: 4 month vs 8th month' herm*weevil*month 0 1 -1 0; contrast 'month: 4 month vs 12th month' herm*weevil*month 0 1 0 -1; estimate 'month: 4 month vs 12th month' herm*weevil*month 0 1 0 -1 ; contrast 'month: 8 month vs 12th month' herm*weevil*month 0 0 1 -1; estimate 'month: 8 month vs 12th month' herm*weevil*month 0 0 1 -1; run;quit;title 'NO WEEVILS/NON HERMETIC'; data a4; infile '\\iastate.edu\cyfiles\aaa\Desktop\GERMINATION RESEARCH\NOWEEVILS- NH.TXT'; INPUT jar level rep trt sample subsample germ herm$ weevil$ pday gshelf gcart month tray; RUN;/* DATA aa(DROP=Obs);SET a2;RUN;*/ proc sort data=a4; by trt ; run;/*proc print data=a4 NOOBS; */ proc glm data=a4; class rep trt germ herm weevil pday gshelf gcart month; model germ= herm weevil month herm*weevil*month; /*rep trt rep*trt rep*sample(trt);*/ random herm*weevil*month/test; lsmeans herm*weevil*month/slice=month; run;quit; proc glm data=a4; class rep trt germ herm weevil pday gshelf gcart month;

238
model germ= herm*weevil*month; /*rep trt rep*trt rep*sample(trt);*/ random herm*weevil*month/test; lsmeans herm*weevil*month; contrast 'month: 0 month vs 4, 8, 12th month' herm*weevil*month 3 -1 -1 -1; estimate 'month: 0 month vs 4, 8, 12th month' herm*weevil*month 3 -1 -1 – 1/divisor=3 ; contrast 'month: 0 month vs 4th month' herm*weevil*month 1 -1 0 0; estimate 'month: 0 month vs 4th month' herm*weevil*month 1 -1 0 0; contrast 'month: 0 month vs 8th month' herm*weevil*month 1 0 -1 0; estimate 'month: 0 month vs 8th month' herm*weevil*month 1 0 -1 0; contrast 'month: 0 month vs 12th month' herm*weevil*month 1 0 0 -1; estimate 'month: 0 month vs 12th month' herm*weevil*month 1 0 0 -1 ; contrast 'month: 4 month vs 8th month' herm*weevil*month 0 1 -1 0; estimate 'month: 4 month vs 8th month' herm*weevil*month 0 1 -1 0; contrast 'month: 4 month vs 12th month' herm*weevil*month 0 1 0 -1; estimate 'month: 4 month vs 12th month' herm*weevil*month 0 1 0 -1 ; contrast 'month: 8 month vs 12th month' herm*weevil*month 0 0 1 -1; estimate 'month: 8 month vs 12th month' herm*weevil*month 0 0 1 -1; run;quit;
E.2 PREDICTED TIME TO COMPLETE ADULT WEEVIL MORTALITY
RESEARCH ANALYSIS
DM 'LOG;CLEAR;OUTPUT;CLEAR;';/*USE*/ TITLE 'FINAL ANALYSIS'; DATA PTCM; infile '\\iastate.edu\cyfiles\aaa\Desktop\GERMINATION RESEARCH\PTCM.TXT';

239
INPUT Obs Run day trt num herm$ block level; RUN; /*proc print data=PTCM ;run;*/ PROC SORT data= PTCM;BY herm; RUN; /*proc print data=PTCM NOOBS; run; QUIT;*/ PROC GLM DATA=PTCM; CLASS Run day trt num herm block level; MODEL num=day herm day*herm; run; quit; PROC GLM DATA=PTCM; CLASS Run day trt num herm block level; MODEL num=trt level trt*level level(block); run; quit; PROC GLM DATA=PTCM; CLASS Run day trt num herm block level; MODEL num=trt level trt*level level(block) trt*level(block); lsmeans trt*level level(block) trt*level(block); run; quit; PROC GLM DATA=PTCM; CLASS Run day trt num herm block level; MODEL num=day herm day*herm; lsmeans herm day*herm; run; quit; PROC GLM DATA=PTCM; CLASS Run day trt num herm block level; MODEL num=trt level trt*level level (block) trt*level(block) ; lsmeans level level(block) trt*level; run; quit; PROC GLM DATA=PTCM; CLASS Run day trt num herm block level; MODEL num=trt level trt*level block(level) trt*block(level);run; quit; PROC GLM DATA=PTCM; CLASS Run day trt herm block level; MODEL num=trt level trt*level block(level) trt*block(level)/ss3; RANDOM block(level) trt*block(level); run; quit; PROC MIXED DATA=PTCM method=type3; CLASS Run day trt herm block level; MODEL num=trt level trt*level; RANDOM block(level) trt*block(level); run; quit; PROC GLM DATA=PTCM; CLASS herm day;MODEL num=day herm herm*day;

240
LSMEANS herm*day/stderr; RUN; QUIT; proc sort data=PTCM; by herm; PROC GLM DATA=PTCM; CLASS herm; MODEL num=herm; MEANS herm/hovtest; contrast 'herm' herm 1 -1; estimate 'Herm vs. Non-herm' herm 1 -1 ; run;quit; proc sort data=PTCM; by trt; PROC GLM DATA=PTCM; CLASS trt; MODEL num=trt; MEANS trt/hovtest; contrast 'treatments' trt 1 1 1 -1 -1 -1; estimate 'Herm vs. Non-herm' trt 1 1 1 -1 -1 -1 ;run;quit; DATA a; infile '\\iastate.edu\cyfiles\aaa\Desktop\GERMINATION RESEARCH\DATAa.TXT'; INPUT Obs Run day trt num herm$ block level; RUN; /*proc print data=a ;run;*/ PROC GLM DATA=a; CLASS Run day trt num herm block level; MODEL num=trt; contrast 'Hermetic treatment contrasts' trt 3 -1.5 -1.5; run; quit; proc sort; by trt; DATA b; infile '\\iastate.edu\cyfiles\aaa\Desktop\GERMINATION RESEARCH\DATAb.TXT'; INPUT Obs Run day trt num herm$ block level; RUN; /*proc print data=b ;run;*/ proc sort; by trt; PROC GLM DATA=b; CLASS Run day trt num herm block level; MODEL num=trt; contrast 'Non hermetic treatment contrasts' trt 3 -1.5 -1.5; run; quit; Title 'LEVEL EFFECTS'; proc sort data=PTCM; by level;run; PROC GLM DATA=PTCM; CLASS Run day trt num herm block level; MODEL num=level; contrast 'Non hermetic treatment contrasts' level 1 0.5 0.5;run; quit;

241
Title '20-L CONTAINER ANALYSIS'; DATA jcan; infile '\\iastate.edu\cyfiles\aaa\Desktop\GERMINATION RESEARCH\jcan.TXT'; INPUT label type$ pcent; RUN; PROC GLM DATA=jcan; CLASS type pcent; MODEL pcent=type; lsmeans type; run; quit; proc sort data=jcan; by type; proc print data=jcan; run; PROC GLM DATA=jcan; CLASS type; MODEL pcent=type; MEANS type/hovtest; contrast 'treatments' type 1 -1; estimate 'Herm vs. Non-herm' type 1 -1 ; run;quit; TITLE 'NON HERMETIC'; DATA NONHERMETIC; infile '\\iastate.edu\cyfiles\aaa\Desktop\GERMINATION RESEARCH\GERMINATION-ALL.TXT'; INPUT Obs Run day trt num herm$ block level; RUN; /*proc print data= NONHERMETIC ;run;*/ PROC SORT DATA=NONHERMETIC; BY day; RUN;/*PROC PRINT NOOBS DATA=NONHERMETIC; RUN;*/ PROC GLM DATA=NONHERMETIC; CLASS Run day trt num herm block level; MODEL num= day*herm; lsmeans day*herm; contrast '17 days vs 21 and 26 days' day*herm 2 -1 -1; estimate '17 days vs 21 and 26 days' day*herm 2 -1 -1/divisor=2; contrast '17 days vs 21 days' day*herm 1 -1 0; estimate '17 days vs 21 days' day*herm 1 -1 0; contrast '17 days vs 26 days' day*herm 1 0 -1; estimate '17 days vs 26 days'

242
day*herm 1 0 -1; contrast '21 days vs 26 days' day*herm 1 -1 0; estimate '21 days vs 26 days' day*herm 1 -1 0;run;quit; TITLE 'HERMETIC'; DATA HERMETIC; infile '\\iastate.edu\cyfiles\aaa\Desktop\GERMINATION RESEARCH\GERMINATION-ALL.TXT'; INPUT Obs Run day trt num herm$ block level; RUN; /*proc print data= HERMETIC ;run;*/ PROC SORT DATA=HERMETIC; BY day; RUN;/*PROC PRINT NOOBS DATA=HERMETIC; RUN;*/ PROC GLM DATA=HERMETIC; CLASS Run day trt num herm block level; MODEL num= day*herm; lsmeans day*herm; contrast '17 days vs 21 and 26 days' day*herm 2 -1 -1; estimate '17 days vs 21 and 26 days' day*herm 2 -1 -1/divisor=2; contrast '17 days vs 21 days' day*herm 1 -1 0; estimate '17 days vs 21 days' day*herm 1 -1 0; contrast '17 days vs 26 days' day*herm 1 0 -1; estimate '17 days vs 26 days' day*herm 1 0 -1; contrast '21 days vs 26 days' day*herm 1 -1 0; estimate '21 days vs 26 days' day*herm 1 -1 0; run;quit;
243
E.3 RECYCLED CONTAINERS RESEARCH ANALYSIS DM 'LOG;CLEAR;OUTPUT;CLEAR;'; OPTIONS FORMDLIM='-' NOCENTER NONUMBER NODATE; TITLE; DATA z; TITLE1 'RECYCLING RESEARCH-FULL RUN'; infile '\\iastate.edu\cyfiles\aaa\Desktop\z.TXT'; INPUT EU wipe rep trt quantity method$ container$;RUN; proc print data=z;run; PROC GLM DATA=z;CLASS EU wipe rep trt quantity method container;MODEL quantity = trt; RUN;quit; PROC GLM data=z; class EU wipe rep trt quantity method container; model quantity=trt; LSMEANS trt/stderr; means trt;run; title2 'CONTAINS ALL ERRORS AND MAIN EFFECTS'; PROC GLM data=z; class EU wipe rep trt quantity method container; model quantity= wipe rep trt rep*trt wipe*trt wipe*rep*trt; lsmeans wipe rep trt rep*trt wipe*trt wipe*rep*trt; run;quit; title2 'TEST OF HYPOTHESIS 2'; PROC GLM data=z;class EU wipe rep trt quantity method container; model quantity=wipe rep trt rep*trt wipe*trt wipe*rep*trt; random wipe wipe*trt wipe*rep*trt; test h=rep e=rep*trt;test h=trt e=rep*trt; test h=wipe e=wipe*rep*trt;test h=wipe*trt e=wipe*rep*trt;run;quit; title3 'INTERACTIONS ONLY'; PROC GLM data=z;class EU wipe rep trt quantity method container; model quantity= method container method*container;

244
lsmeans method container method*container; PROC MEANS method*container std n; VAR quantity;run; run;quit; title4 'INTERACTIONS ONLY-#2'; PROC GLM data=z; class EU wipe rep trt quantity method container; model quantity=wipe trt wipe*method wipe*container wipe*method*container; run;quit; title5 'INTERACTIONS ONLY-#3'; PROC GLM data=z; class EU wipe rep trt quantity method container; model quantity= wipe method container wipe*method wipe*container method*container wipe*method*container; lsmeans method container method*container wipe*method wipe*method*container; MEANS method container method*container wipe*method wipe*method*container; run;quit; TITLE6 'CONTRAST: NOOBS AND CONTRAST'; DATA p; infile '\\iastate.edu\cyfiles\aaa\Desktop\p.TXT'; INPUT EU wipe rep trt quantity method$ container$;RUN; /*proc print data=p ;run;*/ proc print data=p;run; proc sort; by trt; PROC GLM data=p; class EU wipe rep trt quantity method container; model quantity= trt;lsmeans trt ; contrast 'trt: Oil vs hot water and soap' trt 1 -0.5 -0.5;

245
estimate 'oil vs others' trt 1 -0.5 -0.5;run;quit; TITLE7 'CONTRASTS NEEDED BELOW'; TITLE8 'CONTRAST: CONTaminated only'; DATA contaminated; infile '\\iastate.edu\cyfiles\aaa\Desktop\contaminated.TXT'; INPUT EU wipe rep trt quantity method$ container$;RUN; proc sort data=contaminated; by trt; PROC GLM data=contaminated;class EU wipe rep trt quantity method container; model quantity= trt ;lsmeans trt;contrast 'trt: Oil vs hot water and soap' trt 1 -0.5 -0.5; estimate 'oil vs others' trt 1 -0.5 -0.5 ;run;quit; TITLE 'CONTRAST: CONTAMINATED-T TEST:HOT WATER VS. SOAP'; DATA J; infile '\\iastate.edu\cyfiles\aaa\Desktop\J.TXT'; INPUT EU wipe rep trt quantity method$ container$;RUN; /*proc print data=J ;run;*/ proc sort data=J; by method; proc print data=J noobs; run;/**/ proc ttest data=J; class oil-drai hot-wate ;var quantity;run;PROC GLM data=J; class EU wipe rep trt quantity method container;model quantity= trt;lsmeans trt ; contrast 'trt: Hot water vs soap' trt 1 -1;estimate 'hot water vs soap' trt 1 -1 ;run;quit; TITLE9 'CONTRAST: UNCONTaminated only';DATA uncontaminated; infile '\\iastate.edu\cyfiles\aaa\Desktop\uncontaminated.TXT'; INPUT EU wipe rep trt quantity method$ container$;RUN; /*proc print data=uncontaminated ;run;*/ proc sort data=uncontaminated; by trt; PROC GLM data=uncontaminated;
246
class EU wipe rep trt quantity method container; model quantity= trt ; lsmeans trt;contrast 'trt: Oil vs hot water and soap' trt 1 -0.5 – 0.5; estimate 'oil vs others' trt 1 -0.5 -0.5 ;run;quit; TITLE10 'CONTRAST: CONTAMINATED-T TEST:OIL VS. HOT WATER ';DATA Q; infile '\\iastate.edu\cyfiles\aaa\Desktop\Q.TXT'; INPUT EU wipe rep trt quantity method$ container$;RUN; /*proc print data=Q ;run;*/ proc sort data=Q; by trt; proc ttest data=Q; class oil-drai hot-wate ;var quantity;run;PROC GLM data=Q; class EU wipe rep trt quantity method container;model quantity= trt;lsmeans trt ; contrast 'trt: Oil vs hot water' trt 1 -1;estimate 'oil vs hot water' trt 1 -1; run;quit; TITLE1 'CONTRAST: CONTAMINATED-T TEST:OIL VS. SOAP '; DATA R; infile '\\iastate.edu\cyfiles\aaa\Desktop\R.TXT'; INPUT EU wipe rep trt quantity method$ container$;RUN; /*proc print data=R ;run;*/ proc sort data=R; by trt; proc ttest data=R; class oil-drai soap; var quantity;run; PROC GLM data=R;class EU wipe rep trt quantity method container;model quantity= trt;lsmeans trt ; contrast 'trt: Oil vs soap' trt 1 -1;estimate 'oil vs soap' trt 1 -1 ;run;quit; TITLE2 'CONTRAST: UNCONTAMINATED-T TEST:OIL VS. HOT WATER '; DATA S; infile '\\iastate.edu\cyfiles\aaa\Desktop\S.TXT'; INPUT EU wipe rep trt quantity method$ container$;RUN; /*proc print data=S ;run;*/

247
proc sort data=S; by trt; proc ttest data=S; class oil-drai hot-wate ;var quantity;run; PROC GLM data=S;class EU wipe rep trt quantity method container; model quantity= trt;lsmeans trt ;contrast 'trt: Oil vs hot water' trt 1 1; estimate 'oil vs hot water' trt 1 -1 ;run;quit; TITLE3 'CONTRAST: UNCONTAMINATED-T TEST:OIL VS. SOAP '; DATA T; infile '\\iastate.edu\cyfiles\aaa\Desktop\T.TXT'; INPUT EU wipe rep trt quantity method$ container$;RUN; /*proc print data=T ;run;*/ proc sort data=T; by trt; proc print noobs data=T; run; proc ttest data=T; class oil-drai hot-wate ;var quantity;run;PROC GLM data=T; class EU wipe rep trt quantity method container;model quantity= trt; lsmeans trt ; contrast 'trt: Oil vs soap' trt 1 -1;estimate 'oil vs soap' trt 1 -1 ;run;quit; TITLE 'CONTRAST: UNCONTAMINATED-T TEST:HOT WATER VS. SOAP'; DATA L; infile '\\iastate.edu\cyfiles\aaa\Desktop\L.TXT'; INPUT EU wipe rep trt quantity method$ container$;RUN; /*proc print data=L ;run;*/ proc sort data=L; by method; proc print data=L noobs; run; proc ttest data=L; class oil-drai hot-wate ; var quantity;run; PROC GLM data=L;class EU wipe rep trt quantity method container;model quantity= trt; lsmeans trt ;contrast 'trt: Hot water vs soap' trt 1 –1; estimate 'hot water vs soap' trt 1 -1 ; run;quit; DATA methodbycontainer; INPUT method$ quantity; DATALINES; hot-wate 0.14202222 oil-drai 0.24949444
248
soap 0.00385000 ;RUN; proc sort data=methodbycontainer; by method; TITLE1 'CONTAMINATED: method by container'; PROC GLM data=methodbycontainer; class method quantity;model quantity= method; contrast 'mean: oil vs Hot water' method 1 -1 0; estimate 'oil vs Hot water' method 1 -1 0; contrast 'mean: oil vs soap' method 1 0 -1;estimate 'oil vs soap' method 1 0 -1; contrast 'mean: Hot water vs. soap' method 0 1 -1;estimate 'Hot water vs soap' method 0 1 -1;run; DATA methodbycontainer1;INPUT method$ quantity; DATALINES; hot-wate 0.00595000 oil-drai 0.00523333 soap 0.00564444 ;RUN; proc sort data=methodbycontainer1; by method; TITLE1 'UNCONTAMINATED: method by container'; PROC GLM data=methodbycontainer1;class method quantity;model quantity= method; contrast 'mean: oil vs Hot water' method 1 -1 0;estimate 'oil vs Hot water' method 1 -1 0; contrast 'mean: oil vs soap' method 1 0 -1;estimate 'oil vs soap' method 1 0 -1;

249
contrast 'mean: Hot water vs. soap' method 0 1 -1;estimate 'Hot water vs soap' method 0 1 -1; run;