Reconstruction of Protein Backbones from the BriX Collection of Canonical Protein Fragments
11
Reconstruction of Protein Backbones from the BriX Collection of Canonical Protein Fragments Lies Baeten 1,2 , Joke Reumers 1,2 , Vicente Tur 3 , Franc ¸ ois Stricher 3 , Tom Lenaerts 1,2 , Luis Serrano 3 , Frederic Rousseau 1,2 *, Joost Schymkowitz 1,2 * 1 SWITCH Laboratory, Vrije Universiteit Brussels, Brussels, Belgium, 2 VIB, Vrije Universiteit Brussels, Belgium, 3 Center for Genomic Regulation, Barcelona, Spain Abstract As modeling of changes in backbone conformation still lacks a computationally efficient solution, we developed a discretisation of the conformational states accessible to the protein backbone similar to the successful rotamer approach in side chains. The BriX fragment database, consisting of fragments from 4 to 14 residues long, was realized through identification of recurrent backbone fragments from a non-redundant set of high-resolution protein structures. BriX contains an alphabet of more than 1,000 frequently observed conformations per peptide length for 6 different variation levels. Analysis of the performance of BriX revealed an average structural coverage of protein structures of more than 99% within a root mean square distance (RMSD) of 1 Angstrom. Globally, we are able to reconstruct protein structures with an average accuracy of 0.48 Angstrom RMSD. As expected, regular structures are well covered, but, interestingly, many loop regions that appear irregular at first glance are also found to form a recurrent structural motif, albeit with lower frequency of occurrence than regular secondary structures. Larger loop regions could be completely reconstructed from smaller recurrent elements, between 4 and 8 residues long. Finally, we observed that a significant amount of short sequences tend to display strong structural ambiguity between alpha helix and extended conformations. When the sequence length increases, this so-called sequence plasticity is no longer observed, illustrating the context dependency of polypeptide structures. Citation: Baeten L, Reumers J, Tur V, Stricher F, Lenaerts T, et al. (2008) Reconstruction of Protein Backbones from the BriX Collection of Canonical Protein Fragments. PLoS Comput Biol 4(5): e1000083. doi:10.1371/journal.pcbi.1000083 Editor: Roland Dunbrack, Fox Chase Cancer Center, United States of America Received September 21, 2007; Accepted April 7, 2008; Published May 23, 2008 Copyright: ß 2008 Baeten et al. This is an open-access article distributed under the terms of the Creative Commons Attribution License, which permits unrestricted use, distribution, and reproduction in any medium, provided the original author and source are credited. Funding: LB was funded by a PhD grant from the Institute for the Promotion of Innovation through Science and Technology in Flanders (IWT-Vlaanderen), Belgium. Competing Interests: The authors have declared that no competing interests exist. * E-mail: [email protected] (FR); [email protected] (JS) Introduction High-resolution structure determination of proteins and protein complexes via experimental methods occurs at a significantly slower pace than the collection of novel protein sequences. As a result, less than 30% of human proteins have a known structure in the Protein Data Bank and the percentage for other species is significantly lower [1]. In addition, structures mostly cover one or a small number of protein domains, thus covering only a fraction of the total sequence of the protein. Homology modeling improves this coverage using related proteins with known structures to build a model [2–5]. The construction of an adequate homolog can be divided into two related tasks: the placement of the amino acid side chains on a given backbone template and the detection of changes in backbone conformations that are required to accommodate the new sequence. For proteins that are relatively close in terms of sequence identity, the backbone-modeling problem is usually ignored, but in many cases the best homology template shows less than 50% homology with the target, and small compensatory changes to the backbone are likely to be required to obtain an accurate model. Recent advances in protein backbone modeling are based on the observation that protein structures are built from a finite repertoire of structural folds [6]. Structural redundancy allowed the classification of protein folds such as in the SCOP database [7], the CATH database [8] or the FSSP classification [9,10]. The unit of fold classification is usually a protein domain, since large proteins are generally composed of multiple domains. As a consequence, the classification comprises a hierarchical organisation of protein domains that embodies evolutionary and structural relationships. By creating more categories and thus refining the secondary structure descriptions, it has been proposed that a set of discrete backbone conformational states can be derived [11,12]. Different research groups demonstrated the usefulness of such fragment libraries when reconstructing protein structures by generating sets of protein decoys [13–17]. In the latest editions of CASP, prediction approaches that assemble fragments of known structures into a candidate structure have proven to be successful [17–20]. In fragment assembly methods, the assumption is made that local interactions create a particular conformational bias, but do not uniquely define local structure [21–24]. Instead, environmental constraints will determine the overall compact protein conformation. The construction of a final model is composed of three steps: The first step involves a selection of fragment candidates based on their stability that can be measured by a simplified scoring function [25]. In the second step the fragments are assembled combinatorially [26,27]. In the final step the obtained structure is optimized through the employment of a force field [27,28]. This method works well for small all a class proteins, and reasonably well for a/b, a+b and all b class proteins. The fragment approach has been successfully applied in the PLoS Computational Biology | www.ploscompbiol.org 1 May 2008 | Volume 4 | Issue 5 | e1000083
-
Upload
independent -
Category
Documents
-
view
0 -
download
0
Transcript of Reconstruction of Protein Backbones from the BriX Collection of Canonical Protein Fragments

Reconstruction of Protein Backbones from the BriXCollection of Canonical Protein FragmentsLies Baeten1,2, Joke Reumers1,2, Vicente Tur3, Francois Stricher3, Tom Lenaerts1,2, Luis Serrano3, Frederic
Rousseau1,2*, Joost Schymkowitz1,2*
1 SWITCH Laboratory, Vrije Universiteit Brussels, Brussels, Belgium, 2 VIB, Vrije Universiteit Brussels, Belgium, 3 Center for Genomic Regulation, Barcelona, Spain
Abstract
As modeling of changes in backbone conformation still lacks a computationally efficient solution, we developed adiscretisation of the conformational states accessible to the protein backbone similar to the successful rotamer approach inside chains. The BriX fragment database, consisting of fragments from 4 to 14 residues long, was realized throughidentification of recurrent backbone fragments from a non-redundant set of high-resolution protein structures. BriXcontains an alphabet of more than 1,000 frequently observed conformations per peptide length for 6 different variationlevels. Analysis of the performance of BriX revealed an average structural coverage of protein structures of more than 99%within a root mean square distance (RMSD) of 1 Angstrom. Globally, we are able to reconstruct protein structures with anaverage accuracy of 0.48 Angstrom RMSD. As expected, regular structures are well covered, but, interestingly, many loopregions that appear irregular at first glance are also found to form a recurrent structural motif, albeit with lower frequency ofoccurrence than regular secondary structures. Larger loop regions could be completely reconstructed from smallerrecurrent elements, between 4 and 8 residues long. Finally, we observed that a significant amount of short sequences tendto display strong structural ambiguity between alpha helix and extended conformations. When the sequence lengthincreases, this so-called sequence plasticity is no longer observed, illustrating the context dependency of polypeptidestructures.
Citation: Baeten L, Reumers J, Tur V, Stricher F, Lenaerts T, et al. (2008) Reconstruction of Protein Backbones from the BriX Collection of Canonical ProteinFragments. PLoS Comput Biol 4(5): e1000083. doi:10.1371/journal.pcbi.1000083
Editor: Roland Dunbrack, Fox Chase Cancer Center, United States of America
Received September 21, 2007; Accepted April 7, 2008; Published May 23, 2008
Copyright: � 2008 Baeten et al. This is an open-access article distributed under the terms of the Creative Commons Attribution License, which permitsunrestricted use, distribution, and reproduction in any medium, provided the original author and source are credited.
Funding: LB was funded by a PhD grant from the Institute for the Promotion of Innovation through Science and Technology in Flanders (IWT-Vlaanderen),Belgium.
Competing Interests: The authors have declared that no competing interests exist.
* E-mail: [email protected] (FR); [email protected] (JS)
Introduction
High-resolution structure determination of proteins and protein
complexes via experimental methods occurs at a significantly
slower pace than the collection of novel protein sequences. As a
result, less than 30% of human proteins have a known structure in
the Protein Data Bank and the percentage for other species is
significantly lower [1]. In addition, structures mostly cover one or
a small number of protein domains, thus covering only a fraction
of the total sequence of the protein. Homology modeling improves
this coverage using related proteins with known structures to build
a model [2–5]. The construction of an adequate homolog can be
divided into two related tasks: the placement of the amino acid side
chains on a given backbone template and the detection of changes
in backbone conformations that are required to accommodate the
new sequence. For proteins that are relatively close in terms of
sequence identity, the backbone-modeling problem is usually
ignored, but in many cases the best homology template shows less
than 50% homology with the target, and small compensatory
changes to the backbone are likely to be required to obtain an
accurate model. Recent advances in protein backbone modeling
are based on the observation that protein structures are built from
a finite repertoire of structural folds [6]. Structural redundancy
allowed the classification of protein folds such as in the SCOP
database [7], the CATH database [8] or the FSSP classification
[9,10]. The unit of fold classification is usually a protein domain,
since large proteins are generally composed of multiple domains.
As a consequence, the classification comprises a hierarchical
organisation of protein domains that embodies evolutionary and
structural relationships. By creating more categories and thus
refining the secondary structure descriptions, it has been proposed
that a set of discrete backbone conformational states can be
derived [11,12]. Different research groups demonstrated the
usefulness of such fragment libraries when reconstructing protein
structures by generating sets of protein decoys [13–17]. In the
latest editions of CASP, prediction approaches that assemble
fragments of known structures into a candidate structure have
proven to be successful [17–20]. In fragment assembly methods,
the assumption is made that local interactions create a particular
conformational bias, but do not uniquely define local structure
[21–24]. Instead, environmental constraints will determine the
overall compact protein conformation. The construction of a final
model is composed of three steps: The first step involves a selection
of fragment candidates based on their stability that can be
measured by a simplified scoring function [25]. In the second step
the fragments are assembled combinatorially [26,27]. In the final
step the obtained structure is optimized through the employment
of a force field [27,28]. This method works well for small all a class
proteins, and reasonably well for a/b, a+b and all b class proteins.
The fragment approach has been successfully applied in the
PLoS Computational Biology | www.ploscompbiol.org 1 May 2008 | Volume 4 | Issue 5 | e1000083

structure prediction algorithm Rosetta of Baker and co-workers
[29–31], which also proved to be successful in accurately designing
new folds [32]. Publicly accessible libraries however are limited;
they are typically small and consider lengths between 4 and 7
residues. For instance, by examining fragments of 5 residues,
Kolodny and Levitt [6] created a library of 20 fragments, while
Etchebest found only 16 building blocks of this length [33]. The
alphabet of Camproux [34] consists of 27 structural classes and is
based on motives of 4 residues. By employing their hypercosine
method on a set of 150,000 length-7 protein fragments, Hunter
and Subramaniam [35] discovered 13 minimal centroids or
representative fragment shapes found in proteins at a resolution of
0.80 Angstrom. As such low resolution approaches, restricted to a
single fragment length and thus resulting in a limited set of
building blocks, might constitute an advantage in terms of
computational efficiency for ab initio structure prediction methods,
it will also lead to a significant loss of information. Wainreb et al
made it possible to cluster variable sized fragments, consisting of at
least 15 residues, through the implementation of their SSGS
algorithm [36]. By allowing more variability in the alignment of
loop locations, they created a library of 8,933 building blocks. An
alternative approach, as implemented by DePristo et al [37], uses
an ensemble of artificially generated small polypeptide conforma-
tions instead of sampling conformations from known protein
structures. By constraining the chemical properties such as the
idealized geometry, phi/psi angles and excluded volume they
constructed ensembles of near-native conformations consistent
with a surrounding fixed protein structure. Our strategy focuses on
obtaining a comprehensive set of high-resolution structural
fragments without using artificial data or restricting fragment
lengths. We decided to partition a non-redundant set of high-
resolution protein structures into fragments that consist of 4 to 14
residues, because preliminary tests indicated the lack of high
structural similarity for more than 50% of all fragments when
larger lengths were considered. Subsequently, clustering tech-
niques were employed to identify structural motifs that are
recurrent in different protein structures. Over 1,000 recurrent
fragment structures or classes were found for each considered
peptide length when a structural variation proportional to the
length of the fragment (0.1 Angstrom per residue) was allowed. As
suggested in [6,38], it is important to determine how well the
classes of the fragment library cover fold space in order to estimate
its value. When applied to protein structures not used in the
construction of the database, this coverage turned out to be 99%
on average using a 1 Angstrom RMSD threshold. The latter
implies that in the majority of the cases studied the so-called
irregular regions or loops can also be reconstructed from recurrent
building blocks. Through the employment of a global fit
reconstruction algorithm, backbone traces were generated having
an average accuracy of 0.48 Angstrom RMSD.
Additionally, the ability to use BriX for local secondary
structure prediction was examined by looking at the sequence-
structure relationship within classes. According to previous
findings [25], the sequence conservation within classes was rather
low because of the large number of determined building blocks
originating from different families. Nonetheless, this analysis led to
a quantitative illustration of the context-dependence of polypep-
tide structure. A significant amount of small sequences tend to
display strong structural ambiguity: for fragments of length 5, 14%
of the fragment pairs with identical sequences have structural
difference within the range of a helix-to-sheet jump. These so-
called plastic sequences, i.e. sequences that display diverse
structural conformations, display a strong preference for the
aliphatic residues Alanine, Valine, and Leucine. For fragments of
more than 5 residues sequence plasticity is no longer observed,
showing that the need for additional context to determine
secondary structure is much reduced for longer fragments.
Results/Discussion
By sliding a window of varying length (4–14 amino acids) over a
non-redundant set of 1,261 high quality protein structures
retrieved from the WHAT IF software package [39], about
260,000 protein fragments of each length were obtained. Using a
multi-step clustering approach (see Materials and Methods
section), these fragments were clustered into more than 1,000 up
to approximately 2,000 structural classes, for each length ranging
from 4 to 14 residues. Furthermore, we distinguished different
degrees of variation inside the classes, by performing the clustering
with 6 different distance thresholds. For instance, the considered
RMSD thresholds for fragments consisting of 7 residues were 0.5,
0.6, 0.7, 0.8, 0.9 and 1.0 Angstrom. Clustering with varying
RMSD thresholds was performed to provide degrees of structural
diversity that are suited for a wide range of modeling
requirements. Particularly for homology modeling, the threshold
variation is a useful parameter for modeling structures with
varying sequence identity. Lower thresholds yield more accurate
fits for high identity regions, while larger thresholds enable the
modeling of loops or other regions with lower sequence identity.
Larger thresholds often result in fanlike shapes at the end of the
fragments and at local loop positions. Figure 1 illustrates the
structural variation within equivalent classes comprising 7 residues
constructed at different. Increasing the distance threshold used to
cluster the fragments resulted in a decrease in the number of
classes being identified as regular structures. The number of
classified fragments, i.e. fragments belonging to a fragment class,
increased with larger thresholds applied in the clustering process
(see Figure 2A). A larger threshold implies a wider radius around
the class centroids, and thus larger and fewer classes with more
internal variation. Monitoring the number of classes in function of
the length of fragments classified at a fixed threshold (RMSD of
0.9 Angstrom, Figure 2B), we observed an increase in the number
of classes with length until a fragment length of 11 residues, after
which the number of classes dropped steeply (length 12–14). This
turning point at fragment length 11 was not observed when
Author Summary
Large-scale DNA sequencing efforts produce largeamounts of protein sequence data. However, in order tounderstand the function of a protein, its tertiary three-dimensional structure is required. Despite worldwideefforts in structural biology, experimental protein struc-tures are determined at a significantly slower pace. As aresult, computational methods for protein structureprediction receive significant attention. A large part ofthe structure prediction problem lies in the enormous sizeof the problem: proteins seem to occur in an infinitevariety of shapes. Here, we propose that this hugecomplexity may be overcome by identifying recurrentprotein fragments, which are frequently reused as buildingblocks to construct proteins that were hitherto thought tobe unrelated. The BriX database is the outcome ofidentifying about 2,000 canonical shapes among 1,261protein structures. We show any given protein can bereconstructed from this library of building blocks at a veryhigh resolution, suggesting that the modelling of proteinbackbones may be greatly aided by our database.
BriX: A Collection of Canonical Protein Fragments
PLoS Computational Biology | www.ploscompbiol.org 2 May 2008 | Volume 4 | Issue 5 | e1000083

plotting the percentage of fragments classified at RMSD threshold
0.9 versus the fragment length (Figure 2C). Here a smooth decline
of the number of classified fragments for increasing fragment
lengths was observed. When the same analysis was performed on
clustering results for RMSD thresholds proportional to fragment
length (0.1 Angstrom variation per residue), thus allowing more
variation for larger fragment lengths, a similar pattern applied.
Although less steep, we still observed a decrease of the percentage
of classified fragments with increasing fragment length (Figure 2C).
Again, a turning point (at fragment length 9) after which the
number of classes dropped was observed (Figure 2B), albeit at a
different fragment length then when a fixed threshold was applied.
These results indicate that increasing the clustering threshold for
longer fragments did not suffice to construct the same number of
fragment classes as at shorter lengths. Increasing fragment length
results in a larger conformational space and variability of classes,
impairing the clustering of fragments into well-defined classes.
The Building BlocksThe dendogram in Figure 3 is the result of applying a clustering
approach similar to the one used to construct the BriX database
on the class centroids comprising 7 residues. In this way, the
fragment space is rebuilt by grouping the BriX classes into
superclasses based on root mean square distances between the class
centroids. For reasons of simplicity only the largest classes (i.e.
superclasses that contain more than 1% of BriX classes) are shown
on each level. At the top of the classification, one branch is shown
that comprises 98.6% of all classes and 87.9% of all fragments
allowing a maximal distance of 1.8 Angstrom RMSD between the
class centroids. At the second level the clustering method is
capable of separating the two principal secondary structure
elements: strands and helices. These segregrate further into
smaller, more specific conformations. A counterintuitive result is
that the clustering method does not differentiate between turn and
helix secondary structure elements on the top level. Instead we find
them at different levels in the tree (see Superclasses i, m, n and q).
Figure 4A shows the percentage of fragments that were found to
be recurrent regarding an increasing distance threshold. Clearly
shown is the difficulty to classify sheets and loops, despite an
increasing distance threshold. This is because they do not exist in
well-defined conformations, but instead occupy a wide range of
geometries. As a consequence, only a few recurring structures
could be identified, resulting in a low number of classes and a large
number of unclassified sheet- and loop fragments. This was also
observed by Du et al [40] when determining the probability of
finding a short protein fragment back among non-homologous
structures in the Protein Data Bank. According to Figure 4A, the
authors perceived a nearest neighbor RMSD distribution for bfragments close to that for loop fragments.
Further analysis revealed the tendency of turns to become
associated with helix classes when larger distance thresholds were
applied. Another observation, as can be seen in both Figure 3 and
Figure 4B, was the small amount of structural variants found in the
helical classes, resulting in a low number of identified helix classes,
while the vast majority of the helical fragments were classified.
Strand fragments, on the other hand, exhibited a lot more
structural variation, resulting in a significantly larger number of
smaller classes.
Figures S1A and S1B show the frequency of the four main
secondary structure elements inside the BriX classes comprising 10
and 7 residues. The DSSP (Dictionary of Protein Secondary
Structure [41]) secondary structure assignments for the four main
secondary structure elements (helix, sheet, turn and loop) were
counted and plotted against the percentage of classes with a similar
composition. Clearly shown is the occurrence of turns and loops in 1
to 4 residue patterns, whereas helices and strands take up longer
stretches within the fragment (peaks at 5 and 6 residues
respectively). Classes of 10-residue long fragments revealed a
substantial heterogeneity, as the presence of pure classes is below
5%. For fragments consisting of 7 residues, on the contrary, we
observed a percentage of nearly 25% pure helix classes and 5%
pure sheet classes.
Validation Tests on the BriX Fragment ClassesThe relevance of the created fragment classes in the BriX
database was evaluated by two validation tests based on 7,290 high
resolution protein structures taken from the Astral set with less
than 40% internal structural homology [42]. In the first test, the
generated Astral fragments were classified into the existing BriX
class hierarchy to assess whether the vocabulary of fragments
obtained from the WHAT IF structure set was sufficient to
describe the Astral40 structure set. In the second test the fragment
classes were used to reconstruct the backbones of all known human
structures in the Protein Data Bank (PDB) using a novel backbone
coverage algorithm.
In the first test, a special focus was directed towards the
classification differences of a-, b-, a/b- and a+b proteins. In
addition to removing sequence redundancy to exclude homologs,
the test set was constructed following the structural hierarchy of
SCOP [7]. Figure 4C illustrates the potential of BriX to give a
Figure 1. Effect of varying RMSD on structural variation within a class. The plot shows the fragment content of equivalent BriX classes oflength 7 created with fixed RMSD thresholds from 0.6 to 1 Angstrom. The increase in structural variation with higher RMSD thresholds is notuniformly distributed over all positions; there is a clear tendency towards the terminal positions (both carboxy- and amino-terminal), resulting in afan-like arrangement.doi:10.1371/journal.pcbi.1000083.g001
BriX: A Collection of Canonical Protein Fragments
PLoS Computational Biology | www.ploscompbiol.org 3 May 2008 | Volume 4 | Issue 5 | e1000083

good representation of protein structures in general. Although the
full Astral set followed a classification pattern similar to the
WHAT IF set, a clear correlation with the fold was noted. In
accordance with the previous finding of [35], SCOP classes with
higher helical content reached a higher level of classification (from
70% up to 95%) than those mainly composed of sheets (from 10%
up to 70%). As there was less variation within helical classes, more
fragments were classified at lower thresholds. At higher thresholds
the difference between the folds diminished.
In order to assess the accuracy of a fragment library to describe
known protein structures two different measures have been
proposed in previous works [6,34]: the local fit and global fit
approximation. The first measure determines how well each
fragment of a protein structure can be locally approximated by the
best corresponding fragment class. Note that in this test it is not
required to assemble the fragments to obtain a unique backbone
trace. In addition, we calculated the total percentage of the
structure that could be covered by the fragment classes (see
Materials and Methods section). For reasons of generality, the
validation test considered a representative set of human proteins,
extracted from the PDB database (see Materials and Methods
section). This relatively small set contained 935 structures,
equivalently balanced over the existing folds (as is illustrated in
Table 1). In order to fully consider the secondary structure
differences, separate tests were carried out for a (A) proteins, b (B)
proteins, a and b (A/B and A+B) proteins, according to the SCOP
classification. With an average RMSD of 0.16 Angstrom for the
local fit approximation BriX improves the previously obtained
0.23 Angstrom RMSD by Camproux et al using 27 structural
classes [34]. Kolodny and Levitt achieved an average RMSD of
0.26 and 0.39 Angstrom for respectively 4 and 14 classes
considering fragments of four-residue length [16], The 16-states
alphabet describing fragments of 5 residues of De Brevern et al
[43] approximated the local structure with an accuracy of 0.51
Angstrom. Furthermore, Table 1 shows BriX achieves a coverage
of 99 to 100%. Figure 5 illustrates an all a (5A) and an all b (5B)
class protein, originating from the human proteins validation set,
entirely covered by BriX classes. Remarkable is that even all bproteins and irregular structures such as loops appeared to have full
coverage of BriX classes. This implies that in spite of their
hypervariable character, loops are made up of regular building
blocks.
The second measure to qualify a fragment library is the global
fit approximation in which a whole protein is reconstructed using
Figure 2. BriX clustering statistics. (A) Effect of increasing RMSDthreshold. Shown is the number of BriX classes (circles) and thepercentage of classified fragments (squares) in function of the RMSDthreshold (0.5–1.0 Angstrom) used during the clustering for fragmentscontaining 7 residues. As expected, higher thresholds result in fewer
fragment classes and more identified recurrent fragment structures asthe variation within a class is higher and a class thus contains moreelements. A threshold of 0.6 Angstrom is sufficient to classify more thanhalf of all fragments of length 7. (B) Number of classes for varyingfragment lengths. Shown is the number of classes in function of thefragment length clustered with a fixed RMSD threshold (circles) of 0.9Angstrom and a RMSD proportional to the fragment length (squares),by increasing the RMSD with 0.1 Angstrom per residue. In both figures,the number of classes increases with the length until a turning point isreached, after which the number of classes drops steeply. When a fixedRMSD is applied, this turning point clearly occurs at fragment length 11,reaching the level of 2,740 classes. (C) Percentage of classifiedfragments for varying fragment lengths. Shown is the percentage ofclassified fragments in function of the fragment length clustered with afixed RMSD threshold (circles) of 0.9 Angstrom and a RMSDproportional to the fragment length (squares), by increasing the RMSDwith 0.1 Angstrom per residue. In both plots, the number of classifiedfragments smoothly decreases when larger fragment lengths areconsidered. When a proportional RMSD is applied, this decrease is lesssteep, resulting in a classification percentage of more than 40%compared with 26% (fixed RMSD) at fragment length 14.doi:10.1371/journal.pcbi.1000083.g002
BriX: A Collection of Canonical Protein Fragments
PLoS Computational Biology | www.ploscompbiol.org 4 May 2008 | Volume 4 | Issue 5 | e1000083

the BriX fragment classes. By employing a depth-first search
algorithm (see Materials and Methods section) backbone traces for
the human proteins were generated (see Figure 5C and 5D). To
avoid ambiguity we repeated this experiment on the Park & Levitt
set [44], which has also been considered during previous
reconstruction attempts [6,34]. Although the calculation of the
best global fit approximation was computationally too expensive,
we achieved an average accuracy of 0.48 Angstrom RMSD for the
resulting backbone reconstructions (see Figure S2A). In order to
obtain this accuracy, the fragment classes from all lengths were
considered. On the same protein set, Camproux et al [34]
managed to obtain an average accuracy of 0.64 Angstrom RMSD,
while Kolodny et al [6] achieved 0.92 Angstrom RMSD.
Interesting observations were made during the different validation
tests. As larger fragment lengths can describe regular secondary
structure elements more accurately, loop/turn regions were best
approximated by shorter fragments, containing 8 residues and less.
This result was most pronounced for the all-a SCOP class (see
Figure S2B and S2C). This illustrates the benefit of using a
fragment library not restricted to one fragment length. One of the
bottlenecks in predicting protein structures is the relative spatial
organization of regular secondary structure elements.
To address the applicability of our fragment library, we looked
more in detail into the bridging region between those regular
secondary structure elements and the loop/turn region. In
previous studies [40,45] loop structures were considered as
seven-residue fragments with less than four continuous a-helical
or b-strand residues as defined by DSSP. In this experiment loops
are defined as in [40,45]. As loops occur in a wide range of lengths,
we slightly adapted the loop definition into a part of a protein
structure consisting of at least 4 residues without 4 continuous a-
helical or b-strand residues. The experiment consisted in finding
local matches for the regions between a regular secondary
structure element and a loop region. A special focus was directed
towards the fragment length of these matches when forcing the
search process to include two residues from the regular side. The
search algorithm was able to find at least one match for each
region by considering a threshold of 1.0 Angstrom RMSD,
According to our previous results, Figure S3A and S3B show that
these regions are best approximated by smaller building blocks.
The various results obtained in this second validation step
suggest that although not every short sequence in a protein
encodes a regular structure, the total protein structure is built with
small building blocks. The size of the building block needs to
Figure 3. Structural hierarchy of classes based on RMSD distance. The nodes are represented by means of a DSSP logo (generated usingWebLogo [47]) and a denotation of the percentage of BriX classes (in black) and fragments (in red) it contains. At the second level, the hierarchicalclustering is able to distinguish the two major secondary structure elements: strands and helices. These branches are further partitioned into loopsand small turns. Notable is the content difference between the pure secondary structure nodes (k and p) at the bottom level of the tree. Althoughnode k consists of 12.2% of all BriX classes, it only represents 19.8% of the fragments of the WHAT IF set. Node p, on the contrary, embodies 27.8% ofthe fragment space, while holding only 3.4% of the BriX classes. This discrepancy shows that the stronger structural constraints imposed on helicesresult in fewer and larger helical classes than the strand classes created with the same threshold.doi:10.1371/journal.pcbi.1000083.g003
BriX: A Collection of Canonical Protein Fragments
PLoS Computational Biology | www.ploscompbiol.org 5 May 2008 | Volume 4 | Issue 5 | e1000083

Figure 4. BriX statistics with regard to secondary structurecontent. (A, B) Effect secondary structure on the respective classifica-tion. The plots show data for classes consisting of one secondary
Figure 5. Reconstruction of human protein backbones usingBriX classes. (A, B) Local fit approximation for the reconstruction ofthe set of human protein structures: some examples. The backbones (inred) of a G25K GTP-binding protein (A) and b human C-reactive protein(B) fully covered with BriX classes (green). The covering algorithmselected 35 and 40 redundancy filtered fragment classes to describe therespective structures. (C, D) Global fit approximation for the recon-struction of the set of human protein structures: some examples. Abackbone trace of a G25K GTP-binding protein (C) and b human C-reactive protein (D). The target proteins are shown in red and theapproximations are shown in green. The overall RMSD is 0.4542Angstrom and 0.5614 Angstrom, respectively.doi:10.1371/journal.pcbi.1000083.g005
structure element, i.e., pure helical (red), strand (blue), turn (green), andloop (orange) classes. The data selection was based on the fragments orfragment classes having an overall DSSP content of more than 80% inthese 4 structural elements. Shown is the percentage of classifiedfragments regarding an increasing distance threshold. Although thevast majority of helical fragments were found to be recurrent (A), thenumber of respective structural classes is low compared to the numberof strand classes (B). Because of the stabilizing hydrogen bonds, helicesdo not allow a lot of variation, resulting in few large BriX classes. Thevariable character and infrequent occurences of loops and turns are themain reason for the small number of recurrent structures and poorclassification results. (C) Classification results for the Astral40 validationtest. The BriX fragment classification obtained from the WHAT IFglobular structure set was used to classify fragments generated fromthe Astral40 structures. Experiments evaluating the effect of increasingthreshold on the percentage of classified fragments were repeated forthe full Astral40 set (open circles) and for the Astral40 structures of themajor SCOP classes (all a [diamonds], all b [triangles], a/b [closedcircles], and a+b [squares]). The initial classification results for the WHATIF generated fragments (open squares) are shown for reference. The fullAstral set follows a similar classification pattern as the WHAT IF set,showing that the latter gives a good representation of proteinstructures in general. The higher classification rate of helical proteinspoints to a lower structural variation within these structures.doi:10.1371/journal.pcbi.1000083.g004
BriX: A Collection of Canonical Protein Fragments
PLoS Computational Biology | www.ploscompbiol.org 6 May 2008 | Volume 4 | Issue 5 | e1000083
describe a small region is dependent on the type of secondary
structure elements present in that region. Hypervariable regions
such as loops are composed of multiple smaller regular building
blocks, while a single longer BriX class can often describe entire
helices and strands.
Plastic SequencesWhen considering part of a protein structure, the possibility was
examined to predict the corresponding BriX class from sequence
information. However, exceptions aside, the overall sequence
conservation within the classes was rather low, precluding
sequence to structure prediction. This is to be expected due to
the large number of classes resulting from the high-resolution
clustering. In addition, an analysis was carried out to identify the
magnitude of structural variance in conformations that a single
sequence can adopt. The experiment, from which the results are
shown in Figure 6, consisted of calculating the pairwise RMSD
between fragments with an identical sequence (see Materials and
Methods section). Figure 6A shows the normalized distribution of
the obtained RMSD values, for three different fragment lengths.
Two peaks were observed: the first peak at 0.2 Angstrom revealed
that the majority of the fragments, containing an identical amino
acid sequence, adopt a similar conformation. A smaller yet
significant second peak was recognized at an RMSD of 1.6–2
Angstrom. The idea arose that, certainly for smaller fragment
lengths (smaller than 7 residues), a drastic structural switch can
occur. This idea was verified through a thorough cluster analysis
on nearly 40,000 sequences where this second peak was
recognized. For each sequence, the analysis consisted in carrying
out the hierarchical agglomeration process on the fragments
sharing this sequence. The resulting histogram, shown in
Figure 6A, confirms that for the vast amount of these sequences
two structural groups could be observed. As the sequence length
increases, the second peak in Figure 6A gradually disappears,
indicating that additional structural context information is
required to remove structural ambiguities.
A closer look at the residues that take part in these structural
switches revealed the propensity of smaller hydrophobic residues,
such as Alanine, Leucine and Valine, to be involved in ambiguous
sequences. Remarkably, as Figure 6C clearly indicates, for some
residues (Proline, Cysteine, Methionine, Glutamine, Asparagine,
Tryptophan, Tyrosine, Phenylalanine and Histidine) this situation
seldom arose. Interestingly Proline and Glycine tended to occur in
fragments that are not represented in BriX, due to their irregular
nature. These so-called structure breakers are inclined to disrupt
secondary structures and often give rise to loop or turn-regions.
Consequently, three groups could be distinguished with amino
acids promoting: 1) a single-well defined regular structure (such as
Tryptophan, Tyrosine, Phenylalanine, Cysteine, Asparagine and
Methionine), 2) several regular structures or structural ambiguity
(such as Alanine, Leucine and Valine) and 3) irregular structures
(such as Glycine and Proline).
Another observation was the magnitude of the structural
ambiguity: a switch from a perfect a helix to a b strand was
recurrently seen. In the case of 5-residue long sequences, for
instance, 15% of all observed structural jumps invoked such a
dramatic switch. In Figure 6B an example is shown of a sequence
(AAVGL) that adopted both a perfect sheet conformation (present
in the a-chain of the 1DQZ pdb-file) and a helical conformation
(present in the a-chain of the 1D7U pdb-file) depending on the
context in which it was placed.
Database AccessIn order to use the fragment database, the BriX classes are
made accessible at http://brix.vub.ac.be through both a search
and a browse interface. Depending on the query, the information
is displayed in either a Class view or a Fragment view and arranged in
information tabs. As well as information about its content, the
Class view offers a sequence alignment view through the web
applet JalView [46]. With the help of WebLogo [47] both a sequence
and a DSSP logo are generated. The Fragment view includes a
detailed description of the source of the particular fragment, the
sequence and the DSSP assignment. In addition, an overview is
presented with links to the BriX classes to which the fragment
belongs for different distance thresholds. Furthermore, the web
applet JMol [48] presents an interactive view of the protein
fragment.
The search interface allows searching for fragments or classes
using specific identifiers (length, sequence information, pdb
filename, …). In order to perform a more complex search, an
option is present to use regular expressions when describing an
identifier. When looking for clearly defined secondary structure
classes, the percentage of helices, turns, strands or irregular
structures occurring in a BriX class can be specified. The outcome
can be sorted according to a user-defined property.
Through the browse interface, it is possible to browse the
secondary structure elements present in the BriX classes. A
hierarchy is built using the DSSP profiles of the classes. After
choosing a branch, intermediate results can be retrieved, resulting
in a list of relevant classes.
ConclusionIn this study we have derived a fragment alphabet, containing
fragments from 4 to 14 residues long. Using a multi-step clustering
approach more than 1,000 recurring protein structures were
identified among 260,000 protein fragments for each length.
Through the employment of a global fit method we showed that
BriX approximates native structures with an RMSD of 0.48
Angstrom, for all major SCOP classes. Loop regions that appear
irregular at first glance could be entirely reconstructed from
smaller building blocks, between 4 and 8 residues long. Regular
secondary structures, on the other hand, were best approximated
by larger building blocks, as they provided closer fits. Regarding
the obtained coverage results, we believe that this collection of
protein fragments can be employed for various modeling purposes,
including loop-modeling applications.
In addition, a sequence analysis revealed the presence of strong
structural ambiguity for a significant amount of small sequences.
Examining the residues that take part in these so-called plastic
sequences, three groups could be distinguished: Amino acids
promoting (1) a single-well defined regular structure, (2) several
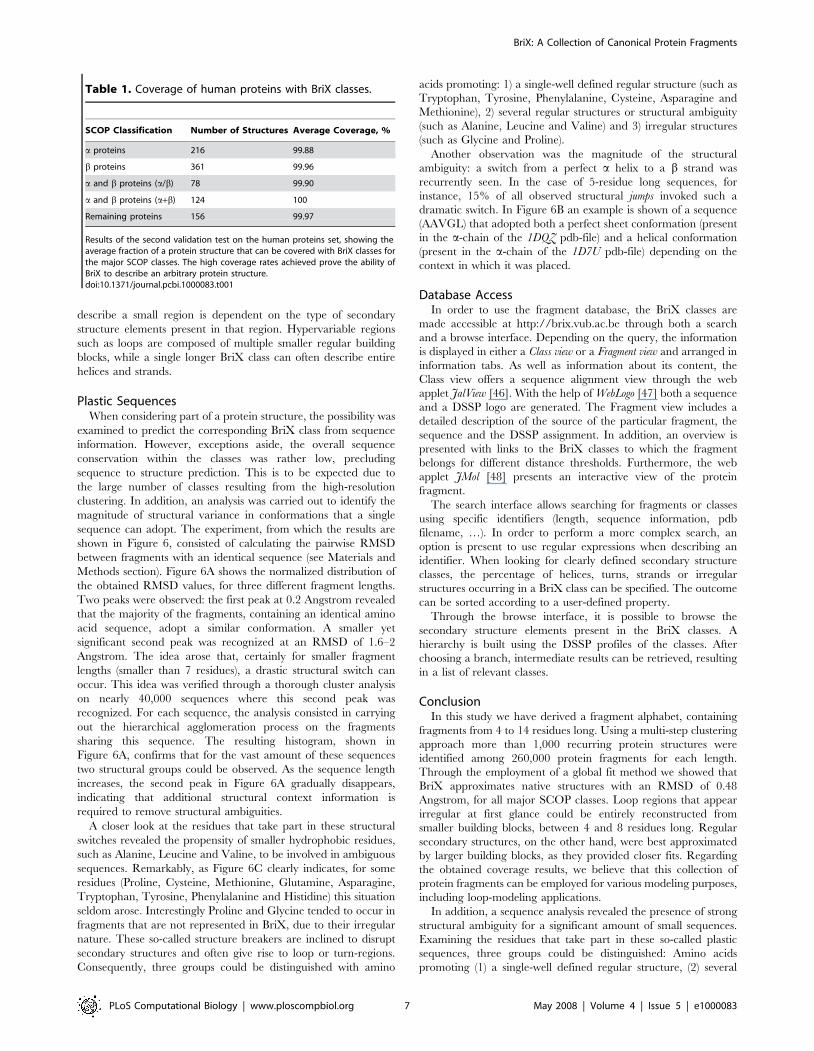
Table 1. Coverage of human proteins with BriX classes.
SCOP Classification Number of Structures Average Coverage, %
a proteins 216 99.88
b proteins 361 99.96
a and b proteins (a/b) 78 99.90
a and b proteins (a+b) 124 100
Remaining proteins 156 99.97
Results of the second validation test on the human proteins set, showing theaverage fraction of a protein structure that can be covered with BriX classes forthe major SCOP classes. The high coverage rates achieved prove the ability ofBriX to describe an arbitrary protein structure.doi:10.1371/journal.pcbi.1000083.t001
BriX: A Collection of Canonical Protein Fragments
PLoS Computational Biology | www.ploscompbiol.org 7 May 2008 | Volume 4 | Issue 5 | e1000083

Figure 6. Presence of structural switches within groups of fragments containing identical residue sequences. (A) The effect of thefragment length on the structural variation. Shown is the percentage of identical sequence pairs in function of the structural distance between themfor fragments of length 5 (red), 9 (blue), and 13 (green) in the Astral40 dataset. Clearly shown in the main histogram is the tendency of smallerfragments to manifest large structural variation. The smaller plot is the result of carrying out the Hierarchical Agglomeration process on nearly 40,000sequences where this variation was recognized. The clustering considered two different distance thresholds: 1.5 Angstrom (red) and 2.0 Angstrom(blue) RMSD. The plot shows that for the vast amount of these sequences, 2 structural groups can be identified. (B) Example of structure differencesfor one amino acid sequence. The sequence AAVGL can adopt both a strand (left) and helix (right) conformation. The strand conformation is presentin the Antigen 85-C protein (structure 1DQZ) and starts at residue-number 119. The helical conformation is cut from the 2,2-dialkylglycinedecarboxylase protein (1D7U) at residue-number 311. (C) Amino acid usage in plastic sequences. Shown is the frequency of amino acids occurring insequences that only allow small structural jumps, resulting in tiny variations of a certain conformation (in red) and in sequences where these jumpsare larger, resulting in drastic structure switches (in blue). The green bars indicate the presence of the respective amino acids in fragments that were
BriX: A Collection of Canonical Protein Fragments
PLoS Computational Biology | www.ploscompbiol.org 8 May 2008 | Volume 4 | Issue 5 | e1000083

regular structures and (3) irregular structures. When fragment
length was increased, sequence plasticity was no longer observed,
illustrating the context-dependency of polypeptide structures.
Materials and Methods
Construction of the BriX DatabaseThe database of fragments was built using a list of proteins
available in the WHAT IF database of high-quality structures
[39]. The compact set of high-resolution proteins embodies the
specificity present in the SCOP classes, as shown in Table 2,
thereby avoiding a bias towards a specific fold.
By sliding a window of 4 to 14 residues long over the main chain of
the proteins all consecutive overlapping fragments were generated.
For each length, a clustering process was employed to identify
equivalent structures. To avoid performance problems, this process
incorporated a pre-clustering stage by grouping the fragments by
their secondary structure assignment according to the DSSP [41]. A
fragment was described as a sequence of the three-dimensional
coordinates of the backbone atoms (N, Ca, Cb, O) of each residue.
Applying the fast RMSD calculation method of Wolfgang Kabsch
[49,50], distance matrices were constructed for each DSSP group.
Subsequently, recurrent structures were detected through the
employment of the Hierarchical Agglomeration algorithm [51] on the
distance matrices. Inspection of the structural classes thus obtained
revealed the need for a second phase of clustering in which similar
subgroups needed to be identified and merged together. To this end,
the representative fragment of each subgroup was determined
(termed centroid). As a consequence, a new distance matrix was
generated composed of the pairwise RMSD distances between the
centroids. Once more, Hierarchical Agglomeration was applied to
the matrix to detect close subgroups that could be joined, resulting in
a final collection of structural classes.
Construction of Fragment Class HierarchyThrough applying the Hierarchical Agglomeration algorithm [51] to
the BriX centroids, a fragment class hierarchy was constructed.
The process can be described in three steps: (1) The coordinates of
the centroids of fragment length 7 were collected; (2) A RMSD
distance matrix was generated by employing the fast RMSD
calculation method of Wolfgang Kabsch [49,50]; (3) The final step
consisted of a predefined number of iterations, which typified the
desired levels in the hierarchy. In each iteration, the Hierarchical
Agglomeration algorithm was called with an increasing distance
threshold (Threshold = 0.5 + k * 0.1, where k denotes de number of
the iteration). By assembling the gathered results at each iteration
(or level) a hierarchy of fragment classes was created.
Protein Backbone Reconstruction AlgorithmLocal fit approximation. Specifically, the algorithm can be
described by an iteration process. At any time, the algorithm
considers a determined position inside the protein structure, and
attempts to identify a similar class centroid for that position. The
selection procedure involves iteration over the possible fragment
lengths. Large fragments that have a sufficiently small RMSD
difference (resolution ,1 Angstrom) compared to the original
structure are favored. Whenever an appropriate centroid could not
be found within the iteration, the fragment length was decreased
by one residue. Otherwise, the respective BriX class was accepted
as a solution and the procedure repeated for a following position in
the protein structure. If a solution could not be obtained, the
location in the structure was marked and the procedure repeated
for the neighbouring position. The algorithm to reconstruct
protein backbones using BriX classes can be described in pseudo
code as follows:
For a given protein structure X
Create an empty solution set S
FOR position i = 1Rlength(X)
Create an empty solution set for position i si
FOR fragment length n = 14R4
IF si = Ø
Select fragment Y [Xi2Xi+n]
FOR all fragment classes Z of length n
IF RMSD(fragment Y, centroid(Z)),1A
Add Z to si
n = n21
ELSE
Continue
Add si to S
i = i+1
RETURN S
Global fit approximation. As the local-fit approximation
consists of looking for BriX classes that match local fragments of a
target structure, the calculation of the global fit is less
straightforward.
The number of possible sequences grows exponentially with the
protein’s target length. Therefore a strategy was necessary to
prevent examining all sequences to output the best global-fit
approximation. However, at any time, the algorithm should be
able to backtrack to a previous solution when it gets stuck in a local
minimum. Our algorithm follows a depth first search approach for
memory-efficiency reasons. At any time, a solution queue keeps
track of candidate structures created so far. These candidate
structures, representing a partial approximation of the protein’s
backbone, are ordered in a way that the closest solutions are in
Table 2. Representation of SCOP classes in the WHAT IFstructure set.
SCOP Classification SCOP, % WHAT IF, %
All a proteins 13 14
All b proteins 21 20
a and b proteins (a/b) 26 33
a and b proteins (a+b) 24 24
Multi-domain proteins (a and b) 3 2
Membrane and cell surface proteins and peptides2 1
Small proteins 4 4
Coiled coil proteins 2 1
Low-resolution protein structures 4 0
Peptides 1 0
Designed proteins 0 0
doi:10.1371/journal.pcbi.1000083.t002
left unclassified in BriX classes, due to their irregular character. Three groups can be distinguished: amino acids promoting (1) a single-well definedregular structure (such as Tryptophan, Tyrosine, Phenylalanine, Cysteine, Asparagine, and Methionine), (2) several regular structures or structuraljumps (such as Alanine, Leucine, and Valine), and (3) irregular structures (such as Glycine and Proline).doi:10.1371/journal.pcbi.1000083.g006
BriX: A Collection of Canonical Protein Fragments
PLoS Computational Biology | www.ploscompbiol.org 9 May 2008 | Volume 4 | Issue 5 | e1000083

front. In general terms, solutions with a longer candidate structure
are favored over those with shorter reconstructions. To avoid a
bias towards fragment length, the last fragment addition is not
considered. When two candidate structures have the same size, the
solution with the smallest distance between the last added fragment
and the target structure is preferred. As long as the queue contains
solutions and no solution has been found, the algorithm pops out
the front candidate structure and tries to extend this structure using
the best fragments matches in BriX. The selection of a good match
is a two-step procedure: First, there is searched for local matches
between the consecutive backbone segment, having an overlap of
three residues with the already constructed candidate, and the BriX
class centroids. Second, for every class match, a more specific
search is carried out considering the fragments within this class
after superimposing them on the target structure. For each class
fragment that is in conformity with the preceding backbone
reconstruction, i.e. when the RMSD between the overlapping
residues is minimal (RMSD ,0.3 Angstrom), a new extended
candidate structure is put in the solution queue. When no viable
fragment can be found, the algorithm tracks back to the second
closest candidate in the solution queue.
We analyzed the efficiency of our algorithm on an Opteron
(TM) Dual Core Processor 2.0 GHz. The execution time of this
algorithm is inherently dependent on the size of the protein. For
an average sized protein like the a G25K GTP-binding protein
(see Figure 5C), for instance, the algorithm is able to output a
solution within 5 minutes time.
All protein graphics in this article were generated with the
YASARA software package [52] and PyMOL [53].
Validation DatasetsFor the creation of the BriX library, we used a list of 1,261 PDB
chains downloaded from the WHAT IF website. These represen-
tative chains were collected from the Protein Data Bank on
October 2002 using a sequence identity cutoff of 30%, a resolution
higher than 2.1 Angstrom and an R factor less than 0.21.
For the plasticity results and the first validation test of BriX,
7,290 structures of the Astral set [42] were used. This set has a 1.8
Angstrom resolution and less than 40% internal structural
homology. The structures were obtained directly from the Astral
website.
The human proteins set was extracted from the PDB [54] by
performing an advanced search. The 935 high-resolution
structures from human origin were obtained by setting the source
organism parameter to Homo sapiens and the experimental method
parameter to X-ray.
Plastic SequencesAs the sequence space within BriX was too small to perform the
experiment with high reliability, the larger Astral40 set was used.
For each fragment length (4–14 residues) groups containing
fragments with identical sequences were created. Subsequently,
the mutual RMSD of all fragment pairs within each group was
calculated. To identify structural switches within the sequence, the
distribution of the obtained RMSD values was plotted in a
histogram with a bin size of 0.1 Angstrom.
Supporting Information
Figure S1. Secondary structure composition of fragment
classes. The DSSP secondary structure assignments for the four
main secondary structure elements (helix, strand, turn and loop)
were counted in fragment classes of 10 long (A) and 7 long (B) and
plotted against the percentage of classes displaying this composi-
tion. Turns and loops mainly occur in 1 to 4 residue patterns,
whereas helices and strands take up longer stretches within the
fragment (peaks at 5 and 6 residues, respectively). Clearly shown is
the presence of pure classes at length 7, i.e. classes that consist of
only one secondary structure element. When a larger fragment
length is considered the classes are generally composed of a
mixture of elements.
Found at: doi:10.1371/journal.pcbi.1000083.s001 (0.51 MB TIF)
Figure S2. Reconstruction of protein backbones using BriX
classes. (A) Global fit of the Park & Levitt protein set. Shown is
the distribution of RMSD observed after reconstructing the
proteins present in the Park & Levitt set. The reconstruction
algorithm was carried out in both directions: from N to C terminal
(in red) and from C to N terminal (in blue). As the direction
affected the outcome of the algorithm, the general RMSD
distribution remained the same. With an average RMSD of 0.48
Angstrom to the crystallographic coordinates we improved
previous obtained backbone reconstruction results. (B, C) Local
fit of human protein backbones. These plots are the result of
covering the human protein backbones and show data for all
major SCOP classes: all a (in red), all b (in blue), a/b (in green)
and a+b (in orange). The coverage experiment revealed that
virtually the entire protein structure could be reconstructed by
using BriX building blocks comprising 14 residues (B). At loop and
turn locations smaller fragments (between 4 and 8 residues) are
needed to describe their hypervariable nature (C).
Found at: doi:10.1371/journal.pcbi.1000083.s002 (0.89 MB TIF)
Figure S3. Reconstruction bridging region between regular
secondary structure elements and loop locations. The plots
are the result of reconstructing the human protein backbones and
show data for all major SCOP classes: all a (in red), all b (in blue),
a/b (in green) and a+b (in orange). Shown are the local matches
with BriX fragments for the regions between a regular secondary
structure element and a loop region, where two residues belong to
the regular side for the b Human C-reactive protein (A). The
occurrences of local matches with regard to a particular length
were counted and plotted in a histogram (B). As can be clearly
seen, these regions are best approximated by smaller building
blocks.
Found at: doi:10.1371/journal.pcbi.1000083.s003 (2.00 MB TIF)
Acknowledgments
Author Contributions
Conceived and designed the experiments: LB LS FR JS. Performed the
experiments: LB. Analyzed the data: LB JR FS LS FR JS. Contributed
reagents/materials/analysis tools: LB JR VT FS TL LS JS. Wrote the
paper: LB.
References
1. Liu J, Montelione GT, Rost B (2007) Novel leverage of structural genomics. Nat
Biotechnol 25: 849–851.
2. Sali A, Blundell TL (1993) Comparative protein modelling by satisfaction of
spatial restraints. J Mol Biol 234: 779–815.
3. Marti-Renom MA, Stuart AC, Fiser A, Sanchez R, Melo F, et al. (2000)
Comparative protein structure modeling of genes and genomes. Annu Rev
Biophys Biomol Struct 29: 291–325.
4. Ginalski K (2006) Comparative modeling for protein structure prediction. Curr
Opin Struct Biol 16: 172–177.
5. Wallner B, Elofsson A (2005) All are not equal: a benchmark of different
homology modeling programs. Protein Sci 14: 1315–1327.
6. Kolodny R, Koehl P, Guibas L, Levitt M (2002) Small libraries of
protein fragments model native protein structures accurately. J Mol Biol 323:
297–307.
BriX: A Collection of Canonical Protein Fragments
PLoS Computational Biology | www.ploscompbiol.org 10 May 2008 | Volume 4 | Issue 5 | e1000083

7. Murzin AG, Brenner SE, Hubbard T, Chothia C (1995) SCOP: a structural
classification of proteins database for the investigation of sequences andstructures. J Mol Biol 247: 536–540.
8. Orengo CA, Michie AD, Jones S, Jones DT, Swindells MB, et al. (1997) CATH–
a hierarchic classification of protein domain structures. Structure 5: 1093–1108.9. Holm L, Ouzounis C, Sander C, Tuparev G, Vriend G (1992) A database of
protein structure families with common folding motifs. Protein Sci 1:1691–1698.
10. Holm L, Sander C (1997) Dali/FSSP classification of three-dimensional protein
folds. Nucleic Acids Research 25: 231–234.11. Pauling L, Corey RB, Branson HR (1951) The structure of proteins: Two
hydrogen-bonded helical configurations of the polypeptide chain. Proc NatlAcad Sci U S A 37: 205–211.
12. Pauling L, Corey RB (1951) The pleated sheet, a new layer configuration ofpolypeptide chains. Proc Natl Acad Sci U S A 37: 251–256.
13. Sippl MJ, Hendlich M, Lackner P (1992) Assembly of polypeptide and protein
backbone conformations from low energy ensembles of short fragments:development of strategies and construction of models for myoglobin, lysozyme,
and thymosin beta 4. Protein Sci 1: 625–640.14. Wendoloski JJ, Salemme FR (1992) PROBIT: a statistical approach to modeling
proteins from partial coordinate data using substructure libraries. J Mol Graph
10: 124–126.15. Bowie JU, Eisenberg D (1994) An evolutionary approach to folding small alpha-
helical proteins that uses sequence information and an empirical guiding fitnessfunction. Proc Natl Acad Sci U S A 91: 4436–4440.
16. Kolodny R, Levitt M (2003) Protein decoy assembly using short fragments undergeometric constraints. Biopolymers 68: 278–285.
17. Bystroff C, Baker D (1998) Prediction of local structure in proteins using a library
of sequence-structure motifs. J Mol Biol 281: 565–577.18. Jones DT, Bryson K, Coleman A, McGuffin LJ, Sadowski MI, et al. (2005)
Prediction of novel and analogous folds using fragment assembly and foldrecognition. Proteins 61 Suppl 7: 143–151.
19. Chivian D, Kim DE, Malmstrom L, Schonbrun J, Rohl CA, et al. (2005)
Prediction of CASP6 structures using automated Robetta protocols. Proteins 61Suppl 7: 157–166.
20. Benros C, de Brevern AG, Etchebest C, Hazout S (2006) Assessing a novelapproach for predicting local 3D protein structures from sequence. Proteins 62:
865–880.21. Floudas CA, Fung HK, McAllister SR, Monnigmann M, Rajgaria R (2006)
Advances in protein structure prediction and de novo protein design: A review.
Chemical Engineering Science 61: 966–988.22. Haspel N, Tsai CJ, Wolfson H, Nussinov R (2003) Hierarchical protein folding
pathways: a computational study of protein fragments. Proteins 51: 203–215.23. Tsai CJ, Maizel JV Jr, Nussinov R (2000) Anatomy of protein structures:
visualizing how a one-dimensional protein chain folds into a three-dimensional
shape. Proc Natl Acad Sci U S A 97: 12038–12043.24. Tsai CJ, Ma B, Sham YY, Kumar S, Wolfson HJ, et al. (2001) A hierarchical
building block based computational method for protein structure prediction.IBM Journal of Research and Development 45: 513–523.
25. Haspel N, Tsai CJ, Wolfson H, Nussinov R (2003) Reducing the computationalcomplexity of protein folding via fragment folding and assembly. Protein Sci 12:
1177–1187.
26. Inbar Y, Benyamini H, Nussinov R, Wolfson HJ (2003) Protein structureprediction via combinatorial assembly of sub-structural units. Bioinformatics 19
Suppl 1: i158–168.27. Lee J, Kim SY, Lee J (2005) Protein structure prediction based on fragment
assembly and parameter optimization. Biophys Chem 115: 209–214.
28. Maupetit J, Tuffery P, Derreumaux P (2007) A coarse-grained protein force fieldfor folding and structure prediction. Proteins 69: 394–408.
29. Simons KT, Bonneau R, Ruczinski I, Baker D (1999) Ab initio protein structureprediction of CASP III targets using ROSETTA. Proteins Suppl 3: 171–176.
30. Bradley P, Malmstrom L, Qian B, Schonbrun J, Chivian D, et al. (2005) Free
modeling with Rosetta in CASP6. Proteins 61 Suppl 7: 128–134.
31. Yarov-Yarovoy V, Schonbrun J, Baker D (2006) Multipass membrane protein
structure prediction using Rosetta. Proteins 62: 1010–1025.
32. Kuhlman B, Dantas G, Ireton GC, Varani G, Stoddard BL, et al. (2003) Designof a novel globular protein fold with atomic-level accuracy. Science 302:
1364–1368.
33. Etchebest C, Benros C, Hazout S, de Brevern AG (2005) A structural alphabet
for local protein structures: improved prediction methods. Proteins 59: 810–827.
34. Camproux AC, Tuffery P (2005) Hidden Markov Model-derived structural
alphabet for proteins: The learning of protein local shapes captures sequencespecificity. Biochimica Et Biophysica Acta-General Subjects 1724: 394–403.
35. Hunter CG, Subramaniam S (2003) Protein fragment clustering and canonicallocal shapes. Proteins-Structure Function and Genetics 50: 580–588.
36. Wainreb G, Haspel N, Wolfson HJ, Nussinov R (2006) A permissive secondarystructure-guided superposition tool for clustering of protein fragments toward
protein structure prediction via fragment assembly. Bioinformatics 22:1343–1352.
37. DePristo MA, de Bakker PI, Lovell SC, Blundell TL (2003) Ab initioconstruction of polypeptide fragments: efficient generation of accurate,
representative ensembles. Proteins 51: 41–55.
38. Holmes JB, Tsai J (2004) Some fundamental aspects of building protein
structures from fragment libraries. Protein Science 13: 1636–1650.
39. Vriend G (1990) WHAT IF - A Molecular Modeling and Drug Design Program.
Journal of Molecular Graphics 8: 52.
40. Du P, Andrec M, Levy RM (2003) Have we seen all structures corresponding to
short protein fragments in the Protein Data Bank? An update. Protein Eng 16:407–414.
41. Kabsch W, Sander C (1983) Dictionary of protein secondary structure: patternrecognition of hydrogen-bonded and geometrical features. Biopolymers. pp
2577–2639.
42. Chandonia JM, Hon G, Walker NS, Lo Conte L, Koehl P, et al. (2004) The
ASTRAL Compendium in 2004. Nucleic Acids Res 32: D189–192.
43. de Brevern AG, Etchebest C, Hazout S (2000) Bayesian probabilistic approachfor predicting backbone structures in terms of protein blocks. Proteins-Structure
Function and Genetics 41: 271–287.
44. Park BH, Levitt M (1995) The complexity and accuracy of discrete state models
of protein structure. J Mol Biol 249: 493–507.
45. Fidelis K, Stern PS, Bacon D, Moult J (1994) Comparison of systematic search
and database methods for constructing segments of protein structure. ProteinEng 7: 953–960.
46. Clamp M, Cuff J, Searle SM, Barton GJ (2004) The Jalview Java alignmenteditor. Bioinformatics 20: 426–427.
47. Crooks GE, Hon G, Chandonia JM, Brenner SE (2004) WebLogo: a sequencelogo generator. Genome Res 14: 1188–1190.
48. Cammer S (2007) SChiSM2: creating interactive web page annotations ofmolecular structure models using Jmol. Bioinformatics 23: 383–384.
49. Kabsch W (1976) A solution for the best rotation to relate two sets of vectors.
Acta Cryst 32.
50. Bruschweiler R (2003) Efficient rmsd measures for the comparison of two
molecular ensembles. Proteins. pp 26–34.
51. Mitchell T (1997) Machine Learning McGraw Hill Higher Education. pp 352.
52. Krieger E, Koraimann G, Vriend G (2002) Increasing the precision ofcomparative models with YASARA NOVA–a self-parameterizing force field.
Proteins 47: 393–402.
53. DeLano WL (2002) The PyMOL Molecular Graphics System. San CarlosCA, ,
USA: DeLano Scientific LLC.
54. Kouranov A, Xie L, de la Cruz J, Chen L, Westbrook J, et al. (2006) The RCSB
PDB information portal for structural genomics. Nucleic Acids Res 34:D302–305.
BriX: A Collection of Canonical Protein Fragments
PLoS Computational Biology | www.ploscompbiol.org 11 May 2008 | Volume 4 | Issue 5 | e1000083