Automated classification of antibody complementarity determining region 3 of the heavy chain (H3)...
18
Automated Classification of Antibody Complementarity Determining Region 3 of the Heavy Chain (H3) Loops into Canonical Forms and Its Application to Protein Structure Prediction Baldomero Oliva 1,2 , Paul A. Bates 2 , Enrique Querol 1 , Francesc X. Avile ´s 1 and Michael J. E. Sternberg 2 * 1 Institut de Biologia Fonamental and Departament de Bioquı ´mica, Universitat Auto `noma de Barcelona 08193 Bellaterra, Barcelona Spain 2 Biomolecular Modelling Laboratory, Imperial Cancer Research Fund, 44 Lincoln’s Inn Fields, London WC2A 3PX United Kingdom A computer-based algorithm was used to cluster the loops forming the complementarity determining region (CDR) 3 of the heavy chain (H3) into canonical classes. Previous analyses of the three-dimensional struc- tures of CDR loops (also known as the hypervariable regions) within antibody immunoglobulin variable domains have shown that for five of the six CDRs there are only a few main-chain conformations (known as canonical forms) that show clear relationships between sequence and structure. However, the larger variation in length and conformation of loops within H3 has limited the classification of these loops into canoni- cal forms. The clustering procedure presented here is based on aligning the Ramachandran-coded main-chain conformation of the residues using a dynamic algorithm that allows the insertion of gaps to obtain an opti- mum alignment. A total of 41 H3 loops out of 62 non-identical loops, extracted from the Brookhaven Protein Data Bank, have been automati- cally grouped into 22 clusters. Inspection of the clusters for consensus sequences or intra-loop interactions or invariant conformation led to the proposal of 13 canonical forms representing 31 loops. These canonical forms include a consideration of the geometry of both the take-off region adjacent to the bracing b-strands and the remaining loop apex. Sub- sequently a new set of 15 H3 loops not included in the initial analysis was considered. The clustering procedure was repeated and nine of these 15 loops could be assigned to original clusters, including seven to canoni- cal forms. A sequence profile was generated for each canonical form from the original set of loops and matched against the sequences of the new H3 loops. For five out of the seven new H3 loops that were in a canonical form, the correct form was identified at first rank by this pre- dictive scheme. # 1998 Academic Press Keywords: protein modelling; combining site; antibody structure; analysis, bioinformatics *Corresponding author Introduction The antigen binding site of an antibody is pri- marily formed by six polypeptide loops known as the hypervariable regions or the complementarity determining regions (CDRs). Three of the six loops (named L1, L2 and L3) protrude from the variable domain of the light chain (VL) and three (H1, H2 and H3) from the variable domain of the heavy chain (VH; Chothia & Lesk, 1987). The binding site produced by these loops provides a surface and charge distribution complementary to that of the antigen. The hypervariable loops are far more variable in sequence and conformation than the b-sheet framework to which they are connected. The specificity and affinity of the binding site is primarily governed by the three-dimensional struc- Abbreviations used: PDB, Protein Data Bank; VL, VH variable domain of light chain and heavy chain; CDR, complementarity determining region; H3, complementarity determining region 3 from heavy chain; RMSD, root mean square deviation; FR, framework region. Article No. mb981847 J. Mol. Biol. (1998) 279, 1193–1210 0022 – 2836/98/251193–18 $30.00/0 # 1998 Academic Press
-
Upload
independent -
Category
Documents
-
view
0 -
download
0
Transcript of Automated classification of antibody complementarity determining region 3 of the heavy chain (H3)...

Article No. mb981847 J. Mol. Biol. (1998) 279, 1193±1210
Automated Classification of AntibodyComplementarity Determining Region 3 of the HeavyChain (H3) Loops into Canonical Forms and ItsApplication to Protein Structure Prediction
Baldomero Oliva1,2, Paul A. Bates2, Enrique Querol1, Francesc X. AvileÂs1
and Michael J. E. Sternberg2*
1Institut de BiologiaFonamental and Departamentde BioquõÂmica, UniversitatAutoÁnoma de Barcelona08193 Bellaterra, BarcelonaSpain2Biomolecular ModellingLaboratory, Imperial CancerResearch Fund, 44 Lincoln'sInn Fields, London WC2A 3PXUnited Kingdom
Abbreviations used: PDB, Proteinvariable domain of light chain andCDR, complementarity determiningH3, complementarity determining rchain; RMSD, root mean square deFR, framework region.
0022±2836/98/251193±18 $30.00/0
A computer-based algorithm was used to cluster the loops forming thecomplementarity determining region (CDR) 3 of the heavy chain (H3)into canonical classes. Previous analyses of the three-dimensional struc-tures of CDR loops (also known as the hypervariable regions) withinantibody immunoglobulin variable domains have shown that for ®ve ofthe six CDRs there are only a few main-chain conformations (known ascanonical forms) that show clear relationships between sequence andstructure. However, the larger variation in length and conformation ofloops within H3 has limited the classi®cation of these loops into canoni-cal forms. The clustering procedure presented here is based on aligningthe Ramachandran-coded main-chain conformation of the residues usinga dynamic algorithm that allows the insertion of gaps to obtain an opti-mum alignment. A total of 41 H3 loops out of 62 non-identical loops,extracted from the Brookhaven Protein Data Bank, have been automati-cally grouped into 22 clusters. Inspection of the clusters for consensussequences or intra-loop interactions or invariant conformation led to theproposal of 13 canonical forms representing 31 loops. These canonicalforms include a consideration of the geometry of both the take-off regionadjacent to the bracing b-strands and the remaining loop apex. Sub-sequently a new set of 15 H3 loops not included in the initial analysiswas considered. The clustering procedure was repeated and nine of these15 loops could be assigned to original clusters, including seven to canoni-cal forms. A sequence pro®le was generated for each canonical formfrom the original set of loops and matched against the sequences of thenew H3 loops. For ®ve out of the seven new H3 loops that were in acanonical form, the correct form was identi®ed at ®rst rank by this pre-dictive scheme.
# 1998 Academic Press
Keywords: protein modelling; combining site; antibody structure; analysis,bioinformatics
*Corresponding authorIntroduction
The antigen binding site of an antibody is pri-marily formed by six polypeptide loops known asthe hypervariable regions or the complementarity
Data Bank; VL, VHheavy chain;region;
egion 3 from heavyviation;
determining regions (CDRs). Three of the six loops(named L1, L2 and L3) protrude from the variabledomain of the light chain (VL) and three (H1, H2and H3) from the variable domain of the heavychain (VH; Chothia & Lesk, 1987). The binding siteproduced by these loops provides a surface andcharge distribution complementary to that of theantigen. The hypervariable loops are far morevariable in sequence and conformation than theb-sheet framework to which they are connected.The speci®city and af®nity of the binding site isprimarily governed by the three-dimensional struc-
# 1998 Academic Press
1194 Classi®cation of Antibody H3 Loops
ture of these six hypervariable regions which inturn is determined the sequences and lengths ofthese loops (Jones et al., 1986).
The relationships between the amino acidsequences of the CDRs of antibodies and theirstructures have been studied (Chothia & Lesk,1987; Chothia et al., 1989, 1992; Tramontano et al.,1990; Al-Lazikani et al., 1997). It was found thatantibodies have only a small number of main-chain conformations known as canonical structuresfor ®ve of the six hypervariable regions. Given theconserved nature of the b-sheet framework, theconformation of these canonical forms depends pri-marily on the length of the loop and the presenceof certain structurally determining residues whichare involved in the packing of the loop against theframework. However, the third CDR of the heavychain (H3) is very variable both in its length andamino acid sequence and was not included in theearly classi®cation of CDRs into a set of canonicalforms.
The extensive repertoire of antibody sequencesmakes experimental determination of all theirstructures impracticable at present and accordinglycomputational methods are required to predictantibody conformation from sequence. In particu-lar the use of native and of engineered antibodiesin a wide range of applications including clinicaldiagnostics and therapeutics has provided a stimu-lus for research in this area (for a review see Reeset al., 1994). In most modelling approaches for anti-bodies, if the sequence of a CDR is compatiblewith a canonical class then the canonical structureprovides the loop template that is subsequentlygrafted onto modelled b-sheet framework (Chothiaet al., 1989; Rees et al., 1996). However, differentapproaches have to be used to model H3 loopsbecause of the absence of known canonical formsfor these loops. Modelling of H3 loops is usuallytackled by a combination of a conformationalsearch of the backbone angles of the loop togetherwith loop fragment searches of a general databasethat includes mainly non-immunoglobulin co-ordi-nates (Bruccoleri et al., 1988; Shenkin et al., 1998;Martin et al., 1989; Rees et al., 1996). Some antibodybinding sites have been modelled to high levels ofaccuracy using the above techniques (e.g. seeChothia et al., 1986; Rees et al., 1996). However,identi®cation of canonical forms for H3 would pro-vide a better starting conformation for modellingH3 as in general database searches to predict loopconformation are of limited accuracy (Fidelis et al.,1994; van Vlijmen & Karplus, 1997).
Recently, as the structures of more antibodieshave been determined, several groups have pro-posed classi®cations of the conformations of H3.Rees and co-workers (Rees et al., 1994, 1996) haveanalysed the overall geometry of H3 in terms ofloop length. Shirai et al. (1996) examined the con-formation of the region just beyond the b-frame-work (known as the take-off region) and identi®eddistinct conformational classes. These classes canbe predicted by rules based on the occurrence of
particular residues and interactions. In contrast tothese classi®cations derived by inspection, Martin& Thornton (1996) used an automatic clusteringprocedure based on ®rst main-chain conformationand then root-mean-square deviation (RSMD) ofCa co-ordinates to cluster CDR loops. Their pro-cedure automatically identi®ed the canonical formsderived by Chothia and co-workers. In additionone cluster of four H3 loops was derived.
The more general problem of automaticallyclassifying the conformation of protein loops hasbeen tackled by several groups (Donate et al., 1996;Kwasigroch et al., 1996; Oliva et al., 1997; Ring et al.,1992; Ru®no et al., 1997; Wintjens et al., 1996). Theclusters are generally derived by considerations of®xed-length loops and evaluating conformationalsimilarity by main-chain geometry and/or theRMSD of Ca superposition. Identi®cation of loopsclusters has been shown to enhance the accuracy ofcomparative model building (Ru®no et al., 1997).
Here we analyse the conformations of H3 loopsusing our approach for clustering loops (Oliva et al.,1997) which is based on the main-chain confor-mation. In particular the limited number of H3loops and the diversity of their lengths hinders useof algorithms that only group loops of the samelength. Accordingly we have extended the algor-ithm to allow for the insertion of gaps into thealignment of pairs of loop thereby enabling com-mon sub-structures to be identi®ed between loops.We propose that several of these loop clusters canbe considered as canonical forms as they exhibit aconsensus either in sequence or with a commonintra-loop interaction. Our results are compared tothe related study by Morea et al. (1998) that waspublished after our manuscript was submitted.Following a suggestion of a referee, the robustnessof the cluster assignment is evaluated by consider-ing a test set of 15 H3 loops whose co-ordinatesare now available but were not included in theoriginal analysis. The predictive accuracy of ouroriginal assignment of canonical forms on the H3test set is then evaluated.
Classification and Clustering
Length of H3
A set of 62 H3 loops of immunoglobulin withdifferent sequence were extracted from the PDB(Table 1A; Bernstein et al., 1977) . According toKabat et al. (1991), H3 loops start at residue 95after framework region 3 (FR3) and end at residue102 before framework region 4 (FR4). H3 loops areb-hairpins connecting b-strands F and G. However,for ease of comparison with Morea et al. (1998) weuse the same loop de®nition starting the H3 seg-ment at the conserved Cys (C92) and ending at theconserved Gly (G104) (see Figure 1). In addition,residues into H3 from C92 are referred to as C � 1,C � 2 etc., for 93, 94, etc. Residue extending to theN terminus from G104 are referred to as G-1, G-2,etc for 103, 102, etc. The Morea et al. (1998) classi®-

Table 1. Set of H3 loops analysed
PDB Resolution Take Torsocode (AÊ ) FR3 LOOP FR4 -off structure Length
A. Antibody structures used for the analyses1nsn 2.90 CTR GNGD WG K ± 93hfm 3.00 CAN WDGDY WG K ± 101nld 2.90 CAR RGGDF WG E ± 101ggi 2.80 CVQ EGYIY WG K TB 101hkl 2.70 CAS YYGIY WG K ± 101ind 2.20 CAS HRFVH WG K TB 101bbj 3.10 CKR SYYGH WG E ± 101baf 2.90 CAR GWPLAY WG I ± 111mrc 2.40 CAN LRGYFDY WG E ± 121flr 1.85 CTG SYYGMDY WG E TNB-1 121ghf 2.70 CAR VEAGFDY WA K ± 122cgr 2.20 CTR GYSSMDY WG K TB 121tet 2.30 CAR RSWYFDV WG K TB 121mlb 2.10 CAR GDGNYGY WG K TB 123hfl 2.65 CLH GNYDFDG WG K ± 124fab 2.70 CTG SYYGMDY WG E ± 121plg 2.80 CAR GGKFAMDY WG K TB 131kel 1.90 CAR WGSYAMDY WG K TB 131vfa 1.80 CAR ERDYRLDY WG K TB 131mam 2.45 CTR DPYGPAAY WG K I 131mfd 2.10 CTR GGHGYYGDY WG K ± 147fab 2.00 CAR NLIAGGIDV WG K TB 141bbd 2.80 CDG YYSYYDMDY WG E TNB-1 142fbj 1.95 CAR LHYYGYNAY WG K TB 141jel 2.80 CAR VMGEQYFDV WG K� TB 141jhl 2.40 CTR DDNYGAMDY WG K TB 141aif 2.90 CVL RPLFYYAVDY WG E ± 151ucb 2.50 CAR GLDDGAWFAY WG K� ± 151clo 2.10 CTR DRGLRFYFDY WG K� ± 151dbj 2.70 CTR GDYVNWYFDV WG K ± 151igi 2.70 CAG SSGNKWAMDY WG K ± 151igf 2.80 CTR YSSDPFYFDY WG K TB 151eap 2.50 CKR SYYGSSYVDY WG E I 151nbv 2.00 CVR DQTGTAWFAY WG K TB 151rmf 2.80 CAR GGWLLLSFDY WG K TB 151for 2.75 CAR SGNYPYAMDY WG K TB 151fig 3.00 CAR RRDGNYGFTY WG K� ± 151ngp 2.40 CAR YDYYGSSYFDY WG K ± 161fvd 2.50 CSR WGGDGFYAMDV WG K� TB 161igc 2.60 CAR WGNYPYYAMDY WG K� TB 161hil 2.00 CAR RERYDENGFAY WG I I 161mcp 2.70 CAR NYYGSTWYFDV WG K TB 161acy 3.00 CSR ENHMYETYFDV WG K ± 161frg 2.80 CAR RERYDEKGFAY WG K TB 161nca 2.50 CAR GEDNFGSLSDY WG I TB 161igm 2.30 CAK HRVSYVLTGFDS WG K TB 178fab 1.80 CAR DPDILTAFSFDY WG K TB 171vge 2.00 CAR DPYGGGKSEFDY WG K ± 171osp 1.95 CAR SRDYYGSSGFAF WG K ± 176fab 1.90 CAR SEYYGGSYKFDY WG K TB 171iai 2.90 CAR DGYYENYYAMDY WG K ± 171ibg 2.70 CAR FRFASYYDYAVDY WG K TB 181lmk 2.60 CAR GEDYYAYWYVLDY WG K TB 181nmb 2.50 CAR SGGSYRYDGGFDY WG K TB 181dvf 1.90 CAT KVIYYQGRGAMDY WG K ± 181fbi 3.00 CAS LYYYGTSYGVLDY WG I ± 181gig 2.30 CAR DFYDYDVFYYAMDY WG K TB 191fai 2.70 CAR SFYGGSDLAVYYFDS WG K TB 201opg 2.00 CTR HPFYRYDGGNYYAMDH WG K TB 211dfb 2.70 CVK GRDYYDSGGYFTVAFDI WG K� TB 222fb4 1.90 CAR DGGHGFCSSASCFGPDY WG K TB 221ikf 2.50 CTR HTLYDTLYGNYPVWFAD WG K TB 22
B. New set of antibody structures1psk 2.80 CTS KSFDY WG K ± 101mim 2.60 CSR DYGYYFDF WG K ± 131igt 2.80 CAR HGGYYAMDY WG K ± 141yuh 3.00 CAR YAYCRPMDY WG K ± 141cfv 2.10 CAR LNYAVYGMDY WG K ± 151kno 3.20 CAR GDYYGSRGAY WG E ± 15
continued overleaf
Classi®cation of Antibody H3 Loops 1195

Table 1ÐContinued
PDB Resolution Take Torsocode (AÊ ) FR3 LOOP FR4 -off structure Length
1axs 2.60 CAR GHSYYFYDGDY WG K ± 162h1p 2.40 CAR RDSSASLYFDY WG K ± 161fpt 3.00 CAR DFYDYDVGFDY WG K� ± 161mpa 2.60 CSI IYFDYADFIMDY WG E ± 171ap2 2.40 CAR REVYSYYSPLDV WG K ± 171aqk 1.84 CAR VLFQQLVLYAPFDI WG K ± 181hyx 1.80 CAR VSHYDGSRDWYFDV WG K ± 181yec 1.90 CTR WGFIPVREDYVMDY WG E ± 181mf2 2.60 CAR SGGIERYDGTYYVMDY WG K ± 20
The PDB code for the structure is given and loops from structures of complexed antibodies are indicated in bold. The resolution ofthe structure is reported. The sequence of the loop is denoted by FR3-LOOP-FR4, where FR3 and FR4 denote framework regions 3and 4 according to Kabat et al. (1991). Take-off gives the geometry classi®ed as E, extended; K, kinked; K�, kinked plus extra bulge;and I, irregular. Torso structure gives the classi®cation reported by Morea et al. (1998), where TB is torso bulged (corresponding toK and K�), TNB is torso not-bulged (corresponding to E) and I is irregular (corresponding to I). The length of the loop is accordingto the Morea et al. (1998) de®nition and is ®ve residues longer than the Kabat et al. (1991) numbering.
New set of H3 for subsequent analysis and prediction.
1196 Classi®cation of Antibody H3 Loops
cation results in H3 loops being ®ve residues long-er than in the Kabat et al. (1991) nomenclature. TheH3 analysed with their sequences and lengths arereported in Table 1A. Their length varies between9 and 22 residues and this has been one of themajor factors preventing their classi®cation intocanonical forms (Martin & Thornton, 1996).
Classification by take-off geometry
The classi®cation used in our study (see Methodsfor details) considers the main-chain conformationof the loop in terms of distinct regions on Rama-chandran f,c space following the de®nitions ofWilmot & Thornton (1990). The take-off region ofeach H3 can be classi®ed into either one of the
Figure 1. Geometry of H3 loops.Geometric scheme of the H3 loopsubdivided into three regions: theframework, the take-off and theapex regions (left). The scheme ofShirai et al. (1996) is shown givingthe Ramachandran conformationcodes of the three classes (centre).A representative of each class isshown on the right from 1fvd (K�),2cgr (K) and 1bbd (E). The Moreaet al. (1998) numbering scheme isshown on the left. Hydrogen bondsbetween strands (starting at thecarbonyl oxygen of C92 and endingat the amide nitrogen of G104) andin the take-off region are shown bya broken line with the arrow fromthe carbonyl oxygen to the amidenitrogen.
Classi®cation of Antibody H3 Loops 1197
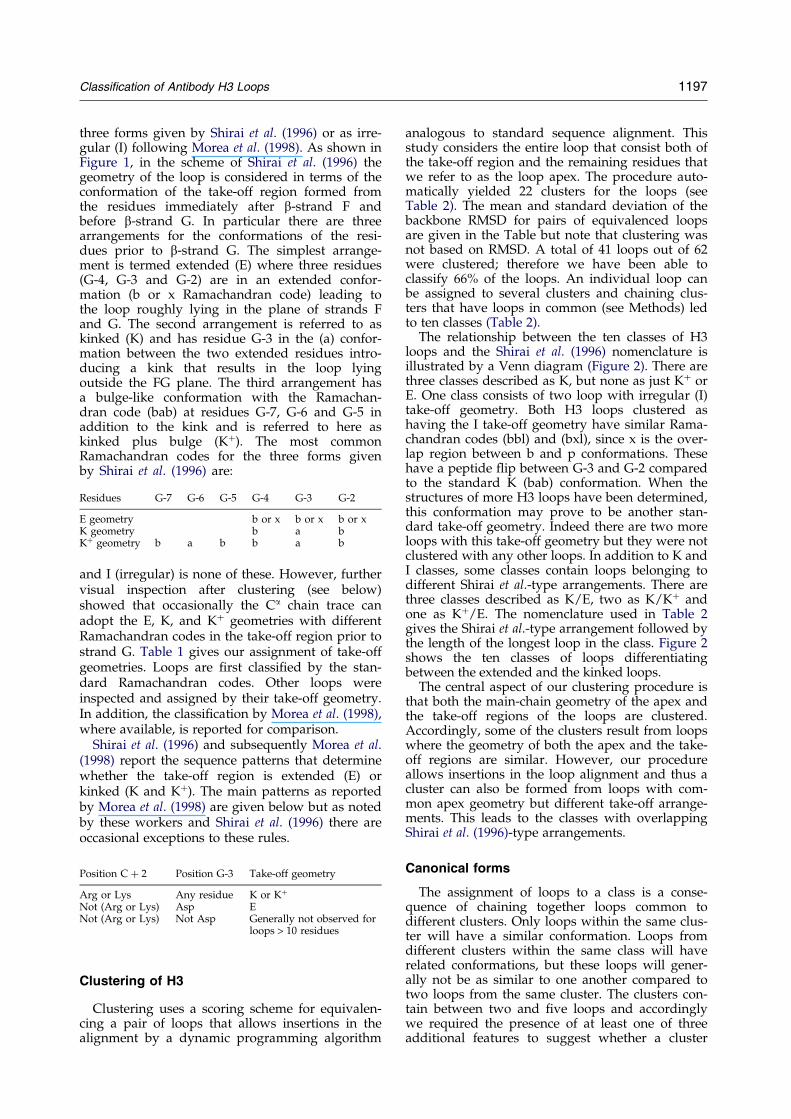
three forms given by Shirai et al. (1996) or as irre-gular (I) following Morea et al. (1998). As shown inFigure 1, in the scheme of Shirai et al. (1996) thegeometry of the loop is considered in terms of theconformation of the take-off region formed fromthe residues immediately after b-strand F andbefore b-strand G. In particular there are threearrangements for the conformations of the resi-dues prior to b-strand G. The simplest arrange-ment is termed extended (E) where three residues(G-4, G-3 and G-2) are in an extended confor-mation (b or x Ramachandran code) leading tothe loop roughly lying in the plane of strands Fand G. The second arrangement is referred to askinked (K) and has residue G-3 in the (a) confor-mation between the two extended residues intro-ducing a kink that results in the loop lyingoutside the FG plane. The third arrangement hasa bulge-like conformation with the Ramachan-dran code (bab) at residues G-7, G-6 and G-5 inaddition to the kink and is referred to here askinked plus bulge (K�). The most commonRamachandran codes for the three forms givenby Shirai et al. (1996) are:
and I (irregular) is none of these. However, furthervisual inspection after clustering (see below)showed that occasionally the Ca chain trace canadopt the E, K, and K� geometries with differentRamachandran codes in the take-off region prior tostrand G. Table 1 gives our assignment of take-offgeometries. Loops are ®rst classi®ed by the stan-dard Ramachandran codes. Other loops wereinspected and assigned by their take-off geometry.In addition, the classi®cation by Morea et al. (1998),where available, is reported for comparison.
Shirai et al. (1996) and subsequently Morea et al.(1998) report the sequence patterns that determinewhether the take-off region is extended (E) orkinked (K and K�). The main patterns as reportedby Morea et al. (1998) are given below but as notedby these workers and Shirai et al. (1996) there areoccasional exceptions to these rules.
Clustering of H3
Clustering uses a scoring scheme for equivalen-cing a pair of loops that allows insertions in thealignment by a dynamic programming algorithm
Residues G-7 G-6 G-5 G-4 G-3 G-2
E geometry b or x b or x b or xK geometry b a bK� geometry b a b b a b
Position C � 2 Position G-3 Take-off geometry
Arg or Lys Any residue K or K�
Not (Arg or Lys) Asp ENot (Arg or Lys) Not Asp Generally not observed for
loops > 10 residues
analogous to standard sequence alignment. Thisstudy considers the entire loop that consist both ofthe take-off region and the remaining residues thatwe refer to as the loop apex. The procedure auto-matically yielded 22 clusters for the loops (seeTable 2). The mean and standard deviation of thebackbone RMSD for pairs of equivalenced loopsare given in the Table but note that clustering wasnot based on RMSD. A total of 41 loops out of 62were clustered; therefore we have been able toclassify 66% of the loops. An individual loop canbe assigned to several clusters and chaining clus-ters that have loops in common (see Methods) ledto ten classes (Table 2).
The relationship between the ten classes of H3loops and the Shirai et al. (1996) nomenclature isillustrated by a Venn diagram (Figure 2). There arethree classes described as K, but none as just K� orE. One class consists of two loop with irregular (I)take-off geometry. Both H3 loops clustered ashaving the I take-off geometry have similar Rama-chandran codes (bbl) and (bxl), since x is the over-lap region between b and p conformations. Thesehave a peptide ¯ip between G-3 and G-2 comparedto the standard K (bab) conformation. When thestructures of more H3 loops have been determined,this conformation may prove to be another stan-dard take-off geometry. Indeed there are two moreloops with this take-off geometry but they were notclustered with any other loops. In addition to K andI classes, some classes contain loops belonging todifferent Shirai et al.-type arrangements. There arethree classes described as K/E, two as K/K� andone as K�/E. The nomenclature used in Table 2gives the Shirai et al.-type arrangement followed bythe length of the longest loop in the class. Figure 2shows the ten classes of loops differentiatingbetween the extended and the kinked loops.
The central aspect of our clustering procedure isthat both the main-chain geometry of the apex andthe take-off regions of the loops are clustered.Accordingly, some of the clusters result from loopswhere the geometry of both the apex and the take-off regions are similar. However, our procedureallows insertions in the loop alignment and thus acluster can also be formed from loops with com-mon apex geometry but different take-off arrange-ments. This leads to the classes with overlappingShirai et al. (1996)-type arrangements.
Canonical forms
The assignment of loops to a class is a conse-quence of chaining together loops common todifferent clusters. Only loops within the same clus-ter will have a similar conformation. Loops fromdifferent clusters within the same class will haverelated conformations, but these loops will gener-ally not be as similar to one another compared totwo loops from the same cluster. The clusters con-tain between two and ®ve loops and accordinglywe required the presence of at least one of threeadditional features to suggest whether a cluster

Ta
ble
2.
Cla
ssi®
cati
on
of
H3
loo
ps

Th
ecl
ass
of
the
loo
ps
isg
iven
foll
ow
edb
yth
eP
DB
cod
ean
dth
elo
op
len
gth
.T
he
clu
ster
sar
eth
enre
po
rted
tog
eth
erw
ith
the
PD
Bco
de
for
the
loo
ps
and
the
cod
efo
rth
eta
ke-
off
geo
me-
try
(see
Tab
le1)
.T
he
seq
uen
cean
dR
amac
han
dra
nco
des
for
each
loo
pis
giv
en.
Th
eR
MS
Dv
alu
esar
eca
lcu
late
du
po
nth
esu
per
imp
osi
tio
no
fth
eb
ack
bo
ne
ato
ms
of
the
alig
ned
resi
du
es.
Can
on
ical
form
sar
ein
dic
ated
by
aC
.A
con
sen
sus
seq
uen
cean
da
con
sen
sus
Ram
chan
dra
nf
,csp
ace
for
each
clu
ster
isin
dic
ated
wit
hin
par
enth
ese
con
tain
ing
the
loo
p.
Th
eco
de
for
the
seq
uen
ceco
nse
nsu
sis
aco
nse
nsu
sre
sid
ue
inca
pit
als,
afo
rar
om
atic
(F,W
,Y),
pfo
rp
ola
r(D
,E,K
,H,N
,Q,R
,S,T
,Y)
and
hfo
rn
on
-po
lar
(A,C
,F,G
,I,L
,M,P
,V,W
,Y).
Th
ecl
assi
®ca
tio
nw
asd
eriv
edfo
rth
ed
ata
set
inT
able
1A.
Lo
op
sfr
om
Tab
le1B
that
wer
esu
bse
qu
entl
yad
ded
toth
ecl
ust
ers
are
den
ote
db
elo
wa
bro
ken
lin
ein
the
list
of
PD
Bco
des
and
bel
ow
the
app
rop
ri-
ate
clu
ster
.T
he
RM
SD
for
the
enti
recl
ust
erin
clu
din
gth
en
ewH
3lo
op
isal
sore
po
rted
bel
ow
the
bro
ken
lin
e.

Figure 2. Venn diagram with the set of H3 classes. The Ca tracing of the loops and adjacent b-strands is depicted andoverlapped for the different members of each class. In dark are depicted those motifs with extended take-off regionand the rest are in light.
1200 Classi®cation of Antibody H3 Loops
could be termed a canonical form. The ®rst featureis that there is a consensus sequence motif and thesecond that there is a consensus intra-loop inter-action. The third feature is that the cluster hasidentical Ramachandran code (allowing for theoverlap of (lgv) and of (pxb) regions see Methods,structural alignment and score). This procedureidenti®ed that 13 of the 22 clusters can thereby beassigned to canonical forms (Figure 3). These 13canonical forms contain 31 loops representing 50%of the original 62 loops considered. The sequencemotifs are a combination of residues in take-offregion and those in the loop apex. These canonicalforms are described below together with the stron-gest of the sequence patterns. The sequence motifsmust be regarded as preliminary given the fewloops that are in each canonical form.
K canonical forms
(1) Cluster K10.1 (Figure 3a) is considered to becanonical as a result of a well de®ned confor-mational consensus without insertions. There is,however, a weak consensus in sequence with a Tyror His at position G-2 of the loop.
(2) Cluster K13.1 (Figure 3b) consists of twodifferent types of loops, one formed by the H3
loop of 1tet and 2cgr and the other by the H3 loopof 1plg and 1kel. The difference is due to the inser-tion of a Gly in position C � 4 of the loop from1plg and 1kel. Nevertheless, the aligned residuesshow a similar pattern of the f,c space and theirsuperimposition gives an RMSD of about1.2(�0.4) AÊ . The consensus sequence motif consistof loop residues polar-aromatic-X-Met-Asp-Tyr,where the Asp and Tyr are part of the kink in thetake-off region.
(3) Clusters K18.2 (Figure 3c) is formed by twoloops with a common aromatic residue in positionC � 5 that interacts with another aromatic residuein position G-6. A main feature of this canonicalform is the main-chain hydrogen bond betweenthe peptide amide of the residue C � 4 and the car-bonyl oxygen in G-7.
(4) Clusters K18.3 (Figure 3c) is similar to canoni-cal form K18.2, above, and shows the samesequence and hydrogen bonding patterns but hasdifferent Ramachandran codes.
I canonical form
(1) Cluster I16 (Figure 3d) has an unusual kinkedtake-off with a (bbl or bxl) rather than a (bab) con-formation. The motif is an Asp/Glu-X-aromatic,

Classi®cation of Antibody H3 Loops 1201
where the motif begins at C � 4 or C � 5 depend-ing on whether there is an insertion.
K/K� canonical forms
(1) Cluster (K/K�)18.5 (Figure 3e) has a main-chain hydrogen bond between the peptide amideof the residue in position C � 3 or C � 5 and thecarbonyl oxygen of C � 6 or C � 8. The sequencemotif is Asp-X-Tyr starting at C � 3 or C � 5,where the Asp forms a hydrogen bond with main-chain amide at position C � 7 or C � 9.
Figure 3(a±d) (lege
(2) Cluster (K/K�)22.1 (Figure 3f) has themotif polar-Arg-X-X-Tyr-X-X-polar-Gly starting atC � 3.
(3) Cluster K/K�22.2 (Figure 3 g) has the motifTyr-Asp at position C � 7 and two aromatic resi-dues at position C � 10 or C � 12 that form anintra-loop hydrophobic interaction.
K/E canonical forms
(1) Cluster K/E15a.1 (Figure 3 h) shows identicalapex, a b-turn of type I0 2:2, but different take-offregions. A common main-chain hydrogen bond
nd on page 1203)

1202 Classi®cation of Antibody H3 Loops
exists between the peptide amide at position C � 4and the carbonyl oxygen at position C � 7.
(2) Cluster K/E17.1 (Figure 3i) has the motif ofAsp/Asn at C � 4 (rather weak as in only threeout of the ®ve loops) and Tyr at position C � 6 orC � 7 and a common main-chain hydrogen bondbetween the carbonyl oxygen at C � 4 and the pep-tide amide at C � 8 or C � 9. The cluster is formedby four loops in a kink and one in an extendedtake-off region.
(3) Cluster K/E17.2 (Figure 3j) has the sequencemotif Phe-Asp-Tyr beginning at position G-4which is involved in the kink take-off region and
Figure 3(e±h) (l
an Asp/Asn at C � 4 or C � 5. In addition themain-chain hydrogen bond is the same asdescribed above for cluster K/E12.1.
K�/E canonical forms
(1) Cluster K�/E15.1 (Figure 3k) has the motifTyr-aromatic beginning at position G-5. It is theonly cluster formed by loops with an extendedtake-off region.
(2) Cluster K�/E10.3 (Figure 3 l) has the motif ofGlu/Asp at position C � 6 and aromatic-Phebeginning at position G-5.
egend opposite)

Figure 3. Conformations of the 13 canonical forms for H3. The Ca tracing of the loops are superimposed according toresidue equivalencies illustrated by the sequence alignment of Table 2. Key features for each cluster are described inResults and shown in each panel. Cluster K18.2 and K18.3, which are very similar in conformation are shown in c.The codes for loops shown in light or dark lines are given in the Figure.
Classi®cation of Antibody H3 Loops 1203
Validation of Clustering and Predictionof Conformation
Clustering of additional H3 loops
The clustering procedure placed 41 loops into 22clusters and with this size of data it is important toshow that the results are robust and will notchange markedly when more H3 loops are con-sidered. Accordingly, after the above analysis was
performed, and following the suggestion of a refer-ee, the PDB was examined for the recently depos-ited antibody co-ordinates. Table 1B lists the 15new H3 that were identi®ed together with theassignment of the take-off geometry. These loopswere pooled with the original data set (Table 1A)and the clustering repeated with all the originalparameters.
Nine of the 15 new H3 loops were added to clus-ters identi®ed in the original analysis (shown

1204 Classi®cation of Antibody H3 Loops
below the broken line in Table 2). For any originalcluster with three or more H3 loops, the new H3was automatically added to the existing cluster.When the original cluster only had two loops (say1 and 2), the repeated clustering with loops 1,2 andthe new loop 3 yielded two separate clusters, 1and 2 and 2 and 3. The application of chain linkage(see Methods) generated the new cluster with 1and 2 and 3. Seven of these nine clusters corre-sponded to canonical forms. The mean � standarddeviation of the backbone RMSD for the enlargedcluster (original plus new H3 loops) is given inTable 2. All the average RMSD values are below2.0 AÊ . Table 3 gives the pairwise backbone RMSDvalue between each new H3 loop and the individ-ual cluster members reporting the minimum, maxi-mum and average values. Figure 4 shows asuperposition of the new loops on the previouslyestablished clusters.
The consensus sequence motifs and interactionsfor canonical forms were re-examined to checktheir validity when the additional H3 loop isincluded. In general many of the sequence patternsremained but some are no longer observed. Theresults for the seven canonical forms with the newH3 loops are given below.
(1) Cluster K10.1 maintains the sequence motif.(2) Cluster K13.1 requires the sequence motif to
be changed from polar-aromatic-X-Met-Asp-Tyr toX-aromatic-X-non-polar-Asp-aromatic.
(3) Cluster K18.2 looses most of the suggestedconsensus features and now only has a commonaromatic at position C � 5. This suggests that thismay not be a canonical form.
Table 3. Prediction of canonical forms for H3 loops
Observed
CDR-H3loop
Observedcluster
Min.RMSD
(AÊ )
Max.RMSD
(AÊ )
MeanRMSD
(AÊ )
1psk K10.1 0.6 1.1 0.8 � 0.21mim K13.1 0.4 1.4 0.8 � 0.41mpa K18.2 1.5 2.6 2.0 � 0.51mf2 K/K� 22.2 1.2 1.6 1.4 � 0.21cfv K/E 17.1 0.7 1.4 1.1 � 0.32h1p K/E 17.2 1.6 1.8 1.7 � 0.11ipt K�/E 15.3 1.8 2.1 2.0 � 0.21igt K/K�18.2 0.7 0.9 0.8 � 0.11ap2 K/E 15b.1 1.4 2.1 1.8 � 0.31axs None ± ± ±1hyx None ± ± ±1kno None ± ± ±1yuh None ± ± ±1aqk None ± ± ±1yec None ± ± ±
For each of the new H3 loops, the Table shows which cluster (ifmum, mean � standard deviation of the pairwise RMSD betweenthat are canonical forms are denoted by Yes below the C form coltop rank of the correct canonical form (i.e. true positive), IP for iparentheses, and TN for true negative. The score of the top rank istop rank. The results for prediction from the single loop sequence a
(4) Cluster K/K�22.2 no longer has a sequencemotif apart from one aromatic at C � 13. Thissuggests that this may not be a canonical form.
(5) Cluster K/E17.1 maintains its sequence motifand the hydrogen bond.
(6) Cluster K/E17.2 maintains its sequence motifand the hydrogen bond.
(7) Cluster K�/E15.3 maintains the motif Glu/Asp at position C � 6 but now only has a Phe atG-4 instead of aromatic at G-5 and Phe at G-4.
These results suggest that many aspects of theinitial analysis are robust to the inclusion ofadditional H3 loops but, as expected given theoriginal data size, certain suggestions will have tobe amended as new loops are included.
Prediction of H3 conformation
We now examine whether one can predict fromthe sequence of an H3 loop which canonical formit adopts. The 15 new H3 loops provide a test setwith known answers that were not used in thedevelopment of the cluster de®nition and associ-ated sequence pattern. The approach is to use thesequence alignments in Table 1 (from the originaldata set only) to generate a set of pro®les. The pre-diction is based on the rank of the matching scorebetween a new H3 sequence (from C92 to G104inclusive) and the pro®le for each canonical form.The algorithm is based on standard pro®le match-ing including the introductions of gaps (e.g. seeGribskov et al., 1987; Barton & Sternberg, 1990) asdescribed in Methods.
Table 3 gives the results of the predictions. Toevaluate the approach we use a strict criterion tode®ne a true positive as when the correct canonical
Prediction with profilematrices
Prediction with singleloop matrices
C form
Rank ofcorrectC form
Score oftop (correct)
C form
Rank ofcorrectC form
Score oftop (correct)
C form
Yes 1 0.47 IP (2) 0.47 (0.45)Yes 1 0.51 IP (8) 0.47 (0.44)Yes IP (3) 0.45 (0.44) IP (2) 0.45 (0.42)Yes 1 0.45 IP (2) 0.45 (0.45)Yes 1 0.44 IP (3) 0.47 (0.43)Yes 1 0.51 1 0.51Yes IP (8) 0.49 (0.43) IP (33) 0.48 (0.35)No IP 0.53 (0.52) IP (7) 0.52 (0.48)No IP 0.49 (0.45) IP (24) 0.46 (0.39)No IP 0.47 IP 0.44No IP 0.44 TN 0.41No TN 0.41 TN 0.43No TN 0.39 TN 0.38No TN 0.41 TN 0.34No TN 0.40 TN 0.37
any) it has been grouped with together with the minimum, maxi-the new loop and each original member of the cluster. Clusters
umn. The results of the pro®le prediction are given with a 1 forncorrect positive with the rank of the correct canonical form ingiven followed by the score for the correct canonical form if not
re presented analogously.

Classi®cation of Antibody H3 Loops 1205
form has the highest rank and a total score(TS) 5 0.44. A true negative prediction (TN) iswhen the loop is not in a canonical form and thealgorithm correctly identi®ed that there was nomatching loop as the highest TS < 0.44. An incor-rect positive (IP) is when a loop that is a canonicalform was assigned to the wrong canonical form.(Note the more usual term false positive is notused because this is not the standard two-state pre-diction as a positive prediction can incorrectlyassign a canonical form.) False negative predictionscould, in principle, also occur but there were none.
Figure 4(a±d) (lege
For additional information about the IP predic-tions, the Table also gives the rank of the correctcanonical form.
To evaluate the prediction, the results can becompared to an analogous sequence search per-formed against all H3 loops. By inspection, thesame cut-off as for the pro®le method was appro-priate. The highest scoring loop is taken as the pre-diction provided TS 5 0.44. The added success ofthe pro®le method above the single sequenceresults is due to knowledge of which loops are incanonical forms and the added information in the
nd on page 1206)

Figure 4. New H3 loops assigned to clusters. The new loop is in dark and the original cluster is lighter. Panels a to gare the seven loops that are canonical; h shows the two additional non-canonical clusters.
1206 Classi®cation of Antibody H3 Loops
pro®le of the cluster beyond that in each individualsequence.
The pro®le method identi®ed the correct canoni-cal form (rank 1) for ®ve out of the seven new H3loops that were in a canonical form. In contrast,the single sequence method was far poorer andwas only able to identify correctly one canonicalform. Of the two H3 loops assigned to canonicalforms that the pro®le method failed to predict,1mpa in cluster K18.2 may well prove not to be acanonical form as its sequence pattern was not
robust when 1mpa was also included. For four ofthe eight H3 loops that were not in a canonicalform, the pro®le method correctly predicted a truenegative (i.e. that there is no matching canonicalform). With the single sequence method, true nega-tives were correctly assigned for ®ve out of theeight loops. Overall the ratio of the number oftimes the pro®le method was correct and the singlesequence approach wrong compared to singlesequence being correct and the pro®le wrong is 4to 1. This ratio is not signi®cant as judged against

Figure 5. Two H3 loops with a common apex confor-mation but different take-off geometries. The main-chainstructure of two H3 loops in a cluster that share acommon apex geometry but have different take-offconformations.
Classi®cation of Antibody H3 Loops 1207
a random 50/50 choice between two methods.Nevertheless, this suggests that with more dataone may well be able to demonstrate a signi®cantimprovement in prediction of canonical forms bythe consideration of pro®les for canonical forms ascompared to matching against all single H3sequences.
Discussion and Conclusion
Canonical forms for H3 loops were identi®ed byan automated approach that allowed for the pre-sence of insertions in the aligned loops. A total of13 canonical forms consisting of 31 loops werecategorised from the starting set of 62 loops. Thecharacteristic of a canonical form is that it is a clus-ter of loops in f,c space that can be of variablelength that also has at least one of the followingadditional features: a sequence motif, an intra-loopinteraction or an identical main-chain geometry.The clustering procedure considered the entireloop without distinguishing between the apex andthe take-off regions. However, 5 of the 13 canonicalforms consisted of speci®c arrangements for thetake-off geometry (four for K and one for I). Theremainder exploited the introduction of insertionsto identify common features of the apex irrespec-tive of the number of residues in the take-offregion. This suggests that there are several canoni-cal forms each of which is a combination of aspeci®c apex geometry combined with differenttake-off geometries. A good illustration of thisprinciple is the canonical form K/E15a, where a Kand an E take-off geometry have identical Rama-chandran codes for the rest of the loop (1¯r and1vfa) and a very similar structure (Figure 5). It isthis diversity of combinations that yields a reper-toire of conformations for a single canonical form.This diversity may stem from the gene structure asthe splicing regions for V-D and D-J regions are atthe N and C termini of the H3 loop (e.g. seeTonegawa, 1983; Pascual & Capra, 1991). However,the rules for splicing are complex and a detailedstudy is required to relate gene recombination tothe conformation of H3 loops analogous to thatperformed for the Vk domain (Tomlinson et al.,1995).
The key feature of our approach is allowing forinsertions in loop clustering. Indeed, if our algor-ithm is run without gap introduction then eitheronly a few clusters for a small fraction of the data-base is obtained or almost all loops are combinedinto a few non-speci®c clusters. Previous analysesof H3 have not been designed to allow for inser-tions. Rees and co-workers (Rees et al., 1994, 1996)classi®ed H3 based on the take-off angle and looplength. Their classes are a more general descriptionof the path of the polypeptide chain and does notconsider the detailed main-chain geometry. Theclassi®cation of Martin & Thornton (1996) is basedon ®rst clustering by torsion angles and then by Ca
RMS. They identi®ed only one H3 cluster withfour loops of seven residues (numbered accordingto Kabat et al., 1991), which corresponds to loopsof length 12 in our work. In our database there areeight loops of length 12. Only one pair of these(2cgr and 1tet) are clustered together and com-bined with two loops of 13 residues to yield thefour-loop cluster K13.1. This difference in cluster-ing 12 residue loops is probably due to differencesin the cut-off in torsion geometry in the two clus-tering algorithms. The work of Shirai et al. (1996)only considers the take-off arrangements of the H3loops but not the conformation of the loop apex.Our classi®cation scheme combines both the take-off and the apex geometry and uses their classi®-cation scheme to organise our description of cano-nical forms.
Recently and independently Morea et al. (1998)published an analysis of H3 loop extending datapreviously reported on the World Wide Web(http://predict.sanger.ac.uk/irbm-course97/Bio-computing/Projects/h3.html). The focus of theirstudy is the classi®cation based on the presenceor absence of the b-bulge (torso bulged or torsonot-bulged) together with a few H3 described asirregular. In our study and that of Shirai et al.(1996) this torso-bulge is subdivided into kinked(K) and kinked plus bulge (K�) conformations forthe take-off region. The conformations of theapex for H3 of a given length and with a giventorso conformation were subsequently comparedby Morea et al. (1998) guided by RMS deviation.In contrast, our study used the Ramachandran

1208 Classi®cation of Antibody H3 Loops
code to cluster the loop geometry. In general, ourclassi®cation of the take-off conformation agreeswith theirs for the antibodies that both groupsanalysed (see Table 1). For the apex geometry,Morea et al. (1998) identify a very similar confor-mation for the 12-residue H3 of 1tet and 2cgrwith an RMSD for backbone atoms of 0.44 AÊ . Inour study these two loops have identical Rama-chandran codes and they are clustered with two13 residue H3 to form canonical form K13.Morea et al. (1998) do not identify any otherpairs of loops with such a low RMSD. Thisabsence of close structural similarity for otherloops is the cause of the differences between theirassignment of apices with similar geometry basedon RMSD and ours based on Ramachandrangeometry.
Antibody structures are now being solved at anever increasing rate. We have therefore been ableto assess the robustness of our initial classi®cationof 62 loops. When an additional new set of 15 H3loops were added, seven of the new loops werefound to adopt previously identi®ed canonicalstructures. Sequence pro®les generated from the
Sequence alignment1gig H EE 8 14 : TAMYYCAR1dfb H EE 9 17 : MALYYCVK
Ramachandran alignment1gig H EE 8 14 : xbxbbbbx1dfb H EE 9 17 : xbbxbxbb
Sequence alignment1gig H EE 8 14 : TAMYYCAR1dfb H EE 9 17 : MALYYCVK
Ramachandran alignment1gig H EE 8 14 : xbxbbbbx1dfb H EE 9 17 : xbbxbxbb
But also,
regions, l/g and b/p (Oliva et al., 1996) are also con-sidered (residues being in l/g conformation, described asv, gives optimal score when aligned with residues in l, gor l/g conformation and region b/p, described as x, isanalogously treated with respect to b and p regions). Fora pair of loops a conformational similarity score isde®ned as the percentage of the total number of residuesthat can be equivalenced with identical conformationalcodes between both ends of the loop (minus a penaltyfor gaps). The alignment is produced by means of adynamic algorithm (Needleman & Wunsch, 1970) thattakes into account the gaps within the Ramachandrancodes.
A consensus sequence can be extracted from thealigned loops, this being de®ned with at least 75% agree-ment. A code is used to represent the chemical propertiesof the consensus of the aligned residues: (a) for aromaticsresidues, (p) for polar residues and (h) for non-polar resi-dues. No sequence consensus is denoted by X, whilst noconformational consensus is denoted with a dot. Theinsertions are indicated by underlining the characters ofthe residue and conformation, using the partial consen-sus of the inserted residues.
However, two different alignments may give the samescore, for example the alignment of the H3 loops of 1gigand 1dfb could be:
DFYDYDVFY.Y..AMDYWGQGTAMYGRDYYDSGGYFTVAFDIWGQGMALY
xbaxbabx.bxb..babbxaexbxbxxaxbbbxebbxabbabbxaexbbx
DFYDYDV..FYY.AMDYWGQGTAMYGRDYYDSGGYFTVAFDIWGQGMALY
xbaxbab..xbx.bbabbxaexbxbxxaxbbbxebbxabbabbxaexbbx
and the resulting score would be the same.Therefore, the problem of the alignment remains
unsolved by this method, unless a further visual inspec-tion is taken into account and the alignment is corrected.This problem does not affect the classi®cation becauseonly the best score is used to compare the set of loopsand to cluster them, independently of the alignment.However, it is required on occasions for the subsequentanalysis of the clusters and the correct alignment of theloops which is a prerequisite for describing the consen-sus sequence.
Clustering of loops and classification
The clustering method is based upon the density ormode-seeking technique (searching for regions contain-ing a relatively dense concentration of loops), a versionof single linkage analysis (Everitt, 1974). Loops areallowed to belong to different clusters. Therefore, clus-ters are joined by means of chain linkage (through loopscommon to both clusters) to produce one class, and thealignment of the whole set of loops of the class is
initial analysis were able to predict the correctcanonical class for ®ve of these seven new loopsfrom their sequences. This study therefore suggeststhat the prediction of the structure of H3 loopsfrom sequence for many antibodies will be compu-tationally tractable and thus provide a solution toa major problem in modelling antibody combiningsites from sequence.
Methods
Structural alignment and score
The conformation of the residues in the loop wasde®ned by an assignment into the accessible regions inthe (f, c) space based on the analysis by Wilmot &Thornton (1990). These regions are a, aL, g, b, bP, and e ,which are described as a, l, g, b, p, and e in keeping withour earlier work (Oliva et al., 1996). Cis-proline residuesare taken into account as a different region of Ramachan-dran space (described as w). In addition two special

Classi®cation of Antibody H3 Loops 1209
rearranged manually. The visual inspection of the loopsand the correction of the alignment improved thedescription of the classes, which are mainly dependenton the take-off region motif. This approach was ourinitial choice following its application to loop clusteringin general (Oliva et al., 1996) and as useful results wereobtained for this study we did not consider alternateapproaches.
Each class is subdivided afterwards into the automati-cally obtained clusters. The clusters can be analysed bysuperimposition of the aligned regions and the calcu-lation of its RMSD (Havel & WuÈ thrich, 1985). The classesnomenclature was de®ned by the conventional type ofloop (kinked base: K, extended base: E, and kinked baseplus an extra bulge extension in the C-terminal side ofthe loop: K�) and the length of the largest loop withinthe class. Some clusters are obtained with the combi-nation of loops with kinked and extended base, kinkedbase and kinked base plus an extra bulge, etc., showinga similar conformation between the extremes of the loop.Therefore, most of the classes are described by thesecombinations as such as (K/E) for classes with loopswith kinked base and extended base and (K/K�) forclasses with loops with kinked base and kinked baseplus an extra bulge.
Prediction of H3 cluster by profile analysis
A sequence pro®le for each of the canonical formslisted in Table 2 was generated from the alignedsequences (without the addition of the sequences of thenew H3 loops). The sequence pro®le can be representedas a matrix Pij of the residue types (including gap as the21st residue type) at position j (j � 1,L) in the ithsequence (i � 1,M). A new CDR-H3 sequence Ck
(k � 1,N) is scored against the pro®le. When Ck ismatched against position j of the pro®le the score for thematch at that position (Sj) is given by:
Sj � 1
M
XMi�1
X�Pij;Ck�
where X(Pij, Ck) is an element of 21 � 21 scoring matrix.The ®rst 20 � 20 elements of X are de®ned as:
X � 1
105IDEN � 3HYDRO� 2
11BLOSUM62
� �IDEN is the identity matrix that scores 1 for the sameresidue type. HYDRO is a matrix that matches thehydrophobic character of the residue, a score is 1 if theresidues i and k are in the same set, either{A,C,G,F,L,I,M,P,V,W,Y} or {D,E,G,H,K,N,R,Q,S,T,Y}.The standard BLOSUM62 matrix (Henikoff & Henikoff,1992) is premultiplied by 1/11 as the maximum score ifthe matrix is 11. The weights 5/10, 3/10 and 2/10 werechosen after trials of the predictive accuracy of thisapproach. Thus, if Ck is (say) Val and all the residues inthe pro®le at position j are Val, the Sj will be 1.
If a gap which is introduced in the Ck sequence ismatched against a gap in the pro®le, a score of 1 isassigned (denoted by X(21,21) � 1). If the gap in the Ck
sequence is matched against an amino acid in the pro®leit scores 0 (X(d,21) � 0, d � 1,20). If a gap occurs in thepro®le and is matched against an amino acid in thesequence a score of 0 is given (X(21,k) � 0, k � 1,20). Inaddition, a total gap penalty (GAP) is introduced to con-sider when a new gap is inserted at position j in the pro-®le or a gap is introduced into the sequence and there is
no aligned position in the pro®le with a gap. The totalgap penalty is the sum of the individual af®ne gappenalties each of which scores �0.4 for gap introductionand �0.1 for each gap extension. The total score (TS) foraligning the new seqquence against the pro®le is:
TS � 1
L
XL
j�1
Sj
0@ 1Aÿ GAP
Each H3 sequence from the new set was scanned againsteach canonical pro®le and the total score (TS) calculated.By inspection of the results, a new H3 loop was assignedto the highest ranking cluster provided TS 5 0.44 andfor lower values of TS the new H3 was classi®ed as notadopting a canonical form.
To compare the above prediction with one that mighthave been performed prior to any classi®cation of H3loops, the search was performed scanning against eachsingle ungapped sequence for all H3 loops using thesame scoring matrix.
Acknowledgements
This work was supported by grants BIO95-0848 andBIO97-511 from the CICYT (Ministerio de EducacioÂn yCiencia, Spain); Spain/UK Acciones Integradas HB96-145; by C4-CESCA; by the Centre de RefereÁncia en Bio-tecnologia de la Generalitat de Catalunya; and byFundacioÁ J. de Roviralta. We thank Dr Peter Sasieni(ICRF) and Dr Cyrus Chothia (MRC, Cambridge) forhelpful discussions.
References
Al-Lazikani, B., Lesk, A. M. & Chothia, C. (1997). Stan-dard conformations for the canonical structures ofimmunoglobulins. J. Mol. Biol. 273, 927±948.
Barton, G. J. & Sternberg, M. J. E. (1990). Flexible proteinsequence patterns: a sensitive method to detectweak structural similarities. J. Mol. Biol. 212, 389±402.
Bernstein, F. C., Koetzle, T. F., Williams, G., Meyer, D. J.,Brice, M. D., Rodgers, J. R., Kennard, O.,Shimanouchi, T. & Tasumi, M. (1977). The ProteinData Bank: a computer-based archival ®le formacromolecular structures. J. Mol. Biol. 112, 535±542.
Bruccoleri, R. E., Haber, E. & Novotny, J. (1988). Struc-ture of antibody hypervariable loops reproduced bya conformational search algorithm. Nature, 335,564±568.
Chothia, C. & Lesk, A. M. (1987). Canonical structuresfor the hypervariable regions of immunoglobulins.J. Mol. Biol. 196, 901±918.
Chothia, C., Lesk, A. M., Levitt, M., Amit, A. G.,Mariuzza, R. A., Phillips, S. E. & Poljak, R. J. (1986).The predicted structure of immunoglobulin D1. 3and its comparison with the crystal structure.Science, 233, 755±758.
Chothia, C., Lesk, A. M., Tramontano, A., Levitt, M.,Smith-Gill, S. J., Air, G., Sheriff, S., Padlan, E. A.,Davies, D., Tulip, W. R., Colman, P. M., Spinelli, S.,Alzari, P. M. & Poljak, R. J. (1989). Conformationsof immunoglobulin hypervariable regions. Nature,342, 877±883.

1210 Classi®cation of Antibody H3 Loops
Chothia, C., Lesk, A. M., Gherardi, E., Tomlinson, I. M.,Walter, G., Marks, J. D., Llewelyn, M. B. & Winter,G. (1992). Structural repertoire of the human VH
segments. J. Mol. Biol. 227, 799±817.Donate, L. E., Ru®no, S. D., Canard, L. H. J. & Blundell,
T. L. (1996). Conformational analysis and clusteringof short and medium loops connecting regular sec-ondary structures: a database for modeling and pre-diction. Protein Sci. 5, 2600±2616.
Everitt, B. (1974). In Cluster Analysis, chapt. 3, HeinemanEducational Books Ltd, London.
Fidelis, K., Stern, P. S., Bacon, D. & Moult, J. (1994).Comparison of systematic search and databasemethods for constructing segments of protein struc-ture. Protein Eng. 7, 953±960.
Gribskov, M., McLachlan, A. D. & Eisenberg, D. (1987).Pro®le analysis: detection of distantly related pro-teins. Proc. Natl Acad. Sci. USA, 84, 4355±4358.
Havel, T. F. & WuÈ thrich, K. (1985). An evaluation of thecombined use of nuclear magnetic resonance anddistance geomety for the determination of proteinconformation in solution. J. Mol. Biol. 182, 281±294.
Henikoff, S. & Henikoff, J. G. (1992). Amino acid substi-tution matrices from protein blocks. Proc. Natl Acad.Sci. USA, 89, 10915±10919.
Jones, P. T., Dear, P. H., Foote, J., Neuberger, M. S. &Winter, G. (1986). Replacing the complementarity-determining regions in a human antibody withthose from a mouse. Nature, 321, 522±525.
Kabat, E. A., Wu, E. T., Perry, H. M., Gottesman, K. S.& Foeller, C. (1991). Sequences of Proteins of Immuno-logical Interest, US Department of Health andHuman Services NIH, Bethesda, MD.
Kwasigroch, J. M., Chomilier, J. & Mornon, J. P. (1996).A global taxonomy of loops in globular proteins.J. Mol. Biol. 259, 855±872.
Martin, A. C. R. & Thornton, J. M. (1996). Structuralfamilies in loops of homologous proteins: automaticclassi®cation, modelling and application to anti-bodies. J. Mol. Biol. 263, 800±815.
Martin, A. C. R., Cheetham, J. C. & Rees, A. R. (1989).Modeling antibody hypervariable loops: a com-bined algorithm. Proc. Natl Acad. Sci. USA, 86,9268±9272.
Morea, V., Tramontano, A., Rustici, M., Chothia, C. &Lesk, A. M. (1998). Conformations of the thirdhypervariable region in the VH domain of immuno-globulins. J. Mol. Biol. 275, 269±294.
NeedlemanS., B. & Wunsch, C. D. (1970). A generalmethod applicable to the search for similarities inthe amino acid sequence of two proteins. J. Mol.Biol. 48, 443±453.
Oliva, B., Bates, P. A., Querol, E., AvileÂs, F. X. &Sternberg, M. J. E. (1997). An automatic classi®-cation of the structure of protein loops. J. Mol. Biol.266, 814±830.
Pascual, V. & Capra, J. D. (1991). Human immunoglobu-lin heavy chain variable region genes: organisation,polymorphism, and expression. Advan. Immunol. 49,1±74.
Rees, A. R., Staunton, D., Webster, D. M., Searle, S. J.,Henry, A. H. & Pedersen, J. T. (1994). Antibodydesign: beyond the natural limits. Trends Biotechmol.12, 199±206.
Rees, A. R., Searle, S. J., Henry, A. H., Whitelegg, N. &Pedersen, J. (1996). Antibody combining sites: struc-ture and prediction. In Protein Structure Prediction:A Practical Approach (Sternberg, M. J. E., ed.),pp. 141±172, Oxford University Press, Oxford.
Ring, C. S., Kneller, D. G., Langridge, R. & Cohen, F. E.(1992). Taxonomy and conformational analysis ofloops in proteins. J. Mol. Biol. 224, 685±699.
Ru®no, S. D., Donate, L. E., Canard, L. H. J. & Blundell,T. L. (1997). Predicting the conformational class ofshort and medium size loops connecting regularsecondary structures: application to comparativemodelling. J. Mol. Biol. 267, 1±16.
Shenkin, P. S., Yarmush, D. L., Fine, R. M., WanG, H. &Levinthal, C. (1998). Predicting antibody hypervari-able loop conformation. I. Ensembles of randomconformations for ringlike structures. Biopolymers,26, 2053±2058.
Shirai, H., Kidera, A. & Nakamura, H. (1996). Structuralclassi®cation of H3 in antibodies. FEBS Letters, 399,1±8.
Tomlinson, I. M., Cox, J. P. L., Gherardi, E., Lesk, A. M.& Chothis, C. (1995). The structural repertoire ofthe human Vk domain. EMBO J. 14, 4628±4638.
Tonegawa, S. (1983). Somatic generation of antibodydiversity. Nature, 302, 575±581.
Tramontano, A., Chothia, C. & Lesk, A. M. (1990). Struc-tural determinants of the conformations of medium-sized loops in proteins. Proteins: Struct. Funct. Genet.6, 382±394.
van Vlijmen, H. W. T. & Karplus, M. (1997). PDB-basedprotein loop prediction: parameters for selectionand methods for optimization. J. Mol. Biol. 267,975±1001.
Wilmot, C. M. & Thornton, J. M. (1990). b-Turns andtheir distorsions: a proposed new nomenclature.Protein Eng. 3, 479±493.
Wintjens, R. T., Rooman, M. J. & Wodak, S. J. (1996).Automatic clasi®cation of aa-turn motifs in pro-teins. J. Mol. Biol. 255, 235±253.
Edited by J. Thornton
(Received 18 November 1997; received in revised form 26 March 1998; accepted 3 April 1998)