Recognition of Rail Car Retroreflective Patterns for Improving ...
46
This document is available to the public through the National Technical Information Service, Springfield, VA 22161 This document is also available on the FRA Web site at www.fra.dot.gov Final Report July 2001 DOT/FRA/ORD-00/07 U. S. Department of Transportation Research and Special Programs Administration John A. Volpe National Transportation Systems Center Cambridge, MA 02142-1093 Office of Research and Development Washington, DC 20590 Recognition of Rail Car Retroreflective Patterns for Improving Nighttime Conspicuity Federal Railroad Administration U. S. Department of Transportation Safety of Highway-Railroad Grade Crossings RAIL ROAD CROSSING
-
Upload
khangminh22 -
Category
Documents
-
view
2 -
download
0
Transcript of Recognition of Rail Car Retroreflective Patterns for Improving ...

This document is available to thepublic through the National TechnicalInformation Service, Springfield, VA 22161This document is also available on the FRAWeb site at www.fra.dot.gov
Final ReportJuly 2001
DOT/FRA/ORD-00/07
U. S. Department of TransportationResearch and Special Programs AdministrationJohn A. Volpe National Transportation Systems CenterCambridge, MA 02142-1093
Office of Researchand DevelopmentWashington, DC 20590
Recognition of Rail CarRetroreflective Patterns for Improving Nighttime ConspicuityFederal Railroad
Administration
U. S. Departmentof Transportation
Safety of Highway-Railroad Grade Crossings
RAIL ROADCROSSING
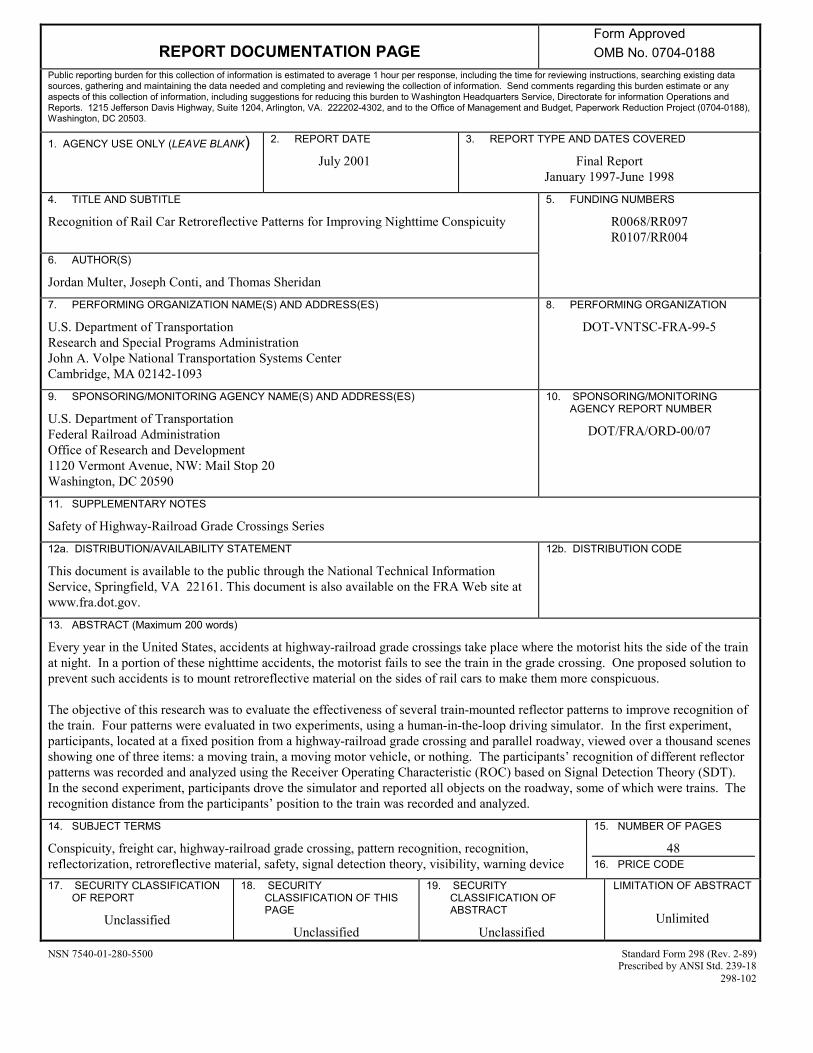
REPORT DOCUMENTATION PAGEForm ApprovedOMB No. 0704-0188
Public reporting burden for this collection of information is estimated to average 1 hour per response, including the time for reviewing instructions, searching existing datasources, gathering and maintaining the data needed and completing and reviewing the collection of information. Send comments regarding this burden estimate or anyaspects of this collection of information, including suggestions for reducing this burden to Washington Headquarters Service, Directorate for information Operations andReports. 1215 Jefferson Davis Highway, Suite 1204, Arlington, VA. 222202-4302, and to the Office of Management and Budget, Paperwork Reduction Project (0704-0188),Washington, DC 20503.
1. AGENCY USE ONLY (LEAVE BLANK) 2. REPORT DATE
July 2001
3. REPORT TYPE AND DATES COVERED
Final ReportJanuary 1997-June 1998
4. TITLE AND SUBTITLE
Recognition of Rail Car Retroreflective Patterns for Improving Nighttime Conspicuity
5. FUNDING NUMBERS
R0068/RR097R0107/RR004
6. AUTHOR(S)
Jordan Multer, Joseph Conti, and Thomas Sheridan
7. PERFORMING ORGANIZATION NAME(S) AND ADDRESS(ES)
U.S. Department of TransportationResearch and Special Programs AdministrationJohn A. Volpe National Transportation Systems CenterCambridge, MA 02142-1093
8. PERFORMING ORGANIZATION
DOT-VNTSC-FRA-99-5
9. SPONSORING/MONITORING AGENCY NAME(S) AND ADDRESS(ES)
U.S. Department of TransportationFederal Railroad AdministrationOffice of Research and Development1120 Vermont Avenue, NW: Mail Stop 20Washington, DC 20590
10. SPONSORING/MONITORINGAGENCY REPORT NUMBER
DOT/FRA/ORD-00/07
11. SUPPLEMENTARY NOTES
Safety of Highway-Railroad Grade Crossings Series
12a. DISTRIBUTION/AVAILABILITY STATEMENT
This document is available to the public through the National Technical InformationService, Springfield, VA 22161. This document is also available on the FRA Web site atwww.fra.dot.gov.
12b. DISTRIBUTION CODE
13. ABSTRACT (Maximum 200 words)
Every year in the United States, accidents at highway-railroad grade crossings take place where the motorist hits the side of the trainat night. In a portion of these nighttime accidents, the motorist fails to see the train in the grade crossing. One proposed solution toprevent such accidents is to mount retroreflective material on the sides of rail cars to make them more conspicuous.
The objective of this research was to evaluate the effectiveness of several train-mounted reflector patterns to improve recognition ofthe train. Four patterns were evaluated in two experiments, using a human-in-the-loop driving simulator. In the first experiment,participants, located at a fixed position from a highway-railroad grade crossing and parallel roadway, viewed over a thousand scenesshowing one of three items: a moving train, a moving motor vehicle, or nothing. The participants’ recognition of different reflectorpatterns was recorded and analyzed using the Receiver Operating Characteristic (ROC) based on Signal Detection Theory (SDT).In the second experiment, participants drove the simulator and reported all objects on the roadway, some of which were trains. Therecognition distance from the participants’ position to the train was recorded and analyzed.
14. SUBJECT TERMS
Conspicuity, freight car, highway-railroad grade crossing, pattern recognition, recognition,reflectorization, retroreflective material, safety, signal detection theory, visibility, warning device
15. NUMBER OF PAGES
4816. PRICE CODE
17. SECURITY CLASSIFICATIONOF REPORT
Unclassified
18. SECURITYCLASSIFICATION OF THISPAGE
Unclassified
19. SECURITYCLASSIFICATION OFABSTRACT
Unclassified
LIMITATION OF ABSTRACT
Unlimited
NSN 7540-01-280-5500 Standard Form 298 (Rev. 2-89)Prescribed by ANSI Std. 239-18
298-102
iii
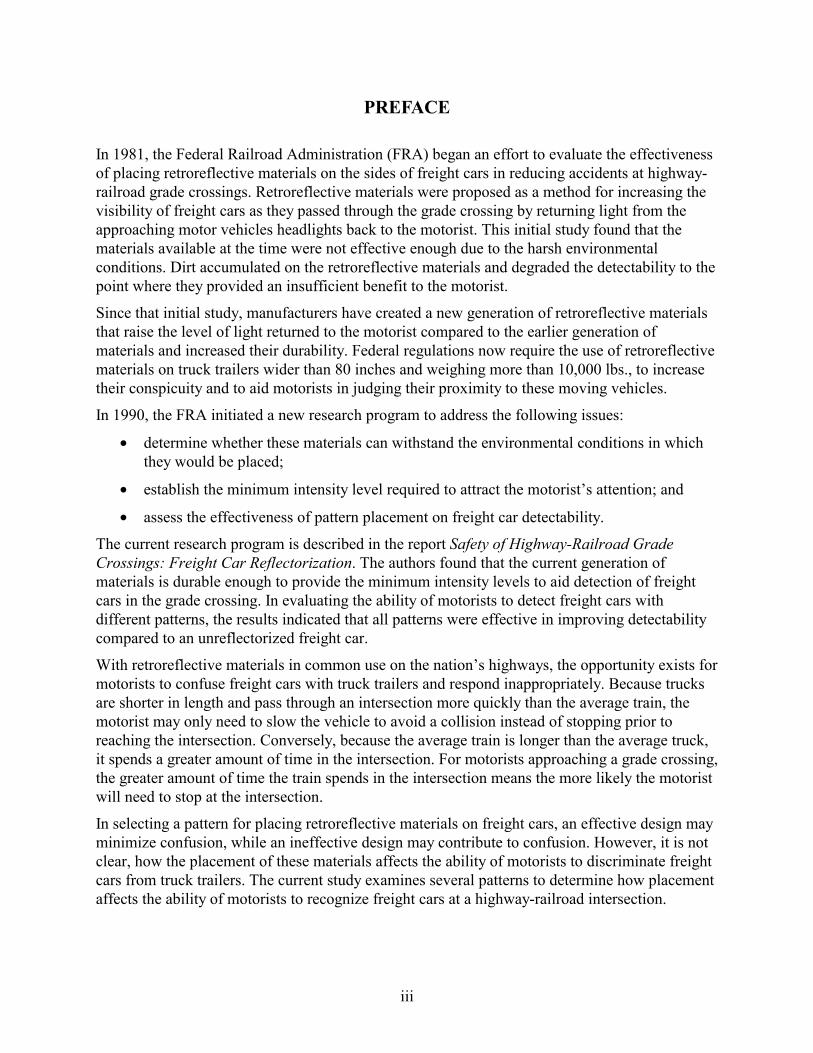
PREFACE
In 1981, the Federal Railroad Administration (FRA) began an effort to evaluate the effectivenessof placing retroreflective materials on the sides of freight cars in reducing accidents at highway-railroad grade crossings. Retroreflective materials were proposed as a method for increasing thevisibility of freight cars as they passed through the grade crossing by returning light from theapproaching motor vehicles headlights back to the motorist. This initial study found that thematerials available at the time were not effective enough due to the harsh environmentalconditions. Dirt accumulated on the retroreflective materials and degraded the detectability to thepoint where they provided an insufficient benefit to the motorist.
Since that initial study, manufacturers have created a new generation of retroreflective materialsthat raise the level of light returned to the motorist compared to the earlier generation ofmaterials and increased their durability. Federal regulations now require the use of retroreflectivematerials on truck trailers wider than 80 inches and weighing more than 10,000 lbs., to increasetheir conspicuity and to aid motorists in judging their proximity to these moving vehicles.
In 1990, the FRA initiated a new research program to address the following issues:
• determine whether these materials can withstand the environmental conditions in whichthey would be placed;
• establish the minimum intensity level required to attract the motorist’s attention; and
• assess the effectiveness of pattern placement on freight car detectability.
The current research program is described in the report Safety of Highway-Railroad GradeCrossings: Freight Car Reflectorization. The authors found that the current generation ofmaterials is durable enough to provide the minimum intensity levels to aid detection of freightcars in the grade crossing. In evaluating the ability of motorists to detect freight cars withdifferent patterns, the results indicated that all patterns were effective in improving detectabilitycompared to an unreflectorized freight car.
With retroreflective materials in common use on the nation’s highways, the opportunity exists formotorists to confuse freight cars with truck trailers and respond inappropriately. Because trucksare shorter in length and pass through an intersection more quickly than the average train, themotorist may only need to slow the vehicle to avoid a collision instead of stopping prior toreaching the intersection. Conversely, because the average train is longer than the average truck,it spends a greater amount of time in the intersection. For motorists approaching a grade crossing,the greater amount of time the train spends in the intersection means the more likely the motoristwill need to stop at the intersection.
In selecting a pattern for placing retroreflective materials on freight cars, an effective design mayminimize confusion, while an ineffective design may contribute to confusion. However, it is notclear, how the placement of these materials affects the ability of motorists to discriminate freightcars from truck trailers. The current study examines several patterns to determine how placementaffects the ability of motorists to recognize freight cars at a highway-railroad intersection.

iv
ACKNOWLEDGMENTS
This research was made possible by the efforts of many people. We would like to thank ourcolleagues, friends and families in supporting our efforts to make this research a success.
This report was sponsored by the Federal Railroad Administration’s Office of Research andDevelopment. We thank Claire Orth, Thomas G. Raslear, and Garold Thomas for their directionand help during this study.
We would like to thank Anya A. Carroll, principal investigator for Highway-Rail Grade CrossingSafety Research and Debra Williams Chappell for their expertise in helping to make thesimulation as realistic as possible and their helpful comments.
We are grateful to John Pollard for his technical wizardry in making all our equipment operateproperly.
Thanks go out to our MIT colleagues, Santanu Basu, Jay Einhorn, Steve Landry, HeliasMarinakos, Nicholas Malsch, Shinsuk Park, Jim Thompson and Steven Villareal who helped inmany ways to make the driving simulator what it is today.
Special thanks go to Robert DiSario, Amy Holton, and Sarah Miesher for applying their sharpanalytical talents to the preparation and analysis of the data.
We are appreciative of Dan Morin’s efforts to turn our crude drawings into clear, easy to readgraphics.
Finally, we are grateful to the many people who participated in this study, and whose supportmade this study possible.

v
TABLE OF CONTENTS
Section Page
EXECUTIVE SUMMARY...........................................................................................................vii
1. INTRODUCTION................................................................................................................... 1
1.1 Freight Cars are Hard to See .......................................................................................... 11.2 Reflectorization Can Increase Conspicuity ..................................................................... 11.3 Goal of Current Research ................................................................................................ 3
2. SIGNAL DETECTION EXPERIMENT................................................................................. 5
2.1 Method ............................................................................................................................ 52.1.1 Overview ..................................................................................................................... 52.1.2 Participants .................................................................................................................. 52.1.3 Experimental Design ................................................................................................... 52.1.4 Scenario Description ................................................................................................... 72.1.5 Apparatus .................................................................................................................. 102.1.6 Procedures ................................................................................................................. 10
2.2 Results and Discussion.................................................................................................. 102.2.1 Signal Detection Theory............................................................................................ 102.2.2 Sensitivity.................................................................................................................. 122.2.3 Response Bias ........................................................................................................... 152.2.4 Summary ................................................................................................................... 17
3. RECOGNITION DISTANCE EXPERIMENT..................................................................... 19
3.1 Method .......................................................................................................................... 193.1.1 Overview ................................................................................................................... 193.1.2 Participants ................................................................................................................ 193.1.3 Experimental Design ................................................................................................. 193.1.4 Scenario Description ................................................................................................. 203.1.5 Apparatus .................................................................................................................. 223.1.6 Procedures ................................................................................................................. 22
3.2 Results and Discussion.................................................................................................. 233.2.1 Recognition Distance ................................................................................................ 233.2.2 Recognition Errors .................................................................................................... 253.2.3 Summary ................................................................................................................... 26
4. SUMMARY AND CONCLUSIONS.................................................................................... 29
REFERENCES.............................................................................................................................. 31
APPENDIX — RESPONSE BIAS: B" VALUES FOR EACH PATTERN ................................ 33

vi
LIST OF FIGURES
Figure Page
1. Freight Car Retroreflective Patterns.......................................................................................... 62. Truck Retroreflective Patterns................................................................................................... 63. Plan View of the Basic Scenario ............................................................................................... 84. Vehicle Dimensions .................................................................................................................. 95. Forward Field of View for Stationary Observer........................................................................ 96. Four Outcomes of Signal Detection Theory............................................................................ 117. Graphical Depiction of Signal Detection Theory..................................................................... 118. Probability of Hits Versus False Alarms by Car Type Based on Confidence Ratings............ 139. A' for Pattern by Car Type and Environment Based upon Confidence Ratings...................... 1310. Observer’s Decision Tree........................................................................................................ 1611. B" Values for Each Pattern by Car Type and Environment ................................................... 1612. B" Values by Observer for Unreflectorized Conditions.......................................................... 1713. Simulator Course..................................................................................................................... 2114. Driver’s Forward Field of View.............................................................................................. 2215. Effect of Pattern on Recognition Distance .............................................................................. 24
LIST OF TABLES
Table Page
1. Experiment 1 Conditions............................................................................................................ 72. Probability of Hits and False Alarms for an Unreflectorized Freight Car by Environment and Car Type ............................................................................................................................ 143. Probability of False Alarms for an Unreflectorized Car by Environment and Signal Present ...................................................................................................................................... 144 . Experiment 2 Conditions.......................................................................................................... 195. Object Type Display Frequency ............................................................................................... 206. Pattern Grouped by Statistical Significance ............................................................................. 247. Recognition Errors by Object in Grade Crossing..................................................................... 26

vii
EXECUTIVE SUMMARY
The typical freight car presents a poor target at night and is difficult to detect by headlightillumination. The painted surface of the freight car is frequently dirty and painted in dark colors.Consequently, much of the light from the motor vehicle’s headlights is absorbed by the freightcar instead of being reflected back toward the motorist. Retroreflective materials have beenproposed as an aid to improve the visibility of freight cars. Retroreflective materials work byreturning the light from the headlights to the motorist. A similar problem with trucks wasaddressed in federal regulations (49 CFR Part 571.108) requiring the use of retroreflectivematerials.
As more roadway hazards benefit from the addition of reflectorization, the potential for motoristconfusion increases. The problem of recognition becomes more difficult in visually complex ornoisy environments. For example, an observer can easily detect a single flashing light in abackground of stationary lights. However, as the number of flashing lights in the backgroundincreases, detecting the target (flashing) light becomes harder. Current federal regulation requirestruckers to reflectorize their vehicles (49 CFR Part 571.108) if it is more than 80 inches wide andweighs more than 10,000 lbs.
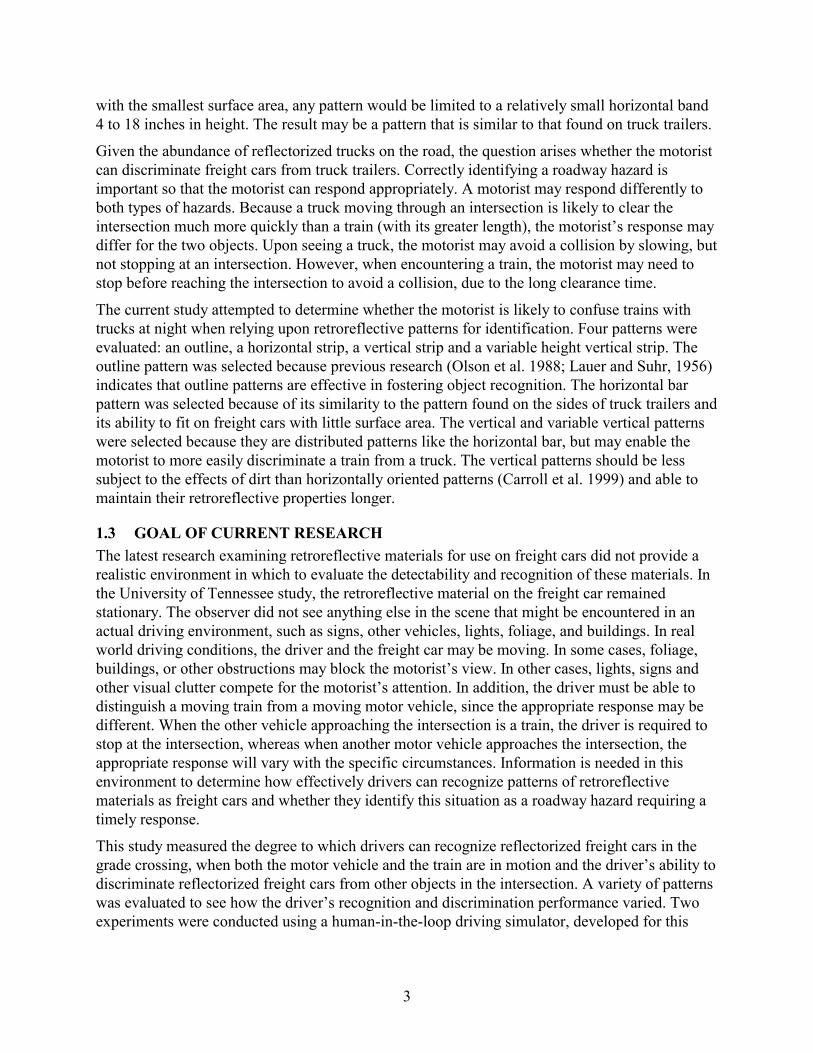
A standard marking design that could fit on all types of freight cars from flat cars to tank carswould facilitate freight car recognition. Olson and his colleagues (Olson et al, 1992) found that adesign that outlines the truck improves the driver’s recognition. However, the limited surfacearea of the flat car constrains the variety of patterns than can be constructed. As the freight carwith the smallest surface area, any pattern would be limited to relatively small horizontal band 4to 18 inches in height. The result may be a pattern that is similar to that found on truck trailers.
Given the abundance of reflectorized trucks on the road as well as on trains, the question ariseswhether the motorist can discriminate freight cars from a truck trailers. Correctly identifying aroadway hazard is important so that the motorist can respond appropriately.
The current study attempted to determine whether the motorist is likely to confuse trains withtrucks at night when relying upon retroreflective patterns for identification. Four patterns wereevaluated: an outline, a horizontal strip, a vertical strip and a variable height vertical strip. Thepatterns were placed on two types of freight cars, a hopper car and a flat car. The study measuredthe degree to which drivers recognized reflectorized freight cars in the grade crossing, when boththe motor vehicle and the train were in motion and the driver’s ability to discriminatereflectorized freight cars from other objects in the intersection.
In the first experiment, the observer remained stationary, at a fixed distance from the gradecrossing. The study used a signal detection paradigm to assess observers’ abilities to recognizetrains with four patterns in two background conditions. One background modeled a ruralenvironment where the amount of visual noise as indicated by the number of lights was relativelylow. The second background modeled an urban environment, where the amount of visual noise,as indicated by the number of lights, is higher. A series of trials were presented in which theobserver viewed a grade crossing for a brief duration and indicated whether there was a train inthe grade crossing. The experimenter measured the accuracy of the observer’s decisions and theconfidence of those decisions.

viii
In the second experiment, both the observer and the train were in motion. The observer drove asimulated passenger car along a route and encountered a variety of objects. These objectsincluded a train, truck, cars, traffic signals, and traffic signs. The observer was asked to report theobjects as soon as they were recognized. The experimenter measured the distance at which theobjects were recognized.
Signal Detection Experiment
The results of the current experiment uncovered no differences in discriminating between trainsand trucks as a function of pattern. Differences were found as a function of the environment andwere attributed to the participants greater difficulty in detecting unreflectorized freight cars in therural environment compared to the urban environment. The lack of differences between patternsmay have been due to visual cues in the environment that enabled participants to use context todiscriminate between trains and trucks.
Recognition Distance Experiment
Overall, participants were able to recognize all four patterns at far greater distances than theunreflectorized patterns. This was expected given the previous research (Ford et al. 1998; Olsonet al. 1992; Ziedman et al. 1981) showing the effectiveness of retroreflective materials in aidingdetectability. In general, participants recognized patterns on the hopper car farther away from thegrade crossing than the flat car. This result was attributed to the greater amount of material thatincreased the amount of light returning to the motorist and the larger visual angle associated withthose patterns.
While the average recognition distance for the flat car was lower than the hopper car, it may stillbe practical to use the smaller amount of material found in the flat car patterns. Field testsconducted on truck trailers (Olson et al. 1992) suggest these values may be a reasonableapproximation of the results from this laboratory study.
Among the four reflectorized patterns, recognition distance varied with car type. Whileperformance with the vertical bar, horizontal bar, and variable vertical bar was relativelyconsistent across car types, the outline showed a significant performance difference between thetwo car types. Performance suffered in the flat car condition, but it is not clear why. The outlinewas also one of two patterns in which participants made errors. Given the small vertical height ofthe typical flat car (between 4 and 18 inches), this car type makes displaying an outline shapedifficult.
In contrast to the outline pattern, the horizontal bar pattern showed better performance in the flatcar condition than in the hopper condition. This finding was unexpected. Since the horizontal barwas the pattern most similar to the truck patterns, participants were expected to take longer toidentify the freight car than for the other three patterns. However, the horizontal bar was the otherpattern for which participants made recognition errors. Although the number of errors wasstatistically insignificant, in every case, the train was confused with a truck. This confusion wasexpected given its similarity with the truck patterns. By contrast, the outline pattern was confusedwith both the truck and car.

ix
Summary and Conclusions
Taken together, the two experiments suggest that motorists can discriminate between freight carsand truck trailers for any of the four patterns tested here. In both experiments, performancedifferences between the four patterns were small. In the first experiment, differences in thepatterns were not statistically significant. In the second experiment, differences between thepatterns were found as a function of car type. While the performance of the vertical bar andvariable vertical bar was consistent across car type, the horizontal bar and outline varied by cartype. Recognition distance for the outline pattern was better with the hopper car than with the flatcar, while the opposite was true for the horizontal bar pattern. The horizontal bar pattern andoutline both exhibited a small number of recognition errors. Participants made no recognitionerrors with the other two patterns. The outline pattern was confused with both the truck and car,while the horizontal pattern was confused with the truck pattern only. Considering the twomeasures together (recognition distance and number of errors), performance is likely to be morevariable with the outline and horizontal bar patterns.
From a practical standpoint, the significance of these differences depends upon the stoppingdistance criterion selected. Assuming the recognition distance found in this study arerepresentative of real world performance, 85 percent of the driving population would recognizethe train for all four patterns in time to stop safely at 45 mph. At 55 mph, only three of the fourpatterns would provide adequate safety margin. The outline pattern would be unacceptable in thissituation. By contrast, the unreflectorized rail car would be significantly more difficult torecognize under these experimental conditions, at speeds above 25 mph.
In terms of confusing the freight cars with truck trailers, the likelihood of these confusions isquite small. However, using similar patterns that could be confused increase the probability of anaccident compared to the patterns that are not easily confused. Choosing a pattern that isdissimilar to the horizontally oriented patterns found on truck trailers will minimize theopportunity for these confusions. A vertically oriented pattern is preferable.
This study also demonstrated the importance of context in participants’ behavior. In the signaldetection experiment, unreflectorized freight cars were more difficult to recognize in the ruralenvironment than the urban environment due the lower illumination levels. The use ofretroreflective materials eliminated this difficulty. This performance improvement did not varywith the type of pattern. For both car types, participants were able to discriminate between trainsand trucks.
The findings from this study are summarized in bullet form below:
• Participants discriminated between freight cars and truck trailers for all of the fourpatterns evaluated.
• Vertically oriented patterns were recommended over outline and horizontally orientedpatterns because they were less likely to be confused with the horizontally oriented truckpatterns.
• Unreflectorized rail cars were more difficult to discriminate from trucks as illuminationlevel declines.

x

1
1. INTRODUCTION
1.1 FREIGHT CARS ARE HARD TO SEEOne category of nighttime accidents at highway-railroad grade crossings takes place when themotor vehicle hits the train as it passes through the crossing. Many of these accidents take placeat passively protected crossings where the motorist receives no information from warning devicesat the crossing whether a train is approaching. Most crossings have only a crossbuck to warn of ahazardous intersection. The crossbuck indicates the presence of the grade crossing intersection. Itdoes not alert the motorist when a train approaches or is in the grade crossing.
Passive crossings typically are located in rural areas where the accident exposure, as measured bythe amount of highway traffic and train traffic, is low. These crossings frequently provide noillumination. Combined with the low ambient light levels in rural areas at night, the driver mustrely upon his headlights to illuminate and detect the train.
However, the typical freight car presents a poor target at night and is difficult to detect byheadlight illumination. The painted surface of the freight car is frequently dirty and painted indark colors. Consequently, much of the light from the motor vehicle’s headlights is absorbed bythe freight car, instead of being reflected back toward the motorist. Generally, the dirtaccumulation is greatest near the ground and decreases the higher the surface is above the ground(Carroll, Multer, Williams, and Yaffee, 1999). The fact that much of the surface of the freight caris above the mounting height of the headlamps decreases the likelihood of detection with lowbeam illumination (Appendix H in Carroll, Multer, Williams, and Yaffee, 1999).
Retroreflective materials have been proposed as an aid to improve the visibility of freight cars.Retroreflective materials work by returning the light from the headlights to the motorist. Asimilar problem with trucks was addressed with the use of retroreflective materials. Currentregulations require trucks to place retroreflective materials on their rear and sides (49 CFR Part571.108, 1996). Current generations of materials are more effective in terms of durability anddetectability than previous generations.
1.2 REFLECTORIZATION CAN INCREASE CONSPICUITYA body of research suggests that retroreflective materials can increase the conspicuity of objectsto which they are attached (Lauer and Suhr, 1956; McGinnis, 1975; Olson, 1988; Olson et al.1992; Stalder and Lauer, 1965). However, previous generations of retroreflective materialsreflected less light and lacked the durability to survive the harsh environment to which freightcars are regularly exposed (Poage, Pomfret, and Hopkins, 1982; Carroll, Multer, Williams, andYaffee; 1999). The prismatic (cube corner) retroreflective markings currently available overcomethese limitations.
Little research suggests how retroreflective materials should be displayed on the freight cars tomaximize freight car conspicuity for the approaching motorist. Studies devoted exclusively to theproblem of displaying retroreflective markings on freight cars were performed with the previousgeneration of retroreflective materials (enclosed lens or encapsulated lens). Lauer and Suhr(1956) tested four different configurations using the same amount of material for each pattern.They discovered that the massed applications (concentrating the material in one or two locations)were more effective than applications that were distributed over a wider area. By contrast, studies

2
assessing the effectiveness of retroreflective markings on trucks, (Olson, 1992; Ziedman et al.1981) using the prismatic materials available today, concluded that providing a design thatoutlined the shape of the vehicle increased conspicuity. The recommendation to use an outlineshape was based in part on the need to estimate closing distance when following behind a truck.However, the motorists interaction with trains is different from trucks. Their task is to detectwhether a train is in the grade crossing in time to stop.
While much of the research investigating the effectiveness of retroreflective markings for trucksare relevant to freight cars, there is a lack of knowledge about the optimal design of freight carretroreflective markings. The primary concern here is with developing a retroreflective markingdesign that is detectable in time for the motorist to recognize a train in the grade crossing andrespond in time to avoid an accident.
The FRA recently supported research examining the effectiveness of the latest generation ofretroreflective materials. In this effort, the Volpe Center looked at the durability of the newestretroreflective materials to withstand the harsh environment in which these materials would beplaced (Carroll, Multer, Williams, and Yaffee, 1999). As part of this research, the Volpe Centersponsored a study, performed by the University of Tennessee, to measure the detectability ofseveral patterns and colors of retroreflective materials on freight cars (Ford, Richards, andHungerford 1998). In this evaluation, participants viewed static images of freight cars, with andwithout reflectorization. This study examined the detectability of three retroreflective patterns inthree color combinations for a total of nine designs and found that even the poorest design wasconsiderably better than an unreflectorized car. The average detection distance was 160 feet forthe unreflectorized car compared to 1245 feet for the worst of the reflectorized patterns. Theseresults were consistent with the findings of Ziedman et al. (1981) and Olson et al. (1992)showing that adding retroreflective materials to roadway hazards significantly increases theirconspicuity.
As more roadway hazards benefit from the addition of reflectorization, the potential for motoristconfusion increases. The problem of recognition becomes more difficult in visually complex ornoisy environments. For example, an observer can easily detect a single flashing light in abackground of stationary lights. However, as the number of flashing lights in the backgroundincreases, detecting the target (flashing) light becomes harder. Current federal regulation requirestruckers to reflectorize their vehicles (49 CFR Part 571.108). The regulation requires the use of astrip (2 to 4 inches or 50 to 100 mm wide) in alternating colors (red and white) and covering atleast 50 percent of the length of the trailer. The colors red and white were selected for severalreasons (Olson, 1988). White returns the greatest amount of light to the driver compared to othercolors, while red has a long association with danger. The use of two contrasting colors increasesinternal contrast and contributes to conspicuity during the daytime, as well as night. Thecombination of red and white is frequently used in the driving environment (i.e., stop signs, gatesat highway-railroad grade crossing) to identify hazards. The logic behind the use of red and whiteretroreflective markings for trucks applies equally well to the development of a retroreflectivemarking for freight cars.
A standard marking design that could fit on all types of freight cars from flat cars to tank carswould facilitate freight car recognition. Olson and his colleagues found that a design that outlinesthe vehicle improves the driver’s recognition of the object. However, the limited surface area ofthe railroad flat car constrains the variety of patterns than can be constructed. As the car type
3
with the smallest surface area, any pattern would be limited to a relatively small horizontal band4 to 18 inches in height. The result may be a pattern that is similar to that found on truck trailers.
Given the abundance of reflectorized trucks on the road, the question arises whether the motoristcan discriminate freight cars from truck trailers. Correctly identifying a roadway hazard isimportant so that the motorist can respond appropriately. A motorist may respond differently toboth types of hazards. Because a truck moving through an intersection is likely to clear theintersection much more quickly than a train (with its greater length), the motorist’s response maydiffer for the two objects. Upon seeing a truck, the motorist may avoid a collision by slowing, butnot stopping at an intersection. However, when encountering a train, the motorist may need tostop before reaching the intersection to avoid a collision, due to the long clearance time.
The current study attempted to determine whether the motorist is likely to confuse trains withtrucks at night when relying upon retroreflective patterns for identification. Four patterns wereevaluated: an outline, a horizontal strip, a vertical strip and a variable height vertical strip. Theoutline pattern was selected because previous research (Olson et al. 1988; Lauer and Suhr, 1956)indicates that outline patterns are effective in fostering object recognition. The horizontal barpattern was selected because of its similarity to the pattern found on the sides of truck trailers andits ability to fit on freight cars with little surface area. The vertical and variable vertical patternswere selected because they are distributed patterns like the horizontal bar, but may enable themotorist to more easily discriminate a train from a truck. The vertical patterns should be lesssubject to the effects of dirt than horizontally oriented patterns (Carroll et al. 1999) and able tomaintain their retroreflective properties longer.
1.3 GOAL OF CURRENT RESEARCHThe latest research examining retroreflective materials for use on freight cars did not provide arealistic environment in which to evaluate the detectability and recognition of these materials. Inthe University of Tennessee study, the retroreflective material on the freight car remainedstationary. The observer did not see anything else in the scene that might be encountered in anactual driving environment, such as signs, other vehicles, lights, foliage, and buildings. In realworld driving conditions, the driver and the freight car may be moving. In some cases, foliage,buildings, or other obstructions may block the motorist’s view. In other cases, lights, signs andother visual clutter compete for the motorist’s attention. In addition, the driver must be able todistinguish a moving train from a moving motor vehicle, since the appropriate response may bedifferent. When the other vehicle approaching the intersection is a train, the driver is required tostop at the intersection, whereas when another motor vehicle approaches the intersection, theappropriate response will vary with the specific circumstances. Information is needed in thisenvironment to determine how effectively drivers can recognize patterns of retroreflectivematerials as freight cars and whether they identify this situation as a roadway hazard requiring atimely response.
This study measured the degree to which drivers can recognize reflectorized freight cars in thegrade crossing, when both the motor vehicle and the train are in motion and the driver’s ability todiscriminate reflectorized freight cars from other objects in the intersection. A variety of patternswas evaluated to see how the driver’s recognition and discrimination performance varied. Twoexperiments were conducted using a human-in-the-loop driving simulator, developed for this

4
purpose at the Volpe Center. Four patterns were evaluated against an unreflectorized freight car.The patterns were placed on two types of freight cars, a hopper car and a flat car.
In the first experiment, the observer remained stationary, at a fixed distance from the gradecrossing. The study used a signal detection paradigm to assess the observer’s abilities torecognize trains with four patterns in two background conditions. A series of trials werepresented in which the observer viewed a grade crossing for a brief duration and indicatedwhether there was a train in the grade crossing. The experimenter measured the accuracy of theobserver’s decisions and the confidence of those decisions.
In the second experiment, both the observer and the train were in motion. The observer drove asimulated passenger car along a route and encountered a variety of objects. These objectsincluded a train, truck, cars, traffic signals, and traffic signs. The observer was asked to report theobjects as soon as they were recognized. The experimenter measured the distance at which theobjects were recognized.
The two experiments will be discussed separately in Sections 2 and 3. Then, the results of bothexperiments will be summarized in Section 4.
5
2. SIGNAL DETECTION EXPERIMENT
2.1 METHOD
2.1.1 OverviewParticipants viewed briefly a series of scenes each containing the same intersection. Eachintersection consisted of a roadway and a railroad track parallel to each other and locatedperpendicular to the roadway where the participant was positioned. A vehicle could cross theintersection perpendicular to the participant. The participant’s task was to identify what was inthe intersection: a train, a truck or nothing.
2.1.2 ParticipantsEleven licensed drivers were recruited from the Massachusetts Institute of Technology (MIT) andthe Volpe Center. All participants possessed visual acuity of 20/30 or better as measured by theSnellen visual acuity test. Some participants’ vision was corrected with eyeglasses. Seven of theparticipants were women and four were men. The participants ranged in age from 20 to 47 with amean age of 26. Participants recruited from MIT were paid $10.00 per hour while employees ofthe Volpe Center participated as a part of their work duties.
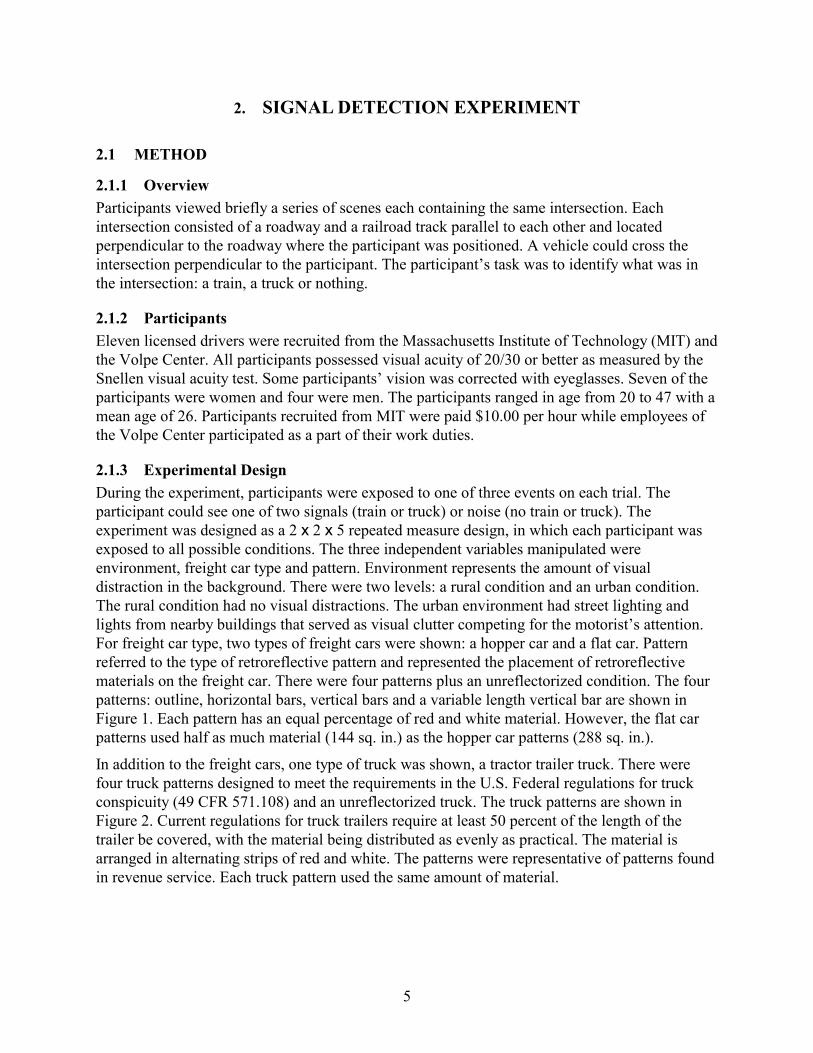
2.1.3 Experimental DesignDuring the experiment, participants were exposed to one of three events on each trial. Theparticipant could see one of two signals (train or truck) or noise (no train or truck). Theexperiment was designed as a 2 x 2 x 5 repeated measure design, in which each participant wasexposed to all possible conditions. The three independent variables manipulated wereenvironment, freight car type and pattern. Environment represents the amount of visualdistraction in the background. There were two levels: a rural condition and an urban condition.The rural condition had no visual distractions. The urban environment had street lighting andlights from nearby buildings that served as visual clutter competing for the motorist’s attention.For freight car type, two types of freight cars were shown: a hopper car and a flat car. Patternreferred to the type of retroreflective pattern and represented the placement of retroreflectivematerials on the freight car. There were four patterns plus an unreflectorized condition. The fourpatterns: outline, horizontal bars, vertical bars and a variable length vertical bar are shown inFigure 1. Each pattern has an equal percentage of red and white material. However, the flat carpatterns used half as much material (144 sq. in.) as the hopper car patterns (288 sq. in.).
In addition to the freight cars, one type of truck was shown, a tractor trailer truck. There werefour truck patterns designed to meet the requirements in the U.S. Federal regulations for truckconspicuity (49 CFR 571.108) and an unreflectorized truck. The truck patterns are shown inFigure 2. Current regulations for truck trailers require at least 50 percent of the length of thetrailer be covered, with the material being distributed as evenly as practical. The material isarranged in alternating strips of red and white. The patterns were representative of patterns foundin revenue service. Each truck pattern used the same amount of material.
6
Figure 1. Freight Car Retroreflective Patterns
Figure 2. Truck Retroreflective Patterns

7
Table 1 shows the 20 conditions in which a freight car signal was present. In addition to thefreight car signal, there were conditions in which a truck signal was present and conditions inwhich no signal was present. Each participant was exposed to the three event types (train, truck,or nothing) equally. On any given trial, the participant had a 33 percent chance of receiving aparticular event. To calculate the number of false alarms, trials were blocked by train condition(environment x freight-car type x pattern). False alarms occurred when the participant said asignal was present (i.e., a train is present) when in fact it was not present. The trials were blockedtogether to associate false alarms with the appropriate train signal condition (i.e., an outlinepattern on a flat car in the urban environment). Within a block of trials, participants’ saw eachevent (train, truck or nothing) 20 times for a total of 60 trials. The order in which the blocks wereadministered was randomized between subjects.
Table 1. Experiment 1 Conditions
Environment Freight car Pattern
OutlineHorizontal Bar
Flat Vertical BarVariable Length Vertical BarNoneOutlineHorizontal Bar
Hopper Vertical BarVariable Length Vertical Bar
Rural
NoneOutlineHorizontal Bar
Flat Vertical BarVariable Length Vertical BarNoneOutlineHorizontal Bar
Hopper Vertical BarVariable Length Vertical Bar
Urban
None
Performance was measured by recording hits, false alarms and confidence estimates of theparticipants on each trial. The meaning of the terms hits and false alarms is described in thesection on signal detection theory that begins on page 10. The confidence estimates were used toconstruct receiver operator curves (ROC) showing the relationship between hits and false alarmsfor each condition.
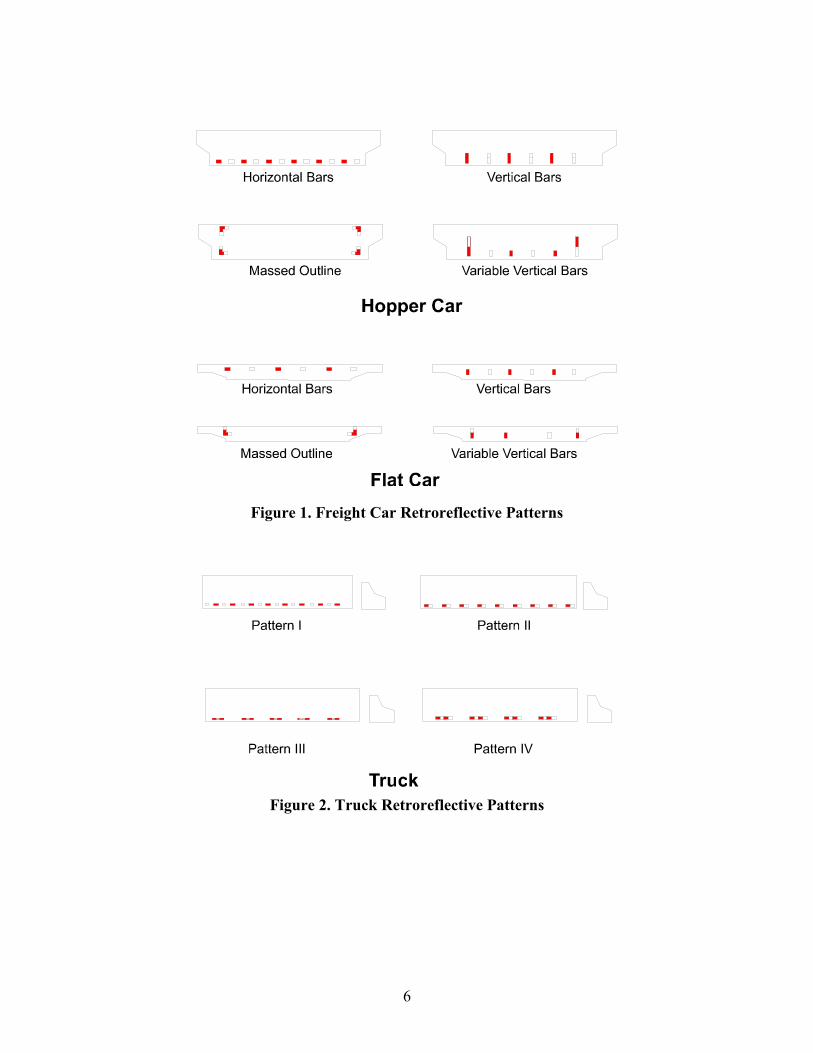
2.1.4 Scenario DescriptionThe basic scenario showed a single two-lane road intersecting a single railroad track and adjacenttwo-lane road at a 90-degree angle as shown in Figure 3. The grade crossing intersection was
8
located approximately 500 feet from the position where the participant began the scenario.Obstructions blocked the view on either side of the roadway. The participant was only able to seethe two lanes of the roadway directly ahead. A moving vehicle consisting of either a group of thesame type of freight cars or a series of trucks passed through the intersection, in front of theparticipant. The dimensions of the two freight cars and the truck were modeled after vehiclesfound operating in revenue service. Figure 4 shows the horizontal and vertical dimensions of allthree vehicles. The crossbuck sign normally found on either side of the road at the grade crossingwas omitted to prevent the participant from using the sign as a cue to identify the object. In theurban scenario, stationary lights were visible and competed with the moving objects for theparticipant’s attention as shown in Figure 5. The rural scenario lacked these lights, but otherwisewas identical to the urban scene.
Figure 3. Plan View of the Basic Scenario

9
Figure 4. Vehicle Dimensions
Figure 5. Forward Field of View for Stationary Observer
10
2.1.5 ApparatusThe visual scenes were created on a Silicon Graphics Indigo 2 workstation and displayed using aBarco 808S projector on a 6' x 8' screen. The participant sat 15 feet away from the display screen.
2.1.6 ProceduresFor each participant, the experiment took place in two 1 1/2 hour sessions over 2 days. At least15 minutes prior to beginning the experimental task, the overhead lights were turned off so theparticipant’s eyes were dark-adapted for nighttime driving conditions. The participant received10 practice trials to become familiar with each of the objects. The trials were broken up into 20blocks of 60 trials. After completing each block, the participant received a 30-second rest beforebeginning the next block. The participant received a 5-minute break approximately every 30minutes.
The participant sat in front of a projection screen showing a blank screen. Each trial began withthe display of a fixation point that lasted 1 second. The purpose of the fixation point was to directall participants’ attention to the same area of the intersection. The intersection was displayed for500 milliseconds during which time a train or truck may pass through the intersection. At thecompletion of the 500-millisecond interval, a response screen displayed one of four options:hopper car, flat car, truck, or nothing. The participant selected could take as much time as neededto select the appropriate response. The participant selected the appropriate response with a mouseto highlight the appropriate option and pressing the mouse button. If the participant selected“nothing,” a dimmed button labeled “next” was highlighted. Selecting the “next” button initiatedthe next trial. If the participant selected any of the other options, a different screen appeared. Thenew screen displayed a five-point rating scale for indicating the confidence of their decision. Theparticipant responded by selecting the appropriate number and pressing the mouse button. Afterresponding, the “next” button was highlighted. The participant selected the “next” button tobegin the next trial. In each of the two experimental sessions, the participant repeated thisprocedure until 600 trials were completed for a total of 1200 trials.
2.2 RESULTS AND DISCUSSION
2.2.1 Signal Detection TheoryIn this experiment, participants were shown a series of scenes. The participants’ task was todecide whether they saw a train, a truck, or nothing. Signal detection theory was used to measurethe participant’s ability to discriminate trains from trucks. In signal detection theory, detection isa function of two processes: the observer’s perceptual sensitivity and response bias. This theoryenables separation of the effects of perceptual sensitivity, in this case, the observer’s ability todiscriminate trains from trucks, from response bias. Response bias represents the observer’swillingness to say “yes” or “no.” Does the observer adopt a conservative strategy or a liberalstrategy? In this experiment, the concern is with the observer’s discrimination.
In a signal detection experiment, events can be categorized in a 2 x 2 matrix showing the eventthat occurred and the observer’s response to that event. Figure 6 shows the four possiblecategories. A hit occurs when a signal is present and the observer reports that the signal ispresent. A false alarm occurs when a signal is absent and the observer reports that the signal is

11
present. A miss occurs when a signal is present and the observer reports that the signal is absent.A correct rejection occurs when a signal is absent and the observer reports that the signal isabsent.
State of the World
Signal Noise
Yes Hit False alarmObserver’s
ResponseNo Miss Correct
rejection
Figure 6. Four Outcomes of Signal Detection Theory
Figure 7 shows how signal detection theory characterizes the relationship between the observer’sresponse for two hypothetical distributions. The distribution on the right represents theprobability that “train” signal occurred. The distribution on the left represents a probability thatthe noise distribution occurred. In this experiment, this distribution is either a truck or “nothing.”The observer’s ability to discriminate trains from truck (sensitivity) is reflected by the amount ofoverlap in the two distributions. Sensitivity increases as the amount of overlap in the twodistribution decreases. Response bias is represented by the vertical line showing the criterionselected by the observer to say “yes” or “no.” When the value of the event is to the right of thecriterion, the observer will say “yes.” When the value of the event is to the left of the criterion,the observer will say “no.” Moving the criterion to the left increases the likelihood that theobserver will say “yes,” while moving the criterion to the right increases the likelihood that theobserver will say “no.”
Figure 7. Graphical Depiction of Signal Detection Theory

12
To evaluate participants’ ability to discriminate trains from trucks the number of hits and falsealarms were recorded. As shown in Figure 7, the two distributions can be characterized fromknowledge of the number of hits and false alarms. This relationship is frequently describedgraphically by an ROC curve. This curve shows the relationship between probability of hits andthe probability of false alarms for different levels of response bias. To calculate ROC curves foreach pattern by type of freight car and environment, the confidence level of each participant’sdecision was also recorded on a five-point scale. Figure 8 shows the ROC curves for each patternby type of freight car and environment. The vertical axis shows the probability of hits and thehorizontal axis shows the probability of false alarms. Sensitivity increases as points on the curvemove from the lower right-hand corner to the upper left-hand corner of the chart. Sensitivity ismeasured typically by an index called d' and response bias is measured by an index called beta(β). D prime (d') corresponds to the separation of the mean of two distributions expressed in unitsof their standard deviations as shown in Figure 7. The response critierion, beta is measured by theratio of the probability of saying “yes” when the signal is present to the probability of saying“yes” when only noise is present. For the reader interested in learning more about signaldetection theory, refer to books by Green and Swets (1988) or Egan (1975).
In this experiment an alternative measure A prime (A') was used rather than d'. D prime cannotbe calculated if either hits or false alarms equal 100 percent, as was the case for severalconditions. Therefore, a nonparametric measure of sensitivity, A prime (A'), was used (Grier,1971) instead. A' measures the area under the ROC for the measured data point. Beta correspondsto the ratio of hits to false alarms for a given event state. In Figure 7, the value of beta isrepresented by the ratio of hits to false alarms where the vertical line intersects the horizontalaxis. To determine statistical significance, analysis of variance (ANOVA) and Student-Newman-Keuls multiple comparison tests were performed on the percent correct for hits (PCh) in eachcondition.
2.2.2 SensitivityTo compare the four reflectorized patterns and one unreflectorized pattern, the data wereanalyzed by environment and car type. For each of the environment-by-car-type conditions, asimilar pattern emerged. Participants showed a high level of sensitivity across all levels ofresponse bias for all reflectorized patterns as shown in Figure 8. For all four of the reflectorizedpatterns, the probability of detecting the signal when it was present was over 85 percent or higheracross all false alarms probabilities. By contrast, for the unreflectorized freight car in eachcondition, participants exhibited a guessing strategy. The probability of hits and false alarmswere approximately equal across all levels of response bias.
A similar picture emerged from an analysis of A'. Figure 9 shows A' values for each pattern byenvironment and car type. A' has a range from zero to one where zero represents an inability todetect and one represent perfect detection. For all conditions, discrimination was better when thepatterns were reflectorized than when they were not. The ANOVA for PCh indicates there was astatistically significant main effect for pattern, F (1,40) = 21.0, p = .0001. Student-Newman-Keuls multiple comparison tests indicate that the differences are attributed to the much lowersensitivity of the unreflectorized car compared to all the reflectorized cars (CRt (5, 40 = .051, p,< .05). However, the differences among the four reflectorized patterns were not statisticallysignificant. No one pattern was better than another in supporting rail car detection. This situation

13
0
0.2
0.4
0.6
0.8
1
0 0.2 0.4 0.6 0.8 1
P (Fa lse Alarm )
P (H
it)
Outline
Vertical
Var. Vertical
Horizontal
No Reflec tors
Figure 8. Probability of Hits Versus False Alarms by Car Type Based on ConfidenceRatings
0
0.2
0.4
0.6
0.8
1
Outline Vertical Variable Vertical Horizontal No Reflectors
Pattern by Car Type & Environment
A'
Rural Hopper
Rural Flat Car
Urban Hopper
Urban Flat Car
Figure 9. A' for Pattern by Car Type and Environment Based uponConfidence Ratings

14
applied for both types of freight cars. While there was no statistically significant effect for freightcars, there was a statistically significant effect as measured by PCh, for environment, F (1,40) =23.85, p = 0.0006. There was also a statistically significant interaction as measured by PCh,between pattern and environment, F (4,40) = 5.58, p = 0.0012. Participants correctly identifiedtrains at a higher rate in the urban condition (92 percent) than in the rural condition (85 percent).
The differences between the urban and rural environment as well as the interactions betweenpattern and environment can be attributed to the performance differences in the unreflectorizedcars for the two environments. Table 2 shows the probability of hits and false alarms forunreflectorized cars by environment and car type. For both car types, the probability of hits in theurban condition are greater than in the rural condition while the opposite is true for false alarms.The task appears more difficult in the rural condition than in the urban condition. Table 3showing false alarms by the type of signal present (truck or nothing), also illustrates the greaterdifficulty of the rural condition. The probability of false alarms occurring when the signal is atruck is almost the same in the rural condition. The equal distribution of false alarms suggestsparticipants are guessing. In the urban condition, the number of false alarms is greater when thesignal is a truck than when nothing is present.
Table 2. Probability of Hits and False Alarms for anUnreflectorized Freight Car by Environment and Car Type
P(Hits) P(False Alarms)Car Type Rural Urban Rural UrbanHopper .58 .70 .16 .08Flat .40 .70 .17 .09
Table 3. Probability of False Alarms for anUnreflectorized Car by Environment andSignal Present
Rural UrbanTruck Nothing Truck Nothing
Hopper .18 .17 .14 .03Flat Car .17 .18 .17 .02
The urban environment differed from the rural environment by exhibiting street lighting andlighting from surrounding buildings. These lights raised the illumination level near the gradecrossing making it easier to detect the freight cars. Additionally, the illumination levels of bothcar types in the urban environment were somewhat higher than in the rural environment.
In discriminating trains from trucks, the unreflectorized rail car posed great difficulty for theparticipants. For different levels of hits and false alarms, participants were equally likely to saythey saw a train when it was there or not. The linear relationship between hits and false alarmsindicates chance performance. This means that the signal cannot be discriminated from noise.
By contrast, the higher A' values for the reflectorized patterns compared to the unreflectorizedcars, suggest that participants had little difficulty discriminating trains from trucks. This finding

15
was particularly surprising for the horizontal pattern, which because of its similarity with thehorizontal patterns on the truck was expected to make discrimination more difficult than with theother patterns.
One reason this finding occurred may lay in the visual cues that enabled the participant todiscriminate trains from trucks independent of the pattern. Streetlights, consisting of verticalpoles with lights mounted on the top as shown in Figure 5, may have enabled the participant touse shape cues to discriminate between objects. As the reflectorized pattern crossed theintersection, different portions of the streetlights may have been obscured. For example, thesmaller vertical height of the flat car would have obscured a smaller portion of the street lampsthan the truck.
A second possibility in explaining the outcome of this experiment is that the patterns,themselves, enabled the participants to discriminate the train from the truck.
2.2.3 Response BiasIn addition to examining the participants’ ability to discriminate trains from trucks based ondifferent patterns, signal detection theory enables us to examine participants’ response strategiesin completing the task. One such strategy is presented graphically in Figure 10. The participant’stask was to select among three options. The small number of options limited the participants’expectations about what they would see. This knowledge may have enabled them to approach thetask by making two paired comparisons. In the first comparison, the participant decided whetheran object was present in the intersection or absent. If the participant believed no object waspresent, the participant selected nothing. If an object was detected, then the participant made asecond comparison between the train and the truck. For each decision, the participant had a 50percent chance of correctly guessing what appeared on each trial.
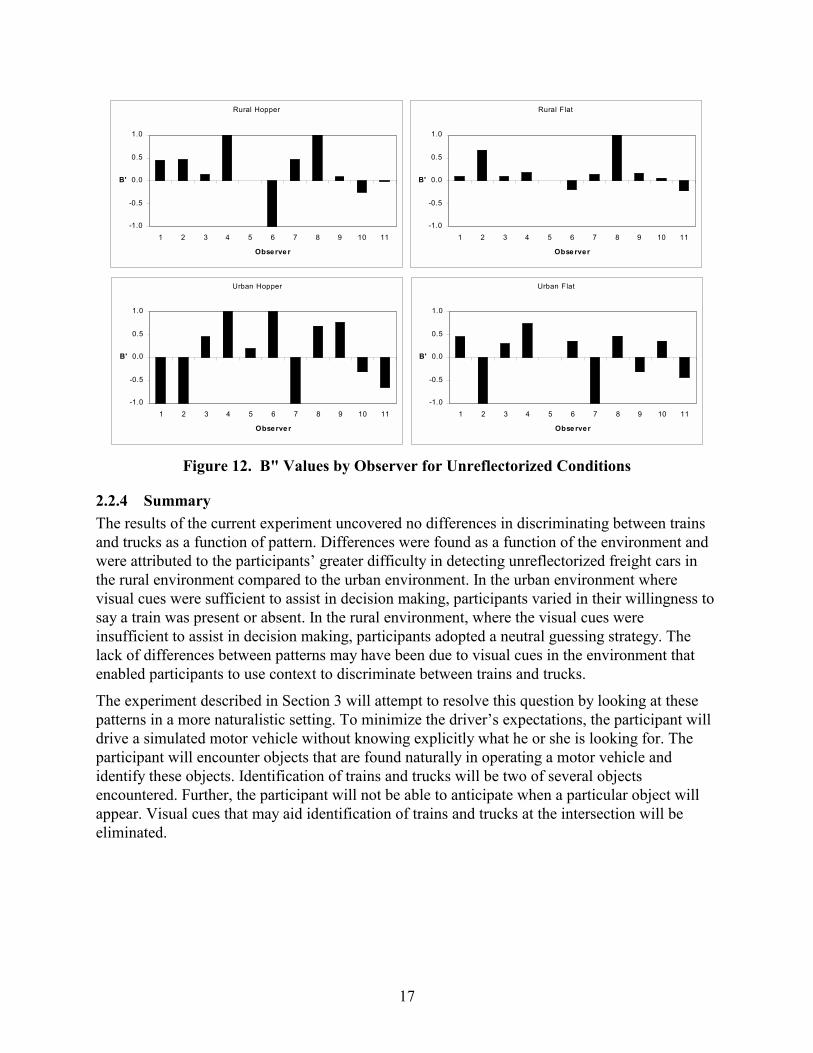
Figure 11 shows response bias as measured by B" for each of the patterns. B" values range from–1 to +1. Negative values represent a willingness to say, “The object is a train.” Positive valuesrepresent a willingness to say, “The object is not a train.” A B" value of 0 indicates no bias; theparticipant is equally willing to say the train is present or absent. For each of the reflectorizedpatterns, participants exhibited a strong bias to say the train was present. Appendix A shows theB" values for each pattern by subject. For all four reflectorized patterns, the B" values rangedbetween –0.8 and –1.0, with one exception. In the urban hopper condition, several participantsexhibited B" values around –0.5. One participant exhibited a B" value of +0.5. The four patternsshowed no consistent trends in the β' values by environment and car type condition.
By contrast, for each unreflectorized pattern, participants exhibited a moderate bias to say thetrain was absent. Figure 12 shows the B" values for each of the unreflectorized conditions. Here,B" values ranged between -1.0 and +1.0. An examination of individual participant’s B" valuesshowed wide variability in willingness to report the train as present or absent in theunreflectorized conditions. Particularly in the urban condition, approximately 50 percent ofparticipants were more willing to say the train was present, while the other 50 percent were morewilling to say the train was absent. Given the greater difficulty in detecting the unreflectorizedfreight cars, this strategy seems reasonable. For the unreflectorized car, the greater willingness ofparticipants to say the train was absent compared to the reflectorized cars, reflects the greaterdifficulty of the detection task. This negative response bias was smaller in the rural condition

16
than in the urban condition, where the detection task was more difficult. Thus, as thediscrimination task became more difficult, participants appeared to adopt a more neutral responsebias.
Observer's Decision Tree
See Nothing
Train Truck
See Object
Trial Event
Figure 10. Observer’s Decision Tree
-1.200
-1.000
-0.800
-0.600
-0.400
-0.200
0.000
0.200
0.400
0.600
Rural Hopper Rural Flat Car Urban Hopper Urban Flat Car
B Prime
OutlineVerticalVariable VerticalHorizontalNo Reflector
Figure 11. B" Values for Each Pattern by Car Type and Environment
17
2.2.4 SummaryThe results of the current experiment uncovered no differences in discriminating between trainsand trucks as a function of pattern. Differences were found as a function of the environment andwere attributed to the participants’ greater difficulty in detecting unreflectorized freight cars inthe rural environment compared to the urban environment. In the urban environment wherevisual cues were sufficient to assist in decision making, participants varied in their willingness tosay a train was present or absent. In the rural environment, where the visual cues wereinsufficient to assist in decision making, participants adopted a neutral guessing strategy. Thelack of differences between patterns may have been due to visual cues in the environment thatenabled participants to use context to discriminate between trains and trucks.
The experiment described in Section 3 will attempt to resolve this question by looking at thesepatterns in a more naturalistic setting. To minimize the driver’s expectations, the participant willdrive a simulated motor vehicle without knowing explicitly what he or she is looking for. Theparticipant will encounter objects that are found naturally in operating a motor vehicle andidentify these objects. Identification of trains and trucks will be two of several objectsencountered. Further, the participant will not be able to anticipate when a particular object willappear. Visual cues that may aid identification of trains and trucks at the intersection will beeliminated.
Rural Hopper
-1.0
-0.5
0.0
0.5
1.0
1 2 3 4 5 6 7 8 9 10 11
Observe r
B'
Rural Flat
-1.0
-0.5
0.0
0.5
1.0
1 2 3 4 5 6 7 8 9 10 11
Obse rver
B'
Urban Hopper
-1.0
-0.5
0.0
0.5
1.0
1 2 3 4 5 6 7 8 9 10 11
Observe r
B'
Urban Flat
-1.0
-0.5
0.0
0.5
1.0
1 2 3 4 5 6 7 8 9 10 11
Obse rver
B'
Figure 12. B" Values by Observer for Unreflectorized Conditions

18
19
3. RECOGNITION DISTANCE EXPERIMENT3.1 METHOD
3.1.1 OverviewExperiment 2 explored the relationship between recognition and retroreflective pattern in anenvironment more like that found in actual driving conditions. The same retroreflective patternsin experiment 1 were evaluated here. Using a low fidelity human-in-the-loop simulator,participants drove a simulated passenger car on a course containing a series of roadwayintersections and highway-railroad grade crossings. The course also contained objects normallyfound in the highway-driving environment. These objects included traffic signs, traffic lights,trains, and motor vehicles. The participant’s task was to drive the simulated passenger car andidentify each object observed.
3.1.2 ParticipantsTwenty-two licensed drivers were recruited from MIT and the Volpe Center. All participantspossessed visual acuity of 20/40 or better, as measured by the Snellen visual acuity test. Someparticipants’ vision was corrected with eyeglasses. Eight of the participants were women and 14were men. The participants ranged in age from 18 to 60 with a mean age of 37. Participantsrecruited from MIT were paid $10.00 per hour while employees of the Volpe Center participatedas a part of their work duties.
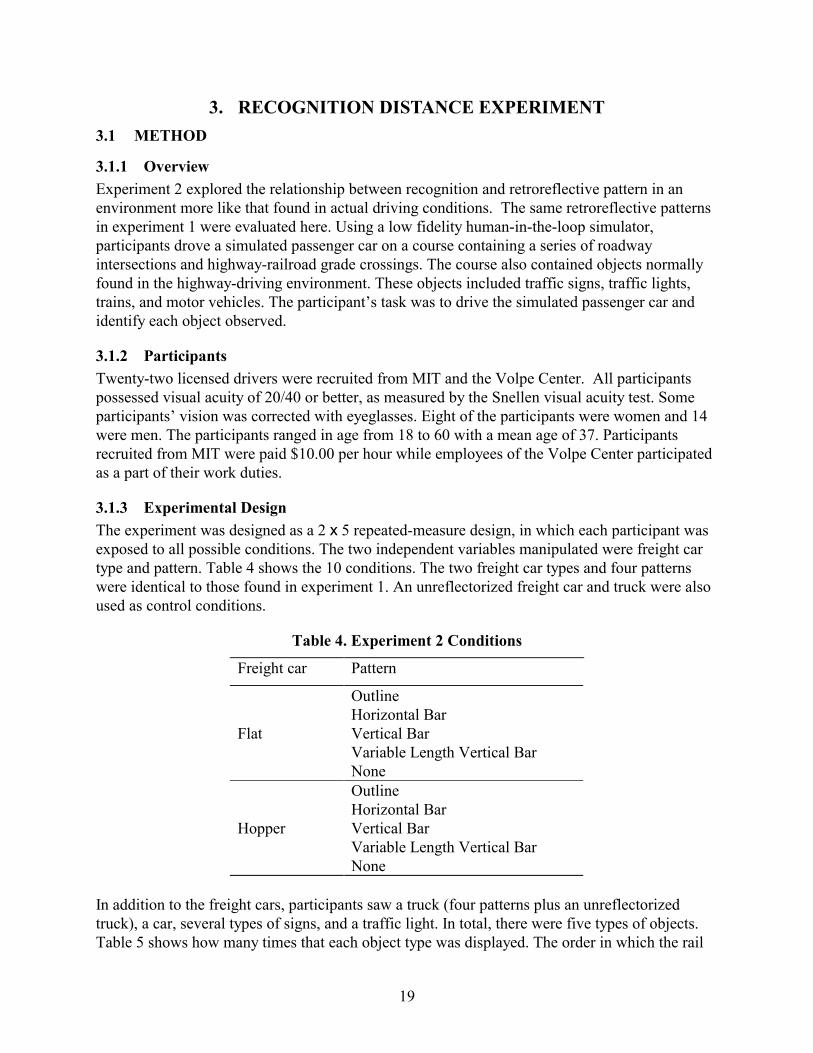
3.1.3 Experimental DesignThe experiment was designed as a 2 x 5 repeated-measure design, in which each participant wasexposed to all possible conditions. The two independent variables manipulated were freight cartype and pattern. Table 4 shows the 10 conditions. The two freight car types and four patternswere identical to those found in experiment 1. An unreflectorized freight car and truck were alsoused as control conditions.
Table 4. Experiment 2 Conditions
Freight car Pattern
OutlineHorizontal Bar
Flat Vertical BarVariable Length Vertical BarNoneOutlineHorizontal Bar
Hopper Vertical BarVariable Length Vertical BarNone
In addition to the freight cars, participants saw a truck (four patterns plus an unreflectorizedtruck), a car, several types of signs, and a traffic light. In total, there were five types of objects.Table 5 shows how many times that each object type was displayed. The order in which the rail

20
patterns were given was randomized by participant. Within an experiment, participants saw eachrail pattern twice for a total of 20 trials.
Table 5. Object Type Display Frequency
Object Type Display Frequency
Car 40
Light 4
Sign 113
Train 20
Truck 20
Performance was measured by recording distance from each object when the participant spokethe name of the object and recognition errors. If the participant changed his or her response whilemoving closer to the object, only the last response was considered in calculating the recognitiondistance. If the driver made a recognition error, an error was recorded. Trials on which driversmade an error were excluded from the calculation of recognition distance.
3.1.4 Scenario DescriptionFigure 13 shows the course participants drove. The course was 17 miles long and contained 11grade crossings and 10 highway intersections. Each driver completed the course twice. Thus,each driver passed through 22 grade crossings and 20 highway intersections. The letters inFigure 13 represent the highway intersections and the numbers represent the grade crossings. Allroad markings, signs, and traffic lights were designed according to the regulations set forth in theManual on Uniform Traffic Control Devices (FHWA, 1988). The posted speed limit was 50mph. The approach to every grade crossing contained an advanced warning sign, railroadwarning sign, and a crossbuck sign. The out-the-window view always displayed a forest of treeson both sides of the road to prevent participants from using peripheral vision to detect vehiclesapproaching an intersection. The design of the trains and trucks and the patterns evaluated in thisexperiment were identical to those found in Experiment 1. The background illumination levelwas comparable to the rural condition in Experiment 1.
As the driver approached intersections where a vehicle would appear, the vehicle would begincrossing the path when the participant was 2,000 feet from the intersection. For trains, a group ofthe same type of freight cars moved continuously through the intersection until the driver was375 feet from the intersection. For trucks and cars, a convoy of the same type of vehiclesseparated by fixed intervals would cross through the intersection until the driver was 375 feetfrom the intersection. The interval for trucks was 5 seconds. The interval for passenger cars was4 seconds.

21
Figure 13. Simulator Course

22
3.1.5 ApparatusA low fidelity, fixed-based driving simulator was created with a Silicon Graphics Indigo 2workstation, using the C++ programming language. The visual scenes were displayed using aBarco 808S projector on a 6' x 8' wall-mounted screen. The vehicle’s motion was modeled after aVolkswagon Rabbit. The participant sat 15 feet away from the projection screen and controlledthe vehicle with a desktop steering wheel and an accelerator and brake pedal located on the floor.The projection screen displayed three items: the out-the-window view, a speedometer, and sixtext labels to aid data collection. Figure 14 shows an example of what the participant saw.
To identify an object, the driver spoke one of five signal words displayed on the screen that mostclosely matched the object. The driver spoke these words into a headset style microphone. Thevoice responses were then recorded on a personal computer using voice recognition software.
3.1.6 ProceduresThe participant’s task was to drive a simulated passenger car while identifying objects thatappeared along the roadway. The experiment lasted approximately 2 hours. Each participantbegan by training the voice recognition software to recognize his or her voice. The participantrepeated five signal words into a microphone for approximately 2 minutes. The signal wordswere: car, light, sign, train, and truck. The participant drove around an oval practice course tobecome familiar with the controls and to see the different objects that would appear on theexperimental course. After seeing all the objects, the participant practiced saying the names of
Figure 14. Driver’s Forward Field of View
23
the objects observed while driving on the practice course. When the participant was comfortabledriving the simulator and identifying objects on the road, the participant began the experimentalcourse.
The experimenter instructed the participant to drive the vehicle while obeying all regulatorytraffic signs (i.e., speed limits and stop signs) and traffic lights. The task was self-paced in thatthe participant could control the speed at which the vehicle traveled. However, the experimenterencouraged the participant to drive as close to the designated speed limit as possible. When itwas necessary to turn at an intersection, arrow signs indicated the correct direction.
While driving, the participant encountered a series of objects. The participant was instructed toidentify these objects in the order in which they were seen and as soon as they could be clearlyrecognized. The participant identified the name of the object by speaking the appropriate signalword shown on the projection screen below the speedometer. When a participant identified anobject, a computer recorded the signal word, the distance of the vehicle from the object at thatpoint, and the actual object name. If the participant changed his or her mind after giving aresponse, the participant could give another response. Only the last response was used incalculating recognition distance.
If the participant needed to interrupt the simulation to take a break or speak with theexperimenter, speaking the word “pause” would suspend the simulation. Speaking the word“resume” continued the simulation from the same point where the simulation was suspended.The participant drove around the experimental course twice. At the conclusion of theexperimental task, the participant completed a brief questionnaire.
3.2 RESULTS AND DISCUSSION
3.2.1 Recognition DistanceTo compare the four reflectorized patterns and one unreflectorized pattern, the data wereanalyzed by car type. For each of the 10 conditions, mean recognition distance was calculatedalong with the number of recognition errors. Figure 15 shows the recognition distance for thefour patterns plus the unreflectorized condition, by car type. An ANOVA for recognition distanceindicates there was a statistically significant main effect for car type, F (1,21) = 17.98, p =0.0001. The mean recognition distance was greater in the hopper car condition (1,026 ft) than inthe flat car condition (947 ft). This outcome was expected since the patterns on the hopper carhad twice as much material as the on the flat car.
An ANOVA for recognition distance showed a statistically significant effect for pattern, F (4,21)= 193.67, p = 0.0001. Since there was also a statistically significant interaction between patternand car type, F (4,21) = 12.17, p = 0.0001, it is more appropriate to discuss the effects of patternby how it varied with car type. For the hopper car, the patterns can be clustered into three groupsaccording to whether the differences between the patterns were statistically significant using aStudent-Newman-Keuls multiple comparison test (CRSNK (5, 181 = 129.35, p, < .05). Table 6shows how the different patterns were grouped according to whether the differences betweenthem were statistically significant. Differences within a group were not statistically significant.Differences between groups were generally statistically significant. An exception occurred whereone pattern belonged in more than one group.

24
Table 6. Pattern Grouped by Statistical Significance
PatternRecognitionDistance (ft) Grouping*
Hopper CarVertical Bar 1240 AOutline 1192 AHorizontal Bar 1132 A,BVariable Vertical 1064 BUnreflectorized 422 CFlat CarHorizontal Bar 1215 AVertical Bar 1179 AVariable Vertical 1045 BOutline 837 CUnreflectorized 325 D*Multiple letters indicate inclusion in more than one group. Statistical evaluationswere made between all possible pairs of patterns. Differences in recognition distancebetween patterns with the same letter were not statistically significant. Differencesbetween patterns with different letters were statistically significant (p < 0.05).
0
200
400
600
800
1000
1200
1400
Hopper Car Flat Car
Car Type
Rec
ogni
tion
Dis
tanc
e (fe
et)
Vertical BarOutline
Horizontal BarVariable Vertical Bar
Unreflectorized
Figure 15. Effect of Pattern on Recognition Distance
25
In the first group, the vertical bar, outline and horizontal bar performed similarly. Of the patternsin this group, the vertical bar and the outline were significantly better than the variable verticaland the unreflectorized pattern. The horizontal bar and variable vertical bar patterns formed asecond group. Both these patterns were significantly better than the unreflectorized pattern. Thethird group consisted of the unreflectorized pattern alone. As expected, recognition performancewas worst in this condition.
Recognition performance in the flat car condition showed a different trend. Multiple comparisontests using the Student-Newman-Keuls multiple comparison test (CRSNK (5, 179 = 128.92, p, <.05) show four statistically significant groupings. Differences within a group were notstatistically significant while differences between groups were statistically significant. From bestto worst, the horizontal bar and vertical bar performed similarly followed by the variable verticalbar, the massed outline and finally, the unreflectorized car.
The only statistically significant result common to both types of rail cars was the betterperformance of the reflectorized patterns compared to the unreflectorized car. As expected, allpatterns were better than the unreflectorized car.
Performance with the vertical bar pattern was among the best for both car types. It ranked first inthe hopper car and second in the flat car. By contrast, the outline pattern performed well in thehopper car condition but suffered in the flat car condition. Mean recognition distance went from1192 feet in the hopper car to 837 feet in the flat car. The poorer performance may be attributedto the fact that the outline pattern did not actually outline the shape of the freight car in the flatcar. In creating this pattern, the small amount of surface area on the flat car resulted in only thelower half of the outline being displayed. Consequently, participants may have had moredifficulty recognizing this pattern as the freight car than with the complete outline shown in thehopper car.
The horizontal bar was the only pattern to show a performance improvement in going from thehopper car to the flat car. This result was surprising, given the smaller amount of material in theflat car. Given the similarity between the truck patterns and the horizontal bar, it was alsosurprising that participants performed best with the horizontal bar in the flat car condition. Othervisual cues in the environment may help the motorist to avoid confusing the two objects. Forexample, freight cars normally travel in closely spaced groups, while trucks generally consist ofsingle trailers. In this experiment, trucks containing a single trailer crossed the intersection at 5-second intervals. The freight cars were separated by 4 feet and crossed the intersectioncontinuously until the participant was 375 feet from the intersection. These differences may havebeen sufficient to enable the participant to discriminate between the train and the truck relativelyquickly.
The variable vertical pattern showed consistent performance across the two car types. Thedifference in recognition distance between the two car types was less than 25 feet. For the hoppercar, this pattern exhibited the worst performance of the four reflectorized patterns. For the flatcar, this pattern exhibited the second lowest performance.
3.2.2 Recognition ErrorsAn analysis of recognition error shows the difficulty in recognizing the unreflectorized freight carcompared to the reflectorized patterns. Table 7 shows the recognition errors for both car types by

26
pattern. For both car types, more recognition errors occur for the unreflectorized cars than for thereflectorized cars. A test of the difference in proportions between these two groups wasstatistically significant (z = 4.14, p < .05). In the hopper condition, participants made sevenrecognition errors with the unreflectorized car and two errors with the reflectorized cars, out of219 observations. In the flat car condition, participants made 10 recognition errors with theunreflectorized car and 4 errors with the reflectorized cars, out of 216 observations.
Table 7. Recognition Errors by Object in Grade Crossing
Object Identified in Grade CrossingNothing Car Truck
Hopper carUnreflectorized a 4 (9%) 0 (0%) 3 (7%)Reflectorizedb 0 (0%) 0 (0%) 2 (1%)Flat carUnreflectorized a 8 (18.2%) 1 (2.3%) 1 (2.3%)Reflectorizedb 0 (0%) 1 (0.6%) 3 (1.7%)aNumber in parentheses represents percent of errors for unreflectorized cars.bNumber in parentheses represents percent of errors for reflectorized cars.
Inspection of the recognition errors in reflectorized patterns shows participants made errors withonly two patterns, the horizontal bar and the outline. Five out of six of the recognition errorsinvolved confusing a train with a truck. In one instance, participants confused a train with a car.In the hopper car condition, participants confused a train with a truck twice with the horizontalbar pattern. In the flat car condition, participants confused a train with a truck twice with theoutline and once with the horizontal bar pattern. The outline pattern was also confused with a caron one occasion with the flat car.
These results suggest that most of the time, motorists can discriminate between similar patternson trains and trucks. Although the number of errors is too small to make statistical judgements,the fact that errors that did occur were predominantly in the horizontal bar condition, suggeststhat this pattern is more likely to be confused than the other patterns. In actual driving conditions,similar patterns are more likely to be confused when driving under less than ideal conditions (i.e.,when weather reduces visibility or the motorist is distracted). Thus, when considering errors, thehorizontal bar pattern may be less desirable than the other three patterns.
3.2.3 SummaryOverall, participants were able to recognize all four patterns at far greater distances than theunreflectorized patterns. This was expected given the previous research (Ford et al., 1998; Olsonet al., 1992; Ziedman et al., 1981) showing the effectiveness of retroreflective materials in aidingdetectability. In general, participants also recognized all patterns on the hopper car farther awayfrom the grade crossing than the flat car. This result was attributed to the greater amount ofmaterial that increased the amount of light returning to the motorist and the larger visual angleassociated with those patterns.
While the average recognition distance for the flat car was lower than the hopper car, it may stillbe effective to use the smaller amount of material found in the flat car patterns. Field tests

27
conducted on truck trailers (Olson et al., 1992) suggest these values may be a reasonableapproximation of the results from this laboratory study. In their experiment measuring detectiondistance, the mean detection distance was 1,461 feet with a standard deviation of 494 feet.
Among the four reflectorized patterns, recognition distance varied with car type. Whileperformance with the vertical bar, horizontal bar, and variable vertical bar was relativelyconsistent across car types, the outline showed a significant performance difference between thetwo car types. Performance suffered in the flat car condition, but it is not clear why. The outlinewas also one of two patterns in which participants made errors. Given the small vertical height ofthe typical flat car (between 4 and 18 inches), this car type makes displaying an outline shapedifficult.
In contrast to the outline pattern, the horizontal bar pattern showed better performance in the flatcar condition than in the hopper condition. This finding was unexpected. Since the horizontal barwas the pattern most similar to the truck patterns, participants were expected to take longer toidentify the freight car than for the other three patterns. However, the horizontal bar was the otherpattern for which participants made recognition errors. Although the number of errors was quitesmall, in every case, the train was confused with a truck. This confusion was expected given itssimilarity with the truck patterns. By contrast, the outline pattern was confused with both thetruck and car.
In selecting a standard pattern that could fit on all rail cars, the flat car becomes the limiting case,since it is the car with the smallest surface area. For 85 percent of motorists, three of the fourpatterns (horizontal bar, variable vertical bar, and vertical bar) would provide stopping distancesadequate for operating at speeds up to 55 mph. All four patterns would be effective at speeds upto 45 mph. The unreflectorized cars would not provide adequate stopping distance at speedsabove 25 mph.
Given that all four patterns are comparable at speeds up to 45 mph, recognition errors can serveas another criterion for selecting the optimal pattern. In this study, the horizontal bar pattern andoutline pattern were more likely to be confused with truck patterns than the vertically orientedpatterns. The number of recognition errors were lowest with the vertical bar pattern followed bythe variable vertical bar pattern. While the number of errors made with the horizontal bar andoutline patterns were small, selecting a vertically oriented pattern will minimize the likelihood ofconfusion.

28

29
4. SUMMARY AND CONCLUSIONS
The two experiments in this study examined the ability of observers to discriminate freight carsfrom truck trailers in an intersection at night, using retroreflective materials. Four patterns wereevaluated. The four freight car patterns were compared to four retroreflective patterns currentlyfound on truck trailers in revenue service. One experiment used a signal detection paradigm toevaluate the discriminability. The other experiment used a human-in-the-loop driving simulatorto evaluate human performance in a more naturalistic setting.
Taken together, the two experiments suggest that motorists can discriminate between freight carsand truck trailers for any of the four patterns tested here. In both experiments, performancedifferences between the four patterns were small. In the first experiment, differences in thepatterns were not statistically significant. In the second experiment, differences between thepatterns were found as a function of car type.
From a practical standpoint, the significance of these differences depends upon the stoppingdistance criterion selected. Eighty-five percent of the driving population would recognize thetrain for all four patterns in time to stop safely at 45 mph. By contrast, 85 percent of motoristswould not recognize an unreflectorized rail car in time to stop at speeds above 25 mph. At 55mph, only three of the four patterns would provide adequate safety margin. The outline patternwould be unacceptable in this situation. In terms of confusing the freight cars with truck trailers,the likelihood of these confusions is quite small. However, using similar patterns that could beconfused increases the probability of an accident compared to the patterns that are not easilyconfused. Choosing a pattern that is dissimilar to the horizontally oriented patterns found ontrucks will minimize the opportunity for these confusions. Therefore, a vertically oriented patternis preferred.
This study also demonstrated the important role context plays in understanding participants’behavior. In the signal detection experiment, unreflectorized freight cars were more difficult torecognize in the rural environment than the urban environment due the lower illumination levels.The use of retroreflective materials eliminated this difficulty. This performance improvement didnot vary with the type of pattern. For both car types, participants were able to discriminatebetween trains and trucks.
For the reflectorized patterns, participants exhibited a strong willingness to say the train waspresent for all patterns with one exception. Participants were less willing to say the train waspresent for the horizontal bar pattern in the urban hopper car. This may have been due to thecombined similarity of the patterns and the outline or shape of the two vehicles. The greaterillumination level found in the urban environment may have enabled the observer to use thisadditional visual information in their decision-making. However, because, the additionalinformation was similar between the two vehicles, it added to the difficulty of the discriminationtask rather than making it easier. This may also explain why participants in the recognitiondistance experiment recognized the horizontal bar at greater distances than the hopper car. It isworth noting that the number of recognition errors for the horizontal bar was greater in thehopper car (2) than the flat car (2). Again, these data suggest that the horizontal bar pattern maybe more likely to result in confusion between freight cars and truck trailers, than the other threepatterns.

30
The findings from this study are summarized below:
• Participants discriminated between freight cars and truck trailers for all four patternsevaluated.
• Vertically oriented patterns were recommended over outline and horizontally orientedpatterns because they were less likely to be confused with the horizontally oriented truckpatterns.
• Unreflectorized rail cars were more difficult to discriminate from trucks as illuminationlevel declines.

31
REFERENCES
49 CFR Part 571.108. (1996). Lamps, reflective devices and associated equipment, Washington,DC: Office of the Federal Register.
Aurelius, J.P. and N. Korobow, (1971). The Visibility and Audibility of Trains Approaching Railand Highway Grade Crossings, Report No. FRA-RP-71-2. Washington, DC: U.S. Departmentof Transportation, Federal Railroad Administration.
Carroll, A.A., Multer, J. and S.H. Markos, (1995). Safety of Highway-Railroad Grade Crossings:Use of Auxiliary External Alerting Devices to Improve Locomotive Conspicuity, Report No.DOT/FRA/ORD-95/13. Washington, DC: U.S. Department of Transportation, Volpe NationalTransportation Systems Center.
Carroll, A., Multer, J., Williams, D. and M. Yaffee, (1999). Safety of Highway-Railroad GradeCrossings: Freight Car Reflectorization. Report No. DOT/FRA/ORD-98/11, Washington,DC: U.S. Department of Transportation, Federal Railroad Administration.
Green, D.M. and J. A. Swets, (1988). Signal Detection Theory and Psychophysics. Los Altos:Peninsula Publishing.
Egan, J.P. (1975). Signal Detection Theory and ROC Analysis. New York: Academic Press.
Federal Highway Administration. (1988). Manual on Uniform Traffic Control Devices for Streetsand Highways. Washington, DC: U.S. Department of Transportation.
Federal Railroad Administration, Office of Safety. Highway-Rail Crossing Accident/Incident andInventory Bulletin. (1996). Washington, DC: U.S. Department of Transportation.
Federal Railroad Administration, Office of Safety. Highway-Rail Crossing Accident/Incident andInventory Bulletin #60. (1994). Washington, DC: U.S. Department of Transportation.
Ford, R.E., Richards, S.H., and J.C. Hungerford, (1998). Evaluation of Retroreflective MarkingsTo Increase Rail Car Conspicuity. Project Memorandum. No. DOT-VNTSC-RR897-PM98-22. U.S. Department of Transportation, Volpe National Transportation Center.
Grier, J.B. (1971). Nonparametric Indexes for Sensitivity and Bias: Computing Formulas.Psychological Bulletin, 75 (6), 424-429.
Lauer, A.R., and V.R. Suhr, (1956). “An Experimental Study of Four Methods of ReflectorizingRailway Boxcars.” Highway Research Board Bulletin, 146, 45-50.
Lebowitz, H.W., Owens, D.A., and R.A. Tyrrell, (1998). The Assured Clear Distance AheadRule: Implications for Nighttime Traffic Safety and the Law. Accident Analysis andPrevention, 30 (1), 93-99.
McGinnis, R.G. (1979). Reflectorization of Railroad Rolling Stock. Transportation ResearchRecord, 737, 31-43.
Olson, P.L. (1988). Minimum Requirements for Adequate Nighttime Conspicuity of HighwaySigns. Report No. UMTRI-88-8. NTIS No. PB88-179841-HDM. St. Paul: Minnesota Miningand Mfg. Co.
32
Olson, P.L., Campbell, K., Massie, D., Battle, D.S., Traube, E.C., Aoki, T., Sato, T., & L.C.Pettis, (1992). Performance Requirements for Large Truck Conspicuity Enhancements, ReportNo. HS-807-815. Washington, DC: U.S. Department of Transportation, National HighwayTraffic Safety Administration.
Poage, J. L., Pomfret, J. C. and J.B. Hopkins, (1982). Freight Car Reflectorization, Report No.FRA-RRS-83-1. Washington, DC: U.S. Department of Transportation, Research and SpecialPrograms Administration, Transportation Research Center.
Sheridan, T.B. and W.R. Ferrell, (1974). Man-Machine Systems. Cambridge: MIT Press.
Stalder, H. I. & A.R. Lauer, (1954). Effective Use of Reflectorized Materials on RailroadBoxcars. Highway Research Bulletin, 89, 70-75.
Villareal, Steven. (1997). Sound Enhancements for Graphical Simulations. Master’s Thesis,MIT.
Ziedman, K., Burger, W.J., Smith, L.R., Mullholland, M.U. and Sharkey, T. (1981). ImprovedCommercial Vehicle Conspicuity and Signaling Systems: Task II Analysis Experiments andDesign Recommendations. Washington, D.C: U.S. Department of Transportation, NationalHighway Transportation Administration.
33
APPENDIX
RESPONSE BIAS: B" VALUES FOR EACH PATTERN

34

35
Horizontal BarRural Urban
Observer Hopper Flat Hopper Flat1 -0.097 -1.000 -1.000 0.0002 -1.000 -1.000 0.574 -1.0003 -1.000 -1.000 -0.457 -1.0004 -1.000 -1.000 -0.542 -1.0005 -1.000 1.000 -1.000 1.0006 -1.000 -1.000 -1.000 -1.0007 -1.000 -1.000 - -8 -1.000 -1.000 -1.000 -1.0009 -1.000 -1.000 -0.394 -1.00010 -1.000 -1.000 -1.000 -1.00011 -1.000 -1.000 -1.000 -1.000
OutlineRural Urban
Observer Hopper Flat Hopper Flat1 -1.000 -1.000 -1.000 -1.0002 -1.000 -1.000 - -3 -1.000 -1.000 -1.000 -1.0004 -1.000 -1.000 - -5 1.000 1.000 -1.000 -6 -1.000 -1.000 -1.000 -1.0007 -1.000 -1.000 -1.000 -8 -1.000 -1.000 - -1.0009 -1.000 -1.000 -1.000 -1.00010 -1.000 -1.000 -1.000 -1.00011 -1.000 -1.000 -1.000 -1.000
Variable Vertical BarRural Urban
Observer Hopper Flat Hopper Flat1 -1.000 -1.000 -1.000 -1.0002 -1.000 -1.000 -1.000 -3 -1.000 -1.000 -1.000 -1.0004 -1.000 -1.000 -1.000 -1.0005 -1.000 - 1.000 -6 -1.000 -1.000 -1.000 -1.0007 -1.000 -1.000 -1.000 -8 -1.000 -1.000 -1.000 0.0009 -1.000 -1.000 -1.000 -1.00010 -1.000 -1.000 -1.000 -1.00011 -1.000 -1.000 -1.000 -1.000

36
Vertical BarRural Urban
Observer Hopper Flat Hopper Flat1 -0.505 -1.000 -1.000 -1.0002 -1.000 -1.000 - -3 -1.000 -1.000 -1.000 -1.0004 -1.000 -1.000 - -1.0005 - 1.000 - 1.0006 -1.000 -1.000 -1.000 -1.0007 -1.000 -1.000 - -8 -1.000 -1.000 -1.000 -1.0009 -1.000 -1.000 -1.000 -1.00010 -1.000 -1.000 -0.394 -1.00011 -1.000 -1.000 -1.000 -1.000
Unreflectorized CarRural Urban
Observer Hopper Flat Hopper Flat1 0.455 0.092 -1.000 0.4572 0.460 0.670 -1.000 -1.0003 0.132 0.092 0.457 0.2954 1.000 0.173 1.000 0.7365 - - 0.188 -6 -1.000 -0.187 1.000 0.3517 0.460 0.138 -1.000 -1.0008 1.000 1.000 0.679 0.4719 0.082 0.158 0.770 -0.30910 -0.244 0.057 -0.309 0.35111 -0.019 -0.220 -0.663 -0.445