Recent vegetation history of Drygarn Fawr (Elenydd SSSI), Cambrian Mountains, Wales: implications...
26
Biodivers Conserv (2007) 16:2821–2846 DOI 10.1007/s10531-007-9169-3 1 C ORIGINAL PAPER Recent vegetation history of Drygarn Fawr (Elenydd SSSI), Cambrian Mountains, Wales: implications for conservation management of degraded blanket mires F. M. Chambers · D. Mauquoy · E. W. Cloutman · J. R. G. Daniell · P. S. Jones Received: 1 March 2007 / Accepted: 1 March 2007 / Published online: 6 June 2007 © Springer Science+Business Media B.V. 2007 Abstract Many areas of blanket mire in Britain display apparently degraded vegetation, having a limited range of ericaceous and Sphagnum species. Data are presented here from Wales from the upland locality of Drygarn Fawr (Elenydd SSSI), which is dominated over- whelmingly by Molinia caerulea. Palaeoecological techniques were used to chronicle vegetation history and to determine the nature and timing of vegetation changes, as an aid to devising conservation management and restoration strategies. Although for the past 2000 years the pollen and plant macrofossil data indicate some evidence for cyclic vegeta- tion change, they demonstrate that here the major vegetation change post-dated the start of the industrial revolution. The palaeoecological data show a greater proportion of Sphagnum than currently. Local extinction of some species (e.g., Myrica gale) apparently took place in Medieval times, but most of the degradation and Xoral impoverishment apparently occurred during the 20th Century. The implications for conservation management are far- reaching. The overwhelming dominance of Molinia is clearly unprecedented. While it was locally present for hundreds of years, some factor(s)—possibly a change in grazer and grazing regime—encouraged its recent ascendancy in the 20th Century. Consequently, any management attempts to reduce the pre-eminence of Molinia would not be countering an ingrained, long-established dominance. It is suggested that investigation of degraded blan- ket mires elsewhere by historical and multi-proxy palaeoecological techniques—through multiple, dated cores to track species extinctions and directional vegetation changes— would help ascertain previous mire Xoras and so indicate a range of restoration targets for mire vegetation. F. M. Chambers (&) · E. W. Cloutman · J. R. G. Daniell Centre for Environmental Change and Quaternary Research, University of Gloucestershire, Francis Close Hall, Swindon Road, Cheltenham, GL50 4AZ, UK e-mail: [email protected] D. Mauquoy Department of Geography & Environment, University of Aberdeen, Elphinstone Road, Aberdeen, AB24 3UF, UK P. S. Jones Countryside Council for Wales, Maes-y-Ffynnon, Penrhosgarnedd, Bangor, Gwynedd, Wales, LL57 2DW, UK
Transcript of Recent vegetation history of Drygarn Fawr (Elenydd SSSI), Cambrian Mountains, Wales: implications...
Biodivers Conserv (2007) 16:2821–2846 DOI 10.1007/s10531-007-9169-3
ORIGINAL PAPER
Recent vegetation history of Drygarn Fawr (Elenydd SSSI), Cambrian Mountains, Wales: implications for conservation management of degraded blanket mires
F. M. Chambers · D. Mauquoy · E. W. Cloutman · J. R. G. Daniell · P. S. Jones
Received: 1 March 2007 / Accepted: 1 March 2007 / Published online: 6 June 2007© Springer Science+Business Media B.V. 2007
Abstract Many areas of blanket mire in Britain display apparently degraded vegetation,having a limited range of ericaceous and Sphagnum species. Data are presented here fromWales from the upland locality of Drygarn Fawr (Elenydd SSSI), which is dominated over-whelmingly by Molinia caerulea. Palaeoecological techniques were used to chroniclevegetation history and to determine the nature and timing of vegetation changes, as an aidto devising conservation management and restoration strategies. Although for the past2000 years the pollen and plant macrofossil data indicate some evidence for cyclic vegeta-tion change, they demonstrate that here the major vegetation change post-dated the start ofthe industrial revolution. The palaeoecological data show a greater proportion of Sphagnumthan currently. Local extinction of some species (e.g., Myrica gale) apparently took placein Medieval times, but most of the degradation and Xoral impoverishment apparentlyoccurred during the 20th Century. The implications for conservation management are far-reaching. The overwhelming dominance of Molinia is clearly unprecedented. While it waslocally present for hundreds of years, some factor(s)—possibly a change in grazer andgrazing regime—encouraged its recent ascendancy in the 20th Century. Consequently, anymanagement attempts to reduce the pre-eminence of Molinia would not be countering aningrained, long-established dominance. It is suggested that investigation of degraded blan-ket mires elsewhere by historical and multi-proxy palaeoecological techniques—throughmultiple, dated cores to track species extinctions and directional vegetation changes—would help ascertain previous mire Xoras and so indicate a range of restoration targets formire vegetation.
F. M. Chambers (&) · E. W. Cloutman · J. R. G. DaniellCentre for Environmental Change and Quaternary Research, University of Gloucestershire, Francis Close Hall, Swindon Road, Cheltenham, GL50 4AZ, UKe-mail: [email protected]
D. MauquoyDepartment of Geography & Environment, University of Aberdeen, Elphinstone Road, Aberdeen, AB24 3UF, UK
P. S. JonesCountryside Council for Wales, Maes-y-Ffynnon, Penrhosgarnedd, Bangor, Gwynedd, Wales, LL57 2DW, UK
1 C
2822 Biodivers Conserv (2007) 16:2821–2846
Keywords Blanket mires · Degraded mires · Mire conservation · Palaeoecological techniques · Plant macrofossil analysis · Pollen analysis · Wales
Introduction
Blanket bog sensu lato is extensively developed in upland Britain and is an importantcomponent of many conservation sites. However, many blanket peats are no longer activelypeat forming, and are considered to be in degraded condition (Tallis et al. 1997). In uplandWales, for example, impoverished vegetation communities, typically dominated by grami-noids, such as Eriophorum vaginatum and Molinia caerulea, and with reduced amounts ofericoids and Sphagna, cover extensive areas of blanket peat. Peat erosion, with networks ofgullies leading sometimes to the substantial removal of the peat blanket, is also a majorproblem locally. In Wales, Yeo (1997) considered that, in general, sites in the southappeared to be more severely degraded than those in the north.
The rationale for this study therefore lay in concern over the apparent degradation ofblanket mire communities in Britain. It was thought that palaeoecological research, todetermine the former vegetation cover of degraded peatlands and to elucidate the factorscausing these changes, could guide the conservation management of the selected studysites, and provide a means of setting restoration targets. Areas of blanket bog in the south-ern half of Wales were chosen for initial investigation, based on previous palaeoecologicalresearch (e.g., Chambers 1982a, b, 1983)) and data compiled by Yeo (1997). During 1997–1998, a pilot study was undertaken for the Countryside Council for Wales (CCW) at threedegraded blanket mire sites to give a preliminary assessment of vegetation changes in rela-tion to human impacts, and to provide an appraisal of the palaeoecological techniques.Recommendations for further research were made, and in the light of these, more detailedanalysis of blanket mire degradation was carried out in an extended study. Here, afterdetailing the methods applied, we report results for the most northerly of the study sites,Drgyarn Fawr. We then outline the implications for research into and conservationmanagement of degraded blanket mires.
Study area and sampling sites
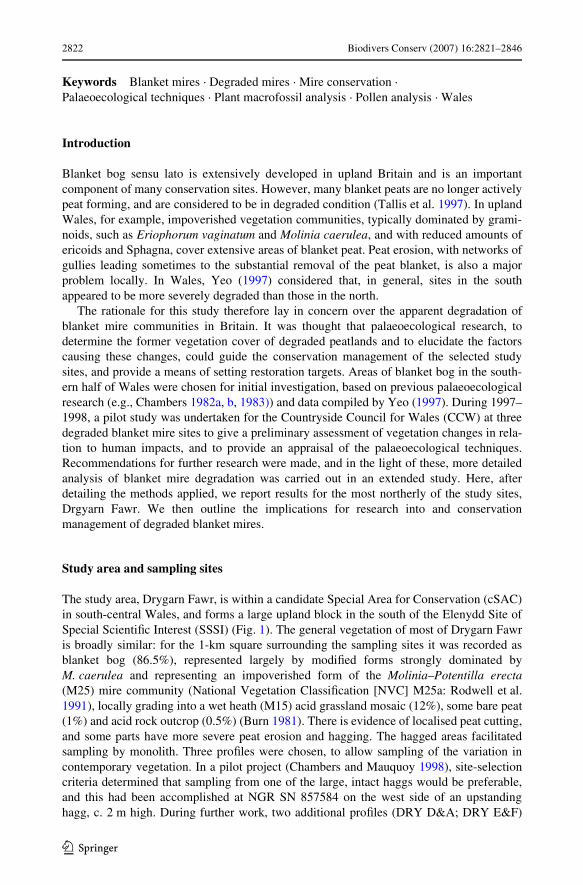
The study area, Drygarn Fawr, is within a candidate Special Area for Conservation (cSAC)in south-central Wales, and forms a large upland block in the south of the Elenydd Site ofSpecial ScientiWc Interest (SSSI) (Fig. 1). The general vegetation of most of Drygarn Fawris broadly similar: for the 1-km square surrounding the sampling sites it was recorded asblanket bog (86.5%), represented largely by modiWed forms strongly dominated byM. caerulea and representing an impoverished form of the Molinia–Potentilla erecta(M25) mire community (National Vegetation ClassiWcation [NVC] M25a: Rodwell et al.1991), locally grading into a wet heath (M15) acid grassland mosaic (12%), some bare peat(1%) and acid rock outcrop (0.5%) (Burn 1981). There is evidence of localised peat cutting,and some parts have more severe peat erosion and hagging. The hagged areas facilitatedsampling by monolith. Three proWles were chosen, to allow sampling of the variation incontemporary vegetation. In a pilot project (Chambers and Mauquoy 1998), site-selectioncriteria determined that sampling from one of the large, intact haggs would be preferable,and this had been accomplished at NGR SN 857584 on the west side of an upstandinghagg, c. 2 m high. During further work, two additional proWles (DRY D&A; DRY E&F)
1 C
Biodivers Conserv (2007) 16:2821–2846 2823
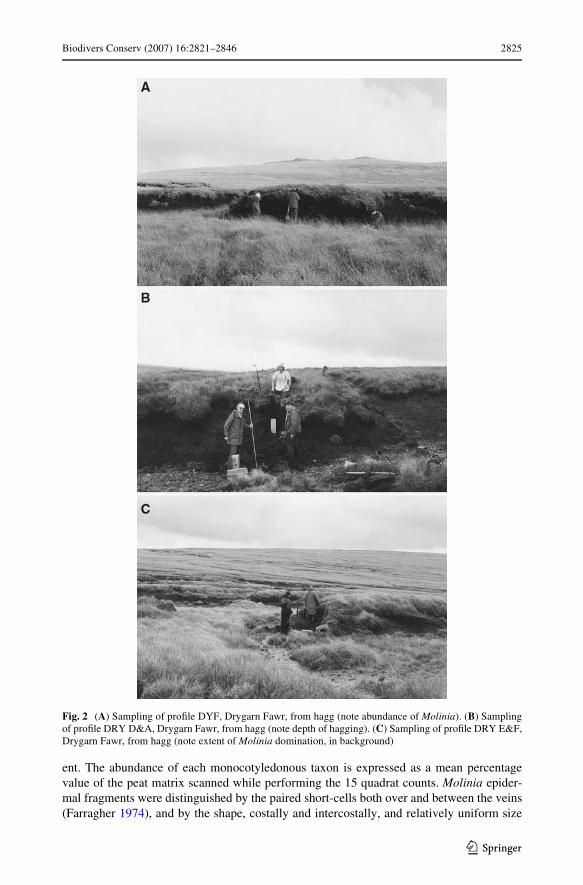
were sampled from nearby haggs, sequentially each c. 100 m further north of the originalsampling location. Table 1 lists the local vegetation: Molinia dominated; ericoids com-prised scattered but frequent shoots of Vaccinium myrtillus, with occasional or at mostlocally frequent Calluna vulgaris and Erica tetralix; Sphagum spp. and Eriophorum vagin-atum were absent (see Fig. 2). In each case, redeposited peat from the foot of a hagg wasdug away and a cleaned vertical face was created for insertion of open-ended monolith tinsof 15 £ 15 cm cross-section. The peat monoliths were cut out cleanly using a speciallydesigned peat cutter (Lageard et al. 1994).
Methodology
Plant macrofossil analysis was conducted on sub-samples to a depth of 1 m (from as farback as c. 2000 BP), to provide a long-term perspective on vegetation change. Pollen anal-ysis was conducted on one proWle, to provide a vegetation history for the study area and tosupplement the plant macrofossil analysis. Peat humication analysis was used to helpdistinguish between site-related factors and climate change. ProWles were dated by conven-tional radiocarbon assay, with the uppermost horizons dated by other methods.
Plant macrofossil analysis
Plant macrofossil analysis was attempted at a minimum of 2 cm intervals on each of thesampled proWles and at 1 cm intervals in the top 25 cm of the (two) newer monoliths, so asto provide a high-resolution reconstruction of site vegetation history. Volume percentages
Fig. 1 Map showing Drygarn Fawr locality
30 km0
Land over 305 m (1000 feet)Land over 610 m (2000 feet)
53 No
52 No
53 No
4 Wo
4 Wo
52 No
WalesBritish Isles
Drygarn Fawr
1 C

2824 Biodivers Conserv (2007) 16:2821–2846
of plant macrofossils were assessed using the semi-quantitative Quadrat and Leaf Counttechnique (QLC: Barber et al. 1994). The same methodology has been applied in investiga-tions of shallow peat on Exmoor (Chambers et al. 1999), blanket peat in Scotland andraised bog in Northern Ireland (Barber et al. 1999, 2000).
A slice of peat measuring 1 £ 1 £ 4 cm was cut from each level with a surgical scalpel.The samples were placed on a 125 �m sieve and sprayed with a high pressure jet of waterfrom a narrow plastic pipe connected to a tap, which served to force Wne, humiWed materialthrough the sieve and so disaggregate the sample. Macrofossils retained on the 125 �msieve were placed in a glass petri dish and 70 ml of water added to create a monolayer ofremains. These were scanned using a Meiji EMZ-TR stereozoom microscope at£10 magniWcation, using a 10 £ 10 square-grid eyepiece graticule (the ‘quadrat’), and theabundance of unidentiWed organic matter (U.O.M.), identiWable Sphagnum, monocotyle-dons, and ericaceous roots, was estimated using 15 averaged quadrat counts. Where a com-ponent covered more than half each individual square, a score of 1% per square was given.Particular care was taken to distinguish, where possible, closely related species (or taxa)within the genus Sphagnum, and in the families Ericaceae, Cyperaceae and Gramineae.
Wherever epidermal fragments were visible in the petri dish, these were removed usingforceps, mounted in Aquamount and examined at £100 to £400 to conWrm the taxa pres-
Table 1 Site details and vegetation notes for sampling sites
Positions for all three monoliths are marked on an aerial photo 98/93/112 (Geonex set, 31/8/93) held at CCW.The idiosyncratic Weld nomenclature for the peat proWles is retained here, because all archived samples are ref-erenced by the proWle name and because submitted radiocarbon samples have already used that naming scheme
DYF—Original monolith, used in pilot project
DRY D&A—Situated c.100 m N of DYF, immediately adjacent to a boundary stone
DRY E&F—Situated c.100 m due N from DRY D&A
Monolith code no.
DYF DRY D&A DRY E&F
NGR (all SN) 857584 857585 857586
Date sampled 27 Oct. 1997 1 Oct. 1998 1 Oct. 1998
Elevation (m OD) 580 585 590
Species recorded in the vicinity of each monolith
M. caerulea (dominant) + + +
Vaccinium myrtillus + + +
Calluna vulgaris + + +
Empetrum nigrum ssp. nigrum + ¡ +
Erica tetralix + ¡ ¡Scirpus cespitosus + + ¡Eriophorum angustifolium + + ¡Festuca ovina + ¡ ¡Deschampsia Xexuosa + ¡ +
Galium saxatile + ¡ ¡Polytrichum commune + ¡ +
Dicranum scoparium ¡ ¡ +
Campylopus introXexus ¡ + +
Cladonia spp. + + +
1 C
Biodivers Conserv (2007) 16:2821–2846 2825
ent. The abundance of each monocotyledonous taxon is expressed as a mean percentagevalue of the peat matrix scanned while performing the 15 quadrat counts. Molinia epider-mal fragments were distinguished by the paired short-cells both over and between the veins(Farragher 1974), and by the shape, costally and intercostally, and relatively uniform size
Fig. 2 (A) Sampling of proWle DYF, Drygarn Fawr, from hagg (note abundance of Molinia). (B) Samplingof proWle DRY D&A, Drygarn Fawr, from hagg (note depth of hagging). (C) Sampling of proWle DRY E&F,Drygarn Fawr, from hagg (note extent of Molinia domination, in background)
1 C

2826 Biodivers Conserv (2007) 16:2821–2846
range of the long-cells (Watson and Dallwitz 1992 et V.) The drawings in Grosse-Braukmann (1972) and Katz et al. (1977), in addition to a reference collection of typematerial, aided the identiWcation of sedges encountered in the sample peat matrices. Inmany instances, the Cyperaceous remains could not be identiWed to species level, particu-larly where macrofossils were largely derived from rhizome material; in such cases, andwhere there was no epidermal material present in sub-fossil samples, monocotyledonousremains were classiWed simply as monocotyledons undiVerentiated (monocots undiV.), andexpressed as a percentage value.
Leaves, seeds and seed boxes of Calluna vulgaris, and leaves and seeds of Erica tetra-lix, Empetrum nigrum, and Vaccinium myrtillus were identiWed using a type referencecollection and the drawings and photographs in Grosse-Braukmann (1972, 1974) andGrosse-Braukmann and Streitz (1992). Each of these plant macrofossil components, inaddition to Eriophorum vaginatum spindles (stem sheaths: bundles of internal tissues thatgive support to the stems), was recorded semi-quantitatively on a 1–5 scale (where 1 = rare,2 = occasional, 3 = frequent, 4 = abundant and 5 = very abundant). Bryophytes other thanSphagnum were recorded where encountered and separately identiWed.
Pollen analysis
Pollen analysis has the advantage of giving a less localised picture of vegetation change thanQLC; furthermore, the preservation of taxa downproWle has less inherent variation than withQLC for which material is more easily preserved in less humiWed peat and particularly nearthe surface. Samples with vertical thickness of 0.5 cm from proWle DRY E&F were preparedfor pollen analysis after Barber (1976), but with an extra stage of micromesh sieving toconcentrate the pollen. Samples were spaced at 4 cm intervals for the whole proWle, and atcloser intervals (2 cm) towards the surface to clarify recent environmental change.
A pollen sum of 500 total land pollen grains (TLP) was counted for each sample horizon.Where possible, Cerealia pollen types were referred to Secale or to Triticum-type; unidenti-Wed Cerealia (including Hordeum) were aggregated under Cerealia. Coryloid pollen wasmainly Corylus and is shown as such in the pollen diagram; grains that exhibited the requi-site diagnostic features of Myrica gale pollen were recorded separately as Myrica.
In the pollen diagram, all taxa are represented as percentages of TLP, but with sporetaxa excluded from the TLP sum (these are in parentheses). The arboreal taxa are arrangedin conventional order, whilst the non-arboreal types are arranged in broad ecologicalgroups, from woodland, through woodland edge, ruderal, arable, grassland, and mire habi-tats. Plant nomenclature largely follows Clapham et al. (1987).
Charcoal analysis
Aaby and Tauber (1975), Tallis (1975) and MacDonald et al. (1991) used macroscopiccharcoal fragments to reconstruct Wre histories. These relatively large charcoal fragmentscorrelate well with known local Wres (MacDonald et al. 1991). Therefore, in order to assessthe frequency and possible severity of Wre events aVecting the area, macroscopic charcoalfragments (>125 �m) in the petri dish were identiWed and counted when the plant macro-fossil components of the peat matrix were determined. A graticule was used to assign char-coal fragments to six size classes: <15,625 �m2, 15,625–62,500 �m2, 62,500 �m2–0.25 mm2, 0.25–1 mm2, 1–4 mm2 and >4 mm2. The use of diVerent size classes wasintended to aid distinction between in situ and ex situ burning, as the larger size classes arebelieved indicative of in situ burning (Clark 1988).
1 C

Biodivers Conserv (2007) 16:2821–2846 2827
Research has shown that charcoal records in pollen slides do not always correspond withknown records of local Wres (MacDonald et al. 1991); nevertheless, the microscopic char-coal evident on pollen microslides can be used as a check on the macroscopic charcoal datafrom each locality. During pollen counting, charcoal on the pollen slides was assessedsemi-quantitatively using a 10-point scale. The results of these assessments are plotted onthe right-hand side of the pollen diagram.
Radiocarbon dating
Sub-samples of peat were taken for radiocarbon dating from two proWles—the originalproWle (DYF, from the pilot study) and the proWle analysed for pollen (DRY E&F)—toprovide an overall timescale for earlier vegetation changes. After the macrofossil analyseshad been conducted, critical horizons were identiWed in the diagrams, and 1-cm samples ofpeat >100 g wet weight were taken for conventional bulk radiocarbon dating at Beta Ana-lytic Inc., Miami. Calibrated age-range equivalents are given, as cal. AD/BC (usingCALIB3: Stuiver and Reimer 1993) at one sigma, to facilitate comparison with historicaland other records.
Spheroidal Carbonaceous Particle (SCP) analysis
SCPs are formed from the high-temperature combustion of fossil fuels. Analyses of theirconcentrations in lake sediments by GriYn and Goldberg (1981), Renberg and Wik (1984,1985) and Rose et al. (1995), and in peat stratigraphy (Barber et al. 2000), has served toindicate the historical development of coal and oil burning in each of the countries studied.The analysis of SCPs potentially oVers an extra degree of dating control, since it shouldallow peat from the very recent past to be dated.
The method was based initially on the techniques described in Rose (1990, 1994).DiVerences from that experimental procedure, which principally uses concentrated nitricacid to remove organic material, were (a) the omission of hydroXuoric and hydrochloricacid digests, because these are designed to remove siliceous and carbonate material andthese components were largely absent from the blanket peat stratigraphy investigated; and(b) a higher temperature setting of 180°C rather than 80°C, during the acid digestion phase.A Gerhardt scrubber unit was used to neutralise acidic vapour evolved during the aciddigestion. SCP concentrations are expressed as per gram dry mass of sediment (gDM¡1).The diameters of SCPs ranged from 5 to 30 �m.
Determination of peat humiWcation
Peat humiWcation is an indication of the condition of the mire at the time of peat formation.The rate of peat-bog growth is dependent on the relationship between biological productionon the bog surface and decay of the plant litter. Most decay takes place in the aerobic layerabove the bog water table, termed the acrotelm (Ingram 1978). Acrotelm thickness isinversely related to the humidity of the mire surface, and depends on precipitation, temper-ature and evaporation (Aaby 1976). Climate is therefore the most important allogenic fac-tor determining the degree of humiWcation of the peat. A change of mean water-table levelof only a few centimetres can signiWcantly aVect the rate of peat humiWcation (Clymo1984) and peat will become more humiWed if the dry season is exceptionally long or dry(Blackford 1993). So, peat of low humiWcation is indicative of wet and possibly coolerconditions; peat of high humiWcation indicates dry and possibly warmer conditions.
1 C

2828 Biodivers Conserv (2007) 16:2821–2846
Both plant macrofossil analysis (QLC) and determination of peat humiWcation can beused as proxy-climate indicators. However, in this study, QLC was also being used as anindicator of recent vegetation change, which might in part be attributable to human impact.Use of the two datasets helped to discriminate between the allogenic factors of climatechange and human impact.
Contiguous sub-samples of peat were analysed from the peat proWles for determiningpeat humiWcation by colorimetry (Overbeck 1947; Aaby 1986) using a standard protocol,following the revised method of Blackford and Chambers (1993). The resulting data areplotted as percentage light transmission through an alkali extract (i.e., not as percentage ofpeat humiWcation). The alkali extract will be darker for peat of high humiWcation, and light-coloured for peat of low humiWcation. This means that high light-transmission values indi-cate low humiWcation (relatively wet, possibly cooler climate), and low light-transmissionvalues indicate high humiWcation (relatively dry, possibly warmer climate).
Results
Data presentation
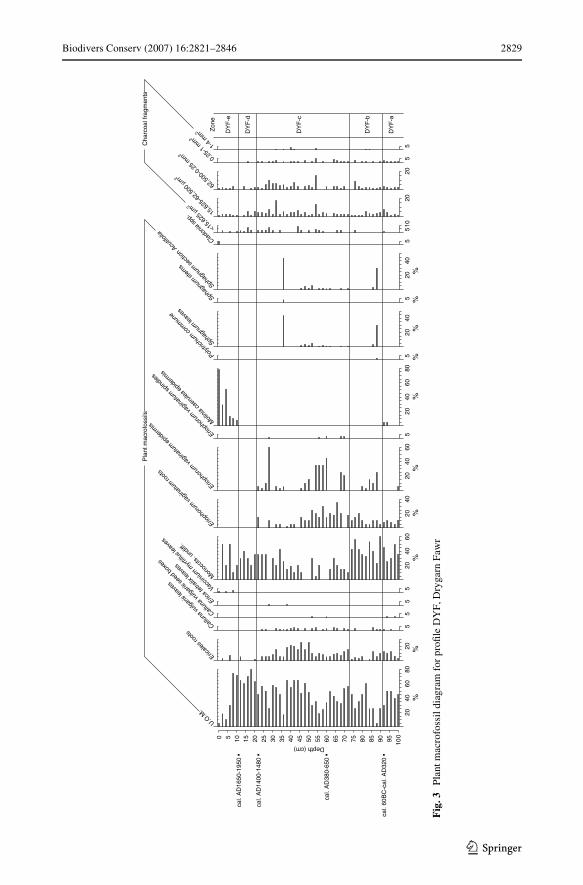
Plant macrofossil and pollen analytical data were entered separately into TILIA spread-sheets, and plotted as diagrams using TILIAGRAPH (Grimm 1991). For ease of descrip-tion, the macrofossil diagrams were zoned, based on signiWcant changes in therepresentation of the plant macrofossils, with the intention of producing relatively homoge-nous zones. To avoid confusion with the macrofossil zones, the pollen diagram was phased(cf. Chambers 1982a). The palaeobotanical data are now presented, proWle-by-proWle, com-mencing with the plant macrofossil data from proWle DYF (see Fig. 3).
Drygarn Fawr ProWle DYF, plant macrofossil data
Zone DYF-a (100–91 cm)
The peat matrices are largely composed of U.O.M. (unidentiWable organic matter) andsedges (Eriophorum vaginatum roots are present). Calluna vulgaris leaves and seeds in thepeat samples and the absence of Sphagna might suggest a relatively dry mire surface. Moli-nia caerulea epidermis (5% of the peat matrix) is present at 92 and 94 cm, and was dated(the sample centred on 92 cm) to 1,920 § 80 BP (cal. 60 BC–cal. AD 320; Beta-113807).
Zone DYF-b (91–61 cm)
The representation of Eriophorum vaginatum epidermis and roots increases in this zone;bryophytes occur sporadically, with 30% abundance of Sphagnum section Acutifolia leavesat 86 cm. In the absence of corroborative evidence for a more hygrophilous mire Xora, thespecies present in section Acutifolia may have been S. capillifolium var. rubellum or,conceivably, S. fuscum, which presently is conWned to very few ombrogenous mires inWales. Had there been supporting evidence for a more hygrophilous Xora, another possibilitymight have been S. subnitens. Molinia caerulea is not recorded. Apart from an absence at76 cm, charcoal particles continue to be recorded in similar quantities to those of thepreceding zone.
1 C
Biodivers Conserv (2007) 16:2821–2846 2829
0 5 10 15 20 25 30 35 40 45 50 55 60 65 70 75 80 85 90 95 100
Depth(cm)
cal.
60B
C-c
al.A
D32
0
cal.
AD
380-
650
cal.
AD
1400
-148
0
cal.
AD
1650
-195
0
2040
6080
%
U.O.M
.
20 %
Ericale
sroot
s
5Callun
avu
lgaris
leave
s
5Callun
avu
lgaris
seed
boxe
s
5Erica
tetra
lixlea
ves
5Vaccin
iumm
yrtill
uslea
ves
2040
60%
Mon
ocot
s.un
diff.
2040
%
Erioph
orum
vagin
atum
root
s
2040
60%
Erioph
orum
vagin
atum
epide
rmis
5Erioph
orum
vagin
atum
spind
les
2040
6080
%M
olinia
caer
ulea
epide
rmis
5 %Polytri
chum
com
mun
e
2040
%
Sphag
num
leave
s
5 %Sphag
num
stem
s
2040
%
Sphag
num
Acutifo
lia
secti
on
5Cladon
iasp
p.
510<1
5,62
5mµ
2
20
15,6
25-6
2,50
0µm
2
20
62,5
00-0
.25
mm2
50.25
-1m
m2
51-4
mm2 Z
one
DY
F-a
DY
F-b
DY
F-c
DY
F-d
DY
F-e
Pla
ntm
acro
foss
ilsC
harc
oalf
ragm
ents
Fig
.3P
lant
mac
rofo
ssil
dia
gram
for
proW
le D
YF
, Dry
garn
Faw
r
1 C
2830 Biodivers Conserv (2007) 16:2821–2846
Zone DYF-c (61–21 cm)
Further increases in the abundance of Eriophorum vaginatum occur, exceeding 30%from 54 to 60 cm, and at 28 cm a value of 60% was recorded. There are also increases inthe abundance of U.O.M., Ericales roots and macroscopic charcoal. The increases inthese components may be linked, since the tussock growth form of Eriophorum vaginatumis eVective protection against Wres (Wein et al. 1987), whilst Ericales can withstand atleast some Wre damage. The increases in U.O.M. and Ericales roots point to a desiccationof the mire surface, which appears to have favoured Sphagnum section Acutifolia bryo-phytes: possibly they were Sphagnum capillifolium var. rubellum or Sphagnum fuscum,as these species inhabit dry mire hummocks (Andrus et al. 1983; Rydin and McDonald1985).
Zone DYF-d (21–11 cm)
Decomposition has occurred to such a high degree that with the exception of the ‘Mono-cots. undiV.’ component and some Ericales roots, the majority of the peat is composed ofU.O.M. Charcoal abundances decline, and so burning is apparently not related to themarked indications in the peat stratigraphy of reduced surface wetness. It is possible thatincipient gullying and the onset of peat erosion in the vicinity of the sampling site may haveinitiated drying of the surface.
Zone DYF-e (11–0 cm)
Molinia caerulea epidermis is encountered frequently in this zone, and reaches a maximumabundance of c. 80% at the surface, which is consistent with its dominance in the samplingarea. Charcoal particles are also continuously present. Ericales roots increase at 6 cm point-ing to a further desiccation of the mire surface. These probably derive from Vacciniummyrtillus, which is a component of the vegetation at the sampling point. Neither Eriopho-rum nor Sphagnum is recorded in zone DYF-e, and both are absent from the surface vegeta-tion of the area. However, although still quite important as a component of the widervegetation, Calluna leaves and seed boxes are not recorded from the peats above zoneDYF-c. Also, neither Trichophorum (syn. Scirpus) nor Empetrum is recorded (as separatelyidentiWed taxa) in the macrofossil records from this zone, although both are recorded asgrowing in the wider area, if not at the sampling point.
Charcoal data
Charcoal is apparently more abundant in horizons at c. 28 cm depth, coincident with a peakin the representation of Eriophorum vaginatum epidermis. There is, however, no apparentincrease in charcoal abundance that relates to the rise in M. caerulea epidermis in the top10 cm of the proWle.
Drygarn Fawr ProWle DRY D&A, plant macrofossil data
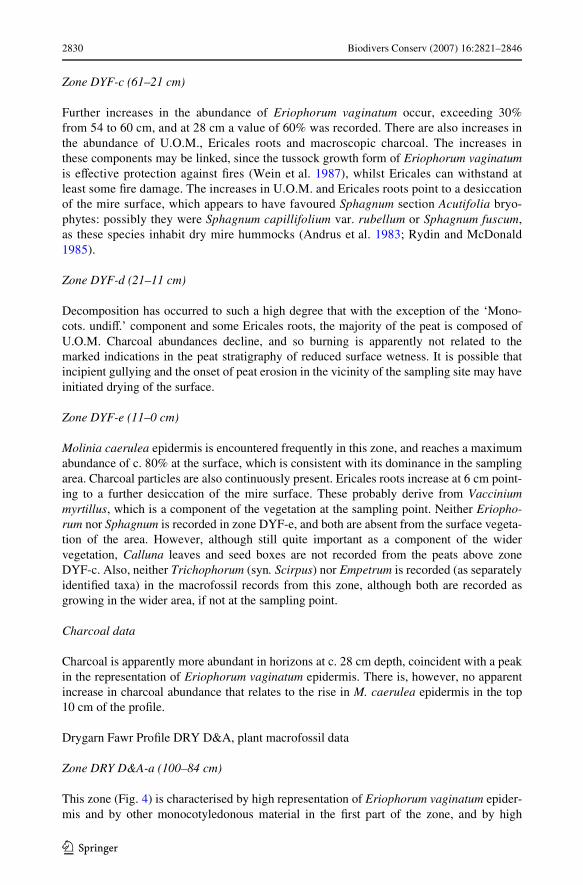
Zone DRY D&A-a (100–84 cm)
This zone (Fig. 4) is characterised by high representation of Eriophorum vaginatum epider-mis and by other monocotyledonous material in the Wrst part of the zone, and by high
1 C

Biodivers Conserv (2007) 16:2821–2846 2831
Fig
.4P
lant
mac
rofo
ssil
dia
gram
for
proW
le D
RY
D&
A, D
ryga
rn F
awr
Depth (cm)
0 5 10 15 20 25 30 35 40 45 50 55 60 65 70 75 80 85 90 95 100
2040
6080
%
U.O.M
.
20%Eric
alesro
ots
5Callun
avu
lgaris
leave
s
5Callun
avu
lgaris
seed
boxe
s
5Erica
tetra
lixlea
ves
2040
60%
Mon
ocot
s.un
diff.
20%Erio
phor
umva
ginat
umro
ots
2040
6080
%
Erioph
orum
vagin
atum
epide
rmis 5Erio
phor
umva
ginat
umsp
indles
2040
6080
100
%
Moli
niaca
erule
aep
iderm
is
5 %Aulaco
mniu
mpa
lustre
5 %Polytri
chum
alpes
tre
5 %Hypnu
mcu
pres
sifor
me
2040
%
Sphag
num
leave
s
5 %Sphag
num
stem
s
2040
%
Sphag
num
Acutifo
lia
secti
on
5Sphag
num
spor
eca
psule
s
2040
<15,
625
µm2
20
15,6
25-6
2,50
0mµ
2
510
62,5
00-0
.25
mm2 20
0.25
-1m
m2
510
1-4
mm2
Pla
ntm
acro
foss
ilsC
harc
oalf
ragm
ents
DR
YD
&A
-e
DR
YD
&A
-d
DR
YD
&A
-c
DR
YD
&A
-b
DR
YD
&A
-a
Zon
e
1 C
2832 Biodivers Conserv (2007) 16:2821–2846
U.O.M. subsequently. There are very few Sphagnum remains. The evidence suggests vege-tation dominance at least locally by Eriophorum.
Zone DRY D&A-b (84–52 cm)
Although there are Eriophorum roots, there were few remains identiWed of E. vagina-tum epidermis here. Sphagnum leaves, principally of Sphagnum section Acutifolia,dominate this zone. In the DYF proWle it was suggested that possibly these were Sphag-num capillifolium var. rubellum or Sphagnum fuscum, as these species inhabit dry mirehummocks, and it is conceivable that the same interpretation is valid here; the presencein mid-zone of the moss Aulacomnium palustre, plus a record of Hypnum cupressi-forme, would be consistent with this interpretation (presumably, this is H. cuppressi-forme var. ericetorum Br. Eur., syn. H. jutlandicum Holmenand Warncke; see Smith1978, p. 652).
Zone DRY D&A-c (52–26 cm)
This zone is separated from the previous on the basis of the resurgence in records of Erio-phorum vaginatum epidermis. Initially, the representation of Sphagnum section Acutifoliacontinues, but identiWed remains of this taxon are absent in the second half of the zone, inwhich there is an increase of charcoal records in the mid-range size-class.
Zone DRY D&A-d (26–8.5 cm)
UndiVerentiated Monocot remains dominate this zone. Recorded in the lower part of thezone are epidermal remains of M. caerulea. Charcoal records in the low- and mid-sizeranges are more abundant than previously.
Zone DRY D&A-e (8.5–0 cm)
Particularly noticeable is the dramatic rise in records of epidermal remains of M. caeruleaduring this zone; the surface horizon demonstrates a particular abundance. There are norecords of ericaceous taxa in this zone. Charcoal, especially in the smallest size class, isparticularly abundant in the topmost horizon, which might indicate very recent Wre eventsin the area, if not directly at the sampling site.
Charcoal data
Charcoal in the mid-size class is fairly abundant in the penultimate zone, and before the risein Molinia records. As at proWle DRY, there is no apparent increase in charcoal abundancethat relates directly to the rise in M. caerulea epidermis in the top 10 cm of the proWle.
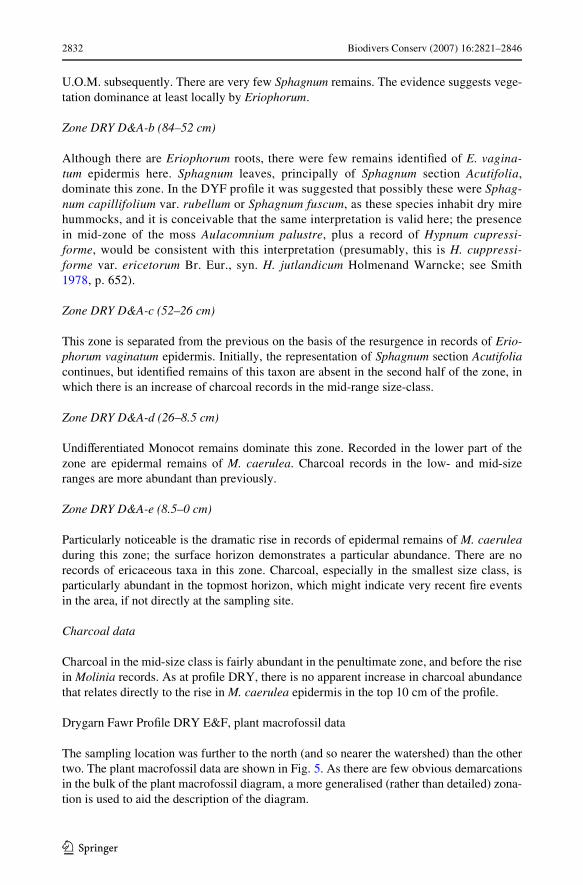
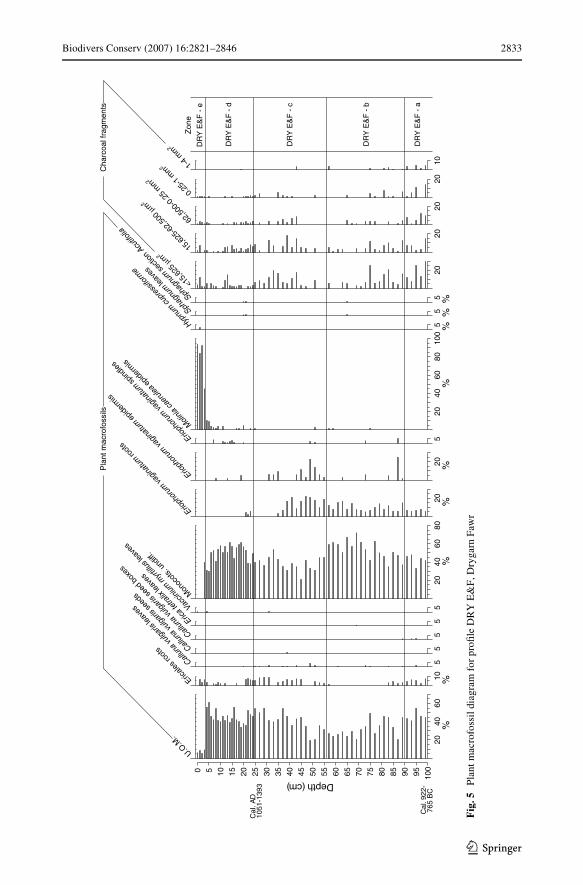
Drygarn Fawr ProWle DRY E&F, plant macrofossil data
The sampling location was further to the north (and so nearer the watershed) than the othertwo. The plant macrofossil data are shown in Fig. 5. As there are few obvious demarcationsin the bulk of the plant macrofossil diagram, a more generalised (rather than detailed) zona-tion is used to aid the description of the diagram.
1 C
Biodivers Conserv (2007) 16:2821–2846 2833
0 5 10 15 20 25 30 35 40 45 50 55 60 65 70 75 80 85 90 95 100
Depth (cm)
2040
60%
U.O.M
.
10 %Ericale
sroot
s
5Callun
avu
lgaris
leave
s
5Callun
avu
lgaris
seed
s
5Callun
avu
lgaris
seed
boxe
s
5Erica
tetra
lixlea
ves
5Vaccin
iumm
yrtill
uslea
ves
2040
6080
%
Mon
ocot
s.un
diff.
20 %
Erioph
orum
vagin
atum
root
s20 %
Erioph
orum
vagin
atum
epide
rmis
5Erioph
orum
vagin
atum
spind
les
2040
6080
100
%
Moli
niaca
erule
aep
iderm
is
5 %Hypnu
mcu
pres
sifor
me
5 %Sphag
num
leave
s
5 %Sphag
num
Acutifo
lia
secti
on
20
<15,
625
mµ2
20
15,6
25-6
2,50
0µm
2
20
62,5
00-0
.25
mm2 20
0.25
-1m
m2
101-4
mm2
Pla
ntm
acro
foss
ilsC
harc
oalf
ragm
ents
DR
YE
&F
-e
DR
YE
&F
-d
DR
YE
&F
-c
DR
YE
&F
-b
DR
YE
&F
-a
Zon
e
Cal
.AD
1051
-139
3
Cal
.922
-76
5B
C
Fig
.5P
lant
mac
rofo
ssil
dia
gram
for
proW
le D
RY
E&
F, D
ryga
rn F
awr
1 C
2834 Biodivers Conserv (2007) 16:2821–2846
Zone DRY E&F-a (100–90 cm)
A high proportion (>40%) of U.O.M. is a feature of this zone, as is the absence of Eriopho-rum vaginatum epidermis. Charcoal is fairly frequent in all size classes.
Zone DRY E&F-b (90–56 cm)
High representation of undiVerentiated monocotyledonous remains and a paucity of Ericalesroots are two characteristics of this rather heterogeneous zone. There are sporadic remains ofEriophorum vaginatum epidermis and occasional epidermal fragments of M. caerulea.
Zone DRY E&F-c (56–24.5 cm)
Lower representation of Monocots undiV. is the principal feature of this zone. There is a peakin representation of epidermal remains of Eriophorum vaginatum in the lower part of thezone; later, representation of roots of this taxon declines. Charcoal records increase in theupper part of the zone. There are records of M. caerulea epidermis from 25 cm depth.
Zone DRY E&F-d (24–3.5 cm)
This zone has fairly high representation of both U.O.M. and undiVerentiated monocotyle-donous remains. There is sporadic representation of M. caerulea epidermis.
Zone DRY E&F-e (3.5–0 cm)
This zone is distinct from those below in having very high and increasing representation ofM. caerulea epidermis, and by low U.O.M. values.
Charcoal data
Charcoal records, particularly in the smaller size classes, are fairly abundant in the Wrstzone and in the Wrst half of zone DRY E&F-b. Charcoal records resurge, including the mid-size range, halfway through the following zone. Although there are increased numbers ofsmall charcoal particles mid-way through zone DRY E&F-d, just before the rise in Moliniarecords, there is no clear relationship between the charcoal records and the rise of Molinia.
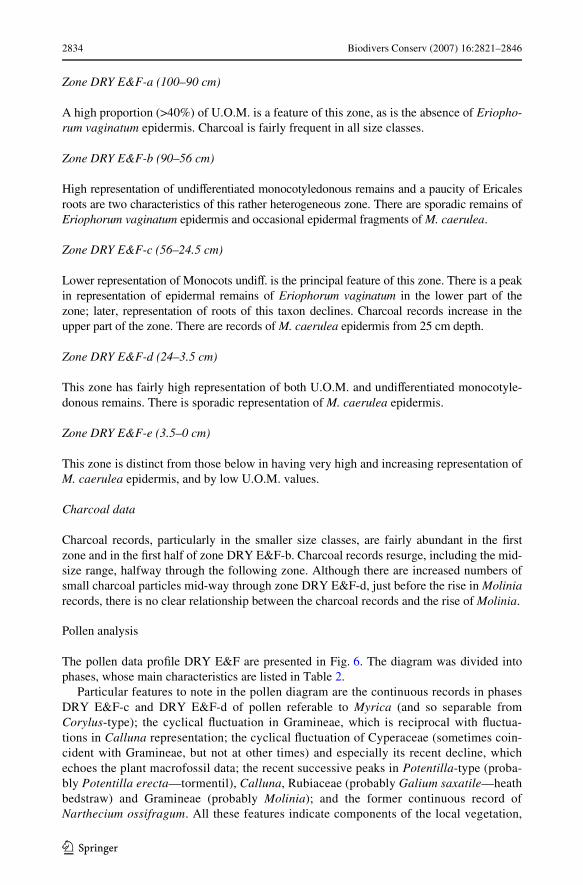
Pollen analysis
The pollen data proWle DRY E&F are presented in Fig. 6. The diagram was divided intophases, whose main characteristics are listed in Table 2.
Particular features to note in the pollen diagram are the continuous records in phasesDRY E&F-c and DRY E&F-d of pollen referable to Myrica (and so separable fromCorylus-type); the cyclical Xuctuation in Gramineae, which is reciprocal with Xuctua-tions in Calluna representation; the cyclical Xuctuation of Cyperaceae (sometimes coin-cident with Gramineae, but not at other times) and especially its recent decline, whichechoes the plant macrofossil data; the recent successive peaks in Potentilla-type (proba-bly Potentilla erecta—tormentil), Calluna, Rubiaceae (probably Galium saxatile—heathbedstraw) and Gramineae (probably Molinia); and the former continuous record ofNarthecium ossifragum. All these features indicate components of the local vegetation,
1 C
Biodivers Conserv (2007) 16:2821–2846 2835
Fig
.6P
olle
n di
agra
m f
or D
RY
E&
F, D
ryga
rn F
awr
5Urtica
5Rumex
undif
f.
5Rumex
acet
osell
a/ac
etos
a
5Planta
gom
ajor/m
edia
10
Planta
golan
ceola
ta
5Planta
goco
rono
pus
2040
60
Gram
ineae
5Labia
tae 5Pot
erium
sang
uisor
ba
5Ranun
culac
eae
5Succis
a 5Filipen
dula 10
Poten
tilla-
type
Campa
nulac
eae
5Rubiac
eae 5
5Polyga
la
20
Cyper
acea
e
0 8 16 24 32 40 48 56 64 72 80 88 96 104
112
120
128
Depth(cm)
Cal
.AD
1051
-139
3
Cal
.922
-76
5B
C
100
200
300
400
(Sph
agnu
m)
5Sparg
anium
-type
5Drose
ra
10
Narth
ecium
ossif
ragu
m
5Anaga
llis 5Pedicu
laris 5Eric
a
5Vaccin
ium
2040
6080
Callun
a
5Empe
trum 5(H
uper
ziase
lago)
5(Oph
ioglos
sum
)
5INDET. 10Cha
rcoa
l
DR
YE
&F
-g
DR
YE
&F
-f
DR
YE
&F
-e
DR
YE
&F
-d
DR
YE
&F
-c
DR
YE
&F
-b
DR
YE
&F
-a
Pha
se
20
Corylu
s
Mer
curia
lispe
renn
is
5Myr
ica
5Sambu
cusnig
ra
5Viburn
um 5Rosac
eae
undif
f.
55(F
ilicale
s) 5(
)
Polypo
dium 10
(
)
Pterid
ium
Centa
urea
nigra
cf.
Centa
urea
cyan
us
5Umbe
llifer
ae 5Mela
mpy
rum
5Stella
ria-ty
pe
5Caryo
phyll
acea
e5
5Compo
sitae
Lig.
5Compo
sitae
Tub.
5Crucif
erae 5Che
nopo
diace
ae
55Can
nabis
sativ
a
5Cerea
lia
5Secale
5Tritic
um
5Artem
isia
DR
YE
&F
-g
DR
YE
&F
-f
DR
YE
&F
-e
DR
YE
&F
-d
DR
YE
&F
-c
DR
YE
&F
-b
DR
YE
&F
-a
Pha
se
20
Querc
us
10
Alnus
5Tilia
5Fraxin
us
5Fagus
5Carpin
us 5Heder
a
5Ilex
5Acer
5Populu
s 5Prunu
s/Sor
bus
5Salix
20
Betula
0 8 16 24 32 40 48 56 64 72 80 88 96 104
112
120
128
Depth(cm)
Cal
.AD
1051
-139
3
Cal
.922
-76
5B
C
5Pinus
5Picea
5Ulmus
1010
1 C
2836 Biodivers Conserv (2007) 16:2821–2846
and imply considerable change through time, but with higher magnitude changes in thelast two phases.
The records of Pinus and Picea towards the top of the diagram indicate recent conif-erous plantations; the Picea records in particular are probably referable to Xowering ofspruce in plantations in central Wales in the Wnal quarter of the 20th Century. Steven-son and Thompson (1993) estimated that a recent decline in Calluna at Llyn Gynon, c.18 km to the northwest, took place at c. AD 1930. The age indications for the declinein Calluna in phase g at Drygarn Fawr are therefore not dissimilar to those at LlynGynon.
Peat humiWcation data
The peat humiWcation data for the three proWles are plotted together in Fig. 7 (gaps in theDYF dataset are where peat had already been removed for radiocarbon dating). Clearly, thepeat haggs no longer possess a functionally distinct acrotelm, but at the time of peat accu-mulation the acrotelm–catotelm boundary would have been more distinct, and would showas a major change to less humiWed peat near the surface.
The data show Xuctuating records in the lower part of the proWles, and a trend to lesshumiWed peat towards the surface, with the greatest change (to high transmission values:at 20 cm depth, in proWle DYF, 14 cm depth in proWle DRY D&A, and 18 cm depth inproWle DRY E&F) indicating either the Little Ice Age, or, conceivably, the previous (i.e.,pre-hagging) catotelm–acrotelm boundary. In reviewing these data, there is no evidencethat a change in climate or local hydrology marks the precise point at which Moliniaabundance increases; however, all the rises in Molinia post-date this major change inpeat humiWcation.
SCP data
The SCP data for the proWles are plotted together in Fig. 8. These data show high valuestowards the surface, with the major rise taking place between 7 and 6 cm depth in proWleDYF; high values below the surface, with the peak value at 2 cm depth for proWle DRYE&F; the Wrst appearance at 10 cm depth, with a major peak at 2 cm depth in proWle DRYD&A. The signiWcance of these data is considered below.
Table 2 Principal features of phases in the pollen diagram (Fig. 6) from DRY E&F (comparisons are madewith earlier phases)
Phase Depth (cm) Features
g 7–0 High Gramineae; declining Calluna values; Rubiaceae and Vaccinium present; rise in Pinus values; appearance of Picea
f 22–7 Higher Cyperaceae; peak in Potentilla-type values; declining Corylus values
e 54–22 High Calluna; declining, then rising Gramineae
d 70–54 Higher Gramineae; declining Calluna; peak in Empetrum values
c 94–70 Low Gramineae; presence of Myrica, Narthecium
b 122–94 Reduced Gramineae; increased Cyperaceae
a 128–122 High Gramineae; low Cyperaceae; presence of Succisa
1 C

Biodivers Conserv (2007) 16:2821–2846 2837
Interpretation
Determining recent vegetation change
Using plant macrofossils
Each of the plant macrofossil diagrams shows towards the top of the proWle a distinctchange in the proportion of macrofossil components. This provides a priori evidence of asigniWcant recent vegetation shift at all sites. However, plant macrofossils in the near-surface horizons (the acrotelm) will generally be less humiWed and so will be more easilyrecognisable than in the catotelm. This can lead to particular taxa having relatively fresh
Fig. 7 Peat humiWcation data for the three proWles, Drygarn Fawr
Profile DYF
0
10
20
30
40
50
60
70
00 20 40 60 80 100 120
10
20
30
40
50
60
70
0
10
20
30
40
50
60
70
Depth (cm)
Ligh
tTra
nsm
issi
om(%
)
Profile DRY D&A
Profile DRY E&F
1 C

2838 Biodivers Conserv (2007) 16:2821–2846
macrofossils in the near-surface horizons, but the same macrofossil types would not be soeasily recognisable at depth as subfossils. So, a vegetation shift towards the surface mightbe indicated by the macrofossil data, when in reality none had occurred. To examinewhether this is the case here, it is necessary to examine closely the penultimate plantmacrofossil zone, to see whether there are identiWable components present there that areabsent from the topmost zone. If so, then a deWnite vegetation shift is indicated.
Fig. 8 SCP data for the three proWles, Drygarn Fawr
0
2
4
6
8
10
12
0 5 10 15 20 25 30 35 40
Profile DRY D&A
SCP count (gDM )-1
Dep
th(c
m)
0 50 100 150 200 250 300
0
2
4
6
8
10
12
14
16
18
20
22
SCP count (gDM )-1
Dep
th(c
m)
Profile DYF24
0 20 40 60 80 100
Dep
th(c
m)
SCP count (gDM )-1
0
2
4
6
8
10
12
Profile DRY E&F14
1 C

Biodivers Conserv (2007) 16:2821–2846 2839
Using pollen data
Pollen analysts consider that, in peat, the preservation of most pollen types is likely to besimilar in both acrotelm and catotelm; with some notable exceptions (e.g., Juncaceaepollen), there is thought to be relatively little diVerential destruction between pollen typesin acidic mires (Moore et al. 1991). This is fundamentally diVerent from the situation thatdevelops with plant macrofossils, in which some elements decay relatively easily (Coulsonand ButterWeld 1978) and so (a) are not likely to be preserved in the catotelm at all, or (b)may only be preserved in conditions of low humiWcation, or (c) are preserved but in much-reduced proportion. With pollen data, continuance of the same vegetation type should gen-erate similar pollen spectra in the catotelm from those in the acrotelm. If pollen spectra aremarkedly dissimilar between horizons, then this suggests a vegetation change. So, conWr-matory evidence of a vegetational shift can come from the pollen evidence, in that anymajor pollen analytical shift in near-surface horizons would provide independent conWrma-tion of a vegetation change. Here, the pollen diagram clearly indicates signiWcant vegeta-tion change towards the top of the proWle.
Dating the change
The question then remains as to whether any indicated vegetation shift is very recent in ori-gin. Here, the radiocarbon dating, SCP and pollen data all need to be considered. The radio-carbon dating is imprecise, but suggests a recent vegetation change in the two datedproWles.
The SCP data indicate both the start of the industrial revolution (shown by the consistentappearance of SCPs in the proWle) and the period of maximum generation and dispersal ofcarbonaceous particles (shown by the peak value). Rose et al. (1995) suggest that for sitesin the United Kingdom the SCP record generally started in the mid-nineteenth century andthat this reXects the combustion of coal during the industrial revolution. Variability in thestarting date for SCP deposition was attributed to the inception of local industries. A rapidincrease in SCP concentration usually dates to the 1950s or the 1960s, although it can com-mence as early as the 1940s (Llyn Glas, Wales; Lough Muck, Ireland). There is also a char-acteristic peak and decline in all of the lake SCP proWles they examined, which they relatedrespectively to the coal consumption maximum in the 1970s and the introduction of emis-sion control measures from the mid-1970s onwards.
SCP proWles in peats
For the peat proWles analysed in this study, if the maximum concentration of SCPs is in thesurface horizon (see proWle DYF), then the post-1970s decline in SCPs has not beenrecorded; it suggests that a concentration of SCPs has built up at the surface and that themire is no longer actively peat-forming. If the major indicated vegetational shift shown byplant macrofossil or pollen data occurs after the consistent appearance of SCPs in the pro-Wle, then the inference can be drawn that the vegetational shift post-dates the start of theindustrial revolution. It might be expected that all the peat proWles would experience thesame or very similar SCP loading. However, other factors, including the nature of the localvegetation and onset of hagging, would inXuence the precise dynamics of SCP incorpora-tion into the peat proWle. Although the SCP proWles show some variation, their overall formis similar.
1 C

2840 Biodivers Conserv (2007) 16:2821–2846
Recent vegetation change at Drygarn Fawr
For proWle DYF, the rise in Molinia epidermis occurs after the onset of SCP accumulation,but well before the peak in SCP values at the surface. Molinia appears consistently at hori-zons before the high SCP values from 4 to 2 cm depth. The last marked change in percent-age light transmission values is at 7 cm (see Fig. 7), and the sharp drop in U.O.M. values isshown between 6 and 8 cm depth (Fig. 3). These both suggest that, before recent peat ero-sion resulted in severe hagging, the acrotelm–catotelm boundary was probably equivalentto c. 7 cm depth. So, the rise in Molinia records in this proWle is not an artefact of catotelm/acrotelm changes, but is a real vegetation shift that occurred after the start of the industrialrevolution, but well before the 1960s.
For proWle DRY D&A, the rise in Molinia values occurs after the start of SCP records.However, it also occurs after the start of the rise in percentage transmission values (at12 cm; Fig. 7), which leaves open the possibility that the rise in Molinia remains is merelyan artefact of their being more recognisable in the relatively unhumiWed peat towards thesurface. Nevertheless, only in the surface horizon is the proportion of U.O.M. signiWcantlyreduced. Comparison of the plant macrofossil (Fig. 4) and SCP (Fig. 8) data suggests thatMolinia started to increase locally around the beginning of the 20th Century, but that theproportion of Molinia locally has continued to increase, even post-1960. There is also evi-dence (in zone DRY D&A-d, Fig. 4) for an earlier (pre-20th Century) presence of Molinia,albeit apparently in much lower proportion.
For proWle DRY E&F, most, but by no means all of the Molinia remains wereencountered in the relatively unhumiWed peat towards the surface. The macrofossil evi-dence for Molinia is relatively long-standing (compare Fig. 5 with Fig. 3), but only inthe topmost zone does the proportion of Molinia macrofossils rise to very high values.Comparison of the plant macrofossil data (Fig. 5) with the SCP data (Fig. 8) from thisproWle shows that there was clearly a local presence of Molinia before the industrialrevolution, but that its apparent major rise took place in the 20th Century. This evidenceis reinforced by the pollen data, which show an unprecedented rise in Gramineae(Poaceae) values to over 40% of total land pollen in the top 4 cm, in which Picea pol-len, attributable to late 20th Century plantations, is recorded. There is little charcoalevidence for Wre having been a factor in this vegetation shift. Rather, other factors seemto have been responsible.
In large part, then, the pollen data are supportive of the plant macrofossil data, butalso complement the QLC technique in providing additional information. For example,there is pollen evidence for the earlier presence of taxa that are now locally extinct,including M. gale; these long-term data counter the claim (in Preston et al. 2002) that theupland population of M. gale is stable, as the species is now absent from most of uplandcentral Wales.
A noticeable feature of the plant macrofossil diagrams is the decline and disappearanceof Eriphorum vaginatum. This occurs before the ascent of Molinia, which argues against acompetition eVect. Drying, induced by peat erosion, may have been responsible.
Discussion
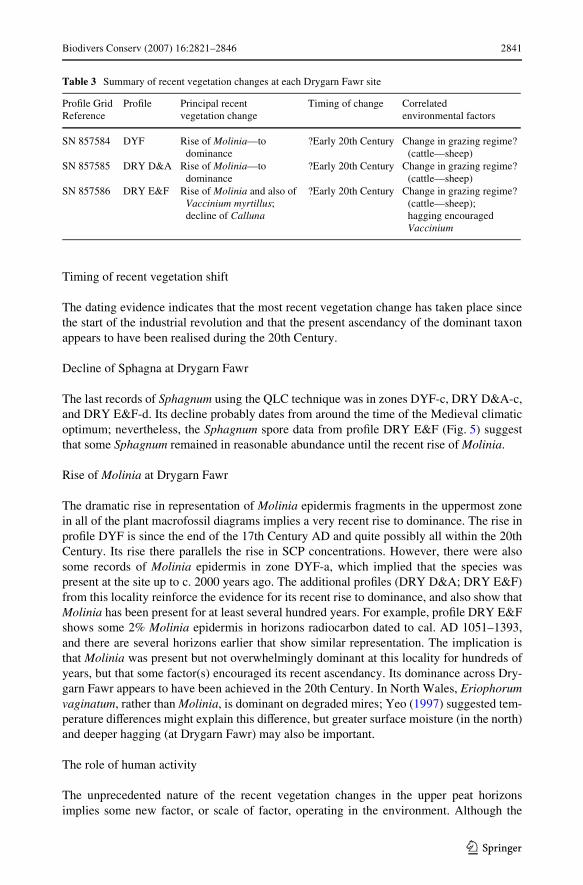
A simpliWed summary of recent vegetation changes at each site is presented in Table 3.Particular points for discussion are considered below.
1 C
Biodivers Conserv (2007) 16:2821–2846 2841
Timing of recent vegetation shift
The dating evidence indicates that the most recent vegetation change has taken place sincethe start of the industrial revolution and that the present ascendancy of the dominant taxonappears to have been realised during the 20th Century.
Decline of Sphagna at Drygarn Fawr
The last records of Sphagnum using the QLC technique was in zones DYF-c, DRY D&A-c,and DRY E&F-d. Its decline probably dates from around the time of the Medieval climaticoptimum; nevertheless, the Sphagnum spore data from proWle DRY E&F (Fig. 5) suggestthat some Sphagnum remained in reasonable abundance until the recent rise of Molinia.
Rise of Molinia at Drygarn Fawr
The dramatic rise in representation of Molinia epidermis fragments in the uppermost zonein all of the plant macrofossil diagrams implies a very recent rise to dominance. The rise inproWle DYF is since the end of the 17th Century AD and quite possibly all within the 20thCentury. Its rise there parallels the rise in SCP concentrations. However, there were alsosome records of Molinia epidermis in zone DYF-a, which implied that the species waspresent at the site up to c. 2000 years ago. The additional proWles (DRY D&A; DRY E&F)from this locality reinforce the evidence for its recent rise to dominance, and also show thatMolinia has been present for at least several hundred years. For example, proWle DRY E&Fshows some 2% Molinia epidermis in horizons radiocarbon dated to cal. AD 1051–1393,and there are several horizons earlier that show similar representation. The implication isthat Molinia was present but not overwhelmingly dominant at this locality for hundreds ofyears, but that some factor(s) encouraged its recent ascendancy. Its dominance across Dry-garn Fawr appears to have been achieved in the 20th Century. In North Wales, Eriophorumvaginatum, rather than Molinia, is dominant on degraded mires; Yeo (1997) suggested tem-perature diVerences might explain this diVerence, but greater surface moisture (in the north)and deeper hagging (at Drygarn Fawr) may also be important.
The role of human activity
The unprecedented nature of the recent vegetation changes in the upper peat horizonsimplies some new factor, or scale of factor, operating in the environment. Although the
Table 3 Summary of recent vegetation changes at each Drygarn Fawr site
ProWle Grid Reference
ProWle Principal recent vegetation change
Timing of change Correlated environmental factors
SN 857584 DYF Rise of Molinia—to dominance
?Early 20th Century Change in grazing regime? (cattle—sheep)
SN 857585 DRY D&A Rise of Molinia—to dominance
?Early 20th Century Change in grazing regime? (cattle—sheep)
SN 857586 DRY E&F Rise of Molinia and also of Vaccinium myrtillus; decline of Calluna
?Early 20th Century Change in grazing regime? (cattle—sheep); hagging encouraged Vaccinium
1 C
2842 Biodivers Conserv (2007) 16:2821–2846
peat humiWcation data show that the peat is less humiWed than previously, this change mayin part reXect the change from catotlem to acrotelm; it explains why some macrofossils aremore abundant towards the surface, but cannot of itself account for all the vegetationchanges noted, nor can recent climate change (howsoever caused) produce the magnitudeof the vegetation change. Therefore, the local role of human activity needs to be consid-ered. In theory, human activity may have inXuenced the recent vegetation change throughone or more of these factors: changes in grazing pressure (Stevenson and Thompson 1993);changes in the grazing type (e.g., cattle to sheep); burning, or changes in burning regime;drainage; nutrient input; other atmospheric input; or combinations of these (Chambers et al.1979). Of the various factors, the role of burning might be thought important and a largeliterature addresses this (see Shaw et al. 1996); however, frequent burning probably couldnot account for the earlier loss of Eriophorum vaginatum, and there is no obvious relation-ship between charcoal records and the rise in Molinia records. Instead, anecdotal evidence(from the local farmer) concerning a change in grazer (from cattle to sheep) at the start ofthe 20th Century at Drygarn Fawr, which coincides with the palaeoecological evidence forthe recent change in vegetation, suggests that the grazing regime may have been particu-larly important (see Grant et al. 1996; Shaw et al. 1996).
Also signiWcant in the rise of Molinia may be increased nutrient input to the sites,either through a more intensive stocking rate—resulting in a general manuring eVect—orthrough atmospheric input of nitrogenous and other pollutants to the nutrient-poor blan-ket mires. Some grasses, including Molinia, are known to respond to elevated nutrientlevels (Heal and Diemont 1983); so the combination of nitrogenous animal manure andatmospheric input (cf. Pitcairn et al. 1995) to the mires will have enhanced its competi-tive ability.
Blanket mire degradation elsewhere
In Wales there are several previous studies that bear upon recent degradation of blanketpeats. At Coed Taf and Cefn Ffordd in upland South Wales (Chambers 1982a, 1983) thereare radiocarbon-dated peats whose pollen records show a marked rise in Gramineae in thelast 140 years, which was attributed by Chambers et al. (1979) to a recent rise to dominanceof Molinia. A similar pattern was shown by the pollen data from Hirwaun Common, inves-tigated during the pilot project (Chambers and Mauquoy 1998). Elsewhere in Wales,research by Blackford (1990) and by Ellis (unpublished) on the Migneint, north Wales, hasshown evidence for recent vegetation degradation.
The degradation of British blanket mires, particularly the paucity of Sphagna in Pen-nine blanket bogs allegedly caused by sulphurous atmospheric deposition, has long beenrecognised, and the problems of a depauperate Xora and of peat erosion have been amplydemonstrated there by Tallis (1997). The spread of Molinia, which has been particularlyapparent in the present study, has been seen in uplands in England, including the PeakDistrict and Exmoor (Todd, 1996; Marrs et al. 2004). As Chambers et al. (1999) noted,its spread is not conWned to blanket mire, nor merely to Britain: it has reportedly beenincreasing, especially at the expense of heather, in a range of heath and mire habitats,including Danish and Dutch heaths (Hansen 1976; Berendse et al. 1994) and disturbedmires in Belgium (Damblon 1992). At sites on central Exmoor its rise to dominance wasagain found to be apparently relatively recent (Chambers et al. 1999), although at onesite (Lanacombe) its dominance may well be connected with attempts to drain the localarea.
1 C

Biodivers Conserv (2007) 16:2821–2846 2843
Implications for management
The action plan for blanket bog, published as part of the UK Biodiversity Action Plan ini-tiative (UK Biodiversity Group 1999), sets ambitious targets for the restoration ofdegraded blanket mire, which in the Welsh uplands is estimated to cover 32,000 ha (Jones2003). The development of appropriate restoration measures requires information on thechronology and causation of degradation, both of which are likely to vary between local-ities. The present study has demonstrated major recent directional changes in blanketmire vegetation in the study area, but has also indicated regional extinctions of particularspecies. The earlier attested presence of Myrica and the recent sequence of changesshown in the later phases of the pollen diagram suggest the present degraded vegetation isconsiderably diVerent from that present c. 2000 or even 500 years ago. So, by using thesepalaeoecological precedents a much more diverse vegetation could in theory be the targetfor this locality. Indeed, the recent rise to dominance of Molinia at Drygarn Fawr sug-gests that management to reduce its abundance is not seeking to reverse an ingrained,long-established dominance. However, there is an earlier loss of or lack of evidence forabundant Sphagna, which suggests there might be limited expectations for an earlyexpansion of this element of the vegetation. The key may be the gullying and hagging,which militates against Sphagna by drying out the upstanding haggs; whilst gullying maynot be the primary causal factor in the present pre-eminence of Molinia, it also does notseem to inhibit the growth of this species.
Conclusions
Palaeoecological data from Drygarn Fawr suggest that although earlier changes in mirevegetation were evident in all proWles, there was a more marked vegetational shift rela-tively recently that led to the present overwhelming dominance of M. caerulea. Althoughthe macrofossil data might exaggerate the degree to which the vegetation has changedrecently, owing to the proportion of relatively fresh macrofossils in the acrotelm, pollendata apparently conWrm the unprecedented ascendancy of Molinia. Of various potentialcausal factors, a change in grazing regime, coupled with nutrient enrichment (rather thanburning), seems the most plausible explanation for the recent vegetation change in thislocality.
Palaeoecological data can provide valuable information not only for trackingregional vegetation trends and species extinctions, but also for local site managementthrough providing information on the timescale, nature and causation of vegetation deg-radation.
In order to ascertain the range of possible restoration targets for the vegetation ofblanket mires elsewhere, both earlier and very recent vegetation changes would repayinvestigation—through multiple, dated cores to track the extinctions and directionalchanges—to ascertain their previous mire Xora and so indicate possible restorationtargets.
Acknowledgements Research was carried out under CCW contract number FC 73-01-172 ‘Recent humanimpact on Welsh Blanket bogs’, as a follow-up to a pilot study of the same name and contract number. Wethank Chris Friend, for Weld and laboratory assistance; Charlotte Cook, for laboratory assistance; the NationalTrust and the Elan Trust for site access; and Marcus Yeo, for commissioning the work, and for Weld assistanceand information on the Weld areas.
1 C
2844 Biodivers Conserv (2007) 16:2821–2846
References
Aaby B (1976) Cyclic climatic variations in climate over the last 5,500 years reXected in raised bogs. Nature263:281–284
Aaby B (1986) Palaeoecological studies of mires. In: Berglund BE (ed) Handbook of holocene palaeoecologyand palaeohydrology. John Wiley, Chichester, pp 145–164
Aaby B, Tauber H (1975) Rates of peat formation in relation to degree of humiWcation and local environment,as shown by studies of a raised bog in Denmark. Boreas 4:1–17
Andrus RE, Wagner DJ, Titus JE (1983) Vertical zonation of Sphagnum mosses along hummock-hollow gra-dients. Can J Bot 61:3128–3139
Barber KE (1976) History of vegetation. In: Chapman SB (ed) Methods in plant ecology. Blackwell, Oxford,pp 5–83
Barber KE, Chambers FM, Maddy D, Stoneman R, Brew JS (1994) A sensitive high resolution record of lateHolocene climatic change from a raised bog in northern England. Holocene 4:198–205
Barber KE, Battarbee RW, Brooks SJ, Eglinton G, Haworth EY, OldWeld F, Stevenson AC, Thompson R,Appleby P, Austin WN, Cameron N, Ficken KJ, Golding P, Harkness DD, Holmes J, Hutchinson R,Lishman JP, Maddy D, Pinder L CV, Rose N, Stoneman R (1999) Proxy records of climate change inthe UK over the last two millennia: documented change and sedimentary records from lakes and bogs.J Geol Soc London 156:369–380
Barber KE, Maddy D, Rose N, Stevenson AC, Stoneman RE, Thompson R (2000) Replicated proxy-climatesignals over the last 2000 years from two distant UK peat bogs: new evidence for regional palaeoclimaticteleconnections. Quat Sci Rev 19:481–487
Berendse F, Schmitz M, de Visser W (1994) Experimental manipulation of succession in heathland ecosys-tems. Oecologia 100:38–44
Blackford JJ (1990) Blanket Mires and climate change: a palaeoecological study based on peat humiWcationand microfossil analyses. Unpublished Ph.D. thesis, University of Keele
Blackford JJ (1993) Peat bogs as sources of proxy climate data: past approaches and future research.In: Chambers FM (ed) Climate change and human impact on the landscape. Chapman and Hall, London,pp 47–56
Blackford JJ, Chambers FM (1993) Determining the degree of peat decomposition in peat-based palaeocli-matic studies. Int Peat J 5:7–24
Burn AM (1981) Upland Vegetation Survey Site Report No. 3—Abergwesyn (Elenydd). Nature ConservancyCouncil, Bangor
Chambers FM (1982a) Two radiocarbon-dated pollen diagrams from high-altitude blanket peats in SouthWales. J Ecol 70:445–459
Chambers FM (1982b) Environmental history of Cefn GwernVrwd, near Rhandirmwyn, Mid-Wales. NewPhytol 92:607–615
Chambers FM (1983) Three radiocarbon-dated pollen diagrams from upland peats north-west of MerthyrTydWl, South Wales. J Ecol 71:475–487
Chambers FM, Mauquoy DM (1998) Recent human impacts on Welsh blanket bogs. Countryside Council forWales Contract Science Report no. 301. CCW, Bangor
Chambers FM, Dresser PQ, Smith AG (1979) Radiocarbon dating evidence on the impact of atmosphericpollution on upland peats. Nature 282:829–831
Chambers FM, Mauquoy D, Todd PA (1999) Recent rise to dominance of Molinia caerulea in environmen-tally sensitive areas: new perspectives from palaeoecological data. J Appl Ecol 26:719–733
Clapham AR, Tutin TG, Moore DM (1987) Flora of the British Isles, 3rd edn. Cambridge University Press,Cambridge
Clark JS (1988) Particle motion and the theory of charcoal analysis: source area, transport, deposition andsampling. Quat Res 30:67–80
Clymo RS (1984) The limits to peat bog growth. Philos Trans R Soc Lond B 327:331–338Coulson JC, ButterWeld J (1978) An investigation of the biotic factors determining the rates of plant decom-
position on blanket bog. J Ecol 51:443–459Damblon F (1992) Palaeobotanical analysis of Eriophorum and Molinia tussocks as a means of reconstructing
recent history of disturbed mires in the Haute-Ardenne, Belgium. Rev Palaeobot Palynol 75:273–288Farragher MA (1974) Poaceae—Irish members. Part 5 Anatomy. Sci Proc R Dublin Soc Ser A 5:159–198Grant SA, Torvell L, Common TG, Sim EM, Small JL (1996) Controlled grazing studies on Molinia grass-
land: eVects of diVerent seasonal patterns and levels of defoliation on Molinia growth and responses ofswards to contolled grazing by cattle. J Appl Ecol 33:1267–1280
GriYn JJ, Goldberg ED (1981) Sphericity as a characteristic of solids from fossil fuel burning in a Lake Mich-igan sediment. Geochim Cosmochim Acta 45:763–769
1 C
Biodivers Conserv (2007) 16:2821–2846 2845
Grimm E (1991) TILIA and TILIAGRAPH. Illinois State Museum, IllinoisGrosse-Braukmann G (1972) Über pXanzliche Makrofossilien mitteleuropaischer Torfe. I. Gewebereste krau-
tiger PXanzen und ihre Merkmale. Telma 2:19–55Grosse-Braukmann G (1974) Über pXanzliche Makrofossilien mitteleuropaischer Torfe. II. Weitere Reste
(Fruchte und Samen, Moose u. a.) und ihre Bestimmungsmoglichkeiten. Telma 4:51–117Grosse-Braukmann G, Streitz B (1992) Über pXanzliche Makrofossilien mitteleuropaischer Torfe. III. Fruc-
hte, Samen und einige Gewebe (Fotos von fossilen PXanzenresten). Telma 22:53–102Hansen K (1976) Ecological studies in Danish heath vegetation. Dansk Bot Arkiv 31:7–116Heal OW, Diemont WM (1983) Raised nutrient levels change heathland into grassland. Vegetatio 53:113–
120Ingram HAP (1978) Soil layers in mires: function and terminology. J Soil Sci 219:224–227Jones PS (2003) Blanket bog. In: Jones PS, Stevens DP, Blackstock TH, Burrows CR, Howe EA (eds) Priority
habitats of Wales—a technical guide. Countryside Council for Wales, BangorKatz NJ, Katz SV, Skobeyeva EI (1977) Atlas of plant remains in peats (in Russian). Nauka, MoscowLageard JGA, Chambers FM, Grant ME (1994) ModiWed versions of a traditional peat cutting tool to improve
Weld sampling of peat monoliths. Quat Newslett 74:10–15MacDonald GM, Larsen CPS, Szeicz JM, Moser KA (1991) The reconstruction of Boreal Forest Wre history
from lake sediments: a comparison of pollen, sedimentological and geochemical indices. Quat Sci Rev10:53–71
Marrs RH, Phillips JDP, Todd PA, Ghorbani J, Le Duc MG (2004) Control of Molinia caerulea on uplandmoors. J Appl Ecol 41:398–411
Moore PD, Webb JA, Collinson M (1991) Pollen analysis, 2nd edition. Blackwell ScientiWc, OxfordOverbeck F (1947) Studien zur Hochmoorentwicklung in Niedesachsen und die Bestimmung der HumiWezie-
rung bei stratigraphish-pollenanalytischen Moor untersuchungen. Planta Archiv für wissenschaftl.Botanik 35:Hft 1/2
Pitcairn CER, Fowler D, Grace J (1995) Deposition of Wxed atmospheric nitrogen and foliar nitrogen contentof bryophytes and Calluna vulgaris (L.) Hull. Environ Pollut 88:193–205
Preston CD, Pearman DA, Dines TD (eds) (2002) New atlas of the British and Irish Flora. Oxford UniversityPress, Oxford
Renberg I, Wik M (1984) Dating of recent lake sediments by soot particle counting. Verh Int Verein Limnol22:712–718
Renberg I, Wik M (1985) Carbonaceous particles in lake sediments—pollutants from fossil fuel combustion.Ambio 14:161–163
Rodwell JS, Pigott CD, RatcliVe DA, Malloch AJC, Birks HJB, Proctor MCF, Shimwell DW, Huntley JP,Radford E, Wigginton MJ, Wilkins P (1991) British plant communities. Mires and heaths. CambridgeUniversity Press, Cambridge
Rose NL (1990) A method for the extraction of carbonaceous particles from lake sediment. J Paleolimnol3:45–53
Rose NL (1994) A note on further reWnements to a procedure for the extraction of carbonaceous Xy-ash par-ticles from sediments. J Paleolimnol 11:201–204
Rose NL, Harlock S, Appleby PG, Battarbee RW (1995) Dating of recent lake sediments in the United King-dom and Ireland using spheroidal carbonaceous particle (SCP) concentration proWles. Holocene 5:328–335
Rydin H, McDonald AJS (1985) Tolerance of Sphagnum to water level. J Bryol 13:571–578Shaw SC, Wheeler BD, Kirby P, Phillipson P, Edmunds R (1996) Literature review of the historical eVects
of burning and grazing of blanket bog and upland wet heath. English Nature and Countryside Councilfor Wales, report no. 172, Peterborough
Smith AJE (1978) The moss Xora of Britain and Ireland. Cambridge University Press, CambridgeStevenson AC, Thompson DBA (1993) Long-term changes in the extent of heather moorland in upland
Britain and Ireland: palaeoecological evidence for the importance of grazing. Holocene 3:70–76Stuiver M, Reimer PJ (1993) Extended 14C data base and revised CALIB 3.0 14C age calibration program.
Radiocarbon 35:215–230Tallis JH (1975) Tree remains in southern Pennine blanket peats. Nature 256:482–484Tallis JH (1997) The Southern Pennine experience: an overview of blanket mire degradation. In: Tallis JR,
Meade R, Hulme PD (eds) Blanket mire degradation: causes, consequences and challenges. MacaulayLand Use Research Institute (for BES), Aberdeen, pp 7–15
Tallis JR, Meade R, Hulme PD (eds) (1997) Blanket mire degradation: causes, consequences and challenges.Macaulay Land Use Research Institute (for BES), Aberdeen
1 C

2846 Biodivers Conserv (2007) 16:2821–2846
Todd PA (1996) The MAFF Molinia study: control of purple moorgrass (Molinia caerulea (L.) Moench) inheather (Calluna vulgaris) moorland after reduction in sheep grazing. The Heather Trust Annual Report(1996), pp 13–16
UK Biodiversity Group (1999) UK Biodiversity Group, Tranche 2 Action Plans, vol. 6, terrestrial and fresh-water species and habitats. English Nature, Peterborough
Watson L, Dallwitz MJ (1992) onwards. Grass genera of the world: descriptions, illustrations, identiWcation,and information retrieval; including synonyms, morphology, anatomy, physiology, phytochemistry,cytology, classiWcation, pathogens, world and local distribution, and references. http://biodiver-sity.uno.edu/delta/. Version: 18th August 1999
Wein RW, Burzynski MP, Sreenisva BA, Tolonen K (1987) Bog proWle evidence of Wre and vegetationdynamics since 3000 years BP in the Acadian Forest. Can J Bot 65:1180–1186
Yeo M (1997) Blanket mire degradation in Wales. In: Tallis JR, Meade R, Hulme PD (eds) Blanket miredegradation: causes, consequences and challenges. Macaulay Land Use Research Institute (for BES),Aberdeen, pp 101–115
1 C