recent and upcoming changes to the national weather ...
8
1A.3 RECENT AND UPCOMING CHANGES TO THE NATIONAL WEATHER SERVICE’S UPPER AIR NETWORK *Ryan N. Brown and Daniel Brewer CyberData Technologies, Inc. Sterling, VA Hiram Escabi, Jr. National Weather Service, Office of Observations Silver Spring, MD 1.0 INTRODUCTION The National Weather Service (NWS) Upper Air Observation Program oversees the radiosonde observations completed at the 92 upper air sites across the Continental United States (CONUS), Pacific and Alaska Regions, along with supporting the 10 upper air stations located in the Caribbean. The radiosonde observations form the backbone of operational forecasts, National Hurricane Center (NHC) forecasts and upper air analyses, which support the NWS mission to protect life and property. The radiosonde observations also serve as the "ground truth" to assist in the verification of other observing platforms such as satellite temperature and moisture retrievals. In 2005, the Radiosonde Replacement System (RRS) was first implemented into field operations to replace its antiquated counterpart, Microcomputer Automatic Radiotheodolite (MicroART), which had been in operation since the late 1980s. Both of these systems operated at the 1680 MHz center frequency, which was the dominant frequency within the NWS network. In recent years, the NWS has made strides to change the operational frequencies of its systems over to the 403 MHz frequency band, which is utilized by the majority of upper air stations across the world. This change is being pursued due to the sale of the 1680 MHz band. 1.1. 403 MHz in the Upper Air Network 403 MHz radiosondes have been in the NWS upper air network for over 5 years, but only at a few locations. In 2010, the NWS began administrating a site in Wallops Island, VA which had previously been managed by National Aeronautics and Space Administration (NASA). Since the system performed with minimal issues, it was also installed in Kodiak, AK as a cheaper solution than the possible repair costs of the current facility due to perceived structural concerns. *Corresponding author address: Ryan N. Brown, 43741 Weather Service Rd., Sterling, VA 20166; E-Mail: [email protected] The first instance of a changeover on a larger scale from the 1680 MHz to the 403 MHz upper air system in the NWS network was with the Cooperative Hurricane Upper Air Stations (CHUAS) Radiosonde Observations System (CROS) during the winter of 2015 into the spring of 2016. Since the changeover, the sites have become more reliable as there are fewer hardware components with the potential for failure, and an upgrade in the functionality of the software. In addition to the frequency changeover, the CHUAS network switched over from radiosondes with Radio Direction Finding (RDF) generated winds to radiosondes with Global Position System (GPS) generated winds. The second instance of the changeover to the 403 MHz center band was with the Transitional Radiosonde Observing System (TROS). Within the past year, the NWS transitioned select upper air stations to the 403 MHz systems due to the launching of the Geostationary Operational Environmental Satellite-R series (GOES-R) satellite, now named GOES-16. Eight upper air stations are located in close proximity to the GOES-16 downlink stations, and it was determined the current operational radiosondes could interfere with the satellite downlink. This prompted the NWS to investigate the TROS which was deployed during the fall of 2016 at these sites within the NWS upper air network, utilizing the same system as Wallops Island, VA, and Kodiak, AK. 1.1.1. Cooperative Hurricane Upper Air Stations (CHUAS) Since the late 1950s, the NWS has supported upper air sites within the CHUAS network in the Caribbean. These observations are vital to forecast and warnings of the NHC for the prediction of hurricanes. The current CHUAS stations include Bahamas, Barbados, Belize, Curacao, Dominican Republic, Grand Cayman, Jamaica, San Andres Island, Colombia, St. Maarten, and Trinidad. Most sites release two radiosondes per day for the majority of hurricane season (usually July through November) and scale back to one sounding per day for the remainder of the year. In 2003, the CHUAS network was outfitted with the International Meteorological (InterMet) Systems
-
Upload
khangminh22 -
Category
Documents
-
view
3 -
download
0
Transcript of recent and upcoming changes to the national weather ...

1A.3 RECENT AND UPCOMING CHANGES TO THE NATIONAL WEATHER SERVICE’S UPPER AIR NETWORK
*Ryan N. Brown and Daniel Brewer CyberData Technologies, Inc.
Sterling, VA
Hiram Escabi, Jr. National Weather Service, Office of Observations
Silver Spring, MD
1.0 INTRODUCTION The National Weather Service (NWS) Upper Air Observation Program oversees the radiosonde observations completed at the 92 upper air sites across the Continental United States (CONUS), Pacific and Alaska Regions, along with supporting the 10 upper air stations located in the Caribbean. The radiosonde observations form the backbone of operational forecasts, National Hurricane Center (NHC) forecasts and upper air analyses, which support the NWS mission to protect life and property. The radiosonde observations also serve as the "ground truth" to assist in the verification of other observing platforms such as satellite temperature and moisture retrievals. In 2005, the Radiosonde Replacement System (RRS) was first implemented into field operations to replace its antiquated counterpart, Microcomputer Automatic Radiotheodolite (MicroART), which had been in operation since the late 1980s. Both of these systems operated at the 1680 MHz center frequency, which was the dominant frequency within the NWS network. In recent years, the NWS has made strides to change the operational frequencies of its systems over to the 403 MHz frequency band, which is utilized by the majority of upper air stations across the world. This change is being pursued due to the sale of the 1680 MHz band.
1.1. 403 MHz in the Upper Air Network 403 MHz radiosondes have been in the NWS upper air network for over 5 years, but only at a few locations. In 2010, the NWS began administrating a site in Wallops Island, VA which had previously been managed by National Aeronautics and Space Administration (NASA). Since the system performed with minimal issues, it was also installed in Kodiak, AK as a cheaper solution than the possible repair costs of the current facility due to perceived structural concerns.
*Corresponding author address: Ryan N. Brown, 43741 Weather Service Rd., Sterling, VA 20166; E-Mail: [email protected]
The first instance of a changeover on a larger scale from the 1680 MHz to the 403 MHz upper air system in the NWS network was with the Cooperative Hurricane Upper Air Stations (CHUAS) Radiosonde Observations System (CROS) during the winter of 2015 into the spring of 2016. Since the changeover, the sites have become more reliable as there are fewer hardware components with the potential for failure, and an upgrade in the functionality of the software. In addition to the frequency changeover, the CHUAS network switched over from radiosondes with Radio Direction Finding (RDF) generated winds to radiosondes with Global Position System (GPS) generated winds. The second instance of the changeover to the 403 MHz center band was with the Transitional Radiosonde Observing System (TROS). Within the past year, the NWS transitioned select upper air stations to the 403 MHz systems due to the launching of the Geostationary Operational Environmental Satellite-R series (GOES-R) satellite, now named GOES-16. Eight upper air stations are located in close proximity to the GOES-16 downlink stations, and it was determined the current operational radiosondes could interfere with the satellite downlink. This prompted the NWS to investigate the TROS which was deployed during the fall of 2016 at these sites within the NWS upper air network, utilizing the same system as Wallops Island, VA, and Kodiak, AK. 1.1.1. Cooperative Hurricane Upper Air Stations
(CHUAS) Since the late 1950s, the NWS has supported upper air sites within the CHUAS network in the Caribbean. These observations are vital to forecast and warnings of the NHC for the prediction of hurricanes. The current CHUAS stations include Bahamas, Barbados, Belize, Curacao, Dominican Republic, Grand Cayman, Jamaica, San Andres Island, Colombia, St. Maarten, and Trinidad. Most sites release two radiosondes per day for the majority of hurricane season (usually July through November) and scale back to one sounding per day for the remainder of the year.
In 2003, the CHUAS network was outfitted with the International Meteorological (InterMet) Systems

(IMS)-1500 radiotheodolite tracking system. This system (similar to the Telemetry Receiving System used in the NWS upper air network) allows the sites to use a variety of 1680 MHz radiosondes in conjunction with the tracking system and software. Despite having the capability of using GPS technology to calculate wind data, none of the CHUAS locations utilized GPS enabled radiosondes. While the IMS-1500 is still considered modern technology, the frequent maintenance requirements of the system are due to its complex electronics and moving parts. This, mixed with the isolated locations, presented a logistical burden to the NWS and resulted in down time for sites awaiting repair. Based off of the modified flight schedule, potential to upgrade the radiosondes, and isolation of the sites, the CHUAS network was selected as the first location to receive GRAW Radiosondes GMBH & Co. 403 MHz systems in 2015. In addition to the upgrades, with the new system and availability of data, some of the sites have begun to complete soundings twice a day all year long. 1.1.2. Transitional Radiosonde Observing
System (TROS) Currently, the majority of NWS radiosondes transmit observation data to the radiosonde tracking system using 1680 MHz Radio-Frequency (RF). The NWS needed to replace the 1680 MHz radiosonde tracking system at sites located at or near GOES-16 NOAA downlink sites to prevent interference with the 1679.7 MHz to 1680.1 MHz downlink from the satellite. The TROS serves as a transitional step from the 1680 MHz to 403 MHz frequency band for the NWS upper air Network. The TROS is a complete system of components from Lockheed Martin including; radiosonde, receiving antennae, 403 MHz RF receiver, signal processor, and computer with software for data processing and dissemination. These components operate together to perform radiosonde observations. Prior to the development of this project, frequency studies were conducted which deemed at least eight (8) upper air stations had the potential to interfere with the GOES-16 downlink. Those sites were Sterling, VA, Blacksburg, VA, Miami, FL, Denver, CO, Norman, OK, Topeka, KS, Anchorage, AK, and Lihue, HI. 2.0 EVALUATION AND DEPLOYMENT Prior to going into full operation, the two different 403 MHz systems needed to be evaluated to ensure NWS specification compliance. Once it was deemed the systems met NWS criteria they needed to be installed by knowledgeable personnel. 2.1. Cooperative Hurricane Upper Air Stations
(CHUAS) Radiosonde Observing System (CROS)
Due to the inventory constraints in the CHUAS network, the evaluation of the CROS had to be expedited to ensure no loss of service. The evaluation of the CROS took place during the early summer months at the Sterling Field Support Center (SFSC). The evaluation focused on the functionality of the software which came with the system and the quality of the data reported by the radiosonde. The installation of the CROS was conducted during the 2015/2016 winter months at all of the CHUAS locations (Table 1). Personnel from SFSC and NWS HQ traveled to all of the CHUAS locations to conduct the installation and the training of the system. Following the deployment, SFSC personnel continued to monitor the sites to ensure all data products were being properly disseminated. In the event of system issues, personnel were readily available to help while the sites became more familiar with the new operations. 2.2. Transitional Radiosonde Observing
System (TROS) Due to the time constraint to migrate at least eight (8) sites to the 403 MHz band before GOES-R launched in November 2016, a full technical evaluation to test new vendors not already eligible for a contract award was not performed. Therefore, it was decided to conduct an abbreviated test, titled System Demonstration & Assessment (SD&A), to demonstrate a 403 MHz system already in operation at two remote upper air locations was suitable for operational use at additional stations. The environmental sensor packages on one of the current NWS 1680 MHz radiosondes are the same as the 403 MHz radiosondes, with the exception of the pressure sensor. In addition to a change in the radiosonde, the software package utilized for the TROS was different than that of RWS. The software with the TROS was a Commercial-off-the-Shelf product, which the vendor modified to meet NWS specifications. The overall functionality of the software is similar to that of RWS in the fact that observers can view data in graphical and tabular form, and the software outputs data files meeting NWS and WMO standards. However, the software lacks some of the additional features of RWS which observers were used to over the years. All of the sites selected to receive the TROS were installed from mid-August through the beginning of October in 2016 (Table 2). During the installation process, all users available onsite were trained on the software since the interface was drastically different from the NWS developed software they were previously using. The idea was to have all of the sites comfortable with the new system well before the GOES-R launch to ensure there were no issues, and to provide them a chance to revert back to RRS if necessary.
3.0 DATA MONITORING In order to ensure the 403 MHz systems are performing adequately, NWS in conjunction with The National Centers for Environmental Prediction (NCEP) keep detailed reports to characterize how the converted sites perform in reference to the 1680 MHz locations, past and present. 3.1. National Centers for Environmental
Prediction (NCEP) Performance Each month NCEP compiles the coded messages sent to them from all upper air stations. From this data they create detailed reports to allow sites a chance to review old flight data which could be in error, and to possibly improve on their processes. 3.1.1. Superadiabatic Lapse Rate Report The first reports which NCEP disseminates are in reference to the number of Super Adiabatic Lapse rates discovered within the coded messages. When the system processes a flight’s coded messages, it looks for any lapse rate which exceeds -34.2°C/km through the first kilometer of flight and -15°C/km thereafter and flags the data. Any column of atmosphere which satisfies these criteria is put into the report along with the day and hour of the flight, and the pressures of where the column of atmosphere started and stopped having the lapse rate over the threshold. The second report details all of the sites together and lists out the number of soundings within that month which have met the super’s criteria. Figure 1 is a graphical representation of this report where the number of superadiabatic lapse rates is compiled into averages for the different systems (NWS 1680 MHz, and NWS 403 MHz TROS) over the course of 2016. Prior to September, only 2 sites were utilizing the TROS system, which resulted in a high average of superadiabatics for that system. Once the TROS was installed at the additional 8 stations, the average per station has begun to drop, yet it still remains 4 times more per site than the national average. Since the system has only been in use at the additional sites for only a few months, the trending of the amount of supers could change as the system is utilized more and observers become more comfortable utilizing it. 3.1.2. Missed Soundings NCEP disseminates reports to detail completeness pertaining to messages for a sounding from each station. If any portion of the messages were missing or late, the report documents the date and time for the particular station. Figure 2 below shows the percentage of data products which were delivered to NCEP on time. This
report does not differentiate products without data (No Data messages) from products with full data available. For CHUAS, the sites do not at this time utilize a No Data message when they are not completing a sounding. Since some of the sites still do not operate the 2 soundings daily, this has caused their data acceptance rates to be much lower than the rest of the NWS. Currently, activities are underway for those sites to utilize No Data messages in the future. For the other 403 systems in the network, there is a slight dip in the percentage of data getting to NCEP on time when comparing it to the 1680 systems, however the dip is not significant as NCEP is still reporting receipt of data over 95% of the time. 3.1.3. Data Rejects Three separate reports are generated monthly in reference to the amount of data rejections over that period. Those three reports are for Temperature, Wind and Height. When the data is sent to NCEP, it runs through a series of algorithms designed and maintained by their office. If for any reason the data does not appear to be accurate to the supercomputers, the data will be rejected and displayed on this list. Results for the past year have been computed and displayed for Temperature, Winds and Heights in Figure 3 through Figure 5. Unfortunately, since the TROS has only been in use since September at more sites, the long term trend is still unclear whether the data will conform to the national average utilizing RWS. It can be seen however, during the month of October, there was an increase in the amount of rejected temperature data, more than likely attributed to observers trying to better understand the new software. A similar trend can be seen from the CROS after it was first installed. During the first quarter of the year, the amount of rejects were upwards of 5 times the national average with RWS, while the observers in the CHUAS were getting used to new software and radiosondes. It appears as if the familiarity for this system took much longer than the TROS, which can be attributed to the region’s previous flight schedule of only one sounding per day during the winter months. 3.2. National Weather Service (NWS)
Performance In conjunction with the NCEP reports, NWS HQ performs its own data management on the upper air systems. By utilizing the reports provided by NCEP along with other documents completed by the field sites, NWS HQ is able to ascertain exactly how well a site is doing in reference to upper air soundings. 3.2.1. Radiosonde Rejections Each site provides NWS HQ with a monthly report detailing the activities in reference to their upper air
performance over a monthly period. In that report, the number of rejected radiosondes can be established. Since the RRS system’s installation, these reports have been utilized to generate national averages for rejected radiosondes. Since the TROS and CROS have been implemented, these reports have continued to be completed. This allows NWS HQ to determine the rejection rates of the different systems and compare them to the national average of the longstanding RRS system. 3.2.2. National Weather Service (NWS)
Performance Score In addition to the above mentioned reports, the NWS developed a way to quantify exactly how a site is performing in comparison to other stations; this is represented by the NOAA National Upper-Air Station Performance score. These scores take information received by NCEP and NWS HQ from various reports. The score also takes into consideration how high the radiosonde has traveled, which does put responsibility of properly inflating balloons back onto the observer to ensure they are conducting the procedures properly. The following equation is used to determine station performance scores: Score = A/2 + B + C + D/2 - E/5 - F/5 where, A = Percentage of monthly soundings arriving at NCEP within 3 hours after balloon release (by 14:00 or 02:00 UTC). This is based on NCEP and FMH#3 requirements. To score in this category, all coded messages (with or without data) must be received. B = Percentage of monthly soundings achieving the minimum 400 hPa pressure level requirement or higher. C = Percentage of monthly soundings achieving 50 hPa or higher. D = Percentage of monthly soundings achieving 20 hPa or higher. E = Percentage of monthly temperature levels between surface & 400 hPa rejected by NCEP. F = Percentage of monthly wind levels between 400 and 100 hPa rejected by NCEP. Unfortunately, these scores do not take into account factors out of the control of the observers such as equipment failures, communications failures, or even inability to conduct soundings due to weather events. The main purpose of this score is to keep observers following proper procedures for inflating balloons and reviewing flight data. Data should be reviewed by all observers prior to transmission to NCEP to ensure the best quality data is being ingested. Through the parameters and equation utilized to calculate the performance score, a maximum score over a month period is 300. Figure 6 shows the trend of the National Average score and the score from the TROS system over the course of the last five years.
Up until September 2016, the there were only two TROS sites which resulted in fluctuations of the scores every now and then. Since 2013, the national average score has mostly stayed above a score of 290 with a couple of minor dips. Through the first few months of the TROS being deployed at 10 sites, those scores have also resided above 290 which shows these stations are still performing up to our national average. 4.0 TO THE FUTURE The NWS is continuing to convert all NWS upper air systems to the 403 MHz center band as the years progress, which is fueled by the desire to sell off additional bands of the 1680 MHz frequency. Additionally, the NWS is investigating the functionality of automated systems which also utilize the 403 MHz band. At this point in time, some tests have been completed in reference to this, but larger scale demonstrations are currently underway to determine the full capability of having a fully automated upper air network. In addition to migrating to 403 MHz for the operational frequency, the NWS is investigating the implementation of BUFR message transmission to NCEP. The current operational version of RWS does not support this function, however, and a newer version with BUFR implemented is currently under evaluation. 5.0 ACKNOWLEDGMENTS Appreciation is extended to the personnel at the TROS locations (Sterling, VA, Blacksburg, VA, Miami, FL, Denver, CO, Norman, OK, Topeka, KS, Anchorage, AK, and Lihue, HI) for accommodating the transition to 403 MHz. The NWS also wishes to acknowledge ongoing efforts in flight support from NCEP in the processing of all of the flight data and producing the performance reports. Additional personnel at the Sterling Field Support Center and NWS HQ continue to provide invaluable flight and field support for the 403 systems which have been deployed. The transitions to the new frequency would not be possible without the contributions of these personnel. 6.0 REFERENCES NWS Office of Planning and Programming for Service Delivery, 2016: System Demonstration and Assessment (SD&A) Plan of the Transitional Radiosonde Observing System (TROS), 35 pp. NWS Office of Observations, 2015: Cooperative Hurricane Upper-Air Stations (CHUAS) Radiosonde Observing System (CROS) Test Plan, 48 pp.

7.0 TABLES and FIGURES
Site Station
ID WMO
ID Date
Operational Curaçao, Neth. TNCC 78988 12/2/2015
Kingston, Jamaica MKJP 78397 12/2/2015
St. Maarten, Neth. TNCM 78866 12/2/2015
Grand Cayman, CI MWCR 78384 12/5/2015
Piarco, Trinidad TTPP 78970 12/5/2015
Santo Domingo, DR MDSD 78486 12/5/2015
Bridgetown, Barbados TBPB 78954 12/9/2015
Nassau, Bahamas MYNN 78073 12/9/2015
San Andres, Colombia SKSP 80001 12/9/2015
Ladyville, Belize MZBZ 78583 4/6/2016 Table 1 - List of CHUAS stations with CROS operational date
Site Station
ID WMO
ID Date
Operational Wallops Island, VA KWAL 72402 2/1/2010
Kodiak, AK PADQ 70350 11/15/2013
TROS Sites
Blacksburg, VA KRNK 72318 8/17/2016
Lihue, HI PLIH 91165 8/31/2016
Anchorage, AK PAFC 70273 9/7/2016
Sterling, VA KLWX 72403 9/14/2016
Topeka, KS KTOP 72456 9/14/2016
Denver, CO KDNR 72469 9/21/2016
Norman, OK KOUN 72357 9/28/2016
Miami, FL KMFL 72202 10/5/2016 Table 2 - List of 403 MHz and TROS stations with operational date

Figure 1 - Average Superadiabatic lapse rates reported per site
Figure 2 - National Average of Data sent to NCEP on time

Figure 3 – Percentage of rejected temperature data during 2016
Figure 4 - Percentage of rejected wind data during 2016
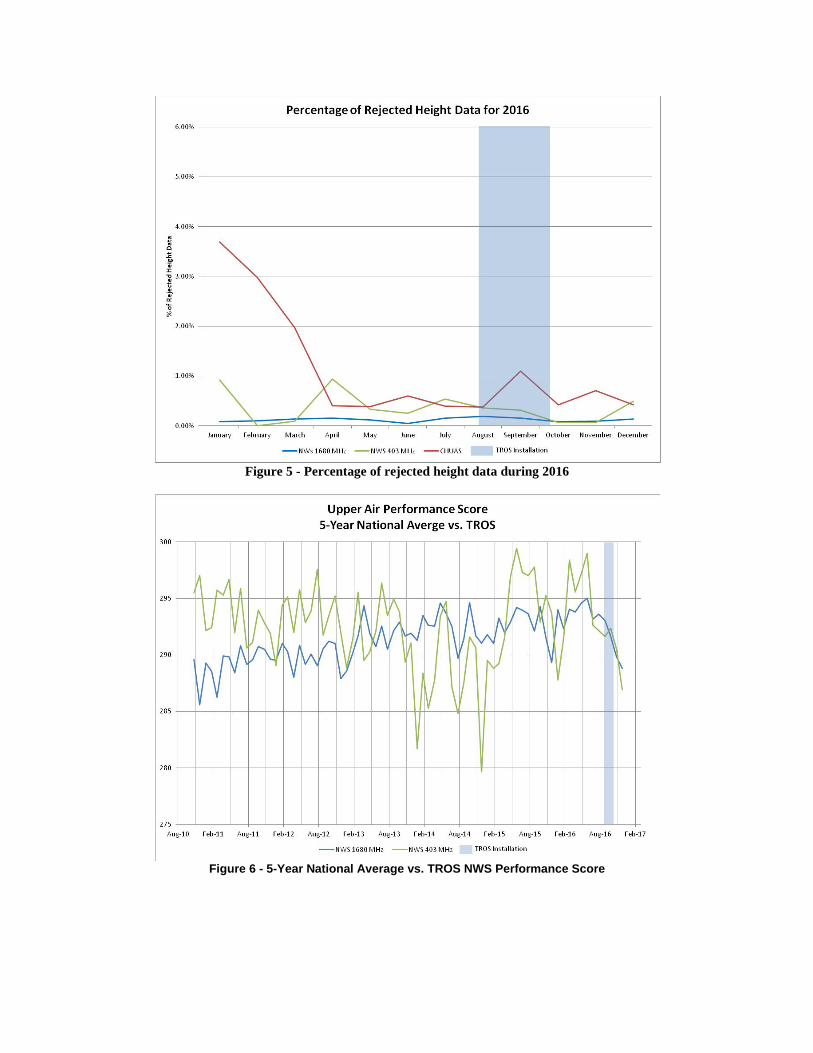
Figure 5 - Percentage of rejected height data during 2016
Figure 6 - 5-Year National Average vs. TROS NWS Performance Score