Reassessment of the Burns temperature and its relationship to the diffuse scattering, lattice...
14
Reassessment of the Burns temperature and its relationship to the diffuse scattering, lattice dynamics, and thermal expansion in relaxor Pb(Mg 1Õ3 Nb 2Õ3 )O 3 P. M. Gehring, 1 H. Hiraka, 2,3 C. Stock, 4 S.-H. Lee, 1 W. Chen, 5 Z.-G. Ye, 5 S. B. Vakhrushev, 6 and Z. Chowdhuri 1 1 NIST Center for Neutron Research, National Institute of Standards and Technology, Gaithersburg, Maryland 20899-6100, USA 2 Department of Physics, Brookhaven National Laboratory, Upton, New York 11973-5000, USA 3 Institute for Materials Research, Tohoku University, Sendai 980-8577, Japan 4 ISIS Facility, Rutherford Appleton Laboratory, Chilton, Didcot OX11 0QX, United Kingdom 5 Department of Chemistry, Simon Fraser University, Burnaby, British Columbia, Canada V5A 1S6 6 Ioffe Physical-Technical Institute, 26 Politekhnicheskaya, 194021 St. Petersburg, Russia Received 27 March 2008; revised manuscript received 27 April 2009; published 9 June 2009 We have used neutron scattering techniques that probe time scales from 10 -12 to 10 -9 s to characterize the diffuse scattering and low-energy lattice dynamics in single crystals of the relaxor PbMg 1/3 Nb 2/3 O 3 PMN from 10 to 900 K. Our study extends far below T c = 213 K, where long-range ferroelectric correlations have been reported under field-cooled conditions, and well above the nominal Burns temperature T d 620 K, where optical measurements suggest the development of short-range polar correlations known as “polar nanoregions” PNR. We observed two distinct types of diffuse scattering. The first is weak, relatively temperature indepen- dent, persists to at least 900 K, and forms bow-tie-shaped patterns in reciprocal space centered on h00 Bragg peaks. We associate this primarily with chemical short-range order. The second is strong, temperature depen- dent, and forms butterfly-shaped patterns centered on h00 Bragg peaks. This diffuse scattering has been attributed to the PNR because it responds to an electric field and vanishes near T d 620 K when measured with thermal neutrons. Surprisingly, it vanishes at 420 K when measured with cold neutrons, which provide approximately four times superior energy resolution. That this onset temperature depends so strongly on the instrumental energy resolution indicates that the diffuse scattering has a quasielastic character and demands a reassessment of the Burns temperature T d . Neutron backscattering measurements made with 300 times better energy resolution confirm the onset temperature of 420 20 K. The energy width of the diffuse scattering is resolution limited, indicating that the PNR are static on time scales of at least 2 ns between 420 and 10 K. Transverse acoustic TA phonon lifetimes, which are known to decrease dramatically for wave vectors q 0.2 Å -1 and T c T T d , are temperature independent up to 900 K for q close to the zone center. This motivates a physical picture in which sufficiently long-wavelength TA phonons average over the PNR; only those TAphonons having wavelengths comparable to the size of the PNR are affected. Finally, the PMN lattice constant changes by less than 0.001 Å below 300 K but expands rapidly at a rate of 2.5 10 -5 K -1 at high temperature. These disparate regimes of low and high thermal expansions bracket the revised value of T d , which suggests the anomalous thermal expansion results from the condensation of static PNR. DOI: 10.1103/PhysRevB.79.224109 PACS numbers: 77.84.Dy, 77.65.j, 77.80.Bh I. INTRODUCTION The concept of nanometer-scale regions of polarization, randomly embedded within a nonpolar cubic matrix, has be- come central to attempts to explain the remarkable physical properties of relaxors such as PbMg 1/3 Nb 2/3 O 3 PMN and PbZn 1/3 Nb 2/3 O 3 PZN. 1–4 The existence of these so-called “polar nanoregions” PNR was first inferred from the optic index of refraction studies of Burns and Dacol 5 on PMN, PZN, and other related systems and later confirmed using many different experimental techniques including x-ray and neutron diffraction, 6–9 207 Pb NMR, 10 and piezoresponse force microscopy. 11 Early small-angle x-ray scattering and neutron pair distribution function PDF measurements on PMN by Egami et al. 12 cast doubt on the nanodomain model of relaxors. However, the recent PDF analysis of Jeong et al., 13 which shows the formation of polar ionic shifts in PMN below 650 K and which occupies only one third of the total sample volume at low temperatures, provides convinc- ing support for the existence of PNR. Neutron inelastic scat- tering data published by Naberezhnov et al. 14 on PMN of- fered the first dynamical evidence of PNR in the form of a prominent broadening of the transverse acoustic TA mode that coincides with the onset of strong diffuse scattering at 650 K, 15 roughly the same temperature 620 K as that reported by Burns and Dacol 5 in their optical study of PMN. This temperature, commonly known as the Burns tempera- ture, and denoted by T d in the original paper, is widely viewed as that at which static PNR first appear. Likely con- densing from a soft transverse optic TO mode, distinctive butterfly-shaped and ellipsoidal diffuse scattering intensity contours centered on h00 and hh0 Bragg peaks, respec- tively, are seen below T d in both PMN Refs. 16–18 and PZN. 19 Similar diffuse scattering patterns were subsequently observed in solid solutions of PMN and PZN with PbTiO 3 PMN-xPT and PZN-xPT; however these patterns appear only on the Ti-poor relaxor side of the well-known mor- photropic phase boundary MPB. 20,21 The polar nature of the strong diffuse scattering, and thus its association with the formation of PNR, was unambiguously established by sev- eral electric field studies of PMN Refs. 22 and 23 and PZN-8%PT, 19,24–26 all of which showed dramatic changes in PHYSICAL REVIEW B 79, 224109 2009 1098-0121/2009/7922/22410914 ©2009 The American Physical Society 224109-1
Transcript of Reassessment of the Burns temperature and its relationship to the diffuse scattering, lattice...
Reassessment of the Burns temperature and its relationship to the diffuse scattering,lattice dynamics, and thermal expansion in relaxor Pb(Mg1Õ3Nb2Õ3)O3
P. M. Gehring,1 H. Hiraka,2,3 C. Stock,4 S.-H. Lee,1 W. Chen,5 Z.-G. Ye,5 S. B. Vakhrushev,6 and Z. Chowdhuri11NIST Center for Neutron Research, National Institute of Standards and Technology, Gaithersburg, Maryland 20899-6100, USA
2Department of Physics, Brookhaven National Laboratory, Upton, New York 11973-5000, USA3Institute for Materials Research, Tohoku University, Sendai 980-8577, Japan
4ISIS Facility, Rutherford Appleton Laboratory, Chilton, Didcot OX11 0QX, United Kingdom5Department of Chemistry, Simon Fraser University, Burnaby, British Columbia, Canada V5A 1S6
6Ioffe Physical-Technical Institute, 26 Politekhnicheskaya, 194021 St. Petersburg, Russia�Received 27 March 2008; revised manuscript received 27 April 2009; published 9 June 2009�
We have used neutron scattering techniques that probe time scales from 10−12 to 10−9 s to characterize thediffuse scattering and low-energy lattice dynamics in single crystals of the relaxor PbMg1/3Nb2/3O3 �PMN�from 10 to 900 K. Our study extends far below Tc=213 K, where long-range ferroelectric correlations havebeen reported under field-cooled conditions, and well above the nominal Burns temperature Td�620 K, whereoptical measurements suggest the development of short-range polar correlations known as “polar nanoregions”�PNR�. We observed two distinct types of diffuse scattering. The first is weak, relatively temperature indepen-dent, persists to at least 900 K, and forms bow-tie-shaped patterns in reciprocal space centered on �h00� Braggpeaks. We associate this primarily with chemical short-range order. The second is strong, temperature depen-dent, and forms butterfly-shaped patterns centered on �h00� Bragg peaks. This diffuse scattering has beenattributed to the PNR because it responds to an electric field and vanishes near Td�620 K when measuredwith thermal neutrons. Surprisingly, it vanishes at 420 K when measured with cold neutrons, which provideapproximately four times superior energy resolution. That this onset temperature depends so strongly on theinstrumental energy resolution indicates that the diffuse scattering has a quasielastic character and demands areassessment of the Burns temperature Td. Neutron backscattering measurements made with 300 times betterenergy resolution confirm the onset temperature of 420�20 K. The energy width of the diffuse scattering isresolution limited, indicating that the PNR are static on time scales of at least 2 ns between 420 and 10 K.Transverse acoustic �TA� phonon lifetimes, which are known to decrease dramatically for wave vectors q�0.2 Å−1 and Tc�T�Td, are temperature independent up to 900 K for q close to the zone center. Thismotivates a physical picture in which sufficiently long-wavelength TA phonons average over the PNR; onlythose TA phonons having wavelengths comparable to the size of the PNR are affected. Finally, the PMN latticeconstant changes by less than 0.001 Å below 300 K but expands rapidly at a rate of 2.5�10−5 K−1 at hightemperature. These disparate regimes of low and high thermal expansions bracket the revised value of Td,which suggests the anomalous thermal expansion results from the condensation of static PNR.
DOI: 10.1103/PhysRevB.79.224109 PACS number�s�: 77.84.Dy, 77.65.�j, 77.80.Bh
I. INTRODUCTION
The concept of nanometer-scale regions of polarization,randomly embedded within a nonpolar cubic matrix, has be-come central to attempts to explain the remarkable physicalproperties of relaxors such as PbMg1/3Nb2/3O3 �PMN� andPbZn1/3Nb2/3O3 �PZN�.1–4 The existence of these so-called“polar nanoregions” �PNR� was first inferred from the opticindex of refraction studies of Burns and Dacol5 on PMN,PZN, and other related systems and later confirmed usingmany different experimental techniques including x-ray andneutron diffraction,6–9 207Pb NMR,10 and piezoresponseforce microscopy.11 Early small-angle x-ray scattering andneutron pair distribution function �PDF� measurements onPMN by Egami et al.12 cast doubt on the nanodomain modelof relaxors. However, the recent PDF analysis of Jeong etal.,13 which shows the formation of polar ionic shifts in PMNbelow �650 K and which occupies only one third of thetotal sample volume at low temperatures, provides convinc-ing support for the existence of PNR. Neutron inelastic scat-tering data published by Naberezhnov et al.14 on PMN of-
fered the first dynamical evidence of PNR in the form of aprominent broadening of the transverse acoustic �TA� modethat coincides with the onset of strong diffuse scattering at650 K,15 roughly the same temperature ��620 K� as thatreported by Burns and Dacol5 in their optical study of PMN.This temperature, commonly known as the Burns tempera-ture, and denoted by Td in the original paper, is widelyviewed as that at which static PNR first appear. Likely con-densing from a soft transverse optic �TO� mode, distinctivebutterfly-shaped and ellipsoidal diffuse scattering intensitycontours centered on �h00� and �hh0� Bragg peaks, respec-tively, are seen below Td in both PMN �Refs. 16–18� andPZN.19 Similar diffuse scattering patterns were subsequentlyobserved in solid solutions of PMN and PZN with PbTiO3�PMN-xPT and PZN-xPT�; however these patterns appearonly on the Ti-poor �relaxor� side of the well-known mor-photropic phase boundary �MPB�.20,21 The polar nature ofthe strong diffuse scattering, and thus its association with theformation of PNR, was unambiguously established by sev-eral electric field studies of PMN �Refs. 22 and 23� andPZN-8%PT,19,24–26 all of which showed dramatic changes in
PHYSICAL REVIEW B 79, 224109 �2009�
1098-0121/2009/79�22�/224109�14� ©2009 The American Physical Society224109-1
the shape and intensity of the diffuse scattering as a functionof field strength and field orientation. The Burns temperatureTd thus represents what is arguably the most important tem-perature scale in relaxors and is several hundred degreeskelvin higher than the critical temperature Tc �which forPMN is �210 K but defined only in nonzero electric field�.
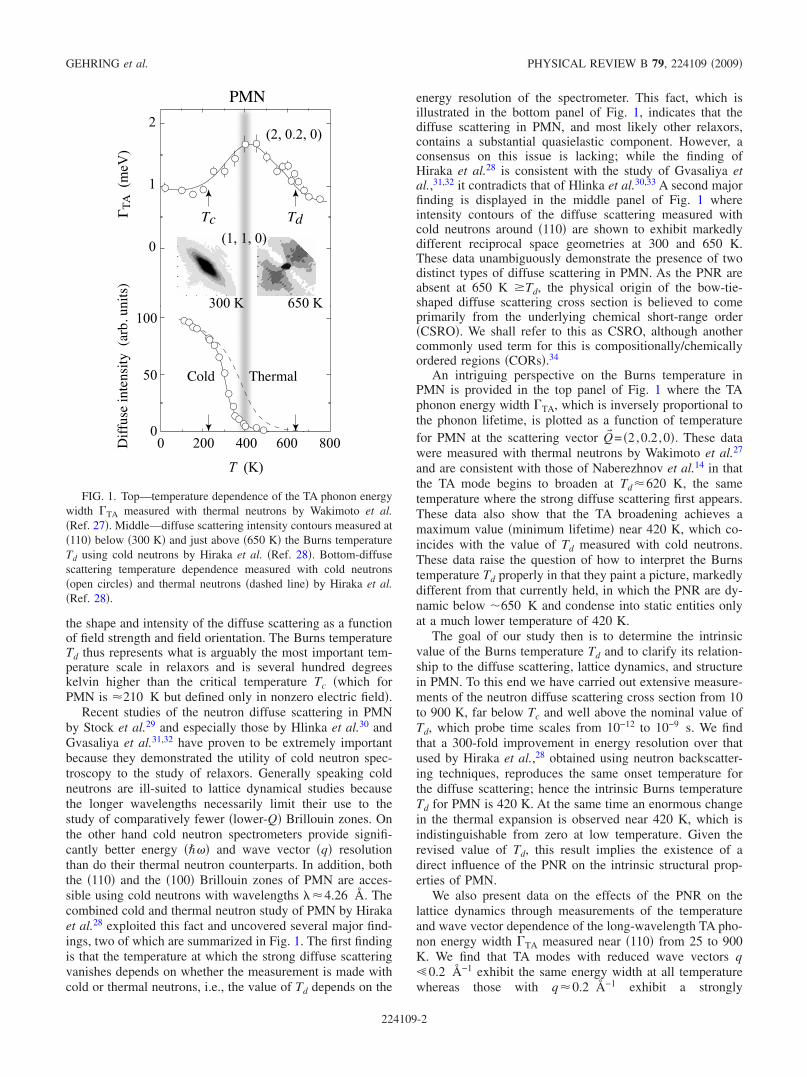
Recent studies of the neutron diffuse scattering in PMNby Stock et al.29 and especially those by Hlinka et al.30 andGvasaliya et al.31,32 have proven to be extremely importantbecause they demonstrated the utility of cold neutron spec-troscopy to the study of relaxors. Generally speaking coldneutrons are ill-suited to lattice dynamical studies becausethe longer wavelengths necessarily limit their use to thestudy of comparatively fewer �lower-Q� Brillouin zones. Onthe other hand cold neutron spectrometers provide signifi-cantly better energy ���� and wave vector �q� resolutionthan do their thermal neutron counterparts. In addition, boththe �110� and the �100� Brillouin zones of PMN are acces-sible using cold neutrons with wavelengths ��4.26 Å. Thecombined cold and thermal neutron study of PMN by Hirakaet al.28 exploited this fact and uncovered several major find-ings, two of which are summarized in Fig. 1. The first findingis that the temperature at which the strong diffuse scatteringvanishes depends on whether the measurement is made withcold or thermal neutrons, i.e., the value of Td depends on the
energy resolution of the spectrometer. This fact, which isillustrated in the bottom panel of Fig. 1, indicates that thediffuse scattering in PMN, and most likely other relaxors,contains a substantial quasielastic component. However, aconsensus on this issue is lacking; while the finding ofHiraka et al.28 is consistent with the study of Gvasaliya etal.,31,32 it contradicts that of Hlinka et al.30,33 A second majorfinding is displayed in the middle panel of Fig. 1 whereintensity contours of the diffuse scattering measured withcold neutrons around �110� are shown to exhibit markedlydifferent reciprocal space geometries at 300 and 650 K.These data unambiguously demonstrate the presence of twodistinct types of diffuse scattering in PMN. As the PNR areabsent at 650 K �Td, the physical origin of the bow-tie-shaped diffuse scattering cross section is believed to comeprimarily from the underlying chemical short-range order�CSRO�. We shall refer to this as CSRO, although anothercommonly used term for this is compositionally/chemicallyordered regions �CORs�.34
An intriguing perspective on the Burns temperature inPMN is provided in the top panel of Fig. 1 where the TAphonon energy width TA, which is inversely proportional tothe phonon lifetime, is plotted as a function of temperaturefor PMN at the scattering vector Q� = �2,0.2,0�. These datawere measured with thermal neutrons by Wakimoto et al.27
and are consistent with those of Naberezhnov et al.14 in thatthe TA mode begins to broaden at Td�620 K, the sametemperature where the strong diffuse scattering first appears.These data also show that the TA broadening achieves amaximum value �minimum lifetime� near 420 K, which co-incides with the value of Td measured with cold neutrons.These data raise the question of how to interpret the Burnstemperature Td properly in that they paint a picture, markedlydifferent from that currently held, in which the PNR are dy-namic below �650 K and condense into static entities onlyat a much lower temperature of 420 K.
The goal of our study then is to determine the intrinsicvalue of the Burns temperature Td and to clarify its relation-ship to the diffuse scattering, lattice dynamics, and structurein PMN. To this end we have carried out extensive measure-ments of the neutron diffuse scattering cross section from 10to 900 K, far below Tc and well above the nominal value ofTd, which probe time scales from 10−12 to 10−9 s. We findthat a 300-fold improvement in energy resolution over thatused by Hiraka et al.,28 obtained using neutron backscatter-ing techniques, reproduces the same onset temperature forthe diffuse scattering; hence the intrinsic Burns temperatureTd for PMN is 420 K. At the same time an enormous changein the thermal expansion is observed near 420 K, which isindistinguishable from zero at low temperature. Given therevised value of Td, this result implies the existence of adirect influence of the PNR on the intrinsic structural prop-erties of PMN.
We also present data on the effects of the PNR on thelattice dynamics through measurements of the temperatureand wave vector dependence of the long-wavelength TA pho-non energy width TA measured near �110� from 25 to 900K. We find that TA modes with reduced wave vectors q0.2 Å−1 exhibit the same energy width at all temperaturewhereas those with q�0.2 Å−1 exhibit a strongly
0
1
2
0 200 400 600 800
T (K)
0
100
50
ΓΤΑ(meV)
Diffuseintensity
(arb.units)
PMN
Tc Td
300 K 650 K
(2, 0.2, 0)
Cold Thermal
(1, 1, 0)
FIG. 1. Top—temperature dependence of the TA phonon energywidth TA measured with thermal neutrons by Wakimoto et al.�Ref. 27�. Middle—diffuse scattering intensity contours measured at�110� below �300 K� and just above �650 K� the Burns temperatureTd using cold neutrons by Hiraka et al. �Ref. 28�. Bottom-diffusescattering temperature dependence measured with cold neutrons�open circles� and thermal neutrons �dashed line� by Hiraka et al.�Ref. 28�.
GEHRING et al. PHYSICAL REVIEW B 79, 224109 �2009�
224109-2
temperature-dependent broadening similar to that shown inthe top panel of Fig. 1. This behavior contrasts with thatobserved in thermal neutron studies of the TO mode, whichexhibits a broadening for all q�0.2 Å−1. Previous neutronscattering work on PMN-60%PT by Stock et al.,35 a materialin which there is no strong temperature-dependent diffusescattering and thus no polar nanoregions, found no evidenceof any TA phonon broadening. In this context, our data lendextremely strong support to the PNR model: the lifetimes ofTA modes with wavelengths comparable in size to the PNRare strongly diminished by the PNR, whereas long-wavelength �low q� TA phonons simply average over thePNR and are unaffected.
II. EXPERIMENTAL DETAILS
The neutron scattering data presented here were obtainedusing the BT9 thermal neutron triple-axis spectrometer, theSPINS cold neutron triple-axis spectrometer, and the coldneutron high-flux backscattering spectrometer �HFBS�, all ofwhich are located at the NIST Center for Neutron Research�NCNR�. On BT9, measurements of the phonons and diffusescattering were made at a fixed final �thermal� neutron en-ergy Ef =14.7 meV ��=2.36 � using the �002� Bragg re-flection of highly oriented pyrolytic graphite �HOPG� crys-tals to monochromate and analyze the incident and scatteredneutron beams, respectively. Horizontal beam collimationswere 40�-47�-S-40�-80� �S=sample�. A special nonstandardhigh q-resolution configuration was employed to measure thethermal expansion in which the �004� Bragg reflection from aperfect Ge crystal was used as analyzer and horizontal beamcollimations were tightened to 15�-47�-S-20�-40�. Thechoice of Ge was motivated by the close matching betweenthe PMN �022� �1.431 � and Ge �004� �1.414 � d spac-ings, which provides a significant improvement in the instru-mental q resolution.36 On SPINS, which sits on the cold neu-tron guide NG5, the phonon and diffuse scatteringmeasurements were made at a fixed final neutron energy Ef=4.5 meV ��=4.264 � also using the �002� Bragg reflec-tion of HOPG crystals as monochromator and analyzer. Aliquid-nitrogen cooled Be filter was located after the sampleto remove higher order neutron wavelengths from the scat-tered beam, and horizontal beam collimations were set toguide-80�-S-80�-80�. The resultant elastic ���=0� energyresolution for the SPINS measurements was �E=0.12 meVhalf width at half maximum �HWHM�.
The high-flux backscattering spectrometer was used tolook for dynamics that might be associated with the strongdiffuse scattering below Td. This instrument uses a mechani-cally driven Si �111� monochromator to Doppler shift theenergies of incident neutrons over a narrow range centeredabout 2.08 meV. Neutrons are backscattered from the mono-chromator and proceed toward the sample where they arescattered into a 12 m2 array of Si �111� crystals that serve asanalyzer. These neutrons are then backscattered a secondtime by the analyzer, which selects the final neutron energyEf =2.08 meV, into a series of detectors positioned about thesample. The effective angular acceptance of each detector is�15°. The HFBS instrument is described in further detailelsewhere.37 The elastic energy resolution for the HFBS
measurements described here was �E=0.4 eV �HWHM�.Two high-quality single crystals of PMN, labeled PMN 4
and PMN 5, were used in this study; both were grown usinga top-seeded solution growth technique.38 The crystal growthconditions were determined from the pseudobinary phasediagram established for PMN and PbO. The PMN 4 and 5crystals weigh 2.7 g �0.33 cm3� and 4.8 g �0.59 cm3�, re-spectively. At 300 K the mosaic of each crystal measured at�220� is less than 0.04° full width at half maximum�FWHM�. Loss of PbO, the formation of a pyrochlore phase,and the reduction of Nb5+ are known to occur in PMN singlecrystals when subjected to high temperatures under vacuumfor extended periods of time. This process results in a dra-matic blackening of the crystal, which is normal of a trans-parent gold/amber color. While dielectric measurements onsuch darkened crystals reportedly show little difference fromthose on unheated samples,39 our measurements reveal a di-minishment of the diffuse scattering intensity after sustainedand repeated heating. Therefore experiments on the largerPMN crystal 5 were limited to 600 K or less, while PMNcrystal 4 was used to obtain data above 600 K.
Both samples were mounted with an �001� axis orientedvertically, giving access to reflections of the form �hk0�. Forthe high-temperature experiments, PMN crystal 4 waswrapped in quartz wool, mounted in a niobium holder se-cured by tungsten wire, and then loaded into a water-cooledfurnace capable of reaching temperatures from 300 to 1800K. PMN crystal 5 was mounted onto an aluminum sampleholder assembly placed inside an aluminum sample can andthen loaded inside the vacuum space of a closed-cycle 4Herefrigerator that provides access to temperatures from 10 to700 K. Each sample has a cubic lattice spacing of a=4.05 Å at 300 K; thus 1 rlu �reciprocal lattice unit� equals2� /a=1.55 Å−1.
III. ORIGINS OF THE DIFFUSE SCATTERING:PNR VERSUS CSRO
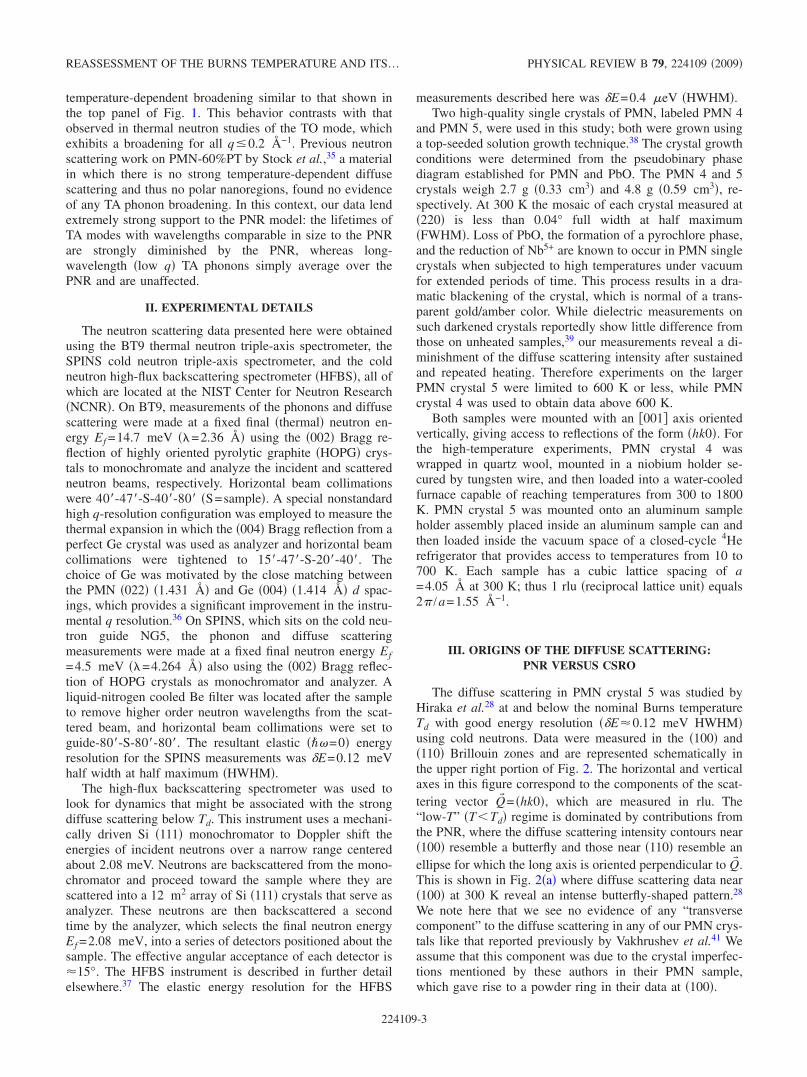
The diffuse scattering in PMN crystal 5 was studied byHiraka et al.28 at and below the nominal Burns temperatureTd with good energy resolution ��E�0.12 meV HWHM�using cold neutrons. Data were measured in the �100� and�110� Brillouin zones and are represented schematically inthe upper right portion of Fig. 2. The horizontal and verticalaxes in this figure correspond to the components of the scat-tering vector Q� = �hk0�, which are measured in rlu. The“low-T” �T�Td� regime is dominated by contributions fromthe PNR, where the diffuse scattering intensity contours near�100� resemble a butterfly and those near �110� resemble anellipse for which the long axis is oriented perpendicular to Q� .This is shown in Fig. 2�a� where diffuse scattering data near�100� at 300 K reveal an intense butterfly-shaped pattern.28
We note here that we see no evidence of any “transversecomponent” to the diffuse scattering in any of our PMN crys-tals like that reported previously by Vakhrushev et al.41 Weassume that this component was due to the crystal imperfec-tions mentioned by these authors in their PMN sample,which gave rise to a powder ring in their data at �100�.
REASSESSMENT OF THE BURNS TEMPERATURE AND ITS… PHYSICAL REVIEW B 79, 224109 �2009�
224109-3
The same butterfly/ellipsoidal diffuse scattering geometrywas shown to persist in single crystals of PMN-xPT andPZN-xPT in studies by Matsuura et al.20 and Xu et al.,21
respectively, for compositions spanning the Ti-poor �relaxor�side of the MPB. These results also completely refute thoseof La-Orauttapong et al.42 who reported that the orientationof the strong diffuse scattering varies with Ti content inPZN-xPT and concluded that the PNR orientation changeswith doping.43 For Ti-rich �tetragonal� PMN-xPT composi-tions just beyond the MPB, Matsuura et al.20 found that thestrong temperature-dependent diffuse scattering vanishes andis replaced by critical scattering. Matsuura et al.20 also foundthat the q-integrated diffuse scattering intensity increaseswith Ti content on the Ti-poor side of the MPB, peaks nearthe MPB, then drops dramatically on crossing the MPB. Thisfinding is significant because it suggests that an intriguingand direct correlation exists between the PNR and the piezo-electric coefficient d33, which exhibits the same dependenceon Ti content.2 A model based on pancake-shaped ferroelec-tric domains has been used successfully to fit the three-dimensional �3D� diffuse scattering distributions measured inPZN-xPT with high-energy x rays.21,44,45 A similar type ofreal-space structure has been proposed to explain the diffusescattering in the relaxor KLixTa1−xO3.46 On the other hand,alternative models explaining the same diffuse scattering dis-tributions have also been proposed.47
In the “high-T” regime �T�Td� there are no PNR, and theassociated butterfly-shaped diffuse scattering is no longer
present. The weak diffuse scattering that remains is thus ar-gued to originate primarily from the underlying CSRO,which reflects weak correlations between the Mg2+ and Nb5+
cations on the B site of the perovskite ABO3 structure. In thisregime the shapes of the diffuse scattering contours are radi-cally different, resembling a bow-tie in both Q� = �h00� andQ� = �hh0� Brillouin zones in which the diffuse scattering ex-tends mainly parallel to Q� . The only difference between thecontours near �100� and �110� appears to be in the orientationof the triangular regions of diffuse scattering, which point intoward �100� but away from �110�. Data taken near �100� at650 K are displayed in Fig. 2�b�.28 At this temperature thediffuse scattering intensities, shown using a linear gray scale,are much weaker than those of the butterfly pattern at 300 K.We further note that the intensities increase �become darker�from left to right in panels �b� and �c�, which corresponds toincreasing Q. Given the �Q� ·u��2 dependence of the neutrondiffuse scattering cross section, this intensity signature im-plies the presence of some short-range correlated displace-ments u� since otherwise, if u=0, there would be no Q de-pendence. Thus the weak diffuse scattering is not solely dueto CSRO.
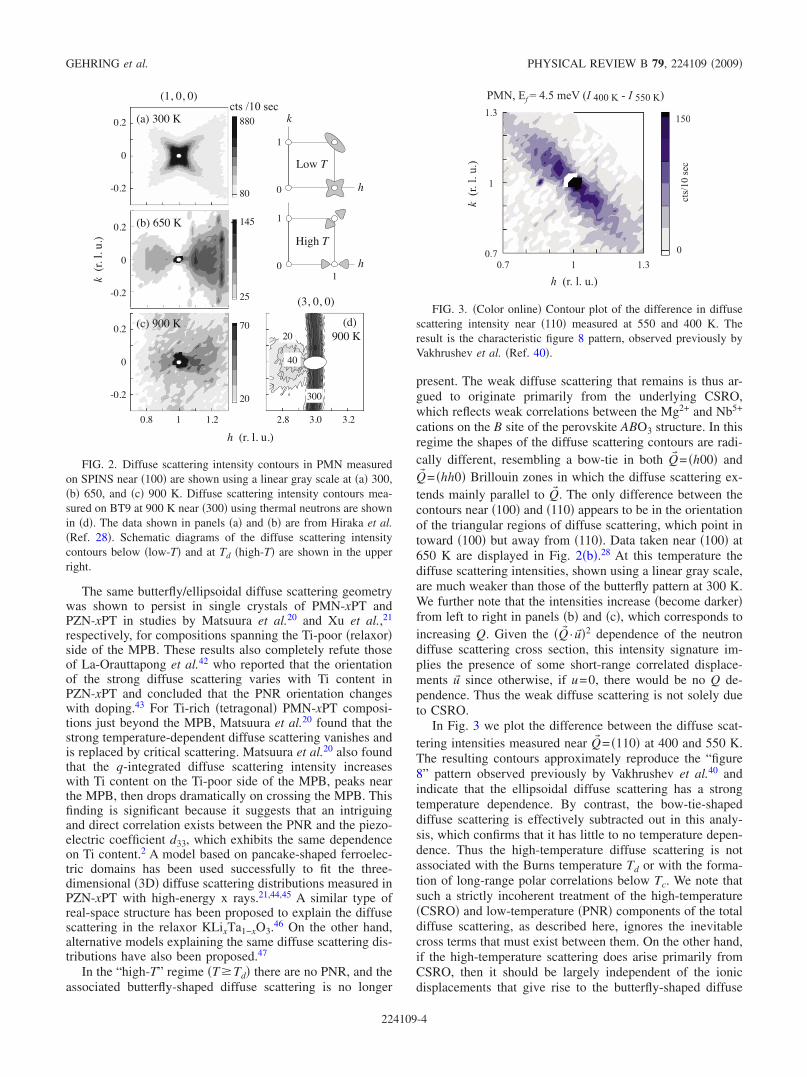
In Fig. 3 we plot the difference between the diffuse scat-tering intensities measured near Q� = �110� at 400 and 550 K.The resulting contours approximately reproduce the “figure8” pattern observed previously by Vakhrushev et al.40 andindicate that the ellipsoidal diffuse scattering has a strongtemperature dependence. By contrast, the bow-tie-shapeddiffuse scattering is effectively subtracted out in this analy-sis, which confirms that it has little to no temperature depen-dence. Thus the high-temperature diffuse scattering is notassociated with the Burns temperature Td or with the forma-tion of long-range polar correlations below Tc. We note thatsuch a strictly incoherent treatment of the high-temperature�CSRO� and low-temperature �PNR� components of the totaldiffuse scattering, as described here, ignores the inevitablecross terms that must exist between them. On the other hand,if the high-temperature scattering does arise primarily fromCSRO, then it should be largely independent of the ionicdisplacements that give rise to the butterfly-shaped diffuse
3.02.8 3.2
(1, 0, 0)
h (r. l. u.)
k(r.l.u.)
0
-0.2
0.2
10.8 1.2
(a) 300 K
0
-0.2
0.2
0
-0.2
0.2
(b) 650 K
(c) 900 K
80
880
25
145
20
7020 900 K
h
k
1
0
Low T
h
1
0
High T
1
(d)(3, 0, 0)
40
300
cts /10 sec
FIG. 2. Diffuse scattering intensity contours in PMN measuredon SPINS near �100� are shown using a linear gray scale at �a� 300,�b� 650, and �c� 900 K. Diffuse scattering intensity contours mea-sured on BT9 at 900 K near �300� using thermal neutrons are shownin �d�. The data shown in panels �a� and �b� are from Hiraka et al.�Ref. 28�. Schematic diagrams of the diffuse scattering intensitycontours below �low-T� and at Td �high-T� are shown in the upperright.
1
1
1.30.7
1.3
0.7 0
150
PMN, Ef= 4.5 meV (I 400 K - I 550 K)
cts/10sec
h (r. l. u.)
k(r.l.u.)
FIG. 3. �Color online� Contour plot of the difference in diffusescattering intensity near �110� measured at 550 and 400 K. Theresult is the characteristic figure 8 pattern, observed previously byVakhrushev et al. �Ref. 40�.
GEHRING et al. PHYSICAL REVIEW B 79, 224109 �2009�
224109-4

scattering �PNR� below Td. The relative weakness of thehigh-temperature diffuse scattering compared to that at lowtemperatures also suggests such cross terms should be weak,and this appears to be supported by the simple subtractionanalysis presented in Fig. 3 in that one effectively recoversthe ellipsoidal �not bow-tie� intensity contours. For this rea-son we believe it is a reasonable first approximation to treatthe two diffuse scattering components as being nearly inde-pendent.
We extended the diffuse scattering measurements to tem-peratures well above Td using PMN crystal 4, which we re-served for very high-temperature experiments. Previous datataken on PMN and PZN crystals heated to 1000 K revealedsignificant evidence of sample decomposition, so we limitedour measurements to 900 K. Diffuse scattering intensity con-tours at 900 K for the �100� and the �300� Brillouin zones arepresented in Figs. 2�c� and 2�d�, respectively. Although thediffuse scattering near �100� is quite weak, it is consistentwith the bow-tie geometry observed in Fig. 2�b� at 650 K.We exploited the Q2 dependence of the neutron diffuse scat-tering cross section to obtain higher intensity by using ther-mal neutrons to access �300�. The �300� diffuse scatteringintensity contours are shown in Fig. 2�d�, where the bow-tiepattern observed at 650 K is still present at 900 K. Thecontours are truncated for h�3.02 rlu because of a me-chanical limit on the maximum scattering angle available onBT9, but the triangular region on the low-Q side of �300� isclearly evident. That the bow-tie-shaped diffuse scatteringpersists to such high temperature provides what is perhapsthe most convincing evidence that it arises mainly fromCSRO.
During the course of our measurements we noticed thatthe diffuse scattering in PMN crystal 4 had diminished andwas noticeably weaker than that in PMN crystal 5, which wehad never exposed to temperatures above 650 K. We alsoobserved a broad ring of scattering passing directly throughQ� = �300�, which is shown in Fig. 2�d�. This feature wasnever observed prior to heating this crystal to 900 K. Giventhe length of time spent at high temperatures, this featuremost likely corresponds to a powder ring arising from par-tially decomposed regions of PMN crystal 4, which hadturned entirely black after exposure to high temperatures.These regions do not affect any other data presented in thispaper because the 900 K measurements on PMN crystal 4were the last ones performed on this sample. Therefore thepowder ring appears only in Fig. 2�d�.
It is instructive to compare these results with those onPMN-60%PT, a composition that lies well beyond the mor-photropic phase boundary and undergoes a first-order ferro-electric transition from a cubic to a tetragonal phase near 540K. An extensive study of this material using neutron andhigh-energy x-ray scattering methods found no sign of thestrong butterfly-shaped diffuse scattering at lowtemperatures.35 This result lends further support to our asso-ciation of the strong temperature-dependent diffuse scatter-ing with the PNR, which is absent in PMN-60%PT. Neutronmeasurements on PMN-60%PT do, however, reveal the pres-ence of bow-tie-shaped diffuse scattering intensity contoursat all temperatures studied, which supports the identificationof such diffuse scattering with chemical short-range order
between cations on the B site of the PMN perovskite ABO3structure. This picture is supported by theoretical work48 aswell as 93Nb NMR,49 electron microscopy,50 and polarizedRaman scattering51 measurements. All of these studies sug-gest that there is no temperature dependence to the bow-tie-shaped diffuse scattering below �1000 K, which is consis-tent with our results on PMN over the extended temperaturerange.
During our study of PMN we discovered that the diffusescattering near �200� is not as weak as previouslybelieved.17,40,42,52 To confirm this finding, we made detailedmeasurements of the diffuse scattering intensity near �200� at300 and 100 K along a trajectory in reciprocal space thatfollows one wing of the butterfly intensity contour; this isshown by the dashed line in the inset of Fig. 4. The results ofthe 300 K scan are compared to an identical scan measuredin the �100� zone, both of which are shown in Fig. 4. Thesedata demonstrate that the �100� diffuse scattering cross sec-tion, represented by the dotted lines passing through the opencircles, is substantially larger than that at �200�, designatedby the solid circles. This result supports the model of Hirotaet al.52 in which the �unexpectedly� weak �200� diffuse scat-tering cross section observed in PMN and other relaxors canbe explained by the presence of a uniform shift or displace-ment of the PNR relative to the nonpolar cubic matrix alongthe direction of the local PNR polarization. Indirect evidencefor the existence of this shift has been obtained from neutronscattering measurements of the anisotropic response of thediffuse scattering in PZN-8%PT to an electric field appliedalong the �001� direction.24
Figure 5 shows diffuse scattering intensity contours mea-sured on BT9 at 100, 300, and 600 K near �200�; these dataillustrate that the �200� diffuse scattering intensity followsthe same temperature dependence as that measured in other
0
100
200
300
400
500
-0.2 -0.1 0 0.1 0.2 0.3 0.4
Intensity(counts/10sec)
PMN 14.7Ef 40'-46'-40'-80'
T = 300 K
� (2+�, -�, 0)
2 2.3
0
0.3
-0.3
h (r. l. u.)
k(r.l.u.)
(2, 0, 0)
(1, 0, 0)
FIG. 4. �Color online� Diffuse scattering intensity measured onBT9 at 300 K as a function of reduced momentum transfer relativeto �100� �open circles� and �200� �solid circles�. The dotted linesisolate the diffuse scattering component from the Bragg peak. Theinset shows the orientation of the scan relative to the familiar but-terfly pattern measured near �200� at 100 K.
REASSESSMENT OF THE BURNS TEMPERATURE AND ITS… PHYSICAL REVIEW B 79, 224109 �2009�
224109-5
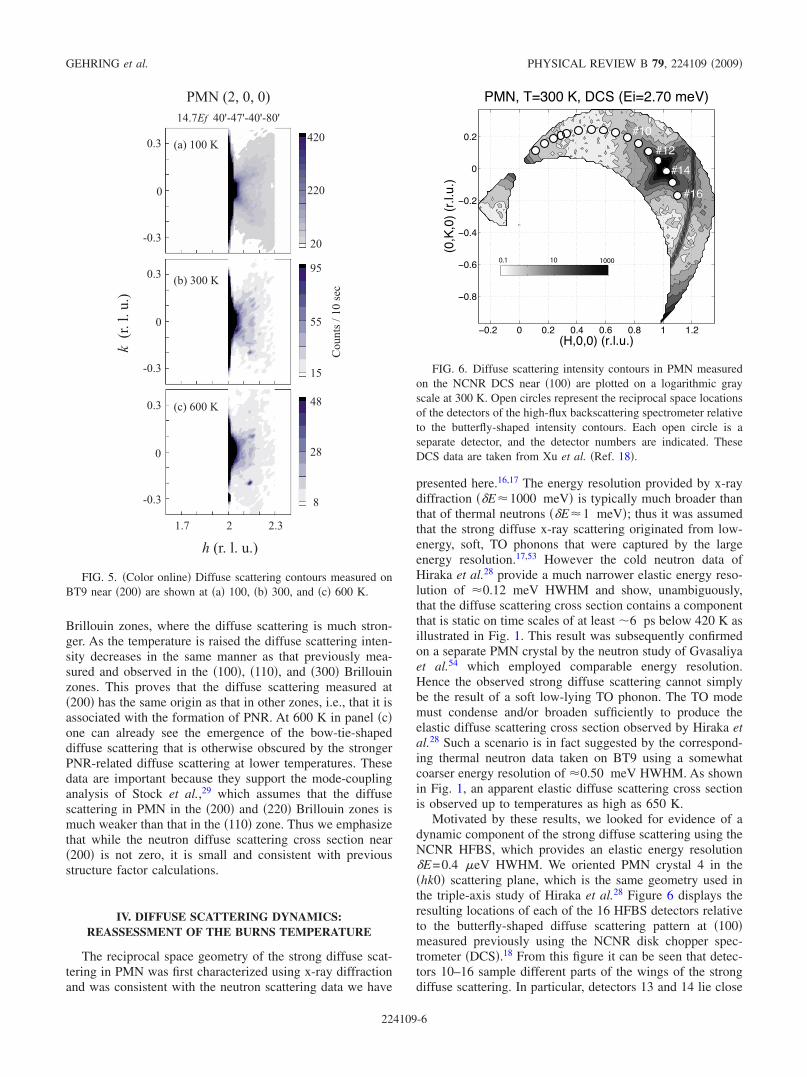
Brillouin zones, where the diffuse scattering is much stron-ger. As the temperature is raised the diffuse scattering inten-sity decreases in the same manner as that previously mea-sured and observed in the �100�, �110�, and �300� Brillouinzones. This proves that the diffuse scattering measured at�200� has the same origin as that in other zones, i.e., that it isassociated with the formation of PNR. At 600 K in panel �c�one can already see the emergence of the bow-tie-shapeddiffuse scattering that is otherwise obscured by the strongerPNR-related diffuse scattering at lower temperatures. Thesedata are important because they support the mode-couplinganalysis of Stock et al.,29 which assumes that the diffusescattering in PMN in the �200� and �220� Brillouin zones ismuch weaker than that in the �110� zone. Thus we emphasizethat while the neutron diffuse scattering cross section near�200� is not zero, it is small and consistent with previousstructure factor calculations.
IV. DIFFUSE SCATTERING DYNAMICS:REASSESSMENT OF THE BURNS TEMPERATURE
The reciprocal space geometry of the strong diffuse scat-tering in PMN was first characterized using x-ray diffractionand was consistent with the neutron scattering data we have
presented here.16,17 The energy resolution provided by x-raydiffraction ��E�1000 meV� is typically much broader thanthat of thermal neutrons ��E�1 meV�; thus it was assumedthat the strong diffuse x-ray scattering originated from low-energy, soft, TO phonons that were captured by the largeenergy resolution.17,53 However the cold neutron data ofHiraka et al.28 provide a much narrower elastic energy reso-lution of �0.12 meV HWHM and show, unambiguously,that the diffuse scattering cross section contains a componentthat is static on time scales of at least �6 ps below 420 K asillustrated in Fig. 1. This result was subsequently confirmedon a separate PMN crystal by the neutron study of Gvasaliyaet al.54 which employed comparable energy resolution.Hence the observed strong diffuse scattering cannot simplybe the result of a soft low-lying TO phonon. The TO modemust condense and/or broaden sufficiently to produce theelastic diffuse scattering cross section observed by Hiraka etal.28 Such a scenario is in fact suggested by the correspond-ing thermal neutron data taken on BT9 using a somewhatcoarser energy resolution of �0.50 meV HWHM. As shownin Fig. 1, an apparent elastic diffuse scattering cross sectionis observed up to temperatures as high as 650 K.
Motivated by these results, we looked for evidence of adynamic component of the strong diffuse scattering using theNCNR HFBS, which provides an elastic energy resolution�E=0.4 eV HWHM. We oriented PMN crystal 4 in the�hk0� scattering plane, which is the same geometry used inthe triple-axis study of Hiraka et al.28 Figure 6 displays theresulting locations of each of the 16 HFBS detectors relativeto the butterfly-shaped diffuse scattering pattern at �100�measured previously using the NCNR disk chopper spec-trometer �DCS�.18 From this figure it can be seen that detec-tors 10–16 sample different parts of the wings of the strongdiffuse scattering. In particular, detectors 13 and 14 lie close
15
95
55
h (r. l. u.)
k(r.l.u.)
(b) 300 K
0
0.3
-0.320
220
420
Counts/10sec
PMN (2, 0, 0)
14.7Ef 40'-47'-40'-80'
(a) 100 K
0
0.3
-0.3
0
0.3
-0.3
21.7 2.3
(c) 600 K
8
48
28
FIG. 5. �Color online� Diffuse scattering contours measured onBT9 near �200� are shown at �a� 100, �b� 300, and �c� 600 K.
(H,0,0) (r.l.u.)
(0,K,0)(r.l.u.)
PMN, T=300 K, DCS (Ei=2.70 meV)
���� 0 0.2 0.4 0.6 0.8 1 1.2
����
����
����
����
0
0.2
#14
#16
#10#12
0.1 100010
FIG. 6. Diffuse scattering intensity contours in PMN measuredon the NCNR DCS near �100� are plotted on a logarithmic grayscale at 300 K. Open circles represent the reciprocal space locationsof the detectors of the high-flux backscattering spectrometer relativeto the butterfly-shaped intensity contours. Each open circle is aseparate detector, and the detector numbers are indicated. TheseDCS data are taken from Xu et al. �Ref. 18�.
GEHRING et al. PHYSICAL REVIEW B 79, 224109 �2009�
224109-6
to the �100� Bragg peak. Because the instrumental Q reso-lution of the HFBS is relatively poor, we checked for thepresence of Bragg contamination in the integration analysisby removing contributions from detectors 13 and 14. Thisdid not change any of the results. Moreover the PMN studyby Wakimoto et al.55 showed the �202� Bragg peak intensitychanges by less than 10% between 50 and 300 K. Therefore,in the following analysis we have integrated the intensityfrom detectors 10–16.
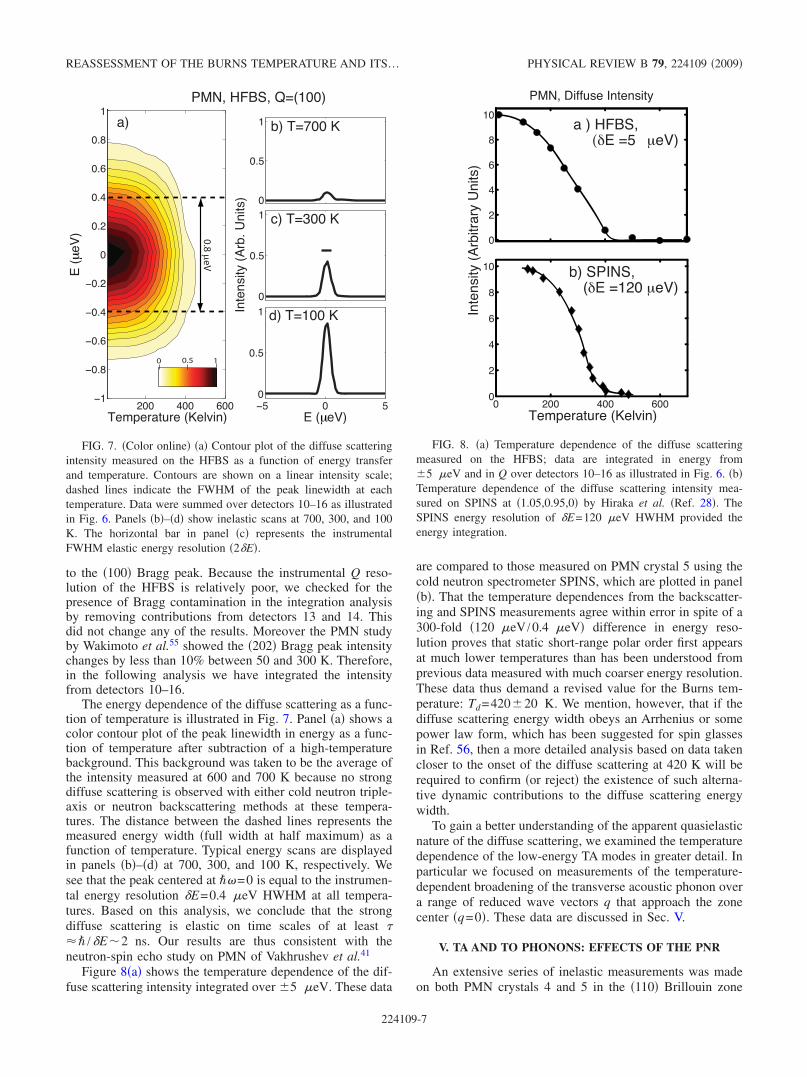
The energy dependence of the diffuse scattering as a func-tion of temperature is illustrated in Fig. 7. Panel �a� shows acolor contour plot of the peak linewidth in energy as a func-tion of temperature after subtraction of a high-temperaturebackground. This background was taken to be the average ofthe intensity measured at 600 and 700 K because no strongdiffuse scattering is observed with either cold neutron triple-axis or neutron backscattering methods at these tempera-tures. The distance between the dashed lines represents themeasured energy width �full width at half maximum� as afunction of temperature. Typical energy scans are displayedin panels �b�–�d� at 700, 300, and 100 K, respectively. Wesee that the peak centered at ��=0 is equal to the instrumen-tal energy resolution �E=0.4 eV HWHM at all tempera-tures. Based on this analysis, we conclude that the strongdiffuse scattering is elastic on time scales of at least ��� /�E�2 ns. Our results are thus consistent with theneutron-spin echo study on PMN of Vakhrushev et al.41
Figure 8�a� shows the temperature dependence of the dif-fuse scattering intensity integrated over �5 eV. These data
are compared to those measured on PMN crystal 5 using thecold neutron spectrometer SPINS, which are plotted in panel�b�. That the temperature dependences from the backscatter-ing and SPINS measurements agree within error in spite of a300-fold �120 eV /0.4 eV� difference in energy reso-lution proves that static short-range polar order first appearsat much lower temperatures than has been understood fromprevious data measured with much coarser energy resolution.These data thus demand a revised value for the Burns tem-perature: Td=420�20 K. We mention, however, that if thediffuse scattering energy width obeys an Arrhenius or somepower law form, which has been suggested for spin glassesin Ref. 56, then a more detailed analysis based on data takencloser to the onset of the diffuse scattering at 420 K will berequired to confirm �or reject� the existence of such alterna-tive dynamic contributions to the diffuse scattering energywidth.
To gain a better understanding of the apparent quasielasticnature of the diffuse scattering, we examined the temperaturedependence of the low-energy TA modes in greater detail. Inparticular we focused on measurements of the temperature-dependent broadening of the transverse acoustic phonon overa range of reduced wave vectors q that approach the zonecenter �q=0�. These data are discussed in Sec. V.
V. TA AND TO PHONONS: EFFECTS OF THE PNR
An extensive series of inelastic measurements was madeon both PMN crystals 4 and 5 in the �110� Brillouin zone
0 0.5 1
0.8µ
eV
FIG. 7. �Color online� �a� Contour plot of the diffuse scatteringintensity measured on the HFBS as a function of energy transferand temperature. Contours are shown on a linear intensity scale;dashed lines indicate the FWHM of the peak linewidth at eachtemperature. Data were summed over detectors 10–16 as illustratedin Fig. 6. Panels �b�–�d� show inelastic scans at 700, 300, and 100K. The horizontal bar in panel �c� represents the instrumentalFWHM elastic energy resolution �2�E�.
0
2
4
6
8
10
PMN, Diffuse Intensity
0 200 400 6000
2
4
6
8
10
Temperature (Kelvin)
Intensity(ArbitraryUnits)
a ) HFBS,(δE =5 μeV)
b) SPINS,(δE =120 μeV)
FIG. 8. �a� Temperature dependence of the diffuse scatteringmeasured on the HFBS; data are integrated in energy from�5 eV and in Q over detectors 10–16 as illustrated in Fig. 6. �b�Temperature dependence of the diffuse scattering intensity mea-sured on SPINS at �1.05,0.95,0� by Hiraka et al. �Ref. 28�. TheSPINS energy resolution of �E=120 eV HWHM provided theenergy integration.
REASSESSMENT OF THE BURNS TEMPERATURE AND ITS… PHYSICAL REVIEW B 79, 224109 �2009�
224109-7
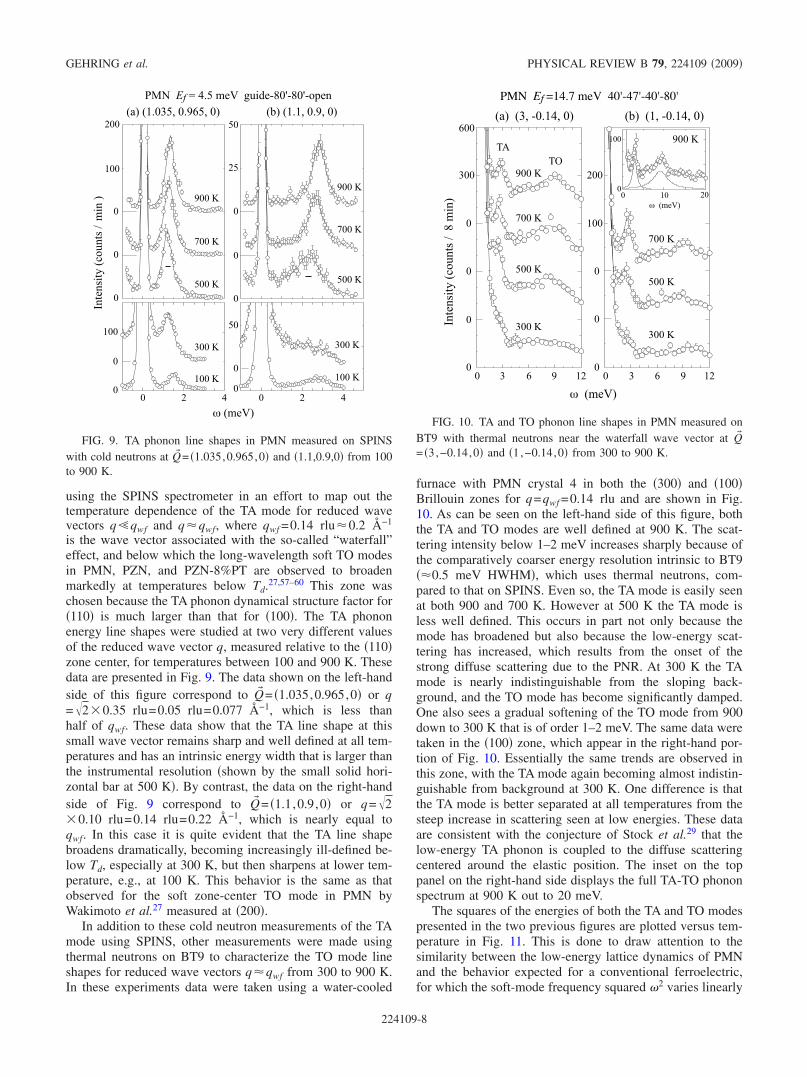
using the SPINS spectrometer in an effort to map out thetemperature dependence of the TA mode for reduced wavevectors qqwf and q�qwf, where qwf =0.14 rlu�0.2 Å−1
is the wave vector associated with the so-called “waterfall”effect, and below which the long-wavelength soft TO modesin PMN, PZN, and PZN-8%PT are observed to broadenmarkedly at temperatures below Td.27,57–60 This zone waschosen because the TA phonon dynamical structure factor for�110� is much larger than that for �100�. The TA phononenergy line shapes were studied at two very different valuesof the reduced wave vector q, measured relative to the �110�zone center, for temperatures between 100 and 900 K. Thesedata are presented in Fig. 9. The data shown on the left-handside of this figure correspond to Q� = �1.035,0.965,0� or q=�2�0.35 rlu=0.05 rlu=0.077 Å−1, which is less thanhalf of qwf. These data show that the TA line shape at thissmall wave vector remains sharp and well defined at all tem-peratures and has an intrinsic energy width that is larger thanthe instrumental resolution �shown by the small solid hori-zontal bar at 500 K�. By contrast, the data on the right-handside of Fig. 9 correspond to Q� = �1.1,0.9,0� or q=�2�0.10 rlu=0.14 rlu=0.22 Å−1, which is nearly equal toqwf. In this case it is quite evident that the TA line shapebroadens dramatically, becoming increasingly ill-defined be-low Td, especially at 300 K, but then sharpens at lower tem-perature, e.g., at 100 K. This behavior is the same as thatobserved for the soft zone-center TO mode in PMN byWakimoto et al.27 measured at �200�.
In addition to these cold neutron measurements of the TAmode using SPINS, other measurements were made usingthermal neutrons on BT9 to characterize the TO mode lineshapes for reduced wave vectors q�qwf from 300 to 900 K.In these experiments data were taken using a water-cooled
furnace with PMN crystal 4 in both the �300� and �100�Brillouin zones for q=qwf =0.14 rlu and are shown in Fig.10. As can be seen on the left-hand side of this figure, boththe TA and TO modes are well defined at 900 K. The scat-tering intensity below 1–2 meV increases sharply because ofthe comparatively coarser energy resolution intrinsic to BT9��0.5 meV HWHM�, which uses thermal neutrons, com-pared to that on SPINS. Even so, the TA mode is easily seenat both 900 and 700 K. However at 500 K the TA mode isless well defined. This occurs in part not only because themode has broadened but also because the low-energy scat-tering has increased, which results from the onset of thestrong diffuse scattering due to the PNR. At 300 K the TAmode is nearly indistinguishable from the sloping back-ground, and the TO mode has become significantly damped.One also sees a gradual softening of the TO mode from 900down to 300 K that is of order 1–2 meV. The same data weretaken in the �100� zone, which appear in the right-hand por-tion of Fig. 10. Essentially the same trends are observed inthis zone, with the TA mode again becoming almost indistin-guishable from background at 300 K. One difference is thatthe TA mode is better separated at all temperatures from thesteep increase in scattering seen at low energies. These dataare consistent with the conjecture of Stock et al.29 that thelow-energy TA phonon is coupled to the diffuse scatteringcentered around the elastic position. The inset on the toppanel on the right-hand side displays the full TA-TO phononspectrum at 900 K out to 20 meV.
The squares of the energies of both the TA and TO modespresented in the two previous figures are plotted versus tem-perature in Fig. 11. This is done to draw attention to thesimilarity between the low-energy lattice dynamics of PMNand the behavior expected for a conventional ferroelectric,for which the soft-mode frequency squared �2 varies linearly
FIG. 9. TA phonon line shapes in PMN measured on SPINSwith cold neutrons at Q� = �1.035,0.965,0� and �1.1,0.9,0� from 100to 900 K.
FIG. 10. TA and TO phonon line shapes in PMN measured onBT9 with thermal neutrons near the waterfall wave vector at Q�
= �3,−0.14,0� and �1,−0.14,0� from 300 to 900 K.
GEHRING et al. PHYSICAL REVIEW B 79, 224109 �2009�
224109-8
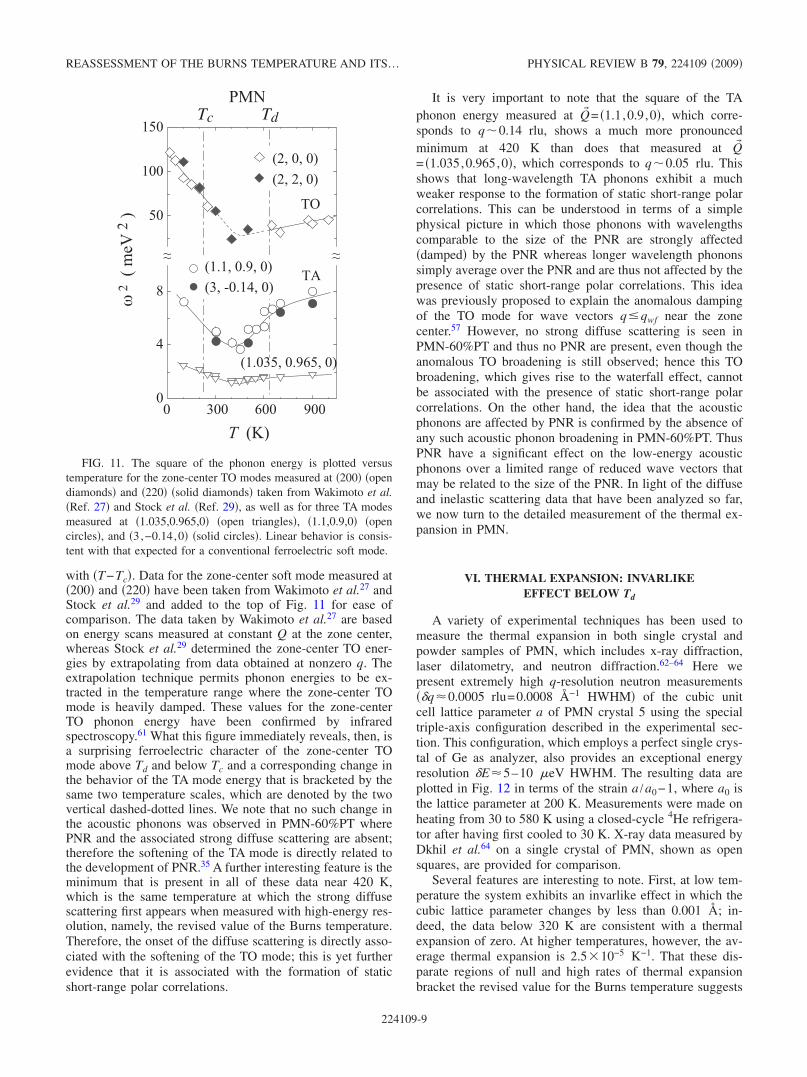
with �T−Tc�. Data for the zone-center soft mode measured at�200� and �220� have been taken from Wakimoto et al.27 andStock et al.29 and added to the top of Fig. 11 for ease ofcomparison. The data taken by Wakimoto et al.27 are basedon energy scans measured at constant Q at the zone center,whereas Stock et al.29 determined the zone-center TO ener-gies by extrapolating from data obtained at nonzero q. Theextrapolation technique permits phonon energies to be ex-tracted in the temperature range where the zone-center TOmode is heavily damped. These values for the zone-centerTO phonon energy have been confirmed by infraredspectroscopy.61 What this figure immediately reveals, then, isa surprising ferroelectric character of the zone-center TOmode above Td and below Tc and a corresponding change inthe behavior of the TA mode energy that is bracketed by thesame two temperature scales, which are denoted by the twovertical dashed-dotted lines. We note that no such change inthe acoustic phonons was observed in PMN-60%PT wherePNR and the associated strong diffuse scattering are absent;therefore the softening of the TA mode is directly related tothe development of PNR.35 A further interesting feature is theminimum that is present in all of these data near 420 K,which is the same temperature at which the strong diffusescattering first appears when measured with high-energy res-olution, namely, the revised value of the Burns temperature.Therefore, the onset of the diffuse scattering is directly asso-ciated with the softening of the TO mode; this is yet furtherevidence that it is associated with the formation of staticshort-range polar correlations.
It is very important to note that the square of the TAphonon energy measured at Q� = �1.1,0.9,0�, which corre-sponds to q�0.14 rlu, shows a much more pronouncedminimum at 420 K than does that measured at Q�= �1.035,0.965,0�, which corresponds to q�0.05 rlu. Thisshows that long-wavelength TA phonons exhibit a muchweaker response to the formation of static short-range polarcorrelations. This can be understood in terms of a simplephysical picture in which those phonons with wavelengthscomparable to the size of the PNR are strongly affected�damped� by the PNR whereas longer wavelength phononssimply average over the PNR and are thus not affected by thepresence of static short-range polar correlations. This ideawas previously proposed to explain the anomalous dampingof the TO mode for wave vectors q�qwf near the zonecenter.57 However, no strong diffuse scattering is seen inPMN-60%PT and thus no PNR are present, even though theanomalous TO broadening is still observed; hence this TObroadening, which gives rise to the waterfall effect, cannotbe associated with the presence of static short-range polarcorrelations. On the other hand, the idea that the acousticphonons are affected by PNR is confirmed by the absence ofany such acoustic phonon broadening in PMN-60%PT. ThusPNR have a significant effect on the low-energy acousticphonons over a limited range of reduced wave vectors thatmay be related to the size of the PNR. In light of the diffuseand inelastic scattering data that have been analyzed so far,we now turn to the detailed measurement of the thermal ex-pansion in PMN.
VI. THERMAL EXPANSION: INVARLIKEEFFECT BELOW Td
A variety of experimental techniques has been used tomeasure the thermal expansion in both single crystal andpowder samples of PMN, which includes x-ray diffraction,laser dilatometry, and neutron diffraction.62–64 Here wepresent extremely high q-resolution neutron measurements��q�0.0005 rlu=0.0008 Å−1 HWHM� of the cubic unitcell lattice parameter a of PMN crystal 5 using the specialtriple-axis configuration described in the experimental sec-tion. This configuration, which employs a perfect single crys-tal of Ge as analyzer, also provides an exceptional energyresolution �E�5–10 eV HWHM. The resulting data areplotted in Fig. 12 in terms of the strain a /a0−1, where a0 isthe lattice parameter at 200 K. Measurements were made onheating from 30 to 580 K using a closed-cycle 4He refrigera-tor after having first cooled to 30 K. X-ray data measured byDkhil et al.64 on a single crystal of PMN, shown as opensquares, are provided for comparison.
Several features are interesting to note. First, at low tem-perature the system exhibits an invarlike effect in which thecubic lattice parameter changes by less than 0.001 Å; in-deed, the data below 320 K are consistent with a thermalexpansion of zero. At higher temperatures, however, the av-erage thermal expansion is 2.5�10−5 K−1. That these dis-parate regions of null and high rates of thermal expansionbracket the revised value for the Burns temperature suggests
50
100
150
0 300 600 900
(2, 0, 0)
(2, 2, 0)
TO
0
4
8
(1.035, 0.965, 0)
~~ ~~
TA
T (K)
ω2(meV
2)
PMN
(1.1, 0.9, 0)
(3, -0.14, 0)
Tc Td
FIG. 11. The square of the phonon energy is plotted versustemperature for the zone-center TO modes measured at �200� �opendiamonds� and �220� �solid diamonds� taken from Wakimoto et al.�Ref. 27� and Stock et al. �Ref. 29�, as well as for three TA modesmeasured at �1.035,0.965,0� �open triangles�, �1.1,0.9,0� �opencircles�, and �3,−0.14,0� �solid circles�. Linear behavior is consis-tent with that expected for a conventional ferroelectric soft mode.
REASSESSMENT OF THE BURNS TEMPERATURE AND ITS… PHYSICAL REVIEW B 79, 224109 �2009�
224109-9

that a direct connection exists between the onset of staticshort-range polar correlations and the structural properties ofPMN. This behavior seems to be consistent with that of PZN,which also exhibits an increase in the thermal expansion attemperatures above that where the diffuse scattering firstappears.65
There is ample evidence of similar behavior reported byother groups in samples of PMN and PMN-xPT. A low-temperature invarlike effect was observed in single crystalPMN-10%PT, where a transition to a high rate of thermalexpansion was found at 400 K; the thermal expansion forthis sample at high temperature is 1�10−5 K−1, which isvery close to that measured here.66 The x-ray study of ce-ramic samples of PMN by King et al.67 also shows a transi-tion between low and high rates of thermal expansion butlarger values for both. X-ray and neutron work conducted byBonneau et al.68 on PMN powders yielded onset tempera-tures and values for the thermal expansion consistent withour single crystal measurements. Finally, an invar effect wasalso observed in the laser dilatometry study by Arndt andSchmidt63 on a ceramic sample of PMN, which covered arange from 300 to 800 K.
Even though there is a general trend toward a larger ther-mal expansion for temperatures above that where the diffusescattering is onset, there is some sample dependence andsome differences between powders and single crystals. Asnoted by Ye et al.,69 powder measurements of PMN yield adifferent slope for the thermal expansion measurements thando those of Dkhil et al.64 Also, studies using neutron strainscanning techniques found different thermal expansion coef-ficients as a function of depth in single crystal samples.70,71
Therefore, part of the discrepancy observed between differ-ent samples may be associated with surface effects. In thisregard, we also note the presence of a change in the slope of
the strain curve between 400 and 500 K; since this change isnot observed in other PMN studies, we believe this feature tobe sample dependent and thus extrinsic.
The phase-shifted model of polar nanoregions proposedby Hirota et al.52 provides a plausible starting point fromwhich to understand the anomalous invarlike behavior inPMN below the Burns temperature Td. This model is basedon the observation that the Pb, Mg, Nb, and O ionic displace-ments obtained from the diffuse scattering measurements ofVakhrushev et al.40 on PMN can be decomposed into acenter-of-mass conserving component, consistent with thecondensation of a soft transverse optic mode and a uniformscalar component, corresponding to an acoustic phase shift.In so doing Hirota et al.52 were able to reconcile the discrep-ancies between the structure factors of the diffuse scatteringand the soft TO modes and, in particular, to explain theweakness of the diffuse scattering intensity observed in thevicinity of the �200� Bragg peak.52 The idea that the PNR areuniformly displaced with respect to the underlying cubic lat-tice in a direction parallel to the PNR polarization has al-ready been used by Gehring et al.24 to explain the persistenceof the strong diffuse scattering in a single crystal of PZN-8%PT against large electric fields applied along �001�. In thatstudy it was shown that the diffuse scattering near �003�,which measures the projections of the ionic displacementsalong �001�, decreases under an external �001� field as ex-pected. By contrast, the diffuse scattering near �300�, whichmeasures the projections of the ionic displacements along�100�, i.e., perpendicular to the field direction, remains unaf-fected even for field strengths up to 10 kV/cm. Thus a uni-form polar state is not achieved. This surprising behavior canbe understood if one assumes that the electric field appliedalong �001� removes or reduces the PNR shifts along �001�while preserving those along �100�. The diffuse scatteringshould then decrease anisotropically with field, as is ob-served. In the context of the invarlike behavior of PMN be-low Td, we speculate that such uniform shifts of the PNRcould effectively stabilize the lattice against subsequent ther-mal expansion at lower temperature. Such a scenario is con-sistent with the fact that both PMN-10%PT and PMN-20%PT retain cubic structures down to low temperaturewhen examined with high q-resolution neutron diffractionmethods.66,72
VII. DISCUSSION AND CONCLUSIONS
We have presented a comprehensive neutron study of thediffuse scattering in the relaxor PMN. We have greatly ex-tended the time scales of previous neutron measurements bytaking data on three different spectrometers, BT9, SPINS,and the HFBS, which provide elastic energy resolutions of500, 120, and 0.4 eV HWHMs, respectively. While thebackscattering data represent a 300-fold improvement in en-ergy resolution over those obtained by Hiraka et al.28 onSPINS, both yield an onset temperature of 420�20 K forthe diffuse scattering. This indicates that the PNR in PMNare static on time scales of at least 2 ns below 420 K but areapparently dynamic at higher temperatures. Thus the trueBurns temperature in PMN, which was originally interpreted
0 100 200 300 400 500 600
0
5
10
15
20
25
T (Kelvin)
104 (a
/a0−
1)PMNBT9, 14.7 meV E
i, 15’−47’−20’−40’
Neutron
X−ray
FIG. 12. Lattice strain of single crystal PMN derived from the�220� Bragg reflection measured from 30 to 580 K on BT9. Datawere obtained on heating using a perfect Ge�004� analyzer, an in-cident neutron energy Ei=14.7 meV, and horizontal beam collima-tions of 15�-47�-S-20�-40� to obtain extremely high q resolution.X-ray data from Dkhil et al. �Ref. 64� are indicated by the opensquares for comparison.
GEHRING et al. PHYSICAL REVIEW B 79, 224109 �2009�
224109-10

by Burns and Dacol5 as the condensation temperature ofstatic regions of local, randomly oriented, nanometer-scalepolarization, is 420�20 K, not 620 K. Independent evi-dence of the existence of purely dynamic, short-range, polarcorrelations has been reported in PMN-55%PT, a composi-tion with no strong diffuse scattering and thus no static PNR,by Ko et al.73 who observed phenomena that are typicallyrelated to the relaxation of dynamic PNR. These include sig-nificant Brillouin quasielastic scattering, a softening of thelongitudinal acoustic phonon mode, and a deviation of thedielectric constant from Curie-Weiss behavior over an 80 Ktemperature interval above Tc.
Previous measurements of the temperature dependence ofthe neutron diffuse scattering have been extended in thisstudy to 900 K, well above Td. In so doing we have unam-biguously established the existence of two types of diffusescattering based on the observation of two markedly differenttemperature dependencies, one of which vanishes at Td andone of which does not. We associate the strong, temperature-dependent, diffuse scattering with the formation of static,short-range, polar correlations �PNR� because of its welldocumented response to an external electric field and be-cause it first appears at the same temperature at which thesoft �polar� TO mode reaches a minimum in energy. We as-sociate the weak, temperature-independent, diffuse scatter-ing, which shows no obvious change across either Tc or Td,with chemical short-range order because it persists to ex-tremely high temperature. We further confirm the observa-tions of Hiraka et al.,28 who first characterized the distinctlydifferent reciprocal space geometries of both types of diffusescattering, and we show that the bow-tie shape of the weakdiffuse scattering persists up to 900 K�Td.
Key effects of the strong, temperature-dependent, diffusescattering and thus of the PNR on the low-energy latticedynamics of PMN are also highlighted in this study. Theneutron inelastic measurements on PMN-60%PT by Stock etal.35 prove conclusively that PNR cannot be the origin of theanomalous broadening of long-wavelength TO modes ob-served in PMN, PZN, and other compounds, also known asthe waterfall effect, because PMN-60%PT exhibits the sameeffect but no strong diffuse scattering �no PNR�. By contrast,many studies have shown that PNR do broaden the TAmodes in PMN �Refs. 14, 15, and 29� and in PZN-xPT,42 butthat such effects are absent in compositions with no PNRsuch as PMN-60%PT.35 Our cold neutron data show thatthese effects are q dependent. Whereas long-wavelength TAmodes with reduced wave vectors q0.2 Å−1 remain welldefined and exhibit a nearly constant energy width �lifetime�from 100 to 900 K, shorter wavelength TA modes with re-duced wave vectors q�0.2 Å−1 broaden substantially, withthe maximum broadening occurring at Td=420 K. This re-sult motivates a very simple physical picture in which onlythose acoustic phonons having wavelengths comparable tothe size of the PNR are significantly scattered by the PNR;acoustic modes with wavelengths much larger than the PNRare largely unaffected because they simply average over thePNR. Models describing this effect have been discussedelsewhere.29 In particular, very recent work by Xu et al.74 hasrevealed the presence of a phase instability in PZN-4.5%PTthat is directly induced by such a PNR-TA phonon interac-
tion. This is shown to produce a pronounced softening andbroadening of TA modes in those zones where the diffusescattering is strong and provides a natural explanation of theenormous piezoelectric coupling in relaxor materials.74
In addition, we have performed neutron measurements ofthe thermal expansion with extremely high q and �� resolu-tions over a broad temperature range extending well belowTc and far above Td�420 K. In agreement with many otherstudies, our single crystal samples of PMN exhibit little or nothermal expansion below Td, behavior that is reminiscent ofthe invar effect, but an unusually large thermal expansioncoefficient of 2.5�10−5 K−1 above Td, where the strong dif-fuse scattering is absent. The crossover between null andlarge coefficients of thermal expansion coincides closelywith Td, which suggests that the appearance of static PNRstrongly affects the thermal expansion in PMN and thus pro-vides a structural signature of the formation of short-rangepolar correlations in zero field. The model of uniformly dis-placed, or phase-shifted, PNR proposed by Hirota et al.,52
which successfully predicts the anisotropic response of thestrong diffuse scattering to an electric field, offers a simplis-tic, yet plausible, framework in which to understand thisanomalous behavior.
Finally, it is satisfying to note that the revised value ofTd=420�20 K is consistent with the dielectric susceptibil-ity data of Viehland et al.,75 from which a Curie-Weiss tem-perature �=398 K was derived. Such good agreement be-tween Td and � solidifies our identification of the strongdiffuse scattering with the condensation of the soft TO mode,which reaches a minimum frequency at Td=420 K. How-ever this begs the question of how one should interpret theoriginal Burns temperature of �620 K. At present there aretwo broadly divergent opinions on this issue, one of whichconsiders �620 K to be a meaningful temperature scale inPMN and one of which does not. As it turns out, this debateis closely tied to another on how many temperature scales areneeded to describe the physics of relaxors. We offer no finalresolution to this discussion. Instead, we close our paper witha brief summary of the primary studies supporting these con-trasting points of view, which is by no means comprehen-sive, so that the readers may draw their own conclusions.
A number of experimental studies report evidence of ei-ther structural or dynamic changes in PMN in the tempera-ture range of 600–650 K, starting with the optical index ofrefraction measurements of Burns and Dacol.5 Siny andSmirnova76 were the first to observe strong first-order Ramanscattering in PMN at high temperatures, which, being forbid-den in centrosymmetric crystals, implied the presence ofsome type of lattice distortion. In 2002 Vakhrushev andOkuneva77 calculated the probability density function for thePb ion in PMN within the framework of the spherical layermodel using x-ray powder diffraction data. It was shown thatthis probability density evolves from a single Gaussian func-tion centered on the perovskite A site to a double Gaussianform between 635 and 573 K and that the positions ofmaximum density for the lead ion follow a power law�Td−T�0.31 with Td=635 K. This picture was developed fur-ther by Prosandeev et al. within a model that ascribed thechanges in the lead probability density function and subtlevariations in the thermal expansion near 620 K to a crossover
REASSESSMENT OF THE BURNS TEMPERATURE AND ITS… PHYSICAL REVIEW B 79, 224109 �2009�
224109-11
from soft-mode to order-disorder dynamics.78 In 2004 Egamiet al.79 first proposed that at very high temperatures the vi-brations of the oxygen octahedra are sufficiently faster thanthose of the Pb ions that, on average, a high-symmetry localenvironment is obtained, whereas at temperatures below�680 K the Pb and O ions become dynamically correlated.This led to the subsequent reinterpretation of the Burns tem-perature ��600 K� as being the point below which dynamicPNR first form, which was based on the dynamic PDF mea-surements of Dmowski et al.80 obtained with an elastic en-ergy resolution of 4 meV at six temperatures �680, 590, 450,300, 230, and 35 K�. Interestingly, after integrating their datafrom −5 to +5 meV, Dmowski et al.80 saw evidence of athird temperature scale in PMN of order 300 K, and thusdistinct from both Tc�210 K and Td�600 K, which theyassociated with the formation of static PNR. Similar ideashave very recently been put forth by Dkhil et al.64 based onextremely interesting acoustic emission and thermal expan-sion measurements and also in a general summary written byToulouse.81,82
A different approach was taken by Stock et al.83 whoproposed a unified description of the lead-based relaxors onthe basis of striking similarities between PMN and the Zn-analog PZN, both of which display strong, temperature-dependent, diffuse scattering, identical soft-mode dynamics,yet no long-range structural distortion at low temperature inzero field.84 Arguing by analogy with magnetic systems,Stock et al.83 considered a three-dimensional Heisenbergmodel with cubic anisotropy in the presence of random fieldsin which the Heisenberg spin corresponds to the local ferro-electric polarization, the cubic anisotropy represents the pref-erential orientation of the polarization along the �111 axes,and the isotropic random magnetic field corresponds to therandomly oriented local electric fields that originate from thevarying charge of the B-site cation. Following a suggestionby Aharony,85 Stock et al.83 considered the case where theHeisenberg term dominates over the random field term, andthe cubic anisotropy term is the weakest of the three. In thispicture there would be just two distinct, static, temperaturescales. For T�Td, the cubic anisotropy is irrelevant andtherefore the system should behave like a Heisenberg systemin a random field. In this case the excitation spectrum ischaracterized by Goldstone modes and therefore no long-range order is expected in the presence of random fields.85
Instead the system forms polar nanoregions in a paraelectricbackground. The second temperature scale Tc appears at lowtemperatures where the cubic anisotropy term becomes im-portant, and in this limit the system should resemble an Isingsystem in the presence of a random field. This model thusexplains the local ferroelectric distortion characterized by therecovery of the soft-optic mode and, although a 3D Isingsystem in equilibrium should display long-range order in thepresence of small random fields, as is observed in magneticsystems, nonequilibrium effects with long time scales be-come dominant. The presence of such nonequilibrium effectsmay explain the lack of long-range ferroelectric order inPMN and PZN, as well as the history dependence of physicalproperties such as the linear birefringence. The phase-shiftednature of the polar nanoregions may also create another en-ergy barrier against the ordered phase at Tc. Stock et al.83 are
also able to explain the physics of compounds beyond theMPB, such as PMN-60%PT, within this model, for whichonly one temperature scale �Tc� exists. As the Ti concentra-tion Ti increases, the relaxor phase diagram crosses over to aferroelectric regime, and this can be understood as an in-crease in the strength of the cubic anisotropy term that issimultaneously accompanied by a reduction in the randomfields as must occur in the limit of pure PbTiO3.35 It shouldbe mentioned that other studies have invoked random fieldsto explain the static and dynamic properties of relaxors.86–88
Independent of the validity of either of the two picturessummarized above, the seminal finding of our study remainsthat the strong diffuse scattering in PMN first appears at atemperature that depends sensitively on the energy resolutionof the measurement. This fact inevitably raises interestingquestions about the significance of the previous value of theBurns temperature ��620 K�. If the strong diffuse scatteringin PMN results from the soft TO mode, then other techniquesbased on x-ray diffraction, thermal neutron scattering, orneutron PDF, which provide comparatively much coarser en-ergy resolution, will be unable to discriminate between low-energy, dynamic, short-range polar correlations and trulystatic ���=0� PNR because any low-energy polar correla-tions will be integrated into the elastic channel by the broadenergy resolution. Thus as the TO mode softens, the associ-ated low-energy, polar, spectral weight will fall within theenergy resolution at temperatures above Td=420 K, and thenet result will be an artificially higher value of Td that in-creases with the size of the energy resolution. This effectshould be especially pronounced for phonon modes that arebroad in energy �i.e., that have short lifetimes�, and this isclearly the case for the soft TO mode in PMN, which exhib-its a nearly overdamped line shape and a minimum fre-quency precisely at Td=420 K. While it is true that thestructure factor of the strong diffuse scattering is inconsistentwith that of the soft TO mode, the phase-shifted model ofHirota et al.52 provides a way to reconcile this discrepancy.In this respect, we simply suggest that the previous value ofTd�620 K might not represent a physically meaningfultemperature scale in PMN. Future studies examining the val-ues of Td in other relaxor compounds with improved energyresolution are thus of interest.
Our reassessment of the Burns temperature Td immedi-ately clarifies an intimate relationship between the formationof static short-range polar correlations and the consequenteffects on both the low-energy lattice dynamics and structureof PMN. Cold neutron triple-axis and backscattering spectro-scopic methods conclusively show the existence of staticshort-range polar correlations only below Td=420�20 K ontime scales of at least 2 ns. Thermal neutron measurementsof the lattice dynamics reflect the presence of these staticPNR through the presence of a distinct minimum in both thesoft TO and TA mode energies, both of which occur at 420K. The effect of PNR on the lattice dynamics is evident onlyfor TA modes having wave vectors of order 0.2 Å−1, a factthat could be exploited to determine the size of the PNR. Atthe same time an enormous change in the coefficient of ther-mal expansion is seen near Td, below which the crystal lat-tice exhibits invarlike behavior.
GEHRING et al. PHYSICAL REVIEW B 79, 224109 �2009�
224109-12
ACKNOWLEDGMENTS
We would like to thank A. Bokov, Y. Fujii, K. Hirota,D. Phelan, S. Shapiro, S. Wakimoto, and G. Xu for stimulat-ing discussions. This study was supported in part by the US-Japan Cooperative Neutron-Scattering Program, the NaturalSciences and Engineering Research Council of Canada�NSERC�, the National Research Council of Canada �NRC�,the Japanese Ministry of Monbu-Kagaku-shou, the RFBR
under Grant Nos. 08-02-00908 and No. 06-02-90088NSF,the U.S. Department of Energy under Contract No. DE-AC02-98CH10886, the U.S. Office of Naval Research underGrant No. N00014-06-1-0166, and the NSF under Grant No.DMR-9986442. We also acknowledge the U.S. Departmentof Commerce, NIST Center for Neutron Research, for pro-viding the neutron scattering facilities used in this study,some of which are supported in part by the National ScienceFoundation under Agreement No. DMR-0454672.
1 Z.-G. Ye, Key Eng. Mater. 155-156, 81 �1998�.2 S.-E. Park and T. R. Shrout, J. Appl. Phys. 82, 1804 �1997�.3 A. A. Bokov and Z.-G. Ye, J. Mater. Sci. 41, 31 �2006�.4 B. E. Vugmeister, Phys. Rev. B 73, 174117 �2006�.5 G. Burns and F. H. Dacol, Solid State Commun. 48, 853 �1983�;
Phys. Rev. B 28, 2527 �1983�.6 P. Bonneau, P. Garnier, E. Husson, and A. Morell, Mater. Res.
Bull. 24, 201 �1989�.7 N. de Mathan, E. Husson, G. Calvarin, J. R. Gavarri, A. W.
Hewat, and A. Morell, J. Phys.: Condens. Matter 3, 8159�1991�.
8 J. Zhao, A. E. Glazounov, Q. M. Zhang, and B. Toby, Appl.Phys. Lett. 72, 1048 �1998�.
9 K. Hirota, S. Wakimoto, and D. E. Cox, J. Phys. Soc. Jpn. 75,111006 �2006�.
10 R. Blinc, V. Laguta, and B. Zalar, Phys. Rev. Lett. 91, 247601�2003�.
11 V. V. Shvartsman and A. L. Kholkin, Phys. Rev. B 69, 014102�2004�.
12 T. Egami, S. Teslic, W. Dmowski, P. K. Davies, and I.-W. Chen,J. Korean Phys. Soc. 32, S935 �1998�; T. Egami, W. Dmowski,S. Teslic, P. K. Davies, I. W. Chen, and H. Chen, Ferroelectrics206, 231 �1998�.
13 I.-K. Jeong, T. W. Darling, J. K. Lee, Th. Proffen, R. H. Heffner,J. S. Park, K. S. Hong, W. Dmowski, and T. Egami, Phys. Rev.Lett. 94, 147602 �2005�.
14 A. Naberezhnov, S. B. Vakhrushev, B. Dorner, and H. Moudden,Eur. Phys. J. B 11, 13 �1999�.
15 T. Y. Koo, P. M. Gehring, G. Shirane, V. Kiryukhin, S. G. Lee,and S. W. Cheong, Phys. Rev. B 65, 144113 �2002�.
16 S. Vakhrushev, A. Naberezhnov, S. K. Sinha, Y. P. Feng, and T.Egami, J. Phys. Chem. Solids 57, 1517 �1996�.
17 H. You and Q. M. Zhang, Phys. Rev. Lett. 79, 3950 �1997�.18 G. Xu, G. Shirane, J. R. D. Copley, and P. M. Gehring, Phys.
Rev. B 69, 064112 �2004�.19 G. Xu, Z. Zhong, Y. Bing, Z.-G. Ye, and G. Shirane, Nature
Mater. 5, 134 �2006�.20 M. Matsuura, K. Hirota, P. M. Gehring, Z.-G. Ye, W. Chen, and
G. Shirane, Phys. Rev. B 74, 144107 �2006�.21 G. Xu, Z. Zhong, H. Hiraka, and G. Shirane, Phys. Rev. B 70,
174109 �2004�.22 S. B. Vakhrushev, A. A. Naberezhnov, N. M. Okuneva, and B.
N. Savenko, Phys. Solid State 40, 1728 �1998�.23 C. Stock, G. Xu, P. M. Gehring, H. Luo, X. Zhao, H. Cao, J. F.
Li, D. Viehland, and G. Shirane, Phys. Rev. B 76, 064122�2007�.
24 P. M. Gehring, K. Ohwada, and G. Shirane, Phys. Rev. B 70,014110 �2004�.
25 G. Xu, P. M. Gehring, and G. Shirane, Phys. Rev. B 72, 214106�2005�.
26 G. Xu, P. M. Gehring, and G. Shirane, Phys. Rev. B 74, 104110�2006�.
27 S. Wakimoto, C. Stock, R. J. Birgeneau, Z.-G. Ye, W. Chen, W.J. L. Buyers, P. M. Gehring, and G. Shirane, Phys. Rev. B 65,172105 �2002�.
28 H. Hiraka, S.-H. Lee, P. M. Gehring, G. Xu, and G. Shirane,Phys. Rev. B 70, 184105 �2004�.
29 C. Stock, H. Luo, D. Viehland, J. F. Li, I. Swainson, R. J. Bir-geneau, and G. Shirane, J. Phys. Soc. Jpn. 74, 3002 �2005�.
30 J. Hlinka, S. Kamba, J. Petzelt, J. Kulda, C. A. Randall, and S. J.Zhang, J. Phys.: Condens. Matter 15, 4249 �2003�.
31 S. N. Gvasaliya, S. G. Lushnikov, and B. Roessli, Crystallogr.Rep. 49, 108 �2004�.
32 S. N. Gvasaliya, S. G. Lushnikov, and B. Roessli, Phys. Rev. B69, 092105 �2004�.
33 The study by Hlinka et al. �Ref. 30� employed a much narrowerenergy resolution of 30 eV full width at half maximum�FWHM� than did the studies of Gvasaliya et al. �Ref. 32� andHiraka et al. �Ref. 28� �200 eV FWHM�.
34 B. P. Burton, E. Cockayne, S. Tinte, and U. V. Waghmare, PhaseTransitions 79, 91 �2006�.
35 C. Stock, D. Ellis, I. P. Swainson, Guangyong Xu, H. Hiraka, Z.Zhong, H. Luo, X. Zhao, D. Viehland, R. J. Birgeneau, and G.Shirane, Phys. Rev. B 73, 064107 �2006�.
36 G. Xu, P. M. Gehring, V. J. Ghosh, and G. Shirane, Acta Crys-tallogr., Sect. A: Found. Crystallogr. 60, 598 �2004�.
37 A. Meyer, R. M. Dimeo, P. M. Gehring, and D. A. Neumann,Rev. Sci. Instrum. 74, 2759 �2003�.
38 W. Chen and Z.-G. Ye �unpublished�; Z.-G. Ye, P. Tissot, and H.Schmid, Mater. Res. Bull. 25, 739 �1990�.
39 S. B. Vakhrushev �private communication�.40 S. B. Vakhrushev, A. A. Naberezhnov, N. M. Okuneva, and B.
N. Savenko, Phys. Solid State 37, 1993 �1995�.41 S. Vakhrushev, A. Ivanov, and J. Kulda, Phys. Chem. Chem.
Phys. 7, 2340 �2005�.42 D. La-Orauttapong, J. Toulouse, Z. G. Ye, W. Chen, R. Erwin,
and J. L. Roberston, Phys. Rev. B 67, 134110 �2003�.43 These authors show schematic diffuse scattering intensity con-
tours in Fig. 4 of their paper �no data are shown� for PZN-4.5%PT and PZN-9%PT that are wrong because they do notpossess the required crystal lattice symmetry.
44 T. R. Welberry, D. J. Goossens, and M. J. Gutmann, Phys. Rev.
REASSESSMENT OF THE BURNS TEMPERATURE AND ITS… PHYSICAL REVIEW B 79, 224109 �2009�
224109-13
B 74, 224108 �2006�.45 T. R. Welberry, M. J. Gutmann, Hyungje Woo, D. J. Goossens,
Guangyong Xu, and C. Stock, J. Appl. Crystallogr. 38, 639�2005�.
46 S. Wakimoto, G. A. Samara, R. K. Grubbs, E. L. Venturini, L. A.Boatner, G. Xu, G. Shirane, and S.-H. Lee, Phys. Rev. B 74,054101 �2006�.
47 M. Pasciak, M. Wolcyrz, and A. Pietraszko, Phys. Rev. B 76,014117 �2007�.
48 B. P. Burton and E. Cockayne, Phys. Rev. B 60, R12542 �1999�.49 V. V. Laguta, M. D. Glinchuk, S. N. Nokhrin, I. P. Bykov, R.
Blinc, A. Gregorovic, and B. Zalar, Phys. Rev. B 67, 104106�2003�.
50 C. Boulesteix, F. Varnier, A. Llebaria, and E. Husson, J. SolidState Chem. 108, 141 �1994�.
51 O. Svitelskiy, J. Toulouse, G. Yong, and Z.-G. Ye, Phys. Rev. B68, 104107 �2003�.
52 K. Hirota, Z.-G. Ye, S. Wakimoto, P. M. Gehring, and G.Shirane, Phys. Rev. B 65, 104105 �2002�.
53 R. Comes, M. Lambert, and A. Guinier, Acta Crystallogr., Sect.A: Cryst. Phys., Diffr., Theor. Gen. Crystallogr. 26, 244 �1970�.
54 S. N. Gvasaliya, B. Roessli, R. A. Cowley, P. Huber, and S. G.Lushnikov, J. Phys.: Condens. Matter 17, 4343 �2005�.
55 S. Wakimoto, C. Stock, Z.-G. Ye, W. Chen, P. M. Gehring, andG. Shirane, Phys. Rev. B 66, 224102 �2002�.
56 H. Sompolinsky and A. Zippelius, Phys. Rev. B 25, 6860�1982�.
57 P. M. Gehring, S.-E. Park, and G. Shirane, Phys. Rev. Lett. 84,5216 �2000�.
58 P. M. Gehring, S. B. Vakhrushev, and G. Shirane, in Fundamen-tal Physics of Ferroelectrics 2000: Aspen Center for PhysicsWinter Workshop, AIP Conf. Proc. No. 535, edited by R. E.Cohen �AIP, New York, 2000�, p. 314.
59 P. M. Gehring, S. Wakimoto, Z.-G. Ye, and G. Shirane, Phys.Rev. Lett. 87, 277601 �2001�.
60 P. M. Gehring, S.-E. Park, and G. Shirane, Phys. Rev. B 63,224109 �2001�.
61 V. Bovtun, S. Kamba, A. Pashkin, M. Savinov, P. Samoukhina, J.Petzelt, I. P. Bykov, and M. D. Glinchuk, Ferroelectrics 298, 23�2004�.
62 L. A. Shebanov, P. P. Kapostins, and J. A. Zvirgds, Ferroelectrics56, 53 �1984�.
63 H. Arndt and G. Schmidt, Ferroelectrics 79, 149 �1988�.64 B. Dkhil, J. M. Kiat, G. Calvarin, G. Baldinozzi, S. B. Vakhru-
shev, and E. Suard, Phys. Rev. B 65, 024104 �2001�.65 D. K. Agrawal, A. Halliyal, and J. Belsick, Mater. Res. Bull. 23,
159 �1988�.66 P. M. Gehring, W. Chen, Z.-G. Ye, and G. Shirane, J. Phys.:
Condens. Matter 16, 7113 �2004�.67 H. W. King, M. Yildiz, S. H. Ferguson, D. F. Waechter, and S. E.
Prasad, Ferroelectr., Lett. Sect. 31, 55 �2004�.68 P. Bonneau, P. Garnier, G. Calvarin, E. Husson, J. R. Gavarri, A.
W. Hewat, and A. Morell, J. Solid State Chem. 91, 350 �1991�.69 Z.-G. Ye, Y. Bing, J. Gao, A. A. Bokov, P. Stephens, B. Noheda,
and G. Shirane, Phys. Rev. B 67, 104104 �2003�.70 K. H. Conlon, H. Luo, D. Viehland, J. F. Li, T. Whan, J. H. Fox,
C. Stock, and G. Shirane, Phys. Rev. B 70, 172204 �2004�.71 G. Xu, P. M. Gehring, C. Stock, and K. Conlon, Phase Transi-
tions 79, 135 �2006�.72 G. Xu, D. Viehland, J. F. Li, P. M. Gehring, and G. Shirane,
Phys. Rev. B 68, 212410 �2003�.73 J.-H. Ko, S. Kojima, A. A. Bokov, and Z.-G. Ye, Appl. Phys.
Lett. 91, 252909 �2007�.74 G. Xu, J. Wen, C. Stock, and P. M. Gehring, Nature Mater. 7,
562 �2008�.75 D. Viehland, S. J. Jang, L. E. Cross, and M. Wuttig, Phys. Rev. B
46, 8003 �1992�.76 I. G. Siny and T. A. Smirnova, Ferroelectrics 90, 191 �1989�.77 S. B. Vakhrushev and N. M. Okuneva, in Fundamental Physics
of Ferroelectrics, AIP Conf. Proc. No. 626, edited by R. E. Co-hen �AIP, New York, 2002�, p. 117.
78 http://arxiv.org/ftp/cond-mat/papers/0506/0506132.pdf79 T. Egami, W. Dmowski, I.-K. Jeong, R. H. Heffner, J.-S.
Park, K.-S. Hong, M. Hehlen, and F. Trouw, in FundamentalPhysics of Ferroelectrics, Williamsburg Conf. Proc., edited byR. E. Cohen and P. M. Gehring �Washington, D.C., 2004�,p. 58. �http://people.gl.ciw.edu/cohen/meetings/ferro2004/Ferro2004Abstractbook.pdf�.
80 W. Dmowski, S. B. Vakhrushev, I.-K. Jeong, M. P. Hehlen, F.Trouw, and T. Egami, Phys. Rev. Lett. 100, 137602 �2008�.
81 M. Roth, E. Mojaev, E. Dul’kin, P. Gemeiner, and B. Dkhil,Phys. Rev. Lett. 98, 265701 �2007�.
82 J. Toulouse, Ferroelectrics 369, 203 �2008�.83 C. Stock, R. J. Birgeneau, S. Wakimoto, J. S. Gardner, W. Chen,
Z.-G. Ye, and G. Shirane, Phys. Rev. B 69, 094104 �2004�.84 G. Xu, Z. Zhong, Y. Bing, Z.-G. Ye, C. Stock, and G. Shirane,
Phys. Rev. B 67, 104102 �2003�.85 A. Aharony �private communication�.86 V. Westphal, W. Kleemann, and M. D. Glinchuk, Phys. Rev. Lett.
68, 847 �1992�.87 R. Pirc and R. Blinc, Phys. Rev. B 60, 13470 �1999�.88 R. Fisch, Phys. Rev. B 67, 094110 �2003�.
GEHRING et al. PHYSICAL REVIEW B 79, 224109 �2009�
224109-14

 O3 ceramics](https://static.fdokumen.com/doc/165x107/6327e6759f8521b2bb016ffe/structural-refinement-optical-and-electrical-properties-of-ba1-x-sm2x3zr0.jpg)
![MICROWAVE DIELECTRIC PROPERTIES OF CA[(LI1/3A2/3)1-XMX]O3-d [A=NB, TA AND M=TI, ZR, SN] COMPLEX PEROVSKITES: A REVIEW Sumesh](https://static.fdokumen.com/doc/165x107/6331727e2055169fc2032fb5/microwave-dielectric-properties-of-cali13a231-xmxo3-d-anb-ta-and-mti.jpg)