Nature of atomic ordering and mechanism of relaxor ferroelectric phenomena in PMN
464
Volume 206 Numbers 1-4 (1998 FERROAS 206 (i-4> & 207 (1-2) wm . «,,„„„, (1998) ISSN: 0015-0193 Volume 207 Numbers 1-2 (1998) OB GORDON AND BREACH SCIENCE PUBLISHERS
Transcript of Nature of atomic ordering and mechanism of relaxor ferroelectric phenomena in PMN

Volume 206 Numbers 1-4 (1998 FERROAS 206 (i-4> & 207 (1-2) wm . «,,„„„, (1998) ISSN: 0015-0193
Volume 207 Numbers 1-2 (1998)
OB GORDON AND BREACH SCIENCE PUBLISHERS

FERROELECTRICS and related materials
EDITOR: George W. Taylor Princeton Resources, P.O. Box 211, Princeton, New Jersey 08542-0211, U.S.A
Sidney B. Lang Department of Chemical Engineering Ben Gurion University of the Neger
Beer Sheva 84120, Israel '
Bibliographers Koichi Toyodo (Ferroelectrics) S. B. Lang (Pyroelectrics)
Ryuji Abe. Nagoya, Japan F. Ainser. Northhampton.
United Kingdom K. S. Aleksandrov.
Krasnojar.sk, Russia A.S. Bhalla. University Park.
Pennsylvania R. Blinc. Ljubljana. Slovenia L. E. Cross. University Park,
Pennsylvania V. Dvorak. Prague.
Czech Republic J. Foiisek. Prague.
Czech Republic V. M. Fridkin. Moscow, Russia A. M. Glass. Murray Hill, New Jersey J. A. Gonzalo. Madrid, Spain
ASSOCIATE EDITORS Jan Petzelt
Institute of Physics Academy of Sciences of the
Czech Republic 18040 Prague 8
Lihen Na Slovance2, Czech Republic
EDITORIAL BOARD Peter Günter. Zürich, Switzerland G. H. Haertling, Clemson,
South, Carolina W. Hcywang, Munich, Germany B. Hilczer. Poznan. Poland Sadao Höshino, Yokohama, Japan V. Janoec. Prague, Czech Republic T. Janssen, Nijmegen, The Netherlands Jinzo Kobayashi, Tokyo, Japan S. K. Kurtz. University Park,
Pennsylvania S. Lagerwall. Göteborg, Sweden W. J. Lawless. Westerville, Ohio R. Le Bihan, Names, France V. V. Lemanov, St. Petersburg, Russia K. A. Müller, Zürich, Switzerland Jörn Petersson, Saarbrücken, Germany
Koichi Toyoda Research Institute of Electronic
Shizuoka University Hamamatsu 432, Japan
Book Review Editor S. C. Abrahams, Ash/and, Oregon
G. A. Samara. Albuquerque, New Mexico
Shozo Sawada. Iwaki-Shi, Japan H. Schmid, Geneva, Switzerland V. Hugo Schmidt. Bozeman, Montana James F. Scott, Sydney, Australia L. A. Shuvalov, Moscow, Russia W. A. Smith, Arlington, Virginia J. Stankowski. Poznan, Poland E. C. Subbarao, Pune, India Kenji Uchino, University Park,
Pennsylvania F. G. Ullman, Lincoln, Nebraska Yao Xi, People's Republic of China Zhi-wen Yin, Shanghai,
People's Republic of China
GENERAL INFORMATION AimS and SCOpe Ferrroclectrics is designed to provide a forum for people working in ferroelectrics and related materials such as ferroelastics. ferroelectric-ferromagnetics, electrooptics, piezoelectrics. pyroelectrics, nonlinear dielectrics, and liquid crystals. Ferroelectrics publishes experimental and theoretical papers aimed at the understanding of ferroelectricity and associated phenomena and applied papers dealing with the utilization of these materials in devices and systems. An impor- tant aspect of Ferroelectrics is to provide a vehicle for the publication of interdisciplinary papers involving ferroelectricity.
The editor invites original papers and short communications on the theory, fabrication, properties, and applications of ferro- electrics and related materials. In addition to research papers, Ferroelectrics publishes appropriate and timely review articles. There are no charges to authors or to institutions.
Indexing: FERROELECTRICS is indexed in Science Citation Index. SciSearch, Research Alert, Chemistry Citation Index, Materials Science Citation Index and Current Contents/Physical, Chemical & Earth Sciences.
Notes for contributors can be found at the back of the journal
Please see inside back cover for information on subscription rates and ordering information.
C 199S OPA (Overseas Publishers Association) Amsterdam B.V. Published under license under the Gordon and Breach Science Publishers imprint. All rights reserved.
Except as permitted under national laws or under the photocopy license described below, no part of this publication may be reproduced or transmitted in any form or by any means, electronic, mechanical, photocopying or otherwise, or stored in a retrieval system of any nature, without the advance written permission of the Publisher.
A CD-ROM ARCHIVE Version (which may include visual data such as 3-D animations and video clips) is available for this journal at a nominal extra charge to subscribers.
World Wide Web Addresses
Additional information is also available through the Publisher's web home page site at http://www.gbhap.com. Full text on-line access and electronic author submissions may also be available.
Editorial enquiries by e-mail: <cditlink@gbhap. com>.
Printed in India.
FEBRUARY 1998 (Continued on inside back cover)

UNIVERSITY OF ILLINOIS AT URBANA-CHAMPAIGN
April 21, 1998
Department of Materials Science and Engineering College of Engineering 1304 West Green Street Urbana, IL 61801
Office of Naval Research Wallace A. Smith, Program Officer, Code 332 Ballston Tower One 800 North Quincy Street Arlington, VA 22217-5660
SUBJECT: ONR Grant N00014-96-1-1102
Dear Dr. Smith:
Enclosed are four (4) copies of the Proceedings from the Williamsburg Conference on Ferroelectrics that was supported by the subject grant. These copies are being submitted as the final report in accordance with the terms of the grant. The support provided by ONR is sincerely appreciated.
Should you have any questions, please feel free to contact me at (217) 333-7636 at your convenience.
Haydh Chen Professor
Enclosures
Cc: Grants Administrator, Chicago (letter only) Defense technical Information Center (1 copy of Proceedings) UnJC Grants & Contracts
Telephone (217) 333-1441 • Fax (217) 333-2736

PROCEEDINGS OF
THE 1997 WILLIAMSBURG WORKSHOP ON FERROELECTRICS
Williamsburg, Virginia 2-5 February 1997
Guest Editor
Haydn Chen
Sponsors
Office of Naval Research University of Illinois, Urbana-Champaign
Gordon and Breach Science Publishers S.A.

FERROELECTRICS
Volumes 206-207 (1998)
CONTENTS
GUEST EDITORIAL HAYDN CHEN vii
FIRST-PRINCIPLES STUDY OF PIEZOELECTRICITY IN TETRAGONAL PbTi03
G. SÄGHI-SZABÖ, R. E. COHEN AND H. KRAKAUER 1
SOLITON DYNAMICS OF GEOMETRICALLY CONFINED FERROELECTRIC LIQUID CRYSTALS
R. BLINC, I. MUSEVIC AND M. SKARABOT 11
THEORETICAL EXAMINATION OF STRESS FIELDS IN Pb(Zr0.5Ti0.5)O3
N. J. RAMER, E. J. MELE AND A. M. RAPPE 31
ACOUSTIC MODE INSTABILITIES IN FERROELECTRICS: ANHARMONIC MODE-MODE COUPLING INDUCED BY ELECTRON-PHONON INTERACTIONS
A. BUSSMANN-HOLDER 47
ELECTRONIC STRUCTURES AND THE PHASE STABILITY OF PEROVSKITE-TYPE OXIDES KNb03 AND KTa03
M. KITAMURA AND H. CHEN 55
FIRST-PRINCIPLES CALCULATIONS FOR Fe IMPURITIES IN KNb03
A. V. POSTNIKOV, A. I. POTERYAEV AND G. BORSTEL 69
APPLICATION OF TIKHONOV REGULARIZATION TO DIPOLE GLASS RELAXATION FUNCTION
B.-G. KIM AND J.-J. KIM 79
DTICQüiLUTx liyi&tfiCi'JEDft

iv CONTENTS
FIELD-INDUCED PIEZOELECTRIC RESONANCES IN THE SUPERPARAELECTRIC PHASE OF KTN
J. TOULOUSE AND R. PATTNAIK 93
DISCRIMINATING BETWEEN THE DISPLACIVE VS. ORDER-DISORDER CHARACTER OF A PHASE TRANSITION BY MAGIC ANGLE SPINNING NMR
A. N. KLYMACHYOV AND N. S. DALAL 103
THRESHOLD OF IRREVERSIBLE DOMAIN WALL MOTION IN SOFT PZT-PIEZOCERAMIC
V. MUELLER AND Q. M. ZHANG 113
CRYSTAL STRUCTURE ANALYSIS AND POLARIZATION MECHANISMS OF FERROELECTRIC TETRAGONAL TUNGSTEN BRONZE LEAD BARIUM NIOBATE
R. GUO, H. T. EVANS, JR. AND A. S. BHALLA 123
PRECURSOR STRUCTURES IN FERROELECTRICS FROM FIRST-PRINCIPLES CALCULATIONS
H. KRAKAUER, R. YU, C.-Z. WANG AND C. LASOTA 133
FERROELECTRIC TRANSITION IN A RANDOM FIELD: POSSIBLE RELATION TO RELAXOR FERROELECTRICS
S. SEMENOVSKAYA AND A. G. KHACHATURYAN 157
FIRST-PRINCIPLES THEORY OF STRUCTURAL PHASE TRANSITIONS FOR PEROVSKITES: COMPETING INSTABILITIES
D. VANDERBILT AND W. ZHONG 181
AB INITIO PHONON DISPERSION CURVES AND INTERATOMIC FORCE CONSTANTS OF BARIUM TITANATE
PH. GHOSEZ, X. GONZE AND J.-P. MICHENAUD 205
LATTICE DYNAMICS STUDY ON CUBIC BARIUM TITANATE BASED UPON A MODIFIED RIGID-SHELL MODEL
N. TAKESUE, H. KUBO AND H. CHEN 219

CONTENTS v
NATURE OF ATOMIC ORDERING AND MECHANISM OF RELAXOR FERROELECTRIC PHENOMENA IN PMN
T. EGAMI, W. DMOWSKI, S. TESLIC, P. K. DAVIES, I.-W. CHEN AND H. CHEN 231
A DOMAIN WALL MODEL FOR RELAXOR FERROELECTRICS
I-WEI CHEN AND Y. WANG 245
A PHENOMENOLOGY OF RELAXOR-FERROELECTRIC PHASE TRANSITIONS
B. E. VUGMEISTER AND H. RABITZ 265
THE INFLUENCE OF MOBILE VS. RANDOMLY QUENCHED IMPURITIES ON FERROELECTRIC PHASE TRANSFORMATIONS
Q. TAN, J.-F. LI AND D. VIEHLAND 275
VARIATION IN THE ORDERING OF Ba(Zni/3Ta2/3)03 WITH A-SITE SUBSTITUTIONS
C.-C. LEE, C.-C. CHOU AND D.-S. TSAI 293
TRANSITION DYNAMICS IN RELAXOR FERROELECTRICS I. G. SINY AND R. S. KATIYAR 307
FINITE SIZE EFFECTS IN A BaTi03 FERROELECTRIC GLASS CERAMIC
C. A. RANDALL, D. E. McCAULEY AND D. P. CANN 325
THE ROLE OF INTERFACES ON AN APPARENT GRAIN SIZE EFFECT ON THE DIELECTRIC PROPERTIES FOR FERROELECTRIC BARIUM TITANATE CERAMICS
M. H. FREY, Z. XU, P. HAN AND D. A. PAYNE 337
ELASTIC PROPERTY CHARACTERIZATION IN THIN SAMPLES OF SUB-WAVELENGTH IN THICKNESS
W. CAO 355
FUTURE ISSUES IN FERROELECTRIC MINIATURIZATION J. F. SCOTT 365

vi CONTENTS
PIEZOELECTRICITY IN FERROELECTRIC THIN FILMS: DOMAIN AND STRESS ISSUES
S. TROLIER-MCKINSTRY, J. F. SHEPARD, JR.,
J. L. LACEY, T. SU, G. ZAVALA AND J. FENDLER 381
STRUCTURE CONTROL OF PULSED-LASER-DEPOSITED Pbo.6Sro.4Ti03/Lao.5Sro.5Co03 THIN FILMS ON VARIOUS SUBSTRATES
C.-C. CHOU, C.-S. HOU AND H.-F. CHENG 393
LOCAL STRUCTURE AND THE PHASE TRANSITIONS OF BaTi03
B. RAVEL, E. A. STERN, R. I. VEDRINSKII AND V. KRAIZMAN 407
AUTHOR INDEX i
ANNOUNCEMENTS

GUEST EDITORIAL
This volume contains twenty nine of the forty papers presented at the 1997 Williamsburg Workshop on Ferroelectrics which was held between February 2-5, 1997. Since the first workshop began at historical Williamsburg in 1990, the number of participants has expanded and the range of studies has broadened. The 1997 Workshop was the largest ever in both the number of attendents involved and the number of papers present- ed. Since 1993, this annual workshop has taken a new organizational approach, that is in alternate years the emphasis of the workshop will be placed, upon theories and experimental results, respectively. It was later decided that Ronald Cohen of Carnegie Institute of Washington will organize the workshops every other year to address the recent theore- tical development, whereas Haydn Chen of University of Illinois at Urbana-Champaign and Takeshi Egami of University of Pennsylvania will co-organize the workshops in alternate fashion to focus on experimental discoveries of ferroelectricity.
The 1997 Williamsburg Workshop started off with three thematic presentations by Ronald Cohen on First Principles Studies, by Eric Cross on Relaxor Ferroelectrics, and by Robert Bline on "Soliton Dynamics of Geometrically Confined Ferroelectric and Antiferroelectric Liquid Crystals". They were then followed by 35 oral presentations and 2 poster papers.
The 1997 Williamsburg Workshop had two main focuses: (1) Relaxor Ferroelectrics, and (2) Geometrically Confined Ferroelectrics. Relaxor ferroelectrics are a class of materials in which imperfectly understood inter- nal mechanisms prevent the development of full ferroelectricity. The substantial technical potential of relaxor ferroelectrics is manifest in their very large dielectric susceptibility and huge, tunable piezoelectricity, optical birefringence, and non-linear optical properties. Two sessions of this workshop were devoted to this topic. Geometrically confined ferroelectrics refer to ferroelectric materials in the form of thin films, nano particles, or strained conditions so that the materials microstructure and their corresponding properties are influenced by external confinements.The synthesis and processing in geometrically confined modes are of practical importance. The resulting structure and properties often exhibit unusual phenomena which are far from totally understood. Ten papers addressed this topic including interfaces, size effects and thin films of ferroelectrics.

viii GUEST EDITORIAL
As the Guest Editor and the 1997 Williamsbug Workshop organizer, I would like to express my sincere appreciation to Judy Brewer of the University of Illinois for her able assistance in every phase of the organiza- tional matters. Thanks are also due to my students, Chung-hisung Lin and Vijay Gosula, who helped at the workshop. Acknowledgement is also extended to the Office of Naval Research, University of Illinois and Gordon & Breach, the Publisher for providing needed financial support.
Haydn Chen Department of Materials Science & Engineering
University of Illinois Urbana, Illinois 61801, USA
August 1997

Ferroelectrics, 1998, Vols. 206-207, pp. I-10 Reprints available directly from the publisher Photocopying permitted by license only
) 1998 OPA (Overseas Publishers Association) Amsterdam B.V. Published under license
under the Gordon and Breach Science Publishers imprint.
Printed in India.
FIRST-PRINCIPLES STUDY OF PIEZOELECTRICITY
IN TETRAGONAL PbTi03
GOTTHARD SÄGHI-SZABÖ a, RONALD E. COHEN a
and HENRY KRAKAUER b
a Carnegie Institution of Washington, 5251 Broad Branch Rd., N.W., Washington, D.C. 20015-1305, USA;
b College of William and Mary, Williamsburg, VA, USA
(Received 10 April 1997; In final form 16 September 1997)
The e33 component of the piezoelectric strain tensor in tetragonal PbTi03 was studied by an all- electron ab initio method, and was found to be in good agreement with the experimental piezoelectric stress constant of high quality twin-free single PbTi03 crystals. Equations of the density functional theory were solved within the general gradient approximation (GGA) using the general potential linearized augmented plane-wave local orbital (LAPW + LO) method. Macroscopic polarization values necessary to calculate the piezoelectric coefficient and elements of the Born effective charge tensors were determined via finite differences using the geometric phase formulation. In this approach, bulk quantities are expressed as the property of the phase of the wavefunction in terms of a Berry connection. The £33 component of the piezoelectric tensor, i.e. the change in polarization with strain, was extracted from results of groundstate Berry's phase calculations performed on units cells of different strains and volumes, We found that in PbTi03 the large intrinsic piezoelectric response is mainly due to strong coupling between macroscopic strain and internal microscopic strain, giving the value of 3.23 C/m2 for the e33 modulus.
Keywords: LAPW; PbTi03; macroscopic strain
1. INTRODUCTION
Polycrystalline ceramics based on PbZr!^xTix03 (PZT) are the materials of choice in a wide range of applications including actuators, ultrasonic transducers, piezoelectric transformers and acoustic scanners [1]. Most of these applications require materials with high electromechanical coupling

2 G. SAGHI-SZABO et al.
factors. This factor, which depends on the geometry of the sample is defined as
, stored mechanical energy .„ ,, K =—■ \ ;—; — (I-1) input electrical energy
or 2 stored electrical energy
nz = . r : r DJ (1.2) input mechanical energy
Generally, coupling factor values of higher than 75% are required in many modern applications. Another widely used parameter to characterize electroactive materials is the piezoelectric stress coefficient dy, which describes the strain induced in materials at a given applied electric field. The piezoelectric stress coefficient d and electromechanical coupling factor K
are interrelated by the equation
„2=^, (1.3) EEQS
where e is the dielectric constant, e0 is the permittivity of vacuum and s is the elastic compliance. All of these parameters can be computed by ab initio methods, thus giving us a better understanding of the underlying principles of piezoelectricity at the microscopic level. In the near future, theory can actively participate in the design of high quality ferroelectric and piezo- electric crystals of technological importance.
A new category of relaxor-based piezoelectric materials, originally discovered by Kuwata et al. [2], has been synthesized recently with very high electromechanical coupling properties and low dielectric loss[3'4]. In these single-crystal materials, in contrast to PZT based polycrystalline ceramics, compositions near a morphotropic phase boundary (MPB) were not necessary in order to achieve high piezoelectric strain. This paper investigates the piezoelectric properties of PbTi03 (PT), which is the end- member of both the technologically important PZT based ceramics and the newly discovered relaxor-PT materials, represented by PbZn1/3Nb2/303- PbTi03 (PZN-PT) and PbMg1/3Nb2/303-PbTi03 (PMN-PT).
At low temperatures PbTi03 is ferroelectric with tetragonal perovskite structure. It has a clearly established tetragonal (P4mm) to cubic (Pm3m)^ phase transition at 493°C. Recently, first-principles density-functional computations on perovskite type oxides were successful in quantitatively reproducing a variety of experimental data. These studies helped us to

FIRST-PRINCIPLES STUDY OF PIEZOELECTRICS 3
incorporate, analyze and understand at the microscopic level the role that charge distortion, covalency and hybridization play in ferroelectric materials. PbTi03 has been extensively studied by state-of-the-art computa- tional methods. Cohen [6] found that hybridization between the titanium 3d and oxygen 2p states is essential for ferroelectricity, while the hybridization between lead and oxygen states results in a large strain, which leads to the stabilization of the tetragonal phase. Cohen and Krakauer [7] pointed out the possible existence of partial order-disorder character in the tetragonal- to-cubic phase transition of PbTi03. Recent calculation of the temperature- dependent phase diagram of PbTi03 by Rabe and Waghmare [8] provided a microscopic explanation for the deviation from the simple displacive picture based on local instabilities in the crystal. Garcia and Vanderbilt[9] showed that a low temperature orthorhombic distortion is possible but unlikely in PT and that there are no zone-boundary instabilities in this material that could induce a cell doubling phase transition.
Theoretical advances in the field of piezoelectrics and macroscopic polarization allow a pure ab initio study of piezoelectricity in tetragonal PbTi03. As a first important step in this field, Martin [10] showed that piezoelectricity is a macroscopic bulk property of the solid and is determined by the electronic wave function of the material. At first, a direct approach, or large supercell approach was used in order to overcome the short- wavelength limit generally imposed by the boundary conditions adopted in periodic first-principle calculations. The introduction of a reformulated (Green's function) linear-response approach by Baroni et al.[n] for density- functional calculations in extended systems made it possible to perform long-wavelength limit calculations analytically. Using this approach, Gironcoli et al. [12) successfully calculated the piezoelectric properties of III-V semiconductors from the stress induced by an applied electric field, at vanishing microscopic strain.
The latest advance in the field of modern macroscopic polarization was made by King-Smith and Vanderbilt[13] (for an alternative derivation and excellent review see Ref. [14]). This latter quantum-mechanical approach makes it possible to calculate the polarization difference between two different states of the same solid, assuming that the two states can be transformed into each other through an adiabatic variation of a crystal Hamiltonian parameter, under the necessary condition that the crystal remains an insulator along the transformation path. This method evaluates polarization differences using geometric quantum phases (Berry's phase approach), which are defined as the phases of overlap determinants between Bloch wavefunctions evaluated on a dense mesh of neighboring k points.

G. SAGHI-SZABO et al.
Instead of computing the stress induced by a macroscopic electric field, the piezoelectric moduli can be determined from polarization differences induced by macroscopic strain. This method was successfully applied to study linear piezoelectricity in ZnO [16] and nonlinear effects in CdTe [15].
2. PIEZOELECTRICITY IN CRYSTAL CLASS 4mm
The piezoelectric tensor has only three independent components in crystal class 4mm. Tensor elements e3[ and e33 describe the zero field polarization induced along the z axis, when the crystal is uniformly strained in the basal xy plane and along the z axis, respectively. The third component eX5
measures the polarization induced perpendicular to the z axis by shear strain. If one keeps the shear strain and the strain in the basal plain at zero values, the induced change in polarization (P3) for small strains along the z axis can be expressed as
P3=e33£3, (2.1)
where e3 is the strain tensor element in matrix notation. Modulus e33 can be expressed as
cte3
vaP3 f^, (2-2)
where the first, in this case pure electronic, term can be evaluated from polarization differences as a function of strain, with the internal parameters being' kept fixed at their values corresponding to zero strain. One has to calculate the dynamical charge tensors and then determine the variation of« as a function of strain along the z axis in order to evaluate the second term, which corresponds to the contribution from internal microscopic relaxation [16, 17]
3. METHOD
Total energy calculations presented here were performed within the GGA approximation using the full-potential LAPW + LO method [18]. The LAPW + LO method includes local orbitals (LO) in addition to the normal LAPW basis to allow treatment of all the valence bands in a single energy

FIRST-PRINCIPLES STUDY OF PIEZOELECTRICS 5
window and allow greater variational freedom. The Perdew-Burke- Ernzerhof 1996 (PBE96)[19] exchange-correlation parametrization was used in the calculations. LAPW sphere radii of 2.0, 1.7 and 1.6 a.u. were used for Pb, Ti and O, respectively. Pb 5d, 6s, 6p, Ti 3s, 3p, 3d, 4s and O 2s and 2p orbitals were treated as valence orbitals.
3.1. Strucural Optimization and Computation of Electronic Polarization
Local orbitals were used to include the semi-core Ti 3s states with the valence bands as well as to help the relaxation of the linearization of the Pb 5d, Ti 3p, 3d and O 2s, 2p states. Hamiltonian matrix elements were determined using the scalar relativistic method [I8]. The special points method I20-23! was applied for Brillouin-zone samplings with 4x4x4 k- point mesh. The convergence parameter RKmax, which governs the quality of the basis set was set to 8.3, giving a basis set size of more than one thousand functions per unit cell. The results of the calculations were checked for convergence with respect to the number of k-points and the plane wave cutoff energy. Analytical atomic forces were calculated using the formulation of Yu et al.[24]. The Broyden-Fletcher-Goldfarb-Shanno (BFGS) multidimensional variable metric method was implemented to optimize internal coordinates at a given volume and strain. Wavefunctions necessary to obtain the geometric quantum phases for the calculation of electronic polarization were evaluated on a discrete mesh, fc-space integrations in the Berry's phase calculations were made on a uniform 4 x 4 x 20k-point mesh. The results of the calculations were checked for convergence with respect to the number of k-Points and the plane wave cutoff energy.
4. COMPUTATIONAL RESULTS
4.1. Homogeneous Strain
The tetragonal structure of PbTi03 is completely denned by the a lattice constant, the cja ratio and by three internal coordinates uh which correspond to the relative positions of the five atoms in the unit cell parallel to the c axis in units of c. We have kept the volume of the PbTi03 unit cell at the experimental value in the first part of the calculation to determine an optimum set of cja and ut parameters which minimize the total energy. The theoretical GGA minimum of cja equals to 1.073 under this constraint. The value agrees quite well with the room temperature experimental data of

6 G. SAGHI-SZABO et tu.
1.065 [28]. The agreement is even more remarkable, if we take into account the temperature dependence of c/a, which we expect to further increase from its room temperature value as we approach 0 K. Table I contains the internal parameters in the five atom unit cell at experimental volume and optimized c/a together with other theoretical results and experimental data. As the next step, we determined the electronic polarization at this point in (c/a, u) space. Next, macroscopic polarization values were calculated as a function of c/a with internal parameters fixed at those of the GGA minimum structure. These calculation were performed at fixed lattice constant a, that is the volume was allowed to change depending on the value of c/a Polarization differences between the reference and strained structures were used to extract the homogeneous strain contribution to the e33 modulus.
4.2. Dynamical Effective Charges and Spontaneous Polarization
In a polar insulator Born effective charges (dynamical charges) indicate the extent of polarization change induced by relative sublattice displacements. While many ionic oxides have Born effective charges close to their static value [25], ferroelectric perovskites display anomalously large dynamical
charges [26' 27]. In order to determine the contribution from the internal strain to the
piezoelectric modulus, we obtained Born effective charges from finite differences of polarization. Computations were performed with small displacements of atoms along the z axis to get all the effective charges.The amplitude of displacements was 0.3% of lattice constant c. Changes in the It- point mesh or in the amplitude of displacements caused less than 1 % change in the corresponding Z* values. Table II contains the results of our
TABLE I Structure parameters of tetragonal PbTi03. The GGA parameters were obtained from constant volume optimization. Internal coordinates along the z direction (u) are given in terms of the c lattice constant
GGA LDA"
a(a.u.) 7.356 7.247 c/a 1.073 1.122 Mpb 0.000 0.000 uTi 0.530 0.542 «o, o2 0-610 0.634 u0,' 0.105 0.134
LDAh Experiment
7.380 7.373 1.063 1.065 0.000 0.000 0.549 0.538 0.630 0.612 0.125 0.117
a Constant volume, LDA, all-electron basis set. b Ref. [9), relaxation with fixed lattice constants, LDA, ultrasoft pseudopotentials with planewave basis. ° Ref. p81, room temperature data.

FIRST-PRINCIPLES STUDY OF PIEZOELECTRICS 7
TABLE II Born effective charges for PbTi03. The charges were calculated from polarization differences induced by finite displacement of atoms along the tetragonal z axis at experimental tetragonal volume, theoretical c/a and internal coordinates
xyk-point mesh k/ 7* 7* Zh> 7*
4x4 4x4 4x4
20 20 20
3.52 3.90 3.92
5.18 7.06 6.71
-2.16 -2.56 -2.56
-4.38 -5.83b
-5.51° a discrete mesh along z.
Ref. , theoretical cubic structure. c Ref. l26\ experimental tetragonal structure.
calculations together with former theoretical results. We find that our values show similar trends to those reported previously, namely significantly larger dynamical than static charges, however the difference we calculated between the Born effective and static (pure ionic) charges is smaller. Zhong et al. [26]
used a pseudo potential plane-wave method within the LDA to obtain their Z* values, while an all-electron method within the GGA was used in this work. Since the effective charges were found to be quite sensitive to atomic positions and volume, the smaller magnitude of effective charges we found may be partly due to the different structural parameters used in the two sets of calculations.
Spontaneous polarization can be measured directly in ferroelectric materials via polarization reversal. It gives us an opportunity to further test our method and the calculated Born effective charges. Using displacement values together with lattice parameters from the experimental structural data at 295 K [28], and Born effective charges that we determined at the theoretical optimized GGA structure, we can get a good estimate for the value of spontaneous polarization while neglecting the volume, and position dependence of Z* [29\ However, when comparing to experimental data, one has to take into account, that experiments usually give erroneous results for the polarization, due to charge leakage caused by crystal cracking during measurements. The polarization values we determined are shown together with other theoretical and experimental values in Table III.
4.3. Contribution Due to Internal Strain
We have to determine the change of the internal coordinates as a function of external strain along the z-axis to calculate the second part of the e33
piezoelectric modulus, the part which is due to the relative displacement of positively and negatively charged sublattices. These calculations were

8 G. SAGHI-SZABO et al.
TABLE III Spontaneous polarization values. Structural information for the calculations were taken from Ref. [29]
Temperature (K) Method xy k-point mesh k/ Polarization (C/m )
295 indirectb 4x4 20 0.88 4x4 20 1.04c
experiment* N/A N/A 0.75
1 discrete mesh along z. ' calculated by using Born effective charges and displacement vectors from the high symmetry sites. : Ref. [26], 1 Ref. [33].
performed at fixed lattice constant a and with varying c/a ratios just as in section 4.1. At each c/a internal coordinates were optimized using the LAPW + LO method described in section 3.1. The sum of the calculated duijde-i values multiplied the corresponding dynamical charge tensor elements gives the microscopic strain contribution to the piezoelectric modulus ot tetragonal PbTi03. Common origins to determine internal coordinates are arbitrarily assigned along the crystallographic axes. The individual terms in the expression for the total polarization do depend on the choice; however, the final results are independent of origin.
The two experimental values available for the e33 piezoelectric stress constant of PbTi03 are very different from each other. Ikegami et al. [30]
reports a value of 6.50 C/m2, which was measured on poled ceramic PbTi03
by Li et al.[31] reports a complete set of coefficients for the electromechanical properties measured on high-quality, twin-free single crystals of tetragonal PbTi03. They obtained the value of 3.35 C/m2 for e33, with a 10% uncertainty (e33 values were calculated from the measured sfj and dtJ data Li et al.[31], where s is the elastic compliance and d is the piezoelectric strain
constant). Our theoretical value for the e33 modulus is 3.23 C/m2 computed on the
4 x 4 x 20 mesh. The clamped ion contribution is -0.88 C/m2, whereas the contribution from the internal microscopic strain is much larger with an opposite sign, 4.11 C/m2. This value is in good agreement with the data reported by Li et al. [31], Generally, methods used in this work give results for the intrinsic piezoelectric properties of an infinite single-domain perfect material. The value of e33 reported by Ikegami et al. [30] is based on experimental data obtained on a poled ceramic sample. In the latter case, extrinsic contributions to the piezoelectric constants can be expected in addition to the intrinsic contribution. It is however not uncommon, that extrinsic contributions, mainly from domain wall boundaries, are of the same magnitude as the part due to the intrinsic properties of the crystal[32].

FIRST-PRINCIPLES STUDY OF PIEZOELECTRICS 9
5. CONCLUSIONS
The Berry's phase approach within the LAPW + LO GGA formalism can be effectively used to predict the values of the piezoelectric tensor elements even in computationally difficult materials such as PbTi03. We computed the e33
intrinsic piezoelectric modulus, which we found in good agreement with experimental data measured on single crystal material. The other piezo- electric moduli, e3i and e]5 can be determined in a similar fashion. We found that the large piezoelectric response in this material is mainly due to the large relative displacement of cationic and anionic sublattices induced by the macroscopic strain. This effect is further amplified by the anomalously large dynamic charge values of ions in solid PbTi03.
Acknowledgment
This work is supported by the Office of Naval Research under ONR grants N00014-97-1-0052 (REC) and N00014-97-0049 (HK). The computations were performed on a CRAY J90/8-1024 computer at the Geophysical Laboratory, Carnegie Institution of Washington. The authors would like to thank Michel Posternak and David Singh for helpful discussions.
References
[1] Uchino, K. Piezoelectric Actuators and Ultrasonic Motors (Kluwer Academic Publ., Boston, 1996).
[2] Kuwata, J., Uchino, K. and Nomura, S. (1981). Ferroelectrics, 37, 579. [3] Park, S.-E. and Shrout, T. R. (1997). in press IEEE Transactions on Ultrasonics,
Ferroelectrics, and Frequency Control, in press. [4] Park, S.-E. and Shrout, T. R. (1997). /. Mat. Res. Innovations, in press. [5] Lines, M. E. and Glass, A. M. in Principles and Applications of Ferroelectrics and Related
Materials, (Clarendon Press, Oxford, 1977). [6] Cohen, R. E. (1992). Nature, 358, 136. [7] Cohen, R. E. and Krakauer, H. (1990). Phys. Rev. B, 42, 6416. [8] Rabe, K. M. and Waghmare, U. V. (1996). J. Phys. Chem. Solids, 57, 1397. [9] Garcia, A. and Vanderbilt, D. (1996). Phys. Rev. B, 54, 3817.
[10] Martin, R. M. (1972). Phys. Rev. B, 5, 1607. [11] Baroni, S., Giannozzi, P. and Testa, A. (1987). Phys. Rev. B, 58, 1861. [12] de. Gironcoli, S., Baroni, S. and Resta, R. (1989). Phys. Rev. Lett., 62, 2853. [13] King-Smith, R. D. and Vanderbilt, D. (1993). Phys. Rev. B, 47, 1651. [14] Resta, R. (1994). Rev. Mod. Phys., 66, 899. [15] Dal Corso, A., Resta, R. and Baroni, S. (1993). Phys. Rev. B, 47, 16252. [16] Dal Corso, A., Posternak, M., Resta, R. and Baldereschi, A. (1994). Phys. Rev. B, 50,
10715. [17] Posternak, M., Baldereschi, A., Catellani, A. and Resta, R. (1990). Phys. Rev. Lett., 64,
1777; Tagantsev, A. K. (1992). ibid, 69, 389; Baldereschi, A., Posternak, M. and Resta, R. (1992). ibid, 69, 390.

10 G. SAGHI-SZABO et al.
[18] Singh, D. J. Planewaves, Pseudopotentials and the LAPW Method, (Kluwer Academic Publishers, Boston, 1994).
[19] Perdew, J. P., Burke, K. and Ernzerhof, M. (1996). Phys. Rev. Lett., 77, 3865. [20] Baldereschi, A. (1973). Phys. Rev. B, 7, 5212. [21] Chadi, D. J. and Cohen, M. L. (1973). Phys. Rev. B, 8, 5747. [22] Monkhorst, H. J. and Pack, J. D. (1976). Phys. Rev. B, 13, 5188. [23] Monkhorst, H. J. and Pack, J. D. (1977). Phys. Rev. B, 16, 1748. [24] Yu, R., Singh, D. and Krakauer, H. (1991). Phys. Rev. B, 43, 6411. [25] Posternak, M., Baldereschi, A., Krakauer, H. and Resta, R.'submitted to Phys. Rev. B. [26] Zhong, W., King-Smith, R. D. and Vanderbilt, D. (1994). Phys. Rev. Lett., 72, 3618. [27] Resta, R., Posternak, M. and Baldereschi, A. (1993). Phys. Rev. Lett., 70, 1010. [28] Ferroelectrics: Oxides, Landolt-Bornstein Numerical Data and Functional Relationships in
Science and Technology, Group III, 28, Pt. a (Springer-Verlag, Berlin, 1996). [29] Wang, C.-Z., Yu, R. and Krakauer, H. (1996). Phys. Rev. B, 54, 11161. [30] Ikegami, S., Ueda, T. and Nagata, T. (1971). /. Accoust. Soc. Am., 50, 1060. [31] Li, Z., Grimsditch, X., Xu, X. and Chan, S.-K. (1993). Ferroelectrics, 141, 313. [32] Zhang, Q. M., Wang, H., Kim, N. and Cross, L. E. (1993). J. Appl. Phys., 75, 454. [33] Gavrilyachenko, V. G. et al. (1970). Sov. Phys. Solid State, 12, 1203.

Ferroelectrics, 1998, Vols. 206-207, pp. 11-30 Reprints available directly from the publisher Photocopying permitted by license only
) 1998 OPA (Overseas Publishers Association) Amsterdam B.V. Published under license
under the Gordon and Breach Science Publishers imprint.
Printed in India.
SOLITON DYNAMICS OF GEOMETRICALLY CONFINED FERROELECTRIC
LIQUID CRYSTALS
R. BLINC, I. MUSEVIC and M. SKARABOT
/. Stefan Institute, University of Ljubljana, Ljubljana, Slovenia
(Received in final form 27 February 1997)
We show that geometrical confinement of Sm C* type ferroelectric liquid crystals between two parallel boundaries separated by a distance d induces a soliton structure similar to the one obtained in a transverse external magnetic field. For non-polar surface anchoring (i.e., quadrupolar boundary conditions) the (T, d) phase diagram in fact closely resembles the (T, H) phase diagram and the unwinding of the smectic C* helix is preceded by a transition from the plane-wave to the soliton like helical structure. The periodic potential of the soliton lattice induces a gap in the phason dispersion relation similar to the gaps between the valence and conduction bonds of an electron in a periodic potential. For a system with polar boundary conditions the splay distortion of the director field is accompenied by a splayed polarization and a soliton like deformation of the phase profile across the cell. A transverse solitary wave excitation with a (l/d2) relaxation rate thickness dependence and a finite frequency gap at l/d2 = 0 has been observed at small thicknesses. A cross-over to a gapless plane-wave like dynamics has been found at large thicknesses.
Keywords: Liquid crystals; solitons
INTRODUCTION
The physics of liquid crystals is in many respects fuller and richer than the physics of 3D periodic solids. Many liquid crystalline phases exhibit continuous point group symmetry (Fig. 1) whereas solid crystals exhibit discrete point group symmetry. This gives rise to new physical phenomena which are not observable in solids, e.g. symmetry recovering Goldstone modes[1_3]. These modes are responsible for the strong scattering of light in some liquid crystal phases. Liquid crystals are also very soft systems where a non-linear soliton-like structure and a soliton dynamic response can be
11

12 R. BLINC et cd.
ORDER IN LIQUID CRYSTALS
Isotropie phase (I) y\ N \ \
Nematic phase (N)
Orientational order
SmA
SmecticA(SmA) phase
Quasi long-range 1-D positional order + orientat. order
FIGURE 1 Order in nematic and smectic A liquid crystals.
obtained for even very moderate external fields. This allows us, for example, to observe soliton dynamics in external magnetic fields which can not be observed in solids at experimentally accessible fields.
The continuous rotational symmetry of many liquid crystalline phases can be broken either spontaneously or by the presence of external fields or restricted geometries. This symmetry breaking is responsible for many remarkable properties of liquid crystals. For example, at the ferroelectric Sm A-^Sm C* phase transition (Fig. 2) the continuous rotational symmetry Doo of the chiral Sm A phase is spontaneously broken and replaced by the
SOLITON DYNAMICS, FERROELECTRIC LIQ. XTAL. 13
locally :C2 and P*0
globally: <P>=0
SmC
x./- y
FIGURE 2 Order in the ferroelectric smectic C* liquid crystal phase.
discrete symmetry group C2[4]. In view of that the doubly degenerate soft
mode of the Sm A phase splits into two modes in the ferroelectric Sm C* phase: an amplitude mode and a gapless phason mode[5]. The amplitude mode represents a change in the magnitude of the tilt angle 9(z, t) whereas the phason represents a change in the azimuthal position <f>{z, t) of the molecules on the cone around the normal to the smectic layers. The phason mode thus represents a rotation of the in-plane polarization and the tilt, or what is equivalent, a sliding of the helix as a whole. The phason is thus the symmetry recovering Goldstone mode of the Sm A—>Sm C* transition, which appears according to the Goldstone theorem, if a continuous symmetry of the system is broken. This mode is responsible for some intriguing optical and dielectric properties of ferroelectric liquid crystals, like the strong scattering of light, etc. The gapless nature of the Goldstone mode has been indeed experimentally demonstrated'61.
When a ferroelectric liquid crystal is confined between two polymer- coated surfaces, separated by a distance of the order of a micrometer, a wide variety of textures'7-131 is formed which result from the interplay of the effects of confinement, dictated by the surface and the intrinsic behavior,

14 R. BLINC et al.
imposed by the bulk liquid crystal. The nature and physical properties of these textures have been the subject of intensive research, which was primarily motivated by the potential use of ferroelectric smectic phases in fast switching electrooptic devices[14]. Here we show that a soliton-like dynamics, characteristic of incommensurate crystals, can be observed when a ferroelectric liquid crystal is confined in a bookshelf geometry between two parallel plates with equal and polar boundary conditions.
Effects of External Fields
In the absence of external fields or boundaries the ferroelectric smectic C* helix (Fig. 2) is described[5] by a sinusoidal precession of the tilt of the average direction of the long molecular axis n—(nx,ny, nz)
£x = nx nz = 6 cos $ (z) (la)
£y = nynz = esm<&(z) (lb)
in the direction perpendicular to the smectic layers, where the position of the molecule on the cone of opening 6 centered around the normal nz to the smectic layers is given by
$(z) = 2-KZ/P (2)
Here p is the period of the helix and z the coordinate axis perpendicular to the smectic layers. Alternatively the helix can be described by the sinusoidal precession of the inplane polarization parallel to the local C2 axis:
Px = -P0sm<f>(z) (3a)
Py = P0 cos $(z) (3b)
In the presence of an external magnetic field [3' 7] applied perpendicularly to the helix the molecules try to rotate along the tilt cones into the field direction. The additional term in the free energy describing this effect is
g„=-\±xH2ey (4)
where Ax describes the diamagnetic anisotropy and H is the external magnetic field in the y-direction.

SOLITON DYNAMICS, FERROELECTRIC LIQ. XTAL. 15
Soliton Structure in Magnetic Fields
Minimization of the free energy with respect to $ leads to the non-linear Sine-Gordon equation[3' 7]
^ = -(Ax//2/2^3) sin(2$) (5)
which determines the spatial variation of the tilt and the in-plane spontaneous polarization. Here K3 is the appropriate renormalized elastic constant. For H—> 0 the phase is a linear function of the spatial coordinate $ = qz, and the helicoidal modulation wave is sinusoidal (Figs. 3a-b). For HytzO the phase $ is a non-linear function of the spatial coordinate. It can be expressed in terms of Jacobian elliptic functions. The phase profiles are described by
sin$(z) = sn(«, k) (6)
where sn(u, k) is the Jacobi elliptic sine of the reduced coordinate
u = z/£k (7)
Here £ = ^/Ki/(\(Ax)\H2) is the magnetic coherence length. The modulus k of Jacobi's elliptic function is defined by the equation
k = §E(k) (8)
where E(k) is the complete elliptic integral of second kind and Hc is the critical magnetic field for the unwinding of the helix:
(9)
Here p0 is the period of the unperturbed helix in the absence of the magnetic field. For finite fields Eq. (5) admits 7r-phase soliton solutions (Fig. 3a). Regions where the phase is constant are separated by regions, called phase solitons, where the phase changes rapidly (Fig. 3b).

16 R. BLINC et al.
_/_
(a)
3lt -
H = 0 H*0 H>Hc
"}Tt-wall
r V&>J H/Hc=0.995 H/Hc= 0.965 H/Hc=0.77 H=0
0.5
(b) (i) z/p(H)
0 0.1 0.2 0.3 0A 0.5 0.6 0.7 0.8 OS 1
,.., z/p(H)
FIGURE 3 (a) Unwinding transition in a magnetic field applied perpendicularly to the smectic C* helix, (b) Effect of magnetic field on the spatial variation of the phase (i) and form of the modulation wave (ii) in the SmC* phase. The formation of a soliton lattice at Hjt o is clearly visible.
Soliton Dynamics in Magnetic Fields
The dynamics of small phase fluctuations 6 $>(z, i) around the equilibrium soliton structure[3' 8]
*(z, t)=$o(z) + S$(z, t) (10)
where
6$(z, t) = * (z) exp [-t/r] (11)

SOLITON DYNAMICS, FERROELECTRIC LIQ. XTAL.
is determined by Lame's equation of order one
17
du2 [h-2k2sn(u,k)}f = 0 (12)
Here h = k2 [^2j/T(H)Ki+ 1] is the eigenvalue, 7 is the rotational viscosity and T~
1(H) is the relaxation rate of the phason.
The above Eq. (12) is equivalent to the Schroedinger equation describing the propagation of a particle in a periodic soliton-like potential
V{u) = -2k1 sn2(w, k) (13)
where for H=0, V(u) = 0. For H=£0 the periodic potential induces a band like structure in the phason spectrum with gaps at the edges of the Brillouin zone (Fig. 4). The predicted splitting of the phason spectrum with increasing magnetic field has been indeed observed in the ferroelectric liquid crystal CE-8 (Fig. 5).
A gapless Goldstone mode exists for fields lower than the critical field. This is explained by considering the spontaneous symmetry breaking in the (H, T) phase diagram. Whereas at the Sm A—>Sm C* transition the continuous translation symmetry of the SmA phase is spontaneously broken by the appearance of a modulated phase, this continuous symmetry is preserved at the phase transition into the unwound SmC phase (Fig. 6).
vP
0 q
H>HC
FIGURE 4 Effect of the periodic multi-soliton lattice potential on the phason dispersion for H^O. The splitting of the phason into optic and acoustic-like branches separated by a gap GocH2 is obvious. For H>HC the acoustic branch disappears.

R. BLINC et al.
a) The splitting of the phason spectrum at q = 0 — 2
: 1.5
1 ,
0.5
0 ,r
18~
b) Period of the helix as a function of the field.
o Dielectric data EII HXq"c
* Ouasielastic light scatter ingdata
TC-T=3K «I ^ i;'(q=0)
■~^*»-i^. i-'lq-O)
_l I i I t , I
TC-T = 3K
G(H)
(kHz)10
c) Magnetic-field induced gap G(P) at q=0
150 200 H2(T2)
FIGURE 5 (a) Experimentally observed splitting of the phason branch at q = 0 in a mixture of chiral and racemic CE-8 in a magnetic field[3]. (b) Period of helix as a function of the magnetic field; (c) Variation of the gap G with magnetic field at 0 = 0.
SmC* SmC
HL H
FIGURE 6 T- H phase diagram of a ferroelectric liquid crystal[3' 6I.

SOLITON DYNAMICS, FERROELECTRIC LIQ. XTAL. 19
Effects of Geometrical Confinement
When a ferroelectric liquid crystal is confined between two parallel plates in the bookshelf geometry (Fig. 7), two different cases can be distinguished.
A. Non-polar Boundary Conditions (Quadrupolar Anchoring)
The surface anchoring energy density is
gs = [S(x + L) + 6(x-L)]^Csex
where £x is the out of plane component of the tilt. For positive Cs parallel alignment with the interface is favored.
B. Polar Boundary Conditions (Surface Induced Polar Effects)
The surface anchoring energy density is here:
g, = [D6{x + L)Z,- D6{x- L)Zy\
A positive coupling constant D favors a positive equilibrium value of £,y at x = L and a negative £y at x = —L.
Due to the coupling between the tilt and polarization a surface induced polarization region develops in the vicinity of the interface.
a) b)
FIGURE 7 Geometry of a ferroelectric liquid crystal in the bookshelf configuration placed between two parallel infinite plane boundaries.

20 R. BLINC et al.
A. Non-polar Boundary Conditions (Quadrupolar Anchoring)
The homogeneous form of the surface anchoring energy in the z-y plane is competing with the bulk elastic energy, which favors a helicoidal ordering far from the surface. For a thin enough sample the helical structure will be
unwound by the surface. The surface term has here a similar role as a homogeneous transverse
magnetic field which tends to unwind the helical Sm C* structure. A soliton lattice is thus formed in the helicoidal direction normal to the
smectic layers close to the unwinding transition. The (d, T) phase diagram of a ferroelectric liquid crystal (Fig. 8) will thus
resemble the (H, T) phase diagram because of similar couplings. This has been indeed observed1151.
1/d FIGURE 8 T-d phase diagram of a ferroelectric liquid crystal for non-polar surface anchoring[ISI.

SOLITON DYNAMICS, FERROELECTRIC LIQ. XTAL. 21
B. Polar Boundary Conditions (Surface Induced Polar Effects)
In view of the different orientation of the polarization at the two interfaces of a thin ferroelectric liquid crystalline cell the polarization in the smectic planes will be space dependent and we expect a soliton structure in the smectic planes which is absent for non-polar boundary condition.
The (d, T) phase diagram is here quite different from the one for non- polar boundary conditions. One can find a re-entrant modulated phase and perhaps even 2 Lifshitz points.
Soliton Structure in Confined Geometry with Polar Boundary Conditions
Let us consider a ferroelectric liquid crystal, confined in a bookshelf geometry between two parallel plates, separated by a distance d. The boundary conditions are polar and fixed on both confining surfaces (Fig. 9). The splay distortion of the director field is accompanied by the splay distortion of the polarization field. This results in an induced space charge
FIGURE 9 The splayed states of a ferroelectric liquid crystal for polar surface anchoring. The dipole moments prefer an "inward" direction pointing into the bounding surface. This results in a splayed state were the direction of the polarization is rotated by 180° as one moves from one boundary to another.

22 R. BLINC et al.
Pinduceä(r) = -divP, which has substantial influence on both the dynamic and static properties of splayed states (Fig. 10).
The free-energy density in the constant amplitude (tilt) and one elastic constant approximation is
g (*) = go ■5*5 j$y_i dxj 2
eooe0E2-P E (14)
Here 3>(x) is the phase profile across the cell, e^ is the high frequency dielectric constant of the crystal and P = P0 (cos $, sin $, 0) is the polarization. By introducing the electric potential E (x) — -V ip(x) and
1 P
-d/2 0 d/2
FIGURE 10 Variation of Py, Px and the space charge density p across the cell.

SOLITON DYNAMICS, FERROELECTRIC LIQ. XTAL. 23
minimizing the free energy (1/Z-) fg (x)dx with respect to $(x) and <p(x) we obtain a set of coupled equations
d2$n Pn ■ ^ dtp .,„ .
^ + -^.sm$o^ = 0 (15b) dXl EooEo dx
for the stationary phase profile and the electric potential. Here the second equation is in fact the well-known Poisson equation, relating the charge distribution to the corresponding potential, Eoo^oV2^^) = — p(~t) = divP (Y). After integrating (15b), we obtain the sine-Gordon equation for the stationary phase profile <3>0 (*)
d $0 P ft ■ r. i /-. ^\
^r + 2^S|-s'"2*» = ° <16)
whereas the local electric field is Ex — dtpjdx = (Po/Soo^o) cos<t>o- The above equations show clearly that the presence of a splayed spontaneous polarization generates an internal local electric field that has the same role as an external homogeneous magnetic or electric field. This field has the tendency to induce a soliton-like deformation of the phase profile in the smectic layer (Fig. 10).
Similarly to the magnetic or electric-field induced soliton lattice, the solution of the sine-Gordon which satisfies fixed boundary conditions sin $0
(x — —L) = sin <E>0 (x = + L) = 0 is a soliton phase profile
sin$o = sn(u, k) (17)
Here u = x/£j>k + K is a reduced coordinate, £P = Je^eoKß\lP\ is the polarization coherence length, K(k) is the complete elliptic integral of the first kind and the modulus k of the Jacobi's elliptic functions is given by the transcendental equation
k = WW) (18)

24 R. BLINC et al.
Let us note that the magnitude of the modulus k determines the type of the solution: for k -»0 we are in the plane-wave regime whereas for &—>1 we are in the soliton regime (Fig. 11). We have therefore a crossover from the plane- wave modulation to the soliton-like modulation of the phase of the order parameter in splayed cells (Fig. 11 and Fig. 12).
d/2
FIGURE 11 Spatial variation of the phase of the splayed state across the cell showing the transition from the plane wave behaviour at small P0 to a soliton structure at large P0-
/ y / y / / / / /
Py(x)
P0 small
//////////
Py(x)
P0 large
wall
(i) (Ü)
FIGURE 12 Variation of Py across the cell for a small (i) and a large (ii) P0-

SOLITON DYNAMICS, FERROELECTRIC LIQ. XTAL. 25
Soliton Dynamics in Confined Geometry with Polar Boundary Conditions
The nonequilibrium phase profile is
$(x, () = $oW + *'e"'/r (19)
where * is the amplitude of the phase excitation and the equilibrium phase profile $o satisfies the sine-Gordon Eq. (15). The linearized Landau- Khalatnikov equation of motion, as deduced from the nonequilibrium free- energy density, appears in the well known form of the Lame's equation of order one[18]
^-|- + [A - 2k2sn2$0 ] • * = 0 (20) du1
The eigenvalue h of the Lame's equation is
h = k2fl+Wl€\ (21)
and therefore determines the relaxation rate of the phase excitation. The eigenfunction, which satisfies the fixed boundary conditions is selected from the general solutions of the Lame's equation[18]
# = sn(u, k) and h=l+k2 (22)
The corresponding relaxation rate of the lowest-order mode is
_t P2 AK K2{k)
OoJ£oo£ok2 7 (23)
Plane Wave and Soliton-like Excitations
One of the surprising features of the dispersion relation for solitary waves in splayed cells with a variable thickness is the appearance of a gap in the long- wavelength limit, g«l/ii2—>0. This is similar to the magnetic-field and electric field-induced gaps and is related to the symmetry breaking by the external field[18].
The nature of this phenomena can be further clarified by considering the limiting values of the dispersion. For zero spontaneous polarization we

26 R. BLINC et al.
always have the plane-wave regime and the dispersion is parabolic (Fig. 13)
fl. = 0*t-0 = r-=f©J (24)
For a finite polarization P0 we can have either a plane wave (k —> 0) or a soliton (k->l) regime, depending on the ratio d/£P. For very small thicknesses we have again a plane-wave regime, but the relaxation rates are now polarization re-normalized by an additional, thickness independent term:
Po const., d/£P —> 0 and k —> 0 : r ' = — • (-) K /7r\2 K 1
7 w 7 2£2P
(25)
For large thicknesses, we have a soliton-like dynamics, which is polarization-renormalized and there is a finite gap at q = 0 (Fig. 13).
K 1 P0 = const., K(k) -> oo and fc -> 1 : r"1 (? = 0) = ---j (26)
7 ?/>
d"2(a.u.)
FIGURE 13 Dispersion relation for transverse phase excitations in a thin splayed cell in the plane wave (P0 = 0) and soliton (P0 ^ 0) limits. The appearance of a gap at q = 0 in the soliton limit is clearly seen.

SOLITON DYNAMICS, FERROELECTRIC LIQ. XTAL. 27
Experimental Results and Discussion
We have measured the thickness dependence of the order parameter relaxation rates in the helicoidal and the unwound phases of CE-8[19].
The experiment was performed in wedge-type cells which were Nylon coated and unidirectionally rubbed with a soft velvet. The thickness of the cell was determined by the 4 um glass spacers on one edge and a close (proximity) contact on the other edge of the glass. Due to the irregularities of Nylon layer, the thinnest part of the cell was approximatelly 0.3 urn thick. The thickness of each individual cell as a function of the position along the cell was determined by measuring the spectral transmission. An 0.5x2.0 mm2 slit was used to licalize the spot, and it was placed directly on the glass surface of an empty cell. In this way, the local thickness of the cell was determined with an accuracy better than ±0,05 urn. The resulting wedge angle was of the order of 1.5xl0"3 and had a negligible effect on the experiment.
The linear response "electroclinic" experiment measures the real (in- phase) and imaginary (out-of-phase) parts of the linear electrooptic response x(w) of a sample to a small measuring electric field E = (EQ, 0, 0) elut. This field will couple to those collective eigenmodes of the system that have a finite space-average of the fluctuating electric polarization (6P (r ,t)). Because of the interconnection between the polarization and the director field, this will result in a finite value of the space-averaged director field (67? (7", t)). The dielectric tensor for the optical frequencies £,-,- has the same symmetry as the tensor7f ®7?, and the change (67? (r*,t)) will be reflected in the dielectric tensor field. For small external electric fields and consequently small local distortions of the director field, the change of the dielectric tensor £y can always be expanded in terms of the excess polarization. It is straightforward to show that in the case of a mirror- symmetric director field in a splayed cell, the field-induced change of the dielectric tensor is
(Se) oc
0 0 0 0 0 (SPX) 0 (SPX) 0
(27)
and is therefore linear in the electric field. This change of the dielectric tensor is detected with a suitable optical technique. It is therefore clear that in a linear electrooptic experiment we detect polar eigenmodes of the system, i.e., the dielectric eigenmodes. This method is therefore an optical analog to dielectric spectroscopy.

28 R. BLINC et al.
In the ferroelectric phase we observe for all thicknesses two relaxation modes, a high and a low frequency one. We assign them as two phase modes. The first mode has a relatively high relaxation rate in the kHz region. It is nearly temperature independent except very close to Tc, and shows a very strong thickness dependence. The relaxation rate of this phase mode, as observed in CE-8 filled wedge-type cells in the splayed ferroelectric smectic- C* phase, is shown in Figure 14 as a function of \/d2. For small thickness (large \jd2), the relaxation rate follows the predicted l/d2 dependence, as indicated by the solid line in Figure 3. If this part of the measurements is extrapolated to l/d2mO, one can clearly observe a frequency gap of approximately 10 kHz at l/d2 = 0. There is however an obvious crossover at intermediate thicknesses of approximately 1 j^m. Here, the observed data approach a line through the origin of the coordinate system, so that there is in fact no frequency gap at l/d2 = 0. We have a soliton-like dynamics of splayed states at very small thicknesses and a crossover to the plane-wave- like dynamics at large thicknesses.
The observed crossover can be explained by the presence of ions, which screen-out the electrostatic field. These ions apparently diminish the induced
tsl 31
50
40 -
30 -
H 20 -
10 -
- •• •
-
i i i i .
^
x: • i i i
. ! i I i I < 1 t I i
1 </ 2 ds
3 4 5
d_2(|xm2)
FIGURE 14 Observed dispersion of the fast transverse phase mode in CE-8 showing a cross- over from the soliton regime at small cell thicknesses to the plane wave regime at large cell thicknesses.

SOLITON DYNAMICS, FERROELECTRIC LIQ. XTAL. 29
charges and drive the dynamics into the plane-wave regime. If the thickness of the cell is much smaller than the Debye screening length, the screening will not be efficient and we will have a soliton-like dynamics. On the other hand, for large thicknesses, the screening will be efficient and we will have a plane-wave-like dynamics. One can estimate that the Debye screening length in CE-8 would be of the order of 0.7 |im, which is of the correct order of magnitude.
The relaxation rate of the low-frequency relaxation is of the order of 20 - 30 Hz and is nearly thickness-independent. It shows in electric fields a non-linear cross over to the collective switching of the polarization of the cell as a whole.
CONCLUSIONS
From the above results we can conclude that:
a. Confinement effects in ferroelectric liquid crystals induce a soliton structure similar to the one obtained in external magnetic and electric fields.
b. The unwinding transition of the helicoidal structure of ferroelectric liquid crystals induces first a cross-over from the plane wave to the soliton lattice type modulation regime.
c. The periodic potential of the soliton lattice significantly influences the phase mode dynamics of the system and induces a gap in the spectrum similar to the gaps between the valence and conduction bands of an electron in a periodic potential.
d. For a system with polar boundary conditions we have observed below the Sm A-Sm C* phase transition two polar phase modes. The relaxation rate of the higher-frequency mode scales as the inverse square of the cell thickness. This mode is identified as a transverse solitary wave in the splayed ferroelectric structure which is characteristic for the confined geometry. The relaxation rate of the slow mode is, on the other hand, nearly thickness-independent. It shows in electric fields a nonlinear crossover to the collective switching of the polarization of the cell as a whole.
References
[1] Meyer, R. B., Liebert, L., Strzelecki, L. and Keller, P. (1975). J. Phys. - Letters, 36, L69. [2] Goldstone, J., Salam, A. and Weinberg, S. (1962). Phys. Rev., 127, 965.

30 R. BLINC et al.
[3] Musevic, I., Zeks, B., Blinc, R. and Rasing, Th. (1994). Phys. Rev. B, 49, 9299. [4] Pikin, S. A. and Indenbom, V. L. (1978). Uspekhi Fiz. Nauk, 125, 251. [5] Blinc, R. and Zeks, B. (1978). Phys. Rev. A, 18, 740. [6] Musevic, I., Blinc, R., Zeks, B., Copic, M., Wittebrood, M. M., Rasing, Th., Orihara, H.
and Ishibashi, Y. (1993). Phys. Rev. Lett., 71, 1180. [7] Bourdon, L., Sommeria, J. and Kleman, M. (1982). J. Physique, 43, 77. [8] Handschy, M. A., Clark, N. A. and Lagerwall, S. T. (1983). Phys. Rev. Lett., 51, 471. [9] Glogarova, M., Lejcek, L., Pavel, J., Janovec, V. and Fousek, J. (1983). Mol. Cryst. Liq.
Cryst., 91, 309. [10] Handschy, M. A. and Clark, N. A. (1984). Ferroelectrics, 59, 69. [11] Glogarova, M. and Pavel, J. (1984). J. Physique, 45, 143. [12] Glogarova, M., Fousek, J., Lejcek, L. and Pavel, J. (1984). Ferroelectrics, 58, 161. [13] Clark, N. A. and Lagerwall, S. T. (1984). Ferroelectrics, 59, 25. [14] Clark, N. A. and Lagerwall, S. T. (1980). Appl. Phys. Lett., 36, 899. [15] Povse, T., Musevic, I., Zeks, B. and Blinc, R. (1993). Liq. Cryst., 14, 1587. [16] Nakagawa, M. and Akahane, T. (1986). /. Phys. Soc. Jap., 55, 1516. [17] Akahane, T., Itoh, N. and Nakagawa, M. (1989). Liq. Cryst., 5, 1107. [18] Musevic, I., Zeks, B., Blinc, R. and Rasing, Th. (1995). Int. J. Mod. Phys., B9, 2321. [19] Skarabot, M., Musevic, I. and Blinc, R., to be published.

Ferroelecirics, 1998, Vols. 206-207, pp. 31-46 Reprints available directly from the publisher Photocopying permitted by license only
i 1998 OPA (Overseas Publishers Association) Amsterdam B.V. Published under license
under the Gordon and Breach Science Publishers imprint.
Printed in India.
THEORETICAL EXAMINATION OF STRESS FIELDS IN Pb(Zr0.5Tio.5)03
NICHOLAS J. RAMER \ E. J. MELEbc
and ANDREW M. RAPPE ac
a Department of Chemistry; Department of Physics;
0 Laboratory for Research on the Structure of Matter, University of Pennsylvania, Philadelphia, PA 19104
(Received 12 April 1997; In final form 28 July 1997)
In this paper, we develop a rigorous formulation of the local stress field. This approach can be used in conjunction with any first-principles method to study stress fields in complex bonded systems. In particular we investigate the induced stress fields resulting from the homogeneous deformations of tetragonal PbTi03 and rhombohedral PbZr03. As an extension of these findings we also compute the induced stress fields resulting from homogeneous deformation of the (100) and (111) orderings of Pb(Zr0.5Tio.5)03. The stress-field responses in these four materials are compared and their piezoelectric responses are discussed.
Keywords: Piezoelectricity; stress field; PbTi03; PbZr03; PZT; (100)-Pb(Zro5Tio5)03; (111)- Pb(Zr0.5Ti0.5)O3
PACS numbers: 77.65.Ly, 77.84.Dy, 71.15.Mb, 31.15.Ar
1. INTRODUCTION
When mechanical stress is applied to a piezoelectric material, microscopic atomic rearrangements occur which give rise to a change in the macroscopic electric polarization of the material. Conversely, application of a voltage across a piezoelectric material produces an internal strain within it. In eitther case, it is the material's internal structural behavior (and therefore spontaneous polarization) under applied or induced stress that underlies the piezoelectric response.
31

32 N. J. RAMER et al.
The ability of piezoelectric materials to interconvert electrical and mechanical energy lies at the foundation of many electro-optic and electro-acoustic devices. The use of piezoelectric materials in these devices stems from the need to monitor the magnitude of induced or applied electrical response through the device. One of the clearest examples of such an application is seen in the constant tunneling voltage mode of the scanning-tunneling microscope (STM).[1] Piezoelectric materials also play a vital role in electro-acoustic transducers. In these devices the piezoelectric material acts as an interpreter for the incoming (or outgoing) sound wave and the outgoing (or incoming) electric signal. These types of devices have uses in underwater and medical ultrasonic imaging.
In this paper, we present a first-principles investigation of the distorted perovskite materials PbTi03 and PbZr03 at zero temperature and study the spatial variation of their stress-field responses to an externally applied uniform strain. In addition, stress-field studies of the (100) and (111) orderings of the solid solution Pb(Zr0.5Ti0.5)O3 (PZT) are also reported. Our selection of PZT is motivated by the wealth of experimental studies characterizing the strong piezoelectric response in various composite PZT ceramics.[2] In Section 2 we briefly describe the formalism for construction of the local stress fields. In Section 3 we present results for the computation of local stress fields induced by a uniform uniaxial deformation. A discussion of the local stress fields produced in the simple perovskite crystals and the more complex PZT superlattices is provided in Section 4 and we conclude the paper in Section 5.
2. STRESS-FIELD FORMALISM
It is central to the study of any piezoelectric crystal to understand the material's internal response to an externally applied strain. Experimentally, a particular crystal's structural response to an applied strain can be measured using various diffraction techniques[3] or direct measurement of the changes in the dimension of the sample by electrical capacitance or optical interference.[4] In order to ascertain the effect strain has upon piezoelectric response, these techniques are paired with high-field measure- ment of strain hysteresis and polarization change. More recently, field- induced strain, has been measured using a displacement magnification technique.[5] However because the formation and testing of many of these strained materials is complicated and possibly destructive,[6] it is advanta-

STRESS FIELDS IN Pb(Zr0.5Ti0.5)O3 33
geous to have a concise theoretical method from which information concerning the microscopic response of a system to an external strain can be extracted.
We consider the response of a system to a homogeneous long wavelength deformation (scaling transformations describing pure dilation, strain or shear). For an interacting system of atoms, the introduction of any of these uniform deformations can induce a force distribution on all the structural degrees of freedom of the unit cell. Within a harmonic theory, the induced atomic force distribution, F, contains all the relevant information about the redistribution of the external stress within the cell. Therefore, the starting point for the computation of the local stress fields is the calculation of the induced force distribution. This can be accomplished using local density functional theory. These theoretical methods have proven to be very successful for studying structural phenomena in a broad class of condensed phases. Below we outline our method to compute the stress field given the local force density. Once the stress field has been constructed, correlations between the elastic response and the structural features of the system can be made. A more detailed explanation of the method will be presented elsewhere.[7]
We begin with the principle of virtual work in the presence of an induced force distribution Fm. Any set of displacements of the nuclear coordinates u for a particular interacting system produces a variation of the energy, U, according to
SU'=^Fm-Mm (1) m—\
where m represents the ra-th ion of the interacting system. It is useful to convert the displacements and forces to continuous fields:
6U = \r f rf3rF(r) • u(r) » ' ./cell
= £F(-G)-«(G). (2)
In the last line we have used lattice translational symmetry to transform the force and displacement distributions to a reciprocal-space representation. The principle of virtual work can be recast in terms of the internal strains in

34 N. J. RAMER et al.
the structure
6U= f d3rt(r)-t{r) ./cell
(3) = n2?(-G).?(G)
G
where a is the 6-component stress field tensor and e is the 6-component strain tensor. (Since only the contraction of two rank-2 tensors is required in equation (3), the tensors are represented as length-6 vectors for simplicity.)
The direct space components of the strain tensor can be directly related to the displacement field,
en(r) = V-Tn-u(r) (4)
where e„ is the w-th component of the strain tensor (« = 1,..., 6) and r„ is the 3x3 matrix determining the symmetry of e„. Transforming this relationship into Fourier space gives the particularly convenient result
e„{G) = G-Tn -u(G). (5)
Combining equation (5) for all 6 components of the strain tensor gives
=e(G)=P-u(G) (6)
or
V~x ■t{G) = u{G). (7)
Inserting this relationship into the last line of equation (2) and equating lines (2) and (3) yields
SU=il^2F(-G)-Vr-l-^(Ö) (8) G
= SlYt(-6)-°e(G) (9) G
Equating the arguments of the summations in equations (8) and (9) yields all 6 components of the local stress field in the reciprocal space:
t(-G)=F(-G)-V-1. (10)

STRESS FIELDS IN Pb(Zr0.5Tio.5)03 35
By transforming according to
t(f) = Y,v(G)ei8-? (11) G
we can construct the stress distribution in direct space, and this result can be used to generate a map of the spatial distribution of the n-th stress field of the system.
Vanderbilt [8] has correctly pointed out that this formalism only enables computation of the stress-field components which possess the periodicity of the unit cell. In addition the G = 0 stress tensor can be computed by the approach of Nielsen and Martin.[9'10] Development of a method for the computation of the stress-field components which are uniform in one or two dimensions and of finite wavelength in the others is in progress.
3. RESULTS
The first-principles calculations presented in this paper are performed within density functional theory,[11] and the local density approximation (LDA) is used to describe the electron-electron interactions. For the solid-state calculations, the single electron wave functions are expanded in a plane- wave basis using a cutoff energy of 50 Ry.
To describe the electron-nuclear interaction, optimized pseudopoten- tials[12] in fully separable nonlocal form [13] are used. An additional feature of our nonlocal pseudopotentials [14] is their improved transferability over a wide range of electronic configurations. We have been able to exploit the flexibility contained in the separation of the local and nonlocal parts of the pseudopotential. By designing the form of the local potential so that the pseudo-eigenvalues and all-electron eigenvalues agree at an additional charge state, it is possible to improve the transferability of the potential across the charge states lying between the original reference state and this second charge state.
Due to the need for high accuracy when examining ferroelectric phenomena, semi-core shells are included in the generation of the pseudopotentials. We include as valence states the 3s and 3p for Ti and the 4s and Ap for Zr. The 5d shell is included for Pb. Furthermore, scalar relativistic effects are included in the generation of the Pb pseudopotential.[15]
For each metal, a pseudopotential is constructed using a designed local potential with the addition of a square well within the core region. By doing

36 N. J. RAMER et al.
so, we are able to achieve excellent transferability of the pseudopotential over a variety of charge and excited states. For each of the metals, excellent agreement of the pseudo-eigenvalues and total energy differences with the all-electron results is achieved for charge states of +4 to neutral. The oxygen pseudopotential is constructed using the s angular momentum channel as the local potential.
Brillouin zone integrations for PbTi03 and PbZr03 were done using a 4x4x4 Monkhorst-Pack fc-point mesh.[16) It should be noted that to compute the nonuniform force distribution resulting from the application of a uniform external stress, additional ^-points were needed due to the broken symmetries in the distorted structure.
The calculations involving the rhombohedral PbZr03 and (lll)-PZT deserve closer consideration. Crystallographically, the zero-temperature form of PbZr03 is orthorhombic with 40 atoms per unit cell. [17~19] In order to simplify our comparisions of the local stress fields, the structure of PbZr03 was fully relaxed within the rhombohedral symmetry of zero- temperature ferroelectric phase of PbZr03 with small Ti doping.[2]
Rhombohedral strains of the unit cell shape away from cubic were neglected since they have been shown to be quite small (~ 0.1°). [20] In the case of (111)-PZT, rhombohedral strains were also neglected to simplify analysis of the induced local stress fields.
As part of the local stress-field calculations, complete structural relaxations of both internal coordinates and crystal lattice constants were completed for the PbTi03 and PbZr03 distorted perovskite structures. We report our atomic positions and lattice constants for tetragonal PbTi03 and rhombohedral PbZr03 in Table I and compare these results with previous theoretical and experimental values where possible. The absence of experimental values for the rhombohedral PbZr03 is explained by our simplification of the PbZr03 structure as described above. In the case of PbTi03, our agreement with previously reported theoretical[21] and experimental results [22] is quite good and is within the error expected from density functional solid-state calculations done within LDA. For the rhombohedral PbZr03, our results agree quite well with the theoretical results of Singh. [23] (In Singh's work, the lattice constant of rhombohedral PbZr03 was not relaxed. The theoretically determined lattice constant of the high temperature cubic perovskite was used instead.)
Atomic and lattice relaxations were also performed for the PZT superlattices. The experimental lattice constants as well as theoretical lattice constants and relaxed atomic positions are contained in Table II. Experimental values for the (100)-PZT ceramic are taken for the tetragonal

STRESS FIELDS IN Pb(Zr0.5Tio 5)03 37
TABLE I Computed and experimental equilibrium lattice constants and atomic positions for tetragonal PbTi03 and rhombohedral PbZr03
Present Theory Experiment
PbTi03 «(A) 3.870 3.862' 3.9052
c/a 1.063 1.054 1.063 z(Ti) 0.531 0.537 0.540 z(0,,02) 0.604 0.611 0.612 z(03) 0.098
PbZr03
0.100 0.112
c(A) 4.1.43 4.123
z(Zr) 0.540 0.545 *,y(O0 0.583 0.590 z(0,) 0.057 0.061
1 Reference [21]. 2 Reference [22]. 3 Reference [23].
TABLE II Computed equilibrium lattice constants and atomic positions for tetragonal (100)- PZT and rhombohedral (lll)-PZT. Experimental lattice constants are given for randomly ordered PZT ceramics close to the 50-50 batch composition. See text for description
Present Experiment
c(k) c/a z(Pb2) z(Ti) z(Zr) z(0,) z(02,03) z(04) z(05,06)
c(A) z(Pb2) z(Ti) z(Zr) x(0,) z(0,) x(04) z(04)
(100)-Pb(Zr05Ti05)O3
. 8.313 2.083 0.468 0.211 0.714
-0.049 0.185 0.424 0.660
(lll)-Pb(Zr„.5Tio.5)03
8.043 0.498 0.237 0.737 0.221
-0.014 0.721 0.470
8.279' 2.053
8.1641
1 Reference [2].
50 - 50 batch composition PZT ceramic according to Jaffe et al. (ceramic 3 using the notation from reference [2]). The experimental values for the (111)- PZT ceramic are taken for a rhombohedral PZT ceramic close to the 50-50 batch composition (ceramic 5 using the notation from reference [2]).
We studied the induced local stress fields by calculating the internal force distribution induced by a uniform external strain. The force distribution is

38 N. J. RAMER et al.
obtained from first-principles density functional theory within the LDA using the Hellmann-Feynman theorem.[24'251 Since our stress-field formal- ism relies on the fact that any deformation must not take the system beyond lowest order in gradients of the total energy, attention must be paid to the magnitude of the deformations. We have found that ± 0.2% deformations in lattice lengths and ± 0.5° in lattice angles are within the harmonic limit of the potential energy. Extension of this work beyond harmonic order is a promising direction for the study of recently discovered piezoelectric single crystals which exhibit large reversible strains. [26]
There are 6 homogeneous deformations which can be made to any crystal: dilation having the symmetry of x2 + y2 + z2, uniaxial strains-tetragonal with symmetry 2x2- y2- z2 and orthorhombic with y2-z2 symmetry, and elementary shear operations (xy, xz, and yz). Based on crystal symmetry considerations, certain homogeneous deformations are degenerate and can easily be constructed from the other deformations. For a crystal subjected to any of the 6 homogeneous deformations one finds a local internal stress field in all 6 stress components. It is important to note that for a given deformation, the induced stress fields corresponding to the 5 other deformations must each integrate to zero over the entire unit cell.
For brevity, we only report the local stress fields induced by an applied tetragonal uniaxial stress. In particular we focus our discussion on the internal tetragonal and dilation stress-field responses induced by a tetragonal compression. We have omitted the dilation response stress fields for the PbTi03, PbZr03 and (100)-PZT because they are quite similar to their respective tetragonal responses.
To simplify the visualization of the stress fields, we have chosen to show only the regions of highest induced local stress. For a tetragonal response to a tetragonal compressive deformation, light blue regions correspond to prolate response (expansive along the axial direction but compressive along the equatorial directions) and pink regions correspond to oblate response (compressive along the axial direction but expansive along the equatorial directions). For a dilation response to a uniaxial compressive deformation, light blue isosurfaces correspond to regions in the unit cell undergoing compression in all directions and pink isosurfaces correspond to expansion in all directions.
A. Tetragonal PbTi03
Figure 1 shows the tetragonal local stress field produced in response to a uniaxial tetragonal deformation of the zero-temperature equilibrium

STRESS FIELDS IN Pb(Zr0.5Tio.5)03 39
FIGURE 1 Tetragonal stress-field response to a uniaxial tetragonal deformation of tetragonal PbTi03. (blue = lead, red = titanium, green = oxygen), (See Color Plate I).
structure of tetragonal PbTi03. The (100) lattice direction contains the Pb atoms at the lower left forward corner and upper left forward corners of the unit cell. We find the region of highest induced stress does not involve the Pb atoms but instead straddles the Ti atom and is oriented along the (100) direction. In the upper half of the Ti06 octahedron lying along the (100) direction, there is an oblate response which would shift the Ti along the (100) direction toward the upper half of the octahedron. In addition to the oblate response, there is a prolate response in the lower half of the Ti06
octahedron. The effect of these volume deformations would be to elongate the lower half of the oxygen octahedron while shortening the upper half. Finally, there is no significant stress-field response involving the oxygens lying equatorial to the Ti atom.

40 N. J. RAMER et al.
B. Rhombohedral PbZr03
Figure 2 shows the tetragonal local stress field produced in response to a uniaxial tetragonal deformation of the zero-temperature equilibrium structure of rhombohedral PbZr03. The (111) atomic distortion direction contains the Pb atoms at the lower left forward and upper right rear corners of the unit cell. In this stress field, as in the tetragonal field for PbTi03, there is pairing of oblate and prolate regions surrounding the central metal atom. However, there is a clear difference between the responses for the two crystals. The regions in the response for the PbZr03 lie along a composite of the (111) ferroelectric distortion direction and (100) uniaxial strain direction. The corresponding motion of the Zr is toward the upper half of the Zr06 octahedron, along this composite direction. In addition to the motion of the Zr atom, the O atoms lying axial to the Zr atom are moving in a direction opposing the Zr atom motion.
FIGURE 2 Tetragonal stress-field response to a uniaxial tetragonal deformation of rhombohedral PbZr03. (blue = lead, yellow = zirconium, green = oxygen). (See Color Plate II).

STRESS FIELDS IN Pb(Zr0 5Ti0 5)03 41
C. Tetragonal (100)-Pb(Zr0.5Tio.5)03
Figure 3 shows the tetragonal local stress field produced in response to a uniaxial tetragonal deformation of the zero-temperature equilibrium structure of tetragonal (100)-Pb(Zro.5Tio.5)03. The (100) lattice direction contains the Pb atoms at the lower left forward corner and upper left forward corners of the unit cell. For this super-cell, an alternating pattern of oblate and prolate responses is found lying along the 4-fold rotation axis. As a result of our imposition of tetragonal symmetry, we find response in the (lOO)-PZT superlattice lying exclusively along the (100) direction indicating atomic motions purely in the (100) direction, similar to the tetragonal response for PbTi03. This combination of responses leads to Ti and Zr motions toward the lower halves of the octahedra. The axial O atoms show opposing motion to the Ti and Zr atoms.
FIGURE 3 Tetragonal stress-field response to a uniaxial tetragonal deformation of tetragonal (100)-Pb(Zr05Tio5)03. (blue = lead, yellow = zirconium, red = titanium, green = oxygen). (See Color Plate III).

42 N. J. RAMER et al.
D. Rhombohedral (lll)-Pb(Zro.5Ti0.5)03
Figures 4A and 4B show the dilation and tetragonal local stress fields produced in response to a uniaxial tetragonal deformation of the zero- temperature equilibrium structure of rhombohedral (lll)-Pb(Zro.5Tio.5)03. The (111) atomic distortion direction contains the Pb atoms at the lower left forward and upper right rear corners of the unit cell. The (100) lattice direction contains the Pb atom at the lower left forward and upper left forward corners of the unit cell. There are two crystallographically unique Pb atoms lying along the (111) direction in addition to the Ti and Zr atoms.
Dilation Response
Each individual region of highest induced stress field in the response is oriented perpendicular to the (111) atomic distortion direction. Unlike the responses for the previously mentioned crystals, we find the Ti and Zr atoms of (lll)-PZT have negligible involvement. Instead we report alternating expansion and compression regions consisting of entire Pb204 octahedra.
FIGURE 4A Dilation stress-field response to a uniaxial tetragonal deformation of rhombohedral (lll)-Pb(Zro.5Tio.5)03. (blue = lead, yellow = zirconium, red = titanium, green = oxygen). (See Color Plate IV).

STRESS FIELDS IN Pb(Zr0.5Tio.5)03 43
FIGURE 4B Tetragonal stress-field response to a uniaxial tetragonal deformation of rhombohedral (lll)-Pb(Zro.5Ti0.5)03. (See Color Plate IV).
These octahedra are comprised of two adjacent Pb atoms lying along the (100) lattice direction and 4 equatorial O atoms. The overall pattern of the expansions and compressions shows the (111) stacking of the entire superlattice. Focusing on the Pb at the lower left forward corner, we find expansion of the Pb204 octahedron above this atom and contraction of the Pb204 octahedron below, resulting in largely downward motion of this Pb atom. Analogous reasoning shows that the dilation stress field causes upward motion of the central Pb atom. The expansion and contraction of the Pb204 octahedra also gives rise to equatorial oxygen motion in the (100) plane. The O atoms not involved in the Pb204 octahedra also exhibit atomic motion. Due to the ellipsoidal shape of the stress-field regions, the O atoms lying beneath the Ti atoms are moving primarily upward along the (100) while the O atoms lying beneath the Zr atoms are moving mostly downward.
Tetragonal Response
In this response we report a feature of the stress field not found in any of the other responses for the other materials. Namely, we find oblate regions in

44 N. J. RAMER et cd.
the titanate sub-units alternating with prolate regions in the zirconate sub- units. In particular, the responsive regions encompass the entire B metal/ oxygen octahedra of their respective sub-units.
4. DISCUSSIONS
As a general guideline for analysis, it is important to understand the relationship between the ferroelectric distortion direction for a particular material and the direction of uniaxial stress. It is the combination of these effects that will either enhance, diminish or change the nature of the ferroelectric distortion as the stress is applied. We have therefore divided our discussion of the four materials according to this guideline. For all of the above reported responses the direction of uniaxial stress is (100).
In both tetragonal PbTi03 and the (100)-PZT crystals, the direction of applied stress is parallel to the direction of ferroelectric distortion. Because of this orientation, we have found stress field responses that indicate B metal and oxygen motions along the direction of the uniaxial stress. Application of positive stress moves the atoms from their tetragonal positions towards the paraelectric cubic phase. Since the cubic structure is not ferroelectric, positive stress clearly reduces the ferroelectric distortion; in this way, the local stress field depicts the piezoelectric response of these materials.
For the rhombohedral crystals, the direction of uniaxial stress is not parallel to the direction of ferroelectric distortion. The simplest depiction of this is shown in rhombohedral PbZr03. It is evident from the tetragonal local stress field that the directions of uniaxial strain and atomic distortion are competitive influences on the B metal and oxygen displacements. Thus, the local stress field depicts two mechanisms for the piezoelectric response: the rotation of the ferroelectric distortion direction from the (111) toward (100) as well as the change in the magnitude of the ferroelectric distortion due to different cation and anion responses.
In the case of (111)-PZT, this competition of influences is more difficult to characterize. Upon uniaxial compression we find no significant motion of the B metal atoms. Instead we find complex Pb and O motions. The origin of O motion deserves particular attention. The motion along (100) and (100) of the oxygen atoms that lie directly above and below the B metal atoms can be predicted from either the dilation or tetragonal responses. However, the complex motion of the other oxygen atoms can only be ascertained from a simultaneous analysis of both reponses. As an illustration, we examine the

STRESS FIELDS IN Pb(Zr0.5Ti0.5)O3 45
motion of the O atom located near (1/4, 0, 1/4). Because of its position relative to the expansion region depicted in the dilation response, it has a component of atomic motion along the (001) direction. However, according to the tetragonal response, the same atom also moves along the (OlO) direction due to the pairing of an oblate response centered in the Ti06
octahedron and a prolate response centered in the adjacent Zr06
octahedron. This same type of analysis can be done for all the oxygen atoms lying equatorial to the B metal atoms and can be used to predict their atomic motions due to uniaxial compression. Based upon these atomic motions, it is possible to characterize the piezoelectric response in (111)- PZT. The piezoelectric response can be summarized as complex motions of the Pb and O sub-lattices against the almost stationary B metal atomic positions, and not a simple move toward a higher symmetry structure, as seen in the previously described tetragonal crystals.
5. CONCLUSIONS
In this density-functional study, we have examined the induced local stress fields resulting from an externally applied homogeneous uniaxial deforma- tion of two distorted perovskite structures, PbTi03 and PbZr03 and the (100) and (111)-PZT superlattices. We have found in the case of materials in which the ferroelectric distortion direction is parallel to the direction of uniaxial stress (tetragonal PbTi03 and (100)-PZT), the existence of a piezoelectric response involving atomic motions of the B metal and axial O atoms. However, application of stress along a direction not parallel to the ferroelectric distortion directions gives rise to a complicated stress-field pattern (rhombohedral PbZr03 and (lll)-PZT). In particular, we report a piezoelectric response in the rhombohedral PbZr03 due to B metal and oxygen atomic motions along a composite direction comprised of the (111) atomic distortion and (100) uniaxial strain directions. In the (lll)-PZT crystal, we find complex Pb and O motions against a fixed B metal atom sub-lattice upon application of tetragonal stress.
This study demonstrates the utility of stress fields and their applicability to ferroelectric phenomena. The construction of the local stress field is computationally tractable and provides an intuitive way to visualize and understand the response of a crystal to applied stress. Stress-field analyses done in conjunction with spontaneous polarization studies will further broaden the understanding of piezoelectric materials.

46 N. J. RAMER et al.
Ackno wledgments
We would like to thank Karin Rabe for illuminating and valuable discussions on various aspects of the work. In addition we would like to thank Steven P. Lewis, Eric J. Walter, Lewis D. Book, and Mark Feldstein of the University of Pennsylvania for their help in the preparation of this work and manuscript. We also would like to thank John Shalf of the National Center for Supercomputing Applications for his help with the visualization of the stress fields using AVS 5.02.[27] This work was supported by the Laboratory for Research on the Structure of Matter and the Research Foundation at the University of Pennsylvania as well as NSF grants DMR 93-13047 and DMR 97-02514 and the Petroleum Research Fund of the American Chemical Society (Grant No. 32007-G5). Computa- tional support was provided by the National Center for Supercomputing Applications and the San Diego Supercomputer Center.
References
[1] J. A. Stroscio and W. J. Kaiser, Eds. Methods of Experimental Physics, 11 (Academic Press, San Diego, 1993).
p; [3: [4: [5: [6: [T [s [9.
[io: [11
[12;
[i3: in; [is; lie; [17
[is; [i9; [20' [21 [22" [23 [24; [25; [26; [27;
Jaffe, B., Roth, R. S. and Marzullo, S. (1955). J. Res. Nat. Bur. Stand., 55, 239. Jona, F. and Shirane, G., Ferroelectric Crystals (Macmillan, New York, 1962). Ikeda, T. Fundamentals of Piezoelectricity (Oxford, New York, 1990). Saito, Y. (1996). Jpn. J. App. Phys., 35, 5168. Ikegami, S., Ueda, I. and Nagata, T. (1971). J. Acous. Soc. Am., 50, 1060. Mele, E. J. and Rappe, A. M. Work in progress. Vanderbilt, D. (1997). Unpublished communication. Nielsen, O. H. and Martin, R. M. (1983). Phys. Rev. Lett., 50, 697. Nielsen, O. H. and Martin, R. M. (1985). Phys. Rev. B, 32, 3780. Payne, M. C, Teter, M. P., Allan, D. C, Arias, T. A. and Joannopoulos, J. D. (1992). Rev. Mod. Phys., 64, 1045, and references therein. Rappe, A. M., Rabe, K. M., Kaxiras, E. and Joannopoulos, J. D. (1990). Phys. Rev. B, 41, 1227. Kleinman, L. and Bylander, D. M. (1982). Phys. Rev. Lett., 48, 1425. Ramer, N. J. and Rappe, A. M. Phys. Rev. B, submitted. Koelling, D. D. and Harmon, B. N. (1977). J. Phys. C, 10, 3107. Monkhorst, H. J. and Pack, J. D. (1976). Phys. Rev. B, 13, 5188. Fujishita, H., Shiozaki, Y., Achiwa, N. and Sawaguchi, E. (1982). J. Phys. Soc. Jpn., 51, 3583. Fujishita, H. and Hoshino, S. (1984). /. Phys. Soc. Jpn., 53, 226. Teslic, S. and Egami, T. (1997). Ada Cryst. B, submitted. Whatmore, R. W. and Glazer, A. M. (1979). J. Phys. C, 12, 1505. Garcia, A. and Vanderbilt, D. (1996). Phys. Rev. B, 54, 3817. Friere, J. D. and Katiyar, R. S. (1988). Phys. Rev. B, 37, 2074. Singh, D. (1995). Phys. Rev. B, 52, 12559. Hellman, H. Einführung in die Quanten Theorie (Deuticke, Leipzig, 1937). Feynman, R. P. (1939). Phys. Rev., 56, 340. Park, S. and Shrout, T. R. (1997). /. App. Phys., 82, 1804. AVS 5.02 (Application Visualization System) is a product of Advanced Visual Systems, Inc. of Waltham, Massachusetts.

Ferroelectrics, 1998, Vols. 206-207, pp. 47-53 Reprints available directly from the publisher Photocopying permitted by license only
) 1998 OPA (Overseas Publishers Association) Amsterdam B.V. Published under license
under the Gordon and Breach Science Publishers imprint.
Printed in India.
ACOUSTIC MODE INSTABILITIES IN FERROELECTRICS: ANHARMONIC
MODE-MODE COUPLING INDUCED BY ELECTRON-PHONON INTERACTIONS
A. BUSSMANN-HOLDER
Max-Planck-Institut für Festkörperforschung, Heisenbergstr. 1, 70569 Stuttgart, Germany
(Received in final form 25 February 1997)
Various reports on large anomalies in the ferroelectric acoustic mode at small wave vectors have been evidenced as an instability to a new coherent quantum state. Especially in SrTi03 this anomaly is found to occur at a characteristic temperature which has been detected by EPR and Brillouin scattering experiments. The present analysis shows that the observed anomaly can find an alternative explanation, i.e. it can originate from electron-phonon-driven anharmonic mode-mode coupling, which leads to giant ^-dependent renormalization in the effective electron-phonon interaction. These renormalizations do not only occur in SrTi03, but also in other oxide perovskite ferroelectrics, e.g., in PbTi03, and stem from highly anharmonic oxygen ion displacements, which are present even for temperatures far away from the ferroelectric transition temperature.
Keywords: Nonlinear lattice dynamics
Ferroelectricity in oxide perovskites is known to stem from a crucial hybridization of oxygen p and transition metal rf-states, m which is strongly coupled to the lattice displacement field. First principles, as well as phenomenological model calculations,ll] achieve consistent agreement with experimental data on the temperature dependence of the soft optic mode, where its frozen-in displacement pattern determines the structure of the low- temperature polar phase. The observation of the softening of this transverse optic mode has - for a long time - been evidenced as supporting a displacive-type phase transition - as opposed to the order-disorder mechan-
47

48 A. BUSSMANN-HOLDER
ism where random hopping between equivalent sites becomes correlated at the transition point. That this clear distinction between the mechanisms is not possible became recently clear where from different experiments controversial conclusions about the mechanism were drawn. [21 The controversy could be clarified theoretically by showing that the particle dynamics in strongly anharmonic systems obey different time and length scales[3] which show up in different experiments. Specifically it became clear that at least very close to Tc, order-disorder features always dominate the dynamics.
All the above results, experimental as well as theoretical, concentrate on the soft optic mode only, which is believed to cause the ferroelectric instability. For SrTi03 it has been shown experimentally recently [4' 51 that the acoustic mode related to the soft optic mode, shows a pronounced anomaly at small ^-values, with a well-defined on-set temperature of «40 K. The occurrence of this anomaly coincides with an anomaly in the EPR signal and has been evidenced as a new quantum coherent state.[5] This explanation is, of course, very intriguing as conventional mode-mode coupling theory is unable to reproduce these observations. Yet, in the following it will be shown that a mode-mode coupling theory can account for these features if it is treated beyond the meanfield level and if the coupling is provided through multiphonon-electron-density interactions. As these interactions are believed to be present in all oxide ferroelectric perovskites, it is concluded that not only SrTi03, but also PbTi03, KNb03
or BaTi03 should show distinct anomalies in their acoustic modes and consequently in the elastic constants.
The model which is being used is the quantum-mechanical analogue of the phenomenological two-dimensional polarizability model,[6] which, by means of the Tomogana transformation, yields an electron-phonon interaction model extended by higher-order density-density multiphonon terms.
H = He\ + H\aU + i/el-latt
k kk!
*.- S M*+f a,a„a„„a,,+ i,,„a,a„ It' i" £'"
Äel-latt = -T= 2 g2<1 (?) n" V JT* Ö-9-' + 77^ Yl %4 ^) nq Q~ ',1 x

ACOUSTIC MODE INSTABILITIES 49
\ V Q-g',l \ -r^ + Q-qW Q-g«,l «-!_.ü..... Ä J e/ci is the ^-dependent band-/ energy with cjjj, c« electron creation and annihilation operators, and % = c~j[ ct, Vkk' the Coulomb repulsion. The lattice Hamiltonian refers to the transition metal-oxygen planes with pt, Qt
momentum and conjugate displacement coordinate of ion i (z'=l corresponds to oxygen, i = 2 transition metal ion) and corresponding harmonic mode frequency w,. As w\ is explicitly admitted to become imaginary, the system is stabilized through the higher-order anharmonic terms proportional to g4 and the second nearest neighbor interactions given by Vu.
From H\&it only there is no net interaction between the two sublattices. This is provided only through i/ei-iatt where the linear electron-phonon interactions g2,i and g2,2 couple on-site and intersite, respectively. In addition to the linear couplings, the term proportional to g4 (q) is considered which yields multiphonon-electron coupling and electron-density-phonon interactions. This last term is included to account for the nonlinear polarizability of the oxygen ion, which is known to be crucially volume- dependent in AB03 systems. [7] From Eq. 1 the equations- of motion are derived:
M\LO2 Qit\ — (Jj,\Qi,i +g4 Qe,\ Qe\\ Qe>",\ - Ve,t> gf,i
-Aeffe,pwn /
<J Qe,2 = —^2,I£Fwt*
Qt,\ (w?,i + S4 Qt',\ Qtn Qt'"i) = -£/• A2,2 u}<2IQi2 - ePAeff u\x IQe,i (2)
with
Aefr = A2:i + \4(epu)(lI + u)i",iQe«,iwe"',i Qe\\)
A,- Nhirep u>i
I— — tanh zrr^dk Jo Ek 2kT
{ y,lßf,l + ^q',lQe",l^q'",\ Qtl",\ \\ \ (3)

50 A. BUSSMANN-HOLDER
The above system of nonlinearly coupled equations is solved exactly self- consistently for arbitrary q for the displacement coordinates as well as the corresponding frequencies. This means that opposite to former approaches, a meanfield treatment of the higher-order nonlinear terms is not made which has the substantial advantage that finite q nonlinear effects can be investigated exactly. In order to find the exact solutions numerically, ek is neglected, which corresponds to the ionic limit, valid for ferroelectrics, and the phonon decay process is restricted to one channel only: q = q'+ q" + q'" with the corresponding energy conservation %(ujq> +ug» + uy») = Huq. The Coulomb interaction is explicitly included in the density - density term appearing in Aeff and might lead to sign changes of Aeff, if metallic systems are considered.
Exact solution for the Qt and w; are obtained by starting from trial frequencies w„ solve for Qh reinsert the Qt into the equations of motion, solve for wt and iterate until convergence is achieved. The observed slow convergence is clearly a signature of the metastability of the system. As temperature effects are not explicitly included, the temperature is simulated through the variation of J\, which determines the height of the local double- well potentials. The remaining interactions and frequencies have been taken from earlier results obtained within a meanfield self-consistent phonon approximation (MFSPA),[8] and it is found that the agreement between the present and the former calculations is astonishingly good for the overall dispersion. The dispersion of the two modes considered is shown in Figure 1 for three different tempratures. Similar to the previous results, mode softening is observed for decreasing ui\ and the overall impression does not indicate substantial finite ^-anomalies. Yet, from Figure 2 it is clear that the blown-up dispersion for small q shows substantial anomalies in the (11) direction, which are manifested below 40 K. For comparison the MFSPA results are shown in Figure 3. Even though a softening of the acoustic mode is apparent with decreasing J\, the anomalies appearing in Figure 2 are absent. In order to clarify the origin of the pronounced TA-phonon anomaly, the ^-dependence of Aeff is calculated and the normalized values Aeff(tf)Aeff(# = 0) is shown in Figure 4. At sufficiently large temperatures Aeff
is practically constant along the (11) and the (10) direction with small enhancements along (11) around # = 0.3 and # = 0.6. With decreasing temperature these anomalies shift to the zone center and the zone boundary. For T=10K giant fluctuations of the normalized effective coupling are observed along (11) with a pronounced maximum at very small q-values. Also along the (10) direction a strong enhancement of the normalized

ACOUSTIC MODE INSTABILITIES
10-r
51
q<10>
FIGURE 1 Dispersion of the lowest transverse acoustic and optic modes along (11) and (10) for the indicated temperatures.
\ '—' //■
•\\ N a A ^ //■
■\\ I" //■ »', \ ' ■
i 3 /// / 4 *- 220/1:1 / / 1 '■' / /
■^r^--^ v. \ /!j ^/. '■•■•-C^^ V\V- as/ a ^ ./,■■■' ..•••■••" '■•'.. **-. "—• ^*\. '• \ ■' >:S .' ■■ ■•••■" if .—' ,- ..-'
"•■•• "'--. '^^H '• f! y' *** .••**'"
m.---" / '"■"••-. **"V\> # / /
''■■ \
1 1 1 \ 1 : ,.-- 0.4 0.3 0.2 \0.1 A
"■•■•./ i / i i i
<0/\.0.l/ 0.2 0.3 0.4
q<10> \ q <11>
FIGURE 2 Enlarged small ^-dispersion corresponding to the framed area of Figure 1 of the same modes including results for imaginary frequency, i.e. T < OK.
coupling is observed but here the dramatic ^-dependent fluctuations are absent as already evidenced for the higher temperatures. What remains unresolved, but will be clarified in the future, is the question about the onset

52 A. BUSSMANN-HOLDER
0.75
v[THz]
0.5
0.25
Results from SPA ^-''
,''" ,*''
,'"'' i
<^~'^ ——— ' ■—
1 1 1
40K 30K 20K 10K
0 0.02 0.04 0.06 0.08 0.1 q
FIGURE 3 Dispersion of the lowest transverse acoustic and optic mode as obtained from the MFSPA calculations [Ref. 8].
X 2a 0
Wq)/Wq=o) 10-
"--A.
__,,'
0.5
q<10>
-1 o- -1-
10K
>*\ 40K \
85K 0.5
q<11>
X X 2a '2a
FIGURE 4 Normalized ^-dependent effective electron-phonon coupling along (11) and (10) at the indicated temperatures.
of the acoustic mode anomalies. Due to the above mentioned slow convergence of the problem a systematic study of the onset temperature has not yet been carried through. Yet, the origin of the present finding seems

ACOUSTIC MODE INSTABILITIES 53
to be clearly attributable to substantial anharmonic dynamical displace- ments of the oxygen ion, contrasted to quasiharmonic dynamics of the transition metal ion, which are present at all temperatures.
In summary, an alternative explanation for experimentally observed transverse acoustic mode anomalies in ferroelectrics is presented using an anharmonic electron-phonon interaction model, which is solved exactly self- consistently for arbitrary q. Thus, considerable progress is made in studying the dynamics of nonlinear systems as compared to approaches based on MFSPA results. In agreement with experiment strong ^-dependent anomalies are observed for the TA-branch along (11), which can be attributed to giant fluctuations in the normalized effective ^-dependent electron-phonon interaction, driven by the anharmonic oxygen ion dynamics.
A ckno wledgement
It is a pleasure to acknowledge very useful comments by J. F. Scott.
References
[1] Bilz, H., Benedek, G. and Bussmann-Holder, A. (1987). Phys. Rev. B, 35, 4840; See e.g. Proceed. On Williamsburg Workshop on "First-Principles Calculations on Ferroelectrics", Ferroelectrics, 164 (1995).
[2] See e.g. Stachiotti, M., Dobry, A., Migoni, R. and Bussmann-Holder, A. (1993). Phys. Rev. B, 47, 2473, and references therein.
[3] Bussmann-Holder, A., Bishop, A. R. and Benedek, G. (1996). Phys. Rev. B, 53, 11521; Bussmann-Holder, A. and Bishop, A. R. (1996). Phil. Mag. B, 73, 657.
[4] Courtens, E., Hehlen, B., Coddens, G. and Hermion, B. (1996). Physica B, 219-220, 577; Hehlen, B., Perou, A.-L., Courtens, E. and Vacher, R. (1995). Phys. Rev. Lett., 75, 2416.
[5] Müller, K. A., Berlinger, W. and Tosatti, E. (1994). Z. Phys. B, 94, 12596. [6] Migoni, R., Bilz, H. and Bäuerle, D. (1978). Phys. Rev. Lett., 37, 277. [7] Bussmann-Holder, A., Bilz, H., Roenspiess, R. and Schwarz, K. (1980). Ferroelectrics, 25,
343. [8] Bussmann-Holder, A., Bilz, H. and Benedek, G. (1980). Phys. Rev. B, 39, 9214. [9] The onset temperature of the acoustic mode anomaly has recently been adressed by Scott,
J. T. Ferroelectrics, in press.

Ferroelectrics, 1998, Vols. 206-207, pp. 55-67 © 1998 OPA (Overseas Publishers Association) Reprints available directly from the publisher Amsterdam B.V. Published under license Photocopying permitted by license only under the Gordon and Breach Science
Publishers imprint. Printed in India.
ELECTRONIC STRUCTURES AND THE PHASE STABILITY OF PEROVSKITE-TYPE
OXIDES KNb03 AND KTa03
MICHIHIDE KITAMURA3 and HAYDN CHENb
a Department of Electrical and Electronic Engineering, Utsunomiya University, 2753 Ishii-machi, Utsunomiya, Tochigi 321, Japan;
b Department of Materials Science and Engineering, University of Illinois at Urbana-Champaign, 1304 West Green Street, Urbana IL 61801, USA
(Received 20 February 1997; In final form 6 May 1997)
Electronic structures of perovskite-type oxides of KNb03 and KTa03 are calculated for the first time by the band theory based on the self-consistent-charge extended Hiickel tight-binding (SCC-XHTB) method including the self-consistent-field (SCF) atomic structure calculations and the scalar relativistic correction. By using the resultant densities of states and the SCC's, the total energies are evaluated for both cubic and tetragonal phases. It is found that the KNb03 is stable for the tetragonal phase and the KTa03 is stable for the cubic one.
Keywords: KNb03; KTa03; SCF; perovskite-type
1. INTRODUCTION
Perovskite-type compounds ABC3 have been extensively studied from both experimental and theoretical points of view, especially the perovskite-type oxides AB03 such as ^Ti03 with A = Ca, Sr, Ba and Pb and K2?03 and LU?03 with 5 = Nb and Ta, have been great interested in physics,[1 ~14]
because the ferroelectric behavior is found in some of the v4503's and the structural phase transition from the cubic phase .to the tetragonal one is observed at the transition temperature Tc. The ferroelectric property is of course closely related to the electronic structure of crystal, so it is very important task to calculate the electronic structures of the AB03's on the basis of the self-consistent manner.
55

56 M. KITAMURA AND H. CHEN
We have already calculated the electronic structures of some crystals on the basis of the extended Hückel tight-binding (XHTB) method, and found that the XHTB method is well applicable to the studies of not only the electronic structures'15^171 but also the phase stability[17' 18] and the elastic property.[19] In order to do a further study for the electronic structure of crystal, in the present paper, the previous band theory based on the XHTB method is extended in such a way that the calculation satisfies the condition of the self-consistent-charge (SCC), and in order to check the reliability of the band theory based on the self-consistent-charge extended Hückel tight- binding (SCC-XHTB) method, the electronic structures of perovskite-type oxides KNb03 and KTa03 are studied as a first application of the SCC- XHTB band structure calculation. The motivation of the present paper is to extend the XHTB method which is easily applicable to the electronic structure calculations of complicated structure materials such as a relaxor so as to satisfy the condition of the self-consistent-charge (SCC), and to apply the method to the electronic structure calculations of perovskite-type oxides KNb03 and KTa03 as a first step. Here, it should be noted that the SCC- XHTB band structure calculation includes the self-consistent-field (SCF) atomic structure calculations in each iteration routine, and that the SCF atomic structure calculation is based on the Hartree-Fock-Slater method[20)
using the atomic data of Herman and Skillman[21] and the Schwarz's exchange parameter [22] for the exchange corrections. Moreover, it is mentioned that the relativistic effects except for the spin-orbit interaction have also been included by the perturbation theory, in order to calculate the energy levels as correctly as possible.
2. THEORY
The theoretical details for the XHTB method have already been given in Ref. 16 so in the present section, we briefly state the XHTB method and describe how the number of electron on a valence orbital is calculated in the SCC-XHTB band structure calculation.
The Schrödinger equation to be solved is
Htfk(r) = £k*k(r), (1).
and the one-electron wave function *k(r) specified by a wave vector k within the first Brillouin zone (BZ) is written as
Mr) = J2Y,uL](VXL](k>*)> (2)

ELECTRONIC STRUCTURES KNb03 AND KTa03 57
Xf (M = ^e*-R^^(r-RM)/^:, (3) R,
where </>£ (r - R,,) is the atomic orbital with a quantum state denoted by the collective index L= (I, m) for the \i ion located at R^, and the atomic orbital <j>i' (r) is numerically obtained by using the self-consisten-field (SCF) atomic structure calculation based on the Hartree-Fock-Slater method .[20]
The matrix equation to be solved is a generalized eigenvalue problem such as
H(k)u(k) = £kS(k)u(k), (4)
and the matrix elements are given by
H[^(k) = (xi\k,T)\}i\xP(Kr))
^^'(^(WttPi*-*»)), (5)
5Öf")(k) = <x£,)(k,r)|x£?(k,r)>
= ^e^(^(r)|^(r-R,)), (6) R„
Here, the matrix element in Eq. (5) is evaluated in the XHTB method as follows:
(^W(r)|H|(r-R„)> = ((?/2)(eW+eM)
x<^(r)|*M(r-R„)), (7)
where e^' is the atomic energy including both the Madelung and the relativistic corrections, and G is an adjustable parameter usually set to the value of 1.75. The overlap integral (<^i (r)|0^?(r - R„)) can be transformed into basic overlap integrals A^y (R„) with £, £' = s, p and d and X = a, TT
and 6 by use of direction cosine (a, ß, 7) of R», as shown in the table of Slater and Koster.[23] The basic overlap integral is calculated using an elliptic coordinate and the atomic orbitals obtained numerically from the SCF atomic structure calculations. The electronic structure calculations using the XHTB method we have already done have indicated that Eq. (7) is fairly available for the evaluation of the Hamiltonian matrix elements, [15~19' however, this equation may overestimate the Hamiltonian matrix elements

58 M. KITAMURA AND H. CHEN
between core-like orbitals because of the deep energy levels of those. Physically, the Hamiltonian matrix elements between the core-like orbitals should be small, so that in the present paper those matrix elements are set to zero instead of doing the evaluation by Eq. (7).
The total density of states D(E) is defined by
n D{E) = 2Y,KE-Ek), (8)
k
and the partial density of states P^\E) is defined by
lf{E)=2YfPW{E-Ei), (9) k
where
ffw=v^(k)vW(k)/^5:vit(k)^(k). (io) I v U
Here v^(k) is the projected value of the total wavefunction |*k(r)) represented as *£„, £L, H^'MIX^M)
int0 a base Ix^CM) which is a
Bloch state characterized by the site (j, and the quantum state L=(n, I, m), i.e.,<xi")(k,r)|*k(r)))So
viA')(k) = EE^')(k)4^')(k)- (")
It should be mentioned here that the v£°(k) is equal to the u^\k) when the basis set is orthogonal, i.e., S^^ (k) = <$z,z,'<W- In the case, it is of course noted that/^k) = |«iM)(k)|2,' because of E.EL- K^OOH^OO = 1.
The energy shift due to the relativistic effect is originated from the mass- velocity term Ae^„,, the Darwin term Ae^, and the spin-orbit interaction term which is zero for / = 0 and for ty 0 it is given by /Ae^.^ for /+ 1/2 and -(/+ 1)A4O„/
for l~\ß, and they are calculated using the perturbation theory as follows: [ '
AÄH!)Tr2*)2(r){*~ I/""M>2*' <12)

ELECTRONIC STRUCTURES KNb03 AND KTa03 59
Here a is a fine structure constant and £<y„ i, R„] (r) and V^\r) are the energy eigenvalue, the radial function and the atomic potential obtained from the self-consistent-field (SCF) atomic structure calculation for ß atom. The energy with the qua turn state O, L) used in the present SCC-XHTB band structure calculation is obtained by adding the relativistic corrections except for the spin-orbit interaction into the Madelung corrected energy with the (IJ,,L).
3. CALCULATION
The band theory based on the self-consistent-charge extended Hiickel tight- binding (SCC-XHTB) method is constructed by joining the molecular- orbital (MO) theory based on the SCC-XHTB method [15] and the band theory based on the XHTB method.[16] The theoretical details for the SCC- XHTB MO and the XHTB band theories have already been given in our previous papers [15' 16] and the section II, so in the present paper, only the flow chart of SCC-XHTB band structure calculation for the perovskite-type oxides ABO3 is shown in Figure 1. In the present paper, the electronic structures for not only the Oh symmetry (cubic phase) but also the D4h one (tetragonal phase) are calculated to study the phase stability of the K503
with 5=Nb and Ta. In order to avoid the numerical error due to the difference of the calculational routines, the same program is used for the electronic structure calculations of both the cubic and tetragonal phases, i.e., even in the case of the cubic phase, the band structure calculation is carried out using the Brillouin zone with D4h symmetry whose shape is of course cubic in this case.
The orbitals as a basis set used in the SCC-XHTB band structure calculations of KB03 with B = Nb and Ta are 3p and 4y orbitals of K atom, Ad, 5s and 5p ones of Nb, Sd, 6s and 6p ones of Ta, and 2s and 2p ones of oxygen. The 3p orbital of K atom and the 2s orbital of oxygen can be regarded as the core-like orbital, so in the present paper, the numbers of electrons on these orbitals are fixed in the iterational routine in the SCC- calculation. Namely, the valence orbitals used in the SCC-XHTB band structure calculation and the numbers of electrons on the orbitals are set to K: 3/4**, Nb: 4du5sv5pw, Ta: 5du6sv6pw, and O: 2s22pz. The values of x, u, v, w and z are of course obtained when the condition of the SCC is satisfied
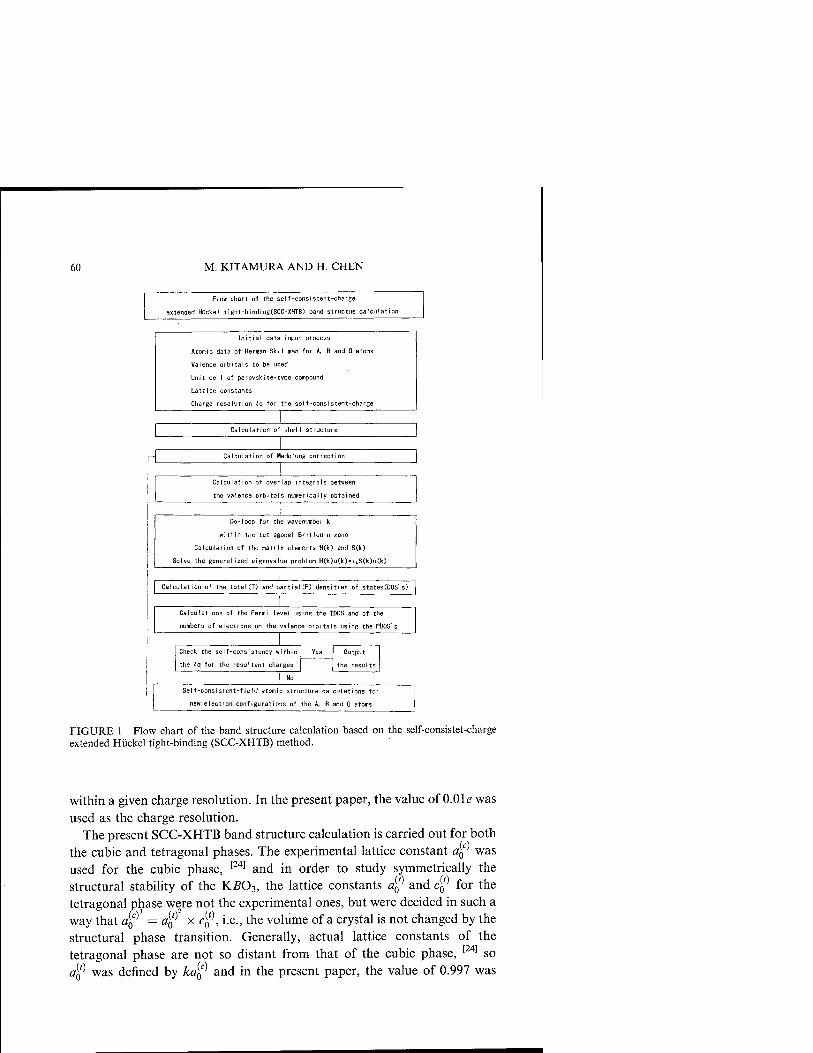
60 M. KITAMURA AND H. CHEN
Flow chart of the self-consistent-charge
extended Hückel tight-binding(SCC-XHTB) band structue calculate
Init al data input process
Atomic data of He rma n-Sk i1 Im an for A, B and 0 atoms
Va1ence orb tals to je used
Unit ce II 0 perovsk te-type compound
Lattice constants
Charge reso ution Aq for the self-consi tent- charge
| Ca culat/ on of shell str ucture
1 -1 Calcu 1 at ion of Hade lung CO rrection
Calculation of overlap integrals between
the valence orbitals numericaliy obtained
1 Dc -loop for the wavenumber k
<H th n the tetragonal Bri1louin zone
Cal culat on of the matrix elements H(k) and S(k)
Sol ve the gene al zed e genvalue problem H(k) Li(k) = vSCk)u<k)
Calculation of the total(T) and partial(P) densities of statesCDOS's)
Calculations of the Fermi level using the TDOS and of the
numbers of electrons on the valence orbitals using the PDOS's
Check the self-consistency within
the Aq for the resultant charges
Output
the result:
Self-consistent-field atomic structure calculations for
new electron configurations of the A, B and 0 atoms
FIGURE 1 Flow chart of the band structure calculation based on the self-consistet-charge extended Hückel tight-binding (SCC-XHTB) method.
within a given charge resolution. In the present paper, the value of 0.01 e was used as the charge resolution.
The present SCC-XHTB band structure calculation is carried out for both the cubic and tetragonal phases. The experimental lattice constant a^ was used for the cubic phase, [24] and in order to study symmetrically the structural stability of the KB03, the lattice constants af and c$ for the tetragonal phase were not the experimental ones, but were decided in such a way that a^ = af x c%\ i.e., the volume of a crystal is not changed by the structural phase transition. Generally, actual lattice constants of the tetragonal phase are not so distant from that of the cubic phase, [24] so a$ was defined by kc$ and in the present paper, the value of 0.997 was

ELECTRONIC STRUCTURES KNb03 AND KTa03 61
adopted as k. Used lattice constants are tabulated in Table I. Furthermore, in order to study systematically the effect of lattice distortions which breaks an inversion symmetry, in the present paper the lattice distortions observed in the polar tetragonal phase have been made by settting the value of 6 to 0.02 which describes the lattice displacement (in c0) along with a c-axis of all the oxygens. Total energy Etot in units of eV/cell consists of the energy Eei
come from electrons and the energy Estat from the electrostatic interaction between charged ions. Here, it should be noted that in the present paper, the EA includes not only the energy E§mä\= fi£ ED(E)dE) due to the valence band but also the energy £^ore)(= X^core"core£core) due to the core orbitals.
The number of sampling points of k used to calculate the density of states is 4096. Reference 25, which has stated that 256 sampling points are enough to obtain the well converged band energy for zincblende structure semiconductors, may clarify that 4096 sampling points are large enough to obtain the converged results, in spite of the structural difference between the [001] uniaxial strain applied zincblende structure and the tetragonal structure considered in the present paper.
4. RESULTS AND DISCUSSION
The total density of states (TDOS) for KNb03 obtained from the SCC- XHTB band structure calculation is shown in Figure 2(a), and that for KTa03 is shown in Figure 3(a). From these figures, first we can see that the TDOS's of KNb03 and KTa03 are very similar to each other, and that the valence band consists of three bands, lower, middle and upper bands, and the conduction band consists of two bands (lower and upper), in spite of the observation that the middle and upper valence bands are somewhat overlaped in the KTa03. The calculated energy gap E^alhn e^ is 3.75 for KNb03 and 4.75 for KTa03 within the energy resolution of 0.25 eV, which
TABLE I Values of the self-consistent-charges x, u, v, w and z obtained from the self- consistent-charge extended Hiickel tight-binding (SCC-XHTB) band structure calculation and the resultant charges q(K), q{B) and q(0) for the K503 with 5 = Nb and Ta. The SCC's x, u, v, w and z are numbers of electrons on the K-4s, Nb(Ta)-4(5)rf, Nb(Ta)-5(6)s, Nb(Ta)-5(6)/?, and 0-2p orbitals. Lattice constant ay (atomic units) for the cubic phase and the calculated and experimental energy gaps (eV), Eg ' and Eg , are also tabulated
Crystal x u v w z q(K) q(B) q(O) F(™0 p (,'xp)
KNb03 0.38 1.75 0.43 1.23 4.74 KTa03 0.39 1.76 0.45 1.19 4.74
0.62 1.59 -0.74 0.61 1.60 -0.74
7.572 7.537
3.75 4.75
~3.3 3.79

62 M. KITAMURA AND H. CHEN
10 8
6 4
2
0
8
<=■ 6
1 4 > 2 "55 0
S 8 ¥ 6
S 4 o z- £> 0 "I 8 Q 6
4 2
(a)
i L (b)
(c)
(d)
.^-. (e)
35 -30 -25 -20 -15 -10
Energy(eV)
FIGURE 2 Densities of states (DOS's) (states/eV cell) within the energy resolution of 0.25 eV for the perovskite-type oxides KNb03 obtained by using the SCC-XHTB band structure calculation, (a) The total density of states (TDOS), (b) the partial density of states (PDOS) for K-3/> orbital, (c) the PDOS for Nb-5j? orbital, (d) the PDOS for Nb-4rf orbital, and (e) the PDOS for 0-2p orbitals. Energy in eV is measured from the vacuum level. The energy position of the valence band maximum is indicated by an arrow.
are satisfactory for the comparison with the experimental values of ~ 3.3 (Ref. 8) for the former and 3.79 (Ref. 8) for the latter. The values of the calculated SCC's x , u, v, w and z and the resultant charges q(K), q(B) and q(0) are tabulated in Table I together with the energy gap and the lattice constant a£\ The common feature observed in both TDOS's is that the lower valence band mainly consists of 2s orbitals of oxygens denoted hereafter as O-ls orbitals and that the K-4s and the Nb(Ta)-5(6> and 5(6)/> orbitals make small DOS's. Namely, it is noted that the other valence orbitals, i.e., the K-3p, the Nb (Ta)-4(5)rf and the 0-2p orbitals, make

ELECTRONIC STRUCTURES KNbOj AND KTa03 63
>
3
Q
10 8 6 4 2 0 8 6 4 2 0 8 6 4 2 0 8 6 4 2 0 8 6 4 2 0
(a)
A. (b)
(c)
(d)
(e)
35 -30 -25 -20 -15 -10 -5 Energy(eV)
0 5
FIGURE 3 The same as in Figure 3, but for KTa03. (a) The TDOS, (b) K-3/> PDOS, (c) Ta- 6p PDOS, (d) Ta-5d PDOS, and (e) 0-2p PDOS.
almost all the valence and conduction bands. In the following, therefore, we focus our attention on the middle and upper valence bands and the conduction band which play an essential role on the study of the electronic property of the AB03.
The partial densities of states (PDOS's) obtained for KNb03 are shown in Figures 2(c), (d) and (e), and those for KTa03 are shown in Figures 3 (b), (c), (d) and (e). In these figures, the PDOS for the K-3p orbital denoted as K-3p PDOS is shown in (b), the Nb(Ta)-5(6)/? PDOS is in (c), the Nb(Ta)- 4(5)d PDOS is in (d), and the O-lp PDOS is shown in (e). We can also see that the PDOS's KNb03 and KTa03 are similar to each other as well as the case of the TDOS. From the comparison of the TDOS in (a) and the Nb(Ta)-4(5)rf PDOS in (d), it is found that the B-nd valence orbital in the

64 M. KITAMURA AND H. CHEN
K503 makes almost all the conduction band, but that the considerable DOS's due to the B-nd orbital are formed on the upper valence band. This observation on the upper valence band clearly shows that the hybrid of 0-2p and Nb(Ta)-4(5)J orbitals is sizable on the upper valence band. Actually, these DOS's on the upper valence band have already been observed in the photoelectron spectroscopy for KNb03 and KTa03 (Ref. 8). Next, it is seen from (b) that the K-3p orbital mainly contributes to the middle valence band, and finally, from (e) we can see that the O-lp orbitals mainly contribute to the upper valence band.
Neumann et al.[8] have measured the photoelectron spectra (PES) of KNb03 and KTa03, and compared them with the spectra calculated on the basis of the self-consistent scalar-relativistic linear-muffm-tin-orbital (LMTO) method. As well as our calculation, they have also found in both the experiment and calculation that there is no significant difference between the spectra obtained for KNb03 and KTa03. The spectrum to be compared with the PES is obtained by multipling the Fermi distribution function and the Lorentian into the TDOS. The TDOS and the spectrum calculated by us for KNb03 are shown in Figures 4(a) and (b) together with the experiment in (c) and calculation in (d) done by Neumann et al. They have obtained the spectrum to be compared with PES, which is drawn by a broken curve in Figure 4(d), by convoluting a Gaussian of 2.5 eV full width at half maximum into the TDOS. In the present calculation, the Lorentian with a width of 2.0 eV was used to obtain the spectrum to be compared with the PES, tentatively. The experimental spectrum shown in Figure 4(c) consists of three structures, a, ß and 7. Aside from the peak position of the structure ß, it seems that both the calculated spectra shown in (b) and (d) satisfactory predict the experimental feature. Our calculation shows that the structure a is originated from the 0-2.? orbitals, the structure ß is come from the K-3/? orbital, and the structure 7 is made from the 0-2p orbitals including Nb-4J orbital considerably, as can be seen from Figure 2. Our assignment for the structures a, ß and 7 is the same as Neumann et al, however the origin of the disagreement between the experimental and the calculated peak positions of the structure ß should be clarified. Generally, a reasonable result should be found from a method in which a wavefunction is well represented and the Hamiltonian matrix elements are well evaluated, so we think that the expansion of the wavefunction seems to be not enough to represent the electronic state, especially for the K atom. In the present situation, however, we can not check this point explicitly, because of the restriction for the number of Bloch states used in the program. At the end of this paragraph, we wish to make a comment for the charges #(K), q(B) and

ELECTRONIC STRUCTURES KNb03 AND KTa03 65
^35 -30 -25
Energy(eV)
FIGURE 4 Comparison of the calculated spectra with the experimental one for KNb03. (a) The total density of states (TDOS) calculated by authors using the self-consistent-charge extended Hückel tight-binding (SCC-XHTB) method, (b) the spectrum obtained by multipling the Fermi distribution function and the Lorentian with a width of 2.0 eV into the TDOS drawn in (a), (c) the photoelectron spectrum (PES) observed by Neumann et al, and (d) the TDOS (solid curve) calculated by Neumann et al., using the self-consistent scalar-relativistic linear- muffin-tin-orbital (LMTO) method, where a broken curve was obtained by convoluting a Gaussian of 2.5 eV full width at half maximum into the TDOS.
q(0) of K, B and O ions of the K503 with 5 = Nb and Ta. Neumann et al. -+0.63O+0.20 0+u/u and roughly presented the charge distributions such as K Nb
K-o.87Ta+o.770+o.io We think that it is natural to consider that K, Nb and
Ta atom act as the cation and O atom works as the anion. As can be seen from Table I, our result for the charge behaves of course like this.
Finally, we will discuss the phase stability of the K503 with B = Nb and Ta. As already mentioned, the total energy Etot consists of Erel
an ', E^™' and jrJstat- The energy differences, Aistot, is^ \^ an<i Aisstat, of those energies calculated for the KB03 with both the cubic and tetragonal phases are tabulated in Table II together with the used lattice constants and the transition temperature Tc of KNbC>3 (Ref. 26). Here, it is well known that the KTa03 holds the cubic phae untill at least 1.6 K (Ref. 26). Table II clearly shows that KNb03 is stable for the tetragonal phase and KTa03 is stable for the cubic phase. Here we should renote that in the tetragonal

66 M. KITAMURA AND H. CHEN
TABLE II Differences A£^and), E§°re), A£stat and A£tot between the energies E^n6\ E§ore), £stat and Etot calculated for both cubic and tetragonal phases. The energy is in units of eV/cell. The lattice constants öQ , ao an^ co m atomic units used for the cubic and tetragonal phases and the transition temperature TC(K) of KNb03 are also tabulated. Note that in the tetragonal phase, the lattice displacements along with a c-axis are assumed for all the oxygens, and the value of the displacement has been set to 0.02 in units of c0
Crystal a(c) "0 a{,)
"0 A£M AE(core)
^As/af A£w, T x c
KNb03
KTa03
7.572 7.537
7.550 7.515
7.618 7.583
0.0298 -0.1224
0.0441 0.0938
-0.0002 -0.0010
0.0737 -0.0296
691
phase considered in the present paper, the effect of lattice distortions which break an inversion symmetry is taken into account by uniform displace- ments along with the c-axis of all the oxygens. In order to do a further study for the structural stability, it is necessary to know the geometrical arrangements of not only the cubic phase but also the tetragonal phase including the lattice distortions, but unfortunately there are no data for the tetragonal phase of KTa03.
5. SUMMARY
A band theory has been developed by joining the molecular-orbital (MO) theory based on the self-consistent-charge extended Hiickel tight-binding (SCC-XHTB) method and the band theory based on the XHTB method, and the developed SCC-XHTB band theory has been applied for the first time to the electronic structure calculations of perovskite-type oxides KNb03 and KTa03. For the valence band, it has been found that the band consists of lower, middle and upper bands, the lower one is mainly come from the 2s orbitals of oxygens, the middle one is come from K-3/? orbital, and the upper one is constructed by the hybrid of the 0-2p and the Nb(Ta)- 4(5)d orbitals. For the conduction band, it has been demonstrated that the Nb(Ta)-4(5)J orbital makes almost all the conduction band.
By evaluating the total energy of the K503 with B — Nb and Ta for both cubic and polar tetragonal phases, the structural phase stability has been studied tentatively. It has been found that KNb03 is stable for the tetragonal phase and KTa03 is stable for the cubic one.
References
[1] Mattheiss, L. F. (1972). Phys. Rev., B6, 4718. [2] Mattheiss, L. F. (1972). Phys. Rev., B6, 4740.

ELECTRONIC STRUCTURES KNb03 AND KTa03 67
[3] Pertosa, P. and Michel-Calendini, F. M. (1978). Phys. Rev., B17, 2011. [4] Freire, J. D. and Katiyar, R. S. (1988). Phys. Rev., B37, 2074. [5] Weyrich, K.-H. and Madenach, R. P. (1990). Ferroelectrics, 111, 9. [6] Cohen, R. E. and Krakauer, H. (1990). Phys. Rev., B42, 6416. [7] Yong-Niau, Xu, Ching, W. Y. and French, R. H. (1990). Ferroelectrics, 111, 23. [8] Neumann, T., Borstel, G., Scharfschwerdt, C. and Neumann, M. (1992). Phys. Rev., B46,
10623. [9] Cohen, R. E. and Krakauer, H. (1992). Ferroelectrics, 136, 65.
[10] Resta, R., Posternak, M. and Baidereschi, A. (1993). Phys. Rev. Lett., 70, 1010. [11] Postnikov, A. V., Neumann, T. and Borstel, G. (1993). Phys. Rev., B48, 5910. [12] King-Smith, R. D. and Vanderbilt, D. (1994). Phys. Rev., B49, 5828. [13] Singh, D. J. (1995). Ferroelectrics, 164, 143. [14] Singh, D. J. (1996). Phys. Rev., B53, 176. [15] Kitamura, M., Sugiura, C. and Muramatsu, S. (1989). Phys. Rev., B39, 10288. [16] Kitamura, M. and Muramatsu, S. (1990). Phys. Rev., B41, 1158. [17] Holma, M., Kitamura, M. and Chen, H. (1994). J. Appl. Phys., 76, 451. [18] Inoue, H. R. P., Kitamura, M., Wayman, C. M. and Chen, H. (1991). Philo. Mag. Lett.,
63, 345. [19] Kitamura, M., Muramatsu, S. and Harrison, W. A. (1992). Phys. Rev., B46, 1351. [20] Slater, J. C. The Calculation of Molecular Orbitals (Wiley, New York, 1979). [21] Herman, F. and Skillman, S. Atomic Structure Calculations (Prentice-Hall, Englewood
Cliffs, NJ, 1963). [22] Schwarz, K. (1972). Phys. Rev., B5, 2466. [23] Slater, J. C. and Koster, G F. (1954). Phys. Rev., 94, 1498. [24] Wyckoff, R. W. G Crystal Structures (Interscience, New York, 1960), 2. [25] Kitamura, M. and Harrison, W. A. (1991). Phys. Rev., B44, 7941. [26] Ferroelectric and Related Substance, edited by K.-H. Hellwege, Landolt-Börnstein,
III/16a Oxides (Springer-Verlag, Berlin, 1981).

Ferroelectrics, 1998, Vols. 206-207, pp. 69-78 Reprints available directly from the publisher Photocopying permitted by license only
] 1998 OPA (Overseas Publishers Association) Amsterdam B.V. Published under license
under the Gordon and Breach Science Publishers imprint.
Printed in India.
FIRST-PRINCIPLES CALCULATIONS FOR Fe IMPURITIES IN KNb03
A. V. POSTNIKOVa, A. I. POTERYAEVb and G. BORSTEL3
a University of Osnabrück - Fachbereich Physik, D-49069 Osnabrück, Germany;b Institute of Metal Physics, Academy of Sciences
of Russia, Yekaterinburg GSP-170, Russia
(Received 24 February 1997; In final form 28 April 1997)
Nb-substituting Fe impurity in KNb03 is studied in first-principles supercell calculations by the linear muffin-tin orbital method. Possible ways to account for the impurity charge compensation are discussed. Calculations are done in the local density approximation (LDA) and, for better description of Coulomb correlation effects within the localized impurity states, also in the LDA + U scheme. The achievements and problems encountered in both approaches are analyzed. It is found that the impurity possess either a low-spin configuration (with 0 or 1 compensating electron), or a high-spin configuration (with 2 or 3 compensating electrons), the latter two apparently corresponding to practically relevant rechargeable impurity states.
Keywords: Ferroelectricity; doping; photorefractive effect
1. INTRODUCTION
Impurities in ferroelectric crystals play an important role in many physical applications, particularly in what regards optical absorption and the change of dielectric properties under illumination, the so-called photorefractive effects. For a review on this subject see, e.g., Ref.[1]. The explanation of the photorefractive effect is essentially based on the assumption of the existence of several charge states of an impurity, which can be switched by the drift of electrons or holes in the process of illumination. In what regards specifically Fe-doped KNb03, one can address Ref.[2] for the description of the models available, and Ref.[3] for practical aspects of tuning photorefractive properties. Therefore, much experimental effort has been concentrated on
69

70 A. V. POSTNIKOV et al.
the elucidating the electron configuration of impurities in question, related lattice relaxation, or other defects coming along with the substitutional impurities. Important information of this kind can be extracted from electron paramagnetic resonance measurements. Earlier studies for Fe in KNb03
[4] established the presence of Fe3+ centers without local charge compensation and also of other centers, that were interpreted as Fe3+ with local charge compensation, presumably Fe at Nb site with an oxygen vacancy in the nearest neighborhood. The subsequent studies [5] included more detailed comparison of the spectra with the description based on different structure distortion models. It was suggested that the Fe3+ ion is displaced by ~ 0.2Ä towards the neighboring O vacancy. There seems to be now general agreement between the experimentalists that Fe preferentially enters the Nb site in KNb03. The calculations of the energy balance with empirical interaction potential (see Ref.[6], with the potentials from Ref.[7]) show beyond doubt that the Fe substitution at the K site is energetically unfavorable. In contrary to this, Ref. [8] claimed that Fe mostly substitutes K in KNb03, based on the similarity of angular yield particle-induced X-ray emission profiles for K and Fe. This similarity however does not seem highly convincing. One should note that the Fe doping in KTa03, that is equistructural and equielectronic to KNb03, favors another pattern, with higher probability of entering the K site. [6]
In the situation when the information on the electronic structure of doped systems is available from experiment in a rather indirect way, there is a demand for ab initio or other reliable calculations which would provide the energy positions of impurity levels in the gap and compare energetically different mechanisms for the charge compensation and the relaxation pattern around impurity. To out knowledge, just two attempts have been undertaken in this direction up to now. The result of a shell-model calculation by Exner [6] for a Fe at Nb site and an oxygen vacancy as its nearest neighbor is that Fe is displaced by 0.38Ä from the vacancy, i.e., contrary to what was supposed based on the analysis of the electron spin resonance data. [5] Also, the displacement of four "equatorial" O neighbors to Fe is 0.19Ä outwards in the shell-model calculation, [6] contrary to the estimated 0.1Ä inwards in Ref. [5]. The ab initio calculation with the linearized muffin-tin orbital method (LMTO) in the atomic sphere approximation (ASA) for one Nb-substituting Fe in the 2x2x2 supercell of KNb03, without any oxygen vacancies, [9] has shown that the "breathing" relaxation of the 06 octahedron is ~0.05Ä outwards. The shell model calculation for the same geometry (also in Ref. [9]) as well predicts the outward expansion of 06 of comparable magnitude.

FIRST-PRINCIPLES CALCULATIONS, Fe IN KNb03 71
The deficiencies of these previous calculations are that the shell model depends on the empirical interaction parameters fitted into it, and normally discards the anharmonic effects, and the LMTO-ASA calculation is normally too crude for reliable estimates of lattice relaxation. Moreover, no data on the electronic structure of impurity was published in Ref.[9]. The aim of our present study is to provide this information, concentrating specifically on the treatment of different charge configurations within the localized rf-shell. In particular, we compare the treatment within the local density approximation (LDA) with the so-called LDA + U approach. The calculations are done by a LMTO-ASA method for undistorted lattice, without introducing oxygen vacancies. The accurate analysis of lattice relaxation, with and without vacancies, needs the use of a full-potential (FP, i.e., with the potential of general shape). Such FP-LMTO calculations are in progress and will be reported elsewhere.
2. CALCULATION METHOD AND SETUP
The calculations have been done with the LMTO-ASA method, [10] in part using the TB-LMTO code of the O. K. Andersen group in Stuttgart.[11] The LDA + U calculation scheme (discussed below) has been implemented in another LMTO-ASA code by V. I. Anisimov. In all calculations, we considered the cubic high-temperature phase of KNb03 with lattice constant 4.015A; atomic sphere radii were 1.639Ä for Fe and Nb, 1.964Ä for K abd 1.050A for O. Such choice of radii produces the band structure in reasonable agreement with that from FP-LMTO calculations.[12] According to our experience, the use of additional empty spheres in the interstitials of the perovskite structure does not bring any improvement in the LMTO- ASA calculation. In order to account for the lifting of orbital degeneracy at the Fe site, the minimal point group symmetry, including only inversion, was assumed in the calculations.
Although KNb03 is not a typically ionic compound, and, moreover, the covalency of the Nb — O bond is quite important for giving rise to ferroelectric instability, it is useful to refer to nominal ionic charges in order to understand why the problem of charge compensation occurs, when one considers the Fe impurity. Fe is either Fe2+ or Fe3+ in oxides; the sub- stitution of (nominally) Nb5+ with Fe3+ leaves 2 extra electrons in the system, which can be removed along with one O2- ion, thus restoring the neutrality. This is one possible mechanism of local charge compensation;

72 A. V. POSTNIKOV et al.
another, in principle, possible one is that two Fe3+ substitute Nb5+ and K + . In terms of neutral atoms building the crystal, 30 electrons are provided in total in the valance band per unit cell of KNb03 (including K3p, which are treated as valence band states). If Fe atom with its 8 electrons substitutes Nb, only 5 electrons can be absorbed by the valence band, leaving Fe nominally in the 3d3 configuration. This is possible, but expectedly highly instable. In order to restore a typical for Fe 3d5 or 3d6 configuration, one should either provide extra electrons, or remove one oxygen atom, thus reducing the capacity of the valence band. There are essentially only two ways to account for a charge compensation in the calculation - one either specifies explicitly the configuration of impurities/vacancies that provides such compensation, or adds extra electrons to the system, implying that their donors are in some distant parts of crystal and do not affect the local electronic structure. The second way is probably technically easier, because one needs only to search for the Fermi energy corresponding to the specified number of extra electrons in each iteration. In order to keep the supercell neutral, a compensating positive charge is added in the background.
Our initial calculations did not consider the charge compensation in any way, simply treating the neutral supercell with one Nb atom substituted with Fe. As a smallest possible supercell for the modeling of isolated impurity, we considered the perovskite cell doubled in all three directions, i.e., including 40 atoms in total. The density of states (DOS) resulting from this calculation reveals the hybridization of Fe3d states with those of Nb and O over the whole width of the valence band (see Fig. 1). Moreover, several groups of localized impurity states are split off to form flat bands just above the Fermi level. Majority-spin t2g states are completely filled, whereas all other d- orbitals are roughly half-filled. Magnetic moment at Fe is 1.69 /xB and exclusively related to the 3d shell.
It may be noted that the t2g states remain relatively more localized than eg, as should be expected already from the fact that the spatial distribution of the former dominates along the line directed towards the interstitial between adjacent K atoms. On the contrary, eg states directly overlap with the p shells of nearest oxygen atoms. This hybridization mediates the interaction between the e^-impurity levels (for both spin directions) at adjacent Fe atoms which are situated only two lattice spacings apart. As a result, the eg- related subbands are smeared so strongly that the band gap almost disappears. We assume that the 8 x KNb03- supercell is too small for a realistic modeling of isolated Fe impurities.
The doubling of this supercell with the translation vectors (022), (202), (220) results in the \/l times increased distance between Fe atoms. The

FIRST-PRINCIPLES CALCULATIONS, Fe IN KNb03 73
8xKNb03:Fe 16xKNbO,:Fe
■
hi \J
Fe3d
: t
-10 -5 0 Energy (eV)
-10 -5 Energy (cV)
FIGURE 1 Total and Fe3rf-partial DOS as calculated for 40-at. and 80-at. supercells of KNb03 with single substitutional Fe impurity.
broadening of the eg states is then sufficiently decreased to form completely split-off discrete levels in the band gap. The system remains non-metallic, in contrast to the 40-atom supercell where a small DOS at the Fermi level was present. Therefore, this larger 80-atom supercell seems already to be appropriate for the treatment of impurity problem. It should be noted however that the charge and magnetic moment at the Fe site are almost identical in the calculation with both supercells.
The number of electrons and magnetic moments within atomic spheres of Fe and its nearest neighbors of different types are shown in Table I for several numbers of extra electrons. With no extra electrons, the charge configuration of Fe is of course far from the nominal 3d3 as mentioned above in reference to a non-charge compensated case. The reason is, the electrons of the valence band which have been in perfect crystal localized at the Nb site, should be, roughly speaking, added to this number. Since KNb03 is not so strongly ionic, and because of our choice of atomic sphere radii, the electron numbers in Table I are close to those of neutral atoms.
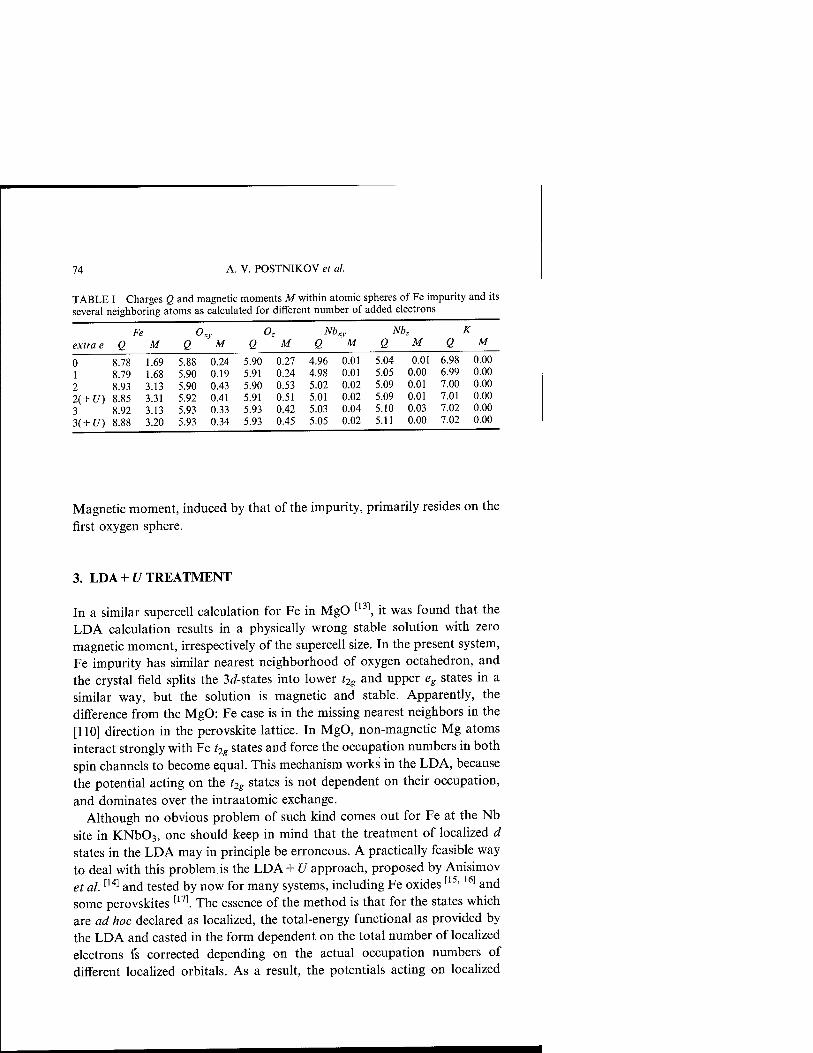
74 A. V. POSTNIKOV et al.
TABLE I Charges Q and magnetic moments M within atomic spheres of Fe impurity and its several neighboring atoms as calculated for different number of added electrons
Fe 0 0 Z Nl xy Nbz K
extra e Q
8.78
M
1.69
Q M Q M Q M Ü M Ü M
0 5.88 0.24 5.90 0.27 4.96 0.01 5.04 -0.01 6.98 0.00
1 8.79 1.68 5.90 0.19 5.91 0.24 4.98 0.01 5.05 0.00 6.99 0.00
2 8.93 3.13 5.90 0.43 5.90 0.53 5.02 0.02 5.09 0.01 7.00 0.00
2(+U) 8.85 3.31 5.92 0.41 5.91 0.51 5.01 0.02 5.09 0.01 7.01 0.00
3 8.92 3.13 5.93 0.33 5.93 0.42 5.03 0.04 5.10 0.03 7.02 0.00
3(+U) 8.88 3.20 5.93 0.34 5.93 0.45 5.05 0.02 5.11 0.00 7.02 0.00
Magnetic moment, induced by that of the impurity, primarily resides on the
first oxygen sphere.
3. LDA+t/TREATMENT
In a similar supercell calculation for Fe in MgO [13], it was found that the LDA calculation results in a physically wrong stable solution with zero magnetic moment, irrespectively of the supercell size. In the present system, Fe impurity has similar nearest neighborhood of oxygen octahedron, and the crystal field splits the 3d-states into lower t2g and upper eg states in a similar way, but the solution is magnetic and stable. Apparently, the difference from the MgO: Fe case is in the missing nearest neighbors in the [110] direction in the perovskite lattice. In MgO, non-magnetic Mg atoms interact strongly with Fe t2g states and force the occupation numbers in both spin channels to become equal. This mechanism works in the LDA, because the potential acting on the t2g states is not dependent on their occupation, and dominates over the intraatomic exchange.
Although no obvious problem of such kind comes out for Fe at the Nb site in KNb03, one should keep in mind that the treatment of localized d states in the LDA may in principle be erroneous. A practically feasible way to deal with this problem is the LDA+ U approach, proposed by Anisimov et al.[14] and tested by now for many systems, including Fe oxides [15'i6] and some perovskites [17]. The essence of the method is that for the states which are ad hoc declared as localized, the total-energy functional as provided by the LDA and casted in the form dependent on the total number of localized electrons is corrected depending on the actual occupation numbers of different localized orbitals. As a result, the potentials acting on localized

FIRST-PRINCIPLES CALCULATIONS, Fe IN KNb03 75
states become occupation dependent, and the one-electron energies get accordingly corrected, thus lifting orbital degeneracies when physically motivated. Effective Coulomb interaction U and effective intraatomic exchange / enter as external parameters in a self-consistent cycle of LDA + U calculation. These parameters can be determined from first principles (see, e.g., Ref. [18]), once the orbitals which should be treated as . localized are selected. However, U and / are of essentially intraatomic character and may be largely transferred within many systems including the same chemical constituent with a priori localized states.
Solovyev et al. [20] thoroughly studied the applicability of LDA+ £7 in comparison with LDA to LaM03 (M=Ti-Cu) perovskite systems, where a similar problem of treating more localized t2g and somehow less localized eg
states of a 3d constituent occurs. As apparently the most reasonable option (among others tested), the t2g states have been singled out as localized ones, to be treated according the prescription of the LDA + {/approach, while eg have been attributed to common band states well describable within the LDA. This segregation may prove useful for the Fe impurity as well. But as a first try, we treated all Fe3d states as localized. Estimates of U for Fe based on somehow different criteria vary from ~9 eV[20] to 5.1 eV;[16] we used in our calculation £7=6.8 eV as estimated in Ref. [I9], and .7=0.89 eV. We did the LDA+ U calculations only for the systems with added 2 and 3 electrons, that corre- spond to experimentally expected (nominally) Fe3+ and Fe2+ configura- tions, correspondingly. The related lines of data in Table I are labeled (+ U).
4. OVERVIEW OF RESULTS
As is seen from Table I, the number of electrons on all constituents, at the exception of Fe, grows very smoothly with the extra background charge. As the first electron is added, nothing happens at the Fe site, and the extra electron goes completely into the valence band, resulting only in a slight shift of the Fermi energy but not visibly affecting the DOS. With the second extra electron, the Fermi level finally crosses the narrow majority-spin eg
subband (Fig. 2). This increases the magnetic moment considerably (by less than 2ßB, however, because the majority-spin eg states also contribute somehow to the already occupied valence band). The distribution of the impurity states in the minority-spin channel is affected only quantitatively. The third extra electron begins to populate the minority-spin t2g subband, but most part of it goes into the valence band, where the charge at all sites almost uniformly increases. It is noteworthy that the magnetic moment at O

76 A. V. POSTNIKOV et al.
> a)
O o
4 -
> 0
^5 <0
S 0 £■ <z> O Q
—■- i i i '
+2e L DA+C/
hg i
^yyv^ ; \ -^>
[1 *25
e9
-
, , 1
+3e e9 LDA
hg
j MAV^\,
"•*pr \ " \
h9
■
eg
h
1 1 1
+3e IDA+U
xy xz,yz I.
e<7
-4 0 4 Energy (eV)
8 -8 -4 0 Energy (eV)
FIGURE 2 Local 3rf-DOS for charge configuration with 2 and 3 addition electrons per 80-at. supercell of KNb03: Fe, as calculated in the LDA and LDA+ U.
neighbors dramatically increases with the addition of the second electron, but comes back (and the charge increases, instead) with the addition of the third one. Since the states at the top of the valence band are of exclusively 02p character (see, e.g., Ref. [12]), the drift of the eg-subband below the Fermi level and into the valence band affects the majority-spin Olp states most directly. The crossing of the Fermi level by minority-spin t2g subband contributes to the minority-spin 02p subband and reduces the magnetic moment on oxygen atoms, increasing at the same time their occupation. At

FIRST-PRINCIPLES CALCULATIONS, Fe IN KNb03 77
this point, the majority-spin eg subband enters the region of noticeable Nb contribution in the valence band and produces the peak of magnetic moment on Nb sites.
Comparing the results of LDA and LDA + U calculations (Fig. 2), one should keep in mind that the overall effect of the latter is the lowering the energies of occupied states and the upward shift of vacant ones. This is exactly what happens in the configuration with 2 extra electrons. Since essentially all majority-spin states are already occupied in this configuration and all minority-spin states empty, the inclusion of the [/-correction has a negligible effect on all integral properties (both charges and moments). However, the exact position of the ^-impurity state is changed, that may give rise to the change in the optical absorption. The situation in the configuration with 3 extra electrons is completely different. Since here the minority-spin t2g state is partly occupied in the LDA, in the LDA + U treatment the potentials acting on the xy, xz and yz components of it become different, thus lifting the orbital degeneracy of these states and distorting the local DOS considerably.
Summarizing, our study of the electronic structure of Fe impurity in the Nb site of KNb03 with the analysis of different charge compensation has shown, that only two considerably different configurations of impurity occur. The first one, with the magnetic moment ~1.7 /uB, corresponds to the substitutional impurity without compensation-the situation that probably is not very common in reality. This configuration, however, survives under addition of one extra electron per impurity. Two extra electrons-or, equivalently, Fe impurity combined with a distant oxygen vacancy-induces a transition into the high-spin state with the magnetic moment ~3.1 /xB, with the minority-spin t2g level in the band gap. The charge and magnetic moment of this configuration remain intact with the addition of third extra electron, but the exact position of the level in the gap (probably, its splitting as well) may be affected. The last two configurations with 2 or 3 extra electrons correspond to the most practically relevant impurity configura- tions, referred to as Fe3+ and Fe2+. A more precise study of their energetics is possible with the use of a full-potential calculation scheme and simultaneous analysis of lattice relaxation around impurity and, optionally, oxygen vacancy.
A cknowledgements
The authors are grateful to V. Anisimov for his assistance and providing the code for LDA+ U calculations, and to M. Korotin for useful discussions.

78 A. V. POSTNIKOV et al.
Financial support of the Deutsche Forschungsgemeinschaft (SFB 225) is gratefully acknowledged. A.I.P. appreciates the support of the NATO International Scientific Exchange Program (Grant HTECH.LG 940861) and the hospitality of the University of Osnabrück during his stay there.
References
[1] Photorefractive Materials and Their Applications I: Fundamental Phenomena, Eds. P. Günter and J.-P. Huignard (Springer-Verlag, Berlin Heidelberg, 1988), pp. 131-66.
[Iff [11
[12:
[13;
[i4;
[is;
lie; [17
[is; [I? [2o;
Buse, K. and Krätzig, E. (1995). Appl. Phys. B, 61, 27. Medrano, C, Voit, E., Amrhein, P. and Günter, P. (1988). /. Appl. Phys., 64, 4668. Siegel, E., Urban, W., Mueller, K. A. and Wiesendanger, E. (1975). Phys. Lett., 53A, 415; Siegel, E. (1976). Ferroelectrics, 13, 385. Possenriede, E., Schirmer, O. F., Donnerberg, H. J. and Hellermann, B. (1989). J. Phys.: Cond. Matter, 1, 7267. Exner, M. Computer-Simulation von extrinsischen und intrinsischen Defekten in Kaliumtantalat- und Kaliumniobat-Kristallen (Shaker, Aachen 1994). Lewis, G. V. and Catlow, C. R. A. (1986). J. Phys. Chem. Solids, 47, 89. Beck, O., Kollewe, D., Kling, A., Heiland, W. and Hesse, F. (1994). Nucl. Instr. Meth. Res. B, 85, 474. Donnerberg, H., Exner, M., Neumann, T., Borstel, G, Schirmer, O. F., Bartram, R. H. and Catlow, C. R. A. Defects in Insulating Materials -Proceedings of the XII Inernat. Conference on, 2 (World Scientific, Singapore, New Jersey 1993). pp. 1178-80. Andersen, O. K. (1975). Phys. Rev. B, 12, 3060. Andersen, O. K. and Jepsen, O. (1984). Phys. Rev. Lett., 53, 2571; Andersen, O. K, Pawlowska, Z. and Jepsen, O. (1986). Phys. Rev. B, 34, 5253. Postnikov, A. V., Neumann, T., Borstel, G. and Methfessel, M. (1993). Phys. Rev. B, 48, 5910. Korotin, M. A., Postnikov, A. V., Neumann, T., Borstel, G., Anisimov, V. I. and Methfessel, M. (1994). Phys. Rev. B, 49, 6548. Anisimov, V. I., Zaanen, J. and Andersen, O. K. (1991). Phys. Rev. B, 44, 943; Liechtensiein, A. I., Zaanen, J. and Anisimov, V. I. (1995). Phys. Rev. B, 52, R5467; Anisimov, V. I., Aryasetiawan, F. and Lichtenstein, A. I. (1997). J. Phys.: Cond. Matter, 9, 767. Anisimov, V. I., Elfimov, I. S., Hamada, N. and Terakura, K. (1996). Phys. Rev. B, 54, 4387. Mazin, I. I. and Anisimov, V. I. Cond-mat/9610147. Korotin, M. A., Ezhov, S. Yu., Solovyev, I. V., Anisimov, V. I., Khomskii, D. I. and Sawatzky, G. (1996). Phys. Rev. B, 54, 5309; Anisimov, V. I., Elfimov, I. S., Korotin, M. A. and Terakura, K. Cond-mat/9609158. Solovyev, I. V., Dederichs, P. H. and Anisimov, V. I. (1994). Phys. Rev. B, 50, 16861. Anisimov, V. I. and Gunnarsson, O. (1991). Phys. Rev. B, 43, 7570. Solovyev, I., Hamada, N. and Terakura, K. (1996). Phys. Rev. B, 53, 7158.

Ferroelectric.?, 1998, Vols. 206-207, pp. 79-91 Reprints available directly from the publisher Photocopying permitted by license only
i 1998 OPA (Overseas Publishers Association) Amsterdam B.V. Published under license
under the Gordon and Breach Science Publishers imprint.
Printed in India.
APPLICATION OF TIKHONOV REGULARIZATION TO DIPOLE GLASS
RELAXATION FUNCTION
BOG-GI KIM and JONG-JEAN KIM*
Department of Physics, Korea Advanced Institute of Science and Technology, 373-1 Kusung-dong, Yusung-ku, Taejon 305-701, Korea
(Received 20 February 1997; In final form 30 June 1997)
Relaxation distribution function g(r) was derived from the experimental data of dielectric measurements by use of the Tikhonov regularization method of solving for the inverse solution of the integral transform defining the relaxation time distribution g(r) in the dipole glass system undergoing the glass freezing. The distribution function g(r) allows to calculate the average or effective relaxation time (r). The temperature dependence of (r) was studied in DRADP-x (x = 0.4) dipole glass and found to follow the Vogel-Fulcher law of glass freezing with the static freezing temperature 7*o:^16.5K.
Keywords: Relaxation; dipole glass; Tikhonov regularization
1. INTRODUCTION
Dipole glass systems are considered as a model system for theoretical studies of glass freezing, where random fields play an important role in addition to the random bonds of the magnetic spin glass systems due to a strong coupling between electric dipoles and ionic lattice.'1^31 Freezing dynamics of dipole glass system approaching the freezing temperature can be studied by measurements of complex dielectric constants. [4~10]
Courtens[4' 5] reported on the broadening of relaxation time distribution and the Vogel-Fulcher scaling of dielectric dispersion in the dipole glass system. Gaussian distribution of the relaxation times was assumed[6] to analyze the dielectric dispersion observed in the frequency range from 103 Hz
* To whom correspondences should be addressed.
79

80 B.-G. KIM AND J.-J. KIM
to 109 Hz. As the experimental measurements were improved and extended to below 10 Hz the low frequency dispersions were observed at low temperatures closer to the static freezing temperature. Kutnjak et al.[8' 9] further extended to 10~3 Hz and assumed a simple linear form of the relaxation time distribution in this frequency region to analyze the observed dielectric data.
We have made use of the recently developed DSP lock-in amplifier system in the low frequency dielectric measurements and obtained a precision data set of dielectric measurements to 10~2 Hz. The precision data set was used to derive the distribution function g(r) of relaxation time by use of the Tikhonov regularization method [10~15] without presumption of any functional form of the distribution for data fitting.
2. EXPERIMENTALS
The dipole glass system we have studied in the present work is deuterated rubidium ammonium dihydrogen phosphate (DRADP-x, x = 0.4) crystal which was grown from the saturated solution at 35°C formulated by Rb2C03, D3PO4, ND4OD and D20 of analytical grade. Mixing concentra- tion of ND4 ions with respect to Rb ions was determined by specific density measurement as x = 0.4 and deuteration percentage of the grown crystal sample was found to be 91% from the NMR measurements.
Aluminum electrode was vacuum evaporated onto a-cut samples of dimension 8x8x1 mm3 and silver paste was used for making electrical wire contacts. Closed cycle helium refrigerator (DE-202, APD Co.) with two silicon diode sensors and temperature controller (Lakeshore-330) were used to measure and control the sample temperature.
In the frequency range from 1 kHz to 10 MHz a commercial impedance analyzer (HP-4192A) was used with probe field of amplitude IV. For low frequency region of 10 mHz to 1 kHz a digital signal processing lock-in amplifier (EG&G-DSP7260) was employed with appropriate standard capacitor and time constant selections.
In Figure 1 we have shown the DSP lock-in system setup for dielectric constant measurements where a standard capacitor (polystylene, 100 nF) is connected in series with the sample capacitor. Input sine wave voltage of 1 Vrm% was drawn from the internal oscillator of the lock-in amplifier and the output signal across the standard capacitor Was fed into the input of the lock-in amplifier. Remanent polarization is observable at an applied field strength greater than about 100 V/mm, and our probe signal of 1V^ is safe from the field cooling effect. Since the sample capacitance remains at around

TIKHONOV REGULARIZATION TO DIPOLE GLASS 81
Vacuum
Chamber
Compressor
w
He Refrigerator(APD)
, Expander
■ Sample
'—..... ... j
Temperature Controller
(LakeShore 330)
Lockln Amp O (EG&G 7260)
Personal
Computer
IEEE 488
Bus
IEEE 488
Standard Capacitor
Bus
FIGURE 1 Experimental setup for low frequency dielectric measurements by use of the DSP lock-in amplifier system.
10 pF, that is, 10~4 of that of the standard capacitor the applied input voltage will be taken up mostly by the sample capacitor, and the response output V*ut from the standard capacitor is given by
■'sample 'in — ^standard ' nu (1)
where V*ut is the complex signal voltage detected by the lock-in amplifier, Vin the input voltage, C* )e corresponds to the complex dielectric constant of the sample, and Cstandard to the capacitance of the standard capacitor. As can be seen from Equation (1) if Cstandard is too large, V*ut becomes too small and noisy. If it is too small, the applied input voltage will be divided between C* !e and Cstandard to make the circuit analysis complicated. The best choice from experience is Cstandard~(103~105) Csample.

82 B.-G. KIM AND J.-J. KIM
Time constant of the DSP lock-in amplifier is set by l/(2irfc), where fc
represents the -3 dB frequency of the low pass filter. The succeeding slope in the gain curve of the DSP lock-in amplifier can be controlled in steps of 6 dB/oct, 12 dB/oct, 18 dB/oct and 24dB/oct. When we want to measure a lock-in signal at 1 Hz a harmonic noise at 2 Hz is expected in the ideal case and the cut-off frequency fc can be set at 1 Hz. In this perfectly ideal case we may use the time constant of l/(2nfc) ~ 200 msec to obtain a reasonably clean signal with the maximum slope of 24 dB/oct incorporated. However, in the real situation of experimental measurements other sources of noise can interfere, and the time constant should be increased to find a best on a trial and error basis.
With the use of the RC type filter we need an equilibration time of about five times the time constant to get the final stationary signal, and a long time constant would require too long equilibration time. For lOmHz measure- ment of our present work we have taken the time constant of 500 sec and the equilibration time of 4000 sec. The data point at 10 mHz represents an average over 20 samplings taken every 80 sec after the equilibration time of 4000 sec. This means that it takes about 6 hours for a complete measurement over 40 frequencies from 10 mHz to 1 kHz at one fixed temperature near 40 K.
3. DIELECTRIC RELAXATION AND TIKHONOV REGULARIZATION
Relaxation behaviour of a nonequilibrium dielectric polarization P{i) is described by [16' 17]
dP(t) ~nr=lXd limP(/)-P(0
t—*-oo (2)
where \id is a relaxation parameter, representing a characteristic frequency of a dipole in the dipolar relaxation. The concerning relaxation behaviour can be measured either by polarization switching current in the time domain or by complex dielectric permittivity in frequency domain.[17]
When a static field E0 is applied, the steady state solution of Equation (2) is given by
P(/) = P0exp(-/M) (3)

TIKHONOV REGULARIZATION TO DIPOLE GLASS 83
and the switching current is given by
7(0 = —+± = -ßdPo exp(-Hdt) ' (4)
When a sinusoidal oscillating field is applied, the complex dielectric permittivity e*(w) is obtained from dP(t)/dE(t) as [16' 18]
e (w) - £oo = r-—. (5) 1 + ILJTd
where e^ denotes the permittivity at optical frequency, e0 static permittivity, e0—£oo the dipolar strength, and rd the dipolar relaxation time of ßdTd= 1-
Real system deviating from the single Debye relaxation behaviour need empirical modifications of Equations (3) and (5):
In the time domain representation the so called KWW function [19' 20] is well known as
P(t) = P0exV(-{ßdt)ß) (6)
with ß between 0 and 1. In the frequency domain a well known modification is the Cole-Davidson
function'21'221
e (w) - e«, = —— -ß (7) (1 + lUTd)P
with ß again between 0 and 1. A more complicated modification was introduced by Havriliak and
Negami [23] and further explored by many others [24_26] as
£o ~~ £o
(iTI^)T £ (w) - £oo = n t ,. s«,7 (8)
where both a and 7 are fractions between 0 and 1. A different approach to solve this modification problem is the assumption
of a distribution function in both time domain and frequency domain responses as follows:
W=^dT = - //M^o e*P(-/"Mln M) (9)

84 B.-G. KIM AND J.-J. KIM
where the distribution function/(/x) satisfies the normalization
and
e (to -ea
/oo
f(ß)d(\nß) = 1 (10) ■CO
= (eo-e,»)f0T^-rf(taT) (11)
with
/•oo
g(T)d(\nr) = 1 (12) / J — c
These equations represent integral transforms of /(//) and g(r), the distribution functions, with the respective single Debye response as the kernel of the transform.
Equation (11) is then an integral transform of g(r) through a kernel K(u), r) = 1/(1 + iujr) and belongs to the Fredholm integral equation of the first kind.[11] This problem is known as belonging to the ill-posed problems, that is, there may well be an infinite number of g(r) to best fit the experimental data of e*(u>) by use of the least square method where a Gaussian distribution is assumed for errors of the experimental data.[11]
Consequently several numerical algorithms have been devised to obtain the inverse solution from the Fredholm integral equation of the first kind, the representative ones of Which are the Tikhonov regularization (TR) algorithm [1I] and the maximum entropy algorithm.[15] We have applied the TR algorithm to find g{r) from the experimental data set of e*(u).
In the TR algorithm we seek a solution minimizing the quantity V(X)
defined as following
V(X)-^2[^-ef}2 + X\\g(r)\\ (13) j
where ejxp represents experimental values of dielectric constant, ejst the estimated dielectric constant, ||g(r)|| = fD [g" (r)]241n r), and A the regulari- zation parameter.111'13_15] The following matrix and vector notations will be suitable to simplify the above equation for programming.
b, = efp, gj = g(v) (14)

TIKHONOV REGULARIZATION TO DIPOLE GLASS 85
(K • g)j = £oo + (eo - £oo) J K(LUJ, T)g(T)d(\n r) (15)
|B-g|2= f[g"(r)}2d(\nr) (16) JD
We can then express V(X) in the matrix form as
F(A) = |K-g-b|2 + A|B-g|2
= |K • g - b|2 + Ag • H ■ g (17)
where H = BTB. Minimizing with respect to g we obtain the nominal equation
(KT-K + AH)-g = KT-b (18)
The solution of this equation is obtained by calculating inverse matrices for given A:
g=(%— KTKV'b (19) 8 VKT-K + AH J
As a test run of the TR algorithm we define a relaxation time distribution function g(r) as Gaussian of the form
g{T)=AeJd±l^l) (20)
Integral transform of g(f) by use of Equation (11) gives rise to a dielectric loss function e"(uS) as depicted in Figure 2(a). Given the values of this s"(u>) curve as an input data set we can apply the Tikhonov regularization of Equations (13) and (19) to obtain g(r) which is to be compared with our starting assumption on Equation (20).
The only fitting parameter A was so adjusted as to best stabilize the fitting. With A = 0.1 x Tr(KTK)/Tr(H) we could obtain g(r) from the Tikhonov regularization as shown (■) in Figure 2(b), which can be seen to agree so well with the original (solid line) g(r).

86 B.-G. KIM AND J.-J. KIM
u.o-
0.6-
.,0.4- s
0.2-
i ■
(a)
I ■ I ' I '
■■■■ ■ ■
■ ■ ■ ■
■ ■ ■ "
■■
1
■
1 i
0.0- ■■■■
0 1 ' I ' I '
2 4 6 iog10(f)
1
8 i
10
1.0-
0.8-
i
(b)
i ■ i ' i '
A i (
-pO.6-
°>0.4- A 0.2- / v 0.0- ■MM —> V. —Ml MM -
1
-10 i ■ i ' i '
-8 -6 -4
iog10(x)
-2 1
0
FIGURE 2 (a) e "(u>) as calculated from the Gaussian distribution function g(r) of relaxation times; (b) g{r) originally assumed (■) and calculated (solid line) by Tikhonov regularization from e"(w) of (a).
4. EXPERIMENTAL RESULTS AND DISCUSSION
In Figure 3 the frequency dependence of e' and e " is shown as measured at several fixed temperatures. As temperature is lowered a broader dispersive region in s'(T, w) is observed with the frequency of maximum peak in e"(T, w) decreasing to lower frequency conforming with the previous works on dipole glass, [4"9] orientational glass, [27 281 and relaxor ferroelectrics [29'30].
Instead of the presumption of the relaxation time distribution g(r) as Gaussian [6] or straight line [8' 9] for the least square fitting analysis of the experimental data we can now find out g(r) directly from experimental data of e*(T, u>) by use of the TR method where we only presume g(r) to be a smooth function in the region concerned. Figure 4 displays the results of

TIKHONOV REGULARIZATION TO DIPOLE GLASS 87
80-
60-
40-
20-
<a) =5r^^?>-. : \ % o * '
"■«_ O A A 0
""■. ""a \ &* • ° ■«. V \ ÄA '. °
'■■'■"■ "I " ' I ' "1 ' I ' I "'
-2
S 10
FIGURE 3 Semilog plot of both e' and e " as a function of frequency observed at several temperatures from 40K (■) to 80K ( + ).
g(r), from which we can calculate e{'R (solid lines) by integral transforma- tion of g(r) to be compared with e" of experimental observations. The relaxation time distribution g(r) can be seen to become broader with the maximum peak shifting toward larger r, that is, longer (slower) relaxation time as temperature is lowered from 65 K to 40 K. The overall functional form of g(r) can be seen to be very much like gaussian but with a distinctive asymmetry between short time head side and long time tail side. This asymmetry is emphasized by comparison between rmax, where g(r) has a maximum peak, and rmean as defined by (r) = JYg(r) J(ln r). Figure 5(a)

0.00
-7.5 -5.0 -2.5 Log10(x)
0.0 2.5
FIGURE 4 (a) Semilog plot of g(r) as a function of r obtained from the Tikhonov regularization analysis of experimental data e' and e" at various temperatures from 40 K (• ■ •) to 65 K (—); (b) ETRM obtained from Tikhonov regularization method (solid lines) and e"xPM experimental observation (discrete points) at several temperatures from 40K (■) to 65 K (o).
shows both Tmax and (r) in comparison as a function of temperature and an excellent best fit of (r) by a Vogel-Fulcher law
(T) = T0 exp E
T-To T>T0 (21)
where the best fit values are obtained as T0= (0.5 ± 0.2) x 10~ sec, T0 = 16.5±1.2KandJE,= 378±25K.Forrmaxwehaveobtainedr0 = 12.0 ±1.0K with the same r0 and lvalues as (r). Also shown in Figure 5(b) we have rvar
and rskew as calculated from (r) and the respective definitions
7"skew
J{T-{r)fg{r)d{\n-
Hi) V^var
(22) g{T)d{\nr)

TIKHONOV REGULARIZATION TO DIPOLE GLASS
16
89
Log10(f)
FIGURE 4 (Continued).
where rvar is a measure of the broadening of the relaxation time distribution and rskew a measure of the asymmetry. We can sep from Figure 5(b) that rvar
increases with decreasing temperature but rskew remains nearly independent of temperature in the temperature region of 65 K to 40 K.
Our analysis shows that the Vogel-Fulcher law is obeyed by both rmax and (T). However, (r) was found to diverge at T0~ 16.5K while rmax at a lower temperature of TJJ ~ 12.0 K, which suggests the growing importance of the long time tail of T > Tmax in g (r) in the freezing dynamics near T0. We have thus confirmed that the relaxation time distribution function g(r) of DRADP-x(x = 0.4) conveys the dynamic informations of the glass transition at finite temperature, where we hope to see what differences they have in freezing dynamics among the dipole glass, orientational glass, relaxor ferroelectrics, etc. by comparing the temperature dependence of g(r) between each other.

90 B.-G. KIM AND J.-J. KIM
40 45 50 55 60
Temperature(K)
FIGURE 5 (a) Semilog plots of relaxation time dependence on temperature: (r) and rmax are represented by • and o respectively, and solid line represents the best fit by Vogel-Fulcher law; (b) Semilog plots of temperature dependence for rvar and rskew of g(r). T* denotes rvar (•) or
1"skew(°)-
5. CONCLUSION
We have successfully applied the Tikhonov regularization to derive the relaxation time distribution function g(r) of a dipole glass DRADP- x(x = 0.4) so that we could determine the static freezing temperature T0 ~ 16.5 K uniquely from the temperature dependence of the effective relaxation time (r). This unambiguous determination of T0 has been impossible in the previous works of the least squares fitting of the dielectric data, where T0 was reported to be in the range of 17 K to 30 K depending on the fitting functions used. [5]
TIKHONOV REGULARIZATION TO DIPOLE GLASS 91
Acknowledgment
This work was supported in part by the Korea Science and Engineering Foundation (RCDAMP-1997).
References
[1] Pirc, R., Tadic, B. and Blinc, R. (1986). Phys. Rev. B, 36, 8067. [2] Blinc, R. et al. (1989). Phys. Rev. Lett., 63, 2248. [3] Papantopoulosm, G. et al. (1994). Phys. Rev. Lett., 73, 276. [4] Courtens, E. (1986). Phys. Rev. B, 33, 2975. [5] Courtens, E. (1987). Ferroelectrics, 72, 229. [6] He, P. (1991). /. Phys. Soc. Jpn., 60, 313. [7] Howell, F. L., Pinto, N. J. and Schmidt, V. H. (1992). Phys. Rev. B, 46, 13762. [8] Kutnjak, Z. et al. (1993). Phys. Rev. Lett., 70, 4015. [9] Kutnjak, Z. et al. (1994). Phys. Rev. B, 50, 12421.
[10] Kim, B.-G. and Kim, J.-J. (1997). Phys. Rev. B, 55, 5558. [11] Tikhonov, A. N. and Arsenin, V. Y. "Solutions of III Posed Problems", J. Wiley (New
York, 1977). [12] Karatasos, K. et al. (1994). Macromolecules, 27, 3543. [13] Weese, J. (1992). Comp. Phys. Commun., 69, 99. [14] Schäfer, H. et al. (1996). Phys. Rev. Lett., 76, 2177. [15] Press, W. H. et al. "Numerical Recipes in C", Cambridge University Press (Cambridge,
1992) Chaps. 14,15,18. [16] Debye, P., "Polar Molecules", Dover (New York, 1945). [17] Dias, C. J. (1996). Phys. Rev. B, 53, 14212. [18] Cole, K. S. and Cole, R. H. (1941). J. Chem. Phys., 9, 341. [19] Kohlrausch, F. (1863). Pogg. Ann. Phys., 119, 352. [20] Williams, G and Watts, D. C. (1970). Trans. Faraday Soc, 66, 80. [21] Davidson, D. W. and Cole, R. H. (1951). J. Chem. Phys., 19, 1417. [22] Lindsey, C. P. and Patterson, G. D. (1980). J. Chem. Phys., 73, 2348. [23] Havriliak, S. and Negami, S. (1967). Polymer, 8, 161. [24] Liedermann, K. and Loidl, A. (1993). J. ofNoncryst. Sol., 155, 26. [25] Alvarezm, F., Alegria, A. and Colmenero, J. (1991). Phys. Rev. B, 44, 7306. [26] Alvarezm, F., Alegria, A. and Colmenero, J. (1993). Phys. Rev. B, 47, 125. [27] Höchli, U. T. (1982). Phys. Rev. Lett., 48, 1494. [28] Doussineau, P., Farssi, Y., Frenois, C, Levelut, A., Mcenaney, K., Toulouse, J. and
Ziolkiewicz, S. (1993). Phys. Rev. Lett., 70, 96. [29] Kleemann, W. (1993). In?I J. of Mod. Phys., B7, 2469 and references therein. [30] Tagantsev, A. K. (1994). Phys. Rev. Lett., 72, 1100.

Ferroelectrics, 1998, Vols. 206-207, pp. 93-102 Reprints available directly from the publisher Photocopying permitted by license only
i 1998 OPA (Overseas Publishers Association) Amsterdam B.V. Published under license
under the Gordon and Breach Science Publishers imprint.
Printed in India.
FIELD-INDUCED PIEZOELECTRIC RESONANCES IN THE SUPERPARAELECTRIC
PHASE OF KTN
J. TOULOUSE and R. PATTNAIK
Physics Department, Lehigh University, Bethlehem, PA 18018
(Received 12 May 1997; In final form 24 July 1997)
A new type of dielectric resonances has been observed in mixed ferroelectric, KTai_xNbx03 (KTN), also known to belong to the family of Relaxor Ferroelectrics. These resonances and their metastability in KTN provide clear evidence for the presence of permanent polar nanoregions with a local spontaneous polarization and a local strain field. The application of a small dc bias field can align these regions and activate a strong polarization-strain coupling that give rise to the observed dielectric/mechanical resonances. These resonances are found to persist over long periods of time, indicating that the field-induced macroscopic polarization is stabilized by this coupling. Their frequencies can be calculated from the elastic constant, which reveals the unexpected clamped nature of the resonance. These results constitute an important piece of evidence in support of the role of polar regions in explaining the Relaxor behavior.
Keywords: Piezoelectric; KTN; relaxor behavior
INTRODUCTION
The most important characteristic of ferroelectrics, when comparing them to their magnetic analogues, is the direct coupling of the polarization to the strain. It is well known, both experimentally and theoretically, that polarization can couple to elastic strains via the piezoelectric or the electrostricitive coefficients. However, piezoelectric effects can only be observed in non-centrosymmetric crystals (non-cubic) and the electrostric- tive effect is a second order effect. In cubic systems, the application of an external dc bias field can always break the symmetry and induce a piezoelectric effect, which is of first order, but very large fields are required in order to induce any measurable polarization. It was reported by
93

94 J. TOULOUSE AND R. PATTNAIK
Hubregtse et al.m that, in BaTi03, several kV/cm are necessary to induce such a metastable macroscopic polarization in the cubic phase and that this is only possible close to the transition. In the present paper, we report a novel case in which a strong polarization-strain coupling can be observed with much weaker fields (< 50V/cm) and as far as 20 K above the ferroelectric phase transition at Tc. We further show that, as far as 20 K above Tc, the field-induced macroscopic polarization is metastable and persists over long periods of time after removal of the field.
This novel case of polarization-strain coupling was observed recently in several mixed ferroelectrics that belong to the family of Relaxor Ferro- electrics, KTai_,Nbx03 (KTN), in K^Li^TaOs (KLT) and in PbMg1/3
Nb2/303 (PMN), and may be a general feature of many others. In KTN, niobium is randomly substituted for tantalum and occupies an
off-center position in the unit cell[5] which, as a result, acquires a permanent dipole moment. This moment can couple dynamically or statically to the surrounding host unit cells. As the temperature is decreased, this impurity- host coupling grows stronger and modifies the normal characteristics of the paraelectric phase of the system. Several anomalies have already been reported. The linear dielectric constant response departs from a Curie-Weiss law, [6] a finite remnant polarization,'61 coercive fields and polarization overtones'71 have also been shown to appear at that temperature and otherwise silent optic modes have been observed in Raman scattering.'81
These anomalies clearly indicate a lowering of the local symmetry on a nanometer scale [8'9] while X-ray diffraction[10] still gives the average symmetry as cubic. Because they have been reported either in polarization measurements, i.e. in the presence of a large electric field, or in Raman measurements, i.e. at high frequency, these anomalies could be due to a field-induced or dynamical symmetry lowering. In the present communica- tion, we show that these anomalies are the consequence of the condensation of polar regions, the permanence of which is stabilized by strain. We present evidence for such a condensation and, most surprisingly, show that this process occurs approximately 20 K above the phase transition for all Nb concentrations studied between 1.2% and 30%. Poalr regions can form/ condense when two or more Nb cells (along with their neighboring host cells), interacting in pairs or groups, begin to respond as a single polar unit. An essential feature of these regions is the local distortion that accompanies their local spontaneous polarization and leads to the modification of the normal characteristics of the paraelectric phase and to the polarization- strain coupling.

FIELD-INDUCED PIEZOELECTRIC RESONANCES 95
RESULTS AND DISCUSSION
When a coupling between polarization and strain is present, various mechanical modes of vibrations can by excited electrically, by modulating the macroscopic polarization. This can be easily done experimentally by superposing on the dc bias field a small ac field. The dc field serves to induce a macroscopic polarization and the small ac field to excite vibrations which become significant in amplitude when the ac frequency of the small field matches the resonant frequency of the bar or plate sample. Cubic KTN presents a very different situation. In Figure 1 we display the frequency spectrum of (a) the dielectric constant, e', and (b) the dielectric loss, D = e"/
o .—i
a
§ H
CO O
10.0
9.5
9.0
8.5 k
8.0
0.06
0.04
0.02 L.
0.00 0.8
(a) KTN 15.7% T = 155K
400 V/cm
200 V/cm I 50V;'cm
;! ",v i ..---'" y~_
- 1 9
N T=155K
\ i
50 V/cm
8.46
(b) 8
- 8.44
i:
7 "D(10
J),
s'qoj)
8.42
i Ji; !'< !i
6 l.l.l.
0.85 0.90 0.95 1. Freq. (MHz)
00
i i: i V
.j ^ r)k .,,....-
0.9 1.0 1.1
Frequency (MHz)
1.2
FIGURE 1 (a) Real dielectric constant, e' of KTN crystal for different bias fields showing the resonances, (b) the associated loss tangent, D. Inset: Details of the 50 V/cm data of (a) and (b).

96 J. TOULOUSE AND R. PATTNAIK
e', for a KTN cyrstal measured at Tc + 15K under several dc bias fields. In all cases, the dc bias field was applied perpendicular to the major faces of the plate sample. The KTN spectrum clearly reveals two large resonances near 1 MHz. In the inset, we also show a magnified version of one of the resonances under a 50 V/cm dc bias field. Even for this very low field, the resonance is extemely strong. Moreover, as the ferroelectric transition is approached or at higher Nb concentrations, even smaller dc bias fields can trigger these resonances. We note that, the shape of the (two largest) resonances were observed to be independent of the bias field strength (50 V/ cm to 2 kV/cm) thereby precluding any possibility of coupling between the modes. Evidently the polar regions, once aligned, contribute significantly to the macroscopic polarization since it is quite clear that much lower fields are required to rotate an existing polarization than to induce it. If it were not for the presence of polar regions, much larger fields would be required in order to induce a macroscopic polarization, as in the case in BaTiC>3.'1] These results therefore confirm the presence, in KTN above the transition, of permanent polar regions that possess a local spontaneous polarization and the local distortion associated with it.
We now show that the resonances displayed in Figure 1 are associated, albeit in a peculiar way, with longitudinal mechanical vibrations of the plate sample. The fundamental resonant frequency of a plate or bar sample can be obtained from the simple condition, 2L = A, in which L is the legnth of the sample and A the wavelength of the acoustic wave. This condition leads to the following expression for the resonance frequency:'11]
in which p is the density and su, the elastic compliance measured at constant stress. It is important to note that the resonance of plate or a bar sample leads to free vibrations which therefore take place at constant stress while the propagation of sound waves in a solid takes place at constant strain.'121
For a plate sample, one expects two longitudinal resonances, corresponding to the two dimensions of the sample, as we indeed observe in Figure 1. Using the above relation, the frequencies of the resonances can be calculated from a knowledge of the elastic compliance. Using ultrasonics, we have also independently measured the elastic constants'135 cu and c12 from which su
can be estimated.'14' However, when comparing the resonant frequencies thus calculated with the measured ones, we note a large 20% discrepancy.

FIELD-INDUCED PIEZOELECTRIC RESONANCES 97
On the other hand, if we assume that the modulation of the polarization actually generates sound waves and accordingly replace l/su by cn in the above formula, we obtain a remarkably good agreement between the calculated and measured values, as demonstrated in Table I for the 15.7% KTN sample. The measured and calculated values as a function of temperature have been provided in Figure 2. In the table below, the small remaining discrepancies for the two other samples (the deviation between the calculated and measured frequencies has been marked in percent inside brackets) are most likely due to the quality of the electrodes or to a non perfectly rectangular shape of the sample. However they remain quite small
940
920
900
880
860
840
820
800
780
760
1 (b) KTN 15.7% _^*
■/, - O I
O -/
-
' / —o—Calculated " " / _ ■
i
—•— Measured -
i , i , i
140 150 160 170
Temperature (K) 180
FIGURE 2 Resonance frequency determined from Eq. (1) of the text compared with experimental resonance frequency as a function of temperature, (a) KTN 15.7% (b) KTN 1.2%.

98 J. TOULOUSE AND R. PATTNAIK
TABLE I Comparison of measured and calculated resonant frequency at T= Tc + 20 K for different KTN crystals
Concentration Dimension vx (calc) V\ (meas) v2 (calc) v2 (meas) (mm2) (kHz) (kHz) (kHz) (kHz)
1.2% (rc=12K) 8.2x5.3 486 451 (7.2%) 767 727 (5.2%) 15.7%(rc=139K) 3.8x4 902 908 949 952 26%(rc = 225K) 3.5x4.4 748 770(3%) 948 960 (1.2%)
relative to the frequency separation between sucessive resonances so that there is no question of identification. The overall very good agreement between the resonant frequencies calculated from cx \ and those measured is a surprising one which suggests that the resonances are not excited at constant stress but, effectively, at constant strain and correspond to the internal generation of sound waves propagating in the plane of the sample i.e. perpendicular to the applied field. Thus the field induced piezoelectric coefficient is d$\.
As indicated earlier, the observation of these resonances in KTN was not limited to one concentration, but was in fact made for all the Nb concentrations studied, between 1.2% and 30%. This is illustrated in Figure 3 for three concentrations covering this range and the resonance frequencies are the ones appearing in Table I. This figure however also reveals another remarkable fact that is particular to KTN: for all three concentrations, the resonances appear approximately 20 K above the ferroelectric transition, i.e. at 7,*^T'e + 20K, even though Tc itself depends on concentration[6] (see Tab. I). Because of this universal character of T* in KTN, it is believed that the polar regions form as a result of a condensation process. The suggestion of a possible condensation was recently made and supporting evidence given in another publication[6], While, in KTN, it appears to take place as a condensation process at T*^rc + 20K, in KLT, these regions form at approximately 200 K for all Li concentrations. This difference between the two systems has been attributed to the magnitude of the local distortion energy of the Li or Nb centers relative to the interaction energy between centers.[15)
Although the results reported so far provide a strong indication of the existence of polar regions in relaxor ferroelectrics, the strongest piece of evidence is the metastability of these resonances and therefore the metastability of the induced macroscopic polarization above the transition. As an example, we show in Figure 4 the result of a cycle in which a KTN crystal was measured at different temperatures upon cooling, with a 650 V/ cm dc bias field on and then measured at the same temperatures upon

FIELD-INDUCED PIEZOELECTRIC RESONANCES 99
heating without the field. The reosnances are observed starting at about 180K, but rapidly increase in amplitude around 160K(=7'C + 20K), as shown by the changing vertical scale. At 150 K( = Tc + 11 K), the dc field was turned off and the resonances measured at the same temperatures upon warming. The equilibration time at each temperature was approximately 15 minutes. Although smaller in amplitude, the resonances clearly persist without the bias field and again decrease rapidly around 160K. It is also interesting to note that, in the second part of the experiment (heating with bias field off), the KTN spectrum displays all the same details that are visible upon cooling, e.g. double peaks or shoulders etc. The persistance of the
10
©
(a) KTN 1.2%
-v-
J ^-L_ 0.2 0.3 0.4 0.5 0.6 0.7 0.8 0.9
; (b) KTN 15.7% 400 V/cm 150K-
r " v—
155K-
r 160K- .
■ I70K-
- I80K 1 ....1 -
0.6 0.7 0.8 0.9 1.0 1.1 1.2 1.3
8 - (c) KTN 30% 400 V/cm
6 ■
{ r
4 260K
270K
i 2R0K 9Q«
, , , , 1 . ,.. 1 .. . .1. . . .1.. .. 1
0.6 0.7 0.8 0.9 1.0 1.1 1.2 1.3
Frequency (MHz)
FIGURE 3 Real part of the dielectric constant as a function of frequency at different temperatures in presence of a dc bias field, (a) KTN 1.2% (b) KTN 15.7% (c) KTN 30%. The increase of resonance peaks for temperatures T < Tc + 20 K is noticeable.

100 J. TOULOUSE AND R. PATTNAIK
,-','-.-t-,' , 'i 1-; :., i , ..,
1220 1240 1260 1280 1300 1320 1200 1225 1250 1275
Frequency (kHz)
FIGURE 4 Loss tangent data of the KTN crystal at different temperatures (both upon cooling and heating) showing the metastable characteristics of the polarization. The dotted lines are the data (left axis) in presence of the bias field upon cooling down to 155 K. The solid lines correspond (right axis) to the same with the field removed, and upon heating up from 155 K to 180K.
resonances, even 60 minutes after removal of the bias field, clearly demostrates the metastable character of the induced macroscopic polariza- tion.
CONCLUSIONS
The metastability of the resoances indicates that the origin of the macroscopic polarization is different above and below the condensation temperature, T*. In the high temperature range, the local polarization is

FIELD-INDUCED PIEZOELECTRIC RESONANCES 101
primarily induced by the application of the dc bias field; although the external field aligns the Nb-centered dipoles giving rise to an observable macroscopic polarization, these dipoles are only weakly correlated in the sense that their dynamics is dominated by thermal effects and, consequently, the macroscopic polarization disappears instantly upon removal of the field. By contrast, below T*, neighbouring Nb-centered dipoles become strongly correlated, forming permanent polar regions characterized by a local spontaneous polarization; the macroscopic polarization is essentially due to the alignment of the polar regions and it is stabilized by the polarization- strain coupling. For low niobium concentrations, the polar regions are more remotely spaced and, hence, not as strongly correlated as they are for higher concentrations. As a result, upon removal of the bias field, the induced alignment persists but over a shorter time.
The present results are very significant for the understanding of many mixed or disordered ferroelectrics and, in particular, for the class of ferroelectrics known as "relaxors". They indicate that, given an ensemble of randomly distributed dipoles in a highly polarizable solid, nanoscopic regions with a local spontaneous polarization can develop that are stabilized by the local strain. These then can be regarded as giant electric dipoles giving rise to superparaelectric behavior and field-induced piezoelectricity. Here, the field merely aligns the giant dipoles or local polarization moments and, consequently, a much weaker field is requried. The corresponding alignment of the local distortion fields give rise to a macroscopic strain. By contrast, in KLT, and even more so in PMN, the distortions are greater and the polar regions, to be reoriented, require higher bias fields; KLT is thus a harder relaxor than KTN and PMN a harder relaxor still. This increasing degree of hardness is clearly visible in the relative size of the polarization hysteresis loops for the three compounds. It is also supported by the fact that the ferroelectric transition is continuous (second order) in KTN, it is first order in KLT and it is absent in PMN.
Acknowledgements
We greatefully acknowledge L. A. Boatner for providing the KTN crystals, and E Cross for helpful discussions. This work was supported by ONR Grant No N00014-90-J-4098.

102 J. TOULOUSE AND R. PATTNAIK
References
[1] Hubregtse, E. J., Bessy, W. H. and Drougard, M. E. (1959). Phys. Rev., B30, 899. [2] Toulouse, J., Vugmeister, B. E. and Pattnaik, R. (1994). Phys. Rev. Lett., 73, 3467. [3] Setter, N. and Cross, L. E. (1980). J. Appl. Phys., 51, 4356. [4] Toulouse, J., DiAntonio, P., Knauss, L. A., Pattnaik, R. and Vugmeister, B. International
Conference on Relaxors, Dubna, Russia (1996). [5] Hanske-Petitpierre, O. and Yacoby, Y. (1991). Phys. Rev., B44, 6700. [6] Toulouse, J. and Pattnaik, R. (1996). /. Phys. Chem. Solids, 57, 1473. [7] Knauss, L. A., Pattnaik, R. and Toulouse, J., Phys. Rev., B (in print). [8] Toulouse, J., DiAntonio, P., Vugmeister, B. E., Wang, X. M. and Knauss, L. A. (1992).
Phys. Rev. Lett., 68, 232. [9] Azzini, G., Banfi, G., Giulloto, E. and Höchli, U. T. (1991). Phys. Rev., B43, 7473.
[10] Gehring, P. M., Henry Chou, S. M., Shapiro, S. M., Hriljac, J. A., Chen, D. H., Toulouse, J., Rytz, D. and Boatnerm, L. A. (1992). Phys. Rev., B46, 5116.
[11] Mason, W. P. (1950). Piezoelectric crystals and their application to ultrasonics, Van Nostarnd, Princeton, NJ.
[12] Pollard, H. F. (1977). Sound Waves in Solids, Pion Limited, London. [13] Knauss, L. A., Wang, X. M. and Toulouse, J. (1995). Phys. Rev., B52, 13261. [14] Nowick, A. S. and Berry, B. S. (1972). Anelastic Relaxation in Crystalline Solids,
Academic Press New York. [15] Toulouse, J., Diantonio, P. and Vugmeister, B. E. (1993). Ferroelectrics, 150, 67.

Ferroekctrics, 1998, Vols. 206-207, pp. 103-112 Reprints available directly from the publisher Photocopying permitted by license only
i 1998 OPA (Overseas Publishers Association) Amsterdam B.V. Published under license
under the Gordon and Breach Science Publishers imprint.
Printed in India.
DISCRIMINATING BETWEEN THE DISPLACIVE VS. ORDER-DISORDER
CHARACTER OF A PHASE TRANSITION BY MAGIC ANGLE SPINNING NMR
A. N. KLYMACHYOV* and N. S. DALAL
Department of Chemistry, and Center for Interdisciplinary Magnetic Resonance, National High Magnetic Field Laboratory, Florida State University,
Tallahassee, FL 32306, USA
(Received in final form 21 May 1997)
Using squaric acid (H2C404) as an example, it is shown that the temperature dependence of the isotropic chemical shift (Ssso), as measured by magic angle spinning (MAS) NMR, can serve as a probe of the displacive vs. order-disorder character of a phase transition. It is also found that the utilization of single crystals in the MAS measurements leads to significantly narrower peaks than using powders. In the case of MAS on squaric acid, single crystals exhibit a four-fold narrowing of the 13C peaks, as compared to those from powders. This additional gain in resolution has made it possible to measure a sharp anomaly in the I5ISO at the paraelectric- antiferroelectric phase transition of squaric acid (Tc ~ 373 K). This anomaly is interpreted as a direct evidence that the transition mechanism involves a displacive component for the hydrogens as T- > Tc, suggesting that MAS/NMR can indeed serve as a new complement to the current methodologies for investigating phase transitions.
Keywords: Squaric acid; ferroelectricity; solid state NMR; phase transitions
1. INTRODUCTION
The purpose of this investigation was to examine the potential of the high resolution NMR techniques for probing the microscopic mechanism of ferroelectric transitions in hydrogen-bonded solids. Our specific goal was to develop a methodology with which one could differentiate between an order-disorder versus a displacive behavior of a polar lattice. We were
*Current address: Department of Chemistry, The Ohio State University, Columbus, OH 43210.
103

104 A. N. KLYMACHYOV AND N. S. DALAL
motivated by the fact that while this type of information is of fundamental importance for discriminating between the various theoretical models of phase tmasitions in polar lattices, there is a lack of easily available experimental techniques with which one could probe this question quantitatively. Since NMR is the most direct and versatile method for characterizing the chemical structure of a compound, we explored the utility of the magic angle spinning (MAS)[1_3] technique. As a model system, we selected squaric acid (H2C404) for the following reasons. Squaric acid (henceforth, SQA) has a very simple crystal structure, essentially a two- dimensional network of hydrogen-bonded C404 units (Fig. 1). This simple structure, however, exhibits some ususual dielectric and thermodynamic characteristics whose origin is not yet well understood. In particular, SQA exhibits a paraelectric to antiferroelectric phase transition at about 373 K, [4'5] but the underlying trigger mechanism remains to be established. It is known, however, that the atom that undergoes the largest displacement at the phase transition is the hydrogen (H), and thus this atom must be dominantly involved in the transition mechanism [4'5]. This conclusion is consistent with the fact that the transition temperature (Tc) increases almost linearly with amount of deuteration, up to a maximum of about 500 K[4]. Indeed, the current theoretical models of the phase transition in SQA assume that the transition is related to an order-disorder behavior of the H's in their O—H... O hydrogen bonds [4'5]. It is implicitly assumed that the transition is of an order-disorder type. At T> Tc, the H's are thought to be in some dynamic state such that they are statistically found located at the midpoint of the O—H... O bonds. On lowering the temperature, as T^>TC, the H's get orderd (i.e., localized) close to one of the O's. While this 'order- disorder' mechanism seems to be generally accepted, the role of a 'displacive' behavior of the H's (or the heavier atomic sites) has not been ruled out. Further progress in the development of these theoretical models for this phase transition is hampered because of the lack of experimental data. It appears that this is a result of the lack of an easily accessible experimental technique with which one could probe the order-disorder versus displacive character of a given atomic site. In the following, we attempt to show that MAS/NMR could help provide the needed data.
An additional motivation for undertaking this study was that there is a discrepancy between the earlier reported NMR and X-ray structural data on SQA: whereas the X-ray diffraction studies [4'5] show that all the four carbons in the C404 moiety are chemically and magnetically distinct, NMR measurements [6'7] indicated that the four carbons can be grouped into two: the C=0 and the C—OH carbons. In the present investigation, we find

DISPLACIVE VS. DISORDER OF A PHASE TRANS 105
a
*fa
y^*/ y^s y^-o" \ \ \
FIGURE 1 Crystal structure of squaric acid in: (a) Antiferroelectric phase and (b) Paraelectric phase[4].
that this controversy originated from the lack of resolution in the earlier NMR investigations [6' 7]. As discussed below, we report a new experimental methodology which enhances the NMR resolution by a factor of 4. This enhanced resolution has made it possible to obtain a fairly direct evidence for the presence of a displacive character in the mechanism of the phase transition in squaric acid.
2. THEORETICAL BASIS
The basic idea underlying this study is that the isotropic part of the chemical shift tensor 6ISo, is a sensitive function of the overall electronic structure of a given molecule and characteristic of the relative distances and dispositions of the various atomic sites in the molecule[3' 8]. It should thus be possible to monitor the change in the dynamics and position of a given atomic site by measuring the 8\So for the corresponding nucleus. It is noted here that several earlier studies have utilized high resolution NMR techniques for studying phase transitions in-bonded solids. Some of the pioneering experimental and theoretical results have been reported by Blinc[9] on the ferroelectric transition in KH2P04 and related phosphates, and by MehringI6'7] on squaric acid. In both of these cases, single crystals were utilized as samples with the view of measuring the change in the total chemical shift tensor 6 across the phase transition boundaries. The major

106 A. N. KLYMACHYOV AND N. S. DALAL
theme here was that the transition mechanism would be of an order-disorder type if <5iso at T> Tc were to be found to be essentially equal to the average of the tensor(s) for the T< Tc (ferroelectric or antiferroelectric) phase. In both of these cases, the NMR peak-widths were too large compared to the expected change in £Iso. Perhaps the dominant factor hindering these earlier studies was that at the low Zeeman fields utilized in those investigations the sought-for change in <5ISO was much smaller than the change in the anisotropic part, thus making it hard to measure the isotropic part. In the studies presented here, we took a new approach: direct measurement of (5iSo by utilizing the MAS techniques'1"31. In addition, for the 13C CP/MAS measurements we utilized single crystals[10^12], rather than powders'31. This latter procedure resulted in about a factor of four enhancement in the spectral resolution, essentially as a result of the reduction in the line- broadening effects due to anisotropic bulk magnetic susceptibility (ABMS)[13]. The combined use of MAS and single crystals has enabled us to detect a significant role of the 'displacive' character in the mechanism of the phase transition of SQA for the first time.
3. EXPERIMENTAL DETAILS
3.1. NMR Measurements
The 13C NMR measurements were made at 90.5 MHz using a Chemagnetics VT-MAS, double resonance probe. Sample temperature could be varied from 120 to 520 K, in steps of 0.1 K. The probe temperature readings were corrected by using squaric acid as an internal standard, following an earlier reported procedure [10~12]. A variable amplitude cross-polarization pulse sequence was combined a proton flip-back-pulse to increase the repetition rate. This shortened the repetition time to 15 s. This procedure enabled us to obtain sufficient signal-to-noise ratio with 4 to 12 accumulations.
Another important aid in achieving good signal and narrow peaks was the utilization of single crystals in the 13C CP-MAS measurements. The line width at half-intensity point decreased form about 1.4 ppm for powders to 0.3 ppm for single crystals, which was mainly responsible for the success of
this study.
3.2. Sample Preparation and Crystal Growth
Squaric acid was purchased from Aldrich. Single crystals were grown by the slow evaporation (over several days) of a saturated aqueous solution.

DISPLACIVE VS. DISORDER OF A PHASE TRANS 107
The samples were pressed in a 7.5 mm rotor using silica powder as a filler. No attempt was made to orient the single crystals inside the rotor, mainly because the line widths obtained for any arbitrary orientation were found to be sufficiently small for the present investigation.
3.3. Crystal Structure
Figure 1 shows the crystal structure of squaric acid as determined by X-ray diffraction analysis [4' 5]. The structure consists of sheets of the C404
moieties connected together through O—H... O hydrogen bonds. At T> Tc (373 K), the point symmetry is DAh, with the H's being localized at the mid-point of the O—H... O bonds (Fig. 1(a)). Thus at T> Tc, all four carbons are chemically and magnetically equivalent and only one peak would be expected in the 13C NMR spectrum. In the anitferroelectric phase, below 373 K, however, the H's localize closer to one or the other oxygen, in accordance with the formula H2C404 (Fig. 1(b)), and all the four carbons become chemically distinct. Thus four separate peaks would be expected in a 13C spectrum at T< Tc. These considerations, together the effects of motional averaging in NMR spectra, formed the basis of the present work.
4. RESULTS AND DISCUSSION
4.1. Resolution Enhancement in MAS Measurements Due to Single Crystal Usage
Our first goal was to probe the cause of discrepancy between the earlier reported X-ray diffraction[4'5] and high resolution NMR studies'6'71. Briefly, the high resolution NMR measurements on SQA single crystals at room temperature (antiferroelectric phase) yielded only two values for the isotropic chemical shift, <5iSO, of the I3C carbons: one from the two C=0 carbons and the second one from the two C—OH carbons. The X-ray data, however, require that all four carbons be chemically distinct, hence one should expect four separate peaks in the 13C spectra. With a view of obtain a more resolved spectrum, we carried out 13C CP/MAS measurements. Figure 2(a) shows a typical 13C spectrum for SQA powder at room temperature[10]. Once again, only two peaks are observed, which is in accord with the earlier NMR results, but in disagreement with the X-ray data.
We surmised that the source of discrepancy between the NMR and the X-ray results might relate to the lack of resolution in the NMR spectra. One

108 A. N. KLYMACHYOV AND N. S. DALAL
200 —I—'—'—'—'—I—'—
195 190
ö (ppm from TMS)
-i 1 | r-' ' i ■'
185
FIGURE 2 13C CP-MAS spectra of squaric acid in the form of: (a) powder, (b) a single crystal'101.
important source of broadening in MAS is bulk magnetic susceptibility (BMS). As discussed in detail by Vander Hart et al.[l3] in a sample of arbitrary shape, the magnetic polarization induced by BMS produces a nonuniform screening field that leads to line broadening. In the case of powder, many differently shaped small crystals distort the field not only inside themselves, but they also influence the field inside the neighboring crystals, thereby causing a significant line broadening effect. It may be noted that the magnitude of this broadening process increases in proportion to the applied Zeeman field, so simply going to higher fields would not be helpful. It is known, however, that this broadening can be reduced by utilizing single crystals rather than powders for the NMR measurements. We thus carried out CP/MAS 13C measurements utilizing single crystals. Figure 2(b) shows a typical spectrum from a single crystal, under essentially the same conditions

DISPLACIVE VS. DISORDER OF A PHASE TRANS 109
as those used for Figure 2(a). This spectrum[10'11] shows four clearly resolved peaks, because the line widths decrease by a factor of four: from an average of 1.3 ppm to 0.3 ppm. The use of single crystals in the MAS experiments at 600 MHz yielded similar results, thus confirming that the resolution enhancement was essentially a result of the reduction of anisotropic BMS broadening.
4.2. Temperature Dependence of the 13C Isotropie Chemical Shifts
The enhanced resolution afforded by the use of single crystals in the CP/ MAS spectra opened up a new avenue for probing the temperature dependence of the <5ISo m the vicinity of the Tc of SQA, and thereby to probe the mechanistic details of the phase transition.
Figure 3 shows the temperature dependence of the 13C CP/MAS spectra[12] in the paraelectric (PA) phase (above T'c~373 + or - 1.5 K) as well as in the antiferroelectric (AFE) phase (below Tc). It can be noted that as temperature (T) is approached from the T< Tc side, at first the small splitting of the two main doublets (caused by H-bonding) disappears. This process corresponds to the initiation of the delocalization of the H's in the O—H... O bonds. Then as T— > Tc, a narrow peak appears at about the average positions of the two low-temperatures peaks. This new peak grows in intensity at the expense of the low-temperature peaks and is the only signal at about 3 K above Tc. Thus, in the temperature regime in which all the three peaks coexist, the areas under the (low-temperature) doublet and the (high temperature) singlet are proportional to the fraction of the lattice in the AFE and PA phases, respectively. Figure 4 shows[14] the temperature dependence of the <5ISo (average) for all four carbons. It can be noted that SJSO increases steadily with TasT- > Tc, but exhibits a sharp, anomalous, increase within 2-3 K of the Tc. Since the parameter <5ISO is a sensitive function of the total electronic distribution over the whole molecule[3'8], any anomalous variation in öjSo implies the existence of a parallel change in the molecular structure. We note here that the earlier NMR studies using static single crystals[6' 73 have also reported the detection of a difference in 6iSO
values measured at room temperature (antiferroelectric phase) versus (apparently) at one temperature above the Tc. Our results at these temperatures are in agreement with the earlier data[6' 1\
The above-described detection of an anomaly in <5ISO (averaged over all four carbons) is a direct evidence that the mechanism of the PA-AFE phase transition involves a significant in the electronic and, therefore, molecular

110 A. N. KLYMACHYOV AND N. S. DALAL
T = 450 K
= 373K
_^TI^L-l3AVZr T = 300K ' I ' ' ' ' I ' 195 190
' I ' ' ' ' 185 ppm from TMS
FIGURE 3 Temperature dependence of 13C CP/MAS spectra of squaric acid[12).
191.2
191.1 -
g- 191.0
g. 190.9 -
> <
190.7
190.6
0.33 ppm
A
• low-temperature peaks
■ high-temperature peaks
—i 1 1 1 1 1 1 ; 1 r 240 260 280 300 320 340 360 380 400 420 440
Temperature (K)
FIGURE 4 Temperature dependence of the isotropic chemical shift, S, in the close vicinity of the paraelectric - antntiferroelectric phase transition of squaric acid at ~373 K ].

DISPLACIVE VS. DISORDER OF A PHASE TRANS 111
structure of the whole H2C404 molecule. This result in turn implies that the chemical structure of the high temperature (PA) phase is not just a time average of the various low-symmetry forms of the AFE phase, but must include a definite change in molecular geometry. Since the atoms that undergo the largest change in positions are the H's, we can infer that the mechanism of the phase transition involves a displacive component, in addition to an order-disorder behavior. In other words, on lowering the temperature toward Tc the potential well for the motion of the H within an O—H... O bond must change from an essentially single minimum type to an asymmetric double minimum type. If the mechanism were only the order- disorder type, then the spectra at T > Tc would be expected to be strictly the average of those corresponding to the low-temperature phase, devoid of any obvious anomaly at Tc.
5. CONCLUSIONS
The higher resolution obtained by the utilization of a single crystal in 13C CP-MAS measurements has enabled us to obtain a fundamentally important result: direct evidence for the displacive character of the antiferroelectric phase transition. The mechanism of this line narrowing effect due to the use of single crystals appears to be the averaging of the broadening due to the anisotropic bulk magnetic susceptibility (ABMS), as discussed by Van der Hart et al.[n] This is consistent with our observation that the line widths in ppm remain unaffected on going from 300 to 600 MHz. Moreover, we have recently suggested that the high resolution spectra of squaric acid such as reported here can serve as internal standards for the calibration of the absolute temperature as well as temperature gradient in 13C CP/MAS studies'121. However, in some other compounds such as sucrose, we have observed that only some of the C-13 peaks exhibit this remarkable narrowing effect. We are continuing these studies with the view of arriving at a detailed understanding of this line-narrowing phenomenon that is a direct result of the utilization of single crystals in MAS[13].
Finally, it seems worth reporting that we have obtained1101 similar results in 31P MAS investigations on NH4H2P04 (ADP), another well-known hydrogen-bonded lattice that undergoes an antiferroelectric transition at 148 K. Here the anomalous increase in the <5iSO for the 31P nucleus implies a distortion of the P04 tetrahedral units as a result of the localization of protons in the O—H... O bonds that link the P04 groups. While further conclusions must await some additional MAS data, it seems clear that the

112 A. N. KLYMACHYOV AND N. S. DALAL
localization of H's in the hydrogen bonds triggers the distortion of the heavy atom frame-work. It is believed that this result is of high current interest to those interested in developing the theoretical models of hydrogen-bonded ferroelectric and antiferroelectric compounds and for obtaining new clues toward the synthesis of new polar lattices.
A ckno wledgments
The authors wish to thank Dr. Riqiang Fu for his experimental help in the measurements at 600 MHz. This work was partially supported by the National Science Foundation.
References
[1] (a) Andrew, E. R. (1959). Arch. Sei. (Geneva), 12, 103; (b) Andrew, E. R., Bradbury, A. and Eades, R. G. (1959). Nature (London), 183.
[2] Lowe, I. J. (1959). Phys. Rev. Lett., 2, 285. [3] Fyfe, C. A. (1984). "Solid State NMR for Chemists", CRC Press, Boca Raton, FL. [4] (a) Semmingsen, D. (1973). Terahedron Lett., 11, 807; (b) Samuelsen, E. J. and
Semmingsen, D. (1975). Sol. St. Commun., 17, 217. [5] Semmingsen, D. and Feder, J. (1974). Sol. St. Commun., 15, 1369. [6] Mehring, M. and Suwalack, D. (1979). Phys. Rev. Lett., 42, 317. [7] Mehring, M. and Becker, J. D. (1981). Phys. Rev. Lett., 47, 366. [8] See, for example, Pople, JA., Schneider, J. and Bernstein, HJ., High Resolution NMR,
McGraw-Hill, N.Y. (1958), Chapter III. [9] Blinc, R. and Zeks, B. (1987). Ferroelectrics, 72, 193.
[10] Klymachyov, A. N. (1996). High Resolution NMR in Hydrogen-Bonded Solids, Ph. D. Dissertation, West Virginia University, Morgantown, WV.
[11] Klymachyov, A. N. and Dalai, N. S., High Resolution Through Single Crystal Spinning in 13C CP/MAS Measurements on Squaric Acid,' poster at the 38th ENC, Orlando, FL., March 24 1997.
[12] Klymachyov, A. N. and Dalai, N. S. (1996). Sol. St. Nucl. Mag. Resort., 7, 127. [13] VanderHart, D. L., Earl, W. L. and Garroway, A. N. (1982). J. Magn. Resort., 44, 361. [14] Klymachyov, A. N. and Dalai, N. S. (1997). Z. Phys. B (in press).

Ferroelectrics, 1998, Vols. 206-207, pp. IB-122 Reprints available directly from the publisher Photocopying permitted by license only
i 1998 OPA (Overseas Publishers Association) Amsterdam B.V. Published under license
under the Gordon and Breach Science Publishers imprint.
Printed in India.
THRESHOLD OF IRREVERSIBLE DOMAIN WALL MOTION IN SOFT
PZT-PIEZOCERAMIC
VOLKMAR MUELLER and Q. M. ZHANG
Materials Research Laboratory, The Pennsylvania State University, University Park, PA 16802, USA
(Received in final form 31 March 1997)
The nonlinear ac-fleld dependence of dielectric and piezoelectric coefficients in soft PZT piezoceramics is studied at/=100Hz. We demonstrate that two different thresholds for the onset of nonlinearity exist at Ec2^\ V/cm and EC\^\QQ V/cm, respectively. At weak fields, the ac-field dependence of the effective dielectric coefficients obeys a scaling law x = x0 + A[(E-Ec)/ ECY with the effective coefficient <p= 1.5 ±0.1. Above the large field threshold, both dielectric and piezoelectric coefficients exhibit a non-analytic scaling behavior. The nonlinearity is here anisotropic which is reflected by exponents ip = 1.0 ± 0.1 and ip = 1.2 ± 0.1 for fields parallel and perpendicular to the poling direction of the ceramic, respectively. The nonlinear domain wall response at fields well below the electrical depoling field is apparently dominated by the depinning of domain walls rather than by the anharmonicity of the potential energy of the wall.
Keywords: Nonlinearity; PZT; domain wall
INTRODUCTION
PZT-piezoceramics are widely used in technically applications such as piezoelectric actuators, resonators and motors. In these applications, the material is usually driven in high electric fields resulting in a substantial non- linearity in the piezoelectric and dielectric behavior. [1] Nevertheless, up to date little understanding was developed about the mechanisms causing the nonlinear field dependence of the piezoelectric and dielectric properties of PZT.
It is well known that the motion of domain walls driven by external electric or elastic fields has an important influence on the linear dielectric and piezoelectric response of the piezoceramic (see for example reference[2_5]).
113

114 V. MUELLER AND Q. M. ZHANG
A large amount of experimental work was done to separate this extrinsic domain wall contribution to the material coefficients from the intrinsic properties of a (hypothetic) single domain PZT-single crystal. [6^11] In donar doped (soft) PZT, where the mobility of the walls is exceptionally high, the domain wall contribution to the permittivity at room temperature was shown to be approximately 60%. [6] The data available up to now indicate that, depending on the amplitude of the driving ac-field, at least two different types of domain wall contributions exist in PZT.
First, domain walls were shown to contribute already at low ac fields 20mV/cm<£'<40V/cm both to the permittivity e33 and the piezomodule d33 and no ac-field dependence could be detected within the measuring accuracy in this ac-field range.[12] It is assumed that weak ac-fields excite oscillations of domain walls which are pinned at the grain boundary and at randomly distributed defects within the grain. The amplitude of these oscillations is thereby much smaller than the lattice constant. This type of domain contribution is referred to as reversible domain wall motion because no field hysteresis of the polarization P could be observed at weak fields.
Results of several authors indicate, on the other hand, that a threshold for the onset of nonlinearity exists in soft PZT at Ec& 100V/cm. [7' I2' I3] Since the intrinsic nonlinearity in PZT is believed to be negligible at these fields, it was suggested that an additional type of domain wall movement sets in at Ec. Above threshold, the P(E) dependence is hysteretic and can be described by the Rayleigh law originally discovered in ferromagnetic systems.[14]
Therefore, the additional domain wall contribution at E> Ec is referred to as irreversible domain wall motion. The threshold field Ec is usually defined to be the smallest value of the electric field for which a field dependence of the corresponding quantity can be detected. Clearly, this procedure depends on the accuracy of the measurement and can give only an upper limit for Ec.
In addition to the threshold behavior due to the onset of irreversible domain wall motion, other sources of nonlinearity related to the domain wall interaction, the electrical and mechanical boundary conditions and the nucleation and coalescence of domains may be of importance at higher field strengths. These effects were considered in a formal phenomenological ap- proach by treating the motion of the wall in an anharmonic potential.[7]
In this paper, we have studied the ac-field dependence of the dielectric and electromechanical properties of a soft PZT-piezoceramic. We compare data obtained in fields parallel and perpendicular to the poling direction of the ceramic, respectively. Special attention was paid to the range of low ac-fields in order to get information about the threshold for the onset of irreversible domain wall motion in this material.

IRREVERSIBLE DOMAIN WALL MOTION IN PZT 115
Experimental
All samples were cut from a commercial available PZT-ceramic (Motorola 3203HD) which had been poled for 1 minute at a temperature T= 373 K. The poling field was thereby £=20 kV/cm. The measurements parallel to the poling direction were performed at thin plates (typical dimensions 3x3x1 mm3), whereas perpendicular to this direction rectangular paralle- lepipeds (typical dimensions 5x3x3mm3) were chosen. Gold electrodes were sputtered onto the major faces.
The longitudinal and shear strain S3 and S5, respectively, were measured using a glass fibre sensor (MTI 2000). The sample was glued with its bottom electrode on a stage and a mirror was mounted on to the top electrode from which the motion of the top surface, originated from either S3 or S5, can be sensed. The sinusoidal measuring voltage (/= 100 Hz) was generated by a function generator (Stanford Research Systems DS 345) and a high voltage amplifier (TREK 610 C). The output signal of the glass fiber sensor was fed both into a digital oscilloscop displaying the strain-field dependence and a lock-in amplifier (Stanford Research Systems DSR-830) analyzing its first harmonic component Sjl'h' from which we determined the effective piezo- coefficient du = sf'h)/Et. A Sawyer-Tower circuit was used to measure simultaneously the polarization of the sample which was analyzed in its first harmonic PJ-1'1^ by another lock-in amplifier to obtain the effective dielectric coefficients £,-,- = Pt ' /£/.
In order to estimate the influence of dielectric heating and field induced changes of the domain structure in large fields, we compared the results obtained in the continuous wave mode and tone burst mode where 5 periods of the ac-voltage are followed by a 3 seconds zero voltage dwelling time. The measurements were restricted to the field range where the results do not depend on the mode chosen in the experiment. At weak fields, only the permittivity was measured using a General Radio 1616 precision capaci- tance bridge with an DSR-830 lock-in amplifier as a null indicator.
RESULTS AND DISCUSSION
All effective dielectric and piezoelectric coefficients show qualitatively the same ac-field dependence (Figs. la,b). The nonlinear contribution to these coefficients increases considerably with increasing amplitude E of the ac- field so that at a field 2s« 3 kV/cm the coefficients are about two times of the corresponding small signal value. By adjusting the weak signal coefficient,

116 V. MUELLER AND Q. M. ZHANG
the large field data can be scaled in such a way that, in a double logarithmic scale, they can be well approximated by straight lines. This indicates that the ac-field dependence of the coefficients obeys in large fields a simple power law. However, deviations from the power law appear at E < 100V/cm and the ac-field dependence is much smaller in this field range. This supports the hypothesis suggested previously [7'12] that the onset of irreversible domain wall motion in electric fields above a threshold Ec causes the significant nonlinearity of PZT. In order to test this scenario, the data were analyzed with the scaling relation
x = x0 + A[{E -EC)/ECY (1)
where x stands for en, e33, dl5 and fi?33, respectively, and the threshold field Ec, the weak field coefficient x0, the prefactor A and the exponent <f> are used as free fitting parameters.
10000
Ü a. co co
■o <
CO CO
W <
1000 -
100
E3 (V/cm)
FIGURE 1 AC-field dependence of the field dependent part of the effective coefficients a) e33, ^33; b) en, di5. Full symbols represent dielectric data, open symbols piezoelectric data. The straight lines illustrate the power law at fields E> 100 V/cm.

IRREVERSIBLE DOMAIN WALL MOTION IN PZT 117
ü Q.
T3 <
<
UW -
b)
000 -
//
100 - mr cv : o*
• • o
10 - i—i rrn *- T 1 ( i in i"| 1 1—i—i i i rri 1 1—i—
10 100
E, (V/cm)
FIGURE 1 (Continued).
1000
The data above threshold can be fitted quite well by Eq. (1). For an accurate determination of Ec, however, the parameter x0 would have to be fixed. This requires the precise knowledge of the weak signal coefficient which we find to have itself a weak but distinctive ac-field dependence which we will discuss later. For this reason, we can give here only a rough estimation Ec= 100±50V/cm. For a given direction of the field, the fit parameters tp and Ec obtained on piezoelectric and dielectric data do not show significant difference. Since the piezoelectric response can only be from the non-1800 wall motion, the adta suggest that it is predominantly the non- 1800 walls which are depinned and contribute to the nonlinear response above Ec. On the other hand, the effective exponent ip depends on the direction of the ac-field which indicates a significant anisotropy of the nonlinearity of the ceramic. We determined exponents tp = 1.0 ± 0.1 for fields parallel and (p= 1.2 ±0.1 for fields perpendicular to the poling direction.
Now we discuss the observed nonlinearity of PZT piezoceramics in terms of the motion of domain walls driven by the external electric field. At low frequencies where the inertia of the wall can be neglected, this motion is

118 V. MUELLER AND Q. M. ZHANG
given by [3' 5]
9U -^ = -1? (2) dAx <9Ax Here, Ax is the wall displacement from the equilibrium position due to the driving force given by the electric energy WE of the wall in the external electric field. The energy dissipation of the moving walls is usually treated by introducing a friction force FF <x A x, depending linearly on the wall velocity. Finally, the restoring force Fr is determined by the potential energy U{Ax) of the wall which may be strongly anharmonic. In this case, Fr acting on a wall would depend nonlinearly on the displacement Ax from its equilibrium position. Nevertheless, any nonlinearity attributed to an anharmonic potential U(Ax) has to meet the symmetry conditions which imply that the Taylor expansion of a coefficient depending on a field Ex
perpendicular to the poling direction can contain only even order terms of Ex.
[7] The exponent </?= 1.2±0.1 determined from the ac-field dependence of di5 and en, respectively, is obviously inconsistent with this symmetry restriction. It should be noted that this non-analytic nonlinearity can be found also in other soft PZT materials and the results of a more comprehensive study will be published elsewhere. [15]
In small fields E < 100 V/cm, the resolution of the strain measurement was insufficient to provide an accurate analysis of the ac-field dependence of the piezoelectric coefficients so that we present here only dielectric weak field data. Though much weaker than in large fields, the ac-field dependence of the dielectric coefficients shown in Figure 2 is apparently more intricate than in large fields and depend moreover on the particular sample under investigation. A closer examination shows, however, that the sample properties have changed during the measurement by the measuring field itself. That is, the value x(Eo) of the susceptibility, determined for sufficiently small fields E0< 0.3 V/cm for which no ac-field dependence can be detected, changes during the measurement and depends on the value of the measuring field Em before (see Fig. 2). We interprete this behavior as a deaging phenomenon due to the measuring field. This deaging effect has in weak fields the same order' of magnitude as the reversible ac-field dependence which we separate by considering the difference
AX = x(Em)-x(Eo). (3)
The resulting values Ax(Em) are independent of the particular aging state of the sample and can be fitted according to Eq. (1) in the same way as the corresponding data in large fields. In this manner, we found for both

IRREVERSIBLE DOMAIN WALL MOTION IN PZT 119
directions of the external field the effective exponent ip= 1.5 ±0.1 (Fig. 3). As in the large field region, this ac-field dependence can not be attributed to a simple Taylor-expansion of the dielectric coefficient. On the other hand, the threshold in weak fields can be determined much more precisely because the field independent part xiin has not to be taken into account as an additional fitting parameter. Therefore, the data prove unambiguously the existence of a non-zero threshold £,
c2 = 0.6±0.2V/cm for the onset of nonlinearity in the ceramic at weak fields. Since we could not obtain sufficiently accurate piezoelectric data in weak fields, it is not clear whether the threshold at Ec2 is connected with the onset of 180° wall motion or with another kind of non-1800 wall motion.
One approach to introduce a nonlinearity into the model of moving domain walls, which is compatible with the experimental results, is to modify the assumption of a linear friction force-velocity dependence Ff(x).
1.002
1.000
o
w 0.998
0.996
0AA**A-AA" o
o
% o,
V
A A A A A
A e33(E) A e33(0.3V/cm)
• e„(E) O en(0.3V/cm)
° • • o • o
o • • • u o o o o
~T~
0 —I—
10 15
E (V/cm)
FIGURE 2 AC-field dependence of the dielectric coefficients in weak fields (full symbols). The data are normalized to the value £(0) measured initially at the AC-field E0 = 0.3 V/cm. Open symbols represent data measured at E=E0 immediately after the measurement at the particular measuring field Em > E0 was completed.

120 V. MUELLER AND Q. M. ZHANG
10 -
* o o o
E (V/cm)
FIGURE 3 AC-fleld dependence of the reversible exzess part (Ax/x)1//? of the suszeptibility close above weak field threshold. The exponent /3 = 3/2 was obtained from a least square fit of the experimental data which is represented by the straight lines.
We note that theoretical models treating the depinning transition of elastic interfaces as a dynamical critical phenomenon predict a scaling behavior similar to Eq. (1) between force and velocity above the onset of interface motion. [16] The introduction of a nonlinear friction force changes Eq. (3) into a nonlinear differential equation
Ax = ß ■(
dWE dU \
-\<p
V dAx dAxJ (4)
where ß is a friction coefficient and Fc the critical depinning force. The critical exponent ip depends on the spatial dimensionality d and no result is available up to now for d— 3. It is believed that the exponent for d= 3 is between 1 and the mean-field exponent 3/2. [17]
We are aware that the values for threshold field and effective exponent obtained in a technical piezoceramic represent the average over all grains, 180°- and several types of non-1800 domain walls with different

IRREVERSIBLE DOMAIN WALL MOTION IN PZT 121
orientations to the external field. In addition, our experiments may not probe the critical region of a probable depinning transition in the sense of the theory mentioned above. As more it is surprising, that the exponents determined in this study seem to be consistent with the theoretical expectations. Moreover, an exponent y? = 1.45 ± 0.03 was found recently for (non-ferroelastic) 180° domain walls in the ferroelectric lock-in phase of a purified incommensurate single crystals. [18] Clearly, more experimental work especially on single crystals is necessary to obtain further information about the depinning transition of ferroelectric non-1800 walls.
Another related issue is the nature of the restoring force which cannot be ignored in Eq. (4) since this would lead to a nonlinear conductivity. It should be pointed out that only a small amount AP<0.1P0 of the spontaneous polarization P0 is switched in our experiments. Apparently, the mean displacement of the walls is considerably smaller than the mean wall- wall distance provided that the majority of the walls are displaced by the field and contribute to AP. For small displacements Ax, it is reasonable to assume that the wall moves in a quasiharmonic potential and the restoring force depends approximately linearly on Ax. On the other hand, the motion of the interface close above the depinning threshold is jerky and the elasticity of the wall itself may also contribute to the restoring force.
To conclude, evidence for the onset of nonlinearity in soft PZT piezoceramics at two threshold fields Ec\ and Ec2 was obtained by analyzing the nonlinear ac-field dependence of their dielectric and piezoelectric coefficients. The result suggests that dynamical critical phenomena connected with the onset of collective interface motion above a threshold field Ec determine the nonlinear response of the piezoceramics. The non- linearity of ferroelectrics in the field range of so called "Raleigh loops"[14]
appears therefore to be attributed to the dynamics of domain walls moving in a medium with randomly distributed pinning centers rather than by the anharmonicity of the potential energy of the wall.
The authors are grateful to the Motorola Ceramics Products Division for providing ceramic material for this study and acknowledge financial support from the office of Naval Research.
References
[1] Cross, L. E. "Ferroelectric Ceramics: Tailoring Properties for Specific Applications" in "Ferroelectric Ceramics", edited by N. Setter and E. L. Colla (Birkhaeuser Verlag, Basel 1993).
[2] Jaffe, B., Cook, J. and Jaffe, H. "Piezoelectric Ceramics", (Academic Press, London 1971).

122 V. MUELLER AND Q. M. ZHANG
[3] Arlt, G. and Pertsev, N. A. (1991). J. Appl. Phys., 70, 2283. [4] Smits, J. (1976). IEEE Trans. Son and Ultrason., SU-23, 168. [5] Fousek, J. and Brezina, B. (1964). /. Phys. Soc. Jpn., 19, 830. [6] Zhang, Q. M., Wang, H., Kim, N. and Cross, L. E. (1994). J. Appl. Phys., 75, 454. [7] Li, S., Cao, W. and Cross, L. E. (1991). J. Appl. Phys., 69, 7219. [8] Zhang, X. L., Chen, Z. X., Cross, L. E. and Schulze, W. A. (1983). /. Mater. Sei., 18, 968. [9] Kersten, O. and Schmidt, G. (1986). Ferroelectrics, 67, 191.
[10] Boettger, U. and Arlt, G. (1992). Ferroelectrics, 127, 95. [11] Kleemann, W. and Schremmer, H. (1989). Phys. Rev. B, 40, 7428. [12] Zhang, Q. M., Pan, W. Y., Jang, S. J. and Cross, L. E. (1988). J. Appl. Phys., 64, 6445. [13] Saito, Y. (1995). Jpn. J. Appl. Phys., 34, 5313. [14] Damjanovic, D. and Demartin, M. (1996). J. Phys. D: Appl. Phys., 29, 2057. [15] Mueller, V. and Zhang, Q. M. to be published. [16] Fisher, D. S. (1985). Physical Review B, 31, 1396. [17] Littlewood, P. B. in "Charge Density Waves in Solids", edited by L. P. Gorkov and
G. Grüner (Elsevier, Amsterdam 1989). [18] Hauke, T., Mueller, V., Beige, H. and Fousek, J. (1996). /. Appl. Phys., 79, 7958.

Ferroelectrics, 1998, Vols. 206-207, pp. 123-132 Reprints available directly from the publisher Photocopying permitted by license only
i 1998 OPA (Overseas Publishers Association) Amsterdam B.V. Published under license
under the Gordon and Breach Science Publishers imprint.
Printed in India.
CRYSTAL STRUCTURE ANALYSIS AND POLARIZATION MECHANISMS OF FERROELECTRIC TETRAGONAL
TUNGSTEN BRONZE LEAD BARIUM NIOBATE
RUYAN GUOa, H. T. EVANS, jR.b and A. S. BHALLAa
a Materials Research Laboratory, The Pennsylvania State University, University Park, Pennsylvania USA; b Geological Survey, United States
Department of the Interior, Reston, Virginia, USA
(Received 28 February 1997; In final form 2 May 1997)
Lead barium niobate single crystals of the composition Pbo.596Ba0.404Nb2.o3706, near the tetragonal: orthorhombic morphotropic phase boundary with tetragonal symmetry at room temperature, were the subject of this study. The crystallographic details, including the ionic coordination, the site occupancies and the thermal anisotropy of a lead-containing tetragonal tungsten bronze crystal are determined. This paper reports the structural refinement results, the site-preference by cations and vacancies, the macroscopic polarization properties derived from the cation displacement, and the apparent valences determined by the bonding distance. Unlike other non-lead-containing ferroelectric tungsten bronzes, significant polarization contribution can be attributed to cations (Pb2+ and Ba2+) at the A2-site. Large anisotropic thermal coefficients found for cations at the A2-site further strengthens the local polarization fluctuation model and suggests the local polarization components are perpendicular to the mirror plane along the (110) direction.
Keywords: Tungsten bronze lead; barium niobate
INTRODUCTION
The tungsten bronze ferroelectric family is one of the largest oxygen octahedral ferroelectric families next to the ferroelectric perovskites. Similar to the perovskites, the ferroelectric tungsten bronzes typically have large spontaneous polarization and high dielectric constants. The structural flexibility and the chemistry versatility of this family make it more suitable
123

124 R. GUO et al.
in many application aspects than the ferroelectric perovskites. Additionally, a morphotropic phase boundary (MPB) that separates two ferroelectric phases with mutually perpendicular polarization directions has been found so far only in tungsten bronze solid solution systems such as in Pbi_xBaxNb206, (PBN). Along with many optimized properties expected, it was also demonstrated that in PBN, polarization status can be controlled by applying external electric field in a crystal near the MPB compositiontl]
and crystals grown with proper compositions can have both the ferro- electric-ferroelectric and ferroelectric-paraelectric phase transitions in temperature span with good crystal quality and homogeneity.[2]
The prototype of all tetragonal tungsten bronzes is of point group 4/mmm. The chemical formula in an extended sense has complicated composition with the general form:
(Al)f(A2)f(C)f(Bl)r(B2)-0^
in which Al, A2, and C are the 12-, 15-, and 9-fold coordinated sites in the crystal structure surrounded by oxygen anions.[3] The B06 octahedra are linked by their corners in such a manner as to form three (Al: square, A2: pentagonal, and C: triangular) different types of tunnels running through the structure parallel to the c-axis.[4] In Pb! xBaxNb206 the polar axis is parallel to the (001) axis for the Ba-rich tetragonal phase but perpendicular to the (001) for the Pb-rich orthorhombic phase.'51 The dependence of the polarization orientation on composition results in the appearance of the morphotropic phase boundary.
Determinations of ferroelectric tungsten bronze crystal structures were given by Jamieson, Abrahams, and Bernstein in their detailed structure measurements on specific compositions of SBN,[6] BNN,[7] and KLN.[8]
However, precise determinations of ferroelectric tungsten bronze crystal structure for lead-containing compounds that may have polarization components in the a-b plane are so far lacking. To understand the ferroelectric tungsten bronzes, particularly the lead-containing families, for their relaxor behaviors (e.g., dispersive dielectric properties) at near the ferroelectric-paraelectric phase transitions,'91 or in a substantially lower temperature region,'101 knowledge of the structural details is necessary. This study was intended to fill in this gap by carrying out the crystallographic structure study on a lead containing tungsten bronze crystal, tetragonal Pb0.596Bao.404Nb2.o3706 (abbreviated hereafter as PBN60, or nominally, Pb3Ba2Nb1003o).

STRUCTURE AND POLARIZATION MECHANISMS 125
EXPERIMENTAL PROCEDURE
Single crystal specimens used for this study were grown by the Czochralski pulling technique, at the Materials Research Laboratory, Penn State University. Chemical composition of the crystal studied was determined by electron probe microscopic analysis as to be Pb0.596Ba0.404Nb2.037O6.
A tetragonal unit cell was measured from a Guinier-Hägg focused powder pattern. Precession photographs confirmed the Laue group 4/mmm with absences corresponding to a i-glide; the ferroelectric character of the crystal leads to a space group P4bm (no. 100). X-ray powder diffraction pattern was obtained on finely ground and annealed (550°C for 5 hours in air) crystal powder. The lattice parameters obtained by powder XRD after the least square fitting are a = b= 12.502(3) A, c = 3.961(7) A, and a unit cell volume of V = 619.2 A3. The measured density of the crystal is 6.13 g/cm3, comparing to the X-ray density of 6.18 g/cm3, based on its analytical formula.
The crystal chip selected was from an as grown crystal boule (without annealing) to obtain a single domain piece. A thin crystal flake, 0.3x0.3x0.03 mm in size, was selected and then mounted on the CAD4 diffractometer (Smithsonian Institution, Washington, D. C). A total of 1148 reflections within one-quarter of the Ewald sphere with 2#<60° were measured. These were reduced to 546 symmetry-independent structure factors, of which 506 had |F| > 3er(F) (being significantly above background) and were used to refine the structure parameters.
DATA ANALYSIS AND STRUCTURE REFINEMENT
Starting with the structure of PbNb206 tungsten-bronze type, the structure was refined in space group P4bm holding zNb2 constant. Convergence was obtained at first with one Pb in site 2(a) and four Ba in site 4(c) (Rw= 0.10). Refinement of population parameters indicated occupation 0.5 for Nb(l) and 1.0 for Ba. However, two measurements (EPMA analytical result and density measurement) clearly indicated a much higher proportion of lead in the sample.
Refinement was renewed with Pb(l) half occupied, and Ba half replaced by Pb(2). Following Brusset et a/.[I1] all the Ba is confined to the mirror-plane site. Least squares analysis continued to converge; population parameters were then released for refinement for Pb(l), Pb(2), and Ba, while position parameters for Ba were held to those of Pb(2). With anisotropic parameters

126 R. GUO et al.
refined for Nb, Pb, and Ba, Rw reached 0.081. With O anisotropic Rw
reached 0.076, but all O atoms tended to a nonpositive definite state. It became apparent that the above procedure was not realistic.
Refinement of Ba as above leads to unusual results (t/=0.22) and Pb:Ba = 5:2. The structure appears to be very "soft", that is, cross correlation and errors tend to become high. A more careful approach was followed and some basic restrictions such as Pb + Ba = 5, and that Pb:Ba = 3:2 were applied.
REFINEMENT RESULTS AND DISCUSSIONS
Refinement with Nb and Pb anisotropic and Ba fixed to A2 with p = 0.5 led to Rw = 0.085, but Pb:Ba = 2.87:2. With Pb:Ba fixed at 3:2 and only/» for Al refined and P for A2 adjusted to hold Pb/Ba at 3:2, with isotropic oxygen, Rw reached 0.090. This result led to occupancy of the 4-axis site of 0.551, and for the mirror-axis site 0.975. The A2 site is somewhat elongated normal to the mirror plane (Fig. 1), which suggests that the site could also be split with the atoms localized in positions to one side of the mirror. An attempt to refine such a model clearly showed that there is no concentration of electron density off the mirror plane. With split A2 atoms, isotropically the model did refine but to a higher R, and anisotropically it drifted back to the elongated mirror position.
The final position coordinates and the final temperature coefficients corresponding to the best model successfully carried out referred to above are listed in Table I.
(a) Al- and A2-Site Occupancies by Cations and Vacancies
The structure refinement results indicated that there are essentially no barium atoms in the Al-site. When an attempt was made to place barium atoms in the Al-site, the population for this site is refined to nearly zero.
The lattice parameters refined for the single crystal chip (unannealed state) are a = b = 12.4970 Ä, c = 3.9603 A, and the population of Pb in the Al-site is /? = 0.551. The lattice parameters found for the powder X-ray diffraction of the annealed powder, however, are a = b = 12.5019 A, c = 3.9605 Ä, and the population of Pb in the Al-site was found to be somewhat higher than p = 0.551 as in the case of unannealed crystal.[12]
It is likely that the Al-site in the annealed state is larger than that in the unannealed state (or poled state), presumably due to the relaxation of

STRUCTURE AND POLARIZATION MECHANISMS 127
e—e
FIGURE 1 PBN60 single crystal refined structure viewed along the polar c-axis.
oxygen octahedron distortion and redistribution of vacancies after anneal- ing that makes the Al-site more accommodate to the Pb2+ ions. This observation is in agreement with Trubelja et al. [13] that an increase in Sr occupancy in the Al-site was observed in Sr0.5oBao.5oNb206 upon annealing. It is a further support for the vacancy non-random distribution hypothesis proposed earlier, through an annealing and quenching effect study in tungsten bronze Sr!_xBaxNb206 and Ba2_xSrxK1_J,NaJ,Nb50i5 crystals.[14]
(b) Oxygen Anisotropy
Attempts to refine oxygen anisotropically always led to a nonpositive definite result, but apparently with certain significance. An oblique view of the structure (Fig. 2) shows that the oxygen atoms are highly compressed normal to the Nb—O bonds as would be expected. Though the effect is

128 R. GUO et al.
TABLE I Refined parameters for Pb3Ba2Nb,0O3l
Atoms
Populations: 2pPbl + 4pPb2 +4pBa = 5; Pb:Ba = 3:2 Coordinates
Position x y z
Nb(l) 2b Bl 0.0 0.5 -0.0089(34) 0.11(6) 1.0 Nb(2) 8dB2 0.0740(2) 0.2104(2) 0.0 0.16(8) 1.0 Pb(l) 2a Al 0.0 0.0 0.4887(26) 0.14(7) 0.551(3) Pb(2) 4c A2 0.3287(5) 0.1713 0.4904(32) 0.26(13) 0.475 Ba 4c A2 {x,y,z = Vb{2)) 0.30 0.500 O(l) 8d -0.007(1) 0.345(1) 0.048(7) 0.15(8) 0(2) 4c 0.216(2) 0.274 0.062(7) 0.10(6) 0(3) 8d 0.141(1) 0.070(1) 0.054(5) 0.11(6) 0(4) 4c 0.0 0.5 0.546(24) 0.22(11) 0(5) 8d 0.072(2) 0.211(2) 0.540(11) 0.19(19)
Thermal Ellipsoids {A2) Atoms t/n U22 ^33 Un t/13 C/23
Nb(l) 0.007(1) 0.007 0.024(2) -0.000(1) 0.0 0.0 Nb(2) 0.009(1) 0.008(1) 0.027(1) 0.002(1) -0.007(2) 0.006(2) Pb(l) 0.013(1) 0.013 0.030(2) 0.0 0.0 0.0 Ba/Pb(2) 0.078(2) 0.078 0.054(3) 0.021(2) 0.000(6) 0.000
FIGURE 2 PBN60 single crystal refined structure showing oxygen anisotropy.
probably exaggerated by an inadequate absorption correction on the intensity data; nevertheless, the correction is to some degree valid as shown by the distinct improvement of Rw over conventional R. The 05 half-atom model used by Jamieson et al. [6] in other tungsten bronze crystals such as SBN was not adopted in this study as the isotropic temperature constants refined for 05 and 04 are within normal range.

STRUCTURE AND POLARIZATION MECHANISMS 129
(c) Cation Displacement and Polarization
The final position coordinates of Table I and the lattice constants were used to calculate interatomic distances and angles, as listed in Table II.
As can be seen from the Figure 3, cations displace in the same sense away from the nearest mean plane of oxygen anions. The oxygen atoms lie close to a plane 0.2 Ä below the level of the Nb atoms. The short apical Nb — O distance is 1.76(9) A for Nb(l) and 1.82(4) Ä for Nb(2), each of these sites
TABLE II Interatomic distances and angles in Pb3Ba2Nbio03(
Distances (A) Angles (deg.)
Atoms d Atoms a
Nb(l)—0(4) 1.76(9) 0(4)—Nb(l)— 0(l)(x4) 97.7(8) -0(l)'(x4) 1.95(2) 0(1)—Nb(l)— 0(l)(x4) 84.1(6) -0(4)' 2.20(9) O(l)—Nb(l)— 0(l)(x4) 94.3(6) Nb(2)—0(5) 1.82(4) 0(4)—Nb(l)— 0(4) 180.0 -0(3) 1.96(2) O(l)—Nb(l)— 0(l)(x2) 166.6(1.3) -0(1) 1.98(2) 0(5)—Nb(2)— 0(3) 96.7(9) -0(3)' 2.01(2) 0(5)—Nb(2)— 0(1) 95.1(1.0) -0(2) 2.02(2) 0(5)—Nb(2)— 0(3)' 95.6(9) -0(5)' 2.14(4) 0(5)—Nb(2)— 0(2) 97.5(1.0) Pb(l)—0(3)(x4) 2.61(2) 0(5)—Nb(2)— 0(5)' 178.8(9) -0(5)(x4) 2.79(2) 0(3)—Nb(2)— O(l) 167.0(9) -0(3)(x4) 2.99(2) 0(3)—Pb(l)— 0(3)' 89.1(6) Ba/Pb(2)—0(2) 2.61(3) 0(3)—Pb(l>— 0(2) 90.9(5) -0(l)(x2) 2.71(3) 0(3)—Pb(l)— 0(5)' 84.2(8) -0(2)' 3.01(3) 0(1)—Ba/Pb(2)-0(3)' 84.3(6) -0(l)'(x2) 3.02(2) O(l)—Ba/Pb(2)-0(2)' 93.0(6) -0(4) 3.04(1) O(l)—Ba/Pb(2)—0(5)' 84.1(9) -0(3)(x2) 3.18(2) 0(3)—Ba/Pb(2)-0(2)' 166.8(1.0) -0(5)(x2) 3.25(2) 0(3)—Ba/Pb(2)-0(5)' 83.5(8) -0(5)'(x2) 3.39(2) 0(2)—Ba/Pb(2)-0(5)' 83.4(1.0) -0(3)'(x2) 3.48(2)
O.Q45 o.oas
Pb(l) Pb(2)/Ba ""'» ors-.
0.18 0.16
Nbri) NbC2) O(l) ^ 0.00
0.035
Q(2)
0.19 0.24
>(3)
0.5
z=0.0
0.21
FIGURE 3 Magnitude and sense of atomic displacements (in angstroms) relative to the c-axis in PBN60. Macroscopic polarization is indicated by the large arrow.

130 R. GUO et al.
possesses distorted octahedral symmetry. On average the apical distance is 1.78 Ä and the opposite distance is 2.22 Ä. The equatorial Nb—O distances are all near the average 1.97 A (compared with the average distance of 2.0 A in LiNb03 and 2.011 Ä in KNb03).
The Pb(l) coordination has mm symmetry and is 12-fold with Pb(l)—O distances average 2.80 Ä. The Pb(2)/(Ba) environment is irregular with 15 oxygen contacts within 3.5 A.
The direction of cation displacements can be related directly to the orientation of the macroscopic ferroelectric polarization as illustrated in the Figure 3. Note that the Nb(2) position was selected for the z = 0 plane. It is known that for lead-free oxygen octahedron compounds, the displacement of Nb5 + from the oxygen plane is the major contribution to the macro- scopic polarization. Substantial polarization contributions in this crystal, however, can be attributed to the Pb2+ and Ba2+ displacements as they are of similar magnitude as that of the Nb5+.
An evaluation of the spontaneous polarization can be made based upon the knowledge of the atomic displacement. Two different approaches are compared:
(a) From the proportionality relationship with displacement A (in angstroms) developed by the "homopolar" metal atoms, the equation[15]
Ps = (258 ± 9) A t^C/cm2] (1)
can be used for Ps calculation for oxygen octahedra ferroelectrics, provided the ferroelectric material is of displacive type. Spontaneous polarization evaluated for the Nb06 oxygen octahedra gave values Ps = 54.8~58.7 nC/cm2 (for Nb(l)Oe group) or Ps = 39.8-42.7 nC/cm2 (for Nb(2)06 group). Simple weighted average of the Nb(l)- and Nb(2)- group yielded average value of Ps = 44.8 ~ 48.1 nC/cm2. The calculated average values are in reasonable agreement with the experimentally determined value (Ps = 38~46 (aC/cm2). It perhaps indicated that one dimensional displacive model is still suitable for this material, being consisted of the oxygen octahedra building blocks.
(b) Assuming a point-charge model, using the expression:
* = ^£>A* (2)
where the summation is over the volume V containing i ions of charge Zh
and A, is the atomic displacement vector along the polarization axis, the

STRUCTURE AND POLARIZATION MECHANISMS 131
total polarization taking into account each ions can be calculated. The value thus obtained is Ps = 41.7 nC/cm2, compared to the experimental value.
(d) Apparent Valence of the Cations
The apparent valences (V,) of the cations for PBN60 single crystal using r0s listed in Brown and Altermatt[16] were calculated for the refined structure. The results are summarized in Table III.
As it is clear from the Table III that the Pb2+ in the A2-site (15- coordination) are severely underbonded. High polarizability in the unique c- axis direction in this tetragonal structure therefore evidently includes the contribution from the largely rattling Pb2+ ions in the A2-site. Together with the high temperature anisotropy, the cation fluctuation in the A2-site could give dynamic polarization components perpendicular to the mirror plane, in the (110) direction. With the increase of the Pb:Ba ratio, it is inevitable that more Pb2+ will occupy A2-site, that may aggravate the rattling status of the Pb2+ in the open cage until the orthorhombic structure became energetically more favored in the morphotropic phase boundary composition (Pb: ~63%). Slight overbonding is found for Pb2+ in the Al- site and Ba2+ in the A2-site. Nb(l) in Bl-site is also slightly overbonded and is known to form less distorted oxygen octahedra compared to the more deformed Nb(2) in B2-site.
SUMMARY
Crystallographic structural refinement for a single crystal of composition Pb0.596Bao.404Nb2.o3706 was carried out and the results obtained allowed further understanding on the ferroelectric tungsten bronze polarization mechanisms. It is found that at Pb:Ba = 3:2 ratio, there is essentially no
TABLE III Apparent valences for cations in Pb3Ba2Nbio03o
Atom Site Coordination Vt
Nb(l) Bl 6 5.498 Nb(2) B2 6 4.999 Pb(l) Al 12 2.045 Ba A2 15 2.088 Pb(2) A2 15 1.307

132 R. GUO et al.
Ba2+ occupies the Al-site. Pb2+ cations prefer occupation of the A2-site over the Al-site as the Al-site was found nearly half vacant. Pb2+ in the A2- site is severely underbonded and both Nb5+ and Pb2+/Ba2+ (in A2-site) are major contributors to the macroscopic polarization. Rattling Pb2+ in A2- site with large temperature anisotropy may cause significant polarization components normal to the mirror plane. Reduced thermodynamic energy may force the frozen of Pb2+ cations at one side of the mirror plane and cause local polarization components. There is no ionic concentration found away from the mirror plane at the environmental temperature.
A cknowledgements
This research was supported partially by the National Science Foundation under Grant No. DMR-9510299. The use of facilities in the Department of Mineral Science, Smithsonian Institution, Washington, DC, is gratefully acknowledged.
References
[1] Guo, R., Bhalla, A. S. and Cross, L. E. (1990). Applied Optics, 29, 904. [2] Burns, G., Dacol, F. H., Guo, R. and Bhalla, A. S. (1990). Appl. Phys. Letters, 57, 543. [3] Hagg, G. and Magneli, A. (1954). Rev. Pure Appl. Chem. {Australia), 4, 235. [4] Lines, M. E. and Glass, A. M. (1977). Principles and Applications of Ferroelectrics and
Related Materials, 280, Oxford University Press, Oxford. [5] Francombe, M. H. (1960). Ada Cryst., 13, 131. [6] Jamieson, P. B., Abrahams, S. C. and Bernstein, J. L. (1968). J. Chem. Phys., 48, 5048. [7] Jamieson, P. B., Abrahams, S. C. and Bernstein, J. L. (1969). J. Chem. Phys., 50, 4352. [8] Abrahams, S. C, Jamieson, P. B. and Bernstein, J. L. (1971). /. Chem. Phys., 54, 2355. [9] Guo, R., Bhalla, A. S., Randall, C. A., Chang, Z. P. and Cross, L. E. (1990). J. Appl.
Phys., 67(3), 1453. [10] Guo, R., Bhalla, A. S., Randall, C. A. and Cross, L. E. (1990). /. Appl. Phys., 67(10), 6405. [11] Brusset, H., Gillier-Pandraud, H. and Mahe, R. (1972). Bull. Soc. Chim. France, 3, 926. [12] Guo, R., Smith, D. K. et al. (unpublished result). [13] Trubelja, M. P., Ryba, E. and Smith, D. K. (1996). J. Mat. Sei., 31, 1435-1443. [14] Guo, R., Bhalla, A. S., Burns, G. and Dacol, F. H. (1989). Ferroelectrics, 93, 397. [15] Abrahams, S. C, Kurtz, S. L. and Jamieson, P. B. (1968). Phys. Rev., 172, 551. [16] Brown, I. D. and Altermatt, D. (1985). Ada Cryst., B41, 244-247.

Ferroekctrics, 1998, Vols. 206-207, pp. 133-155 Reprints available directly from the publisher Photocopying permitted by license only
i 1998 OPA (Overseas Publishers Association) Amsterdam B.V. Published under license
under the Gordon and Breach Science Publishers imprint.
Printed in India.
PRECURSOR STRUCTURES IN FERROELECTRICS FROM
FIRST-PRINCIPLES CALCULATIONS
HENRY KRAKAUER, RICI YU, CHENG-ZHANG WANG
and CHRIS LASOTA
Department of Physics, College of William and Mary, Williamsburg, Virginia 23187-8795
(Received 17 March 1997; In final form 12 May 1997)
Based on an analysis of the wavevector dependence of lattice instabilities in KNb03, the existence of a real-space chain-like instability was deduced [1]. To further study this instability, we have constructed an ab initio effective Hamiltonian for KNb03 that reproduces the low- energy Born-Oppenheimer surface. Classical molecular dynamics (MD) simulations yield the observed sequence of ferroelectric phase transitions. The transition temperatures are lower than experiment, especially for the higher temperature transitions. Simulations of the static structure factor reveal features consistent with chain-like correlations and qualitatively reproduce diffuse X-ray scattering measurements. The calculated dynamic structure factor reveals anharmonically stabilized TO vibrational modes that soften along the entire Y-X line in the Brillouin zone, as the phase transition is approached from above. A real-space analysis of the intercell correlations of the soft-mode coordinate, unambiguously establishes the long-lived dynamic character of these chain-like structures.
Keywords: KNb03; phase transition; Brillouin zone
I. INTRODUCTION
A recent first-principles linear-response calculation [1] on KNb03 revealed the existence of unstable lattice distortions over large regions of the Brillouin zone (BZ). The regions of instability were three mutually perpendicular interpenetrating slabs centered at T, perpendicular to the cubic axes, and extending to the BZ boundaries. These large two- dimensional regions in reciprocal space allowed us to deduce the existence of a real-space chain-like instability in KNb03
[1]. Based on the transverse
133

134 H. KRAKAUER et al.
polarization of the unstable modes, the real-space chains must be perpendicular to these slabs. In other words, the chain-like character arises from the fact that the components of the atomic displacements along the chain direction are correlated, while those perpendicular to the chain direction are uncorrelated. In the high-temperature paraelectric phase, displacements on adjacent chains are uncorrelated, i.e., adjacent chains are randomly oriented. A scenario was proposed of sequential freezing out or onset of coherence of these instabilities, which could qualitatively explain the sequence of observed temperature-dependent ferroelectric phases. Given the very similar ferroelectric phases of BaTi03, we suggested that this chain- like instability should also be found in BaTi03. Ghosez et al.[2] subsequently confirmed this. By contrast with KNb03 and BaTi03, a similar linear response study of cubic SrTi03
[3] revealed a greatly reduced phase space for the ferroelectric instability and a competing antiferrodistortive instability that extends along the entire R-M-R line in the BZ. This is consistent with the fact that no ferroelectric phases have been observed in SrTi03 down to the lowest temperatures measured. Again, the fact that the antiferrodistor- tive instability extends over large regions of BZ suggests that a real space picture of local distortions may be more appropriate.
There are also many experimental indications in perovskite ferroelectrics that the actual atomic structure may be significantly different locally than is indicated by the average crystallographic structure deduced from elastic X-ray and neutron scattering. Perhaps the earliest evidence is from the diffuse X-ray scattering measurements of Comes et al. [4'5], who interpreted temperature-dependent streak patterns in terms of precursor short-range order in the form of static chains of distorted primitive cells along [100] directions. Observations of quasi-elastic central peaks in neutron scattering [6] and Raman spectroscopy [7] above the phase transition temperature were also indicative of preformed clusters of the low temperature phase. More recently, pair distribution functions obtained from neutron scattering measurements up to very high momentum transfers [8] and XAFS measurements [9] indicate the presence of short-range order.
While first-principles calculations have provided a great deal of information, they are limited to zero temperature and to relatively small simulation cells. It is possible to extend the reach of the first-principles results through the use of ab initio effective Hamiltonians, HeS [10' 11]. These Hamiltonians are constructed by removing the inessential degrees of freedom, and they reproduce the low-energy Born-Oppenheimer surface as determined by the first-principles results. Using a database of first- principles total-energy and linear response calculations, the important

PRECURSOR STRUCTURES IN FERROELECTRICS 135
degrees of freedom can be obtained (these are essentially the local soft-mode coordinates) and then the parameters of Hes can be fitted.
In order to further study the local character of the ferroelectric instabilities, we have constructed such an HeS for KNb03 and performed classical molecular dynamics (MD) simulations as a function of tempera- ture. The rest of the paper is organized as follows. The methodology is briefly described in Section II, results and discussion are presented in Section III, and conclusions are given in Section IV.
II. METHOD
We constructed Hefr using the the lattice-Wannier-function formulation of Rabe and Waghmare.[11] Details of the construction are presented elsewhere [12], and we give only a brief description here. The effective Hamiltonian subspace is defined using a basis of localized and symmetrized atomic displacement patterns, called lattice Wannier functions, which are con- structed to reproduce the LAPW linear response results of the unstable transverse optic phonon eigenvectors and frequencies (the "soft modes") at various points in the BZ, including the unstable polar T15 phonon. For KNb03, there is one vector lattice Wannier function per unit cell, representing a great reduction from the 15 ionic degrees of freedom associated with every unit cell in the perovskite AB03 structure.
In addition to these degrees of freedom, there is also a homogeneous strain tensor, which allows the volume and shape of the simulation cell to change during MD runs. Schematically, the following terms are contained in
HtK = K.E. + U, (1)
where
U = £/on_site + ^short-range + ^dipolar + L'soft-mode-strain + ^/elastic- {*■)
Anharmonic terms are contained only in the on-site interaction E/0n-site and the soft-mode-strain coupling £/Soft-mode-strain- The former is given by
f/on-site = K$ + 6£l+ 7(&& + ' ' 0' ^
where £,, a,a = x, y, z, is the amplitude of the local soft-mode coordinate on primitive cell /. E/soft-mode-strain is linear in the strain and quadratic in the soft-

136 H. KRAKAUER et al.
mode coordinates. Strain coupling is crucial in obtaining the correct sequence of observed ferroelectric phase transitions [10]. The remaining terms contain only harmonic terms. For example, the short-range interac- tions are given by
^short-range = / _, Ji,j,a,ßKi,asj,ß- VV i,j, a, ß
The long-range dipolar interactions £/dipoiar depend on the classical potential between dipoles, where the dipole moments are given by the mode effective charge times the soft-mode amplitude, screened by the dielectric constant:
L/dipolar = (/■ ) I eoo 2_^ Jvi ' W
where the mode effective charge Z * is given by the sum of Born effective charges of the individual atoms in the unit cell weighted by the coefficient of the soft-mode eigenvector: [10]
Z* = eKZ*K + eNbZ*m + eO||-Zo|| + eo±Z*0±. (6)
The short range parameters JiJ>a,ß are fitted using the first-principles soft- mode eigenvectors and frequencies. The anharmonic parameters including the strain coupling were determined by fits to total-energy calculations as a function of strain and T point soft-mode amplitude along the (100), (110) and (111) directions.
Using Heff, molecular dynamics simulations were carried out for a 10x10x10 simulation cell containing 1000 primitive unit cells with periodic boundary conditions. Simulation cells of this size were found to be adequate in previous Monte Carlo calculations for BaTi03
[10]. A variable cell shape formalism was used together with Nose-Hoover thermostats to equilibrate the MD runs at constant temperature [13]. After equilibration, and prior to computing the static and dynamic structure factors, the thermostats were turned off and the cell shape and volume were kept fixed. Further equilibration (constant-energy MD) generally caused the temperature to change by about 5 K. After this last equilibration, MD runs of typically 20000 time steps (each time step ~ 1 femptosecond) were performed, writing all the £,jQ every 10 time steps to a file. The static and dynamic structure factors were then computed [14). Due to the use of periodic boundary conditions with the 10x lOx 10 simulation cell, the structure factor and other wavevector dependent quantities can be calculated only for wavevectors

PRECURSOR STRUCTURES IN FERROELECTRICS 137
q = (2ir/l0a) (ri\, n-i, n3), where a is the cubic lattice parameter and nt are integers. For example, the sructure factor along the (100) direction could only be calculated at reduced wavevectors (a/2ir)qx= [0.1, 0.2, 0.3, 0.4, 0.5].
As a test of the MD method, we applied it to the effective Hamiltonian previously constructed by Zhong et al.[10] for BaTi03 and obtained excellent agreement with the sequence of phase transitions and transition tempera- tures they obtained using Monte Carlo simulations.
III. RESULTS AND DISCUSSION
The different structural phases are identified in the MD simulations by calculating the three components of the order-parameter Ra, defined as an average over all the local soft-mode amplitudes:
Ra = (\/N)Y^£itCn (7) i
where the a = x, y, z denotes the three Cartesian components of the order parameter, and £,->Q is expressed in units of the lattice parameter. This average is calculated at each time step in the simulation and plotted for KNb03 at 400 K in Figure la. The time average of all three components of the order parameter is zero at 400 K, indicating that the system is in the cubic paraelectric phase. At 350 K, Figure lb, one of the components of the order freezes out and fluctuates about an average value of about 0.014. The time average of the other two components is still zero, indicating that the system is in the tetragonal phase. Note that the fluctuations of the condensed components are much smaller than those of the uncondensed components. Figures lc and Id indicate the subsequent freezing out of the other components of the order parameter in the orthorhombic and rhombohedral phases, respectively. We obtained similar results from MD simulations on BaTi03 using the effective Hamiltonian constructed by Zhong et al.[10]. Note that in the plots of the uncondensed order parameters there are rather large and long-lived excursions from the average value. These are present well away from the transition temperatures, and we associate them with the motion of chain-like structures. We will return to this important point later.
The order parameters are monitored as the system is cooled (or heated) and the transition temperatures are thus identified. Upon cooling the transition temperatures tend to be about 10 K lower than those found upon

138 H. KRAKAUER et al.
0.02
0.01
CD
CD
CÖ
cö 0.00 Q.
CD T3
-0.01
-0.02
(a)
1000 2000 Time Step
3000
CD ■*—«
CD E CO 1_
cd Q.
CD T3
(b)
0.02
0.01
0.00
-0.01
-0.02
N_/\ .„-^-'^-"^'W
^AA/"^A'
(b) Tetragonal
1000 2000 Time Step
3000
FIGURE 1 The three components of the order parameter (see text) in KNb03 in the (a) cubic phase at 400 K, (b) tetragonal phase at 350 K, (c) orthorhombic phase at 240 K, and (d) rhombohedral phase at 150 K.

PRECURSOR STRUCTURES IN FERROELECTRICS 139
0.02
0.01
o 0 E CC
cö 0.00 Q_
0 ■D
-0.01
-0.02
(c)
1000 2000 Time Step
3000
0 *-* 0 E CO i— CO
Q_ 1— 0
"O 1— o
0.02
0.01
0.00
-0.01
-0.02
(d)
1000 2000 Time Step
3000
FIGURE 1 (Continued).

140 H. KRAKAUER et al.
heating. The tetragonal-cubic transition is about the same for heating or cooling. The transition temperatures, Tc's, are presented in Table I. The MD values are an average of the cooling and heating runs, and we estimate the error in these numbers to be about 5-10K. As mentioned, we also calculated the 7Vs for BaTi03, and these are also shown and compared with experiment and the Monte Carlo results of Zhong et al.[l0]. The calculated Tc for the cubic-tetragonal transition is greatly underestimated in both materials, and the error is considerably larger in KNb03. Tc's for the R-O and O-T are in better agreement, with the R-O agreement being the best.
There are several possible reasons for this. The effective Hamiltonians retain only the lowest energy degrees of freedom. At higher temperatures the higher-energy vibrational modes may have significant interactions with the soft-modes degrees of freedom that could affect the temperature at which the transition occurs. Since the transition temperatures are higher in KNb03, the effect could be larger than in BaTi03. Another possibility is the error in the first-principles calculations of the low-energy Born-Oppenhei- mer surface. For example, the anharmonic well-depths are only 0(1 mRy) and are very sensitive to volume and strain. Zhong et al.[10] determined the parameters of Heff in BaTi03 at their calculated equilibrium lattice parameter, which was about 1% too small. In their Monte Carlo simulations, they imposed a negative pressure to keep the volume at the experimental value. We did the same in out MD simulations using their Hefr. In our first-principles calculations of KNb03, we used the Wigner exchange- correlation potential, which tends to give larger lattice parameters, and our equilibrium lattice parameter is essentially identical to the observed value. We thus obtained the parameters for HeS in KNb03 from first-principles calculations at the calculated equilibrium volume.
TABLE I Comparison of calculated and measured transition temperatures (see text), between the rhombohedral (R), orthorhombic (O), tetragonal (T) and cubic (C) phases. Temperatures are in Kelvin
R-O O-T T-C
BaTi03
MD 200 230 290
MCa 197 230 290
Experb 183 278 403
KNb03
MD 210 260 370
Exper.0 210-265 488 701
aRef. 10. bFrom Ref. 10. cSee for example, M. D. Fontana, G. Metrat, J. L. Servoin and F. Gervais, J. Phys., C 16, 483 (1984).

PRECURSOR STRUCTURES IN FERROELECTRICS 141
In our initially constructed KNDO3 HeS we observed a very broad direct transition from the cubic to the rhombohedral phase. We were not able to obtain the tetragonal or orthorhombic phases. We then recalculated the an- harmonic well-depths using the local-orbital LAPW method (LO-LAPW)fl6]
which has greater variational freedom than the standard method in materials that have valence electron states spanning two principal quantum numbers with the same orbital angular momentum. In KNb03, the Nb states fall into this category. Specifically, the electronic wavefunctions expanded about the Nb site have /= 1 angular momentum components arising from both the relatively loosely bound Nb(4/?) core states and Nb(<W) - 0(2p) bonding contributions. Unlike the tightly bound core state, the Nb(4/>) state must be treated variationally along with the other valence states. In the conventional LAPW method, the variational basis is limited in this regard. In the LO-LAPW method, extra local orbitals provide additional variational freedom. These extra orbitals are strictly localized within the muffin-tin sphere of the relevant atoms. Using this method, the calculated well depths changed by about 0.2 mRy, significantly affecting some of the parameters such as soft-mode-strain coupling. With these new parameters we obtained the results reported here.
Turning to the temperature dependent soft-mode vibrational frequencies, Figures 2(a-c) present the dynamical structure factor S(q, ui), calculated for KNb03 along [100] directions at the reduced wavevectors (a/2 IT) qx = [0.1, 0.2, 0.3,0.4, 0.5]. S(q, uS) can be measured by inelastic neutron scattering, and well-defined peaks in S(q, UJ) correspond to one-phonon absorption or emission processes from phonons with long lifetimes. Multiphonon processes and heavily damped phonons contribute to the continuum. Several features are worth noting in these figures. The higher lying LO branch dispersing downwards from about 20 THz at q = 0.1 to about 16 THz at q = 0.5 is relatively insensitive to temperature. The electric-fields arising from the long-range dipolar terms in Heg are responsible for the appearance of this LO branch split-off from the soft-mode TO branch. This cannot be directly compared with the first-principles LO branches or with experiment, because only the soft-mode TO branch in the first-principles calculations was fit in constructing Heff. It would be necessary to add extra degrees of freedom to i/eff to adequately represent these high-frequency branches. In addition, the use of the theoretically determined LDA dielectric constant (which is typically 10-20% too large) will also affect the comparison with experiment. Nevertheless, the frequency of the LO branch has the right order of magnitude compared with the first-principles calculations and experiment. For example, the highest LO first-principles phonon at T has a

142 H. KRAKAUER et al.
8.0
7.0
6.0
T = 1000 K (Cubic)
(a)
8 12 16 Frequency (THz)
+±jAl*H.M~.^f*^
24
(b)
T = 400 K (Cubic)
8 12 16 Frequency (THz)
24
FIGURE 2 KNb03 dynamical structure factor S(g, u>). The curves corresponding to the reduced wavevectors (aßix) qx= [0.1, 0.2, 0.3, 0.4, 0.5] are offset from one another vertically, the 0.1 curve appearing at the top. (a) 1000 K (cubic), (b) 400 K (cubic), (c) 230 K (orthorhombic), calculated along the (001) direction.

PRECURSOR STRUCTURES IN FERROELECTRICS 143
(c)
8 12 16 Frequency (THz)
FIGURE 2 (Continued).
24
frequency of 22.5 THz, only about 2 THz higher than in Figure 2. However, in the first-principles calculation this branch disperses slightly upward towards the X point, whereas in Figure 2 it disperses downward.
One striking feature in these figures is that the entire TO branch (there are actually two degenerate TO branches in the figure) softens by about 2 THz on cooling from 1000 K to 400 K. This is very different from the usual soft- mode picture, in which softening occurs only in the vicinity of the wavevector associated with the structural phase transition. Thus, in KNb03
one might have expected such softening to be limited to the immediate vicinity of the T (q = 0) point. Instead the entire branch softens. This is completely consistent with the first-principles LAPW linear response results previously obtained by Yu and Krakauer[1]. This revealed regions of instability in the BZ described by three mutually perpendicular interpene- trating slabs centered at T, perpendicular to the cubic axes, and extending to the BZ boundaries. The first-principles unstable TO mode is seen in Yu and Krakauer [1] to also disperse slightly upwards in frequency from Y to the X point, consistent with what is found here. In these figures the harmonically unstable first-principles TO branch is anharmonically stabilized. As expected, this anharmonic stabilization is very temperature dependent.

144 H. KRAKAUER et al.
Upon further cooling to the tetragonal phase (not shown), one of the TO branches subsequently hardens. To be precise about this, the wavevector should be specified. If the c-axis of the tetragonal phase is the z-axis, then for say q = (100), the TO mode with polarization along (010) remains soft, while the TO mode with polarization along (010) hardens. For q = (001), by contrast, both TO modes remain soft in the tetragonal phase. This can be made more clear by examining instead S(q, w) in the orthorhombic phase, Figure 2c. For the MD simulation corresponding to this figure, the condensed order parameters are Ry and Rz, while Rx is uncondensed. The wavevector in this figure is along the (001) direction, so that one of the TO modes has hardened (the one polarized along (010)) and other remains soft (the one polarized along (100)). Again, it is the entire branch that softens or hardens.
The temperature dependence of the soft-mode dispersion in KNb03 is shown in Figure 3 and compared with the 798 K cubic phase inelastic neutron scattering measurement of Holma and Chen [15). The experimental data is taken about 100 K above the cubic-tetragonal phase transition. The 400 K MD results are 30 K above the calculated transition temperature. The agreement is good below q ~ 0.2, with the theoretical TO branch showing greater dispersion for larger q. Holma and Chen state, however, that this branch was very difficult to measure, the corresponding peak being unusually broad. They ascribed this broadening to anharmonic effects. Given this uncertainty in the position of the experimental peak, the agreement in Figure 3 is satisfactory. At higher temperatures in the MD simulations, the entire TO mode hardens, as shown by the curve labelled 1000 K in Figure 3. This is a consequence of large on site anharmonic terms in the effective Hamiltonian. Qualitatively speaking, at higher temperatures, the larger vibrational amplitudes cause the system to more strongly sample the repulsive regions of the potential. By contrast, in the ground state rhombohedral phase (the curve labelled 150 K), the system is sampling the regions near the bottom of the double-well potential, and the TO mode frequency then reflects the curvature at this minimum. This results in a hardening of the condensed TO mode upon cooling below the transition temperature. This can also be seen in Figure 2c, where one of the TO modes has hardened, corresponding to a condensed component of the order parameter.
In Figure 4 we show the excellent agreement between the measured transverse acoustic branch [15] and our linear response calculation [1]. Although not directly related to the MD results presented here [The acoustic modes are approximately included in HeS only through the £/Soft-mode-stram

Holma and Chen
0.0 0.1 0.2 0.3 0.4 Wavevector in <100> Direction
0.5
FIGURE 3 Comparison of the soft-mode dispersion along the [100] direction. Filled circles are neutron scattering data from Ref. 15 in the cubic phase of KNDO3 at 789 K. Open circles are the MD simulations at the temperatures indicated. In the MD results, the system is in the cubic phase at 400 and 1000 K and in the rhombohedral phase at 150 K.
N X
CD 3 cr CD
Linear Response
Holma and Chen
0.1 0.2 0.3 0.4 Wavevector in <100> Direction
0.5
FIGURE 4 Comparison of the TA accoustic branch along the [100] direction. Filled circles are neutron scattering data from Ref. 15 in the cubic phase of KNb03 at 798 K. Open circles are first-principles linear response results from Ref.l.

146 H. KRAKAUER et al.
and t/eiastic terms in Equation (2).], the good agreement here further supports the reliability of the first-principles calculations used to construct
Hf eft- In view of the fact that an entire phonon branch softens/hardens, i.e., the
softening/hardening occurs simultaneously over large regions of the BZ, it is more illuminating to think about the mode softening in real-space, rather than in reciprocal space. To investigate the real-space character of the ferroelectric instability, we first calculate the static structure factor. Figure 5 reproduces the experimentally measured intensity from Figure 6 in Comes et al. [5] corresponding to monochromatic Mo Ka radiation. Similar intensities are observed for BaTi03 Figures 6a-6d present simulated diffuse elastic X-ray scattering intensities in BaTi03. These were calculated from the static structure factor, S(q), determined from MD simulations using Heff
from Zhong et al.[10]. Similar behavior is found in KNb03 for selected {qy =
» 'lit.
#.**!
, •♦ ,
.V'-^f,
FIGURE 5 Measured diffuse X-ray scattering in KNb03, corresponding to monochromatic Mo Ka (taken from Ref. 5). a) cubic, b) tetragonal, c) orthorhombic, and d) rhombohedral phase.

PRECURSOR STRUCTURES IN FERROELECTRICS 147
constant) lines in the plane of this figure, but we have not yet calculated the entire X-ray scattering image in this case. The plane of the figure is perpendicular to a cubic axis and to the incident X-ray. In Figure 6, the horizontal and vertical scales (-5 to 5) are in units of the distance between the crystal sample and the (simulated) recording film. The maximum value of 5 corresponds to a scattering angle of 78.7°, which is about twice as large as is observed experimentally. Due to the finite size simulation cell, which obscures some of the vertical and horizontal streaks at small scattering angle, we used the larger maximum scattering angle to more clearly bring out the streak patterns.
Cubic Phase
FIGURE 6 Calculated diffuse X-ray scattering in BaTi03, corresponding to monochromatic MoKa (see text.) The plane of the figure is perpendicular to a cubic axis and to the incident X-ray. a) cubic, b) tetragonal, c) orthorhombic, and d) rhombohedral phase.

148 H. KRAKAUER et al.
Tetragonal Phase
(b)
FIGURE 6 (Continued).
At this semi-quantitative level of comparison, the agreement is excellent, and all of the essential experimental features in Figure 5 are reproduced in Figures 6(a-d). The position and shape of these streak patterns agrees quantitatively with the experiment and, as noted by Comes et al. can be explained by scattering from disordered finite-length static chains of distorted primitive cells. As the crystal is cooled from the cubic to tetragonal phase, the circular streak patterns are seen to disappear, while the vertical and horizontal streaks remain. Upon further cooling to the orthorhombic phase, the vertical streaks disappear, and finally upon cooling to the ground state rhombohedral phase the horizontal streaks disappear as well. Corresponding to this figure, Comes et al. proposed an empirical model in

PRECURSOR STRUCTURES IN FERROELECTRICS 149
Orthorhombic Phase
FIGURE 6 (Continued).
which there is sequential ordering of chains directed along the z-axis (perpendicular to the plane of the figure) upon cooling from the cubic to tetragonal phase. The ordering of the z-axis chains corresponds to the disappearence of the incoherent scattering (circular streaks) due to randomly oriented z-chains. Subsequent ordering of the x-axis and j-axis chains corresponds to entering the orthorhombic and rhombohedral phases, with all the chains being ordered in the ground state rhombohedral phase. The ordering of the x-axis and j-axis chains corresponds to disappearance of the vertical and horizontal streak patterns, respectively. This sequence of events is also reflected in the sequential freezing of the order parameter components shown in Figure 1. Experimentally, the diffuse X-ray streaks are observed to have very weak temperature dependence within a given

150 H. KRAKAUER et al.
Rhombohedral Phase
(d)
FIGURE 6 (Continued).
phase. MD calculations of S(q) at wavevectors corresponding to the diffuse scattering also show weak temperature dependence. We return to this observation later.
The linear response calculations of Yu and Krakauer [I7] on KNb03 were first ab initio calculations to support the empirical chain model of Comes et al. by showing the existence of BZ planar instabilities. The MD simulated X-ray scattering in Figure 6 shows that this planar instability does in fact lead to the observed X-ray diffuse streak patterns further supporting the existence of disordered chains. The question of whether these chains are static or dynamic, however, still remains to be addressed.
An alternative view was suggested by Hüller [17], who proposed that a dynamic chain structure could also explain the diffuse X-ray scattering.

PRECURSOR STRUCTURES IN FERROELECTRICS 151
Evidence for this comes from recent high-resolution X-ray measurements by Holma et al. [18] Hüller proposed an empirical model with a low frequency TO branch with flat dispersion along (100) directions that could account for this type of dynamic scattering. His model is supported by the first- principles linear response calculations[I], which showed this type of anisotropic dispersion of the TO soft-mode and by the observed and MD calculated soft-mode TO dispersion shown in Figure 3.
Using our molecular dynamics simulations, we can resolve the issue of whether the chains are static or dynamic. Figure 7 shows the time dependence of the soft-mode coordinates £,-, x in the orthorhombic (230 K) phase of KNb03, for six (/, 0 ... 5) adjacent primitive cells along the x- direction. In this run, the order parameters Ry and Rz are condensed, but the average value of Rx is zero, corresponding to disordered chains along the x- direction. Chain-like correlations are evident in the correlated motion of the six soft-mode coordinates as a function of time in this figure. [Due to the use of periodic boundary conditions in the 10x10x10 simulation cell, a maximum of six atoms in a row are unique, the seventh being equivalent
0.003
0.002
§ 0.001 nuIMn c 'nm CD m\ E
CD Ü CO
0.000 ^
Q. \l CO V Q -0.001
-0.002
-0.003
T = 230 K (Ortho)
o.o 100.0 Time (x 1 e-14sec)
200.0
FIGURE 7 Time dependence of the soft-mode coordinates £I>Jt in the orthorhombic (230 K) phase of KNb03, for six (i = 0... 5) adjacent primitive cells along the x-direction (see text). Chain-like correlations are evident in the correlated motion of the six soft-mode coordinates as a function of time.

152 H. KRAKAUER et al.
to the one at - 4]. Inspection of this figure indicates that the frequency corresponding to reversal of the chain direction is about 1 THz. This figure unambiguously shows 1) the existence in real space of chains and 2) the dynamic character of the chains. Based on the width of the slab like regions of instability seen in the linear response calculations [I], the minimum length of these chains was estimated to be about 5 lattice spacings. This is qualitatively supported by the present MD simulations. We will need to employ larger simulation cells to investigate the linear extent of the chains and to better quantify these correlations.
As expected from the linear response calculations[1], the j-components of these atoms should be uncorrelated, and this is confirmed in Figure 8. Similarly if we examine the soft-mode coordinates along a j-chain (condensed in the orthorhombic phase in this simulation) in Figure 9, there is no correlation. Also note the absence of long-lived excursions from the average in Figures 8 and 9. Such long-lived excursions are present in Figure 7 and result from the relatively small chain reversal frequency. We can also attribute the long-lived excursions of the uncondensed order parameters seen in Figure 1 to the low frequency associated with this chain motion.
0.003
0.002 -
CO 0.001
c 03 E CD 0.000 O CO Q. CO Q -0.001
-0.002
-0.003 100.0
Time (x 1 e-14sec) 200.0
FIGURE 8 Time dependence of the soft-mode coordinates f,-_ y in the orthorhombic (230 K) phase of KNb03, for six (i = 0 ... 5) adjacent primitive cells along the x-direction (see text). There is no correlation of the ^-components along the (uncondensed) x-chain.

as c 0 E a> o
Q. <n Q
0.003
0.002
0.001
.0.000
-0.001
-0.002
-0.003 100.0
Time (x 1 e-14sec) 200.0
FIGURE 9 Time dependence of the soft-mode coordinates £,-, y in the orthorhombic (230 K) phase of KNb03, for six (z = 0 ... 5) adjacent primitive cells along the ^-direction (see text). There is no correlation of the ^-components along the (condensed) y-chain.
0.003
-0.003 100.0
Time (x 1 e-14sec) 200.0
FIGURE 10 Time dependence of the soft-mode coordinates £f> x in the cubic (390 K) phase of KNb03, for six (/= 0 ... 5) adjacent primitive cells along the x-direction (see text). Chain-like correlations are evident in the correlated motion of the six soft-mode coordinates as a function of time.

154 H. KRAKAUER et al.
T= 1000 K (Cubic)
^> c CD
E CD O
_C0 Q. CO
Q
0.003
0.002
0.001
0.000
-0.001
-0.002
-0.003 100.0
Time(x 1 e-14sec) 200.0
FIGURE 11 Time dependence of the soft-mode coordinates £,- x in the cubic (1000 K) phase of KNb03, for six (('= 0 ... 5) adjacent primitive cells along the x-direction (see text). Chain- like correlations are evident in the correlated motion of the six soft-mode coordinates as a function of time.
Figure 10 and Figure 11 show the x-component of the soft-mode coordinates along and x-chain in the cubic phase. The chain correlation is still evident in these figures, even as high as 1000 K. While the chain-like structures remain, the frequency corresponding to reversal of the chain direction increases as a function of temperature. Since the X-ray scattering is essentially instantaneous with respect to the chain motion, however, this accounts for the relative temperature independence of the diffuse X-ray streak patterns.
IV. CONCLUSIONS
The principal conclusion of this study is that dynamic low-frequency, ~ 0(1 THz), chain-like structures are precursors of the ferroelectric phase transitions in KNb03 and BaTi03, thus definitively ruling out static chains. This is consistent with the conclusions of Holma et al. [18], based on their

PRECURSOR STRUCTURES IN FERROELECTRICS 155
diffuse X-ray measurements. The MD simulations show that the chains are preformed well above the cubic-tetragonal phase transition temperature. These chains are defined by adjacent rows of distorted primitive cells oriented along the three cubic axes, with the atomic displacements along the chain highly correlated with one other. Displacements in different chains are uncorrelated at high temperature. The observed phase transitions corre- spond to the sequential freezing or onset of coherence of families of chains along the three cubic axes.
Acknowledgments
This research was supported by Office of Naval Research grant N00014-94- 1-1044 and N00014-97-0049. Computations were carried out at the Cornell Theory Center. We are pleased to acknowledge collaboration with K. Rabe and U. Waghmare on the construction of effective Hamiltonians. We are also pleased to acknowledge useful private communications with J. Broughton regarding the molecular dynamics algorithms.
References
[1] Yu, R. and Krakauer, H. (1995). Phys. Rev. Lett., 74, 4067. [2] Ghosez, P., Gonze, X. and Michenaud, J.-P. this proceedings. [3] LaSota, C, Wang, C.-Z., Yu, R. and Krakauer, H. Proceedings of the 4th Williamsburg
Workshop on First-Principles Calculations for Ferroelectrics, February 4-7, Williamsburg, VA (1997). Ferroelectrics, 194, 109.
[4] Comes, R., Lambert, M. and Guinier, A. (1968). Sol. State Commun., 6, 715. [5] Comes, R., Lambert, M. and Guinier, A. (1970). Ada Cryst., A26, 244. [6] Shapiro, S. M., Axe, J. D. and Shirane, G (1972). Phys. Rev., B6, 4332. [7] Fontana, M. D., Idrissi, H., Kugel, G. E. and Wojcik, K. (1991). J. Phys. Condens. Matter,
3, 8695. [8] Teslic, S., Egami, T. and Viehland, D. (1996). /. Physics and Chem. Solids, 57, 1537. [9] Stern, E. A. and Yacoby, Y. (1996). J. Physics and Chem. Solids, 57, 1449.
[10] Zhong, W., Vanderbilt, D. and Rabe, K. M. (1994). Phys. Rev. Lett., 73, 1861. [11] Rabe, K. M. and Waghmare, U. V. (1995). Phys. Rev. B, 52, 13236. [12] Krakauer, H., Yu, R., Waghmare, U. V. and Rabe, K. M. to be published. [13] Lill, J. V. and Broughton, J. (1992). Phys. Rev. B, 46, 12068; Broughton, J., private
communication. [14] Schneider, T. and Stoll, E. (1978). Phys. Rev. B, 17, 1302. [15] Holma, M. and Chen, H. (1996). J. Phys. Chem. Solids, 57, 1465. We have reversed the
assignment of the transverse acoustic and transverse optic branches near the zone boundary as given in this reference. Chen, H. has confirmed this correction, private communication.
[16] Singh, D. (1991). Phys. Rev. B, 43, 6388. [17] Hüller, A. (1969). Solid State Commun., 7, 589; ibid. Z. Physik, 220, 145 (1969). [18] Holma, M., Takesue, N. and Chen, H. (1995). Ferroelectrics, 164, 237.

Ferroelectrics, 1998, Vols. 206-207, pp. 157-1 Reprints available directly from the publisher Photocopying permitted by license only
) 1998 OPA (Overseas Publishers Association) Amsterdam B.V. Published under license
under the Gordon and Breach Science Publishers imprint.
Printed in India.
FERROELECTRIC TRANSITION IN A RANDOM FIELD: POSSIBLE
RELATION TO RELAXOR FERROELECTRICS
S. SEMENOVSKAYA and A. G. KHACHATURYAN
Department of Ceramics, Rutgers University, P.O. Box 909, Piscataway, NJ 08855-0909
(Received 7 April 1997; In final form 18 August 1997)
Ferroelectric phase transition developing in a random field of static defects is studied by the computer simulation method. The chosen free energy provides the stability of the ferroelectric phase in the absence of defects. The simulation model takes into account the transformation- induced strain and the dipole-dipole interaction. It is shown that the ferroelectric transition in a random field produces the two-phase thermoelastic metastable equilibrium rather than the single-phase ferroelectric state. The metastable state is a dispersion of ferroelectric clusters in the paraelectric matrix. The clusters formation mechanism is discussed in terms of the percolation theory. Increase in the transformation driving force transforms the cluster dispersion to the ferroelectric macrodomain state. The theoretical prediction of comparatively stable polar clusters in the paraelectric matrix in relaxor ferroelectrics provides an additional footing for the superparaelectric origin of unusual properties of the relaxor ferroelectrics.
Keywords: Relaxor ferroelectric; paraelectric matrix; clusters
1. INTRODUCTION
Since the ferroelectric transition is a particular case of the displacive (martensitic) transformation, it is useful to review some important recent results obtained for the displacive transformations and see a relevance of these results to the ferroelectric transition. The displacive transformations have several features which are difficult to explain in terms of the conventional thermodynamics of phase transformations and which usually are not observed in diffusional transformations. In particular, the displacive transformation produces in many cases the two-phase thermoelastic equilibrium. In the thermoelastic equilibrium, the retain parent phase
157

158 S. SEMENOVSKAYA AND A. G. KHACHATURYAN
co-exists with a product phase, the volume of the product phase being a function of the undercooling temperature. This phenomenon was found in both elastically constrained materials, such as polycrystals, and in elastically unconstrained single-crystals. It was mostly observed in metal alloys but recently was also reported for PbTi03 ferroelectrics[1]. Although existence of the retain phase in the constrained material could be explained by the elastic strain contribution to the free energy in terms of the conventional thermodynamics, there is still no satisfactory explanation why the equilibrium two-phase state exists in an unconstrained single crystal (in the latter case the Gibbs phase rule excludes the isobaric two-phase equilibrium).
Recently observed pre-transitional behavior is the second group of phenomena which is also hardly explained in usual terms of the conventional phase transformation thermodynamics. The pre-transitional state was observed in Fe-32at% Pd[2"4], /3-NiAl alloys [5'6], V3Si[7], ßx- AgCd[8] and other martensitic crystals within the temperature range just above the temperature Ms of the conventional martensitic transformation producing the macroscopic domains of the martensitic phase. It was observed at 10°-100°C above Ms. The microstructure of the pre- transitional state has a so-called tweed structure where structural domains of orientation variants of the product phase (sometimes within the retain phase matrix) are aligned along certain crystallographic directions. In the cubic—>tetragonal transformation, they are the (110) directions. Lowering the temperature below Ms, results in transformation of the tweed structure to the conventional single-phase polytwinned martensitic state. Thermo- dynamically, the pre-transitional state seems to be stable since it reversible reappears upon heating and cooling. As a matter of fact, the transition form the pre-transitional state to the conventional martensitic state is the micro—»macrodomain transition. It is interesting to note that the structural states similar to the pre-transitional states were also observed in ferroelectric relaxors PMN-PT and PLZT[9'10].
Back in 1983, Robertson and Wayman [5] proposed an idea that the pre- transitional state can be associated with random static defects which are the disordered solute atoms or antisite defects, Interaction of a random field generated by these defects with a displacive mode, in principle, may change the morphology of the phase transformation and even its thermodynamic behavior.
The theory of ordering in a random static field generated by static substitutional defects was proposed by Semenovskaya et al.[n]. The computer simulation of the tetragonal—s-orthorhombic phase transforma-

FERROELECTRIC TRANSITION IN RANDOM FIELD 159
tion in a doped high-temperature superconducting oxide YBa2Cu306+^ demonstrated that the combined effect of the randomly distributed immobile dopant atoms and the transformation-induced misfit strain does produce the stable tweed state. This result agrees with observations of the stable tweed in YBa2 (Cu, M)306+A-where M = Al, Co, Ni[2_14]. Recently a similar result was obtained by Kartha et a/.[15] whose computer simulation of the proper martensitic transformation in a random static Gaussian field resulted in a stable tweed state with the spin-glass features*.
The observed non-trivial effects mentioned above, which presumably are associated with the random static field of lattice defects, were a focus of interest of many researchers. Since the ferroelectric transformation is a particular case of the displacive transformation, there is no reason to think a random static field of the lattice defects would not produce similar drastic structural and thermodynamic changes. Given the electric nature of ferroelectrics, such effects may have very interesting and non-trivial implications.
The relaxor ferroelectrics seem to give an example of the ferroelectric state whose specific features are associated with random static defects. The relaxor ferroelectrics have a broad maximum of the dielectric constant, sometimes within a range of hundreds degrees, and a low frequency hysteresis. Macroscopically, the relaxors have the symmetry of a nonpolar phase, i.e. the positions of X-ray diffraction maxima correspond to the high- symmetry nonpolar phase. However locally, the symmetry corresponds to that of the polar ferroelectric phase which means that the system maintains local polarization up to comparatively high temperatures. Another important feature is that these materials very often show the remarkably high coefficients of the electro-mechanical coupling.
There is a consensus that unusual physical properties of the relaxor ferroelectrics are associated with the defects. The idea that the relaxor behavior of the ferroelectrics is caused by random concentration hetero- geneities locally affecting the transformation point, was proposed more than three decades ago by Smolensky after his discovery of the relaxor ferroelectrics[17]. Electron microscopy studies of Pb(Mg, Nb)03 (PMN) relaxor by Chen, Chan and Harmer [18] have shown that the material has
The earlier result'161 where the stable tweed state was obtained in a random system with the infinte elastic anistropy is not very convincing. The infinite elastic anistropy is the unrealistic assumption which is equivalent to the kinematic constraint that the resultant morphology is a superposition of one-dimensional modulations along the {110) directions. Such a superposition, by its definition, always produces the tweed-like morphology.

160 S. SEMENOVSKAYA AND A. G. KHACHATURYAN
randomly distributed atomic segregations which seem to be associated with concentration heterogeneities in the B sublattice.
A "chemical" short-range order (sro), which can be also considered as a system of antiphase ordered domains of the submicroscopic size (the typical domain size is of the order of interatomic distances, ~ 0.1 -1 nm size) is also a source of a random static field. This field may also result in the relaxor behavior[19]. The latter conclusion is supported by the fact that developing of sro into the long-range order (lro), which is characterized by large atomically ordered antiphase domains, transforms the relaxor ferroelectric to the conventional one.
Electron microscopic studies of PMN[20] and PLZT ferroelectrics[21'22]
have shown that the microstructure of the relaxor material is formed by polar microdomains in the paraelectric matrix. Although cooling of the system results in growing of the polar domains, it usually does not transform the ferroelectric/paraelectric mixture into the single-phase ferroelectric state. Only the application of the external electric field does[23' 24]. However, there are the exceptions. The transition of the two-phase state, stable at higher temperatures, to the single-phase state in the hot-stage TEM observations was reported by Dai, DiGiovanni and Viehland[25] and Dai, Xu and Viehland[22] for PZLT. Lowering the temperature results in growth of ferroelectric domains and their rearrangement into the tweed-like pattern which leads to losing the relaxor properties. Finally at low temperature, the material becomes a conventional single-phase ferroelectric whose micro- structure consists of normal macroscopic ferroelectric domains. Similar results were obtained by Xu et al.[26] for the Ti-doped PMN.
These TEM data actually support the superparaelectric mechanism proposed by Cross [27] to explain the relaxor properties of ferroelectrics. According to this mechanism, a small ferroelectric cluster behaves as a large superferroelectric dipole moment, flipping between different directions. This results in a superparaelectric effect responsible for the high polarizability of the crystal and thus for very high values of the dielectric constant. However, the superparaelectric effect may occur only if the polar clusters are separated by a nonpolar matrix. What this theory misses, is the explanation why a mixture of the paraelectric phase and ferroelectric clusters is stable - according to the conventional thermodynamics, the two-phase mixture should transform to a single-phase ferroelectric state since the free energy of the ferroelectric phase is lower than that of the paraelectric matrix.
It is the purpose of this study to investigate the effect of a random field on the ferroelectric transformation, with expectation that the random field does result in appearance of a stable two-phase dispersion of ferroelectric clusters

FERROELECTRIC TRANSITION IN RANDOM FIELD 161
in the paraelectric matrix, similar to the tweed-like dispersion observed in the pre-martensitic state. This two-phase coexistence would profoundly alter the dielectric, electromechanic and transformation properties of ferroelectrics. The investigation was carried out by the computer simulation technique.
To perform the simulation, we have to formulate a model which takes into account the interaction of the transformation mode with random static defects, the transformation-induced strain caused by the crystal lattice misfit and the dipole-dipole interaction. This can be done by modification of our theory of coherent diffusionless and coherent diffusional transformations with the transformation-induced strain in an ideal crystal [28'29]. The modification was recently made for the case of the ferroelastic transition in the random field of static defects [30\ The most interesting result obtained in[30] was the proof that under certain conditions (strong coupling between the defects and the long-range order parameters and a large value of the strain energy generated by the crystal lattice misfit) the displacive transition produces a stable two-phase state rather than the single-phase state which would be formed without the defects. The microstructure of the two-phase state is a dispersion of domains of orientation variants imbedded into the retain phase matrix. Change of the thermodynamic parameters affects the volume fraction of the retain phase.
An application of this approach to the ferroelectric materials with random defects is straightforward because the ferroelectric transition is a particular case of the displacive transformation. This application requires the extension of the theory[30] by incorporating the dipole-dipole interaction and the interaction of dipoles with the external electric field. If the ferroelectric transition in random ferroelectrics, similarly to the ferroelastic transition, produces a stable two-phase state with clusters of the ferroelectric phase within the retain paraelectric phase, these clusters may be responsible for the superparaelectric effect.
2. MODEL
We consider the generic model of the cubic —>• tetragonal coherent transformation. The transformation does not affect the translational symmetry of the crystal, i.e. the irreducible space group representation generating the phase transformation is characterized by k = 0. For simplicity we assume the 2-D model of the "square"—» "rectangular" transition imitating the cubic —> tetragonal transition in 3-D. We assume that there are two components of the displacements on the coordinate system parallel to

162 S. SEMENOVSKAYA AND A. G. KHACHATURYAN
the [10] and [01] axes of the paraelectric cubic phase, r)U r\2. They are the lro parameters. The dipole moment per unit cell d is proportional to the displacements and thus d = e*(?71, rji) where e* is the efficient charge of the mode. The local polarization, which is the dipole moment of the volume unit, is P(r) = (Pi, P2) = Po07i, Vi) where Pi = P0»7i, P2 = Po% are the polarization vector components, P0 is the equilibrium polarization, r is the coordinate vector of a point.
A typical example illustrating such a system is the ferroelectric transition in PbTi03. For example, a displacement of Ti4+ atoms along one of the (100) directions transforms the unit cell symmetry from the cubic to tetragonal one and it produces the dipole moment along the displacement direction which is proportional to the absolute value of the displacement.
2.1. Chemical Free Energy
The non-equilibrium "chemical" (stress-free) free energy of the hetero- geneous state is described by the Landau free energy functional
-» chem — für I- \ß{Vmf + \ß{^mf +Am,m) (i)
where ß is a positive coefficient at the gradient terms, V; = {d/dri) is the differential operator. As usual, the gradient terms in (1) provide the stability of the stable and metastable homogeneous states against infinitesimal heterogeneities of lro parameters. The "local" chemical free energy AVu r)2) in (1) is approximated by the Landau expansion with respect to the symmetry invariants:
Am,m) = ^ifo(r), + V(!)l) ~\Mri{r)\ + V(r)42) + ^faM? + ^)2)2
+ l-A4(V(rfl) + „(r$3 (2)
where Au A2, A3 and A4 are the material's constants depending on temperature and composition of the system. They provide a quartet of degenerated minima of f(m, V2) at four points (r)U r)2) = ± (Vo, 0) and ± (0, 770) corresponding to two orientation variants of the "rectangular" product phase and two antiphase states of each of them, distinguished by signs. To describe the first-order transition, A2, A3 and A4 should be positive. If Ax > 0, the parent phase is metastable. Otherwise, if Ax < 0, the parent phase is unstable with respect to infinitesimal fluctuations of lro

FERROELECTRIC TRANSITION IN RANDOM FIELD 163
parameters. Introduction of randomly distributed defects, in general, affects all four constants Au A2, A3 and A4. However, because the constant Ax
plays an especially important role, its defect-induced dependence on coordinates is the most significant. Because of that we may assume that only the constant A\ has the coordinate dependence caused by interaction of the lro parameters with static defects. This dependence is assumed to be
Al(r)=A°l+bc{T) (3)
where A ° is the constant related to the defect-free crystal, A \ = a(T- T°_), a > 0 is a constant, Tis the temperature, T°_ is the temperature of the defect-free crystal below which the metastable parent phase loses the stability with respect to infinitesimal fluctuations of lro parameters, c (r) is a concentration profile describing a random distribution of static defects (it is not affected by the transformation), b is the coupling coefficient describing the interaction between defects and the transformation modes r\p. The coupling constant b characterizes the effect of renormalization of the instability tempertaure T°_ by the defects. It is determined as
b = -a~ (4) dc
where c is the average concentration of defects, T- is the instability temperature renormalized by the defects. According to Equation (4), the sharper is the dependence of the transition temperature on the defect con- figuration, the greater is the "strength" of defects and the more significant is their effect on the phase transformation. We consider the case of b > 0 which means that a defect locally supresses the ferroelectric transition by increasing the local free energy around the defect.
In this study, we consider the case of the first-order transition within the temperature range T < T0 where T0 is the equilibrium temperature of the para <-» ferroelectric transition in the defect-free crystal. The transformation driving force Af(T) within this range is negative (Af(T) is the difference between the free energy of the equilibrium ferroelctric phase, /(r?0, 0), and the free energy of the metastable/unstable paraelectric phase, /(0,0)). There- fore, in the absence of defects, locally supressing the transformation (b > 0), the system should fully transform to the ferroelectric state, However, it is shown in this study that the ferroelectric transition does not necessary go to a completion in the presence of defects with b > 0.

164 S. SEMENOVSKAYA AND A. G. KHACHATURYAN
2.2. Elastic Energy
Appearance of the lro parameters at a point r produces the stress-free strain e?-(r) (the transformation-induced strain characterizing the incompatibility of the transformed and parent lattices). The stress-free strain is responsible for the crystal lattice misfit. As follows from the system symmetry, the first non-vanishing terms of the expansion of the stress-free strain in a Taylor series with respect to the lro parameters are quadratic and have a form
ev(r)=ef(l)V(r)2 + ef(2)V(r)22 (5)
where ef(l) = e0(l
0 f) and ef(r)(2) = £0(l
0 °{) are the constants tensors, £0 is the value of the transformation shear. Therefore, the stress-free strain is described by the lro parameter profiles in accordance with Equation (5). The coherency strain energy caused by the crystal lattice misfit e°(r) contributes to the free energy. This contribution is given by the equation [29]:
EQ + E „lax (6)
where
£o4pEEE>«!w/^(^;(ry2 2 2
EX p=\ q=\
X 2 J_ r A2
(7)
' relax — « 1 p=\ q=\ EE/(02^("){^(^)}k{^(M)K (8)
cyici is the elastic modulus tensor,
d3k
In Equation (8)
{^(')}k = /^W eXP(/kr)"(27r)3
Bpq(e)=ei4(p)il(e)jkoD
kl(q)el (9)
where k is the wave vector defined in the reciprocal space and e = k/k, Mp) = Cjjkie'fip) and Q (e)y is a Green function tensor which is inverse to the tensor fi(e)^1 = c^e^e/- In Equations (6)-(8), the contribution of a macroscopic shape relaxation is justified if a system, where the transforma- tion occurs, is macroscopically constrained. The latter is the case if the

FERROELECTRIC TRANSITION IN RANDOM FIELD 165
system which we consider is just a single grain in a non-textured polycrystalline sample. If the system is not constrained (single-crystal sample with unloaded boundaries), i.e. is able to undergo a macroscopic shape relaxation, only a small modification of Equation (6) is required.
2.3. Dipole-Dipole Interaction
If the displacive transformation is the ferroelectric transition, the displacive mode ?7(r) = (?7(r)i, r/(r)2) generates the polarization P(r) = P0?7(r). The spatially heterogeneous polarization P(r) raises the dipole-dipole interac- tion. This interaction consists of two terms, the dipole-dipole interaction between the polarization heterogeneities within the sample (interaction between domains) and the dipole interaction with the depolarization field caused by the surface charges.
To calculate the energy of the dipole-dipole interaction within the sample, the polarization on the external boundary is assumed to be zero (Vp(Th **) — 0>rs characterizes a point on the boundary). Then, as shown inf31], the Fourier representation of the dipole-dipole interaction energy is determined by equation
^^EE/^T^' t)}Mr>t)Vk p=\ q=x ■> (2TT)
J I
lirPl f d2k | k{-n(r, 0}„ '2
(2TT)2 k2
(10)
where the point k = 0 is excluded from the integration and
/d2k VpW exP(*'kr)7TT2
To take into account the polarization on the external surface of the sample, we have considered the effect of the surface charges. The normal component of the polarization vector P (r|) on the surface of the sample generates the surface charges whose density is P {tg)d (dS is the surface element). These charges produce the depolarization field, which is approximated as Poß(vP) where fi is the depolarization factor, (r]p) is the spatial average of the lro parameter r]p. This approximation is valid for a macroscopically homogeneous system of ferroelectric domains whose sizes are much smaller than the system size. The energy contribution caused by

166 S. SEMENOVSKAYA AND A. G. KHACHATURYAN
interaction of all dipole moments with the depolarization field can be
presented as
^depoi = liP\ ^2(VP) / VP(r, t) d2t p=\ J
The interaction of the dipole moments with the applied electric field £ =
(£,, £2) is p=2 p=z ,
P=\ J
2.4. The Stochastic Field Kinetic Equation
To describe the temporal evolution of the mesoscopic domain micro- structure, we employ the Time-Dependent Stochastic Field equation which we previously used in[29,30]. This equation is
*^ = -MlT7-K + i*™ P = X>2 (11) dt 6r)p(r, t)
where ^(r, t) is a random noise meeting the dissipation-fluctuation theorem, t is time, M is the kinetic coefficient. The total free energy functional F in
(11) is given by equation
F=Fchevn+Ea+Ed^+ßP2QJ2{vp) fvpir^i-Po^Ep [rjpii^ä1! (12) p=\ J P=I
J
which is the sum of the "chemical" free energy (1), elastic strain energy (6), the electrostatic energies Ed_d+Edepoi +Ezpph associated with the polariza- tion heterogeneity, the depolarization field and with the external electric field £ (the fifth term in (12)).
Taking the variational derivative of (12) in (11) gives the kinetic equation
dyP(r,t) dt
= -M -ßArlp(r,t)+^+2Vp(ij)cijklef(p)f^e0°(q)V2
q(T,t) 0rIP q=\
+2^y;/^^K(r,0}kexp(ikr)+/^(^)-/'o^ °PtJ (2TT)
2 & J
(13)

FERROELECTRIC TRANSITION IN RANDOM FIELD 167
where A is the Laplacian. The further simplification of the Stochastic Field Kinetic Equation (13) can be achieved by using the isotropic elasticity assumption. However, as shown in this work and previous study'301, even with this simplification, the model still reproduces the main features of the random system.
For the elastically isotropic continuum
°Hp) = c(iklef(p) = 2Ge'*>(p)
W'-hfa-wh.
(14a)
(14b)
where e = k/fc is the unit vector along k, 6y is the Kronecker symbol, G is the shear modulus and v is the Poisson ratio. With definition of the tensors Sy°(p) in (5), Equations (14a) and (14b) give the 2x2 matrix Bpq(e) defined in (9):
Bpq(e)=4Ge20
(e ,2^2'
2(1 - V)
1 -1
-1 (15)
With (14a) and (15), Equation (13) can be rewritten in the dimensionless form
dyP(r\ f) dt*
<j>Ar* (Vp(r*, f)) + df*
"^ • ■ " ■ dVp
±2(Vp(r*, ntfir*, t*) -V2
2(r*,f)}T
T2Cr,p(r*,n / —2 J-oo J-oo Z7T
2\2l i K - 4) 2{\-v){k\ + ,4f\
[{vKr*,nK-{V2
2(r*,t*U exp(i«r*)
+2.\± r r^iL^^if, nh exp(^) ~f J-oo J-oo (2w) K
+ \(ß(r,p) - e*. (16)
where the upper and the bottom signs of the ± and =p symbols are related to the indexes p-\ and p = 2, respectively, and the definitions e\ = k\\k and e2 = k2\k are used. In Equation (16), f is the reduced time defined as t* = M\Af\t, Af is the transformation driving force, r* =t/£ is reduced

168 S. SEMENOVSKAYA AND A. G. KHACHATURYAN
coordinate vector, I is the length of an increment of the computational grid, K = kt is reduced wave vector, Ar. = (d2/drl2) + (d2/dr*2
2) is the Laplacian in the reduced coordinates, £ * = £ P0 is the reduced external electric field, £' (r*, t*) = £p(r)/M\ A/| is the reduced noise,
- - ß (17) Y I A/I ^2
C = 4_^£i (18) ^ |A/| l '
P2
x=m (19)
are the dimensionless constants. The parameter <f> characterizes the real lengthscale of our simulation because it depends on the length I of an increment of the computational grid. The parameter (, which is the ratio of the typical elastic energy to the transformation driving force A/ determines the contribution of the strain energy to the transformation kinetics and thermodynamics. The parameter A characterizes the role of the electrostatic dipole-dipole interaction. In Equation (16),
^l = ^r^ = al(r*)r]p-a2Vl + a3(V2+V
2)Vp+a4(r,2+V2)2VP (20)
Comparing (20) with the definition off(j}U r)2) in (2) gives: a2 = A2/\Af\, a3 = A3/\Af\, a4 = A4/\Af\. The definition of ^(r*) in (3) gives
ai(r*) = ^i(r*)/|A/|=fl? + 7c(0 (21)
where the parameter 7,
7 = VI A/I (22)
is the reduced "strength" of the defect characterizing the strength of its interaction with the lro parameters r)p. The function öi(r*) defined by (21) is the fixed random function reflecting the location of defects. All new transformation features, associated with the randomly distributed defects, actually appear due to the random term ax(t*)rip in (20). It enters Equation (16) through the thermodynamic force (df*/drjp).
Although the typical strain energy Gel and coupling parameter b have a weak temperature dependence, which we neglected, the corresponding

FERROELECTRIC TRANSITION IN RANDOM FIELD 169
reduced parameters ( and 7 are sharply dependent on the temperature. Indeed, as follows from definition of the first-order transition in the defect-free crystal, the transformation driving force vanishes at the transition temperature T0, i.e. Af(T0)
= 0. Since Af(T) is in the denominators of definitions of C, 7 and A in (18), (22) and (19), the parameters C, 7 and A sharply increase approaching the infinity when the temperature T increases toward T0.
Nonlinear integro-differential equation (16) with definition (21) for fli(r*) describes the development of ferroelectric domains from the paraelectric parent phase in a random field of static defects. It explicitly takes into account two main effects determining the mesoscopic domain pattern of the ferroelectric crystal: the elastic strain generated due to the crystal lattice misfit (between different orientation variants of domains and between the domains and the paraelectric parent phase) and the electrostatic dipole- dipole interaction. Equation (16) is quite general. If A = 0, it describes a particular case of the displacive ferroelastic transformation developing without polarization. If C = 0, it describes a pure ferroelectric transition developing without the elastic strain.
3. DEVELOPMENT OF FERROELECTRIC DOMAINS IN A RANDOM SYSTEM. SIMULATION
To investigate the specifics of the paraelectric—»ferroelectric transition in a static random field of lattice defects, we performed the computer simulation. The simulation was carried out by the numerical solution of Equation (16) with using the Euler algorithm with respect to the reduced time f (At* = 0.001). The initial condition was r]p(r*,t* = 0) = 0. It describes the homo- geneous paraelectric state "quenched" into the stability field of the defect- free ferroelectric phase where the paraelectric state starts to evolve. To speed up the beginning of the kinetic process, we used large fluctuations £p (r*, f)' during the short time t*= 0.6 which then were decreased by the factor 10. The fluctuations were produced by a random number generator.
The computational cell has 256x256 grid sites, the periodical boundary conditions were applied. To simulate the static point defects, we introduced the fixed function c(r*) which assumes the value 1 if a grid site r* is occupied by a defect and 0 otherwise. The function was obtained by a random number generator. Then the function c(r*) (it enters Equation (16) through Equation (21)) was modified by being "smeared" over a grid cell where each defect is located. The "smearing" is achieved by using the new function

170 S. SEMENOVSKAYA AND A. G. KHACHATURYAN
c(r*)', instead of c(r*), where c(r*)' is the back Fourier transform of the function c(K)exp(-cr2K2) and C(K) is the Fourier transform of c(r*). To minimize the "grid" effect, the function Ar» (r)P{r*,t*)) (describing the gradient term in Equation (16)) was calculated as the back Fourier transform the function -K2{r}g(r*, t*)}K exp(-a2K2), where {rjg(r*,t*)}K
is the Fourier transform of t]p (r*, /*)• This procedure is asymptotically accurate for the considered case of smooth heterogeneities characterized by small n = k£<^l where £ is the grid increment length. Indeed, at the latter condition and with the parameter a2= 0.01 that we used, exp(-o-V) « 1.
The solution of the kinetic Equation (16) gives the lro parameter profiles rjp (r*, f) = P0 (771 (r*, f, % (r*, t*))) at the reduced time moment f. Some of the results, obtained for the parameters 0 = 8.88, A = 4ir, p = 2w. £ * = 0 and
CO
03-
02
0.1
A
,a
200 WO 600 800 1000
~f FIGURE 1 Temporal evolution of the volume fraction u of the ferroelectric phase "a" curve - during the "low-temperature annealing" of the homogeneous paraelectric phase "quenched" into the stability field of the defect-free ferroelectric phase, "d" curve - during the "higher- temperature annealing" of the single-phase ferroelectric state (shown on Fig. 2c). Micro- structures corresponding to the saturation points a and d on these curves are shown on Figure 2a and Figure 2d; ui(f)= l-wpar (/*) where wpar (/*) is the fraction of the paraelectric phase. Average concentration of defects c = 0.2, values of parameters 7 and C entering Equation (16) are 7 = 30, C=1.4 ("a" curve) and 7 = 75, ( = 3.5 ("d" curve). The computational cell is 256x256.

FERROELECTRIC TRANSITION IN RANDOM FIELD 171
FIGURE 2 Stable microstructures formed in the random field of static defects (concentration c = 0.20). The sequence a->b->c^d demonstrates the change of microstructure at the "cooling- heating" cycle and the temperature hysteresis. The microstructures were obtained as the asymptotic solutions t]p (r*, /*—>co) of the Equation (16); (a) the two-phase dispersion, obtained by "quenching" (plus "annealing") of the homogeneous paraelectric phase into the stability field of the defect-free ferroelectric phase (7 = 30, C = 1 -4); (b) the mixture of imperfect 90° and 180° ferroelectric domains with a smalll amount (~7%) of the retain paraelectric phase, obtained by "quenching" (plus "annealing") of the microstructure (a) at 7 = 20, ( = 1.4. These parameters correspond to a greater driving force and imitate the lower temperature; (c) the single-phase ferroelectric state (90° and 180° domains), obtained by "quenching" (plus "annealing") of the microstructure (b) at 7 = 5, (=1.4. This change of parameters imitates the lower temperature than that of the microstructure (b); (d) the two-phase dispersion, obtained by bringing the single-phase ferroelectric state (c) to the state characterized by the parameters 7 = 75, C = 3.5 and "annealing" it at this state. The procedure imitates the "overheating" of the ferroelectric state (c) above the level of parameters which resulted in the microstructure (a). The simulated dispersion of ferroelectric clusters in the paraelectric matrix is similar to the microstructure (a). Black, dark gray, white and light gray areas describe four types of ferroelectric domains with different orientations of polarization vector (shown by arrows on Figure c). Gray color on Figures (a), (b) and (d) describes the paraelectric matrix. All microstuctures are stable, they correspond to the saturations points on the time dependences u(f) and F(l*) (F is the total free energy). The microstructures (a) and (d) correspond to the saturations points "a" and "d" on Figure 1. The computational cell is 256x256.
different values of the strain energy parameter C and the defect coupling parameter 7 = Z>/|A/| are presented on Figures 1 -2. The average concentra- tion of the static defects was assumed to be c = 0.2. The expansion

172 S. SEMENOVSKAYA AND A. G. KHACHATURYAN
coefficients of the "local" chemical free energy/*^, r?2) (see Eqs. (2), (20),
(21)) were
a°1=A°l/\Af\=-0.35, a2 = A2/ \ A/ | = 30,
a3 = A3/\Af\ = l9, a* = ^4/I A/I = 10
The free energy/*(T?I, r)2) minima for the defect-free crystal {a\{r*) = a\) with these coefficients describe four types of energetically equivalent ferroelectric domains of the stable ferroelectric phase whose polarization vectors are along one of the directions ± [10] and ± [01].
Figure 2 visualizes the asymptotic solution r\p (f, f) of Equation (16) at large time f —> oo when the system ceases to evolve and the total free energy F starts to fluctuate around a saturation value rather than to decrease. Attainment of the saturation is illustrated by Figure 1 presenting the evolution of the volume fraction UJ of the ferroelectric phase for two sets of parameters ( and 7 : (=1.4 and 7 = 30 (curve a) and C = 3-5 and 7 = 75
(curve d). The to value was determined as Lü=l-ujpar where wpar is the volume fraction of the paraelectric phase determined as the area where (V2i + V2) < 0-01- The microstructures corresponding to the finally reached saturation points "a" and "d" are shown in Figures 2a and 2d.
The ho parameter profiles, formed when the corresponding curves w vs t* (Fig. 1) reach their saturation, describe the stable mesoscopic domain structures (Fig. (2))r*) = (77, (r*), rj2 (r*)) (and thus the polarization vector P(r*) = P0?7(r*)) is directed either along the ±[10] or ±[01] directions. Depending on the direction of P(r*), we have one of the four possible ferroelectric domains which we visualize by four shadows of gray: black if 77 = (0,77) at a point r* (the polarization vector is along the positive direction of the j>-axis), dark gray if r? = (0, -77) (the polarization vector is along the negative direction of the j-axis), light gray if -q = (-77, 0) (the polarization vector is along the negative direction of the x-axis), and white if 77 = (77, 0) (the polarization vector is along the positive direction of the x-axis). The final 5th shadow of gray, between the dark gray and light gray, presents the regions where (77 \ ± 77^) < 0.01 or 77 « 0. In this case the polarization is close to zero and thus this gray area describes the paraelectric phase. It is shown in Figures 2a, d by a gray background. The arrows in Figure 2c designate the relation between the direction of the polarization vector and the intensity of gray color visualizing domains with this polarization direction.
Figure 2 shows the change of microstructure at the "cooling-heating" cycle which was started from the paraelectric phase. The "equilibrium"

FERROELECTRIC TRANSITION IN RANDOM FIELD 173
structure on Figure 2a (corresponding to the point "a" on Fig. 1) is a result of "annealing" of the paraelectric phase at low temperature T<T0 (T0 is the paraelectric-ferroelectric transition temperature in the absence of defects). It shows a stable dispersion of ferroelectric clusters in the paraelectric matrix. Subsequent lowering the temperature ((a)—>(b)-^(c) on Fig. 2), which increases the transformation dirving force \Af(T)\, can be modelled by gradual decrease of the coupling parameter 7. The decrease of 7 from 7 = 30 (Fig. 2a) to 7 = 20 (Fig. 2b) and then to 7 = 5 (Fig. 2c) results in the complete transformation of the paraelectric phase into the ferroelectric phase. The resulting single-phase microstructure (Fig. 2c) is formed by alternating 90° ferroelectric domains, each of them, in turn, consisting of 180° domains.
The computer simulation showed that the two-phase structure of (Fig. 2a) is not fully reversible. Indeed, "heating" of the single-phase structure (Fig. 2c) back to the values of the parameters corresponding to the structure on Figure 2a (i.e., returning to the parameter 7 = 30 of the structure on Fig. 2a) did no change the single-phase structure (Fig. 2c). However, using a more intensive "heating", by increasing both parameters 7 and £ to values (= 3.5 and 7 = 75, did produce the structure similar to that of (Fig. 2a), i.e., the two-phase dispersion consisting of ferroelectric clusters within the para- electric matrix. This situation where "overheating" of the single-phase ferroelectric state (Fig. 2c) is needed to obtain the structure (Fig. 2d) similar to the structure (Fig. 2a) is actually a manifestation of the temperature transformation hysteresis. We emphasize again that each of the four structures presented in Figure 2 corresponds to the state of saturation of dependences uj(t*) and F(f) is the total free energy at the time t*.
Results presented in Figures 1, 2 show that there is a temperature range adjacent to T0 at T<T0 where the two-phase dispersion of ferroelectric clusters in the paraelectric matrix is stable. This range can be attributed to the pre-transitional region.
4. DISCUSSION
As we mentioned in Introduction, there is a growing evidence accumulated in many studies of the martensitic and ferroelectric transitions that static defects which are naturally "frozen" in the crystal lattice may drastically alter the transformation kinetics, thermodynamics and mesoscopic micro- structure. Good examples of this are the pre-transitional behavior observed

174 S. SEMENOVSKAYA AND A. G. KHACHATURYAN
in martensitic crystals [2~8] and the two-phase states observed in ferro- electrics11, 9' 10' 20~22]. In all these cases there is a randomness produced by an atomic disorder. However, there are no conclusive arguments which would fully reveal the mechanisms responsible for stability of the two-phase equilibrium dispersions in these systems. A purpose of this study was to develop the theory which would be able to explain the origin of the two- phase coexistence in ferroelectric crystals and to relate this mixed state with the special properties of relaxor ferroelectrics. We tried to design a "clear" computer "experiment" which would allow us to investigate the influence of random static defects on the paraelectric^ferroelectric transition. A significant advantage of such an approach is that this "experiment" can be performed in a quite controllable fashion, unattainable in a real experiment. In a computer simulation, the thermodynamic and structural parameters of the system can be varied so that a contribution of concurrent effects to the transformation dynamics can be singled out and the effects obscuring the influence of static defects can be excluded.
The first step to reach this objective was developing a sufficiently realistic model of the displacive transformation which would be able to take into account the main factors. They are (i) the transformation-induced strain caused by the crystal lattice misfit between the different structural domains of the transformed phase and between the domains and the parent pahse, (ii) the electrostatic dipole-dipole interaction induced by heterogeneities in the spontaneous polarization and iii) the static defects interacting with the displacive transformation mode. The mathematical framework of this model, the Stochastic Field Kinetic Equation, is the extension of the phenome- nological Time-Dependent Ginzburg-Landau kinetic equation which was formulated in our earlier work for the diffusionless transformation128 _30].
We considered a paraelectric^ferroelectric transition which always goes to completion without defects (in the absence of defects, the transition produces the ferroelectric single-phase state consisting of the 90° and 180° ferroelectric domains). This choice of a system guarantees that the retain paraelectric phase, if we obtain any, is associated only with the defects. It was found that introduction of the static defects, locally supressing the transformation, may completely change the entire transformation dynamics and thermodynamics (instead of the single-phase ferroelectric or single-phase paraelectric states, the two-phase equilibrium forms). However, this change occurs only if the transformation in a static random field is accompanied by the dipole-dipole like interactions, viz, by the interaction between electric dipoles and/or between the elastic dipoles. Without the infinite-range

FERROELECTRIC TRANSITION IN RANDOM FIELD 175
dipole-dipole like interactions, the random system behaves in a conven- tional way, it fully transforms to the ferroelectric state upon "cooling".
Our recent computer simulation'321 of the ferroelectric transformation in a static random field, developing without the misfit-induced strain, showed that the presence of only the electric dipole-dipole interaction is sufficient to produce the same effects as those reported in this paper. Absence of the strain effects just changes the morphology of the two-phase dispersions and the ferroelectric domains pattern.
It is found in this study that a random static field in combination with the dipole-dipole like interactions results in a situation where the system loses its ergodicity. The structure produced by the transformation becomes dependent on the initial conditions, i.e. the system becomes path-dependent. A natural consequence of this circumstances is the temperature transforma- tion hysteresis obtained in the simulation.
This unusual behavior is illustrated by Figure 2 which shows the sequence of microstructures obtained in the "cooling-heating" cycle started from the homogeneous paraelectric phase. The first step of the cycle - "quenching" the paraelectric phase into the stability field of the defect-free ferroelectric phase (followed by "annealing") - produced a stable dispersion of ferro- electric phase clusters (domains) within the paraelectric retain phase (Fig. 2a). It is important that these ferroelectric domains are in the equilibrium with the retain phase, the latter, in particular, is illustrated by the curve "a" in Figure 1 which describes developing of the transformation during the "annealing" in terms of dependence of the volume fraction u> of the ferroelectric phase on the reduced time t*. This dependence demonstrates that the volume fraction u> does not reach the value 100% required to complete the transformation but, instead, it reaches the saturation value ~ 13% (point a). The subsequent "annealing" (beyond the point a) did not change effectively the volume fraction tdf) and total free energy F(T*). Both functions start to fluctuate around the equilibrium values rather than to change monotoneously. That is, the system ceases to evolve further. The obtained microstructure (corresponding to the point a) shown on Figure 2a is stable also in a sense that it does not change irrespective of the fluctuation level ^(r*, f) in Equation (16).
Increase in the transformation driving force, simulating the further "cooling" of the structure in Figure 2a, results in increase of the volume fraction UJ of the ferroelectric phase from ~13% to ~93%. The corresponding microstructure is shown in Figure 2b. The two-phase co- existence illustrated by Figure 2b is also stable, in the same way as the

176 S. SEMENOVSKAYA AND A. G. KHACHATURYAN
structure on Figure 2a. Further increase in the transformation driving force transforms the two-phase state in Figure 2b into the conventional single- phase domain state (w~99%) shown in Figure 2c. It consists of 90° domains which, in turn, are composed of 180° domains.
The inverse process, reducing the transformation driving force (it mimics heating towards the transition temperature T0 of the system without defects) transforms the single-phase domain state shown in Figure 2c. This "heating" restores the two-phase state formed by the ferroelectric clusters in the paraelectric phase. This structure is shown in Figure 2d. The curve d in Figure 1 indicates the reduction of the volume fraction to of the ferroelectric phase during the "high-temperature annealing". The volume fraction of the ferroelectric phase is reduced from about 100% to the value ~28% (the saturation point d).
At this point one important comment should be made. In the ergodic system satisfying the conventional Gibbs thermodynamics case, the cooling- heating cycle must restore the initial equilibrium state. Applying this statement to our system would give us the following. If the single-phase ferroelectric structure obtained by "cooling" (shown on Fig. 2c) were "heated" and "annealed" at the values of the parameters corresponding to the values producing the microstructure of Figure 2a. However, this is not the case for our system. The simulation showed that such "annealing" does not restore the structure in Figure 2a, irrespective of the "annealing" time and fluctuations level. In fact, it does not affect the structure of Figure 2c in any meaningful way. The inverse process of the transformation of the single- phase ferroelectric structure, shown on Figure 2c, into the two-phase paraelectric/ferroelectric mixture, starts only if the system is considerably "overheated", i.e. its transformation driving force is significantly reduced with respect to the value producing the microstructure in Figure 2a. The two-phase microstructure obtained upon this "overheating" is shown in Figure 2d. The situation which is just described actually indicates that the transformation developing in our system is characterized by the transforma- tion temperature hysteresis and is history-dependent. This, in turn, is a direct indication that the system is not ergodic. The latter means that if the system turns out to be in one area of the phase space it is unable to escape it and reach the other areas. The path-dependence of equilibration outcome and its dependence on the initial state ("memory" of initial state) obtained in our simulation is a fingerprint of the non-ergodic system. A well known example of the non-ergodic system is the spin glass system.
For a non-ergodic system, the difference between the metastable and stable states becomes insignificant since the metastable states related to

FERROELECTRIC TRANSITION IN RANDOM FIELD 177
multiplicity of local free energy minima are unescapable by usual thermonucleation process. This is circumstance that results in the thermoelastic (two-phase) equilibrium in the martensitic systemt30J and in the two-phase equilibrium dispersion obtained in this study.
As was proposed by Cross [21\ if the system consists of small independent polar clusters imbedded into a nonpolar matrix, the thermal fluctuations may result in flips of the dipole moment of the entire cluster, the value of the dipole moment being proportional to the particle volume. If the kinetic barrier between the directions along and opposite to the applied electrical field is small enough to avoid the dipole moment freezing, such a system would have a very high polarizability, typical for relaxor materials. The described phenomenon is the superparaelectric effect. The low frequency hysteresis observed in relaxors is also explained by the superparaelectric cluster model. In a situation where the barrier is low, the inverse flipping time assumes the values commensurate with the low frequencies. This condition maximizes the energy absorption and thus increases the hysteresis.
Since the transition barrier between the directions along and opposite to the applied electrical field is proportional to the cluster volume, the superparaelectricity becomes significant for the small polar clusters. As was mentioned in Introduction, in order to attribute the relaxor behavior to the superparaelectricity, it is necessary to explain (i) why the ferroelectric transition produces the stable two-phase mixture while the thermodynamics of the isobaric ferroelectric transition does not permit it and (ii) why the single-phase state, composed of macrodomains of the ferroelectric phase, forms from the two-phase state with change in the transformation driving force, composition or with application of the electric field. The explanation actually follows from this study, Indeed, our simulation shows that in certain random systems the ferroelectric transition produces the metastable dispersion of small polar particles in the nonpolar matrix. This resolves the first problem (i).
The simulation results explain the problem (ii) as well. They show that increasing the transformation driving force by "cooling" increases the volume fraction of the ferroelectric phase until the system fully transforms into the macrodomain single-phase ferroelectric state. This is illustrated by the sequence of Figures 2a, 2b, 2c: with the driving force increase, the dispersion of the polar clusters (Fig. 2a) transforms to the state with a high volume fraction of the polar phase (Fig. 2b) and, finally, to the macrodomain single-phase ferroelectric state (Fig. 2c). Our simulation results, not presented in this paper, shows that increase in the transforma- tion driving force due to the applied electric field also fully transforms the

178 S. SEMENOVSKAYA AND A. G. KHACHATURYAN
two-phase state into the single-phase ferroelectric state. As a matter of fact, using the electric field is a much more efficient way of increasing the transformation driving force than the "cooling". The transition to the single-phase state, obviously, eliminates the superparaelectric effect and, if the superparaelectric model of the relaxor behavior is adopted, it should eliminate all typical features of the relaxor behavior.
Finally, the simulation results may explain the high values of electro- mechanic coupling constants in relaxor materials. This effect can be explain in terms of the elastic strain response to restructuring of the two-phase paraelectric/ferroelectric coherent mixture under the applied electric field. The electric field energetically favors those lower symmetry orientation variants of the ferroelectric phase whose polarization is directed along the field. The growth of favorable variants at expense of the parent paraelectric phase and unfavorable variants of the ferroelectric phase results in a macroscopic shape change of the system characterized by the transforma- tion-induced strain
£y = [£(/)°-£(unf)°]Aw(£)
where e(/) ■■ and e(unf)?- are the stress-free transformation strains of the favorable and unfavorable orientation variants, respectively; Aw(£) is the excess volume fraction of the favorable variant with respect to unfavorable ones; Aw(£) is a function of the applied field £. Since the transformation strains e(/)° and e(unf)?., determining the misfit between the crystal lattices of the paraelectric and ferroelectric phases, are comparatively large, the macroscopic body deformation is also high. The situation here is almost identical to the one occuring in the conventional martensitic transformation under the applied stress. The only difference is that the value Aw(cr) in the martensitic material is caused by the applied stress a whereas the value Aw(£) in the relaxor material would be caused by the applied electric field £. It is well known, that the stress-induced martensitic transformation produces a very large macroscopic strain whose orders of magnitude is smaller than the elastic (Hooke) strain achievable in the homogeneous
martensic crystal. There is no reason to think that a similar large strain (in comparison with
the electrostrictive strain in the homogeneous ferroelectrics) cannot be achieved in the electric field-induced transformation in the ferroelectric system. This would provide an unusually large electrostriction.
It should be noted that the superparaelectric mechanism of the relaxor ferroelectrics, which is discussed in this paper in relation to a ferroelectric

FERROELECTRIC TRANSITION IN RANDOM FIELD 179
cluster formation obtained in our computer simulation, is not necessary the only one contributing to the high polarizability, low frequency relaxation and other features of the relaxor behavior. There are several other mechanisms which may also contribute to the special properties of relaxors (see for example, a review paper by Kleeman[33]). Their relative contribution may vary for different systems. The interesting mechanism based on interaction of polar clusters through the highly polarizable matrix was proposed by Vugmeister and Rabitz in the paper submitted to this issue[34].
A ckno wledgements
The authors gratefully acknowledge the support by Division of Materials Science, U.S. Department of Energy, under Grant No.DE-FG02- 93ER45502. The simulation was performed on Cray-YMP 90 at the Pittsburgh Supercomputing Center. AK would like to thank Dr. D. Viehland and Dr. B. Vugmeister for the helpful discussions.
References
[1] Takesue, N. and Chen, H. (1994). /. Appl. Phys., 76, 5856. [2] Oshima, R., Sugiyama, M. and Fujita, F. E. (1988). Metall. Trans., 19A, 803. [3] Muto, S., Oshima, R. and Fujita, F. E. (1990). Ada Metall. Mater., 38, 684. [4] Seto, H., Noda, Y. and Yamada, Y. (1990). J. Phys. Soc. Jpn., 59, 965. [5] Robertson, I. M. and Wayman, C. M. (1983). Philos. Mag., A48, 421, 443, 629. [6] Schryvers, D. and Tanner, L. E. (1990). Ultramicroscopy, 37, 241. [7] Onozuka, T., Ohnishi, N. and Hirabayashi, M. (1988). Metall. Trans., 19A, 797. [8] Nagasawa, A. (1976). /. Phys. Soc. Japan, 40, 93. [9] Viehland, D., Kim, M.-Chul, Xu, Z. and Li, J.-F. (1995). Appl. Phys. Lett., 67, 2471.
[10] Randall, C. A., Barber, D. J., Whatmore, R. W. and Groves, P. (1986). Ferroelectrics, 76, 311.
[11] Semenovskaya, S., Zhu, Y., Suenaga, M. and Khachaturyan, A. G. (1993). Phys. Rev., B47, 12182.
[12] Schmahl, W. W., Putnis, A., Salje, E., Freeman, P., Graeme-Barber, A., Jones, R., Singh, K. K., Blunt, J., Edwards, P. P., Loram, J. and Mirza, K. (1989). Phil. Mag. Lett., 60, 241.
[13] Wordenweber, R., Sastry, G. V. S., Heinemann, K. and Freyhardt, H. C. (1989). J. Appl. Phys., 65, 1648.
[14] Youwen, Xu., Suenaga, M., Tafto, J., Sabatini, R. L., Moodenbaugh, A. R. and Zolliker, P. (1989). Phys. Rev., B39, 6667.
[15] Kartha, S., Krumhansl, J. A., Sethna, J. P. and Wickham, L. K. (1995-11). Phys. Rev., B52, 803.
[16] Kartha, S., Kastan, T., Krumhansl, J. A. and Sethna, J. P. (1991). Phys. Rev. Letters, 67, 3630.
[17] Smolenskii, J. A. and Usupov, V. A. (1954). Sov. Journ. Tech. Phys., 24, 1375; Smolenskii, J. A. and Agranovskaya, A. I. (1959). Sov. Phys. Solid Slate, 1, 1429.
[18] Chen, Z. L., Chan, H. M. and Harmer, M. P. (1989). J. A. Cer. Soc., 72, 593. [19] Setter, C. G. F., Schölten, F. L. and Burggraat, A. G. (1979). Solid State Comm., 32, 989. [20] Hilton, A. D., Barber, D. J., Randall, C. A. and Shrout, T. R. (1990). /. Mater. Sei., 25,
3461; Hilton, A. D. (1991). Ph. D. Thesis, University of Essex.

180 S. SEMENOVSKAYA AND A. G. KHACHATURYAN
[21] Randall, C. A., Barber, D. J. and Whatmore, R. W. (1987). J. Microsc, 45, 275. [22] Dai, X.-H., Xu, Z. and Viehland, D. (1994). Philos. Mag., B70, 33; Dai, X.-H., Xu, Z. and
Viehland, D. (1996). Philos. Mag., B74, 395. [23] Yao, X., Chen, Z. L. and Cross, L. E. (1983). /. Appl. Phys., 54, 3399. [24] Fan, S. M., He, J. W. and Yao, X. (1988). Ferroelectrics, 11, 181. [25] Dai, H.-H., DiGiovanni, A. and Viehland, D. (1993). /. Appl. Phys., 74, 3399. [26] Xu, Z., -Chul, M. Kim, Li, J. F. and Viehland, D. (1996). Philos. Mag., 74, 395. [27] Cross, L. E. (1987). Ferroelectrics, 76, 249. [28] Yunzhi, Wang, Long-Qing, Chen and Khachaturyan, A. G. (1993). Journ. of Amer.
Ceramic Soc, 76, 3029; Yunzhi, Wang Hongying Long-Qing Wang, Chen and Khachaturyan, A. G. (1995). J. Am. Ceram. Soc., 78, 657-661.
[29] Wang, Y. and Khachaturyan, A. G. (1997). "Three-Dimensional Field Model and Computer Simulation of Martensitic Transformation", Ada Mater., 45, 759.
[30] Semenovskaya, S. and Khachaturyan, A. G. (1997). Ada Mater., 45, 4367. [31] Khachaturyan, A. G. "Theory of Phase Transformations in Solids", p. 266, Wiley & Sons,
N. Y. 1983. [32] Semenovskaya, S. and Khachaturyan, A. G. accepted to /. Appl. Phys. [33] Kleeman, W. (1993). Review article, "Random-field Induced Antiferromagnetic, Ferro-
electric and Structural Domain States", Intl. Journ. of Modern Phys., B7, 2469-2507. [34] Vugmeister, B. and Rabitz, H. (1997). Ferroelectrics, 201, 34.

Ferroelectrks, 1998, Vols. 206-207, pp. 181-204 Reprints available directly from the publisher Photocopying permitted by license only
i 1998 OPA (Overseas Publishers Association) Amsterdam B.V. Published under license
under the Gordon and Breach Science Publishers imprint.
Printed in India.
FIRST-PRINCIPLES THEORY OF STRUCTURAL PHASE TRANSITIONS FOR PEROVSKITES:
COMPETING INSTABILITIES
DAVID VANDERBILT and W. ZHONG
Department of Physics and Astronomy, Rutgers University, Piscataway, NJ 08855-0849
(Received 24 February 1997; In final form 29 April 1997)
We extend our previous first-principles theory for perovskite ferroelectric phase transitions to treat also antiferrodistortive phase transitions. Our approach involves construction of a model Hamiltonian from a Taylor expansion, first-principles calculations to determine expansion parameters, and Monte-Carlo simulations to study the resulting system. We apply this approach to three cubic perovskite compounds, SrTi03, CaTi03 and NaNb03, that are known to undergo antiferrodistortive phase transitions. We calculate their transition sequences and transition temperatures at the experimental lattice constants. For SrTi03, we find our results agree well with experiment. For more complicated compounds like CaTi03 and NaNb03, which can have many different structures with very similar energy, the agreement is somewhat less satisfactory.
Keywords: Structural phase transitions; ferroelectrics; SrTi03; CaTi03; NaNb03
I. INTRODUCTION
Perovskite materials are of considerable interest both for fundamental reasons and for their many actual and potential technological applications. The great fascination of the cubic perovskite structure is that it can readily display a variety of structural phase transitions, ranging from non-polar antiferrodistortive (AFD) to ferroelectric (FE) and antiferroelectric (AFE) in nature[1]. The competition between these different instabilities evidently plays itself out in a variety of ways, depending on the chemical species involved, leading to the unusual variety and richness of the observed structural phase diagrams. For example, as temperature is reduced, BaTi03
181

182 D. VANDERBILT AND W. ZHONG
undergoes a series of FE phase transitions, while SrTi03 has a single AFD transition. More extreme examples are NaNb03 and BaZr03; the former has a series of six transitions, while the latter stays cubic down to zero temperature. Another appealing property of these cubic perovskites is that all of the structural phase transitions involve only small distortions from the ideal cubic structure, the typical distortion being less than 5% of the lattice constant. This simplifies the theoretical treatment considerably. The ample experimental data on these compounds also provide many insights and opportunities for checking the accuracy of theoretical calculations.
It is no wonder that there have been many theoretical attempts to study these compounds. Previous phenomenological model Hamiltonian ap- proaches'2^51 have largely been limited by oversimplification and ambi- guities in interpretation of experiment, while empirical[6] and non-empirical pair-potential methods[7] have not offered high enough accuracy. Recently, advances in density-functional techniques have made possible first- principles investigations of such perovskite compounds. Such calculations have proven capable of providing accurate structural properties and FE distortions for perovskites at zero temperature [8~10].
Recently, a thermodynamic theory based upon such first-principles calculations was developed to study the finite-temperature properties of BaTi03
[I1'12], and predicted the correct transition sequence and fairly accurate transition temperatures. This thermodynamic approach involves three steps: (i) constructing an effective Hamiltonian to describe the important degrees of freedom of the system; (ii) determining all the parameters of this effective Hamiltonian from high-accuracy ab-initio LDA calculations; and (iii) performing Monte-Carlo simulations to determine the phase transformation behavior of the resulting system. A similar approach was also successfully applied to PbTi03 by Rabe and Waghmare [13].
The construction of the effective Hamiltonian is carried out in view of the special structural properties of cubic perovskite compounds. At higher temperature, the cubic perovskite compounds AB03 have a simple cubic structure with O atoms at the face centers and metal atoms A and B at the cube corner and body center, respectively. The two most common instabilities result from the softening of either a polar zone-center phonon mode, leading to a FE phase, or the softening of a non-polar zone-boundary mode involving rotations of oxygen octahedra, leading to an AFD phase. (In some cases a zone-boundary polar mode may also occur, leading to an AFE phase). In our previous thermodynamic theory for BaTi03, we assumed FE and strain distortions would be the only important degrees of freedom of the system. In other words, all other distortions are assumed to

THEORY OF STRUCTURAL PHASE TRANSITIONS 183
be much higher in energy. This is true for BaTi03, but not true for cubic perovskites in general. As shown in our recent first-principle calculations[14], most cubic perovskite compounds may also undergo AFD transitions. To study these compounds, we need to extend our theory to include AFD distortions among the low-energy distortions. This extended theory would also allow us to study the interaction between FE and AFD instabilities. However, because the AFD distortion is a zone-boundary distortion without a clear corresponding zone-center mode, the extension is not trivial.
The rest of the paper is organized as follows. In Sec. II, we go through the detailed procedure for the construction of the effective Hamiltonian with the AFD distortion included. In Sec. Ill, we describe our first-principles calculations and the determination of the expansion parameters for the three compounds SrTi03, CaTi03, and NaNb03. In Sec. IV, we report our calculated transition temperatures, phase sequences, and order parameters for those three compounds. We also identify the differences between the correlation functions of the FE and AFD local modes in SrTi03. Sec. V concludes the paper.
II. CONSTRUCTION OF THE HAMILTONIAN
A. Local Modes for AFD Distortion
In our previous development[12], we argued that the total energy of a cubic perovskite can be well approximated by a low-order Taylor expansion over all the relevant low-energy distortions, specifically FE distortions and strain. The FE distortions are represented by local modes, whose arrangement will reproduce the FE soft phonon modes throughout the Brillouin zone (BZ). To extend the theory to include the AFD distortions, we need to construct a new set of local modes to represent the lowest AFD modes over the whole BZ, or at least over the portion of the BZ where the energy change due to the AFD distortions is either negative, or positive but small. The AFD mode typically has the lowest energy at the zone-boundary R [(0.5, 0.5, 0.5)27r/a0] and M [(0.5, 0.5, 0)2-7r/a0, etc.] points, while near the zone center T the energy is very high. So it is necessary to choose local modes that will accurately reproduce the potentially soft modes in the vicinity of the R and M points.
The rotation of an isolated oxygen octahedron can be represented by a pseudovector passing through its center. Assuming the origin of coordi- nates at the center of the octahedron, a pseudovector with polarization z involves displacements ± 0.5 a0y for oxygen atoms at (± a0/2,0,0) and

184 D. VANDERBILT AND W. ZHONG
displacements T 0.5 a0x for atoms at (0, ±a0/2,0). Here a0 is the lattice constant of the ideal cubic perovskite. In the case of the AB03 perovskite crystal, we can represent octahedral rotation using pseudovectors sitting on the center of each octahedron, i.e., on the B atoms. However, neighboring octahedra share oxygen atoms, so that some continuity conditions would have to be imposed if we were to insist that the displacement of a given oxygen be consistently described by both neighboring pseudovectors. With such constraints the neighboring pseudovectors would no longer be independent of one another, leading to potential problems in the implementation of the Monte-Carlo simulations.
To avoid such problems, we simply construct a set of "virtual" pseudovectors at which are independent of each other, and left the actual oxygen displacements be the superposition of the displacements that would results from these. To be precise, let di = a{R?) denote the pseudovector centered on the B atom of unit cell i (position vector R,), so that each oxygen atom is shared by two pseudovectors. The physical displacement of the oxygen atom shared by «,■ and a, is then given by
Ar = ^Äj/x(a/-«/), (1)
where Rtj = Ä, - Rj,R,j = Rij/\Ry\. The AFD soft modes of interest at R and M are then easily represented by the corresponding pattern of pseudovectors. For example, choosing a(lx + my + nz) = (-) m z repro- duces one of the M-point modes polarized along i. (Here, x = a0x, etc.). Other possible choices of the pattern of pseudovectors correspond to other modes which are probably higher in energy, but possibly still relevant for some materials. For example, choosing a(lx + my + nz) = (-)ly corresponds to an Jf-point mode that can be regarded as either of AFD character polarized along y, or of AFE character polarized along t Finally, note that choosing a(R,) constant (r-point arrangement) gives rise to no displace- ments whatever.
In view of this last point, it is important to realize that the «, themselves do not have direct physical meaning; only differences between adjacent «,'s are physical. Adding a constant to all a-s will not change the physical configuration of the system. So any physical distortions can be mapped to infinitely many pseudovector arrangements, but any pseudovector arrange- ment only corresponds to one specific physical distortion. Because only the pseudovector differences between sites have physical meaning, the Hamilto- nian should be expanded in terms of these differences, not the pseudovectors themselves. Using this approach, we reduce the number of degrees of

THEORY OF STRUCTURAL PHASE TRANSITIONS 185
freedom associated with oxygen displacements perpendicular to the O—B bonds from six to three, and raise the symmetry of the system considerably. As a result, the Taylor expansion is significantly simplified.
The two other low-energy distortions, the FE and elastic distortions, are treated as in Ref. [12]. Briefly, for each unit cell of the AB03 perovskite structure, we define a FE local-mode centered on the B site, and a displacement local mode centered on the A site. The former is chosen in such a way that a uniform superposition of FE local modes reproduces the soft TO mode obtained by diagonalizing the force-constant matrix at the Brillouin zone center. The quantities /•=/(/?,-) and H, are the vector amplitudes of the FE and translational local modes, respectively, in the z'th unit cell. (Note the difference in notation between Ref. [12] and this paper[15]). Inhomogeneous strains r\ are expressed in terms of differences between H, in neighboring cells, and we add six extra degrees of freedom to describe the homogeneous strain. Thus, the total energy Etot depends on the set of variables {/■, at, ut} and the homogeneous strain, and is expanded in a Taylor series in terms of these quantities. The expansion terms can be divided into four kinds, those involving the FE local modes / alone, the AFD modes a, alone, the strain variable H, alone, the strain variable ut alone, and the coupling between them,
Etot = EF({f}) + EA({a}) + 2?E({«}) + EirA({f,«,«}). (2)
The part of the energies involving the FE local modes alone, EF({f}), contains the on-site self energy, dipole-dipole interactions, and short-range residual interactions. Their forms have been given by equations in Ref. [12]: Eq. (3) in Sec. II. B, Eq. (7) in Sec. II. C, and Eq. (9) in Sec. II. D, respectively[15]. The energy due to w, alone, EE({u}), is just the elastic energy, and its form has been given by Eq. (11) of Ref. [12]. Also, the energy terms representing coupling between the/- and H, have been given in Eq. (14) of Sec. II. F of Ref. [12].
It remains to present here the energy terms involving solely the AFD local modes a, and those representing the coupling of the a, to the/- and «,-. Their expressions are presented in the following.
B. AFD Energy Terms
The AFD local modes a, are nonpolar and involve no dipole moment, so long-range dipole-dipole interactions need not be considered, unlike for FE local modes. Recalling that only the differences of the a, between

186 D. VANDERBILT AND W. ZHONG
neighboring sites are physical, it is not appropriate to separate energy contributions into on-site and inter-site interactions, as we did for the//121. Instead, we separate the interaction into harmonic and higher-order
contributions,
EA({a}) = EA' harm({«}) + EA' anharm({«}). (3)
In principle, all the AFD energy terms should be expanded in terms of the Ar expressed through Eq. (1). For intersite interactions, this would become very complicated because of the low crystal symmetry at the O sites. However, for harmonic terms, the expression can be simplified by expansion in terms of the a, directly with certain conditions enforced. In this case, we can write
EA'h*™({a}) = l-J2J2JLßa'*aJß- w i] aß
Here, a and ß denote Cartesian components, and JAaß is a function of Ry
and should decay very fast with increasing \Ry\. We need to impose conditions on the JA
aß reflecting the fact that the dependence of the energy on the a, is only through differences between neighboring sites [Eq. (1)]. The appropriate conditions are
Z^ Jij,aß j'G planem
JLB = 0, (5)
where the sum is over sites j such that RiJt0 = ma0. This reflects the fact that if we make a change aj -> aj + cz for all the pseudovectors in an x-y plane at a distance of m unit cells away from the site i, the resulting "force" on the pseudovector on site i should vanish. It can be shown that with these conditions enforced, the interaction energy is only related to the pseudovector difference between adjacent sites.
The description in terms of the a, directly makes it possible to simplify the interaction matrix JA
aß by symmetry, since at is centered on the high- symmetry sites. For a cubic lattice, we have
on-site: JAaß = 2K,A6aß,
lstnn: JA^aß = [jA + {jA -jA)eijta]6aß,
2nd nn: JAUaß = [jA + (jA -j^)9u,a]6aß
+jAöij,a0y,ß{l-8aß),
3rdnn: JAaß =jA6aß +jAeya6ij)ß{\ - 6aß),
4thnn: JAaß =jA6ij,a6aß, (6)

THEORY OF STRUCTURAL PHASE TRANSITIONS 187
where 9iJta = 1 if Ry has a non-zero a component and 0 otherwise. We include in-plane interactions (i?,-; a = Rjt a) to 4th neighbor, since this kind of interaction is much stronger than other interactions. The conditions Eq. (5) can then be simplified to
J2+4jf + 4J6=0- (7)
Thus, the complicated harmonic intersite interaction matrix for AFD local distortions can be determined from seven independent interaction para- meters.
The structural phase transition problem is intrinsically an anharmonic problem. Since the harmonic modes may be unstable, it is necessary to introduce higher order terms. For simplicity, we first only consider on-site anharmonic contributions associated with oxygen atoms. Because of the tetragonal symmetry on the O sites, the lowest anharmonic terms are of fourth order. Since each oxygen involves two nearest neighbor AFD pseudovectors, this quartic term will take the form
EA, quart({fl}) = £ £ cfi{[ay(Rt) - ay{Rt + d)]4 + [az(Rt) - az(Rt + d)]4} i d=±x
+ EE ^MR') - ay(Ri + *)]2 + W*')" a^Ri + *)12
;' d=±x
+ cyclic permutations. (8)
Here, x = üQX, and aA and 7A are parameters to be determined from first- principles calculations.
In our previous work on BaTi03 the intersite FE interactions have been expanded only up to harmonic order. For AFD interactions the corresponding approximation would be to truncate the interactions between the AFD-induced displacements of different oxygen atoms to harmonic order. [Such terms are already included in Eq. (6)]. We find this approximation to be satisfactory for those compounds with weak distortions, as in the case of BaTi03 or SrTi03. For CaTi03, the AFD distortion is very large and the transition temperature is around 2000 K. In this case, we find it necessary to include more complicated anharmonic terms, such as third-order intersite interaction terms, for the AFD distortions. In fact, such terms turn out to be responsible for inducing a displacement component corresponding to an Z-point phonon (with both O and Ca character) in CaTi03. For NaNb03, although the distortion is not as

D. VANDERBILT AND W. ZHONG
strong (the highest transition temperature is around 700 K), there are many structures with very close free energy. We find that inclusion of the third- order AFD terms does have a noticeable effect for these compounds, so we include these third order interaction terms for CaTi03 and NaNb03.
We consider only those third-order interactions between AFD modes on two or three neighboring lattice sites. We can follow the treatment of the harmonic intersite interactions by listing all the possible interactions and using symmetry arguments to eliminate forbidden terms. Following this approach leads to three kind of terms, and we would need three more parameters to fully specify the Hamiltonian. Since the third-order terms are relatively weak and the exact determination of the three parameters is costly, we investigate the relations between these three parameters, and use a simple argument to combine the three terms to form a single new term with only one free parameter to determine.
The AFD interactions involve only the displacement of oxygen atoms. The strongest energy difference is associated with the distortion of oxygen octahedra, or the change of the length of a nearest-neighbor O —O bond A/. We can start by analyzing A/ for two oxygens at (0, 0, a/2) and (a/2, 0,0). We approximate the total-energy change as solely due to A/. Expanding it as a function of the rotation vectors a(i) up to the third order, we obtain the desired third-order intersite terms. Using the short-
hand notations
a'i{x)=a{Ri + x)-a(Ri),
a{(-jc) =«(*«-*)-«(*/), (9)
the cubic coupling term involving one O — O bond is
^K^-^^KxW + aU*)]2- (10)
The other 11 nearest-neighbor O—O bonds will give rise to 11 other terms and the overall total-energy contribution can be expressed as EA<cub =
B3 £,. Wh where
W, ={+Wi,xiy) -<,(z)K,(z) +<M 2

THEORY OF STRUCTURAL PHASE TRANSITIONS 189
+ WU-y) - a[x(-z)][a[y{-z) + a[z(-y)}2 (11)
+ cyclic permutations}.
This assumption that A/ is solely responsible for the cubic intersite interactions significantly simplifies the energy expression and reduces the number of expansion parameters from three to one.
C. Coupling Energy
There are three kind of coupling energy terms: those between FE and elasticity, between FE and AFD, and between AFD and elasticity,
£int = £F-E + £F-A + £A-E (12)
For simplicity, we consider only on-site couplings. The coupling between ft
and H, (£F~E) has been given by Eq. (14) in Sec. II. F of Ref. [12][15]. Here, we give expressions for EA~B and EF~A.
The coupling between elasticity and AFD modes at lowest order can be written as
£E-A(W, M) = ^BwxT,l(Rt)Ka(x)°;,/»W + <a(-*K/j(-*)] Haß
+ cyclic permutations, (13)
where the short-hand notation of Eq. (9) is again used, and r\i (/?,) is the six- component local strain tensor in Voigt notation (771 = en, rj4 = 2e23). rji(Ri) can be expressed as a function of«; following Sec. II. F of Ref. [12][15]. Biaß1
is a fourth-order coupling tensor. Because of the symmetry, there are only four independent coupling constants in Btaß1,
B\yyx = &\zzx = &2xxy = &2zzy = &3xxz == ^3yyzi
&2yyx = &3zzx = &\xxy = &3zzy = &\xxz = ^lyyzi
&3yyx — &2zzx — &3xxy ~~ &lzzy ~~ &2xxz ~~ &\yyz:
"Ayzx = B&,zyX = ßsxzy = &5zxy = &6xyz = -"6/xz- (14)
All other elements are zero.

190 D. VANDERBILT AND W. ZHONG
The lowest-order coupling beween a, and/- is linear with both a, and/-. It
takes the form
E\~K = Y, Gxy fM)l"y(Ri + «) ~ ay(Ri " *)] i
+ cyclic permutations. (15)
However, in the AFD state, this term is zero. To account correctly for the coupling between at and/-, it is necessary to include higher-order terms. The lowest non-zero term in the AFD state is quadratic in both a, and /-.
Defining wUx by
"U* = \ E [ax(Ri + d)-ax(Rd] (16) d=±y, ±z
and similarly for wUy and w,-z we can write
i
+ cyclic permutations]. (17)
(In principle a term GxyxyfUxfUy wUx wUy could also be included, but for practical reasons we have not done so in this work). In summary, up to the fourth-order terms, the coupling between at and/- is expressed as
E*-K=E\-K + E\-*. (18)
III. FIRST-PRINCIPLES CALCULATIONS
The expansion parameters in the model Hamiltonian can be obtained from a set of first-principles calculations. We use density-functional theory within the local density approximation (LDA). The technical details and convergence tests of the calculations can be found in Ref. [10]. The use of Vanderbilt ultra-soft pseudopotentials [16] allows a low-energy plane-wave cutoff to be used for first-row elements, and also allows inclusion of semicore shells of the metal atoms. This makes high-accuracy large-scale calculations of materials involving oxygen and 3d transition-metal atoms affordable. A generalized Kohn-Sham functional is directly minimized using a preconditioned conjugate-gradient method [10'17'18]. We use a (6, 6, 6) Monkhorst-Pack /fc-point mesh[19] for single-cell calculations (216 fc-points in the full Brillouin zone), and the corresponding smaller sets of mapped k- points for supercell calculations. All expansion parameters are computed

THEORY OF STRUCTURAL PHASE TRANSITIONS 191
relative to the cubic structure at the theoretical equilibrium lattice constants given in Ref. [10].
The calculation of expansion parameters related to the FE modes follows the procedure presented in Ref. [12], Sec. III. The soft mode eigenvectors for SrTi03, CaTi03, and NaNb03 as calculated by King-Smith et al, are summarized in Table I. The calculated expansion parameters for the FE modes are given in the top portion of Table II. (Note that as an expedient we have adopted experimental values for the dielectric constants e^ in Table II; typical values were chosen from the ranges given in Ref. [32]).
The calculation of the AFD expansion parameters follows a similar procedure as for the FE ones. The AFD eigenvector itself does not need to be calculated, since it is determined by symmetry. The LDA total energy vs. AFD distortion, with polarization along x and z, and at A>points X = (ir/a, 0,0), M = (n/a, w/a, 0) and R = (ir/a, ir/a, n/a), are calculated. The arrange- ments of the AFD local modes are the same as for the FE-mode calculations as shown in Figures 3(a)-(f) of Ref. [12]. However, the arrangements at the T point (Fig. 3(a) of Ref. [12]) and at the X point (Fig. 3(b) of Ref. [12]) involve no actual distortions. So the work reduces to four 10-atom cell calculations and two 20-atom cell calculations needed to determine jfjf,J^JA,jf andjf + 2jf. The decomposition of jf and jj- follows the same argument as for the FE case. It is difficult to perform sufficient LDA calculations to carry out the decomposition, and probably not very important to do so. Instead, we rely on the heuristic that the interaction between two AFD local modes should be minimal (in practice, zero) when they are so arranged that reversing one of them induces a minimum bond-length change. For the AFD case, this leads to jf + 2jf = 0, allowing jf and jf to be obtained separately. The fourth- neighbor interaction parameter jf is obtained from LDA calculations on a 15-atom supercell.
As mentioned before, we need to include the effect of third-order intersite coupling in the effective Hamiltonian in some compounds having large AFD distortions. This kind of interaction generates a coupling among three
TABLE I FE soft-mode eigenvectors for AB03 cubic perovskites SrTi03) CaTi03, and NaNb03. 0|| and OL indicate oxygen displacement parallel and perpendicular to O—B bond, respectively
SrTiO, CaTi03 NaNb03
fo foil fo-l
0.472 0.698 0.449 0.612 0.330 0.625
-0.287 -0.157 -0.232 -0.400 -0.436 -0.421

192 D. VANDERBILT AND W. ZHONG
TABLE II Expansion parameters of the Hamiltonian for SrTi03, CaTi03 and NaNb03. Energies are in Hartree. FE local-mode amplitudes are in units of the theoretical lattice constant (a = 7.30 a.u., 7.192 a.u. and 7.396 a.u. for SrTi03, CaTi03, and NaNb03, respectively [10]); AFD local-mode amplitudes are in radians
SrTiO-i CaTi03 NaNb03
FE on-site K2 0.0559 0.0240 0.0679 a 0.150 0.023 0.168
7 -0.191 -0.006 -0.256
FE intersite j\ -0.02034 -0.01186 -0.02378
h 0.04274 0.02750 0.03078
h 0.005722 0.002040 0.006460
U -0.003632 -0.002886 -0.005446
h 0.004882 0.001132 0.004820
k 0.001416 0.000672 0.002358
h 0.000708 0.000336 0.001178
FE dipole Z* 8.783 6.768 9.179 £oo(expt.*) 5.18 5.81 4.96
ADF harmonic KA 0.162238 0.022244 0.095852
jA 0.010526 0.086972 0.034884
ft 0.000820 0.000544 0.002360
J3 -0.002782 -0.001398 -0.000272
rt -0.105414 -0.112050 -0.097678
Jt 0.009460 0.010792 0.009752
J6 0.002577 0.001262 -0.000318 -0.001288 -0.000632 0.000160
iA 0.013769 0.013956 0.014868
AFD 3rd Order B3 - 0.0056 0.0029
AFD 4th Order aA 0.05433 0.04970 0.03775
7A 0.04706 0.02414 0.04301
Elastic Bu 5.14 5.15 6.63 B12 1.38 1.22 0.96
BAA 1.56 1.29 1.07
FE-E coupling B\xx -1.41 -0.59 -1.71
B\yy 0.06 0.06 0.50 BAyz -0.11 -0.10 0.00
AFD-E coupling D\yyx 0.260 0.234 0.316 Blyyx -0.068 -0.008 0.026 »A Dlyyx 0.000 -0.034 0.031
"Ayzx 0.044 0.040 -0.041
FE-AFD coupling Gxy 0.0061 -0.0001 0.0014
**xxxx 0.53 0.72 0.35 ^xxyy 0.11 0.29 0.06
*Ref. [32].
distortions: an i?-point mode with polarization (110), an M-point (ir/a, ir/a, 0) mode polarized along (001), and an Z-point(0, 0, n/a) mode polarized along (110). To determine the strength of this coupling, we carry out a calculation with the above 7?-point and M-point distortions frozen in (20-

THEORY OF STRUCTURAL PHASE TRANSITIONS 193
atom supercell), and calculate the forces of X-point character. We find that the force on the A-metal atom (Ca or Na) is non-zero, and opposite in sign to the force on the oxygen atom. This is in qualitative agreement with the experimentally observed displacements in the low-temperature phase, which are also opposite in sign. We then calculate the projection of these forces onto the X-point mode, under the simplifying assumption that the latter consists of equal-amplitude out-of-phase motion of the two atoms. This projection determines our third-order intersite coupling parameter B3.
The calculation of the anharmonic coefficient aA is performed with an R- point distortion polarized along (001). Typically a set of eight calculations are performed for each compound. The resulting LDA total energy is fitted to a polynomial E0 + c2a2 + c4a4 using standard least-squares methods to extract K
A and aA. A single i?-point calculation with polarization in the
(111) direction is used to extract 7A. The four parameters describing the coupling between AFD modes and
elastic strains are obtained by performing four more 10-atom supercell calculations: at the M-point, a || (001), with an isotropic strain 771 = 772 = 773 = 0.01; at the M-point, a || (001), with strain 77! = 0.01; at the X-point, a || (001), with strain 771 = 0.01; and at the i?-point, a || (111), with strain V4 = V5= Ve = 0-01 • Extra care has been taken to ensure cancellation of errors due to fc-point sampling and basis-size differences for the different unit cells involved.
Finally, the coupling between FE and AFD modes are determined as follows. The harmonic coupling Gxy is determined by considering a geometry in which the primitive cell has been tripled along the x direction, and for which fx is non-zero in two primitive cells and ay is non-zero in the third. The anharmonic couplings Gxxxx and Gxxyy are determined from a series of calculations on a doubled-cell configuration in which/(r) || (100) and a(R) || (100) or (010).
The calculated parameters for all three compounds are listed in Table II. We note that the intersite interaction parameters between AFD local modes have a much stronger anisotropy than those between FE modes. For FE, the j 's show no marked anisotropy. (Of course, when the Coulomb interaction is included, the actual interaction between FE modes are quite anisotropic). On the other hand, for the first-neighbor AFD couplings, jA is more than one order of magnitude larger thany'A, which is reasonable sincey'A involves no distortion of oxygen octahedra. For second neighbors, jK is again much larger than the others, confirming that the distortion of oxygen octahedra dominates the energy for AFD distortions. This observation that the in- plane interaction parameters are much stronger than the out-of-plane ones

194 D. VANDERBILT AND W. ZHONG
is what prompted us to include also the fourth-neighbor in-plane AFD interactions in the effective Hamiltonian.
IV. RESULTS
After the expansion parameters have been determined from first-principles calculations, the finite-temperature properties of the compounds can be calculated using Metropolis Monte-Carlo (MC) simulations[20]. The details of the MC simulations involving FE and elastic distortions have been described in Sec. IV of Ref. [12]. With the AFD distortions included, of degrees of freedom is increased from 6 to 9 per unit cell. All the details are very similar, the main difference being that the AFD degrees of freedom introduce many more possibilities for modes which may go soft. The primary candidates for soft AFD modes are three modes at the i?-point and one mode at each of the three M points, all of them involving only rigid rotations of oxygen octahedra. We thus have to consider a rather complicated set of order parameters, and we anticipate that complex phases
may form. The results for the three different compounds SrTi03, CaTi03, and
NaNb03 will be presented in the three following subsections. Because of the strong sensitivity of structural phase transition temperatures to the lattice constant and the well-known ~ 1% LDA underestimate of lattice constants, we concentrate on presenting calculated transition temperatures and transition sequences at the experimental lattice constants. We thus implicity apply a negative fictitious pressure to the simulation cell, as explained in Sec. IV of Ref. [12].
A. SrTi03
Thermodynamic properties for this compound have been calculated and published in Ref. [14]. A pressure P0=-5.4GPa is applied to restore the experimental lattice constant. A transition from the cubic phase to a tetragonal AFD structure at 130K, and two further FE phase transitions at 70 K and 10K, were predicted. A later quantum path-integral MC simulation revealed that quantum fluctuations suppress the FE phases entirely, and reduce the AFD phase transition temperature to 110K[21]. This gives excellent agreement with experiment, which reveals a single AFD phase transition at 105K[22], and no unambiguous phase transitions (but the presence of "quantum paraelectric" behavior123"251) at low temperature.

THEORY OF STRUCTURAL PHASE TRANSITIONS 195
Our calculated pressure-temperature phase diagram showed that the FE and AFD instabilities have opposite trends with pressure, and FE and AFD instabilities tend to suppress each other.
We have performed some further simulation to investigate the behavior of the AFD and FE local modes, and in particular the nature of the intersite correlations for FE and AFD local modes in the cubic phase but just above the phase transition temperature. The M-point AFD modes do not appear to be important for SrTi03, so we focus on the two vector order parameters f(T) and a(R) associated with the zone-center FE modes and the zone- corner AFD modes. Since the order parameters are vectors, the correlation functions are second-rank tensors. These can be calculated from our simula- tions as
Saß(x,y, z) = {va(x0,y0, z0)vß(x0 +x, yQ + y, z0 + z)), (19)
where the average is taken over all the sites x0, yo, zo in the MC simulation cell and over all MC sweeps /. Here the vQ denote the components of the FE or AFD order parameters [fa for FE, aa(-)
l+m+" for AFD, where Rt = lx + my + nz]. We can get a good picture of the nature of the correlation by investigating the diagonal elements (a = ß) only. Since the three Cartesian directions are equivalent, it suffices to present Szz(x, y, z).
In Figure 1(a), we show the calculated AFD correlation function Si^D(x, y, z) in the two planes x-z and x-y for SrTi03 at T= 150 K, in the cubic phase but just above the AFD phase transition temperature of 130K. We find that the correlations are quite strong in the x-y plane, with a correlation length of about three lattice constants. Along the z direction, even the nearest-neighbor vectors are almost completely uncorrelated. Thus, the shape of the "equal correlation surface" for AFD local modes is disc- like. This is easy to understand on the basis of the RUM picture[2]. Since the AFD local modes involve a rotation of oxygen octahedra, and any distortion of the oxygen octahedra involves a large energy cost (as shown by the large magnitude ofjuM, andy8), the AFD octahedral rotations about z correlate strongly in the x-y direction. On the other hand, the rigidness of the octahedra does not impose any relation between z-polarized AFD modes in different z planes (as reflected in the very small j2)- Thus, the pancake-like correlation naturally results.
Figure 1(b) shows the corresponding FE correlation function S^(x, y, z) for SrTi03 at T= 150K (the FE phase transition occurs at 70 K). Its behavior is just the reverse of the AFD modes, being strong along the z direction and weak in the x-y plane, and resulting in a needle-shaped "equal

196 D. VANDERBILT AND W. ZHONG
(a) (b) (c)
Wt M
(1 ■: *
»■ i ^
Zf ■a
« f >
iWp:: ssMs WiS «ft :::£pr
"I*!* $l|:8 ss :M*:
ft. F gife:: :& r WJtf:- & :*:£*■ SSp
Yt >::i:::: ¥:fe:': B-*W
g9 ■ i
_ Z"
1——♦ X
»MS
Y"
■,
>■:■ '■
i ü ■ m «
: ■:■ >$ ■ ■
_ Z" -- -
X
I-"
Y"
X X
FIGURE 1 (a) Intersite correlations of AFD local modes (ar(0, 0, 0)az(x, y, z)) in SrTi03 at T = 150K. The correlations in the x-z plane (> = 0, top) and the x-y plane (z = 0, bottom) are shown. Each small square represents one lattice site; the origin lies at the center. Grey scale denotes the degree of correlation: black for perfect correlation, white for zero correlation, (b) Same for FE local-mode correlations (/z(0, 0, 0)fz(x, y, z)>. (c) Corresponding FE local-mode correlations in BaTi03 at T = 320 K.
correlation surface". This behavior is a direct consequence of the anomalously large mode effective charges in the cubic perovskite compounds [26] which strongly suppress the longitudinal FE fluctuations and lead to the strong correlation of/z in the z direction. On the other hand, the transverse FE modes can easily go soft, resulting in a short correlation length for/z in the x-y plane.
The above picture of the correlation functions for AFD and FE local modes are presumably quite general for the cubic perovskite compounds. For the FE modes, we decided to repeat the calculations for the case of BaTi03, where the AFD instability does not intervene. We shown in Figure 1(c) the correlation function calculated in the cubic phase at T = 320 K, about 20 K above the FE phase transition temperature. We can see the behavior of the correlations is again needle-like and even more pronounced than for SrTi03,

THEORY OF STRUCTURAL PHASE TRANSITIONS 197
presumably because we are closer to the FE transition temperature. (An elongated supercell was used to accomodate the correlations in this case).
As was done for the FE modes in BaTi03,[11] it is revealing to compute the
equilibrium distribution of one cartesian component of the AFD order parameter a(R) in the cubic phase just above the phase transition temperature in SrTi03. This is shown in Figure 2, where it can be seen that the distribution looks approximately Maxwellian. This is indicative of a transition having a character much closer to the displacive than to the order-disorder limit.
B. CaTi03
CaTi03 is one of the more complicated perovskites. Experimentally, it is found to have two stable phases, an orthorhombic phase at lower T and a cubic phase above 1530K[27]. Some recent experiments suggest that the transition is to a highly disordered cubic phase[28]. The room-temperature orthorhombic phase has a very complicated structure with a 20-atom unit cell. The displacements of all the atoms away from their ideal positions have been determined in Ref. [29]. The refined structure as a function of temperature has also been determined recently using X-ray diffraction [30'31].
-0.4 -0.2 0 0.2 0.4
ax (rad)
FIGURE 2 The probability distribution of the Cartesian component of the local-mode variable ax for SrTi03 in the cubic phase at T = 140K (dashed line) and T = 150K (solid line).

198 D. VANDERBILT AND W. ZHONG
(a)
500 1000 1500 Temperature (K)
2000
of
(b) 0.15
0.10 -
200 400 600 Temperature (K)
800
FIGURE 3 (a) Calculated AFD order parameters a(R) of CaTi03 vs. T at P0 11.3 GPa. (b) Calculated FE and AFD order parameters of NaNbQ3 vs. T at P0 = - 4.3 GPa.
This complicated structure can be decomposed into a simultaneousfreezing in of three AFD modes: an i?-point mode polarized along (110) with rotation angle 0.20 (angles in radians), an M-point mode polarized along (001) with rotation angle 0.14, and an X-point mode polarized along (110). The X-point mode involves not only the rotation of oxygen octahedra, but also an associated displacement of Ca atoms. The ratio of O and Ca displacement is about l:-3 and the oxygen octahedral rotation angle is only
about 0.03. For such a complicated structure, even a complete first-principles
determination of its T= 0 structure would be very difficult. However, we can arrive at a partial understanding of this structure as follows. Our calculations show that the reference cubic structure is unstable towards either the iJ-point or the M-point AFD mode individually (negative u?), whereas it is stable with respect to the X-point mode individually (positive to2, no double-well behavior). In fact, the Z-point mode involves a strong distortion of the oxygen octahedron and thus is far from soft. However, the symmetry of the crystal is such that if both the i?-point and M-point AFD mode distortions are already simultaneously present, then the Ca and O atoms experience forces in the pattern of the Z-point mode, as a result of the cubic anharmonic interactions discussed in Sec. II. B. Thus, under these conditions the crystal would necessarily acquire some X-point mode

THEORY OF STRUCTURAL PHASE TRANSITIONS 199
distortion. We therefore conclude that the appearance of the Z-point mode distortion must be the result of the third-order coupling between R-, M-, and Z-point AFD modes. This is a major reason why we chose to include the third-order coupling in our model Hamiltonian. The strain coupling is expected to be important in the determination of the actual magnitude of the Z-mode distortion, complicating the problem and making a complete quantitative LDA determination of the Z-mode amplitude difficult.
To obtain the phase transition sequence, we start the MC simulation at a high temperature (7" > 2000 K) and equilibrate the system for 10,000 MC sweeps. An isotropic pressure Po = -ll.3GPa. is imposed to restore the experimental lattice constant, and all the subsequent simulations are done under this pressure. The temperature is reduced in small steps (as small as 10 K around the transition temperature) with 30,000 MC sweeps at each T to ensure equilibration. The order parameters are accumulated over the last 20,000 MC sweeps, after checking that they do not vary significantly over this period. In our simulation, we find that except for the i?-point AFD order parameters a(R), all other FE or AFD order parameters are zero throughout the simulation. So the only phase transition we observe is associated with a(R). Figure 1(a) shows the calculated order parameters a(R) as a function of temperature. (What we actually plot are the averaged maximum, intermediate, and minimum absolute values of the order- parameter components). At high temperature (T > 1800K) the system is in the cubic structure, where all the components are zero. The material goes through a phase transition at 1750 K, where all three order parameter components increase simultaneously. Our phase transition temperature is close to the experimentally measured 1530K, but we obtain the wrong low- temperature structure. Ours is rhombohedral with a 10-atom cell, instead of orthorhombic with a 20-atom cell as observed experimentally.
The difference between our theoretical result and experiment is not quite as dramatic as it might seem. Bot the structure and the structural energy are very similar for the i?-point and the M-point AFD mode polarized along (001). Note that in the observed structure, the amplitude of the M-point mode is about \/2/2 times the amplitude of the Ä-point mode polarized in the (110) direction. Thus, we can say that the main difference between our calculated structure and the observed one is that one component of the R- point AFD mode is replaced by an M-point mode in the observed structure. As argued above, the additional presence of the Z-mode is just a result of third-order anharmonic coupling. In fact, we find that if we artificially increase the third-order coupling constant B3 by a factor of 5, we recover the experimental T = 0 structure in our MC simulations.

200 D. VANDERBILT AND W. ZHONG
Clearly, the fact that the structure is strongly affected by relatively weak anharmonic intersite interactions make the determination of the correct low- temperature phase very difficult in CaTi03. It is possible that a more careful treatment of the cubic intersite interactions (for example, an independent determination of the coupling constants associated with all three of the cubic anharmonic invariants discussed in Sec II. B, or three-site or further- neighbor terms) might bring a better agreement with experiment, although one should not rule out the possibility that neglect of quantum fluctuations[21] or intrinsic limitations of the LDA might be at fault.
C. NaNb03
Experimentally, NaNb03 is probably the most complex cubic perovskite known. The high-temperature phase is the simple prototype cubic structure as in the other cubic perovskites. Below 910 K, a whole series of structural phase transitions has been found and at least six more phases have been identified. As the temperature decreases, the compound first goes through a cubic-tetragonal transition at 910 K with freezing in of a(R) modes polarized along one axis. There are then three orthorhombic phases present in the temperature range 845-638 K, the most complicated having a unit cell containing 24 NaNb03 formula units. All of these phases can be regarded as given by rigid rotations of oxygen octahedra, accompanied by small induced X-point distortions. From 638 K down to at least 170K, NaNb03 is antiferroelectric with an orthorhombic unit cell containing eight formula units. At even lower temperature, the crystal has been reported to transform into either a rhombohedral [32] or monoclinic [1] structure.
The complexity of the structural phase-transition sequence suggests the presence of several competing structural instabilities with very similar free energies. In principle, all the distortions involved in the observed structures of NaNb03 are included in our model. However, it is not realistic to expect that the calculated structural energies and free energies will be in exactly the right order, given the complexity of the problem and the level of accuracy of current first-principle based approaches. Nevertheless, we believe a first- principles study of NaNb03 is still important in identifying the most prominent distortions, as well as for demonstrating the limitations of such approaches.
The determination of the structure is done using MC simulations on a cubic 12x12x12 simulation supercell. An isotropic pressure P0 = -4.3 GPa is imposed to restore the experimental lattice constant, and all

THEORY OF STRUCTURAL PHASE TRANSITIONS 201
the subsequent simulations are done under this pressure. We start the simulation at very high temperature and equilibrate. The temperature is reduced in small steps ranging from 10 K to 50 K depending on proximity to a phase transition. At each temperature step, at least 40,000 MC sweeps are used to ensure that equilibrium is reached. The order parameters are accumulated over the last 30,000 MC sweeps.
The calculated averages of order parameters a(R) and f(T) are shown in Figure 1(b) as a function of temperature. All other modes are found to be zero throughout the simulation. As was the case for CaTi03, the averaged maximum, intermediate, and minimum absolute-value components are plotted. At high temperature (7" > 80 K), the system is in the cubic structure with all the order-parameter components close to zero. As T decreases to about 700 K, one AFD component increases rapidly and becomes significantly non-zero, and the structure transforms from cubic to tetragonal. With further decrease of temperature, a second component became non-zero, indicating the occurrence of an orthorhombic phase. Below 560 K, a third AFD component grows and the structure becomes rhombohedral. At very low temperature (below 50 K), the simulation also apparently shows a sequence of three ferroelectric transitions, and the compound ends up in a rhombohedral ferroelectric structure at very low temperature.
Our first cubic-tetragonal phase transition compares favorably with experiment; we obtain the correct structure and underestimate the transition temperature by only ~20%. In the orthorhombic phase, however, the calculated structure is much simpler than the observed one. Only one orthorhombic phase seems to occur in our simulation. However, Figure 1(b) shows signs of fluctuations occurring in the vicinity of this phase (these fluctuations persist even if the number of MC sweeps is increased significantly). This indicates that the orthorhombic phase is not very stable, and may involve a mixing of different phases. Moreover, the transitions do not appear very distinct in Figure 1(b) as a result of finite-size broadening, so increasing the lattice size may help to resolve the different phases. However, the computational load increases rapidly with increasing lattice size, and it becomes impractical to carry out simulations at much larger size. Our inability to get the correct AFE phase at room temperature is probably the most significant failure of our approach. Our zero-temperature structure is ferroelectric, but since the FE phases occur only at such low temperatures, it is likely that quantum fluctuations would need to be included to determine the actual low-temperature structure[21].

202 D. VANDERBILT AND W. ZHONG
V. DISCUSSION AND CONCLUSION
In this and previous studies, we perform a series of ab initio studies of the thermodynamic properties of perovskite compounds. Without introducing any adjustable parameters, we have calculated structural transition sequences, transition temperatures, phase diagrams, and other thermodynamic proper- ties based on first-principles calculations. For compounds with simple phase transitions, like BaTi03 and SrTi03, our calculated thermodynamic proper- ties agree very well with experimental observations. For more complicated compounds like CaTi03 and NaNb03, our results are less satisfying.
There are two major sources of errors, the inaccuracy of LDA calculations and the imperfection of our models. Our LDA calculations have been carefully performed to avoid possible errors, and convergence has been carefully tested. As for the intrinsic accuracy of LDA, our calculated structural parameters and energies are within a few percent of experimental values. Although this is the usual high accuracy observed generally for the LDA, it is unfortunately not enough for truly accurate determination of the thermodynamic properties of perovskites. For example, it is embarrassing that we are forced to choose between carrying out the calculations at the theoretical equilibrium lattice constant or the experimental lattice constant (negative fictitious pressure); this choice can affect phase transition temperatures by ~ 100%. We regard this as being the most important probable source of error in our calculations.
It is also possible to improve our model Hamiltonian. For example, our restricted assumption for the form of the third-order intersite interactions may be lifted, resulting in a significantly more complicated model Hamiltonian. Also, other higher-order terms can be included in the Hamiltonian. It would also be possible to include more degrees of freedom per cell, or include eigenvector information from more ^-points of the Brillouin zone when defining the local-mode vectors, to treat other phonon excitations more accurately [33]. However, in view of the current accuracy of first-principles calculations, we are not sure that these modifications would dramatically improve our results.
Finally, we emphasize that all of the MC simulations reported here treat the atomic motion puely classically. As mentioned above, we have recently reported results of quantum path-integral MC simulations showing that quantum fluctuations of the atomic coordinates (i.e., zero-point motion) can shift transition temperatures by tens of degrees, and in some cases even eliminate delicate phases[21]. Certainly this remains an important avenue of investigation for CaTi03 and NaNb03, but we nevertheless think it unlikely

THEORY OF STRUCTURAL PHASE TRANSITIONS 203
that inclusion of quantum fluctuations would immediately resolve the discrepancies with the experimental phase diagrams for these compounds.
In conclusion, we have extended our previous first-principles theory for perovskite ferroelectric phase transitions to treat also antiferrodistortive transitions. We apply this approach to the three cubic perovskite compounds SrTi03, CaTi03, and NaNb03, and calculate their thermo- dynamic properties including phase transition sequences and transition temperatures. For SrTi03, our calculated results are in good agreement with experiment. For CaTi03 and NaNb03, our calculated structural transitions have the correct general trend and the transition temperatures are in rough agreement with experiment, but the calculated transition sequences are not correct in detail. We attribute this to the larger distortions and many multiple competing instabilities in these compounds. For SrTi03, we also analyzed the intersite correlations for both FE and AFD local modes, finding needle-like and pancake-like correlations respectivley for FE and AFD modes as expected on physical grounds.
Acknowledgements
This work was supported by the Office of Naval Research under contract number N00014-91-J-1184. Partial supercomputing support was provided by NCSA grant DMR920003N.
References
[1] Lines, M. E. and Glass, A. M. (1977). Principles and Applications of Ferroelectrics and Related Materials (Clarendon Press, Oxford).
[2] Dove, M. T., Giddy, A. P. and Heine, V. (1992). Ferroelectrics, 136, 33. [3] Pytte, E. (1972). Phys. Rev. B, 5, 3758. [4] Bruce, A. D. and Cowley, R. A. (1981). Structural Phase Transitions (Taylor and Francis,
London). [5] Pytte, E. and Feder, J. (1969). Phys. Rev., 187, 1077; Feder, J. and Pytte, E. (1970). Phys.
Rev. B, 1, 4803. [6] Bilz, H., Benedek, G. and Bussmann-Holder, A. (1987). Phys. Rev. B, 87, 4840 and
references therein. [7] Gordon, G. and Kim, Y. S. (1972). J. Chem. Phys., 56, 3122; Boyer, L. L. et al. (1985).
Phys. Rev. Lett., 54, 1940; Edwardson, P. J. et al. (1989). Phys. Rev. B, 39, 9738. [8] Cohen, R. E. and Krakauer, H. (1990). Phys. Rev. B, 42, 6416; Cohen, R. E. and
Krakauer, H. (1992). Ferroelectrics, 136, 65; Cohen, R. E. (1992). Nature, 358, 136. [9] Singh, D, J. and Boyer, L. L (1992). Ferroelectrics, 136, 95.
[10] King-Smith, R. D. and Vanderbilt, D. (1994). Phys. Rev. B, 49, 5828, Ferroelectrics, 136, 85 (1992).
[11] Zhong, W., Vanderbilt, D. and Rabe, K. M. (1994). Phys. Rev. Lett., 73, 1861. [12] Zhong, W., Vanderbilt, D. and Rabe, K. M. (1995). Phys. Rev. B, 52, 6301. [13] Rabe, K. M. and Waghmare, U. V. (1996). J. Phys. Chem. Solids, 57, 1397. [14] Zhong, W. and Vanderbilt, D. (1995). Phys. Rev. Lett., 74, 2587. [15] Note the change of notation between Ref. [12] and this paper. Variables / and u here
correspond to u and v in Ref. [12], respectively.

204 D. VANDERBILT AND W. ZHONG
[16] Vanderbilt, D. (1990). Phys. Rev. B, 41, 7892. [17] Payne, M. C, Teter, M. P., Allan, D. C, Arias, T. A. and Joannopoulos, J. D. (1992). Rev.
Mod. Phys., 64, 1045. [18] Arias, T. A., Payne, M. C. and Joannopoulos, J. D. (1992). Phys. Rev. Lett., 69, 1077. [19] Monkhorst, H. J. and Pack, J. D. (1976). Phys. Rev. B, 13, 5188. [20] Allen, M. P. and Tildesley, D. J., Computer Simulation of Liquids (Oxford, New York,
1990)'; K. Binder, Ed. The Monte-Carlo Method in Condensed Matter Physics (Springer- Verlag, Berlin, 1992).
[21] Zhong, W. and David Vanderbilt (1996). Phys. Rev. B, 53, 5047. [22] Shirane, G. and Yamada, Y. (1969). Phys. Rev., Ill, 858; Buyers, W. and Cowley, R.
(1969). Solid State Commun., 1, 181. [23] Müller, K. A. and Burkard, H. (1979). Phys. Rev. B, 19, 3593; Müller, K. A., Berlinger, W.
and Tosatti, E. (1991). Z. Phys. B, 84, 277. [24] Viana, R. et al. (1994). Phys. Rev. B, 50, 601. [25] Martonäk, R. and Tosatti, E. (1994). Phys. Rev. B, 49, 12596. [26] Zhong, W., King-Smith, R. D. and Vanderbilt, D. (1994). Phys. Rev. Lett., 72, 3618. [27] Granicher, A. and Jakits, O. (1954). Nuove Cimento Suppl, 9, 480. [28] Vogt, T. and Schmahl, W. W. (1993). Europhys. Lett., 24, 281. [29] Kay, H. F. and Bailey, P. C. (1957). Ada Crystallogr., 10, 437. [30] Liu, X. and Liebermann, R. C. (1993). Phys. Chem. Minerals, 20, 171. [31] Sasaki, S., Prewitt, C. T. and Bass, J. D. (1987). Acta Crystallogr., 43, 1668. [32] Landolt-Bornstein Numerical Data and Functional Relationships in Science and Technology,
edited by T. Mitsui et al. (Springer-Verlag, Berlin, 1981), NS, Group III, 16; ibid, edited by E. Nakamura et al, NS, Group III, 28.
[33] Rabe, K. M. (1995). Phys. Rev. B, 52, 13236.

Ferroelectrics, 1998, Vols. 206-207, pp. 205-217 Reprints available directly from the publisher Photocopying permitted by license only
i 1998 OPA (Overseas Publishers Association) Amsterdam B.V. Published under license
under the Gordon and Breach Science Publishers imprint.
Printed in India.
AB INITIO PHONON DISPERSION CURVES AND INTERATOMIC FORCE CONSTANTS
OF BARIUM TITANATE
PH. GHOSEZ, X. GONZE and J.-P. MICHENAUD
Unite de Physico-Chimie et de Physique des Materiaux, Universite Catholique de Louvain, 1 Place Croix du Sud, B-1348 Louvain-la-Neuve, Belgium
(Received 24 February 1997)
The phonon dispersion curves of cubic BaTi03 have been computed within a first-principles approach and the results compared to the experimental data. The curves obtained are very similar to those reported for KNb03 by Yu and Krakauer (Phys. Rev. Lett., 74, 4067 (1995)). They reveal that correlated atomic displacements along (100) chains are at the origin of the ferroelectric instability. A simplified model illustrates that spontaneous collective displacements will occur when a dozen of aligned atoms are coupled. The longitudinal interatomic force constant between nearest neighbour Ti and O atoms is relatively weak in comparison to that between Ti atoms in adjacent cells. The small coupling between Ti and O displacements seems however necessary to reproduce a linear ferroelectric instability.
Keywords: BaTi03; phonon dispersions curves; ferroelectric instability; density functional theory; linear response
1. INTRODUCTION
Barium titanate (BaTi03) is well known to exhibit three ferroelectric phase transitions: stable at high temperature in a perovskite cubic phase, its structure becomes successively tetragonal, orthorhombic and finally rhombohedral as the temperature goes down. Many works investigated and discussed the origin of its ferroelectric phase transitions [1]. Amongst them, the most gratifying contribution was probably due to Cochran [2] who associated the ferroelectric instability with the softening of a transverse optic phonon, and emphasized the connection between the structural instability and the lattice dynamics.
205

206 PH. GHOSEZ et al.
Consequently to Cochran's work, a large amount of experiments have been performed in order to confirm the existence of a soft ferroelectric mode in BaTi03. They include infrared [3' 4] and Raman [5] measurements of the Y phonon modes as well as various neutron diffraction data [6~11]. These experiments focused on the temperature behaviour of the soft phonon and were mainly concerned by the low frequency modes: only a few results are available for the higher energy vibrations.
Simultaneously, theoretical phonon dispersion curves were deduced from fits to the experimental data using different shell models. Let us mention the pseudo-ionic model developped by Gnininvi and Bouillot [12] or the rigid- shell model used by Jannot et al. [11]. These models were however not particularly suited to describe ABO3 crystals, like BaTi03. Migoni, Bilz and Bäuerle [13] pointed out that the behaviour of the ferroelectric soft mode in the oxidic perovskites originates from the unusual anisotropic polarizability of the oxygen that, in turn, may be connected to hybridization between 0-2p and B-d states. Consequently, a more sophisticated "polarizability model" [14] was introduced in order to include the specific physical features of ABO3 compounds. The application of this model to BaTi03 was reported by Khatib et al. [15] In their work, they obtained a full phonon band structure and investigated the temperature behaviour of the ferroelectric soft mode. However, their interesting results still remained at a semi-empirical level.
Since a few years, theoretical advances have enabled one to determine the phonon dispersion curves of solids within a truly first-principle approach. Recently, ab initio results have been reported for KNb03
[16] and SrTi03 [17].
Similarly, in this paper, we investigate the lattice dynamics of BaTi03. Our phonon frequencies compare well with the experimental data
available. Moreover, our dispersion curves are very similar to those reported for KNb03
[16], a perovskite material presenting the same sequence of phase transitions as BaTi03. In particular, the wave vector of the unstable phonon modes remains located in three (110) slab region of the Brillouin zone, emphasizing a chain-structure instability in real space [16]. This behaviour is illustrated with a simplified model. The range and anisotropy of the interatomic force constants are also discussed.
2. TECHNICALITIES
Our calculations have been performed in the general framework of the density functional formalism [18]. The exchange-correlation energy func- tional was evaluated within the local density approximation, using a

AB INITIO PHONON DISPERSION CURVES 207
polynomial parametrization of Ceperley-Alder [19] homogeneous electron gas data.
We used a plane-wave pseudopotential approach. The all-electron potentials were replaced by the same extended norm conserving highly transferable pseudopotentials as in Ref. [20]. We have considered 5s, 5p and 6s as valence states to build the Ba pseudopotential, 3s, 3p, 3d and 4s valence states for the Ti pseudopotential and 2s and 2p valence states for the O pseudopotential. The electronic wave function was expanded in plane waves up to a kinetic energy cutoff of 45 Hartree (about 6200 plane waves). Integrals over the Brillouin zone were replaced by sums on a mesh of 6x6x6 special fc-points [21l
The dynamical matrix, Born effective charges and dielectric tensor were computed within a variational formulation [22] of the density functional perturbation theory [23]. First, calculations were carried out to determine the dynamical matrix on different meshes of g-points. Then, an interpolation was performed following the scheme proposed in Ref. [24, 25].
This technique takes properly into account the long-range behaviour of the dipole-dipole interaction which is separated from the remaining short- range forces owing to the knowledge of the Born effective charges and the optical dielectric tensor.
An insight into the convergence reached on the phonon dispersion curves is reported in Figure 1. The frequencies deduced from the dynamical matrix at 0 = (0.125, 0.125, 0.125) and ? = (0.375, 0.375, 0.375) are compared to those extrapolated from two different meshes of ^-points: the first mesh (Ml) includes r (0, 0, 0), X (0.5, 0, 0), M (0.5, 0.5, 0) and R (0.5, 0.5, 0.5) points; the second mesh (M2) is the cubic mesh Ml to which the A (0.25, 0.25, 0.25) point was added. We obtain a very good convergence with the M2 mesh.
3. THE PHONON DISPERSION CURVES
Our calculations are performed at the experimental lattice parameter of 4.00 A. This choice facilitates the comparison with the experimental data. Some indication on the volume dependence of the phonon frequencies can be found in Ref. [26], where the frequencies of the Y phonons at different lattice constants have been compared.
First, we present in Table I the Born effective charges and the optical dielectric constant[27], important ingredients of the present study since their knowledge allows to identify the long-range part of the interatomic force

208 PH. GHOSEZ et al.
800
FIGURE 1 Convergence achieved on the calculated phonon dispersion curves of cubic BaTi03 along the Y-R line. The open symbols correspond to ^-points included in the Ml (circle) and Ml (circle + square) meshes used to extrapolate the curves (Ml: dotted lines; Ml: full lines). The filled symbols are associated to points not included in the Ml mesh: they illustrate that a satisfactory convergence is obtained with the Ml mesh.
TABLE I Born effective charges and optical dielectric constant of cubic BaTi03 at the experimental volume [271
Experiment Present Zhong et al.
°o±
i.r + 2.74 + 2.75 6.7a + 7.32 + 7.16 2.4a -2.14 -2.11 4.8a -5.78 -5.69 5.40b 6.75 -
1 Ref. [28]. b Ref. i[32]. Ref. [29].
constants and makes the interpolation of phonon frequencies tractable. For Ba and Ti atoms, the effective charge tensor is isotropic. For O, the two independent components of the tensor correspond respectively to a displacement of the atom parallel (ZQ,,) and perpendicular (ZQ±) to the

AB INITIO PHONON DISPERSION CURVES 209
Ti —O bond. Z*{ ( + 7.32) and Z^ (-5.78) are anomalously large [20' 28"30]
with respect to the nominal ionic charges ( + 4 for Ti and -2 for O). This surprising phenomenon was explained recently in connection within dynamic changes of hybridization between 0-2p and Ti-3d orbitals [30' 31]. This specific feature is at the origin of a large destabilizing dipole-dipole interaction, connected to the anomalous mode effective charge [26'29] and the instability of the ferroelectric mode [26].
Our computed optical dielectric constant (6.75) largely overestimates the experimental value (5.40) [32], as usual within the local density approxima- tion. This discrepancy will essentially affect the position of the highest longitudinal optic mode: when replacing the theoretical dielectric constant by the experimental value, its frequency at the T point changes from 631 to 696 cm-1. At the opposite, the frequencies of the two other longitudinal modes at the T point are affected by less than 2 cm"1.
The calculated phonon dispersion curves are plotted along high symmetry directions in Figure 2. The T-X, Y-M and Y-R lines are along the (100), (110) and (111) directions, respectively. The unstable modes associated to a negative curvature of the energy hypersurface have imaginary phonon frequencies. The frequencies at the high symmetry points are reported in Table II.
Our result can be compared to the experimental data [3' 6~11]. However, a complication arises from the fact that all the experimentally observed
TABLE II Computed phonon frequencies (cm ') of cubic BaTi03 at Y, X, M and R. Symmetry labels follow the convention of Ref. [33]
q-point label frequency label frequency
f r15(TO) mi f^ 281
M
r,5(A) 0 r15(LO) 445 rls(LO) 159 r.scro) 453 r15(TO) 166 rls(LO) 631
X5 189/ x3 322 Xy 104 Xs 330 x2, 146 x5 421 Xs 194 Xx 517 Xi 260 x2. 627 My 167/ M5 344 M2, 103 M2 354 My 104 My 435 M3 208 M, 456 My 270 M4 683 My 333
Rl5 128 RJS 386 R25 182 Ru 414 i?12' 314 R2, 717

210 PH. GHOSEZ et al.
N I
Ü C CD
0)
25
20
15
10
5i
10 i
V*-^
v
p=
-
a A ^=—=^r
2-L ^\~~
et^-r
&
—- A
' (
1 ~^"^~
M R
800
600
400
200
CD X! C CD 3 O >< 'o 3
200 i
M
FIGURE 2 Calculated phonon dispersion curves of cubic BaTi03 at the experimental lattice constant The theoretical result shows a reasonable agreement with the experimental data: (•) Ref. [3], (O) Ref. [6], ( + ) Ref. [7], (D) Ref. [8], (x) Ref. [9], (V) Ref. [10], (A) Ref. [11].
vibrational excitations have a real frequency while the computed unstable modes are obtained with an imaginary frequency. As the soft mode can be clearly identified by its symmetry, the associated experimental frequencies were removed from the comparison, for clarity. In the low frequency region, the presence of this additional soft mode may have slightly modified the frequency of the other modes. In spite of these difficulties we observe a good correspondence between our theoretical frequencies and the experimental data, especially for the acoustic modes for which a large variety of data are
available. The ferroelectric phase transitions- are driven by the unstable phonon
modes. We are therefore mainly concerned by the analysis of these specific phonons. Two transverse optic modes are unstable at the T point: they correspond to a displacement of the Ti atom against the oxygen cage. The associated displacement eigenvector is equal to [<S(Ba) = -0.002, 6(Ti) = -0.096, «5(00=+0.158, S(02) = 6(03)= +0.071] [34]. These two modes remain unstable all along the T-X line, with very little dispersion. One of them stabilizes along the T-M and X-M lines. Examination of the eigenvectors reveals that the unstable mode at the M(0.5, 0.5, 0) point is polarized along the z-direction: its displacement eigenvector is equal to [<5(Ti2) = -0.130, <5(0ljZ)= +0.106] [34]. Both of the unstable modes become stable when deviating from the three T-X-M planes to the i?-point.

AB INITIO PHONON DISPERSION CURVES 211
These features were also observed for KNb03[161 and point out a marked
2D character of the instability in the Brillouin zone. This behaviour is more easily visualized in Figure 3 where we show the frequency isosurface of the lowest unstable phonon branch corresponding to w = 0. The region of instability, uj2(q) < 0, lies between three pairs of flat surfaces, that are parallel to the faces of the Brillouin zone cube. In other words, the unstable modes are contained in three perpendicular interpenetrating slab-like regions of finite thickness containing the T point.
As highlighted by Yu and Krakauer [I6], this behaviour corresponds to chain instabilities in real space. At the M-point, we have seen that there is a single unstable mode polarized along the z-axis and dominated by the Tiz and 01z displacements. At this wave vector (qz = 0), the Ti and Oi atoms will be coherently displaced all along an infinite (001) chain. Going now from M to the Ä-point, the coherency of the displacement will gradually disappear and a finite length of correlation will be reached for which the phonon becomes stable. The finite thickness of the slab region of instability therefore corresponds to a minimum correlation length of the displacement required to observe an unstable phonon mode. From Figure 3, the length of the shortest unstable chain can be estimated to 4 aCeii = 16 A [35]. Note finally, the small dispersion of the unstable mode in the T-X-M plane suggests a small correlation of the displacements between the different Ti — O chains.
FIGURE 3 Zero-frequency isosurface of the lowest unstable phonon branch over the Brillouin zone. V is located at the center of the cube. The mode is unstable in the region between the nearly flat surfaces.

212 PH. GHOSEZ et al.
4. THE INTERATOMIC FORCE CONSTANTS
In cubic BaTi03, we will see that the single displacement of a particular atom never leads to an instability: When one atom is displaced, a force is induced and brings it back in its initial position (see Tabs. III-V: the self- force on Ti and O is positive). However, its atomic displacement will simultaneously induce forces on the other atoms. It is only the additional displacement of some other atoms in this force field that can lower the total energy and produce an instability. The amplitude and the range of the interatomic force constants (IFC) associated to this mechanism can be
TABLE III Longitudinal (||) and transverse (_L) interatomic force constants (Ha/Bohr2) with respect to a reference Ti atom (Ti(0)) along the Ti—O chain of cubic BaTiQ3
Atom
Ti(0) 0||(D Ti,|(2) 0||(3) Ti|,(4) OxO) Tix(2)
Total force DD force SR force
+ 0.15215 -0.27543 + 0.42758
+ 0.00937 + 0.23247 -0.22310 -0.06721 -0.03680 -0.03041
+ 0.01560 + 0.00861 + 0.00699 -0.00589 - 0.00460 -0.00129 -0.02114 - 0.04298 + 0.02184
+ 0.00751 + 0.01840 - 0.01089
TABLE IV Ti—Ti longitudinal interatomic force constants (Ha/Bohr ) with respect to a reference Ti atom at (0.5, 0.5, 0.5)
coordinate distance
(0.5, 0.5, 0.5) (-0.5, 0.5, 0.5) (-0.5, -0.5,0.5) (-0.5, -0.5, -0.5) (-1.5,0.5,0.5)
0.0000 7.5589
10.6899 13.0924 15.1178
IFC
+ 0.15215 -0.06721 -0.01114 -0.00643 -0.00589
DD part
- 0.27543 - 0.03680 -0.01301 - 0.00780 - 0.00460
SR part
+ 0.42758 -0.03041 + 0.00187 + 0.00065 -0.00129
TABLE V O —O longitudinal interatomic force constants (Ha/Bohr2) with respect to a reference O atom at (0.5, 0.5, 0) ^^
coordinate
(0.5, 0.5, 0) (0.5, 0, 0.5) (-0.5, 0.5, 0) (0.5,0.5, -1.0) (-0.5, 0, 0.5) (-0.5, -0.5,0) (-0.5, 0.5, -1) (0.5, -1, -0.5) (-0.5, -0.5, -1)
distance
0.0000 5.3450 7.5589 7.5589 9.2577
10.6899 10.6899 11.9517 13.0924
IFC
+0.12741 -0.02838 -0.00190 -0.03212 -0.00183 -0.00290 -0.00415 -0.00254 -0.00113
DD part
-0.35322 -0.03367 -0.00314 -0.02295 -0.00289 -0.00111 -0.00340 -0.00246 -0.00129
SR part
+0.48062 +0.00529 +0.00124 -0.00918 +0.00106 -0.00179 -0.00078 -0.00008 +0.00016

AB INITIO PHONON DISPERSION CURVES 213
analysed in order to clarify the chain instability pointed out in the previous Section. Moreover, the specific role of the dipole-dipole interaction (DD) can be separated from that of the short-range forces (SR) following the scheme proposed in Ref. [25]. Our conventions on the interactomic force constants Ca{n, K!) are such that the force Fa(n) induced on atom K by the displacement Ar/3(«;') of atom K! is given by: Fa (K) = -Cai/9(re,
Let us first investigate the IFC with respect to a reference Ti atom along a Ti — O chain (Tab. III). As previously mentioned, we note that the self-force on the Ti atom is large and positive ( + 0.15215 Ha/Bohr2). We observe also that the longitudinal IFC with the first neighbour O atom is surprisingly small ( + 0.00937 Ha/Bohr2); moreover, it is positive. The analysis of the DD and SR contributions points out that these characteristics are the result of a destabilizing DD interaction, sufficiently large to compensate the SR forces. It is this close compensation which allows the displacement of Ti against the O atoms. Another insight on this balance of forces was already reported in Ref. [26]. Consequently to the very small total IFC, the Ti and O displacements might be relatively decoupled.
At the opposite, the DD forces induced on the next Ti atom are negative: they will combine with the SR forces in order to produce sizeable coupling (-0.06721 Ha/Bohr2). This mechanism is at the origin of the chain correlation of the Ti atomic displacements. By contrast, the transverse force on the first Ti neighbour is very small ( + 0.00751 Ha/Bohr2) and confirms the small correlation of the displacements from chain to chain.
The decay of the Ti—Ti and O—O longitudinal IFC with the interatomic distance can also be investigated. The results are reported in Tables IV and V. It is seen that the longitudinal IFC are anisotropic: they propagate essentially along the Ti — O chain. This appears clearly for the SR part. For O, the DD contribution is also highly anisotropic due to the anisotropy of the Born effective charges. The anisotropy of the IFC is inherent to the chain correlation previously mentioned in this paper.
5. THE CHAIN-STRUCTURE INSTABILITY
From the knowledge of the IFCs previously reported, we can also investigate the energy surface of BaTi03 and illustrate the chain correlation highlighted in Section 3. Let us consider that we have a bulk cubic crystal with the atoms frozen at their equilibrium position TKO. Then, we allow displacements of Ti and O atoms belonging to a [100] single Ti—O chain of

214 PH. GHOSEZ et al.
finite but increasing size. The total energy of this system will be given by:
E(TK) = E{TJ + £CU (K>OAT.AV
where C is the interatomic force constant matrix and the sum on re and re' is restricted to the Ti and O atoms that are allowed to move. With the help of this equation, we can track the appearance of an instability in terms of the length of the chain of displaced atoms. An instability will correspond to a specific displacement pattern that lowers the total energy of the system: it will be associated to a negative eigenvalue of the restricted force constant matrix.
In Figure 4, we report the evolution of the lowest eigenvalue of the force constant matrix with respect to the length of the chain of moving atoms. Displacing only a single atom, the force induced on the Ti is larger than that on the O atom. With 3 atoms, we observe, at the opposite, that the Ti- terminated chain (Ti —O —Ti) is more stable than the O-terminated one (O — Ti — O): it points out the important role of the Ti—Ti interaction. The difference between Ti and O terminated chains will disappear progressively with the chain length. It is seen that an instability takes place for a chain longer than 10 atoms (5 unit cells). This is in close agreement with the correlation length estimated in the previous Section. It suggests that
0.2 CD^ .C 3
0.15
©■= 3 +-
11 0.1 £+- CD C O)C0
"CDW 0.05 *- c CO o CD O
"cö 9> 0 py co £
-0.0b
n 1 1 1 1 r
■ [Ti-O] -Ti chain o [Ti-O] chain ♦ [O-Ti] -O chain
■ 9 > ' ° • O , 0 _
0 2 4 6 8 10 12 14 16 18
Chain length (atom)
FIGURE 4 Lowest eigenvalue of the restricted force constant matrix associated to atomic displacements along a finite Ti —O chain of increasing size.

AB INITIO PHONON DISPERSION CURVES 215
the behaviour of BaTi03 is already well reproduced when considering an isolated Ti —O chain of displacements. It confirms that the correlation between the different chains may play a minor role.
Going further and frozing all the O atoms in such a way that only the Ti atoms are allowed to move along the chain, we can repeat the previous investigations. For this case, however, we do not observe any instability even for an infinite chain of correlated Ti displacements. This result aims to prove that the relatively weak coupling between Ti and O displacements still remains an important feature in the appearance of the linear structural instability.
For completeness, we note however that, contrary to what was observed for the chain, the cooperative displacement of all the Ti atoms of an infinite 3-dimensional crystal is also able to induce the instability.
6. CONCLUSIONS
In summary, we have reported first-principles linear response calculations of the phonon dispersion curves of cubic BaTi03. Our results are in good agreement with the experimental data. Moreover, they are very similar to those reported for KNb03, a cubic perovskite material presenting a sequence of phase transitions analogous to BaTi03. In particular it was seen that a ferroelectric instability takes place when correlated atomic displace- ments are allowed along (100) chains of finite length. This has been investigated with a simplified model and the length of the shortest unstable chain estimated to a dozen of atoms. The interatomic force constants are anisotropic and propagate essentially along the Ti—O chains. Their analysis has emphasized the correlation of the Ti displacements. It has been shown that the Ti and O atomic displacements are only weakly coupled. This small coupling remains however an important ingredient to reproduce the linear ferroelectric instability.
A cknowledgements
We thank J.-M. Beuken for permanent computer assistance. X.G. is grateful to the FNRS-Belgium for financial support. This paper presents research results of the Belgian Program on Interuniversity Attraction Poles initiated by the Belgian State-Prime Minister's Office Science Policy Programming. We acknowledge the use of the RS 6000 work stations and the Namur

216 PH. GHOSEZ et al.
Scientific Computing Facility (Namur-SCF), which are common projects between IBM Belgium and respectively, the Catholic University of Louvain (UCL-PCPM) and the Facultes Universitaires Notre Dame de la Paix (FUNDP-LPMPS).
References
[1] Lines, M. E. and Glass, A. M. (1977). "Principles and Applications of Ferroelectrics and Related Materials", Clarendon Press, Oxford.
[2] Cochran, W. (1960). Adv. Phys., 9, 387. [3] Luspin, Y., Servoin, J. L. and Gervais, F. (1980). /. Phys., C13, 3761. [4] Servoin, J.-L., Gervais, F., Quittet, A. M. and Luspin, Y. (1980). Phys. Rev., B21, 2038;
Servoin, J.-L., Luspin Y. and Gervais, F. (1981). Ferroelectrics, 37, 523; Müller, K. A., Luspin, Y., Servoin, J.-L. and Gervais, F. (1982). J. Physique, 43, L-537.
[5] Perry, C. H. and Hall, D. B. (1965). Phys. Rev. Lett., 15, 700; Scalabrin, A., Chaves, A. S., Shim, D. S. and Porto, S. P. S. (1977). Phys. Stat. Sol. (b), 79, 731; Jannot, B., Gnininvi, L. and Godefroy, G. (1981). Ferroelectrics, 37, 669; Godefroy, G, Jannot, B., Levanyuk, A. and Sigov, A. (1984). Ferroelectrics, 54, 297; Laabidi, K., Fontana, M. D. and Jannot, B. (1990). Solid State Comm., 76, 765; Dougherty, T. P. et al. (1992). Science, 258, 770; Nakamura, T. (1994). Ferroelectrics, 137, 65; Fontana, M. D., Laabidi, K. and Jannot, B. (1994). J. Phys.: Cond. Matt., 6, 8923.
[6] Shirane, G, Frazer, B. C, Minkiewicz, V. J., Leake, J. A. and Linz, A. (1967). Phys. Rev. Lett., 19, 234.
[7] Yamada, Y., Shirane, G. and Linz, A. (1969). Phys. Rev., Ill, 848. [8] Shirane, G, Axe, J. D.t Harada, J. and Linz, A. (1970). Phys. Rev., B2, 3651. [9] Harada, J., Axe, J. D. and Shirane, G (1971). Phys. Rev., B4, 155.
[10] Bouillot, J., Escribe, C, Fitzgerald, W. J. and Gnininvi, L. (1979). Solid State Comm., 30, 521.
[11] Jannot, B., Escribe-Filippini, C. and Bouillot, J. (1984). /. Phys., C17, 1329. [12] Gnininvi, L. and Bouillot, J. (1977). Ferroelectrics, 15, 173. [13] Migoni, R., Bilz, H. and Bäuerle, D. (1976). Phys. Rev. Lett., 37, 1155. [14] Bilz, H., Benedek, G. and Bussmann-Holder, A. (1987). Phys. Rev., B35,4840; Bussmann-
Holder, A., Bilz, H. and Benedek, G. (1989). Phys. Rev., B39, 9214. [15] Khatib, D., Migoni, R., Kugel, G E. and Godefroy, L. (1989). J. Phys.: Condens. Matter,
1,9811. [16] Yu, R. and Krakauer, H. (1995). Phys. Rev. Lett., 74, 4067. [17] LaSota, C, Wang, C.-Z., Yu, R. and Krakauer, H. (1997). Ferroelectrics, 194, 109. [18] Pickett, W. E. (1989). Comput. Phys. Rep., 9, 115; Payne, M. C, Teter, M. P., Allan, D. C,
. Arias, T. A. and Joannopoulos, J. D. (1992). Rev. Mod. Phys., 64, 1045. [19] Ceperley, D. M. and Alder, B. J. (1980). Phys. Rev. Lett., 45, 566. [20] Ghosez, Ph., Gonze, X. and Michenaud, J.-P. (1994). Ferroelectrics, 153, 91. [21] Monkhorst, H. J. and Pack, J. D. (1976). Phys. Rev., B13, 5188; ibid., Phys. Rev., B16,
1748 (1977). [22] Gonze, X., Allan, D. C. and Teter, M. P. (1992). Phys. Rev. Lett., 68, 3603. [23] Zein, N. E. (1984). Sov. Phys., Solid State, 26, 1825; Baroni, S., Giannozzi, P. and Testa, A.
(1987). Phys. Rev. Lett., 58, 1861. [24] Giannozzi, P., de Gironcoli, S., Pavone, P. and Baroni, S. (1991). Phys. Rev., B43, 7231. [25] Gonze, X., Charlier, J.-C, Allan, D. C. and Teter, M. P. (1994). Phys. Rev., B50, 13035. [26] Ghosez, Ph., Gonze, X. and Michenaud, J.-P. (1996). Europhys. Lett., 33, 713; Ghosez,
Ph., Gonze, X. and Michenaud, J.-P. (1997). Ferroelectrics, 194, 39. [27] The values presented here are slightly different from those reported by us elsewhere
[20, 26, 30] due to the different convergence reached in the calculation. [28] Axe, J. D. (1967). Phys. Rev., 157, 429. [29] Zhong, W., King-Smith, R. D. and Vanderbilt, D. (1994). Phys. Rev. Lett., 72, 3618.

AB INITIO PHONON DISPERSION CURVES 217
[30] Ghosez, Ph., Gonze, X., Lambin, Ph. and Michenaud, J.-P. (1995). Phys. Rev., B51, 6765; Ghosez, Ph., Gonze, X. and Michenaud, J.-P. (1995). Ferroelectrics, 164, 113.
[31] Posternak, M., Resta, R. and Baidereschi, A. (1994). Phys. Rev., B50, 8911. [32] £00 was obtained by extrapolating to zero frequency index of refraction measurements
[Burns, G. and Dacol, F. H. (1982). Solid State Comm., 42, 9] at different wavelengths using a one-oscillator Sellmeier equation.
[33] Cowley, R. A. (1964). Phys. Rev., 134, A981.
[34] The eigendisplacement vector r\ was normalized such that (JJ|M|?7) = 1, where M is such that M=MKS^fj and Mn is the mass of atom K in atomic mass units.
[35] The length of the shortest unstable chain is slightly different from that reported for KNb03. Changes in material properties could explain this difference although part of it could be due to the different fc-point and #-point convergence achieved in Ref. [16]: as observed in Figure 1, the use of a finer mesh of ^-points could still slightly decrease the size of the zone of instability of BaTi03.

Ferroelectrics, 1998, Vols. 206-207, pp. 219-230 Reprints available directly from the publisher Photocopying permitted by license only
i 1998 OPA (Overseas Publishers Association) Amsterdam B.V. Published under license
under the Gordon and Breach Science Publishers imprint.
Printed in India.
LATTICE DYNAMICS STUDY ON CUBIC BARIUM TITANATE BASED UPON A MODIFIED RIGID-SHELL MODEL
N. TAKESUE a, H. KUBO b and HAYDN CHENc
a Institute for Solid State Physics, University of Tokyo, Ibaraki 319-11, Japan;
b Department of Materials Processing, Tohoku University, Sendai 980-77, Japan; 0 Department of Materials Science and Engineering, and Materials Research
Laboratory, University of Illinois at Urbana-Champaign Urbana, IL 61801, USA
(Received in final form April 1997)
The rigid-shell model has been revisited in this paper for the lattice dynamics calculations in the paraelectric BaTi03 since a few decades ago. The conventional harmonic models of Cowley et cd. and Jannot et al, have been modified by including more interatomic force constants. The force constants were adjusted to fit the calculated phonon dispersion curves to the observed data from inelastic neutron scattering studies that were available in the literature. The calculated dispersions agree satisfactorily with the experimental results. Degeneracies of the phonon branches, as required by the crystal symmetry consideration, have been correctly reproduced for the first time. The fitting parameters of our model have values whose trends are seen to have similar behavior to the previous models. Moreover, the newly employed parameters have shown interesting features related to the short-range, non-Coulombic interactions of the ions.
Keywords: Perovskite; phonon; rigid-shell model; lattice dynamics
1. INTRODUCTION
This lattice dynamics work is a part of our study of the para-to-ferroelectric phase transformation of the perovskite ferroelectrics[1 ~7]. Phonon properties including lattice anharmonicity which might be important to the transition have been investigated by the current authors in which the X-ray thermal diffuse scattering (TDS) intensities from paraelectric BaTi03 were measu- red [7] at elevated temperatures. The observed thermal diffuse scattering must be analyzed based upon theories of scattering from phonons [8' 9].
219

'3
220 N. TAKESUE et al.
According to the TDS theories, values of the frequencies and eigen vectors as functions of the phonon wave vector k are needed in order to calculate the X-ray TDS intensity. The required data can be obtained through the normal mode analysis by solving the eigen value problem based on the rigid-shell model. We have applied this method to the cubic (paraelectric) BaTi03 system in this article.
Earlier work of the harmonic lattice dynamics for the paraelectric BaTi03
were done around 1980 by Bouillot et al.[10] and by Jannot et al.[11'12], who basically employed the original rigid-shell model of Cowley et al. t13_18]
developed in 1960s. Their calculated dispersion curves agreed reasonably well with observed neutron scattering data. However, using the interatomic force constants determined by Jannot's work along with the original lattice dynamics model developed by Cowley, we were unable to reproduce their calculated phonon dispersion curves. This implies that there might be an implementation difference between the two models. However, this difference cannot be discovered through review of the two models since there is no precise explanation of Jannot's model in the published literature. Therefore, we have constructed our own rigid-shell model. Details of the modeling and algorithm of the computation will be presented along with results of our calculation in the cubic BaTi03 system. Validity of this model will be assessed by inspecting values and trends of the attained fitting parameters.
2. METHOD OF ANALYSIS
We assumed a pair potential model of ionic crystals in a central force sys- tem [19' 20] under the harmonic approximation. Each atom is polarized and consists of a core and a shell; the core is the nucleus of an atom with tightly bound electrons, and the shell corresponds to loosely bound electrons, i.e., an electron cloud. This model is illustrated in Figure 1. These assumptions lead to the following expression for the potential V.
ij s-y s '7'
4EEE5^ - * v)[< - vJvK - vi'7<] (i) ij s-y s'f'
+zE E E c^ -5 V)K7 - vj,7,][v^ - v^7,], 4' ij sj s'r/'

LATTICE DYNAMICS STUDY ON BaTiO, 221
000
FIGURE 1 A schematic representation of the rigid-shell model. Cores are indicated by filled circles, and shells by ellipses, the central force system is assumed.
where i and_/ are the Cartesian indices, s is an index of the unit cell, 7 is an index of the atomic species in the unit cell, and AiJ(sj—s''y'), BiJ(s"/—s''y') and C,y(j7—s'7') are the interatomic force constants for the interactions between the core-core, core-shell and shell-shell pairs, respectively.
Each interatomic force constant is composed of Coulombic and (short- range) non-Coulombic force constants and is written as
Ay(s"f -s'-y')= Rij(sj - 5'7') + e7e7lFij(s^ -s'j'), (2a)
Btjin - s'7') = Tyisj - s'j') + e.YyFy^ - s'-y'), (2b)
and
Cv(yy -s'y') = Sv(rr - * V) + Y^.F^ -s'-y'), (2c)
where e7 and F7 are charges of the core and shell. Summing them for one species 7 corresponds to the effective charge, while electrical neutrality is maintained so that a sum of the effective charges over all the species becomes zero. Fij(s
ry—s''f') is the Coulombic force-constant coefficient derived by using the Ewald transformation [19' 20-21l. Each of the non- Coulombic constants is further separated into two terms; one is the parallel component along the interatomic vector of each 77' pair, and the other is the perpendicular component to that vector.

222 N. TAKESUE et al.
It clear that no short range force is exerted between the core and shell at s1 = s'1
l (since they are placed at the same position) so the dipole moment between them is zero, as illustrated in Figure 2(a). However, in an actual case, a nonzero relative displacement of the core or shell produces a dipole moment, as seen in Figure 2(b), which generates the electric field. Therefore,
the Coulombic potential,
appears in the system through the interaction between the exerted electric field and the counterpart (the core for the shell field, or the shell for the core field). Here we have introduced the electric polarizability a'y which is the one along the rth direction for the 7th species. Comparison of this potential with
shell
£ai
FIGURE 2 An illustration of the self-interaction event between the core and shell at the same lattice point at sg: (a) There is no relative displacement between the two bodies. Hence, no dipole moment or electric field is exerted, (b) A relative displacement generates the Coulombic self-interaction field.

LATTICE DYNAMICS STUDY ON BaTi03 223
Eq. (1) gives us the following Coulombic interatomic force constants for the core-shell interaction at 57 = s '7':
Fij(s-f-s1)=-r. (3) 7
To set up the eigen-value problem, the interatomic force constants Aijis'f-s'j'), By(s-f - s'7') and QO7 - s'7') in the real lattice space representation were Fourier transformed to the reciprocal lattice space representation, which is the conventional way to proceed with the calculation [19' 20].
In the earlier rigid-shell model, the three groups (core-core, core-shell and shell-shell) of non-Coulombic interatomic force constants were assumed all equal[10_18], and the model had 16 parameters totally. However, they are all assigned with different values in our modified version for more accurate description of the lattice dynamics. Therefore, 16 non- Coulombic parameters are newly added, so our model has, in total, 32 fitting parameters.
To describe the equation of wave motion simply, we eliminate all the suffixes i,j, s and 7 from Eq. (1). Taking derivatives of the potential Fwith respect to the core and shell displacements followed by the adiabatic approximation, we gain the next eigen system form,
u?u = p + eFe) - (T+ eFY)(S + YFY)~l(T + eFY)']u. (4)
where t (superscript) means transposing the matrix, and the displacements are redefined to be square-root-mass-weighted.
The Monte-Carlo method has been employed to fit the calculated phonon dispersion curves to the observed data from previous neutron inelastic scattering measurements [22' 23' 10~12]. The eigen-value problem is solved with respect to the phonon wave vector k. The phonon frequencies are given at each Monte-Carlo iteration step. The 32 fitting parameters are adjusted for minimization of error. A computer program for this Monte-Carlo fitting has been developed including the eigen system routine of Eq. (4). An algorithmic flow chart is illustrated in Figure 4.
3. PHONON DISPERSIONS
Fitting has been performed to the previous neutron data along the three principle directions [100], [111] and [110] by using a main frame computer,

224 N. TAKESUE et al.
o
o
(Pij(sY-sY)x perpendicular
<Pij(sy-sY)i Derpendicular
FIGURE 3 Geometrical definition of the interatomic force constant. A Ba-O pair has been taken as an example. The line between the pair represents the interatomic vector. One force constant (parallel) is defined to exert the force along this direction, and the other force constant (perpendicular) along the direction vertical to it.
ALPHA, at the Materials Research Laboratory, the University of Illinois at Urbana-Champaign. R (residue) factor has been reduced to 3.67% after 44,000-time iteration over a cpu time of about 22 horus. Figure 5 shows a whole series of the calculated (solid lines) and the observed (dots) dispersion curves; each of the longitudinal and the two transverse modes along one direction of k corresponds to one piece of the graphs; there are five branches for each phonon mode. The calculated dispersion curves agree reasonably well with the experimental data except for the two highest energy levels of each mode.
Degenerate states among the modes in the Brillouin zone can be found theoretically by application of group theory to this type of cubic perovskite crystals (see Cowley's case for SrTi03 in Ref. [18]). The deduced degeneracies caused by symmetry consideration of this system are summarized for the three principle directions in the following:
1. k at (000) There are three acoustic modes, one triply degenerate mode, and three longitudinal and doubly degenerate transverse optical modes.

LATTICE DYNAMICS STUDY ON BaTi03
start
225
Randomly pick up 1-10 out of 32 parameters and shift up/down by 1.0-50.0% to make original and new models
Calculate the phonon dispersions through Ewald transformation and the eigenvalue problem as well as a residual (R) factor.
J Rfactor(%) = glijW-'-W]2 x 1QQ~
end
FIGURE 4 An algorithmic flow chart for the Monte-Carlo fitting. The eigen-value problem is solved at each iteration.
2. k along [100] At general points, including the boundary, five branches of the transverse modes are doubly degenerate, and five of the longitudinal mode are single modes.
3. k along [110] There is no degeneracy at general points, but there are four doubly degenerate normal modes at the boundary.
4. k along [111] There are five doubly degenerate transverse modes and five single longitudinal modes a general points. At the boundary there are four triply degenerate normal modes, one doubly degenerate pair, and a single normal mode.
Our reuslts satisfy all of the above symmetry requirements (see Fig. 5); these requirements were not satisfied with the results produced by Cowley et al., or by Jannot et al.

226 N. TAKESUE et al.
[100] T [100] L [HUT [U1]L
[110] Tz [110] L [110] Txy
FIGURE 5 Dispersion curves along the three principle directions ([100]), [111] and [110]). T and L mean the transverse and longtudinal modes, respectively. Along the [100] and [111] directions, the two transverse modes degenerate to each other, but not along the [110]. Solid lines are our calculated dispersion curves. Dots are the results from previous inelastic neutron scattering data (see Refs. [10-12,22,33]). Note the well-satisfied degeneracy at the zone center and the zone boundaries.
4. RIGID-SHELL DYNAMICS PARAMETERS
Tables I and II show all the fitting parameters grouped as Coulombic and non-Coulombic terms, respectively. Jannot's parameters are shown along with ours, for comparison purpose. Because of possible differences between Jannot's and our modeling, values of the parameters for one model do not

LATTICE DYNAMICS STUDY ON BaTiOa 227
TABLE I Results of the Coulombic parameters. The results of Jannot's work" are given for comparison
Model effective charge in shell charge in units of e polarizability (A ) units of e
Ba Ti Ba Ti O Ba Ti O
Ours 3.220 2.620 -0.056 -0.168 -0.569 4.450 0.600 11.25 Jannot's 1.964 3.200 -0.887 -0.900 -2.662 0.010 0.181 0.695
a See Refs. [10-12].
TABLE II Results of the non-Coulombic parameters. The results of Jannot's worka are given for comparison
Model parallel (Njm) perpendicular (N/m)
Ba-0 Ti-O 0-0 Ba- Ti Ba-0 Ti-O 0-0 Ba- Ti
core-core 7O01 159.21 Ö^ÖÖ O03 -0.82 -35.03 -0.04 -0.46 ours shell-shell 3.23 13.42 0.52 0.00 -0.30 -2.70 0.0 -0.08
shell-shell 219.74 447.30 60.48 0.03 -50.59 -43.96 -4.09 -22.45
Jannot's 97.23 758.13 20.50 0.05 -16.32 -68.69 -3.86 4.61
a See Refs. [10-12].
necessarily correspond to those of the other. However, we see some common, but also some different tendencies of the values between the two models which we shall discuss as follows. We also find interesting features in the parameters that are newly added in our model.
The shell charge and polarizability of oxygen have relatively large values compared with the other two elements, as seen in Table I. Negatively charged oxygen has many loosely-bound electrons around its core, so that the shell charge must be large. Since the polarizability is proportional to the ionic radius, the oxygen ion with its large ionic radius must have a high polarizability.
There are similar tendencies in the values and signs of the parameters obtained from the current model as compared with those of the previous mode, as listed in Table II. In each of the parallel and perpendicular core- core, shell-core and shell-shell groups, the Ti-O force constant has the largest absolute value; next is the Ba-O constant; then are the O-O and Ba-Ti. The parallel constants all have positive values and most of the perpendicular constants show negative values.
The non-Coulombic core-core, core-shell and shell-shell constants introduced in the new model, reveal quite interesting features that are not seen in the previous model. The core-core and shell-shell interactions show relatively large repulsion, compared with the core-shell interaction.
From the physics viewpoint, the core-core and shell-shell interactions seem to manifest Van der Waals bonding (classical) and Pauli's exclusion

228 N. TAKESUE et al.
principle (quantum mechanical), respectively. The values of these constants can be expected to be large since their interactions are quite strong.
On the other hand, there is no physical theory that adequately captures the non-Coulombic interaction between the non-quantum object 'core' and the quantum entity 'shell'. The values found for this type of interaction have been expected to be generally small compared with the other two.
There is quite a significant discrepancy between Jannot's and our Coulombic results in Table I. In this study, the effective charge of Ti is found to be smaller than that of Ba, a result opposite from the Jannot model. Since the free-ionic charge of Ti (+ 4) is larger than that of Ba (+ 2), Jannot's result seems to be more plausible. However, the small effective charge of the Ti ion agrees well with the result from the first principle calculation, +2.89 with the charge of Ba fixed at +2.0[24], caused by strong covalent bonding between the nearest-paired Ti and O rather than the Ba-O and Ba-Ti neighbors. We suggest that the empty 4s-electron state of Ti4+(nominal) needs charge transfer from Ba2 +(nominal) to make the covalent bond with the unscreened O ions so that the Ti charge decreases and that of Ba increases.
All the parameters (the vibrational frequencies and amplitudes of phonons) obtained from this current analysis have been employed to compute the X-ray thermal diffuse scattering (TDS) intensities in the doctoral dissertation of Takesue [7]. The calculated intensities have been compared with the observed data[5_7]. However, our modeling still employs the harmonic approximation, in spite of the existence of the overdamped transverse optic modes near the zone center [22, 23]. The lattice anharmo- nicity has been considered in our X-ray TDS analysis '5_7] which will be discussed in a subsequent paper [5].
5. CONCLUSIONS
The rigid-shell model as applied by Jannot et al, to the cubic BaTi03 has been revised. The harmonic approximation is used with additional interatomic force constants. This revised model has been applied to the lattice dynamics calculations of the paraelectric BaTi03 system. Measured phonon dispersion curves along the [100], [111] and [110] directions as reported in the literature have been satisfactorily reproduced using the Monte-Carlo method in this work, showing a residue factor of 3.67%. Degeneracies of the vibrational states over the entire Brillouin zone have been accurately predicted for the first time, completely satisfying the

LATTICE DYNAMICS STUDY ON BaTiOj 229
symmetry requirements. The employed parameters in our model show similar characteristics to those obtained by the previous groups. The newly introduced parameters have given reasonable physical meanings concerning the short-range, non-Coulombic interactions of the ions.
A cknowledgements
We thank Dr. M. Maglione at Universite de Bourgogne, France, for his assitance in our lattice dynamics modeling. The present study was supported by the US Department of Energy via the Materials Research Laboratory at the University of Illinois at Urbana-Champaign under Contract No. DEFG02-96ER45439. The lattice dynamics calculation was performed on the VMS computer ALPHA at the Materials Research Laboratory. N.T. was a graduate student and H.K. was on leave at the University of Illinois at Urbana-Champaign where the work was completed.
References
Takesue, N. and Chen, H. (1994). J. Appl. Phys., 76, 5856. Takesue, N., Holma, M. and Chen, H. (1994). Proceedings of the International Conference on Solid-to-solid Phase Transformations in Inorganic Materials PTM '94, Pittsburgh PA, 667-672. Takesue, N., Maglione, M. and Chen, H. (1995). Phys. Rev., B51, 6696-6699. Holma, M., Takesue, N. and Chen, H. (1995). Ferroelectrics, 164, 237-251. Takesue, N., Kubo, H. and Chen, H., to be submitted to Phys. Rev. B. Takesue, N. and Chen, H. (1996). Procee of the International Conference on Synchrotron Radiation in Materials Science, 1996 Chicago IL, July submitted. Takesue, N. (1996) Ph.D. Thesis, University of Illinois at Urbana-Champaign. Cochran, W. (1973). "The Dynamics of Atoms in Crystals", The Structures and Properties of Solids, 3, Crane, Russak & Company, Inc. New York. Krivoglatz, M. A. (1969). "Theory of X-ray and Thermal-Neutron Scattering by Real Crystals", Plenum Press, New York. Bouillot, J., Escribe, C, Fitzgerald, W. J. and Gnininvi, L. (1979). Solid State Commun., 30, 521. Jannot, B., Escribe-Filippini, C. and Bouillot, J. (1984). J. Phys., C17, 1329. Godefroy, G., Jannot, B. and Michel-Calendini, F. M. (1991). Phase Transitions, 33, 3. Cowley, R. A. (1962). Proc. Roy. Soc, London A268, 109. Cowley, R. A. (1962). Proc. Roy. Soc, London A268, 121. Woods, A. D. B., Cochran, W. and Brockhouse, B. N. (1960). Physical Review, 119, 980. Woods, A. D. B., Brockhouse, B. N, Cowley, R. A. and Cochran, W. (1963). Physical Review, 131, 1025. Cowley, R. A., Cochran, W., Brockhouse, B. N. and Woods, A. D. B. (1963). Physical Review, 131, 1030. Cowley, R. A. (1964). Physical Review, A134, 981. Born, M. and Huang, K. (1954). "Dynamical Theory of Crystal Lattices", Oxford University Press, London.
[20] Maradudin, A. A., Montroll, E. W., Weiss, G. H. and Ipatova, I. P. (1971). "Theory of Lattice Dynamics in The Harmonic Approximation", 2nd Edition, Academic Press, New York.
[io:
in [12: [i3; [i4: [is: tie:
in:
[is: [i9:

230 N. TAKESUE et al.
[21] Cowley, R. A. (1962). Ada Cryst., 15, 687. [22] Yamada, Y., Shirane, G. and Linz, A. (1969). Physical Review, 177, 848. [23] Harada, J., Axe, J. D. and Shirane, G. (1971). Physical Review, B4, 155. [24] Cohen, R. E. and Krakauer, H. (1990). Physical Review, B42, 6416.

Ferroelectrics, 1998, Vols. 206-207, pp. 231-244 Reprints available directly from the publisher Photocopying permitted by license only
i 1998 OPA (Overseas Publishers Association) Amsterdam B.V. Published under license
under the Gordon and Breach Science Publishers imprint.
Printed in India.
NATURE OF ATOMIC ORDERING AND MECHANISM OF RELAXOR
FERROELECTRIC PHENOMENA IN PMN
T. EGAMIa, W. DMOWSKIa, S. TESLICa, P. K. DAVIES3, I.-W. CHENb and H. CHENC
a Department of Materials Science and Engineering, University of Pennsylvania, Philadelphia, PA 19104; b Department of Materials Science and Engineering,
University of Michigan, Ann-Arbor, MI 48109; c Department of Materials Science and Engineering, University of Illinois, Urbana-Champaign, IL 61801
(Received 5 May 1997)
Small angle resonant x-ray scattering measurements were performed for PbCMg^ (PMN) at the Pb and Nb absorption edges using synchrotron radiation. The results are not consistent with the current model of segregated nano-domains and pose a serious question on the mechanism of the relaxor ferroelectric behavior in PMN. Combining with our earlier results of large angle resonant x-ray scattering measurements and the pulsed neutron scattering measurements on PMN, PZ and PZT, an alternative mechanism of the relaxor behavior is proposed.
Keywords: Relaxor ferroelectrics; PMN; small angle x-ray scattering
1. INTRODUCTION
The origin of the relaxor ferroelectric phenomena in Pb(Mg!/2Nb2/3)03 (PMN) has long been thought to be the nano-scale compositional inhomogeneity due to local Mg/Nb ordering and segregation of a Nb rich phase [1]. The basis of this commonly accepted model (standard model) is the observation by transmission electron microscopy (TEM) of nano-domains and the superlattice diffraction of 1/2(111) type associated with the domains. In this scenario these domains are not charge balanced since Mg is divalent while Nb is pentavalent. It was conjectured, therefore, that the domains would not grow into a large size, preventing long range order to
231

232 T. EGAMI et al.
develop and resulting in the relaxor behavior. However, such a segregation would produce very strong local electric field gradients, and would be energetically quite unfavorable even at a very small scale. It is difficult to imagine that domains of 50 A in size with so much charge imbalance can exist. In fact no strong direct evidence of Nb segregation has ever been attained. On the contrary, available data tend to be against such segrega- tion [2]. In this paper we present our recent x-ray and pulsed neutron scattering results which seriously question the validity of this Nb segregation scenario, and instead an alternative mechanism is proposed.
Small angle resonant x-ray scattering measurements were performed for PMN powder at the Pb and Nb absorption edges using synchrotron radiation. The results show that the small angle scattering (SAS) from Nb distribution in PMN is not strong enough to be consistent with the Nb segregation scenario. The high angle resonant x-ray scattering measurement on a single crystal PMN performed earlier [3] shows that the 1/2(111) superlattice diffraction includes significant contribution from the local displacements of oxygen and lead atoms. These results are consistent with either Mg/Nb ordering, or (Mg2/3Nb1/3)/Nb ordering. In addition a comparison of the atomic pair-distribution functions (PDF) obtained from pulsed neutron scattering measurements on PMN, PZ, and PZT [3~6]
suggests that the local structures of these rather disparate compounds are actually very similar, with the polarization of Pb playing a major role. By combining these three pieces of information, we propose that the planar ordering of (mixed Mg-Nb)/Nb along [111] takes place, and due to the compositionally disordered nature of the (mixed Mg-Nb) plane, Pb atoms are locally displaced in random directions, producing the observed relaxor behavior.
2. SMALL ANGLE RESONANT X-RAY SCATTERING
It is well known that any fluctuation in density of materials produces small angle scattering (SAS) of x-ray, electrons or neutrons [7]. If there are Nb micro-segregation as the standard model assumes, significant SAS with the characteristic wavevector corresponding to the size of the micro-domains would be observed. In particular by changing the energy of the x-ray in the vicinity of the Nb absorption edge it should be possible to determine the amount of compositional fluctuation.
The SAS measurement was performed at the X-7A beamline of the National Synchrotron Light Source (NSLS) of the Brookhaven National

RELAXOR FERROELECTRIC PHENOMENA IN PMN 233
Laboratory. The synchrotron radiation was monochromated by a Si (111) channel-cut crystal monochromator, tuned near the K absorption edge of Nb (18.9869 keV) or the Lm edge of Pb (13.0406 keV) [8]. The incident intensity was monitored by a scintillation counter placed above a Kapton (polyimid) film in the beam. The beam size was 0.8x0.8 mm2. The thinly dispersed powder sample on the Kapton film was placed in the He environment in the transmission geometry. The scattered x-ray photons were detected by a high-purity Ge solid state detector that was connected to a multi-channel pulse height analyzer (MCA) in the CAMAC crate which was on-line with the computer. The MCA histogram was transferred to the computer which calculated and stored the total counts of the several pre- selected groups of channels. They were selected to represent the Ka
fluorescence, elastic scattering plus Kß and the total photon count. The total photon count was used to correct for the deadtime of the detector, and the Ka count was used to subtract the Kß count from the elastic channel [9]. This channel arrangement was adopted since the energy resolution of the Ge detector (~250eV at 19keV) was not sufficient to separate the elastically scattered photons from the Kß fluorescence.
The SAS intensity was normalized by the incident monitor counts and corrected for the direct beam contribution, absorption and the background, including the scattering from the Kapton film and the sample container which was measured separately. The measurement was made as a function of the diffraction vector Q( = 4irsm9/\) up to the first diffraction peak at 1.555 A-1, and the corrected intensity I(Q) was further normalized to electron units, so that
I{Q) = (f(Q))2S(Q) + </(ß)2> - </(ß)>2 (1)
where S(Q) is the structure function that converges to unity at Q—>oo, and (• • •) denotes the compositional average. The SAS data measured with the incident x-ray energy just below the Pb edge (12.976keV,/'b = -13.6) are shown in Figure 1, in the log-log plot in the unit of I(Q)/{fiQ))2. It approximately follows the power law,
I(Q) oc Q-" (2)
with n ~ 5. This is an unusually strong power law. Usually an object with a well defined shape or edge produces the SAS with « = 4 (Porod's law) at large values of Q and n = 2 at small values of Q, and if the object has a Gaussian density profile, the SAS also follows the Gaussian form (Guinier's

234 T. EGAMI et at.
Ö
CO
100 i
10 i
1 -
0.1 -
0.01
0.0001 0.01
Q[A'1]
FIGURE 1 The normalized small angle x-ray scattering intensity from PMN powder in the log-log plot.
law). The data indicate a slight change in the slope around g~0.06A_1. The same data are shown in Figure 2 also in the form of the Guinnier plot (log (I(Q){AQ)2) vs- Ö2)-If the Prome is Gaussian the Guinnier plot should be linear. Indeed while the low Q portion of the data are not linear, above Q2 ~ 0.008 (Q ~ 0.09) the data are approximately linear. The linear fit to the range of 0.008 < Q2 < 0.016 gives,
KU> , = 0.0457 exp -^,— (AQ))2 V 2
(3)
with the radius of gyration, R= 17.3 A. As we mentioned above the commonly accepted model assumes (111) B-
site layer ordering of Nb and Mg into micro-domains. The size of the domains, d, can be estimated by the width of 1/2(111) superlattice diffraction. The 1/2(115} superlattice peak measured for PMN as described below is shown in Figure 3. If the SAS was to originate from the same

RELAXOR FERROELECTRIC PHENOMENA IN PMN 235
o CO
100 -
10 i Data R=120A
: R = 17A
1 -
0.1 -
-I
0.01 i
: Y*" 0.0001 - —,— ' : \r
0.000 0.005 0.010
Q2
0.015 0.020
FIGURE 2 The Guinnier plot of the SAS data, compared to the calculated intensity assuming the domain size of 48 A (radius of gyration, R = 18 A, chained line) and 280 Ä (i?=120A dashed line).
objects that are producing the superlattice peak, it essentially should take the same shape. The 1/2(111} peak is fairly well represented by a Gaussian function, indicating that the size of the ordered domain is rather well defined and not distributed very widely. The standard deviation aQ of the fitted Gaussian function is 0.058 Ä-1. This translates to the radius of gyration, R- \\OQ= 17.2Ä, which is in excellent agreement with the observed value of R for the SAS data shown in Figure 2. Since the SAS measurement was made on a powder, while the superlattice measurement was made on a single crystal, the results are not expected to agree completely, so that this closeness of the two values must be somewhat fortuitous. In any case it is apparent that the high Q portion of the SAS and the superlattice peaks must originate from the same object.
In the standard model PMN is supposed to be composed of a nano-phase mixture of two components. One of the components is a compositionally ordered phase in which the (111) layers of the B sites are alternately pure Nb and Mg, while the other is a compositionally disordered phase slightly rich

236 T. EGAMI et al.
0.8
0.7
d 0.6 03
w 0.5 (D
■*-» c
0.4
0.3
.1)1111111.11 i i i 1 1 1 1
" <b -
</ °\ -
d S\
-
^p V
-
<£D ^p &F ÜCV- -, . i , » , , , , "
3.9 4.0 4.1 4.2 4.3
Q (A"1)
FIGURE3 The 1/2(115) superlattice diffraction peak in the radial scan. The solid curve is a fit by a Gaussian curve.
in Nb. Assuming the Gaussian profile the SAS intensity can be given by,
M) (f(Q))2
R5
(2*0 3/2
exp 2n2 RlQ (4)
where c is the volume fraction of the segregated ordered domains, Af=fs- (f),fs is the scattering factor of the ordered domains, and R is the radius of gyration. If we assume the full Mg/Nb ordering within the domain and R = 17.3 A, we obtain c = 0.08 (see Appendix). Thus if we try to interpret the data in terms of the standard model, the fraction of the ordered domains is only 1/8 of the maximum value (0.67), and over 90% of the volume would remain disordered. On the other hand, the result above can also be explained in terms of statistical compositional fluctuations expected for nano-grains with R = 17.3 Ä (also see Appendix). Thus the observed SAS result shown in Figures 1 and 2 is not compatible with the standard model.
As shown in Figures 1 and 2 the SAS from the ordered domains accounts for only a small portion the total SAS intensity. The low Q portion of the

RELAXOR FERROELECTRIC PHENOMENA IN PMN 237
SAS are dominated by the SAS from objects much larger than the ordered domain size. A fit to the low Q portion by Eq. (4) suggests that the radius of gyration is of the order of 100 A or more. For instance the dashed line in Figure 2 corresponds to the object with the R value of 120 A. However, the fit is not very good, suggesting that there is no well defined length scale for the low Q portion of the SAS, and the sizes of the scattering objects are widely distributed.
In order to determine the element specific SAS, the SAS measurement was carried out near the Nb K absorption edge and the Pb Lm edge. The anomalous dispersion of the atomic scattering factor,
f(Q,E) =MQ) +/(£) + if"(E) (5)
where E is the energy of the x-ray, changes sharply with energy near the absorption edge, but is nearly constant far away from the edge. When the energy is changed near the K-edge of Nb only the scattering factor of Nb changes with energy, while the scattering factors of other elements remain almost unchanged. Thus we can single out the SAS contribution of Nb atoms to the scattering intensity using the method.
Unfortunately, in the range Q > 0.06 A-1, where the Gaussian component (4) dominates, the SAS intensity is too small to carry out the anomalous scattering measurement reliably. Therefore it has not been possible to confirm whether or not the observed SAS intensity orginating from the ordered domains is due to the Nb/Mg compositional fluctuation. On the other hand the SAS intensity at low Q was high enough for the anomalous scattering measurement. The energy scans with a constant Q evaluated at Q — 0.02 A-1 are shown in Figures 4 and 5. The measurements were made in the constant 29 mode, and the data were corrected for the changes in Q with energy and for absorption which was measured separately, in order to obtain the constant Q data. The data above the absorption edge are not reliable because of the difficulties in absorption correction. The figures also plot the energy dependence of the calculated anomalous dispersion/',«. Comparing the energy dependence of I(Q) and /' it is clear that
at both edges. In terms of the compositionally resolved partial structure function the scattered intensity can be given by,
i(Q) = J2c«f<*cßfßs°ß(Q^ (7)

238 T. EGAMI et al.
Nb edge, Q=0.02 A 1
30 TT
25 -
24
• SAS -«H- f'Nb(E)
-4
-9
18.9 19-0
Energy [keV]
FIGURE 4 Energy dependence of the SAS at Q = 0.02 Ä"1 near the Nh edge compared to the real part of the anomalous dispersion,/'(£), of Nb.
where a and ß denote elements, ca is the concentration of a,fa is the atomic scattering factor of a, and Saß(Q) is the compositionally resolved partial
structure function. Thus,
MQl = 2CaJ2cßfßSaß(Q). OjaWeL) ß
Assuming only a diagonal (aa) contribution to the SAS we obtain,
■SNbNb = 9.2
SpbPb = 4.1
(8)
(9)
at ß = 0.02Ä_1. Thus the SAS is not only due to the compositional fluctuation in Nb, but includes substantial contribution from Pb fluctuation as well. Possible origins of these SAS are micro-voids or grains of a second phase in the sample. Therefore, much of the observed SAS intensity has little

RELAXOR FERROELECTRIC PHENOMENA IN PMN 239
Pb edge, Q=0.02 A -1
33 -i r -11
32 ! - -12
31 -
\ 30-
O 5 29-
Ö ~" 28 -
27 -
•
.* •*•
•
- -13
- -14
- -15
- -16
- -17
26 - • SAS \ /.•• 00 0
1 1
dx> i i i i
12.95 13.00 13.05 13.10
Energy [keV]
UJ
FIGURE 5 Energy dependence of the SAS at Q = 0.02 A ' near the Pb edge compared to the real part of the anomalous dispersion, f'(K>, of Pb.
to do with the Nb./Mg ordering. The same measurement was made at Q = 0.033 Ä"1 with a similar result.
3. LARGE ANGLE RESONANT X-RAY SCATTERING
The large angle anomalous x-ray scattering measurement of the 1/2(111} superlattice peaks using a single crystal reported earlier [3] provides important insights into the nature of the atomic ordering in the ordered domains. However, from this result alone it is not possible to determine whether the ordering is due to Mg/Nb 1:1 ordering, or due to (Mg2/3Nbi/3)/ Nb ordering, since they contribute to the anomalous scattering in very similar ways. But we now can assume that the ordering is of the latter kind, since our SAS results presented here are not compatible with the standard Nb/Mg 1:1 ordering model. The origin of the 1/2(111) superlattice

240 T. EGAMI et al.
diffraction peak must be the ordering of the alternating layers of Nb and
(Mg2/3Nb1/3) [10]. With this assumption the large angle anomalous x-ray scattering results
offer the following information:
1. The superlattice diffraction peak is due not only to compositional ordering but also to atomic displacements of Pb and O.
2. Pb atoms are displace by ~ 0.05 A toward Mg. While Mg2+ is larger in size (0.72 Ä) than Nb5+ (0.64 Ä) [11], it is less repulsive than Nb5 + .
3. O atoms are displaced toward the Nb layers by ~0.3A to screen the excess charge of the Nb layer.
Thus the charge imbalance between the Nb and Mg/Nb layers is locally compensated for by the oxygen displacements. It should be noted that the (Mg2/3Nb!/3) layer must be compositionally disordered, since the (111) plane of the B sites has a triangular lattice, and is impossible to establish compositional order, unless long range forces are introduced.
4. RESULTS OF PULSED NEUTRON SCATTERING AND MECHANISM OF RELAXOR PHENOMENA
The atomic pair-distribution function (PDF) of PMN obtained by pulsed neutron scattering indicates that the real atomic structure of PMN is significantly deviated from the crystallographic nearly cubic perovskite structure [4]. The measurement was performed at the Special Environment Powder Diffractometer (SEPD) of the Intense Pulsed Neutron Source (IPNS) of the Argonne National Laboratory. The PDF describes the distribution of the real space distances between atoms, and has been widely used in the study of amorphous solids or liquids. It can be obtained from the diffraction data by the Fourier transformation into the real space. Since the PDF is derived from not only the Bragg peaks but also the diffuse scattering intensities which are dropped in the usual crystallographic analysis, the PDF represents periodic as well as aperiodic structure. The structure modeling by the Monte-Carlo procedure showed that the B06 octahedra (B = Nb, Mg) are locally significantly rotated with some degree of short range order [4].
The PDF of PMN exhibits a striking resemblance to the PDF of Pb(Zri_xTix)03 (PZT) as shown in Figure 6 [3]. This is rather surprising because Nb-Mg mixing is heterovalent, while Zr-Ti mixing is homo-valent. It is well known that by replacing a small amount of Pb with La (PLZT) the

RELAXOR FERROELECTRIC PHENOMENA IN PMN 241
FIGURE 6 The atomic pair-distribution function (PDF) of PMN (open circles) obtained by pulsed neutron scattering compared to that of Pb(Zr 65Ti.35)03 (closed circles).
system shows relaxor behavior[12]. However, nanodomains are not observed in PLZT, and hence the origin of the relaxor phenomena in these systems are generally considered to be quite different from that of PMN. Thus PMN and PZT appear to have little in common.
The PDF of PZT is also very similar to that of PbZr03(PZ) [3], even though they have different crystal structures and PZT is ferroelectric (x > 0.05) while PZ is antiferroelectric. Recently the structure of PZ and PZT was studied thoroughly by the combined Rietveld and PDF analyses as a function of temperature and composition [3' 5' 6]. From this study it became clear that the polarization of Pb by displacement from the ideal A-site in perovskite structure is closely tied to the local rotation of the B06
octahedra. Note that in Figure 6 both the PDF of PMN and the PDF of PZT have a peak around 2.45 A. This peak is due to Pb—O distances, and is absent in the PDF of the ideal perovskite structure in which the distances between the A site and the 12 nearest oxygen sites are all equal and are about 2.85 A. Because of the rotation of the B06 octahedra the environment of Pb becomes asymmetric, and the Pb—O distances become unequal. The Pb atom will then be displaced toward three nearest oxygen atoms to form covalent bonds, and to accomodate its lone pair electrons on the other side. The 2.45 A peak in the PDF represents these covalent Pb—O bonds.
In PZT the Zr06 octahedra are locally rotated because of the large size of Zr4+ ion, while the Ti06 octahedra are basically not rotated because Ti4+ is

242 T. EGAMI et cd.
a small ion. The random occupation of the B site by Zr and Ti then produces random local rotation of the B06 octahedra. This induces the random displacements of Pb, resulting in the relaxor phenomena when a small amount of La is added to increase disorder. The situation must be very similar in PMN. The compositional randomness in the (Mg2/3Nbi/3) layer must be producing random local rotation of the B06 octahedra and random displacement of Pb atoms, resulting in the relaxor phenomena. Thus the mechanism of the relaxor behavior in PMN and PLZT must be essentially identical, and must originate from randomness in the atomic structure, rather than the nano-domains, while the latter would certainly enhance the effect. This point was further confirmed by a recent study of the effect of composition and heat treatment[13].
5. CONCLUSIONS
Results of the small angle x-ray scattering measurement conclusively show that the Mg/Nb compositional variation assumed in the nano-domain scenario of the relaxor phenomena in PMN does not exist in reality. This poses a serious question to the widely accepted model. It is proposed instead that the observed (111) layer ordering of the B site is due to Nb/ (Mg2/3Nbi/3) alternate layering, and the compositional randomness in the (Mg2/3Nbi/3) mixed layer produces random Pb local polarization and the relaxor behavior. While this model needs further testing and scrutiny, it appears to be a physically more reasonable model than the standard moel that requires unphysically strong compositional and charge variations in space. Furthermore this model explains the relaxor behaviors of both PMN and PLST at once, while so far they have been thought to originate from totally different mechanisms.
A cknowledgements
The work at the university of Pennsylvania was supported by the Office of Naval Research through N00014-91-J-1036. The work at the University of Michigan was supported by the National Science Foundation through DMR96-32989. The work at the University of Illinois was supported by the U.S. Department of Energy through DEFG02-91ER45439. The National Synchrotron Light Source is operated as a user facility by the Department of Energy, Division of Materials Sciences and Chemical Sciences. The IPNS is

RELAXOR FERROELECTRIC PHENOMENA IN PMN 243
operated as a user facility by the Department of Energy, Division of Materials Sciences under contract W-31-109-Eng-38.
References
[1] Husson, E., Chubb, M. and Morell, A. (1988). Mat. Res. Bull, 23, 357. [2] Park, K., Salamanca-Riba, L., Wuttig, M. and Viehland, D. (1994). J. Mater. Sei., 29,
1284. [3] Egami, T., Teslic, S., Dmowski, W., Viehland, D. and Vakhrushev, S. Ferroelectrics, in
press. [4] Rosenfeld, H. D. and Egami, T. (1994). Ferroelectrics, 158, 351. [5] Teslic, S., Egami, T. and Viehland, D. (1997). Ferroelectrics, in press. [6] Teslic, S. and Egami, T., unpublished. [7] Guinnier, A. (1964). Small Angle X-ray Scattering (Academic Press, New York). [8] International Table of Crystallography IV, Eds. Ibers, J. A. and Hamilton, W. C. (The
Kynoch Press, Birmingham, 1974). [9] Aur, S., Kofalt, D., Waseda, Y., Egami, T., Chen, H. S., Teo, B.-K. and Wang, R. (1984).
Nucl. Instrum. Methods in Phys. Res., 222, 259. [10] Chen, J., Chan, H. M. and Harmer, M. P. (1989). J. Amer. Cer. Soc, 72, 593. [11] Shannon, R. D. (1976). Ada Cryst., A32, 751. [12] Haertling, G. H. and Land, C. E. (1971). /. Amer. Ceram. Soc, 54, 1. [13] Davies, P. K., unpublished.
APPENDIX: ESTIMATION OF THE COMPOSITION OF THE PRECIPITATES
If the precipitates in PMN have the composition of Pb(Mg1/3+ÄNb2/3_Ä)03, the composition of the matrix is Pb(Mgi/3 + 5'Nb2/3-6')03 where 6' = -6c(l-c). The SAS contrast in f(Q) will then be,
A/=(«-«')(/Nb-/Mg)
= 296 (A-l)
1-c
From (4) and using R= 17.3 A and (/) = 123.7 we obtain
c(A/)2 = 2.13 (A-2)
Thus,
62c , = 2.53 x 1(T3 (A-3) (1-C)2
For full ordering <5= 1/6, and
c = 0.08 (A-4)

244 T. EGAMI et al.
On the other hand if we assume that the system is divided 50/50 (c= 1/2) into slightly Mg rich and slightly Nb rich grains we obtain,
6 = 0.04 (A-5)
However, the grain of R= 17.3 A with the lattice constant of 4.05 Ä contains only N=330 Mg/Nb atoms. The expected statistical fluctuation in the composition is 6 = l/\/N = 0.05, even slightly larger than this value. Therefore pure statistical fluctuations in the grain composition can fully explain the observed results.

Ferroekctrics, 1998, Vols. 206-207, pp. 245-263 Reprints available directly from the publisher Photocopying permitted by license only
] 1998 OPA (Overseas Publishers Association) Amsterdam B.V. Published under license
under the Gordon and Breach Science Publishers imprint.
Printed in India.
A DOMAIN WALL MODEL FOR RELAXOR FERROELECTRICS
I-WEI CHEN and YING WANG
Department of Materials Science and Engineering, University of Pennsylvania, Philadelphia, PA 19104-6272
(Received 15 July 1997)
A domain wall model is proposed for relaxor ferroelectrics typified by Pb(Mgi/3Nb2/3)03. Under a large applied field or a large internal field, domain walls move over a long distance by overcoming localized barriers. This movement is responsible for the hysteresis loop and depolarization at temperatures below Tmax. The activation volumes obtained by analyzing the coercive field dependence on temperature and frequency suggest that the barriers encountered by the domain walls are of the size of 1000 unit cells, and they increase as the relaxor becomes more like a normal ferroelectric. Since polarization is usually incomplete in relaxors even under a large polarizing field, depolarization readily occurs without the need of nucleating new domains. Domain walls are also responsible for permittivity peaks at high temperature under a weak field. However, without a strong field, domain walls are partially pinned by barriers and can only oscillate within the unpolarized regions between barriers. The mobility of domain walls can be modified by alloying to vary the spacing between ferroelectrically active ions and the internal field driving the walls. Furthermore, below a certain temperature, polarization domains become increasingly sharp and domain wall oscillation becomes increasingly difficult. This leads to the exhaustion of oscillation at an apparent freezing temperature below Tm.d%. Overall, the domain wall model provides a simple framework that can be used to quantitatively analyze relaxor behavior over a broad range of compositions. Its theoretical basis is further justified by analogy to dislocation theory and interface mechanics in phase transformations.
Keywords: Relaxors; PMN; domain walls; coercive field; depolarization; permittivity
1. INTRODUCTION
Relaxor ferroelectrics exhibit unique behavior not seen in normal ferro- electrics. This includes a depolarization temperature well below the permittivity maximum and a dielectric spectrum which is extremely frequency dependent. Several models have been proposed to explain such behavior. These include treating the polarization unit as a large dipole
245

246 I-WEI CHEN AND Y. WANG
consisting of many atomic cells [1_2], regarding the system as a dipolar glass undergoing structural or kinetic freezing [3], and considering a ferroelectric or a dipole with an arbitrarily broad relaxation spectrum[4_8]. These models are mostly used to analyze the dielectric behavior, namely the frequency spectrum under a weak field. Very little attempt has been made to relate it to the large field, ferroelectric behavior, which is also anomalous in relaxors. Moreover, these models have not been developed to compare relaxors that depart from normal ferroelectrics to different degrees and to make predictions on relaxors of different compositions.
In our view, the problem of the polarization behavior of relaxors is one of first order phase transition in a complex environment. Similar problems in materials science are typically treated by considering interfaces, specifically their role in the nucleation and growth of the new phases from the parent phase [9]. This approach often yields a simplified, yet sufficiently accurate picture even for relatively complex situations. For phase transformations that do not allow long range diffusion, the interface dynamics are formally similar to dislocation dynamics which have a well developed theory [10^11]. This theory accounts for the thermodynamics and kinetics of dislocation movement in a complex field that arises either from lattice periodicity (such as Peierl stress), atomic disorder (such as solute atoms), microstructure heterogeneity (such as precipitates and voids), or from dislocations themselves (dislocation entanglements and dislocation intersections) [lo-ii] although the latter approach has been adopted into the early studies of ferroelectrics, in particular the dynamics of domain walls [12~15], it has been largely ignored in recent literature, especially in the area of relaxors. This is presumably because of the very fine nature of polar regions in relaxors which has made direct observations of domain walls difficult <16-181.
In this paper, we will outline a domain wall model formulated in the same framework as dislocation theory for plasticity and anelasticity and apply this treatment to a subgroup of Pb-containing relaxors that is represented by Pb(B'1/3Nb2/3)03 and its solid solutions. We will demonstrate that this model can provide a unified picture of the relaxor behavior over a broad range of temperatures and fields. It can also provide insight into the origin of relaxor behavior and the condition for relaxor-ferroelectric transition. The significance of Pb and Nb, as well as their interplay with B' cations of different sizes, has been discussed in some detail in our previous paper [19]
which should be consulted for an atomistic insight that underlies our
thinking here.

A DOMAIN WALL MODEL FOR RELAXOR 247
2. DOMAIN SWITCHING UNDER AN EXTERNAL FIELD - HYSTERESIS LOOP
Evidence for domain wall motion can be seen from hysteresis loops taken at low temperatures. A series of hysteresis loops for Pb(Mg!/3Nb2/3)03 (PMN) are shown in Figure 1. At lower temperatures, the loops are well developed showing a large remnant polarization at zero field. Both the hysteresis loop and the first quarter D-E curve (from E=0 to E= maximum) have a sigmoidal shape. This can be associated with the domain wall motion that switches domains and effects polarization. The coercive field required to drive domain wall motion can be identified as the intercept of the loop and D = 0.
The coercive field in PMN is a strong function of temperature and frequency. The temperature dependence at 60 Hz is shown in Figure 2 for PMN and a number of other relaxor ferroelectrics. We see that the coercive field generally decreases with temperature and such a decrease becomes less pronounced for PMN alloyed with PbTi03 (PT). It is known that the addition of PbTi03 to PMN gradually suppresses the relaxor characteristics and, at 40% or more PbTi03, the solid solution behaves not like a relaxor
T=153 K T=173 K
E 5
-20 -10 0 10 20
E(kV/cm) -20 -10 0 10 20
E(kV/cm)
T=193 K
T - / s'
E / 1 u o a. -10 I / J ....
-20 -10 0 10 20
E(kV/cm)
T=233 K T=373 K
ff- 10 | Q o a.
-10
-20
-..-.! —■-»• i—
■■'■■-'■■■■'•■•■'■•■■'■•
-20 -10 0 10 20
E(kV/cm)
C I»
-20 -10 0 10 20
E(kV/cra) -20 -10 0 10 20
E(kV/cm)
FIGURE 1 Hysteresis Loop of Pb(Mgi/3Nb2/3)03 at different temperatures.

248 I-WEI CHEN AND Y. WANG
S
14
12
10
8
° 6
4
2
0
r A
11 11 i ■ '
PMN
i i i i I i i i i | i i i i | i i i i | i i i i
y \ 0.9PMN-0.1PT
0.02Ba-PMN
100 150 200 250 300 350 400 450 Temperature(K)
FIGURE 2 Temperature dependence of coercive field for several relaxor materials. For reference, the data of BaTi03 (BT) are shown as the solid line.
but like a normal ferroelectric with a high Curie temperature. For PMN, the coercive field at 60 Hz vanishes at 235 K. For 0.8 PMN-0.2 PT, the coercive field vanishes at 400 K. In the following, this temperature will be referred to
as T0. We can use the theory of thermal activation to understand the behavior
shown in Figure 2. We envision that the domain wall encounters internal fields as it travels. (See Fig. 3a for a schematic.) Unless the applied field is sufficiently large to overcome the peak resistance field, E, the domain wall will be stopped at some point and thermal activation will be required to overcome the energy barrier AG posed by the resistance field. Similar problems in dislocation plasticity have been treated in detail [10]. In its simplest form, we can write, in analogy to dislocation plasticity, the polarization rate as
dP . D /Aa\ / AG _ = AP0^-j,0exp^ —
In the above, AP0 is the change in local polarization due to the passage of a domain wall, dis the spacing between domain walls (i.e., d~l is the domain wall density in analogy to dislocation density), Aa is the travel distance of a domain wall once it overcomes an energy barrier, u0 is the vibration frequency of a domain wall (usually taken as 1/100 of the Debye frequency in the dislocation theory [10]), and AG is the energy barrier that is field

A DOMAIN WALL MODEL FOR RELAXOR 249
Internal field
l A
AGI M. _ ^1 _ .
'A E
(a)
FIGURE 3 (a) Schematic of internal field in relaxor materials. A positive field resists the forward movement of domain walls and a negative field assists the forward movement of domain walls, (b) Simplified internal field of a constant height.
dependent. For a short range barrier (see Fig. 3b for a schematic) with a constant resistane field E over a volume V*, we find
AG = AG°( 1 = V*P*{E-E) (2)
where AG° = V*P*E is the energy barrier at E=0, and P* is the polarization change in the activated state. At the same rate of polarization switching, a higher temperature can allow for a higher activation barrier, hence a lower applied field. If this field is identified as the coercive field, then the model explains why coercive field decreases with temperature.
Generally speaking, valus of AP0, Aa, d, V*, and P* can all be field dependent, and the shape of activation barrier may not be known a priori. However, to gain some insight into the problem, we will make some simplifying assumptions and obtain values of V* by analyzing the slopes of E - T lines using Eqs. (1-2). The results for different ferroelectrics are shown in Table I. Here, we have assumed Aa/d=l, ^0=10n/s, AP0 = P * = 50 (xC/cm2, and a switching frequency of 60 Hz. We see that the activation volume V* is of a size of 4—6 nm in PMN, and it increases with PbTi03 content. In tetragonal BaTi03, it has been often observed in in-situ microscopy that a major barrier to domain wall motion is the intersection with 90° domains [12'18]. To overcome such a barrier, some collective polarization switching over a certain volume around the

250 I-WEI CHEN AND Y. WANG
TABLE I Activation volume of several relaxor materials and BaTi03
PMN 0.02 Ba-PMN 0.9 PMN-0.1 PT 0.8 PMN-0.2 PT t-BaTi03
K*(nm3) (3^ ~Ötf (4# (^ (10.3)3
K*/(unit cell) 800 800 1700 2200 17000
intersection is needed; after which the domain wall can once again proceed for a long distance. A similar picture may also hold for relaxor ferroelectrics. Since the activation volume V* is of the order of several nm in size and it increases with PbTi03, we suggest that the activation volume is of the size of polar regions and such regions expand with PbTi03 addition as the alloyed PMN-PT material becoems more like a normal ferroelectric. This interpretation seems physically plausible given the current knowledge of relaxor nanostructure.
The frequency dependence of coercive field can be similarly explained using Eq. (1). At a higher switching rate, the time for thermal activation is less, hence a smaller activation energy is required. This can be provided if a larger field is applied. Analysis of frequency dependence of coercive field confirms the same magnitude of activation volume as calculated above.
3. DOMAIN SWITCHING UNDER AN INTERNAL FIELD - DEPOLARIZATION
Domain switching is not only possible when a relaxor ferroelectric is driven by an external field, it also occurs when a relaxor is driven by an internal field, e.g., when the material is previously poled. This phenomenon is called depolarization. The driving energy of depolarization comes from the long- range field of the poled state, which can lower its range and hence its electrostatic energy if opposite polarization domains are introduced in some regions to result in zero net polarization macroscopically. This driving force is equivalent to an internal field, which drives domain switching in certain regions. In PMN, a fully poled polycrystal rapidly depoles at about 200 K. This temperature is some 65 K lower than the peak permittivity temperature Tmax when measured at 100 kHz (see Fig. 4). This depolarization temperature, Td, is also lower than the temperature T0 when the. coercive field at 60 Hz vanishes.
Depolarization at a temperature well below the permittivity maximum is a unique feature of Pb-containing relaxor. In normal ferroelectrics, depolari- zation occurs at the Curie temperature. Even in (Sr,Ba)2Nb206 relaxors, which have a tungsten bronze structure and disorder takes place on the

A DOMAIN WALL MODEL FOR RELAXOR 251
NT 2.5
*
a l's
<u la I- s 1
c o '•5 0.5 N
1 • Q
T-l—I I | I I I I I I I I I
Pb(Mg1/3Nb2/3)03
i i i i
100 150 200 250 Temperature(K)
300
FIGURE 4 Depolarization current of Pb(Mgi/3Nb2/3)03 at heating rate of 3°C/min.
A-site only, depolarization occurs at essentially the same temperature as the permittivity maxima [20]. Indeed, as PMN is alloyed with PbTi03 and the relaxor characteristics are progressively lost, the difference between Td and Tmax also becomes smaller. More generally, we can seen in Figure 5 Td and rmax follow a close correlation with each other for some 50 relaxors, in the family of Pb(Bj,3Nb2/3)03 and its solid solution with A-site and B-site dopants, of various compositions. As the Tmax increases, the relaxor behaves increasingly like a normal ferroelectric; meanwhile, Td approaches Tmax. There is also a distinct boundary across which a relaxor becomes a normal ferroelectric. In Pb(B,,3^2/3)03—PbTi03 systems, this occurs at the composition of morphotropic phase boundary (MPB). The cubic-tetra- gonal-rhombohedral Curie temperatures of a number of Pb(B'j,3
Nb2/3)03-PbTi03 materials with MPB compositions all lie around 450 K, apparently a "universal" temperature independent of B' cation. The farther a relaxor is from this relaxor-normal ferroelectric boundary, the more the depression of Td compared to TmaK.
The reason that normal ferroelectrics do not depole at below their Curie temperatures is probably due to the absence of domains of an opposite polarization in a poled crystal. This is a classical nucleation problem [9]; the paucity of nuclei prohibits a transformation despite an otherwise favorable driving force (i.e., depolarization energy). Without a nucleus, new domains cannot form and the crystal remains poled until the Curie temperature when the long-range correlation of polarization is lost and a complete

252 I-WEI CHEN AND Y. WANG
500 —i 1—i 1—r ■ i ii /
450
400
350
% 300
: // \:
•9 H
250 /& : -
200 - J' l ' 150
/ ¥• ?MPB !
/ i r i i i i ^i 100 150 200 250 300 350 400 450 500
T (K) max
FIGURE 5 Tm!L%-Tä correlation for relaxor materials.
depolarization leaving no domains ensues. In contrast, in PMN, macro- scopic depolarization occurs at 7"d well below Tmax. Apparently, correlation of polarization over an intermediate length scale still survives abvoe Td since the crystal displays a D-E hysteresis loop at above TA much like an unpoled normal ferroelectric below the Curie temperature.
This implies that depolarization in PMN does not encounter nucleation problems. As schematically shown in Figure 6, the random arrangement of ferroelectrically active actions among ferroelectrically inactive actions in PMN makes it difficult to fully pole the crystal. Most likely, there is always some nano regions which have no polarization or have random polarization. The interfaces between the poled polar regions and the random or non-polar regions constitute domain walls in a braod sense. Under an internal field caused by the depolarization energy, these interfaces have no difficulty sweeping up volume elements to produce domain switching, provided kinetics as prescribed by Eq. (1) allow. Given an internal field of the order of the poling field, we have verified that at Td, the kinetics predicted by Eq. (1) are sufficient to yield the depolarization rate observed. Later, as de- polarization continues, the internal field is dissipated and the population

A DOMAIN WALL MODEL FOR RELAXOR 253
ooi looomoo
oo ooo loom ® ®#®<
fflOOO ooo <§0j
®MD ooo
Field direction
FIGURE 6 Schematic polarization in relaxor under a field. Shaded area indicates polar domains and black dots are ferroelectrically inactive cations.
of mobile domain walls is exhausted. This eventually slows down the depolarization process.
4. DOMAIN WALL OSCILLATION UNDER A WEAK EXTERNAL FIELD - DIELECTRIC RESPONSE
Permittivity and dielectric loss of relaxor ferroelectrics exhibit a characteri- stic shift that is frequency dependent below Tmax
[1]. At higher frequency, the permittivity and loss are lower while Tmax is higher. There is no such frequency dependence above Tmax. The temperature dependence of the frequency, Tmax(v), has been shown to be best described by the Vogel- Fulcher equation (3).
v = UQ exp k(T-Tf) (3)
where Ea is an activation energy of the order of several tens of meV, and Tf is an intermediate temperature referred to as freezing temperature. For PMN, Ea is found to be 25 meV and Tf 230 K. The usual Arrhenius equation, if applied to describe the data, would have given a much higher activation energy of the order of eV, but more disappointingly, with a very high frequency factor which is beyond the realm of physical reality [21l
Using the data obtained for hysteresis loops measured at lower temperature and low frequency, we can predict the temperature when the coercive field vanishes at higher frequencies that are typical for dielectric

254 I-WEI CHEN AND Y. WANG
studies. This temperature easily exceeds Tmax at 100 kHz. Thus, if the domains and hence the barriers persist to higher temperatures, they cannot be surmounted at high frequencies with the rather small electrical field (typically 20V/cm) applied in dielectric studies.
This means that, under an oscillating field, the domain walls are not likely to travel a large distance by overcoming hard barriers that extend over several nanometers. Nevertheless, they can still bulge back and forth like a membrane constrained at the edge. This picture is analogous to dislocation bowing between pinning points I'o-n, 22] The jatter has been ^novm to be
responsible for internal friction peaks and can be quantitatively analyzed by a model of kink formation and kink migration along the dislocation [10-11, 22] yyg wjjj appiy the same concept to the domain wall problem.
We envision the domain wall to be hung on the E= 0 slope of Figure 3a. At a small oscillating field, with no cutting of barrier feasible, only a small increment of travel, to be determined by the slope of Figure 3a at E=0, can be realized. Within the linear approximation, the implies a linear response of polarization to the applied field, the polarization coming from the increment of travel by the domain wall. The response time of this oscillation is frequency dependent because the domain wall movement encounters another resistance at the scale of lattice spacing. This resistance may be attributed to the saddle point energy between two degenerate polarization directions. The analogy with dislocation mechanics is the Peierl stress which is attributed to the saddle point energy between two adjacent dislocation positions I10-11!. A more figurative analogy, used in the literature of interface motion in martensitic transformation, is that the small lattice barrier is like the grass on a golf slope, while the golf slope itself is the activation barrier posed by the larger obstacles [23]. Thermal activation is thus still needed to overcome lattice scale barriers to domain wall oscillation. For this reason, the domain wall movement is an anelastic process with an amplitude proportional to the driving force but with a phase lag and a dissipation determined by the thermal activation required to overcome the lattice barrier.
A domain wall will encounter the least resistance if it moves by first forming a pair of kinks (or ledges), then propagating them sidewide as schematically shown in Figure 7. The resultant polarization rate can be written as
^>-(-§M-t^) (4)
In the above, a3 is the unit cell volume, the exponential factor involving Ek{ (the kink formation energy) is the site fraction of kinks on the domain

A DOMAIN WALL MODEL FOR RELAXOR 255
(a) (b)
© . . 0 . . 0 . . © ..Q..0.. 0*-©^- ■
.......... ...... ..«..i
• ••••••••••a ........ t..,
• • 0 • •©• •©• • 0 * — 0— — ©— — © • • 0"*-
0..0..©..0 ..0..0..0..0 £=0 0 Active • Inactive £>0
(c)
E>0
FIGURE 7 Schematic of kink mechanism. For simplicity, the ferroelectrically active sites are regularly arranged into a sublattice. (a) At £=0, the dipole orientations are random; (b) at E > 0, a domain forms on the lower half and is bordered by a domain wall with a kink of a height b; (c) nucleation of a double kink and its spreading causing domain wall movement.
wall, and the exponential factor involving E^m (the kink migration energy) is the probability for a successful attempt of a kink to migrate by one lattice spacing. The field bias in the small field limit is taken into account in the above by the last term Ea3P0/kT which is the difference of the forward and the backward exponential bias due to the applied field on an "atomic" polarization unit a3P0. This equation is a small field, "viscoelastic" description of domain wall movement on a microscopic scale. The corresponding macroscopic constitutive equation is
where 6x is the anelastic susceptibility that can be attributed to the total domain movement at t —> oo, to be determined by the slope of Figure 3a at £ = 0, r is the relaxation time regulating this process, and m = 6x/T is the equivalent of reciprocal viscosity in plasticity. By further incorporating the spontaneous dielectric response, shown as Xu in the equivalent circuit of Figure 8, we can obtain the total susceptibility as a function of angular frequency, w,[22]
Sx \ (_urr_ A+to2r2 * + I^)-[T^SX)*- (6)

256 I-WEI CHEN AND Y. WANG
For the simple case where x« and 8\ are constants, the relaxation spectra seen in permittivity and loss are directly due to the relaxation time r which is now identified as
*»Q VQ kT
exp - -Ekf + -Ekn kT
(V)
This means that as the relaxation time decreases with temperature, a higher driving frequency can be sustained to give a loss maxima located at LOT = 1. This behavior is entirely analogous to the internal friction peaks due to dislocation damping [22].
The problem of dielectric relaxation in relaxors is complicated by the fact that both Xu and 8\ prove to be temperature dependent. Indeed Xu passes over a maximum near the ferroelectric-paraelectric transition, where Sx also drops to zero. Moreover, 6x appears to extropolate to zero at a lower temperature as well. According to Eq. (5), contribution of Xu and Sx can be evaluated by analyzing the difference between Rex* at high frequency and at low frequency. The high frequency portion is essentially Xu and the difference is essentially 8x- This decomposition is shown for PMN in Figure 9. We see that the spontaneous contribution Xu has a maximum
Xu T%
-r- fy
FIGURE 8 Equivalent circuit for dielectric response of a relaxor including both spontaneous polarization with a susceptibility Xu and a delayed polarization due to domain wall movement with a susceptibility Sx and a relaxation time r.

A DOMAIN WALL MODEL FOR RELAXOR 257
around Tmax where the domain wall contribution 6x disappears somewhat abruptly. This is understandable if we accept the temperature region around rmax as a region of phase transition from a ferroelectric state to a paraelectric state. Then, Xu is at a maximum at the transition and 8\ vanishes above the transition where no domain wall remains. The reason that 6x decreases at the low temperature limit is more subtle. The decrease of 6x implies, in our model, a steepening of the E- V slope in Figure 3a at £■=0. This can be understood if we envision that, as the temperature lowers, the ferroelectric domains sharpen consuming the remaining radomly oriented dipoles so that better polarization alignment is achieved on either side of the domain wall. This in turn stiffens the E-V curve and may have caused the observed decrease of 8x-
It is important to note that the temperature where Sx substantially decreases lies in the neighborhood of Tf, the "freezing" temperature in the Vogel-Fulcher equation (3). We believe this is the physical origin of Eq. (3). This is best seen from Imx* of Eq. (6) which dictates that the loss maximum cannot be placed at a temperature much below where Sx itself drops substantially, i.e., near Tf Physically, below this temperature, oscillatory movement of domain walls under a weak field becomes rather difficult in the face of the sharpening polarization order in the adjacent domains; only domain switching under a large field remains a possibility. This interpreta- tion of the Vogel-Fulcher equation and the "freezing" is supported by Figure 10 which plots Tf versus Tmax (taken at 10 kHz) for a number of
15000
10000 -
5000 -
150 200 250 300 Temperature (K)
350
FIGURE 9 Components of dielectric constant for Pb(Mg1/3Nb2/3)03. Xu is approximated by X at 100kHz and t>x is approximated by the difference of xiookHz and Xo.ikHz-

258 I-WEI CHEN AND Y. WANG
relaxors. A close correlation between the two temperatures is evident. Since Tf is caused by the sharpening of polarization order in the domains due to the ferroelectricity and Tmax signals the strength of ferroelectric interactions, a correlation between the two is expected. Both, in essence, are caused by many-body effects of dipole-dipole interactions.
Other aspects of our model are also consistent with the experimental observations if we empirically accept a constant 8\ and incorporating the many-body effects into Eq. (3) by identifying Ea with Ekf+ Ekm. As shown in Figure 11, relaxors that have a higher content of PbTi03 are found to have a lower Ea. This is partly due to a stronger ferroelectric interaction which makes dipole flipping easier. Another important effect of Ti addition on Ea is through the decrease of the spacing of ferroelectrically active sites. As a result, the kink height is lowered and hence the formation energy of the kink pair. Conversely, the substitution of Pb by non-lone-pair cations such as Ba, La, and Na all have the same effect of increasing the spacing of ferroelectrically active sites. Consequently, their Ea increases independent of the type of A-site substitution, as shown in Figure 11.
500
400
300
H
i i i | i i i i | i i i i | i i i i | i | i !/
/' r 1 ■_ Tf~ Tmox /%
200 -
100 - //'
'/ lMPB
y' ■ ■ / ' ■ ■ ■ ■ ' ■ ■ ■ ■ ' ■ ■ ■ ' ' ■ * ' '
100 200 300 400 500
T (K) max
FIGURE 10 rmax-7> correlation for relaxor materials. The upper dashed line, Tf = TmB%, is approached at a unique temperature, 440 K, which coincides with T/R/C transition in relaxor- PbTi03 systems (rMPB).

A DOMAIN WALL MODEL FOR RELAXOR 259
U.Li
0.10 ': jt A-site
0.08 my
> 0) 0.06 '
a V. w -N.
0.04 ^
0.02 *^-^ Ti-doped :
0.00 *-• ;
0 5 10 15 20 Mole percent of A-site dopants
25
FIGURE 11 Activation energy of A-site and B-site modified Pb(Mgi/3Nb2/3)03
5. RELAXOR-NORMAL FERROELECTRIC TRANSITION
According to the atomistic picture that we proposed in our previous paper, shown here in Figure 12, different polarization states in relaxors, such as (111) polar states of Nb ions, are separated by an energy barrier V'0 that is biased by a long range internal field (Curie-Weiss field) U due to dipole- dipole interactions. This field is empirically correlated to Tmax. As the Tmax
increases, it is possible that the barrier vanishes at a certain point. We now believe that the latter condition corresponds to the relaxor-normal ferro- electric transition shown in Figure 5. Ferroelectrics having a TmaK higher
<111> <111>
Unbiased Biased by internal field
FIGURE 12 Energy barrier for B-site hopping (also for kink migration) in relaxor materials. V0 is the barrier in the paraelectric state. In the ferroelectric state, the barrier is biased by the internal field due to orientation correlation of neighboring dipoles.

260 I-WEI CHEN AND Y. WANG
than the critical temperature, 450 K, have barrierless flipping of polarization when aided by an internal field, e.g., in the case of domain wall movement into an unpolarized region. This condition is realized during cooling through the Curie temperature. As the domain walls move freely across the lattice, large domains form in the ferroelectric crystal. The other feature of this critical state is that Tf = Tmax, meaning sharp polarization order across
a domain wall. The biased energy barrier, V0 in Figure 12, corresponds to the migration
energy of the kink. The bias effect of different Tmax is seen in Figure 13 for three relaxors PMN, PZN (Z standing for Zn) and PNN (the middle N standing for Ni). As Tmax increases, the activation energy decreases. Extrapolating the data to Tmax - 0 and subtracting a kink formation energy contribution 27&2 = 25 meV (7 = 10meV/m2 is the domain wall energy [23]
and b the spacing between Nb ions), we obtain an unbiased migration energy, V0 in Figure 12, of 82meV. This is consistent with the values previously obtained by optical spectroscopy for Nb hopping in paraelectric KNb03
[24]. Furthermore, extrapolating Figure 13 to 450 K, where the boundary between normal ferroelectric and relaxors is placed according to Figure 5, we find the activation energy to be entirely made of kink formation energy, meaning that the migration barrier has indeed disappeared because of the bias of ferroelectric interactions.
Thus, the relaxor-normal ferroelectric transition corresponds to a critical value of the Curie Weiss field which is sufficient to allow barrierless polarization flipping on an atomic scale. The fact that the critical value of Tmax is universal among all the Pb(B'1/3Nb2/3)03-PbTi03 relaxors implies the same Nb hopping barrier in the absense of the Curie-Weiss field. This universality is corroborated by the structural universality of the same off- center Nb displacement in all the ferroelectric niobates [25]. Given the structural universality of Nb, it is not, after all, surprising to see the very good correlations between all the characteristic temperatures and properties of relaxor ferroelectrics as we demonstrated here.
6. CONCLUSIONS
We have shown that the domain wall model can be successfully applied to relaxors despite their relatively complex chemical environments and the very fine polar regions with distributed inhomogeneities. In the low temperature, large field regime, it is analogous to the dislocation model for plastic deformation and provides very simple thermal activation parameters that

A DOMAIN WALL MODEL FOR RELAXOR 261
>
0.12
0.1
0.08
0.06
0.04
0.02
0
1
v. \ \
T-T-T-l
•
2.2
1 ■ 1
PNN
PMN
N \
N v PZN " MPB *\
1
, | ^%!> N
} 0.01 0.02
kT
0.03 0.04 0.0
(eV) max
FIGURE 13 Activation energy of three isostoichiometric relaxors showing the effect of Tm
elucidate the nature of domain switching. Compared to normal ferro- electrics, relaxors have spatially smaller barriers for domain switching. The size of these barriers is of the order of several nanometers and can be readily modified by solid solution alloying. By overcoming these barriers, long range domain wall motion is possible and can account for the observed relaxor behavior of polarization and depolarization at low temperatures and low frequencies. Moreover, since polarization is usually incomplete in relaxors even under a large poling field, depolarization readily occurs without the need of nucleating new domains as in normal ferroelectrics.
The dielectric behavior at low field and high frequencies is substantially attributed to domain wall oscillations by kink motion. These domain walls are pinned by barriers which cannot be overcome by thermal activation at high frequencies. The behavior is similar to that of dislocations in anelasticity but is complicated by the presence of ferroelectric-paraelectric transition. Above the transition temperature, which generally lies in the upper range of TmSLX, domains disintegrate and there is no more contribution from domain wall oscillation. Meanwhile, the spontaneous susceptibility experiences a broad maximum at the transition temperature and adds to the total dielectric response. Below the transition temperature, on the other hand, the polarization domains become increasingly sharp as the temperature lowers. This causes increasing difficulty for domain wall
262 I-WEI CHEN AND Y. WANG
oscillation. The effect scales with the ferroelectric interactions so that the temperature of "freezing" that represents the low temperature limit for domain wall oscillation also scales with Tmax. The combined dielectric response, taking into account the thermal activation of kink formation and kink migration as well as the structural sharpening, produces a Vogel- Fulcher type of behavior reminiscent of glass freezing.
Alloying effect can be largely characterized by the magnitude of Tmax
because of the overriding important of the ferroelectric interactions. When rmax reaches a critical value, around 440 K, the Curie-Weiss field is strong enough to allow barrierless polarization flipping on an atomic scale. This facilitates the formation of large domains and destroys the microstructural signature of relaxors. As a result, barriers become increasingly long range in nature so that depolarization does not occur until the Currie temperature when polarization correlation itself disappears. Meanwhile, domain wall oscillation is largely locked because of the sharp order parameter distribution. Whatever remains mobile for barrierless movement will have relatively little dissipation and hence little frequency dispersion. This relaxor-normal ferroelectric transition can be readily tuned by alloying using ferroelectrically active and inactive cations.
A cknowledgements
This research was supported by the U. S. National Science Foundation Ceramic Program under Grant No. DMR-96-32989 and 97-96219.
References
[1] Cross, L. E. (1987). "Relaxor Ferroelectrics", Ferroelectrics, 76, 241. [2] Bell, A. J. (1993). "Calculation of Dielectric Properties from the Superparaelectic Model
of Relaxors", J. Phys: Condens. Matters, 5, 8773. [3] Viehland, D., Jang, S. J. and Cross, L. E. (1990). "Freezing of the Polarization
Fluctuations in Lead Magnesium Niobate Relaxors", J. Appl. Physics, 68(6), 2916. [4] Smolenskii, G. A. (1970). " Physical Phenomena in Ferroelectrics with Diffused Phase
Transition", J. Phys. Soc. Japan, 28, supplement, 26. [5] Colla, E. V., Koroleva, E. Y., Okuneva, N. M. and Vakhrushev, S. B. (1992). "Low-
Frequency Dielectric Response of Pb(Mg1/3Nb2/3)03", /. Phys: Condens. Matters, 4, 3671. [6] Christen, H. M., Sommer, R., Yushin, N. K. and van der Klink, J. J. (1994). "Small-Signal
Dielectric Relaxation in the Disordered Perovskite Pb(Mg1/3Nb2/3)03", J. Phys: Condens. Matters, 6, 2631.
[7] Tsurumi, T., Soejima, K., Kamiya, T. and Daimon, M. (1994). "Mechanism of Diffuse Phase Transition in Relaxor Ferroelectrics", Jpn. J. Appl. Phys., 33 (4A), 1959.
[8] Schäfer, H., Sternin, E., Stannarius, R., Arndt, M. and Kremer, F. (1996). "Novel Approach to the Analysis of Broadband Dielectric Spectra", Phys. Rev. Lett., 76(12), 2177.

A DOMAIN WALL MODEL FOR RELAXOR 263
[9] Christian, J. W. (1965). The Theory of Transformation in Metals and Alloys, Pergamon Press, NY.
[10] Kocks, U. F., Argon, A. S. and Ashby, M. F. (1975). "Thermodynamics and kinetics of Slip", Prog. In Materials Sei., 19. Eds. B. Chalmers, J. W. Christian and T. B. Massalsk, Pergamon Press, NY.
[11] Hirth, J. P. and Lothe, J. (1982). Theory of Dislocations, Wiley. [12] Little, E. A. (1955). "Dynamic Behaviour of Domain Walls in Barium Titanate", Phys.
Rev., 98(4), 978. [13] Merz, W. J. (1958). "Domain Formation and Domain Wall Motions in Ferroelectric
BaTi03 Single Crystals", Phys. Rev., 95(3), 690. [14] Miller, R. C. and Weinerich, G. (1960). "Mechanism for the Sidewise Motion of 180°
Domain Walls in Barium Titanate", Phys. Rev., 117(6), 1460. [15] Hayashi, M. (1972). "Kinetics of Domain Walls in Ferroelectric Switching I. General
Formulation", /. Phys. Soc. Japan, 33(3), 616. [16] Nomura, S., Endo, M. and Kojima, F. (1974). "Ferroelectric Domain and Polarization
Reversal in Pb(Zn1/3Nb2/3)03 Crystal", Jpn. J. Appl. Phys., 13(12), 2004. [17] Hilton, A. D., Barker, D. J., Randall, C. A. and Shrout, T. R. (1990). J. Mater. Sei., 25,
3461. [18] Mulvihill, M. L., Cross, L. E. and Uchino, K. (1995). "Low-Temperature Observation of
Relaxor Ferroelectric Domains in Lead Zinc Niobate", /. Amer. Ceram. Soc., 78(12), 3345.
[19] Chen, I-W., Li, P., Wang, Y. (1996). "Structural Origin of Relaxor Perovskite", J. Phys. Chem. Solids, 57(10), 1525.
[20] Glass, A. M. (1969). "Investigation of the Electrical Properties of Sr!_xBaxNb206 with Special Reference to Pyroelectric Detection", J. Appl. Phys., 40(12), 4699.
[21] Kirillov, V. and Isupov, V. (1973). Ferroelectrics, 5, 3. [22] Nowick, A. S. and Berry, B. S. (1972). Anelastic Relaxation in Crystalline Solids, Academic
Press. [23] Kaufman, L. and Cohen, M. (1958). "Thermodynamics and Kinetics of Martensitic
Transformations", Prog. Metal Phys., 7, 165. [24] Sokoloff, J. P., Chase, L. L. and Rytz, D. (1988). "Direct Observation of Relaxation
Modes in KNb03 and BaTi03 Using Inelastic Light Scattering", Phys. Rev. B, 38(1), 597. [25] Li, P., Chen, I.-W., unpublished research on EXAFS of relaxors.

Ferroelectric*, 1998, Vols. 206-207, pp. 265-273 Reprints available directly from the publisher Photocopying permitted by license only
> 1998 OPA (Overseas Publishers Association) Amsterdam B.V. Published under license
under the Gordon and Breach Science Publishers imprint.
Printed in India.
A PHENOMENOLOGY OF RELAXOR-FERROELECTRIC
PHASE TRANSITIONS
B. E. VUGMEISTER and H. RABITZ
Department of Chemistry, Princeton University, Princeton, NJ 08544
(Received 19 March 1997; In final form 8 May 1997)
We propose a phenomenological theory for the dielectric properties of relaxor ferroelectrics undergoing a "relaxor-ferroelectric" phase transition based on the assumption that the interacting polar clusters distributed in highly polarizable host lattice are responsible for relaxor behavior. Two major differences between relaxor ferroelectrics and conventional order-disorder ferroelectrics have been employed in the theory: i) the existence of the broad distribution of local fields experienced by each polar cluster; ii) the existence of the distribution of relaxation times giving rise to non-exponential non-critical kinetics which may compete with the critical slowing down near the ferroelectric phase transition temperature. We show that the theory is in good agreement with the experiment on frequency dependent permittivity in PbSco.5Tao.5O3 undergoing the first order ferroelectric phase transition.
Keywords: Relaxor ferroelectric; PbSco.5Tao.5O3; phase transition
PACS Numbers: 77.80.-e; 64.60.-i
Relaxor ferroelectrics represent a new class of ferroelectrics which have been a challenging subject since their detection almost forty years ago. They are mixed and disordered systems such as PbMg^Nba/aOs (PMN) or PbSco.5Tao.5O3 (PST) or Ki_xLixTa03 (KLT). Relaxor ferroelectrics possess very unusual properties which have been the subject of numerous investigations in the recent years (see for example Refs. [1-13]).
One of the most important characteristics of relaxor ferroelectrics, is the coexistence of low frequency dispersion of dielectric permittivity, typical for spin glasses, with very high values of the permittivity indicating intermediate range polar order. In some systems like PST with B-site chemical disorder [7]
or KLT above the critical concentration [14], intermediate range polar order can transform to true long range order with the decrease of the temperature.
265

266 B. E. VUGMEISTER AND H. RABITZ
The terminology relaxor-ferroelectric phase transition has been used [7' in order to distinguish between a conventional paraelectric-ferroelectric phase transition. In other systems like PMN long range order appears with the change of the composition [12] or by applying an external field [5'8].
Experiments show that there is a symmetry breaking on a nanometer scale as observed from Raman scattering[2] and X-ray and neutron diffraction[4'9]. This observation implies that polar clusters exist well above Tc and the observed properties of relaxors are strongly affected by the reorientations of the clusters.
It has been proposed'11 that the polar clusters behave like large superparaelectric dipole moments. The broad distribution of relaxation times for cluster orientations originates from the distribution of the potential barriers separating different orientational states like that in spin glasses[3]. Models [1' 3] can not explain the appearance of long range order with the change of the material composition or due to an applied external field. On the other hand, it has been proposed recently [5' ] 1] that the origin of relaxor behavior is due to the domain states induced by the static random fields (caused, for example, by charged composition fluctuations in PMN). Until now no attempts have been made to deduce the observed properties of relaxors from this model.
Below we develop a phenomenology which allows one to incorporate within the same formalism the effect of long time nonexponential relaxation, typical for relaxors, with the existence of a true ferroelectric phase transition. We illustrate the predictions of the theory for the dielectric response of PbSco.5Tao.5O3 that transforms spontaneously to normal ferroelectrics due to a first order phase transition. In the approach proposed below we further develop the cluster picture of relaxor ferroelectrics taking into account the interaction between clusters within the self-consistent random local field theory [15' 14l
We start from the master equation describing the relaxation of the polarization of each cluster to a quasi-equilibrium state which depends on the value of the local field at any moment of time
dPd
dt ■\PA-P*{E)), (1)
where Pcl is the non-equilibrium polarization of the given cluster possessing the relaxation time r. P^{E) is the equilibrium thermal average cluster polarization in the local field E induced by other clusters. In general E is a time dependent random field. The local field also includes the contribution from the applied field Eex and the contribution from the static fields caused by the imperfections of the material.

A PHENOMENOLOGY OF RELAXOR TRANSITIONS 267
In order to calculate the observable properties of the system one should average Eq. (1) with respect to r and E. For this purpose we rewrite Eq. (1) in the equivalent integral form
Pd(t) = Pd(0)e~l/T+- f dt'e-WI'P'SW)). T Jo (2)
Then, taking the average in Eq. (2) with respect to T, E and the initial cluster polarization Pc\ (0), we obtain
p{t) = p(o)ß(0 - f dt> ^(d~° Peq (O, (3)
where
0(0 = e-'/r, (4)
P*(t) = JdEP*(E)AE,P(t)), (5)
f(E, P(t)) is the distribution function of the local field. It depends parametrically on the value of the average polarization of the system P(t). We will consider below f(E, F) in the form
f{E,P)=f(E-1P-1-^E^, (6)
where f(E) is a symmetric function. This form of/is consistent with the mean field approximation f(E, P) = 6(E--yP-je0Eex/4ir), where 6 is the delta-function and 7 the local field phenomenological parameter.
In mixed systems the effect of composition fluctuations leads to a deviation from the simple mean field picture that can be taken into account by the replacement of the «^-function by the function / in Eq. (6) with the finite width. The shape and the width of f{E) depends not only on the distribution and strength of the paraelectric moments, but also on any static random fields caused by the imperfections of the material.
The value 7e0 EeJ4w in Eq. (6) is the local field induced by the external field in the dielectric media with the dielectric constant £0>1 [16'14] 0-e-> we
assume that the polar clusters are distributed in a highly polarizable dielectric media). In relaxor ferroelectrics which are mainly perovskite-based highly polarizable materials, the typical values are e0 > 103.

268 B. E. VUGMEISTER AND H. RABITZ
As seen from Eq. (3), the slow non-exponential relaxation of the system is characterized by the function Q(t). Assuming an Arrhenius or Vogel- Fulcher(VF) law for r(:T)
T(r) = Toexp[c//(r-r0)], (7)
we may write Q(t) in the form
/■OO
Q{t) = dUg(U), (8) J(T-To)\n{t/v>)
where g(U) is the distribution function of the potential barriers and we employed a commonly used approximation [17]
expH/r(E/)] = 0[U- (T- 7o)ln(0-)], (9)
valid for />r0 and 6 is the theta function. The temperature T0 in Eq. (7) is a "freezing" temperature of local clusters which indicates the glassy behavior of the system. In random systems such a glassy behavior may coexist with the long range order [18]. The Arrhenius law corresponds to r0 = 0.
Eqs. (3) and (8) can be applied for the analysis of different experimental situations (e.g., decay of the polarization, the difference between field-cooled and zero field-cooled dielectric susceptibility, the effect of a frequency dependent hysteresis loop, etc). In this paper we will concentrate only on the calculation of the frequency dependent linear dielectric susceptibility.
In order to calculate the steady state linear dielectric susceptibility in the presence of an additional time independent field E(J we write
Eex(t)=E^+EWe^\ (10)
P(t) = P1 + Pi(t), (n)
where Ps is the time independent polarization induced by the field E°ex. For E$ = 0, we denote Ps as the spontaneous polarization. Assuming P(0) = Ps
in Eq. (3) and considering a linear expansion of Pe\t) with respect to ^ex
and Pi if), we obtain
Ps = JdEP%(E)f(E,Ps), (12)

A PHENOMENOLOGY OF RELAXOR TRANSITIONS 269
™-jr*^?/- P^(E)(df("E,P^Emciut' I df^P^ p.(t')
(13)
.(0) 'ex • where f(E, Ps) is given by Eq. (6) with P — Ps, Eex = E{
e
Taking the Laplace transform of Eq. (13) and performing an integration by parts with the use of Eq. (6) and the definition of the dielectric constant
e(u),T)=4vdPi(Lj)/dEW+e0
we obtain
In Eq. (15)
e(u, T) £o
1-K(T)Q(LJ,T)-
K(T) = JdEP*(E) df(E,Ps)
dPs
and ß(w, T) is the Laplace transform of dQ(t)/dt given by
Q(w,T) = (1/(1+iuT))
(14)
(15)
(16)
(17)
For a broad distribution of potential barriers Eq. (17) can be written in the form [20]
Q'(u,T) = I (T-T0)ln-
dUg(U),
71" , Q"(v,T)=-(T-T0)g (r-Tb)ln-
WT0
(18)
(19)
Note that Eq. (15) obtained for dielectric permittivity in relaxor ferro- electrics is different from the equation
e(w, T) = e(0, T)Q(u>, T) (20)
which has been widely adopted in the spin glass literature as a pheno- menological description of long time nonexponential relaxation [19'20' (e(0, T) is the equilibrium (field-cooled) permittivity). This difference has not been recognized in recent studies[21' 22', where Eq. (20) has been applied

270 B. E. VUGMEISTER AND H. RABITZ
to relaxor ferroelectrics possessing true long range order. The authors did not address the point that in this case a comparison of Eq. (20) with well known results for regular order-disordered ferroelectrics [23] possessing a single relaxation time shows that due to the effect of the critical slowing down, the value of r in Eq. (17) could not be ascribed to the relaxation time of independent relaxators, as one assumes in Eq. (20). One can see from Eq. (15) that the description of low frequency dielectric dispersion in terms of Eq. (20) can be justified only if the second term in the denominator of Eq. (15) is small. Such a situation is a typical one for spin glasses and dipole glasses. At the same time, in relaxor ferroelectrics possessing very large values of dielectric permittivity e(ui, T) » e0, then Eq. (15) can not be reduced to the form of Eq. (20).
Eqs. (15)-(19) represent the proposed phenomenological description of low frequency dispersion in relaxor ferroelectrics possessing as well first or second order phase transitions or remaining only incipient ferroelectrics which do not show any spontaneous polarization. They can be used also for the reconstruction of the relaxation function Q (u>, T) from the experimental data on frequency dependent susceptibility. We illustrate below this possibility for PST.
PST with B-site chemical disorder undergoes a first order relaxor- ferroelectric phase transition at Tc « 269 K. The dielectric permittivity of PST shows pronounced frequency dispersion with the position of a frequency dependent maximum obeying the VF law [7].
u) = LJoe~Tm'To, (21)
where w is the frequency of the applied field, Tm is the temperature of the permittivity maximum corresponding to frequency w.
It has been widely accepted that a VF type relation for the permittivity maximum is a consequence of the VF law, Eq. (7) for the relaxation frequency. This assumption has been argued recently by Tagantsev [21] who proposed that observed in PST of VF like frequency dependence of Tm can be explained with the use of an Arrhenius temperature dependence of r taking into account the existence of the first order phase transition and the fact that in PST T0 « Tc. The important conclusion of the Tagantsev analysis is the indication that Tm is influenced significantly by the values of static dielectric constant (at u> = 0), not only by the specific temperature dependence of r. However in order tc be more conclusive one should analyze the shape of the frequency dependent permittivity as a function of temperature for different frequencies not just the frequency dependence of

A PHENOMENOLOGY OF RELAXOR TRANSITIONS 271
the permittivity maximum. Such an analyses is given below with the use of Eq. (15).
First, we extrapolated experimental data '7] and extracted the static permittivity above Tc as shown in Figure 1 (dashed curve). Then, using Eq. (15) and the fact that at w = 0 Q' is equal to 1, we obtained the values of k(T) above Tc. We used the value s0 « 500 for the host lattice permittivity in agreement with the low temperature values of e(T) [7]. Indeed, at low temperatures polar clusters are frozen and observed dielectric response is determined entirely by the host lattice.
With given values of k(T) and experimental values of frequency dependent permittivity e' (to\, T) at frequency LO\= 10 kHz (curve 1) we have calculated the values of Q' {uj\, T) using Eq. (15) and the fact that Q'
« Q". According to Eq. (18) Q'(UJ, T) is a function of (T— T^) In (WT0), and
therefore one can verify that Q' (u>, T) = Q' (w\, T\) with 7\= (T— T0) (ln(wT0)/ln(o;iTo)) + T0. Using this scaling relation' one can reconstruct the values of Q '(w, T) at other frequencies and, therefore, the values of e '(w, T) using the obtained values of Q '(u>, T). The results of such a reconstruction are presented in Figure 1 for the upper 100 Hz (curve 2) and lower 1 MHz (curve 3) boundary frequencies used in the experiment. We used T0 ~ 10~12
in accordance with Ref. [7].
35000 s \ •
1 * 30000 \
1 * w = 0 1 i
V
25000 1 2 ̂ \ l\
20000
3 *\ 15000
10000
1 ^N,,,,,^
5000 1 1,
175 200 225 250 275 325 350
Temperature (K)
FIGURE 1 Real part of permittivity in PST for frequencies 100 Hz (2), 10kHz (1), and 1 MHz (3). Vertical dashed line denotes the first order phase transition temperature.

272 B. E. VUGMEISTER AND H. RABITZ
One can see from Figure 1 that with the developed phenomenological approach we were able to reproduce with rather good accuracy the shape of the temperature dependence of permittivity at different frequencies of the applied field. The parameter of the fit T0 is found to be r0 = 255K. This result means that the employment of the VF law for T(T) is very crucial for obtaining the correct temperature and frequency dependence of permittivity for PST. The VF relation results simultaneously in the very fast temperature dependence of permittivity with a rather slow dependence on ln(wr0). At the same time an Arrhenius like dependence of T(T) would result in an extremely fast dependence of permittivity on ln(wr0) inconsistent with the experimental data.
In conclusion we have presented a simple phenomenological theory describing qualitatively the characteristic anomalies of relaxors undergoing a relaxor-ferroelectric phase transition. The theory combines the equili- brium properties of disordered ferroelectrics, which deviate from the predictions of mean field theory, with the effect of non-critical non- exponential relaxation and can be used for the characterization of complex materials with relaxor behavior.
Acknowledgements
The authors acknowledge support from the National Science Foundation and the Army Research Office. We are thankful to J. Toulouse and A. Tagantsev for the useful discussion of the results of the paper.
References
P no: in [i2;
[i3: [i4:
Cross, L. E. (1987). Ferroelectrics, 76, 241. Burns, G. and Dagol, F. H. (1990). Ferroelectrics, 104, 25. Vieland, D., Jang, S. J., Cross, L. E. and Wuttig, M. (1990). J. Appl. Phys., 68, 2916. de Mathan, N., Husson, E., Galvarin, G, Gavarri, J. R., Hewat, A. W. and Morell, A. (1991). J. Phys. Condens. Matter, 3, 8159. Westphal, V., Kleemann, W. and Glinchuk, M. D. (1992). Phys. Rev. Lett., 68, 847. Cola, E. V., Koroleva, E. Yu., Okuneva, N. N. and Vakhrushev, S. V. (1992). J. Phys. Condens. Matter, 4, 3671. Chu, F., Setter, N. and Tagantsev, A. K. (1993). J. Appl Phys., 74, 129. Sommer, R., Yushin, N. K. and van der Klink, J. J. (1993). Phys. Rev. B, 48, 13230. Rosenfeld, H. D. and Egami, T. (1994). Ferroelectrics, 158, 351. Toulouse, J., Vugmeister, B. E. and Patnaik, R. (1994). Phys. Rev. Lett., 73, 3467. Glazounov, A. E., Tagantsev, A. K. and Bell, A. J. (1996). Phys. Rev. B, 53, 11281. Bidault, O., Licheron, M., Husson, E., Calvarin, G. and Morell, A. (1996). Solid State Commun., 98, 765. Samara, G. (1996). Phys. Rev. Lett., 77, 314. Vugmeister, B. E. and Glinchuk, M. D. (1990). Rev. Mod. Phys., 62, 991.

A PHENOMENOLOGY OF RELAXOR TRANSITIONS 273
[15] Vugmeister, B. E. and Stephanovich, V. A. (1987). Solid State Commun., 67, 323. [16] Kittel, C. (1986). Introduction to Solid State Physics (Willey, New York). [17] Ma, S.-K. (1980). Phys. Rev. B, 22, 4484. [18] Vugmeister, B. E., Diantonio, P. and Toulouse, J. (1995). Phys: Rev. Lett., 75, 1646. [19] Binder, K. and Young, A. P. (1986). Rev. Mod. Phys., 58, 801. [20] Courtens, E. (1984). Phys. Rev. Lett., 52, 69. [21] Tagantsev, A. (1994). Phys. Rev. Lett., 72, 1100. [22] Singh, N. and Pandey, D. (1996). /. Phys. Condens. Matter, 8, 4269. [23] Blinc, R. and Zeks, B. (1974). Soft Modes in Ferroelectrics and Antiferroelectrics (North-
Holland, New York).

Ferroelectrics, 1998, Vols. 206-207, pp. 275-291 Reprints available directly from the publisher Photocopying permitted by license only
) 1998 OPA (Overseas Publishers Association) Amsterdam B.V. Published under license
under the Gordon and Breach Science Publishers imprint.
Printed in India.
THE INFLUENCE OF MOBILE VS. RANDOMLY QUENCHED IMPURITIES
ON FERROELECTRIC PHASE TRANSFORMATIONS
QI TAN, JIE-FANG LI and DWIGHT VIEHLAND
Department of Materials Science and Engineering, the Seitz Materials Research Laboratory, University of Illinois at Urbana-Champaign, Urbana, IL 61801
(Received 24 February 1997; In final form 1 August 1997)
A comparative study of the influence of both mobile and randomly quenched impurities and their associated defect complexes on ferroelectric phase transformations in lead zirconate titanate ceramics has been performed by dielectric spectroscopy and transmission electron microscopy. These investigations have shown a strong dependence of the structure-property relations on the mobility of impurities and/or defect complexes in the temperature range near and below the phase transformation. Impurities-defects which are mobile until temperatures below the transformation are believed to preferentially locate near domain boundaries, resulting in polarization pinning. For these compositions, no evidence of relaxor ferroelectric behavior was observed. However, for the compositions whose impurities-defects were essentially immobile from temperatures above the ferroelectric phase transformation, relaxor behavior and polar nanodomains were found. Studies of the influence of electrical and thermal histories on properties provided additional insights into the influence of impurity-defect mobility.
Keywords: Phase transformation; domain; perovskite; dielectric constant; ferroelectric; polarization
1. INTRODUCTION
In AB03 perovskites such as Pb(Zri_ÄTix)03 (PZT), A-site cations play an important role in the development of long-range polar order, as they make the dominant contribution to the ferroelectric displacement and serve to link neighboring B06 octahedra [Thomas (1990)]. The coupling between neighboring B06 octahedra can be weakened by A-site compositional modifications, resulting in significant changes in the nature of the
275

276 Q. TAN et al.
ferroelectric phase transformation. Various changes have been reported due to compositional modifications. Three general changes which are often reported, include: (i) a partial disordering of the ferroelectric state characterized by decreases in both the remenant polarization and coercive field, (ii) a shifting of the ferroelectric phase transformation temperature, and (iii) the development of a frequency dependence in the dielectric
response. The most pronounced changes in the ferroelectric properties with small
concentrations of A-site substitutions are reportedly found using aliovalent compositional modifications [Haertling and Land (1971); Ikeda and Okano (1964); Jaffe, Cook and Jaffe (1971)]. Aliovalent A-site modifications can be categorized on the basis of the compensation mechanism required to maintain charge neutrality: (i) A-site modifications which require associated A-site vacancies [Haertling and Land] such as La3 + , and (ii) A-site modifications which require B-site vacancies created by pentavalent ions on B-sites and suppresses A-site ones [Ikeda and Okano (1964)] such as K1 + . Previous studies of La3 +-modified PZT (PLZT) have shown dramatic changes in ferroelectric properties and domain stability with increasing La3+ impurity concentrations. [Haertling and Land (1971); Dai, Xu and Viehland (1994); Li, Dai, Chow and Viehland (1995)] Systematic studies of the structure-property relationships have revealed a common sequence of domain-like states with increasing La3+ concentration [Dai, Xu and Viehland (1994)], including: (i) normal micron-sized domains, (ii) tweed-like subdomain structures, and (iii) polar nanodomains. Corresponding di- electric investigations demonstrated normal ferroelectric phase transforma- tion characteristics for micron-sized domains, a strongly broadened transformation for tweed-like subdomains, and relaxor ferroelectric behavior for polar nanodomains. Recent studies of KI +-modified PZT (PKZT) have shown significantly different changes in ferroelectric proper- ties and phase stability with increasing K1+ impurity concentrations [Tan, Xu, Li and Viehland (1996)], relative to La3 + . These investigations have shown the development of "wavy" domains from micron-sized domains with relatively small K1+ concentrations (~1 at.%). Further increments in K1 + concentration did not result in dramatic changes in domain stability. Comparisons of dielectric property data suggested that the "wavy" domains result from pinning effects.
The differences in the structure-property relationships between lower and higher valent A-site substitutions might be due in part to a difference in mobilities of the two general types of modifications in the temperature range near and below the ferroelectric phase transformation. Lower valent

MOBILE VS. RANDOMLY QUENCHED IMPURITIES 277
modifications result in B-site vacancies which reside on the center of each B06 octahedron and which are relatively large, whereas higher valent modifications result in A-site vacancies which reside within eight neighboring B06 octahedra and which are relatively small. Consequently, higher valent impurities might remain significantly more immobile to higher temperatures, than lower valent ones. However, the information available concerning the influence of higher and lower valent modifications, and/or mobile versus immobile (quenched) impurities is very limited. In addition, the difference in mechanisms resulting in domain structure changes for the various types of impurities and resultant property changes has not been studied.
The purpose of this work was to systematically investigate in a comparative manner the influence of both lower and higher aliovalent compositional modifications on the ferroelectric behavior of rhombohedral- structured PZT. It was anticipated that the difference between lower and higher valent modifications might be understood in terms of differences between mobile and randomly quenched impurities, respectively. In addition, it was hoped that a better understanding of ferroelectric phase transformations in impure systems might develop, in particular with respect to the importance of interactions between impurities (mobile and quenched) and domains.
2. EXPERIMENTAL DESIGN
Studies were made on (Pbi_3/2xLax) (Zr0.65Tio.35)03 (PLZT lOOx/65/35) and PbxK1_x(Zr0.65Tio.35)i-x/403(PKZT 100x/65/35) ceramics fabricated by a conventional mixed oxide method. The purities of PbO, La203, K2C03, Zr02 and Ti02 powder were 99.9%. The weighted powders were mixed with isopropyl alcohol and ball milled for 5 hours using a magnesium oxide stabilized zirconium oxide media. The slurries were then dried at 78°C followed -by a calcination at 850°C for 4 hours. After further ball milling of the calcined powder for 10 hours in isopropyl alcohol and subsequent drying, the powder was sieved with a 100-mesh sieve to be further homogenized. The green compact formed at a hydraulic pressure of about 25 kPsi was sinter-forged at 1150°C for 2 hours under a pressure of 60 MPa. Such densified specimens were then annealed at 1300°C for 2 hours in a PbO excess environment, in order to reach a coarse-grained state (~4 urn).
The complex dielectric permittivity was measured using a Hewlett- Packard 4284A inductance-capacitance-resistance (LCR) meter which can cover a frequency range between 20 and 106Hz. Dielectric measurements

278 Q. TAN et cd.
were made by putting the specimens in a small tube furnace specifically equipped. The P-E behavior was characterized with a computer-controlled, modified Sawyer-Tower circuit using a measurement frequency of 50 Hz.
Thin sections were prepared for TEM studies by ultrasonic core drilling 3- mm diameter discs which are mechanically polished to ~ 100 um. The central portions of the discs were further ground by a dimpler to ~15 urn, and argon ion-milled to perforation on a cold stage. Specimens were coated with carbon before examination. The TEM studies were carried out on a Phillips EM-420 microscope at 120 kV.
3. STRUCTURE-PROPERTY RELATIONSHIPS OF La3+ AND K1+ MODIFIED PZT
3.1. Dielectric Studies
Figures 1(a) and (b) show the temperature dependent dielectric constant data for various compositions in the PLZT 100x/65/35 and PKZT 100x/65/ 35 sequences, respectively. The data shown for PLZT were taken using measurement frequencies of 102, 103, 104, 105, 5xl05Hz. The data shown for the PKZT were taken using frequencies of 104, 105 and 106Hz; lower frequency data are not shown due to Maxwell-Wagner effects, indicating the presence of space charge conduction. Figure 1(a) exhibits a strong influence of La3+ concentration on the phase transformation and the dielectric response characteristics. For 0/65/35, a normal ferroelectric transformation can be seen to occur near 360°C. For PLZT 4/65/35, the ferroelectric transformation temperature was lowered to ~240°C and the temperature dependent response was significantly broadened, relative to the base composition. Upon increasing the La3+ concentration to 8 at.%, the dielectric constant maximum was shifted down to ~110°C and strong relaxor ferroelectric characteristics became evident, indicating significant disordering of the ferroelectric state which persists on cooling until temperatures far below that of the dielectric maximum.
Figure 1(b) illustrates the dependence of K1+ concentration on the temperature dependent dielectric response. The changes with increasing K1+ can be seen to be significantly different than that with increasing La- content. For the composition 0.2/65/35, a ferroelectric phase transformation can be seen to occur near 360°C, however the value of the dielectric constant was significantly lower than that for 0/65/35 shown in Figure 1(a). For the PKZT 4/65/35, a small decrease of the temperature of the dielectric

MOBILE VS. RANDOMLY QUENCHED IMPURITIES 279
90 180 270 360 Temperature (°C)
450
FIGURE 1 Dielectric constant as a function of temperature for various PLZT and PKZT compositions, (a) PLZT 0/65/35, 4/65/35, and 8/65/35, and (b) PKZT 0.2/65/35, 4/65/35, and 8/65/35.
maximum (Tmax) to ~340°C, a slight decrease (~5%) in the maximum value of the dielectric constant (Kmax), and a minor degree of broadening of the temperature dependent response characteristics were observed. On further increasing the K1+ concentration to 8 at.%, Tmax was decreased to ~300°C, Kmax was decreased by ~40%, and a strong broadening of the temperature dependent characteristics was observed. The comparisons of these results to those for PLZT clearly demonstrate a significant difference between the effects of lower and higher valent A-site compositional modifications on PZT.
3.2. TEM Studies
Room temperature bright field images are shown in Figures 2(a)-(d) for PLZT 0/65/35, 4/65/35, 8/65/35 and 10/65/35. Distinct changes in the domain size and morphology are evident in Figure 2 with increasing

280 Q. TAN et al.
FIGURE 2 Room-temperature bright-field TEM images for various PLZT compositions, (a) 0/65/35, (b) 0/65/35, (c) 8/65/35 and (d) 8/65/35.
La-content. For the composition 0/65/35 normal micron-sized domains are readily observed at room temperature (see Fig. 2(a)). This domain structure had a stripe-like morphology, where the stripes extend from grain to grain. The dielectric response for 0/65/35 was typical of a normal long-range ferroelectric state, no evidence of relaxor behavior or broadening of the phase transformational characteristics were observed. For the composition 4/65/35 (Fig. 2(b)), a micron-sized domain structure with a stripe-like morphology was again observed. However, a finer-scale subdomain structure can be seen to coexist within the micron-sized domain patterns. These smaller domains were near-periodically spaced and had a striation- like morphology. This subdomain structure may provide partial stress-relief of internal electrostrictive strains associated with polarization nonunifor-
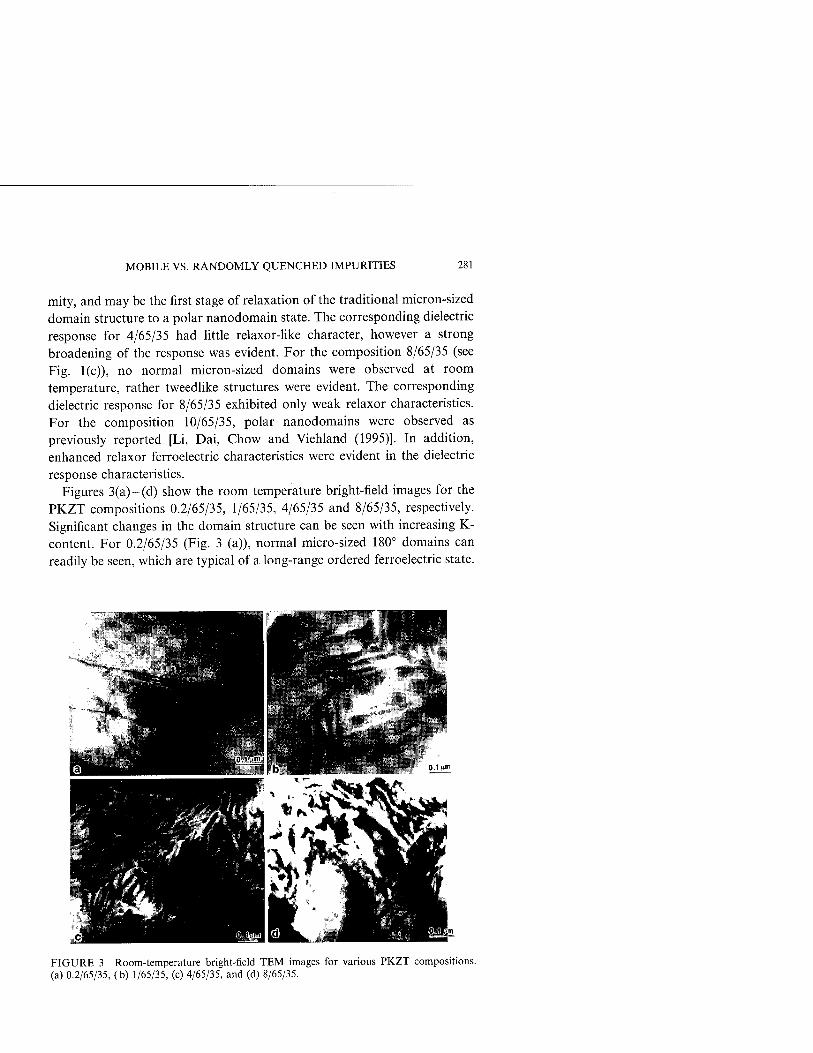
MOBILE VS. RANDOMLY QUENCHED IMPURITIES 281
mity, and may be the first stage of relaxation of the traditional micron-sized domain structure to a polar nanodomain state. The corresponding dielectric response for 4/65/35 had little relaxor-like character, however a strong broadening of the response was evident. For the composition 8/65/35 (see Fig. 1(c)), no normal micron-sized domains were observed at room temperature, rather tweedlike structures were evident. The corresponding dielectric response for 8/65/35 exhibited only weak relaxor characteristics. For the composition 10/65/35, polar nanodomains were observed as previously reported [Li, Dai, Chow and Viehland (1995)]. In addition, enhanced relaxor ferroelectric characteristics were evident in the dielectric response characteristics.
Figures 3(a)-(d) show the room temperature bright-field images for the PKZT compositions 0.2/65/35, 1/65/35, 4/65/35 and 8/65/35, respectively. Significant changes in the domain structure can be seen with increasing K- content. For 0.2/65/35 (Fig. 3 (a)), normal micro-sized 180° domains can readily be seen, which are typical of a long-range ordered ferroelectric state.
FIGURE 3 Room-temperature bright-field TEM images for various PKZT compositions, (a) 0.2/65/35, (b) 1/65/35, (c) 4/65/35, and (d) 8/65/35.

282 Q. TAN et al.
The domains are several microns in length and ~0.5 |^m in width. However, with the addition of only 1 at.% K1 + , significant changes in the domain morphology were observed. In Figure 3(b), the size of the domain structures can be seen to be decreased dramatically for 1/65/35, relative to that for 0.2/ 65/35. The length of the domains was less than 1 |^m and their widths were less than 0.1 urn. In addition, the domain boundaries can be seen to be significantly more wavy, relative to the nearly straight boundaries found for the lower K-content specimen.
With increment in the K-content, the changes in the domain patterns Were found to become more pronounced. For 4/65/35, a further decrease in the domain size was observed, as can be seen in Figure 3(c). The lengths of the domains were less than 0.5 urn and their widths were approximately several hundred angstroms. In addition, the degree of wavy character in the domain patterns was significantly increased with increasing K1 + . In fact, the waviness was the dominant morphological characteristic of the patterns for 4/65/35. However, it should also be noticed that the domains maintained a significant degree of preferred orientation along a family of crystal- lographically equivalent polar directions. The waviness in the morphology was due to continuous bending of the domain orientation between various equivalent directions on a length scale of ~ 0.5 urn. For 8/65/35, the trends of decreasing domain size and increasing irregularity in the domain patterns were observed to continue, as can be seen in Figure 3(d). For this composition, the presence of polar clusters of nanodomains was infre- quently found. The characteristic feature for high K-content ferroelectrics in the 100x/65/35 sequence was the irregular wavy domain patterns.
Comparison of the results presented above for PKZT 100x/65/35 to those for PLZT 100x/65/35 will reveal distinct differences between the influence of lower valent A-site modifications, relative to higher valent ones. For PLZT, normal micron-sized domains were found to remain present with increasing La3 + , until concentrations between 4 and 6 at.%. However, for PKZT, a rapid decrease in the domain size was observed with the addition of only 1 at.% K1 + . Further increment in K1 + concentration to 4 at.% resulted in additional dramatic changes in domain size and morphology. Although, higher K1+ concentrations did not result in the evolution of polar nanodomains or clusters at room temperature, as La3+ modification did. These results clearly demonstrate that the effects of minor concentrations of K1 + impurities on the domain structures are much more pronounced than for La3 + . However, ferroelectric order is not destroyed by high K1 +
concentrations as for La3 + , rather a strong degree of longer range ferroelectric order is maintained.

MOBILE VS. RANDOMLY QUENCHED IMPURITIES 283
4. INFLUENCE OF IMPURITY DISTRIBUTIONS ON FERROELECTRIC PHASE TRANSFORMATION
4.1. Polarization Studies
If the impurities in PKZT remain mobile on cooling through the ferroelectric transformation, then they could readily diffuse to the domain boundaries pinning the boundaries. Randomly quenched impurities could also pin boundaries, however they lack the mobility to diffuse to the boundaries, and consequently can be expected not to have a high concentration near the boundaries. For PKZT, the degree of switchable polarization under field reversal might be expected to decrease with increasing K1+ content, as the density of pinned walls would increase. Figures 4(a)-(d) show the P-E characteristics for PKZT 0.2/65/35, 1/65/35, 4/65/35. and 8/65/35. These results clearly demonstrate the presence of strong double-loop-like polarization curves. Douple-loop-like characteris- tics have previously been reported in aged ferroelectric ceramics. [Griffiths
(d) l
8/65/35 / / - /
/ /* / -
/ y . /
LS- -40 -20 0 20 40 "-40 -20 0 20 40
Electric Reld (kV/cm) Electric Field (kV/cm)
FIGURE 4 Room-temperature Sawyer-Tower polarization (P-E) curves for various PKZT compositions, (a) 0.2/65/35, (b) 1/65/35, (c) 4/65/35, and '(d) 8/65/35.

284 Q. TAN et al.
and Rüssel (1972); Borchhardt et al. (1980); Johker (1972); Bradt and Ansee (1969); Dederichs and Arlt (1986); Carl and Hardt (1978)] Inspection of Figure 4 will reveal that the degree of switchable polarization decreases dramatically with increasing K1 + content. Unmodified PZT has a switch- able polarization of ~ 30 ^C/cm2. However, with increasing K1 + content in the range of 1 to 4 at.%, this value decreased by nearly an order of magnitude. For K1+ contents in excess of 8 at.%, conduction effects resulted in lossy loops. Comparison of these results with the microstructural results in Figure 3 will demonstrate the presence of an increasing domain density whose polarization becomes increasingly difficult to switch, with increasing K1 + concentration.
No indications of pinning effects were observed with increasing La for PLZT 100x/65/35, in fact quite the opposite was found. Figures 5(a)-(c) show P-E curves for the PLZT compositions 1/65/35, 4/65/35 and 8/65/35. Increasing La3+ concentration can be seen to reduce the coercive field required for polarization switching and to increase the degree of switchable
-40 -20 0 20 40 Electric Held (kV/cm)
FIGURE 5 Room-temperature Sawyer-Tower polarization (P-E) curves for various PLZT compositions, (a) 1/65/35, (b) 4/65/35, (c) 8/65/35.

MOBILE VS. RANDOMLY QUENCHED IMPURITIES 285
polarization. Although, aging of PLZT relaxors over long-time periods into a pinned condition with some degree of double-loop features in the P-E curves has been reported, in a temperature range near the dielectric constant maximum [Carl and Hardt (1978)].
Comparisons of the P-E results for PKZT 100x/65/35 with those for PLZT 100x/65/35 will demonstrate that La3+ and KI+ impurities interact differently with the domain structures. Impurities which are quenched-in from temperatures above the ferroelectric phase transformation would seemingly provide spatially random pinning sites within domains which act to disrupt normal long-range ferroelectric order, whereas impurities which remain mobile until temperatures below the ferroelectric phase transforma- tion seemingly pin domain boundaries. The difference in impurity mobility may be due to that La3 + substitution creates Pb-vacancies which reside in the center of the B06 octahedra, whereas K1+ substitution creates O- vacancies which reside at the corners of the octahedra and are relatively well interconnected. Consequently, due to this fundamental structural difference, defect species in PKZT may remain mobile to significantly lower temperatures than for PLZT, resulting in migration of defect complexes to domain boundaries.
Recent computer simulations by Parlinksi et al. [Parlinski et al. (1995)] of the annealing of tweed microstructures in high Tc superconductors in the presence of impurities have shown interesting results which may provide important insights into the nature of the evolution of domain structures in PLZT and PKZT. These studies were an extension of previous simulations performed by Semenovskaya and Khachaturyan [Semenovskaya and Khachaturyan (1993a); Semenovskaya and Khachaturyan (1993b)] who showed in YBa2Cu307_5 and YBa2(Cu1_xFex)307„5 for 0.5<<5<0.8 that tweedlike structures could not coarsen into microtwins, rather a metastable or "glassy" mesophase persists in the low temperature state. Parlinski et al. (1995) extended these simulations by varying the potential between oxygens, such that the quenched vacancies could either be random or assembled into chains. These simulations predicted the presence of very fine tweed-like structures, which decrease in size with increasing quenched impurity concentration. Simulations of the annealing process demonstrated that the fine tweed-like structures could grow and form normal twin structures, if impurities were allowed to diffuse to the domain boundaries forming linear chains. However, if the impurities were randomly quenched-in, the fine tweed structures coarsened some, but normal twin structures did not develop. The features observed in the domain evolution in this study are consistent with these simulations, suggesting that defect complexes assemble

286 Q. TAN et al.
into chain fragments for PKZT strongly pinning the polarization into fine domain structures, whereas impurities are randomly quenched in for PLZT resulting in a metastable mesophase.
4.2. Further Evidence of Mobile Nature of Impurities
Domain-impurity configurations are known to be modified by an applied electric field. For example, randomly oriented pinned domains can be aligned by a dc field, resulting in the establishment of an induced macroscopic polarization. However, on removal of the bias, the internal fields associated with the defect pinning sites result in the recovery of the original randomly oriented polydomain state. Under the action of large ac fields, the domain-impurity configurations will be completely disturbed (i.e., deaging), unless the impurities are sufficiently mobile as to move with the
domain boundaries. Aging is a time-dependent phenomena in which the remanent polariza-
tion, saturation polarization, and dielectric constant decrease with time due to a pinning of domain boundaries by defects and/or impurities. Figure 6(a) shows P-E curves for PLZT under various aging conditions. These results demonstrate significant decreases in the remenant and saturation polariza- tions with increasing number of cycles of an ac field. These changes were found to be irreversible until heating the specimen at 700° C for 1 hour, and indicate quite dramatic changes in domain stability and/or pinning during aging. The inability to recover the original P-E response until heating at elevated temperatures is undoubtedly a reflection of the low mobility of the La3+ impurities. However, significantly different results were found for PKZT. Figure 6(b) shows that the double-loop-like character of the P-E curves was reduced and that the degree of switchable polarization increased with cycling of an ac field. Furthermore, the aging of the specimen at room temperature was reversible at room temperature on removal of the field. These results demonstrate that K1 + impurities are significantly more mobile
than La3+. Figure 7 proposes a possible mechanism explaining the configurational
changes of domain-impurity complexes under an ac field for mobile impurity-defect complexes. Before application of an ac field, mobile impurity species may diffuse to domain boundaries resulting in pinning (Fig. 7(a)). However, under application of an ac field, the domains may breakaway from the pinning sites and the mobile defect species can diffuse, resulting in a partial deaging or randomization of the defect-domain

MOBILE VS. RANDOMLY QUENCHED IMPURITIES 287
-20 0 20 Electric Field (kV/cm)
40
FIGURE 6 Fatigue of P-E behavior for PLZT 4/65/35 and PKZT 4/65/35. (a) PLZT 4/65/35 after 10, 105, 106, 3 x 10⁶ cycles of the ac field, and (b) PKZT 4/65/35 after 10, 104, 106 cycles.
configurations, as shown in Figures 7(b). Consequently, an increased polarization due to switchable domains and enhancement of conductivity due to the drift movement of impurities is observed. However, over time after removal of the field, the mobile impurity complexes diffuse towards the domain boundaries, resulting in a recovery of the original defect-domain configuration, as shown in Figure 7(c).
Further evidence of the mobile character of K1 + defect-complexes was found in temperature dependent P-E studies. Figure 8 shows the P-E response for PKZT 1/65/35 taken at various steady state temperatures on heating and subsequent recooling. These data clearly reveal pronounced and irreversible changes, depending on the electrical and thermal histories of the specimen. At room temperature, strong double loop-like characteristics were evident in the P-E response, as can be seen in Figure 8(a). With increasing temperature to 150°C (Fig. 8(b)), the switching field of the double-loop-like P-E curves began to decrease, indicating enhanced mobility

288 Q. TAN et al.
(a)
(b)
«ft (C)
FIGURE 7 Illustration of micromechanism explaining the configurational changes of domain-impurity complexes under an ac field for mobile defect complexes, (a) Before application of field, (b) after application of field, and (c) after removal of field and re-ageing of specimen.
and decreased pinning effects. On heating to 220°C (Fig. 8(c)), nearly all indications of double loop characteristics disappeared. On subsequent recooling to 200°C (Fig. 8(d)), double loop characteristics began to reappear, indicating the re-establishment of pinned defect-domain config- urations. In addition, the P-E curves became asymmetric on recooling after cycling with an ac field. No such asymmetry was initially observed before heating under ac drives. With further decrease of the temperature back to 25°C, strong double loop characteristics and asymmetry were evident in the P-E response, as shown in Figure 8(e).
After recooling back to 25°C, the specimens were turned over and the P-E loops measured. These measurements revealed a reversal in polarity of the asymmetry in the hysteresis curves, as shown in Figure 8(f). These results clearly demonstrate the presence of an internal field or bias, which was established on cycling of the ac field during cooling. K1 + defect complexes would seemingly be quite mobile above 150°C, consequently an applied electrical field results in a redistribution of defect complexes and the development of internal fields. No asymmetry or evidence of internal bias fields were observed for PLZT, confirming the importance of the impurity defect complex mobility and subsequent interactions with domain bound- aries for PKZT.

MOBILE VS. RANDOMLY QUENCHED IMPURITIES 289
30
15
0
-15
-30
30
E ■S 15 Ü
§ °
a 30°C
~zr
PKZT 1/65/35 40
&_
- -20
_C0 o a.
-15
-30
30
15
0
-15
-30
■ b ' 150°C
sT \
-^
c '_ 220°C s7-
-40
30
15
0
- -15
-30 30
15
0
-15
■-30
: d ■_ 265°C ^?\ \^
y
e ■ 200°C ry- \/>
s
■ t ■ 25°C
\^
\
.
.
1
.
.
20 40
-40 -20 0 20 40 Electric Field (kV/cm)
FIGURE 8 Polarization behaviors of PKZT 1/65/35 at various temperatures on heating and subsequent recooling. (a) 30°C, (b) 150°C, (c) 220°C, (d) 265°C, (e) 200°C, (f) 25°C, and (g) 25° C after reversal of specimen orientation in test fixture.
The influence of polarized defects on ferroelectric and ferroelastic phase transformations has previously been studied both experimentally [Bye and Keeve (1972); Fedorikhin et al. (1980); Martinez et al. (1982); Wieder (1959); Gavrilova et al. (1981); Volk et al. (1983); Zheludev (1955); Eisner

290 Q. TAN et al.
(1957); Smolensky et al. (1984)] and theoretically [Levanyuk and Sigov (1988); Lebedev et al. (1983); Lebedev et al. (1984); Yurin et al. (I960)]. The influence of polarized defects is similar to that of a homogeneous field. Consequently the properties and phase transformational characteristics of a crystal containing polarized defects are identical to that under application of electric field or elastic strain. Randomly oriented polarized defects have been shown to result in double loop characteristics in the P-E response [ Zheludev et al. (1955); Eisner (1957); Yurin et al. (I960)], similar to that observed for PKZT. In addition, the development of oriented polar defects has been shown to result in strong asymmetry in the P-E response of ferroelectrics, similar to that observed for PKZT on cooling under ac electric field. We believe that these results clearly demonstrate that the unusual behavior of PKZT can be attributed to defect mobility, which results in the development of complex polarized defect structures and domain boundary pinning.
5. CONCLUSIONS
A study of the influence of La3+ (randomly quenched) and KI+ (mobile) modifications on PZT has been performed. These investigations have revealed significant differences in the structure property relations between these two modified PZT materials. Mobile impurities were found to suppress the dielectric constant and remenant polarization. The P-E behaviors of these materials were characterized by double loop-like characteristics, in addition asymmetry was observed in specimens cycled under an ac electric field on cooling. These data indicate the presence of a polarized defect complex which interacts with domain boundaries, resulting in polarization pinning. No evidence of relaxor ferroelectric behavior or polar nanodo- mains was found for PKZT. However, impurities-defects which were randomly quenched from temperatures above the ferroelectric phase transformation (i.e., PLZT) were found to result in relaxor behavior and polar nanodomain formation.
A cknowledgements
This work was supported by the Office of Naval Research (ONR) under contract No. N00014-95-1-0805 and by Naval UnderSea Warfare Center contract No. N66604-95-C-1536. The use of the facilities in the Center for Microanalysis in Materials Research Laboratory at the University of Illinois at Urbana-Champaign is gratefully acknowledged.

MOBILE VS. RANDOMLY QUENCHED IMPURITIES 291
References
Borchhardt, G., von Cieminski, J. and Schmidt, G. (1980) Phys. Stat. Sol. (a), 59, 749. Bradt, R. and Ansee, G. S. (1969) /. Am. Cer. Soc, 52, 192. Bye, K. and Keeve, E. (1972) Ferroelectrics, 4, 87. Carl, K. and Hardt, K. H. (1978) Ferroelectrics, 17, 473. Dai, X., Xu, Z. and Viehland, D. (1994) Phil Mag. B, 70, 33. Dederichs, H. and Arlt, G. (1986) Ferroelectrics, 68, 281. Eisner, Y. (1957) Kristallografiya, 2, 296. Fedorikhin, V., Taraskin, S., Strukov, B. and Sorokina, E. (1980) Fiz. Tverd. Tela, 22, 3544. Gavrilova, N., Novick, V., Sorokina, E. and Khrustaleva, L. (1981) Fiz. Tverd. Tela, 23, 1775. Griffiths, C. and Russell, R. (1972) J. Am. Cer. Soc, 55, 110. Haertling, G. and Land, C. E. (1971) /. Am. Cer. Soc, 54, 1. Ikeda, T. and Okano, T. (1964) Japan J. Appl. Phys., 3, 63. Jaffe, B., Cook, W. and Jaffe, H. (1971) in Piezoelectric Ceramics, Academic Press, London and
New York. Johker, G. (1972) J. Am. Cer. Soc, 55, 53. Lebedev, N., Levanyuk, A. and Sigov, A. (1983) Zh. Eksp. Teor. Fiz., 85, 1423. Lebedev, N, Levanyuk, A. and Sigov, A. (1984) Ferroelectrics, 55, 241. Levanyuk, A. and Sigov, A. (1988) "Defects and Structural Phase Transitions", Gordon and
Breach Science Publishers, New York. Li, J., Dai, X. H., Chow, A. and Viehland, D. (1995) /. Mater. Res., 10, 926. Martinez, C, Cintas, A., Dieguez, E. and Gonzalo, J. (1982) Ferroelectrics, 44, 221. Parlinski, K., Watanabe, Y., Ohno, K. and Kawazoe, Y. (1995) /. Mater. Res., 10, 1864. Semenovskaya, S. and Khachaturyan, A. G. (1993) Phys. Rev. B, Al, 12182. Semenovskaya, S. and Khachaturyan, A. G. (1993) Physica D, 66, 205. Smolensky, G., Sotnikov, A., Syrinkov, P. and Yushin, N. (1984) Ferroelectrics, 54, 119. Tan, Q., Xu, Z., Li, J. F. and Viehland, D. (1996) J. Appl. Phys., 80, 5866. Thomas, N. (1990) /. Appl. Chem. Solids, 51, 1419. Volk, T., Semeria, B., Lancon, F. and Billard, L. (1983) J. Phys. C, 16, 6153. Wieder, H. (1959) /. Appl. Phys., 36, 1010. Yurin, V., Baberkin, A., Kornieko, E. and Gavrilora, I. (1960) Izv. Akad. Nauk SSSR, Ser. Fiz.,
24, 1334. Zheludev, I., Proskurhin, M., Yurin, V. and Baberkin, A. (1955) Pokl. Acad. Nauk USSR, 103,
207.

Ferroelectrics, 1998, Vols. 206-207, pp. 293-305 Reprints available directly from the publisher Photocopying permitted by license only
) 1998 OPA (Overseas Publishers Association) Amsterdam B.V. Published under license
under the Gordon and Breach Science Publishers imprint.
Printed in India.
VARIATION IN THE ORDERING OF Ba(Zn1/3Ta2/3)03 WITH A-SITE
SUBSTITUTIONS
CHENG-CHANG LEE, CHEN-CHIA CHOU and DAH-SHYANG TSAI
Materials Science and Technology Center, National Taiwan Institute of Technology, Taipei, Taiwan 106
(Received 24 February 1997; In final form 18 April 1997)
The ordering of Ba(Zni/3Ta2/3)03 is altered by A-site substitution of La or K. The ordering behavior is studied using X-ray diffraction, electron microscopy, and Raman spectroscopy. Bai_^LaA.(Zn(1+^)/3Ta(2-A:)/3)03 shows a transformation from 1:2 to 1:1 ordering with the increasing La content. Ba1_xK^(Zn(1_,.)/3Ta(2 + I)/3)03 displays a monotonous decrease in 1:2 order with the K content. The ordered domains of BLZT first shrink in size with x, then transform into 1:1 ordered domains, and the sizes of new domains increase with x again. The effect of ordering on the quality factor of BLZT is discussed.
Keywords: Barium zinc tantalate; ordering; superlattice; phase transformation
INTRODUCTION
The B-site ordering of complex perovskite Ba(Zni/3Ta2/3)03 BZT has been considered an essential factor in their low dielectric loss at microwave frequencies. Prolonged annealing enhances the long-range ordering of Zn and Ta and reduces the dielectric loss tangent[1_4]. The ordering leads to a slight expansion of cubic perovskite unit cell along the (111) direction. The atomic arrangement of a completely ordered structure is more accurately represented by a hexagonal unit cell characterized with a high c/a ratio. Although the 1:2 ordering is thermodynamically preferred[51, complete ordering is usually not attained after heat treatment. It is believed that the
293

294 C.-C. LEE et al.
existence of hexagonal regions in a pseudoocubic structure is the origin of high quality factor. Sagala and Nambu[6] modeled the dielectric loss tangent from an equation of ion motions that was a function of B-site ordering. They concluded that the mesoscale disorder of B-site ions played a major role in the microwave loss.
On the other hand, the reports on the solid solutions of BZT suggested that other factors besides 1:2 ordering could be equally important. Substitution of 4% Zr in BZT, Ba(Zr Zn Ta)03, was recorded to enhance the Q factor, and destroyed the long-range ordering[7]. Addition of Sn to form another solid solution of similar complex perovskite BMT, Ba(Sn Mg Ta)03, was detrimental to its ordering structure. However, 5.0 mol% Sn decresed the Q value, and 10-15 mol% Sn increased the Q value again[8]. More complex solid solutions incorporating 1:1 ordered complex perovs- kites, such as BZT + (Sr, Ba)(Ga1/2Ta1/2)03, improved the Q value with no gain in the 1:2 ordering [9]. Similarly, the study on the 1:2 ordering of solid solutions of BMT +A(Mg1/2W1/2)03 (A = Ba, Sr, Ca) and their loss tangents indicated that factors other than the degree of ordering influenced the loss tangent. Addition of 0.5 mol% Ba(Mg:/2W1/2)03 was found to increase the Q value, and additions of Sr(Mg1/2W1/2)03 or Ca(Mgi/2Wi/2)03 reduced the Q factor [10]. All these additions diminished the 1:2 B-site ordering of BMT.
This study investigates the effects of A-site substitution in the BZT system by X-ray diffraction, electron microscopy, and Raman spectroscopy. The effects of substitution on the long-range order, ordering domain and local ordering of the microstructure and the Q factor are discussed.
EXPERIMENTAL
Calculated amounts of barium carbonate (Merck, > 99%), zinc oxide (Aldrich, > 99%), tantalum oxide (Aldrich, > 99%), and lanthanum oxide (>99%) or potassium carbonate (>99%) were dried, weighed, ball milled, and calcined at 1100°C for 2 hr. The calcined powder was ball-milled again, and dry pressed into pellets or short rods at 1500°C in air for 2 hr. Specimens of the following compositions are fabricated, Bai_xLax(Zn(1+A)/3Ta(2_x)/3)03
BLZT and Bai„xKx(Zn(1_x)/3Ta(2 + x)/3)03 BKZT. Sintered specimens of relative densities 98-99% were ground and
polished and examined by X-ray diffraction using CuKa radiation

ORDERING OF Ba(Zn1/3Ta2/3)03 WITH A-SITE SUB 295
(Rigaku, Dmax-B). The scanning rate was set 0.5°/min. The Raman spectra of polished specimens were recorded with a Renishaw Raman- scope (RS-2000) using a He-Ne laser light source. Some specimens were thermal etched and inspected by a scanning electron microscope (Cambridge, S360). Some crystals were ground and ion milled and investigated by a JEOL 2000FXII microscope. The dielectric loss tangent was measured in a cylindrical resonator cavity using an HP network analyzer (Model 8722A).
RESULTS AND DISCUSSION
Substituting La3+ for Ba2+ has a significant effect on Zn-Ta ordering in BZT. The X-ray diffraction pattern of BLZT is similar to that of BZT. Every fundamental reflection of BLZT matches one of BZT. Yet there is a difference in the superlattice reflections, illustrated in Figure 1(a). Figure 1(a) plots the diffraction patterns of BLZT between 10-40°. The diffraction peaks are indexed based on a hexagonal cell for the superlattice of BZT and a cubic cell for BLZT of high La contents, according to the structure change shown later. Both intensities of (100)/, and (200)/, superlattice reflection first decrease with the La concentration x, then vanish at x = 0.02. As x>0.04, another set of superstructure peaks appear, shifting about 1° (17.7-^18.8°) and 0.5° (35.9^36.4°), and grow with x. On the other hand, the substitution of K+ only reduces the Zn-Ta ordering. Figure 1(b) indicates those superlattice reflections of BKZT decrease in intensity without shifting in diffraction angles, also the fundamental reflections remain unchanged.
Selected area electron diffraction patterns of BZT, BLZT (x = 0.02), and BLZT (x = 0.2) are shown in Figure 2. BZT and BLZT (x = 0.2) have two different ordered superlattices, showing different arrangements of super- lattice spots embedded upon perovskite fundamental spots. The superlattice spots divide the simple perovskite (111) spacing into three parts for BZT, but only two parts for BLZT (x = 0.2). The ordered structure of BLZT (x = 0.2) can be represented by a doubled unit cell superlattice[11], which was also found in many complex perovskites with 1:1 ordering [12~15]. The superlattice reflections of BLZT (x = 0.02) are weak and diffuse, showing both 1:2 and 1:1 ordering.
The degree of long-range order S can be estimated from the integrated intensity ratio of 7(100)/,/{/(l 10)/,+ 7(012)/,+ 7(102),,} or 7(lll)c/7(220)e in

296 C.-C. LEE et al.
H )—i t/3 z w H Z
X=0.08
X=0.06
X=0.04
V_Jl_
(a) 20 (CuKct)
FIGURE 1 (a) X-ray diffraction pattern of BLZT with various La contents, sintered at 1500°C for 2 hours, (b) X-ray diffraction patterns of BKZT with various K concentrations, sintered at 1500°C for 2 hours.
X-ray diffraction pattern. The ordering parameters S of BLZT and BKZT are plotted in Figure 3. The long-range ordering of BKZT decreases monotonously. The 1:2 ordering of BLZT drops to zero at x = 0.02, then transforms into a 1:1 ordered structure and its degree of ordering increases
with x again. To understand the evolution of ordering pattern with x, microstructural
details have been investigated using the conventional and high resolution transmission electron microscopy. Figures 4 (a), (b), (c) are the centered dark-field images of ordered microdomains of BLZT with x = 0.0, 0.02, 0.06 individually. The B-site microdomains in BZT have a size range of

ORDERING OF Ba(Zn1/3Ta2/3)03 WITH A-SITE SUB 297
H «5
w H
X=0.10
X=0.04
\vvVwv'\*y'^v(
*^<U'<d>\*«/«tt&t<~Aw)i»/nMs^^
X=0.03
«wJ-JUv X=0.02
X=0.01
X=0.00
■W-Af^Wvn
(100). (101)h
(110)* (201)i (012)h (003)1
(102)4 (111>(200> ^
'=*"' '•'•'• |Tg~ 2£
(b) 29 (CuKa)
FIGURE 1 (Continued).
10-30 nm. The sizes of microdomains in BLZT (x = 0.02) are 5-8 nm, much smaller compared with those of BZT. The domain of BLZT (x = 0.06) grows to a significantly bigger size, about 50-80 nm.
Figures 5(a), (b) show atomic structure images of a BZT specimen with zone axis [011]. The bracketed region (a) is enlarged in (b) to better illustrate the 1:2 ordered microdomains. The sizes of microdomains observed in BZT are around 10-25 nm. The microdomains in BLZT (x = 0.02) are less obvious, with smaller sizes about 5 nm, indicated in Figure 5(c). The HREM micrographs of higher La concentration are even more featureless, with fewer observable domain boundaries. Figure 5(d) shows the atomic image of BLZT with x = 0.06, the domain size is difficult to determine from this micrograph. The above observations

298 C.-C. LEE et al.
FIGURE 2 Selected area electron diffraction_ patterns of BLZT showing the ordering variation with composition x, (a) z = 011, (b) z=112.
explain why the long-range order of BLZT (x = 0.02) is not apparent in the X-ray diffraction pattern. With increasing La content, the 1:2 ordered domains are reduced in size, and undergo a transition to the 1:1 domains then grow again. For the specimen with x = 0.02, the domain sizes are so small and randomly oriented that the superlattice reflections are smeared out in the X-ray diffraction pattern.
These composition fluctuations and the ordering transformation in these solid solutions are also indicated in Raman spectra, Figures 6(a), (b). The La substitution has a remarkable influence on three peaks at 102, 375 and 425 cm"1. The intensities of these three peaks decrease and the peaks broaden (or split) at x = 0.02. With higher La concentrations, these three peaks shift and sharpen at high La content, x = 0.2, shown in Figure 6(a).

ORDERING OF Ba(Zn1/3Ta2/3)03 WITH A-SITE SUB
1.0
299
DC G
Si,X=0.00-0.02, BLZT S2, X=0.04-0.20, BLZT
BKZT
0.00 0.05 0.10 0.15
X
0.20 0.25
FIGURE 3 The degree of long-range order S versus the composition parameter x of BLZT and BKZT. St and S2 denote 1:2 and 1:1 order of BLZT respectively.
When JC = 0.2, the peak at 102 shifts to 117 cm-1, and the peaks at 375 and 425 cm"1 shift to 338 and 415 cm"1, respectively. This shifting in peak positions is not observed in Figure 6(b), which are the Raman spectra of BKZT. With increasing K content, these three peaks broaden without shifting. Similar broadening effects on these three Raman peaks, due to the decrease of 1:2 local ordering, was recorded on Ba(Nii/3Nb2/3)03 and Ba(Zn1/3Nb2/3)03
[16]. It is obvious that the ordering transformation in BLZT has a strong effect on the local bonding environment, which was witnessed by Raman peaks.
Figure 7 plots the quality factor Q of BLZT versus its composition parameter x. Since 1:1 ordered perovskites A(B'1/2B"1/2)03 generally have a lower Q factor[17J, one will expect a monotonous decrease with x. Nonetheless, we find a sharp decrease in Q with a small x, the Q value at x = 0.02 is a minimum, and a higher La content raises the Q value. The Q

300 C.-C. LEE et al.
IS ■•* *. ."' " w '
FIGURE 4 The dark-field images of ordered microdomains, using superlattice reflections, in BLZT of composition x = (a) 0.0, (b) 0.02, and (c) 0.06.
factor reaches another maximum at x = 0.06, and decrease with La concentration again. The initial drop in Q can be attributed to the decrease in long-range 1:2 ordering. However the increase-then-decrease in Q indicates that other factors besides the long-range ordering might be
important too.

ORDERING OF Ba(Zn1/3Ta2/3)03 WITH A-SITE SUB 301
FIGURE 5 High-resolution electron micrographs of (a), (b) BZT, (c) BLZT (x = 0.02), and (d) BLZT (x = 0.06), showing ordered microdomains.

302 C.-C. LEE et al.
11111 gpsp 3?^
null ■ ^5$>ÄEir~ l'.tU--^-
BjglEln^^^Kg [HKIB^HI
(c)
?. i'i
FIGURE 5 (Continued).

ORDERING OF Ba(Zn,/3Ta2/3)03 WITH A-SITE SUB 303
e
X=0.20
^AA_ X=0.10
X=0.08
_WWv_ X=0.06
X=0.04
MA
X=0.02
X=0.01
_Wl/v_ X=0.00
1390.9 166S.S 1769
20 416 812 1208 1604
Wavenumber (cm"1)
(a) BLZT , 1500° C 2h
FIGURE 6 Raman spectra of (a) BLZT and (b) BKZT
2000
SUMMARY
Solid solutions of La and K-substituted BZT are prepared by calcination and sintering at 1500°C. The variation in the local ordering of BLZT Bai-^Lax(Zn(1+x)/3Ta(2_x)/3)03 was inspected by TEM, HRTEM and Raman spectroscopy. Its long-range ordering was investigated by X-ray
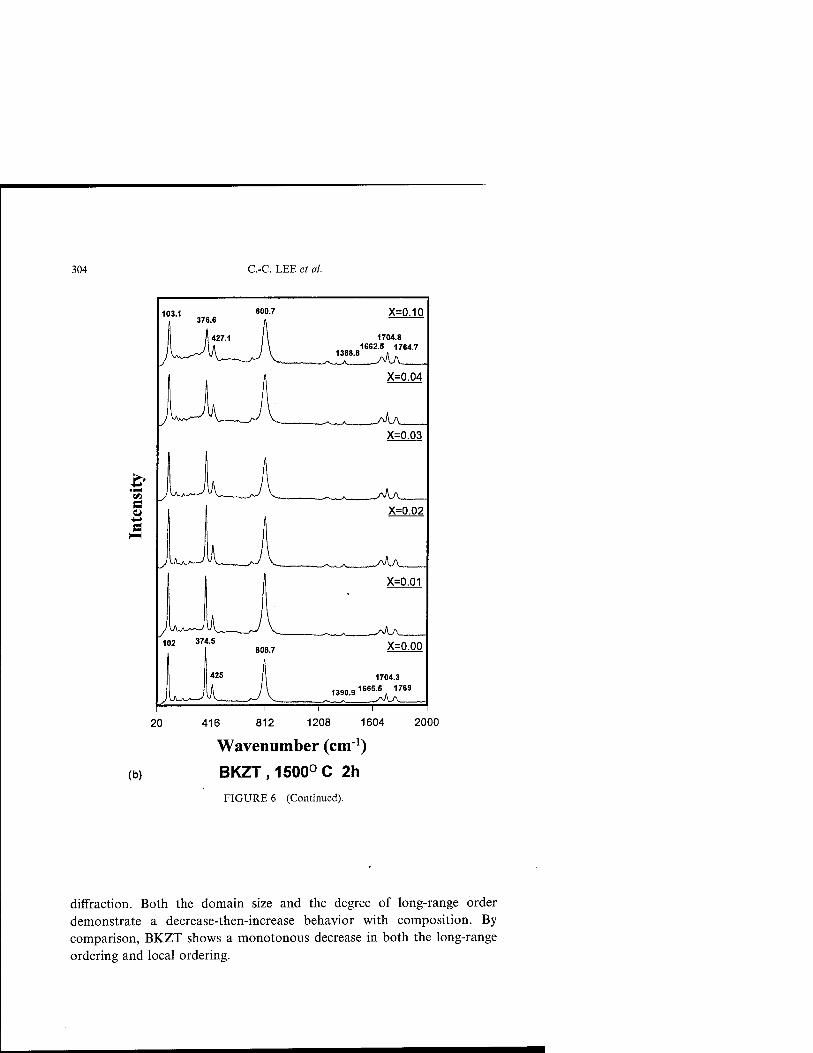
304 C.-C. LEE et al.
VI a 0)
1031 800.7 376.6
X=0.10
1388.8
1704.8 1662.5 1764.7
^MA. X=0.04
_wu_ X=0.03
J\As J 102 374.5
JU^JUl
808.7 X=0.00
1390.9
1704.3 1665.5 1769
1 1 1 1 20 416 812 1208 1604
Wavenumber (cm1)
(b) BKZT,1500°C 2h FIGURE 6 (Continued).
2000
diffraction. Both the domain size and the degree of long-range order demonstrate a decrease-then-increase behavior with composition. By comparison, BKZT shows a monotonous decrease in both the long-range ordering and local ordering.

o
ORDERING OF Ba(Zn1/3Ta2/3)03 WITH A-SITE SUB
1 r
20000
16000
305
O •2 12000
a 8000
4000
0.0 0.3 0.1 0.2
x of BLZT FIGURE 7 The quality factor of BLZT versus its composition parameter x.
Acknowledgements
This work is partially supported by the National Science Council of Taiwan under Contract No. NSC86-2214-E011-001.
References
[1] Kawashima, S., Nishida, M., Ueda, I. and Ouchi, H. (1983). J. Am. Ceram. Soc, 66, 421. [2] Desu, S. B. and O'Bryan, H.M. (1985). J. Am. Ceram. Soc, 68, 546. [3] Nomura, S. (1983). Ferroelectrics, 49, 61. [4] Kim, E. S. and Yoon, K.H. (1992). Ferroelectrics, 133, 187. [5] Sagala, D. A. and Nambu, S. (1992). Jpn. J. Appl. Phys., 61, 1791. [6] Sagala, D. A. and Nambu, S. (1992). J. Am. Ceram. Soc, 75, 2573. [7] Tamura, H., Konoike, T., Sakabe, Y. and Wakino, K. (1984). J. Am. Ceram. Soc, 67, C-59. [8] Matsumoto, H., Tamura, H. and Wakino, K. (1991). Jpn. J. Appl. Phys., 30, 2347. [9] Kageyama, K. (1992). J. Am. Ceram. Soc, 75, 1767.
[10] Furuya, M. and Ochi, A. (1994). Jpn. J. Appl. Phys., 33, 5482. [11] Chen, J., Chan, H. M. and Harmer, M. P. (1989). J. Am. Ceram. Soc, 72, 593. [12] Viehland, D., Kim, N, Xu, Z. and Payne, D. A. (1995). /. Am. Ceram. Soc, 78, 2481. [13] Du, Y. and Nowick, A. S. (1995). J. Am. Ceram. Soc, 78, 3033. [14] Reaney, I. M., Petzelt, J., Voitsekhovskii, V.V., Chu, F. and Setter, N. (1994). /. Appl.
Phys., 76, 2086. [15] Setter, N. and Cross, L. E. (1980). /. Appl. Phys., 51, 4356. [16] Kim, B. K, Hamaguchi, H., Kim, I. T. and Hong, K. S. (1995). J. Am. Ceram. Soc, 78,
3117. [17] Takata, M. and Kageyama, K. (1989). J. Am. Ceram. Soc, 11, 1955.

Ferroekctrics, 1998, Vols. 206-207, pp. 307-324 Reprints available directly from the publisher Photocopying permitted by license only
) 1998 OPA {Overseas Publishers Association) Amsterdam B.V. Published under license
under the Gordon and Breach Science Publishers imprint.
Printed in India.
TRANSITION DYNAMICS IN RELAXOR FERROELECTRICS
I. G. SINY* and R. S. KATIYAR
Department of Physics, University of Puerto Rico, P.O. Box 23343, San Juan, Puerto Rico 00931-3343
(Received 28 February 1997; In final form 18 April 1997)
Raman scattering was used to study two model relaxor ferroelectrics, namely PbMg!/3 Nb2/303(PMN) with the 1:2 stoichiometric composition of Mg2+ and Nb5+ ions in the oxygen octahedrons and PbSc1/2TaI/203 (PST) with the 1:1 stoichiometric composition of Sc3+ and Ta5 + ions. In spite of a different stoichiometric ratio the Raman spectra of both materials are consistent with the Fm3m space symmetry which implies the existence of similar 1:1 ordered clusters at least in nanoscale regions. The spectra show some anomalous features in the temperature range preceding a ferroelectric state, for example, a complex structure develops from the initially singlet line in PST and a broad central peak appears in PMN. Those phenomena are considered as the dynamics features in course of evolution of the relaxors to a ferroelectric state. The preceding phase is characterized by a breakdown in the selection rules for Raman scattering, so some points in the Brillouin zone can contribute to the light scattering spectra. The results obtained in PST and PMN were compared with the behavior of a related relaxor Nai/2Bi,/2Ti03 (NBT) with a cubic-tetragonal-rhombohedral sequence of "preceding" phases. The important similarity was found in the behavior of PST and NBT (double hysteresis loops) and in the behavior of PMN and NBT (acoustic anomalies, central peaks). The comparison of these three relaxor ferroelectrics gives evidence of competing interactions between the ferroelectric phase and some upper non-polar phase.
Keywords: Relaxor ferroelectrics; phase transition dynamics; Raman scattering
1. INTRODUCTION
PbMg1/3Nb2/303 (PMN) is a well-known "classical" material among relaxor ferroelectrics [1_3]. The dielectric response extends over a broad temperature range, which is commonly considered as the region of the diffuse phase
*On leave from A. F. Ioffe Physical Technical Institute, Russian Academy of Sciences, St. Petersburg 194021, Russia.
307

308 I. G. SINY AND R. S. KATIYAR
transition to a ferroelectric state. The so-called mean Curie temperature is about 270 K. A strong frequency dispersion of the dielectric maximum position is one of the accompanying phenomena characteristic of relaxors. However, no macroscopic phase transition has been found in PMN, at least in the same sense as it occurs in the case of ferroelectric transitions in the "pure" AB03 perovskites. The structure of PMN remains cubic down to 5 K according to X-ray and neutron diffraction studies although the profile analysis of the diffraction lines shows that rhombohedral distortions develop upon cooling down from about 600 K in correlated nanoscale clusters which increase in size up to about lOnm at low temperatures [4]. The real macroscopic phase transition of the first order to a rhombohedral phase has been detected in PMN at about 200 K only in an external electric field above the threshold value of about 1.8kV-cm_1 [5]. Therefore the initial temperature evolution of PMN to the ferroelectric state through the diffuse phase transition at Tc ~ 270 K [1"3] has been recently supplemented with the two additional specific temperatures, namely T~ 200 K and T~ 600 K, i.e., below and above the so-called mean Curie temperature [4' 5].
PbSci/2Ta1/203 (PST) is also a model object between relaxors. The degree of Sc3+ and Ta5+ ordering in the B sublattice can be controlled by a suitable heat treatment[6'7]. As a result, dielectric response changes from the relaxor behavior in disordered materials to the "normal" ferroelectric behavior with a sharp phase transition in ordered mate- rials [6"8]. Recent studies [9] show that some disordered PST samples exhibit the spontaneous relaxor-ferroelectric transition. It means that the PST samples show a typical relaxor dielectric maximum at the mean Curie temperature of about 285 K (if we would like to use the same terminology as in the case of PMN mentioned above) and an additional specific value of r~270K which corresponds to the first order phase transition to a ferroelectric state.
The zero-field spontaneous relaxor-ferroelectric transition in PST and the analogous transition in PMN under the electric field let us assume that relaxors exhibit the special dynamical evolution to the ferroelectric state. The present comparative study of PST and PMN by Raman scattering has been undertaken to find some characteristic dynamical features in light scattering to support an idea about the common evolution of relaxors to the ferroelectric state. The transition dynamics to the final ferroelectric state in relaxors with the complex perovskite-type formula AB^ß"..^ is far from being clear. At least, it seems that relaxors do not exhibit any soft mode that used to be a distinctive feature of the phase transition dynamics in most of the classical ABO3 perovskites. This view was emphasized in the past [2].

TRANSITION DYNAMICS IN RELAXOR 309
No new data about soft modes in relaxors have appeared since that review book [2] was published in 1977.
One can note that such complex systems as KTa03 with off-center Li and Nb ions of low concentrations have, probably, some relation to relaxor ferroelectrics. Recently cluster dynamics of such systems has been successfully studied by Raman scattering [10^12]. The loss of inversion symmetry in the disordered polar clusters activates the vibrational modes of odd parity to appear in the Raman scattering spectra. However, the origin and behavior of the transverse optic modes (soft TOi mode and hard T02
and T04 modes) have rather more close relation to the "host" classical perovskites KTa03 and KNb03 than to relaxor ferroelectrics with two different B' and B" ions. Neither AB'03 nor AB"03 "host" compounds could be synthesized in this case.
2. EXPERIMENTAL
The PMN and PST single crystals were grown by spontaneous crystal- lization from a flux. The samples were prepared in the form of a rectangular parallelepiped with edges along the fourfold cubic axes. The samples measured about 5x4x2mm3 and 3x2x1 mm3 respectively. The X(ZZ)Y and X(ZX) Y Raman spectra were measured in the present study, with X, Y and Z being along the fourfold cubic axes. The spectra at room temperature are shown for PST and PMN in Figure 1 in pairs for each polarization. Fragments of the X(ZZ)Y Raman spectra of PST at higher temperatures are given in Figures 2 and 3.
Raman spectra were excited with an argon ion laser for PMN and with a krypton ion laser for PST and were analyzed with a Cary-82 triple spectrometer. The instrument was equipped with an Oxford Instruments optical cryostat with a cold stage for low-temperature measurements and with a small furnace for high temperatures. A temperature controller stabilized the temperature in every scanning run to within ±0.5K.
Both Stokes and anti-Stokes parts of the Raman spectra of PMN were studied. A central part of the spectrum in the limit of iScm^1 was supposed to consist of a stray light from the elastic scattering and therefore it was eliminated from our consideration in all of the experimental spectra. In order to reveal a broad central peak, we used the following procedure. First of all, a spectrum at 77 K, which is at a temperature far below the known anomalies without any visible trace of the central peak, was taken as

310 I. G. SINY AND R. S. KATIYAR
200 400 600 800
WAVENUMBER (cm1)
200 400 600
WAVENUMBER (cm1)
800
FIGURE 1 Comparison of the Raman spectra of PST and PMN which are obtained in two polarizations, (ZX) and (ZZ), at room temperature.
an initial cross-section of light scattering from PMN, SQ{V, 77). Then, all necessary spectra at higher temperatures were reconstructed from the initial spectrum at 77 K by using a normal expected temperature dependence for the first order spectra S(v, T) = S0{v, 11) [n + 1], where the population factor is given by n = [exp(hv/kT)-l]~l. The calculated spectra were subtracted from corresponding experimental spectra. Some additional light scattering at the lowest frequencies appeared as wings on the Rayleigh line in a wide temperature interval. Those results are shown in Figure 4. It is clearly seen that the curves obtained by the procedure described above form broad central peaks. The upper parts of peaks in the eliminated range ± 5 cm" were obtained by fitting to a Lorentzian line shape.

TRANSITION DYNAMICS IN RELAXOR 311
455 K;
450
358 K
295 K
800 850 WAVENUMBER (cm1)
FIGURE 2 Appearance of an additional structure around the Alg hard mode in PST on approaching the transition to a ferroelectric state from above. The arrows show the pronounced structure near the low-temperature boundary of the preceding phase (T= 358 K) and the first emergence of the structure near the high-temperature limit of the preceding phase (TM = 418 K) in a rather ordered sample of PST.
3. RESULTS AND DISCUSSION
Main Features of the Raman Spectra in PST and PMN
Materials crystallizing in an ideal cubic perovskite structure, AB03, with the Pm3m space symmetry do not show any Raman-acitve modes in the first order scattering [2]. From this point of view, the appearance of some intense lines in the Raman scattering from PMN was an unexpected result. The Raman spectra of PMN were explained by the loss of both translational and

751 K
800
750 800 850 900 WAVENUMBER (cm1)
FIGURE 3 The Alg mode in PST at some high temperature remains in a singlet shape, it is shown for r=455K (Fig. 2) and T=557K. However, this mode exhibits an additional structure at higher temperatures again (7=751 K) in the vicinity of a phase transformation to the Pm3m "parent" phase where this mode disappears [161.
FIGURE 4 Stokes and anti-Stokes parts of the low-frequency Raman spectrum in PMN show the appearance of a broad central peak in some preceding phase above the frustrated ferroelectric transition at T~200K [5]. A narrow central component occurs at r~200K and a broader and more intense component appears in a wide range around r~280K.

TRANSITION DYNAMICS IN RELAXOR 313
inverse symmetries due to disordering in the B sublattice [2]. The selection rules for Raman scattering are not obeyed in such disordered systems like PMN, therefore a contribution to light scattering becomes possible from some points in the Brillouin zone as well as from infrared-active and silent modes. This point of view has been used for a long time [2]. It seems that Raman scattering was a tool to confirm the predominant role of disorder in PMN.
However, the AB'^B" /2C>3 ordered complex compounds belong to the Fm3m space symmetry [ ] which allows the appearance of four Raman- active modes [14]: Aig + Eg + 2F2g. Extensive studies of Raman scattering in PST [8' 15~19' confirmed this new point of view. Summing up all published results [8' 15_191 one can conclude that there is in general agreement among various groups based on the Raman spectra of the ordered PST which are found to be well consistent with the Fm3m symmetry with a doubled perovskite unit cell. The F2g(2) mode in the range of about 360 cm-1 is even considered [8' 15' 17] as a probe of the B-site ordering in PST. The ceramic samples of PST did not give the information about the mode polariza- tion[8' 15' 18]. The polarized spectra of the PST single crystals [16' 19] revealed two F2g modes in the off-diagonal X(ZX) Y spectrum and the Alg mode in the diagonal X(ZZ)Y spectrum as it is shown in Figure 1. The Aig mode appears to be the highest frequency mode in PST. The assignment of the Eg
mode which has a low intensity is not quite clear yet. The opinion about the nature of Raman spectra in the disordered PST is not so clear. It is assumed in most of the published papers that there exist at least nanoscale regions with the B-site order and which are enough to provide the spectra consistent with the Fm3m symmetry. One paper[18] considers the Pm3m space group with a simple perovskite unit cell (z= 1) as an upper initial phase in the chain of the symmetry reduction to a ferroelectric state in the disordered PST. The existence of microscopic regions, rich in Sc or Ta, leads to breaking the translational symmetry. This gives rise to Raman activity [18].
Soft modes have neither been found in PST nor in PMN [2]. The origin of hard modes in the Raman spectra in PMN has been still under discus- sion'16' 17' 20~23'. Different points of view have been put forward in the literature. The first idea was that a loss of the translational symmetry due to disorder in the B sublattice was responsible for the appearance of some modes from the Brillouin zone in Raman scattering [20' 21l The next idea is guided by the existence of nanoscale regions with 1:1 order of the B ions. This structure leads to the appearance of Raman spectra, which are consistent with the Fm3m space symmetry [16'17' 22]. Another idea correlates the Raman spectra of PMN with the 1:2 order of the B ions which gives the

314 I. G. SINY AND R. S. KATIYAR
P3ml space group [23]. The recent studies of the high resolution electron microscopy images of PMN [24] show that ordered regions of the {111} type exist which correspond to AB'1/2B"1/203 compounds, as in the case of PST. The 1:1 ordered regions in PMN consist of clusters of about 2nm in diameter regularly spread inside the crystal. The distance between the centers of neighboring clusters is about 2.5 nm [24]. This result supports the assignment of the main modes in the Raman spectra of PMN to the Fm3m symmetry (Fig. 1). Similarity between the Raman spectra of PST and PMN, as clearly seen in Figure 1, confirms an important common characteristic feature of relaxors that there exist nanoscale clusters with the 1:1 B-site order, irrelevant to whether a stoichiometric composition for the B ions is 1:1 or 1:2. Thus, the main contribution to the Raman spectra of PMN (Fig. 1) originates from the modes of even parity. As one can see (Fig. 1), there are some other modes of lower intensity in both the X(ZX)Y and X(ZZ)Y spectra besides the modes considered above. The origin of those modes is not quite clear yet. Probably, the loss of inversion symmetry in the disordered regions leads to the appearance of the infra-red active modes of odd parity in the Raman spectra as it has been found in other mixed systems like KTa!_xNbx03
[10_12' 25]. However, the contribution of the polar modes to the Raman spectra is small in comparison with the allowed Raman active modes consistent with the Fm3m symmetry in the ordered regions. Thus, the recent Raman scattering studies may be considered as an additional method to confirm the predominant role of the order in PMN and other relaxors, at least in the nanoregions. We assume that the nanoscale arrangement prevents the development of "normal" long-range ferroelectric correlations. One can thus expect a special transition dynamics under unfavorable conditions of the frustrated transitions.
Additional Anomalous Structure of the AXg
Mode in the Raman Spectrum of PST
The Aig mode is well distant from other vibrations and is clearly seen in the diagonal Raman spectra of both PST and PMN (Fig. 1). Mode analysis of the normal vibrations in the AB'1/2B"1/203 structure with the Fm3m symmetry shows that the Alg mode is a simple motion of the oxygen atoms like the breath-type mode of a free oxygen octahedron. Neither A nor B' or B" cations are involved in the Aig vibration. However, these cations affect the stretching frequencies corresponing to the Alg mode if the radius of cations changes. All oxygen distances (A-O, B'-O and B"-0) are important. Instead of these three parameters, the tolerance factor was used [26] to show

TRANSITION DYNAMICS IN RELAXOR 315
an interesting correlation between the Aig mode frequency and decrease in the A cation radius. An isotypical series of the AB'j ^B^Ch compounds was considered with Ba—>Pb—>Sr—>Ca sequence of the A cations. This result shows that the Aig mode may reflect clearly the effect of subtle changes in the perovskite structure. This is the reason why we decided to follow the temperature behavior of the Alg mode in PST. This mode should remain a singlet irrespective of any phase transition. At high temperatures, far above the transition region, the Aig mode has the shape of a singlet line (Fig. 2). An obvious structure of the initially singlet line appears when temperature is lowered down to the vicinity of the ferroelectric phase transition (Fig. 2). No evidence of a change in the crystal structure of PST above the ferroelectric transition has been published. The structure around the Aig mode is more pronounced in the samples with a higher degree of disorder on the B sites without any macroscopic ferroelectric transition. Thus, the additional structure appears in the PST even if the ferroelectric transition is frustrated as in PMN. Also these samples exhibit a more extended temperature range with the structural Alg line. Figure 2 shows the behavior of the Alg mode in a sample with the highest degree of order among the materials studied in the present work. We assume that our sample with the highest degree of order is close to that in the sample which shows the spontaneous relaxor- ferroelectric transition [9]. The Alg line takes a singlet shape again in the ferroelectric phase in our sample. One can suppose that the complex structure of the Alg mode is connected with a breakdown in the wave-vector selection rules, so some symmetry points along the Alg optical branches in the Brillouin zone contribute to the Raman scattering around the initial singlet line in the zone center.
The present study shows that some temperature range with the structural Aig mode precedes the ferroelectric phase in several samples of PST with the different degree of order. Besides, there is a noraml range from about 450 K up 800 K in the ordered samples where the AJg mode remains in a singlet shape and its intensity increases in accordance with that for the first-order Raman scattering [16]. At temperatures above the "singlet" range the Aig
line exhibits some broadening and the appearance of the complex structure (Fig. 3). This anomaly occurs in the temperature range of a phase transition from the Fm3m paraelectric phase to the Pm3m high-temperature "parent" phase. All of the Raman-active modes, Aig + Eg + 2F2g, disappear in the cubic perovskite phase[I6]. According to the group theoretical prediction[27], the phase transition from Pm3m to Fm3m is initiated by a breath-type mode at the R point of the Brillouin zone. This mode represents anti-phase vibrations of the adjacent oxygen octahedrons along the [111] direction.

316 I. G. SINY AND R. S. KATIYAR
This situation provides a linear coupling between the Alg optical phonon branch and the order parameter fluctuations. As a result, the structure of the Alg modes appears in the vicinity of the phase transition. The structural AJg
mode reflects the fluctuation contribution from the R point of the cubic
Brillouin zone.
Central Peak in Light Scattering from PMN
The diagonal polarizability components of the Raman spectra in PMN were studied in a wide temperature range with a special attention to the low-frequency part below about 100 cm"1. There is a low frequency O~50cm-1) hard-lattice mode in this region (Fig. 1). Only this mode is seen in the Raman spectrum at 77 K. The most surprising feature of PMN is the appearance of some additional light scattering at the lowest frequencies, appearing as wings on the Rayleigh line at higher temperatures. This effect is clearly seen in Figure 1 which represents the spectrum at room temperature. The F2g mode in the off-diagonal spectrum is more intense than the mode at i/~50cm_I in the diagonal spectrum, however, the approach to the laser line in the first case is significantly better.
The low-frequency diagonal Raman spectra in a wide temperature range were well fitted with two Lorentzian peaks, one centered at zero-frequency shift (the central peak) and the other at z/^SOcm"1 (the hard mode mentioned above). It was enough to use only the second Lorentzian to fit the low-frequency spectrum at 77 K. The part of the scattering spectra fitted by the first Lorentzian was separated to illustrate the temperature evolution of the centeral peak in PMN. The results obtained at several temperatures are shown in Figure 4. The eliminated region of ±5 cm"1 with an intense stray light should not be significant for those broad central components shown in Figure 4. The upper parts of the central peaks in the range of ± 5 cm"1 from zero frequency were restored in Figure 4 after the best fitting with the Lorentzians in the whole range of frequencies. After that procedure, one can correctly analyze the behavior of both the intensity and the width of the central peak.
Our analysis shows two important temperature regions in the evolution of the central peak. The "main" central peak exhibits the maximum intensity and the minimum width around 280 K (Fig. 4). The broad central peak is best described as a Debye relaxation, S(v) ~ (1 + vV), with the inverse relaxation time (1/r) proportional to the width at half maximum of the corresponding Lorentzian. The temperature dependence of the relaxation times is shown in the upper part of Figure 5. This Figure also shows the

TRANSITION DYNAMICS IN RELAXOR 317
O CC K- U LU _J HI 5
N
o CD z K S < o
100 200 300 400 500
TEMPERATURE (K)
FIGURE 5 Thermal dependence of some characteristics of PMN: the relaxation times related to the central peak vs. T(the upper part); the hypersonic damping vs. T(in the middle [2SI and the dielectric response at 100 kHz vs. T (in the bottom) |281.
temperature dependence of the hypersonic damping and the broad dielectric maximum in PMN taken from [28]. The most intense peak as well as the heaviest damping are observed slightly above the main broad anomaly in the dielectric response near room temperature. The central peak broadens and disappears when the temperature increases to about 600 K or decreases down to 100 K. However, there is an additional limited anomalous region around 200 K where the central peak narrows and grows up before it disappears. It seems that the behavior of the central peak in a wide temperature interval correlates with a typical broad dielectric response of

318 LG. SINY AND R. S. KATIYAR
relaxors and the narrow anomaly around 200 K correlates with a sharp dielectric response of PMN in the presence of external electric field [5] (and Refs. therein). The narrow anomaly in the behavior of the broad central peak is mostly pronounced in the thermal dependence of relaxation times (Fig. 5). Considering this sharp anomaly around 200 K, it is very important to emphasize the correlation between the slow-down in the relaxation times obtained from Raman scattering and increase in the hypersonic damping obtained from Brillouin scattering [28] which is shown in the middle in
Figure 5. We suppose that in spite of macroscopically frustrated ferroelectric
transition at about 200 K (without the external electric field) the polarization fluctuations manifest themselves in light scattering from PMN, giving rise to the central peak in light scattering, to the sharp peak in hypersonic damping and, probably, to some other anomalies. No sign of a dielectric anomaly (Fig. 5) has been observed without the external electric field. Our results show that light scattering is very sensitive to a change in the inner structure of the pseudo-cubic arrangement of PMN.
Considering the main stretched anomaly in the relaxation times, related to the central peak, one Should remember that the rhombohedral distortions are developed in the cubic PMN starting with cooling down the sample from 600 K. This is the temperature where the broad central peak appears (Figs. 4 and 5) as well as some deviations from the "normal" behavior appear in the hypersonic velocity and damping [29], in the index of refraction [30] and in other properties. It seems that these rhombohedral distortions have no direct relation to the ferroelectric properties because they develop at temperatures far from the frustrated ferroelectric transition. One should remind that the field-free thermal depoling of the field-induced polarization takes place sharply at T=213K (upon zero-field-heating-after-field-cool- ing)151. Probably, the rhombohedral distortions are connected with a ferroelastic transition. However, the long-range ferroelastic correlations cannot develop in the disordered structure of PMN in order to accomplish a ferroelastic phase transition. Thus, there is the frustrated ferroelastic transition in PMN at high temperatures. We will now show that the possibility of a similar ferroelastic transition has been assumed for PST to explain the appearance of specific double hysteresis loops in some temperature range [9] and the development of the Raman spectra in the ordered samples [18'31]. We shall also discuss a close analogy in the behavior of PMN and PST along with the properties of another relaxor ferroelectric, NainBiinTiOs (NBT), which shows double hysteresis loops [32'33] as well as a high temperature preceding ferroelastic transition '

TRANSITION DYNAMICS IN RELAXOR 319
The ferroelectric transition in PMN at lower temperatures is also frustrated because the long-range ferroelectric correlations cannot over- come the disorder in the microstructure without the external electric field. The situation seems to be analogous to that in mixed Rbi_x(ND4)xD2P04
(DRADP) with x around 0.5 where X-ray and elastic neutron scattering could observe a growth of short-range correlations [37]. These are neither the ferroelectric correlations inducing a transition at the center of the Brillouin zone (r point) nor the antiferroelectric correlations connected with a transition at the zone boundary (Z point). The new broad incommensurate peaks were found at the wave vectors qs on the £ direction connecting the T point to the Z point. We assume that PMN exhibits competing correlations in some temperature range. The central peak in light scattering summarizes the contributions from different points in the Brillouin zone. Then, as in the case of PST above, there is a special preceding phase in PMN where a break down in the wave-vector selection rules occurs in course of a dynamic process. Before making some conclusions, let's consider shortly one more example of a relaxor which exhibits more pronounced system of the preceding phases.
Critical Behavior of NBT in the Intertransition Region
Most relaxor ferroelectrics have pairs of different B cations, but Nai/2Bi1/2Ti03 (NBT) has unlike valence Na+ and Bi3+ cations in A positions. At room temperature NBT is ferroelectric with a rhombohedral structure which is the result of a phase transformation sequence'32' 34_36]
which proceeds, unlike PMN, from cubic to tetragonal at Tcl, then to rhombohedral at Tc2, finally the spontaneous polarization appears at Tc3
below which the material is in the ferroelectric phase. This cubic-tetragonal- rhombohedral sequence has been confirmed by neutron diffraction[36] and X-ray measurements'351. However, the recent study of NBT by X-ray diffraction[38] shows that deviations from the cubic structure are very small and depend on the quality of the crystals. The degree of long- range ordering of Na and Bi cations is very low. One can assume that the development of the ferroelectric or ferroelastic correlations is restrained by random compositions.
A formal resemblance between the acoustic anomalies in NBT and PMN is obvious. NBT also exhibits both a broad dip in hypersonic velocity and a broad maximum of damping [39]. An additional sharp peak in damping was found at Tcl
[40]. The broad anomalies seem to have no simple connection with the structural transtions at TcX and Tc2. A simple superposition of two

320 I. G. SINY AND R. S. KATIYAR
anomalies at TcX and Tc2 does not explain the experimental results. The hypersonic anomalies are centered in the intertransition region and extend beyond both of the transitions. This fact implies the existence of competing interactions between the two transitions separated by some temperature interval[39]. The anomaly is extended due to a large variety of the random correlations occurring somewhere in the Brillouin zone.
The preliminary results showed a broad central component in light scattering from NBT as well[41]. The main response occurs between the two phase transitions and correlates with the acoustic anomalies in this respect. Let us consider the temperature behavior of the background from the Brillouin spectra of NBT [39]. The background originated from the central part of the lowest-frequency scattering which only transmitted throughout a narrow-band (1A°) interference filter used in the experiments to eliminate Raman scattering at higher frequencies. The temperature behavior of the background (Fig. 6) reveals changes in the central peak amplitude. Figure 6 shows a drastic increase in the background or, correspondingly, in the intensity of the central peak. It peaks in the intertransition region between Tc2 and Tcl. There is a jump in intensity at Tc2 and, probably, some non- linear changes in the vicinity of TcX. The neutron-scattering data indicate that the phase transitions at TcX and Tc2 are initiated by some irreducible representations at M and R points of the Brillouin zone corresponding to the cubic phase [36]. Therefore the intense anomalous light scattering from NBT, at the lowest frequencies in the range between these two phase
Si 1- <B
u. Q O z
D t O a. W « z V w o z < m
v> 4000 'E
2000 -
V u u TC3 Tc2 Tcl •
• •• • • •
• \m • • ••
/ ~ • * *
". . • •.». _ • • . •« ••
V~V" • fc •• •
• • ,• 1 1 ■ 1 . j ■—
200 400 600 800
TEMPERATURE (K)
FIGURE 6 Thermal dependence of the intensity of the background in the Brillouin spectra of NBT [39]. The temperatures of transitions in the TcX -> Tc2 -> TA sequence are given at the top.

TRANSITION DYNAMICS IN RELAXOR 321
transitions, produces enough evidence that the wave-vector selection rules appear to be broken down and the excitations from the M and R points as well as, probably, from other points along the direction connecting these points, may contribute to the light scattering. This situation seems to be similar to that in KCaF3 where central peaks have been found by neutron scattering along the R-M line of the cubic Brillouin zone[42]. Probably, one can expect the development of the short-range incommensurate correlations previously observed in DRADP[37].
Thus, one can find an important similarity between NBT and PMN. Far above the temperatures where the remnant polarization disappears (r~ 450-=- 480 K [33' 43] and r-213K[5], respectively), there is a broad "preceding" phase in both materials. This phase manifests itself by a broad central peak in the light scattering and, as seen undoubtedly with the example of NBT, by a breakdown in the wave-vector selection rules.
The Relation to a Model with Competing Interactions
There is an important similarity between NBT and PST as well. Both materials show double hysteresis loops[9'32,33] in some temperature interval preceding the macroscopic ferroelectric state. The real antiferroelectric state has neither been found in NBT[44] nor in PST[9]. The double hysteresis loops appear in a simple model with the two coupled structural and ferroelectric order parameters'451. The similar model was proposed to interpret the preceding behavior of PST [9], including double hysteresis loops whereas the macroscopic ferroelectric state in PST was characterized by the normal hysteresis loops at lower temperature. There is one problem in the case of PST that only the indirect evidences may support the existence of an additional structural phase transition at higher temperatures. In the case of NBT there is undoubtedly the ferroelastic structural transition at Tci. The critical acoustic behavior of NBT with the main anomalies in the inter- transition region[39] gives evidence in support of an interaction between the two phases.
In the case of PMN, one should emphasize the similar character of the main anomalies in both the hypersonic velocity and the damping. Probably, the rhombohedral distortions developing upon cooling down from 600 K [4]
are not polar at least at high temperatures. These distortions imply the following symmetry reduction, Fm3m —> R3m (ferroelastic) —> R3m (ferro- electric), through the region of competing interactions. One should note that this symmetry reduction scheme was proposed for PST as wellt18' 31].

322 I. G. SINY AND R. S. KATIYAR
4. CONCLUSIONS
Raman scattering has been investigated in two model relaxor ferroelectrics, namely PbSc1/2Ta1/203 (PST) and PbMg1/3Nb2/303 (PMN). The following new features of the dynamic evolution to ferroelectric phases in these
materials were found. The singlet Aig mode in the Raman spectra of PST shows a complex
structure in some temperature interval preceding the ferroelectric phase. The structure is connected with the contribution from some points in the Brillouin zone. This effect becomes possible because the preceding phase is characterized by a breakdown in the wave-vector selection rules.
The broad central peak appears in the low-frequency Raman spectra of PMN. A sharp anomaly in the behavior of the central peak (increase in the amplitude, slow down in the relaxation times) is found at about 200 K, just in the range of a frustrated ferroelectric transition. The terminology for such phenomenon in relaxor ferroelectrics has not been settled yet. The real transition occurs only in an external electric field above the threshold value of l.SkV-cuT1 [5]. It is considered as the induced phase transition [5]. In the absence of an external field one can say about the extremely smeared transition in PMN [46]. One more version suggests to consider PMN as the relaxor ferroelectric with an incipient ferroelectric order [47]. Thus, the main central peak is found in some preceding phase. This inelastic scattering connected with the development of mostly short-range correlations in the ordered nanoregions of PMN whereas the long-range correlations are prevented from spreading by the considerable random disorder in the Mg and Nb distribution in the rest of the material which is surrounding the ordered clusters. One can assume the competing interactions in the preceding phase between the ferroelectric correlations and some other structural correlations. The short-range incommensurate correlations are expected to grow as in other disordered systems with competing interac- tions, e.g., in RADP family [37].
Comparison of the anomalies observed in PST and PMN with the behavior of a related relaxor ferroelectric, Na1/2Bi1/2Ti03 (NBT), was very fruitful. The cubic-tetragonal-rhombohedral transition sequence, proved by different methods, distinguishes NBT from other relaxor ferroelectrics. NBT exhibits a preceding phase with double hysteresis loops like that in PST and the acoustic anomalies similar to those in PMN to some extent. Both PMN and NBT [41] show broad central peaks in the light scattering studies with the highest intensity in the preceding phase. Our studies showed preliminary

TRANSITION DYNAMICS IN RELAXOR 323
existence of a central peak in PST as well as some traces of an additional structure around the Alg mode in PMN.
The comparison of all three materials produces enough evidence for competing interactions in the preceding phase. The selection rules for Raman scattering appear to be broken down in this preceding phase, therefore some information from the Brillouin zone appears in the spectra, for example, a critical contribution to the broad central peaks in PMN and NBT as well as to the initial singlet Alg mode in PST. The existence of the special preceding phase is considered as a distinctive characteristic of the transition dynamics in relaxor ferroelectrics with ordered nanoscale clusters.
Acknowledgements
We would like to express our warm thanks to the co-authors V. H. Schmidt, S. G. Lushnikov, C.-S. Tu, E. A. Rogacheva, E. Husson and R. Laiho for helpful discussions during the early stages of our common work on this topic. Special thanks are due to A. P. Levanyuk for clarifying comments. This work was supported in part by NASA-NCCW-0088, DE-FG02- 94ER75764, and NSF-OSR-9452893 Grants and RFBR Grant No. 96-02- 17859.
References
[1] Smolensky, G. A. (1970). J. Phys. Soc. Japan, Suppl., 28, 26. [2] Lines, M. E. and Glass, A. M. (1977). "Principles and Applications of Ferroelectrics and
Related Materials", Clarendon Press, Oxford. [3] Cross, L. E. (1987). Ferroelectrics, 76, 241. [4] De Mathan, N., Husson, E., Calvarin, G., Gavarri, J. R., Hewat, A. W. and Morell, A.
(1991). J. Phys.: Condens. Matter, 3, 8159. [5] Ye, Z.-G. and Schmid, H. (1993). Ferroelectrics, 145, 83. [6] Setter, N. and Cross, L. E. (1980). J. Mat. Sei., 15, 2478; J. Appl Phys., 51, 4356 (1980). [7] Stenger, C. G. F. and Burggraaf, A. J. (1980). Phys. Stat. Sol. (a), 61, 275(1), 653(11). [8] Wang, H.-C. and Schulze, W. A. (1990). /. Am. Ceram. Soc, 73, 1228. [9] Chu, F., Setter, N. and Tagantsev, A. K. (1993). J. Appl. Phys., 74, 5129.
[10] Toulouse, J., DiAntonio, P., Vugmeister, B. E., Wang, X. M. and Knauss, L. A. (1992). Phys. Rev. Lett., 68, 232.
[11] DiAntonio, P., Vugmeister, B. E., Toulouse, J. and Boatner, L. A. (1993). Phys. Rev. B, 47, 5629.
[12] Vugmeister, B. E., DiAntonio, P. and Toulouse, J. (1995). Phys. Rev. Lett., 75, 1646. [13] Galasso, F. S. (1969). "Structure, Properties and Preparation of Perovskite Type
Compounds", Pergamon Press, London, UK. [14] Smolensky, G. A., Siny, I. G., Pisarev, R. V. and Kuzminov, E. G. (1976). Ferroelectrics,
12, 135. [15] Setter, N. and Laulicht, I. (1987). Appl. Spectr., 41, 526. [16] Siny, I. G. and Smimova, T. A. (1989). Fiz. Tverd. Tela, 30, 823; [Soviet Phys.-Solid State,
30, 473 (1988)]; Ferroelectrics, 90, 191 (1989).

324 I. G. SINY AND R. S. KATIYAR
[17] Siny, I. and Boulesteix, C. (1989). Ferroelectrics, 96, 119. [18] Bismayer, U., Devarajan, V. and Groves, P. (1989). /. Phys.: Condens. Matter, 1, 6977. [19] Boulesteix, C, Caranoni, C, Kang, C. Z., Sapozhnikova, L. S., Siny, I. G and
Smirnova, T. A. (1990). Ferroelectrics, 107, 241. [20] Burns, G. and Scott, B. A. (1973). Solid State Commun., 13, 423. [21] Karamyan, A. A. and Krainik, N. N. (1973). Fiz. Tverd. Tela, 15, 2534 [Soviet Phys.-Solid
State, 15, 1687 (1974)]. [22] Husson, E., Abello, L. and Morell, A. (1990). Mat. Res. Bull., 25, 539. [23] Idink, H. and White, W. B. (1994). J. Appl. Phys., 76, 1789. [24] Boulesteix, C, Varnier, F., Llebaria, A. and Husson, E. (1994). /. Sol. State Chem., 108,
141. [25] Manlief, S. K. and Fan, H. Y. (1972). Phys. Rev. B, 5, 4046. [26] Siny, I. G., Katiyar, R. S. and Lushnikov, S. G. (1966). in Proceedings of the XVth
International Conference on Raman Spectroscopy, Edited by S. A. Asher (John Wiley & Sons) 1002.
[27] Aleksandrov, K. S., Zinenko, V. I., Mikhel'son, L. M. and Sirotin, Yu. I. (1969). Kristallografiya, 14, 327 [Sov. Phys.-Crystallography, 14, 256 (1969)].
[28] Siny, I. G, Lushnikov, S. G., Tu, C.-S. and Schmidt, V. H. (1995). Ferroelectrics, 170, 197. [29] Prokhorova, S. D. and Lushnikov, S. G. (1989). Ferroelectrics, 90, 187. [30] Burns, G. and Dacol, F. H. (1983). Solid State Comm., 48, 853. [31] Salje, E. and Bismayer, U. (1989). J. Phys.: Condens. Matter, 1, 6967. [32] Pronin, I. P., Parfenova, N. N., Zaitseva, N. V., Isupov, V. A. and Smolensky, G. A.
(1982). Fiz. Tverd. Tela, 24, 1860 [Sov. Phys.-Solid State, 24, 1060 (1982)]. [33] Sakata, K. and Masuda, Y. (1974). Ferroelectrics, 7, 347. [34] Isupov, V. A., Pronin, I. P. and Kruzina, T. V. (1984). Ferroelectrics Lett., 2, 205;
Isupov, V. A. and Kruzina, T. V. (1983). Bull. Acad. Sei. USSR, Phys. Ser., 47, 194. [35] Zvirgzds, J. A., Kapostins, P. P., Zvirgzde, J. V. and Kruzina, T. V. (1982). Ferroelectrics,
40, 75. [36] Vakhrushev, S. B., Kvyatkovsky, B. E., Malysheva, R. S., Okuneva, N. M., Plachenova,
E. L. and Syrnikov, P. P. (1989). Kristallografiya, 34, 154 [Sov. Phys.-Crystallogr., 34, 89 (1989)].
[37] Xhonneux, P., Courtens, E. and Grimm, H. (1988). Phys. Rev. B, 38, 9331. [38] Park, S.-E., Chung, S.-J., Kim, I.-T. and Hong, K. S. (1994). J. Am. Ceram. Soc, 77, 2641. [39] Siny, I. G., Tu, C.-S. and Schmidt, V. H. (1995). Phys. Rev., 51, 5659. [40] Tu, C.-S., Siny, I. G and Schmidt, V. H. (1994). Ferroelectrics, 152, 403. [41] Siny, I. G, Katiyar, R. S., Husson, E., Lushnikov, S. G and Rogacheva, E. A. (1996).
Bull. Am. Phys. Soc, 41, 720. [42] Ridou, C, Rousseau, M., Daniel, P., Nouet, J. and Hennion, B. (1991). Ferroelectrics,
124, 293. [43] Suchanicz, J. and Ptak, V. S. (1991). Izv. Acad. Nauk SSSR, Ser. Fiz. 55(3), 555 [Bull.
Acad. Sei. USSR, Phys. Ser., 55(3), 136 (1991)]. [44] Hong, K. S. and Park, S.-E. (1996). /. Appl. Phys., 79, 388. [45] Balashova, E. V. and Tagantsev, A. K. (1993). Phys. Rev. B, 48, 9979. [46] Westphal, V., Kleemann, W. and Glinchuk, M. D. (1992). Phys. Rev. Lett., 68, 847. [47] Vugmeister, B. E. (private advice).

Ferroelectric*, 1998, Vols. 206-207, pp. 325-335 Reprints available directly from the publisher Photocopying permitted by license only
) 1998 OPA (Overseas Publishers Association) Amsterdam B.V. Published under license
under the Gordon and Breach Science Publishers imprint.
Printed in India.
FINITE SIZE EFFECTS IN A BaTi03
FERROELECTRIC GLASS CERAMIC
CLIVE A. RANDALL, DANIEL E. McCAULEY and DAVID P. CANN
Intercollege Materials Research Laboratory, Pennsylvania State University, University Park, PA 16802
(Received 23 February 1997; In final form 30 June 1997)
A series of BaTi03 glass ceramics were synthesized to produce dispersed nanometer sized crystals grown in a residual glass matrix. Structure property relations are made between the crystallite size distribution and the dielectric temperature dependence of the ceramics. The phase transition temperature, dielectric anomaly broadening and peak dielectric constant all scale systematically with the mean size of the BaTi03 crystals. These results are discussed in relation to other size effect studies performed on ferroelectric materials.
Keywords: BaTi03; nanometer; glass ceramics; polarization
1. INTRODUCTION
The physical boundary conditions can have a strong influence on the nature of the paraelectric ferroelectric phase transitions. Owing to the large electrostrictive couplings in ferroelectrics between strain and polarization, the elastic boundary conditions must be considered [1~2]. For example, the hydrostatic stress will shift the transition temperature. The sign of this shift is dependant on the details of the dipole ordering. In the case of BaTi03, a compressive hydrostatic pressure will lower the transition temperature. There have been a number of important studies concerning the influence of hydrostatic pressures and their ability to shift the transition temperature to lower temperature values in BaTi03, and a typical derivative change of transition temperature with pressure is quoted as —5.2°C/kilobar[3].
325

326 C. A. RANDALL et al.
In addition to simply shifting the transition temperature, stress fields can also influence the order of the phase transition through higher order elastic coupling coefficients. These trends can be readily modeled with the Landau- Devonshire phenomenological model [1l
A further consideration in ferroelectric materials is the electric boundary conditions'41. The spontaneous polarization within the crystal creates a depolarization field that requires compensation at the crystal surface. Depolarization fields, Ed, are reduced via domain formation, surface charge, or polarization gradients within the crystal. For nanoscale (l-100nm) ferroelectric crystals, the major mechanism for compensation for the depolarization field is assumed to be surface charge and/or polarization gradients. The spatial variation of the depolarization field is then given by:
e0Ed(z) = -[P(z)+a] (1)
where Ed (z) is the spatial variation of the depolarization field, P(z) is the spatial variation of spontaneous polarization, a is the surface charge density, z is normal to the surface of the crystal and
parallel to the polarization, and £0 is permittivity of free space.
Therefore, effects in the size dependence of the physical properties of the materials will be sensitive to both the elastic and electrical boundary conditions and the size of crystals. In general, Binder (1987) has pointed out that a finite system undergoing a phase transition will demonstrate the following characteristics:
(i) Shifting of the phase transition to lower temperatures, (ii) A broadening or rounding of the thermodynamic property anomalies,
and, (iii) A systematic lowering of the magnitude of the properties[5].
There are, of course, some exceptions to these trends, a classical example being the anomalously high magnetic susceptibilities in superparamagnetic particles. In the case of ferroelectric systems, the strong coupling of the polarization to the lattice should confine these materials to the above rules. In addition, the scaling of these effects may differ depending on the order of the phase transition. A first order (discontinuous) phase transition and a second order (continuous) phase transition are microscopically different in the regime of the transition temperature. For a second order phase

FINITE SIZE EFFECTS IN GLASS CERAMIC 327
transition, the correlation length, £, which is a distance at which the fluctuations correlate, diverges at the transition temperature, Tc, viz.:
s< \T-T< (2)
where v is a critical exponent[6]. In constrast, the correlation length, £, for a first order transition remains finite, typically lOnm for ferroelectric materials. Therefore, since the dimensions of a nanocrystal limits the correlation length, £, a second order phase transition would be expected to display a strong size dependence. Most of the fundamental size effects studies have focused on second order phase transitions.
Size effect phenomena in ferroelectrics have been of interest for many years, but recent advances in chemical synthesis and thin film deposition have gained new momentum[7_14]. However, despite the large number of recent investigations regarding the effect of size on the ferroelectric transition, there has been a substantial disagreement in the critical sizes reported in particles, Table I. The inconsistent elastic and electric boundary conditions resulting from different processing schemes may account for some of the variations.
Other problems arise because of limitations in the different characteriza- tion techniques employed to establish the structural symmetry of the unit cell. Many of the studies also lack good statistical analysis of the particle or grain size distributions which are key to such experiments. The results of some of these investigations are summarized in Table I, which considers the loss of ferroelectric behavior in perovskite oxides.
TABLE I Ferroelectric critical crystallite sizes
Composition Size Processing Method
Characterization Method
Reference
BaTi03* 15nm Milling X-ray M. Anlinker et al. BaTi03 + 100 nm Hydrothermal X-ray/Raman T. Yamamoto et al. BaTi03* lOOnm Oxalate X-ray K. Saegusa et al. (Pb0.,6Ba0.84)TiO3 lOOnm Oxalate X-ray K. Saegusa et al. (Pb0.3Ba0.7)TiO3* 57 nm Oxalate X-ray K. Saegusa et al. PbTi03 + 13.8 nm Sol-gel Raman K. Ishikawa et al. PbTi03 + 9.1 nm Sol-gel Raman W. Zhang et al. BaTi03
+'* 15 nm Hydrothermal/Sol -gel coprecipitated
X-ray K. Uchino et al.
BaTi03* 10 nm Milling Electro-optic Effect R. Bachmann and K. Barner
BaTiQ3* 49 nm Sol-gel X-ray and SHG (second harmonic
generation)
S. Schlag and H. F. Eicke
*Size indicative of loss of ferroelectricity at room temperature. +Size indicative of loss of ferroelectricity at all temperature.

328 C. A. RANDALL et al.
2. RESULTS
A glass-ceramic material is a composite created through controlled crystallization of an appropriate glass composition [15'16]. A BaTi03
crystalline phase can be produced on annealing a BaO-Ti02-Al203- Si02 glass[17]. Using a glass ceramic, we are able to avoid particle processing problems such as dispersion and grain growth, while at the same time we can control the size distributions through the careful thermal treatments. Extremely fine crystallites can be developed with a high nucleation efficiency and limited primary grain growth. Various temperature and time schedules were applied to create samples with systematic variations of crystallite sizes. A typical glass composition of 42.9% BaO-35.8% Ti02-14.3%-Si02- 7.2% A1203 was isothermally annealed over temperatures ranging from 700°C to 1000°C for times ranging from 5 minutes to 2 weeks.
A Williamson-Hall X-ray analysis of powder diffraction data was used to establish both residual strain and coherent crystal size[I9]. This concluded that an increase in residual strain occurred with increasing crystallite size. The coherent BaTi03 mean crystallite size lies in the range of 20 to 100 nm for the various glass ceramic samples. Scanning electron microscopy (SEM) observations were also performed to establish crystallite size distri- butions in the glass ceramic materials. There exists excellent agreement between the Williamson-Hall and statistical analysis for the 950°C isothermal samples (Tab. II). From this correspondence, we can conclude that the BaTi03 phase observed in the SEM micrographs are single crystals with a coherent lattice.
The dielectric constant-temperature characteristics of the BaTi03 glass ceramics were obtained as a function of various annealing times. The dielectric constant maximum increases with longer annealing times, and the corresponding temperature of the maximum dielectric constant is also found to increase. Eventually, Tc measured approaches the bulk value of ~ 120°C with longer anneal times at 950°C. The 1 KHz dielectric loss (tan6) ranges from 0.004 to 0.006 at room temperature. Figure 1 specifically shows a shift
TABLE II Crystallite size data from X-ray and microscopy techniques
Sample Processing Average Size Via X-ray Average Size Via SEM
1 hrs. 950°C 20 nm ± 3 nm 25 nm ± 12 nm 3 hrs. 950°C 22 nm ± 5 nm 32 nm ± 17 nm 10 hrs. 950°C 40 nm ± 9 nm 38 nm ± 12 nm 47 hrs. 950°C 51 nm ± 20 nm 45 nm ± 9 nm 2 weeks. 950°C 83 nm ± 43 nm 78 nm ± 19 nm

FINITE SIZE EFFECTS IN GLASS CERAMIC 329
300
250
1 200
•1 3
150
■B 100
50
0.00
-—->. ̂
\ \
-ji: ^
-50 50 150
Temperature (°C)
2 weeks.950 (83 nm)
47h.950 (51 nm)
17h.950 (38 nm)
10h.950 (40 nm)
3h.950 (22 nm)
lh.950 (20 nm)
Glass
FIGURE 1 Variation of dielectric constant versus temperature data for ceramics annealed at 950°C for differing times.
of the dielectric maximum temperature for samples produced with various annealing times. The dielectric maximum is believed to be indicative of a ferroelectric phase transition. A material with both a positive and negative temperature coefficient of capacitance is otherwise extremely difficult to explain. The quenched pure glass phase does not show a maximum but a positive temperature coefficient of capacitance typical of a glass material.
3. DISCUSSION
The data presented in the previous section on ferroelectric glass ceramics can be analyzed in relation to the earlier theoretical investigations. Through a phenomenological model, Binder points out the influence of depolariza- tion fields and the order of the phase transition in ferroelectric systems undergoing size effects[5' 20]. The scaling critical exponents are predicted to change under depolarization fields in finite ferroelectric crystals. In this investigation, the basic trends in the scaling behavior can be observed from correlating the dielectric data and the mean of the crystallite size distribution.
The shift of the transition temperature scales with N, the number of unit cells contained in an average crystal (Fig. 2(a)). This scaling is a consistent with typical size influenced transitions; viz.
Tc(N)-Tc(oo)^N-^d (3)

330 C. A. RANDALL et al.
€
(b)
2.5-
\. 1 i> T^
„ ,...1
:H
HI l" «^
Vl H
1-
K-*4
4.5 5 5.5 6 6.5 7 7.5
Log(N)
Intercept = 4.54
Slope = -.47
Intercept = 3.86
Slope = -.27
FIGURE 2 Comparison of the a) transition shift, b) broadening and c) magnitude of the dielectric maximum as a function of BaTi03 crystal size.
The critical exponents in this case are the shift exponent, A, and d is the dimensionality.
As the crystallites in the glass ceramic are undergoing size effects, we also expect there is also a rounding or broadening of the critical anomalies observed at the transition temperature. This rounding scales with size;
^-'rounding ~ ■''
where d is dimensionality and 9 is the rounding exponent.
(4)

FINITE SIZE EFFECTS IN GLASS CERAMIC 331
(c)
! •
_ L^k y =
-r
T
L 1
^^M»
T _^J-—X pDk I
y
-4*" *
1
1.2 1 l
4 1.6 1.8 ;
Log (size) (ran)
FIC HJRE2 (Contin ued)
Log (Kmax)BaTi03
y = 0.988x + 1.127 r2 = 0.929
log (Kmax) Composite
y = 0.660* + 1.072 r2 = 0.930
The interrelationships between the rounding and shifting exponents and the other critical exponents of the order parameter and susceptibility are linked to the order of the phase transition and the influence of depolarization field. Measurements taken here demonstrate the general scaling trends but are not sufficient to elucidate accurate rounding and shifting exponents. Monosized crystallite distributions and more accurate temperature measurements would be required to establish critical expo- nents.
The peak value of the dielectric constant also scales as a function of particle size. In a second order transition
Krr ,Lllv (5)
where L is the size of the crystal, 7 is dielectric constant critical exponent, and v is the critical exponent of the correlation length temperature de-
pendence (see Eq. (2)).
For a first order phase transition, the dielectric maximum depends on the crystal size raised to the power of the dimensionality, viz.
Krr
where d is again the dimensionality.
(6)
Temperatures below Tmax were used to establish the diffuseness coefficient for the size-affected properties of the glass-ceramic. The diffuseness

332 C. A. RANDALL et al.
coefficient was established from the dielectric-temperature dependence, viz.
1 _ 1 . (-* ~ -'max) /^\
K- -"max *-0 "-max
where Kmax is the peak dielectric constant, Tmax is the corresponding dielectric constant and, 8 is the diffuseness coefficient[21].
A systematic scaling trend is noted in Figure 2b showing the increase in broadening with decreasing crystal size.
Figure 2c shows Kmax increasing with the mean crystallite size. Corrections to the Kmax values were added by taking into account the volume fraction of non-ferroelectric glassy phase. The crystals are dispersed within the residue glassy matrix, and the growth is not interpentrating at the conditions reported in this paper. The volume fraction of BaTi03 can be readily determined by careful density measurements and logarithmic mixing laws. The slope from Figure 2c does not have a dimensionality of 3, which would be indicative of a first order phase transition (as given by Eq. 6). This would imply the ferroelectric crystals are undergoing second order phase transitions. Since the elastic boundary conditions on the crystals would be hydrostatically clamped, one would expect the transition in BaTi03 to be second order. It should also be noted that hydrostatic pressure is not sufficiently high to shift the dielectric anomaly to the temperatures observed in this study and, therefore, the shifts are resulting solely from a size effect.
The shift of the transition temperature with size has been the subject of a number of previous studies. The critical size is defined as the size where ferroelectricity is no longer stable at any temperature. Attempts to predict the critical size have been addressed both theoretically and experimen- tally f7"14-22-24]. The transition temperature shift with crystal size has previously been described by Ishikawa et al, with a simple empirical relationship:
Constant ,. Tc = Tc(oo) + ——- (8)
-^ -^critical
where Tc is the transition temperature of a finite ferroelectric, Tc (oo) is the bulk transition temperature L is the crystallite size and, •^critical is the smallest crystal size showing ferroelectric behavior[7].

FINITE SIZE EFFECTS IN GLASS CERAMIC 333
Figure 3 compares the Tc shift of the BaTi03 glass-ceramic samples to previous studies on BaTi03 and PbTi03 powder. Extrapolating these data on a linear plot reveals the critical BaTi03 crystal size to be 17nm±4nm. This result is in excellent agreement with the PbTi03 powder study by Ishikawa et al, where the critical size was found to be 13.8 nm.
It is interesting that there exists strong evidence for a reduction in the transition temperatures of isolated particles, but the evidence for such shifts in the bulk ceramics or these films is not as clear. Apparently, the electrical boundary conditions strongly influence the critical temperature. Recently Liu et al, used careful calorimetry and X-ray diffraction measurements to study the size effect. Differences in the degree of agglomeration of the particles also changed the extrapolated critical sizes in BaTi03
[29]. The particle agglomerates appeared to show a smaller shift of the transition temperature from the bulk temperature. The size effects in bulk ceramics and thin films would not experience the influence of depolarization fields unless there is a low dielectric constant grain boundary phase present.
In most grain size studies in bulk ceramics and thin films, the dielectric constant temperature behavior presents a peak dielectric constant reduction and a broadening with decreasing grain size[3° 33]. The evidence for dramatic shifts in transition is suppressed. This has been demonstrated by a number of authors in grain sizes down to lOOnm. But recently Frey, et al, were able to fabricate BaTi03 films and bulk ceramics with grain sizes down
400-
D
o (PbTiOj powder)
300-
. Tc= 125°C
200- / (BaTi03 Glass-Ceramic) J (BaTi03 Powder)
100- «.- ° y'' 0.00- ° o
-100- D
1
10 100
Size (nm)
FIGURE 3 Comparison of the transition temperature variation with crystals size for different systems and studies'7, I2].

334 C. A. RANDALL et al.
to 40 nm with no appreciable shift in Tc [30]. Comparing our data with that of
Frey, et al., sizes below 40 nm dramatically demonstrate shifts in transition temperature. However, the sensitivity of these shift may very much depend on differences in electric boundary condition and the ability to create a graded polarization in the crystal. These issues need much greater attention by experimentalists in the area of ferroelectrics.
4. SUMMARY AND CONCLUSIONS
Ferroelectric behavior in nanometer sized crystals and crystallites show a number of size effects that challenges our present understanding of the phenomena. In this study, we showed that a glass ceramic provides one possible method to probe size effects. The shifting of the transition temperature, broadening of the dielectric anomaly and the lowering of the peak maximum are all clearly observed through electric measurements in crystallite sizes ranging from 20-80nm. The critical size for the BaTi03
crystals was extrapolated from the empirical Ishikawa relation to be
17nm± 4nm.
References
[1] Devonshire, A. F. (1949). Phil. Mag., 40, 1040. [2] Buessem, W. R., Cross, L. E. and Goswami, A. K. (1966). J. Am. Ceram. Soc, 49, 33. [3] Samara, G. A. (1987). Ferroelectrics, 73, 95. [4] Würfel, P. and Batra, I. P. (1976). Ferroelectrics, 12, 55. [5] Binder, K. (1987). Ferroelectrics, 73, 43. [6] Fischer, M. E., Critical Phenomena, edited MS Green (Academic Press, New York and
London, 1971). m Ishikawa, K., Yoshikawa, K. and Okada, N. (1988). Phys. Rev. B, 37, 5852. [8] Yamamoto, T., Orabe, K. and Banno, H. (1995). IEEE Transactions on Components and
Packaging, 8. [9] Saegusa, K., Rhine, W. and Bowen, H. K. (1993). /. Am. Ceram. Soc, 76, 1505.
[101 Anliker, M., Brugger, H. R. and Kanzig, T. (1956). Helv. Phys. Ada, 27, 99. [11] Zhang, W. L., Wang, Y. G. and Zhang, L. (1995). Phys. Letts. A, 189 121 [12] Uchino, K., Sadanaga, E. and Hirose, T. (1989). J. Am. Ceram. Soc, 78, 1555. [13] Bachmann, R. and Barner, K. (1988). Solid State Ceram., 68, 865. [14] Schlag, S. and Eicke, H. F. (1994). Langmuir, 10, 357. [15] McMillan, P. W. (1964). Glass Ceramics (Academic Press, London and New York, 1964). [16] Beall, G. H. (1992). J. Mat. Edu., 14, 315. [17] Herczog, A. (1964). J. Am. Ceram. Soc, 47, 107. [18] McCauley, D., Newnham, R. E. and Randall, C. A., accepted J. Am. Ceram. Soc. [19] Williamson, G. K. and Hall, H. H. (1953). Ada Meta, 1, 2. [20] Kretschmer, R. and Binder, K. (1979). Phys. Rev. B, 20, 1065. [21] Smolenskii, G. A. (1970). X Phys. Soc, 528, 26. [22] Wada, S. and Noma, T. (1995). Jap. J. Appl. Phys., 31, 5368 23] Frey, M. H. and Payne, D. A. (1993). Appl. Phys. Letts., 63(20), 2753-2755.

FINITE SIZE EFFECTS IN GLASS CERAMIC 335
[24] Leonard, M. R. and Safari, A. (1993). Proceedings of the 7th US-Japan Seminar on Dielectrics and Piezoelectric Ceramics, Lanaina, Hawaii, 235-240.
[25] Criado, J. M., Dianez, M. J., Gotor, F., Real, C, Mundi, M., Ramos, S. and Del Cerro, J. (1994). Ferro. Letts., 91, 833.
[26] Wang, C. L. and Smith, S. R. P. (1995). J. Phys. Cond. Matter, 7, 7163. [27] Wang, C. L., Smith, S. R. P. and Tilley, D. R. (1994). J. Phys. Cond. Matter, 6, 9633. [28] Chattopadhyay, S., Aygub, P., Palkar, V. R. and Multani, M. (1995). Phys. Rev. B, 52,13,
177. [29] Liu, X. (1996). 98th Annual Meeting of Am. Ceram. Soc, Indianapolis. [30] Frey, M. H. and Payne, D. A. (1996). Phys. Rev. B, 54(5), 3158-67. [31] Randall, C. A., Kim, N., Cao, W. and Shrout, T. R. (1995). Proceedings of the 7th US-
Japan Seminar on Dielectrics and Piezoelectric Ceramics, edited S. Yamamoto, 145-148. [32] Maria, J. P., Trolier-McKinstry, S. and Schlom, D. G., Proceedings of ISAF'96, Rutgers,
New Jersey. [33] Shaikh, A., Vest, R. and Vest, G. (1990). IEEE Transactions on Ultrasonic, Ferroelectrics,
and Frequency Control, 36, 407.

Ferroelectrks, 1998, Vols. 206-207, pp. 337-353 Reprints available directly from the publisher Photocopying permitted by license only
> 1998 OPA (Overseas Publishers Association) Amsterdam B.V. Published under license
under the Gordon and Breach Science Publishers imprint.
Printed in India.
THE ROLE OF INTERFACES ON AN APPARENT GRAIN SIZE EFFECT ON THE DIELECTRIC
PROPERTIES FOR FERROELECTRIC BARIUM TITANATE CERAMICS
M. H. FREY, Z. XU, P. HAN and D. A. PAYNE
Department of Materials Science and Engineering, Seitz Materials Research Laboratory, and Beckman Institute, University of Illinois at Urbana-Champaign,
Urbana, IL 61801, USA
(Received 1 June 1997)
We report the effect of interfaces (and thus internal surface area effects) on the value of dielectric constant (K1) calculated from capacitance and geometry data for sub-micron barium titanate (BaTi03) ceramics prepared with decreasing grain size (and grain volumes). A series model is proposed to explain the decreasing values of apparent K' obtained for grain sizes below 0.5 urn. A distinction is made between the true dielectric constant (K1) and the apparent dielectric constant (K') calculated from experimental data. The progressive suppression in K' is explained in terms of ferroelectric grains of constant dielectric constant (K'x) separated by a lower-K-i boundary region (i.e., grain boundary) of constant thickness (d2). The problem is one of an increasing interfacial surface area to grain volume ratio in fine-grain dielectrics. We begin by reporting original dielectric data for high pressure-densified ultrafme-grain BaTi03 ceramics. Chemically prepared BaTi03 powder was consolidated at high pressure (8GPa) and low temperature to prepare ultrafine grain microstructures. Specimens pressed at 700° C were substantially dense (>98% of theoretical density) with an average grain size of 70 nm. Subsequent heat treatment at increasing temperatures (and atmospheric pressure) yielded a series of specimens with increasing grain sizes up to 20 um. High-pressure consolidation at room temperature, followed by heat treatment at 800°C (and atmospheric pressure), yielded a finer- grain (40 nm) and less dense («90% th) microstructure. The temperature dependence of K' was determined for ceramics ranging in grain size from 40 nm to 20 urn. Curie-Weiss analysis of the dielectric data clearly suggests a series dilution of the composite K' by the interfacial grain- boundary regions. We were able to model the dielectric measurements by considering grain boundary regions of relaxed thickness d2 = SA and dielectric constant K'2 = 130. Polarization reversal and Curie-Weiss characteristics were observed for all BaTi03 ceramics studied in this investigation. Thus, the conclusions are made that if a critical grain size exists for ferroelectricity it is less than 40 nm for polycrystalline BaTi03, and the role of interfaces is extremely important on the calculated values of K' for fine-grain ceramics below 0.5 urn.
Keywords: BaTi03; grain size; dielectric constant; interfaces; series dilution; Curie-Weiss analysis
337

338 M. H. FREY et al.
INTRODUCTION
The effects of size (e.g., grain size) and scale (e.g., thickness) on properties are of current interest for ferroelectric ceramics. Specifically, deviations from intrinsic behavior often exhibited by materials integrated in thin-layer form on semiconductors may compromise their utility for certain applica- tions, including non-volatile and dynamic random access memory elements. For example, we have observed that certain BaTi03-based thin layers display significantly reduced values of dielectric constant (K1), as well as the lack of polarization-reversal characteristics[1]. These significant deviations from intrinsive behavior may result from some combination of i) grain size, ii) layer thickness, iii) residual stress, and iv) electrode interface effects. In the present work, we have isolated the effect of grain size by preparing substantially dense ceramics of very fine microstructure and determining their dielectric properties. In this way, the influence of grain size (from the nano to the micron scale) on properties, was determined for polycrystalline BaTi03. Grain size-dependent Curie-Weiss characteristics, as well as the properties in the ferroelectric state, are explained by series mixing of ferroelectric grain cores with non-ferroelectric grain boundary regions.
The present investigation is based on a characterization of a suite of BaTi03 specimens prepared with average grain sizes which increase sequentially from the nano to the micron scale. Stoichiometric nanocrystal- line BaTi03 powders were prepared by an alkoxide decomposition route. Ceramic bodies were formed by consolidation at high pressure and elevated temperature. The materials of this investigation were prepared without additives. Thus, experimentally determined property values are reported for nominally pure, single-phase BaTi03. As-pressed pellets were sliced into thin wafers, which were heat-treated (individually) at successively higher temperatures to yield the microstructures reported. Impedance and high- electric field polarization measurements were carried out to determine the relationships between grain size and dielectric properties for ultrafine-grain BaTiOs.
EXPERIMENTAL
Barium and titanium methoxyethoxide solutions were prepared as reported previously in our earlier work[2]. Solution concentrations were carefully determined by gravimetric analysis before combination to yield an equimolar BaTi03 precursor solution. Such solutions have been shown to

GRAIN SIZE EFFECT ON THE DIELECTRIC PROP 339
yield the perovskite phase by a multistage decomposition route during heat treatment in air to 750°C - with no further weight loss above this temperature. By contrast with BaTi03 powders prepared at very low temperatures (e.g., 100°C) by excess hydrolysis of the same alkoxides, the powders of this study (i.e., unhydrolyzed metalloorganic decomposed) were confirmed to be free of any detectable hydroxyl defects as determined by infrared spectroscopy[3]. The presence of hydroxyl defects would complicate the interpretation of electrical data. Powders were prepared by drying (150°C) and decomposing the metalloorganic solution at 750°C for Ihr. The starting primary crystallite size was less than 30 nm, as determined by high- resolution scanning electron microscopy (SEM, Hitachi S-800). X-ray diffraction (XRD, Rigaku D-MAX IIIB) showed the powder to exhibit the commonly reported "pseudocubic" perovskite structure.
After grinding the calcined powder in a mortar and pestle, pellets were formed without binder by uniaxial cold-pressing. A sample assembly for high pressure consolidation was prepared in the following way. Individual pellets were encapsulated in gold foil and placed next to a pressure- calibrated D-type thermocouple, all within a cylindrical iron-chromium heating element[4]. The various components of the sample assembly were isolated and lubricated with fitted pieces of hexagonal boron nitride. The sample assembly, held in an octahedral MgO casting, was loaded into a multi-anvil press (Rockland Research Corporation)141. BaTi03 bodies were consolidated isostatically at a pressure of 8 GPa for 30 min, with or without heating to 700°C. The pressure was generated in less than 15 min, held for 30 min, and then released over the course of one hour. Heating to 700°C, after the pressure was reached, required less than 10 min, as did a significant amount of the cooling after the pressure was released. The ceramic pellets pressed with concurrent heating to 700° C were translucent and light blue in color, suggesting that they were dense, but partially reduced. Sliced specimens were heat-treated in air, at atmospheric pressure, and at temperatures of 700° C or higher, where reoxidation, relief of residual stresses, and grain growth could take place. The ceramic specimens had sufficient strength that they could be handled easily without breakage during extraction from the press, and during slicing and polishing. Individual wafers, measuring «4mm in diameter and 0.30-0.35 mm in thickness, were heated at 10°C/min in air to temperatures between 700 and 1325°C and held at temperature for 30 min, before cooling at 10°C/min. An average grain size ((g.s.)) was determined by the linear-intercept method from SEM photomicrographs of fractured surfaces, and_ ranged from 70 nm to 20 um, depending on the secondary heat-treatment conditions. Several areas of

340 M. H. FREY et al.
each specimen were examined, and an average grain size was determined. For the preparation of finer-grain material, the high pressure consolidation was carried out at room temperature. These specimens were less dense and strong. However, secondary heat treatment at 800° C for 30 min in air yielded a material of 40 nm grain size with sufficient strength that it could be handled without breakage throughout the specimen preparation procedure. The disk-shaped specimens were used for electrical measurements. After annealing and polishing, they were found to be light tan in color. Sputter- deposited gold electrodes were used as contacts in a parallel-plate capacitor structure. Temperature-dependent measurements were made in a computer- controlled environmental chamber with a HP4284 LCR meter. Values for the apparent dielectric constant (K1) and loss tangent (tan 6) were obtained. Polarization-electric field (P-E) measurements were carried out at room temperature on a modified Sawyer-Tower apparatus. Microstructures were further characterized by transmission electron microscopy (TEM, Philips 420 and Hitachi 9000).
RESULTS AND DISCUSSION
An enhancement of the dielectric constant (K'), for fine grain (^ 1 um) BaTi03 ceramics below the Curie temperature (Tc), was reported as early as 1954[5 S]. When BaTi03 ceramics are prepared with a grain size as small as 0.5-1 um, the K' values below Tc become significantly enhanced, e.g., K' « 5000 for fine grain (0.5 um) material, compared with K' « 1500 for coarse grain (50 urn) ceramics at room temperature. The effect is clearly illustrated in the data reported by Kinoshita and Yamaji, as shown in Figure 1[6]. The value of 1500 for coarse-grain material is readily understood in terms of an orientational average of the anisotropic dielectric constants which characterize a free single crystal[9]. The value of 5000 for fine-grain microstructures was suggested by Buessem et al., to result from a contribution from residual stresses on individual grains, where the grains were observed to become substantially untwinned with decreasing grain size[10]. With further reduction in grain size below 0.5-1.0 um, the K' value in the tetragonal phase was observed to decrease again. This behavior is illustrated in the data reported by Arlt et al., as shown in Figure 2[7]. Due to practical difficulties in preparing dense BaTi03 ceramics with a grain size less than 0.5 um, little data has been reported for K' values below that grain size. Most importantly, a rigorous explanation of the effect has remained elusive. Arlt et al, proposed that the decrease in K' resulted from changes in

12 1 1 1 r ' i— i
11 -
10 - m 2 9 _ •— I 8 in c o ü 7
I
u 1 2.2;irn
5 5 /Vl.l^im S/w ■
4 /$&£v9'Mr \ " 3
***yaw' 3.0>im / \ '
2
1
"•^^V yk°>03^"ln~' ^
n i i i i i i
-150 -100 -50 0 50 100 150 Temperature (°C )
FIGURE 1 Effect of grain size on measured values of dielectric constant for BaTiOa ceramics with grain sizes ranging from 1-50 um, as a function of temperature (from, Kinoshita and Yamaji, Ref. [6]).
6000
5000
£000
3000
2000 ■
1000
0
BaTi03, dense ceramics
Cr calc. with 19)
• measured at 25 °C • measured at 70 °C « calculated with (9)
Er cat. \ with (erS
I •
1 1 1 I I I I II 1 1 l—TT
0.1 0.2 0.3 OS 1.0 2 3 5 10 20 30 50 100
a/um m
FIGURE 2 Effect of grain size on measured values of dielectric constant for BaTi03 ceramics with grain sizes ranging from 0.3-100 um, at temperatures 25 and 70°C (from, Arlt et al, Ref. [7]).

342 M. H. FREY et al.
crystal structure (i.e., a "pseudocubic" structure, not tetragonal structure) with grain size reduction[7], while Shaikh et al, suggested that the behavior could be explained by combined parallel and series mixing of grain interiors and boundary regions'81. However, analysis by the latter authors led to the unrealistic conclusion that amorphous grain boundaries with a thickness as large as 90 A must be present within ultrafine-grain BaTiOs. We also question the applicability of a combined series and parallel dielectric mixing model for fine-grain BaTiOs. Specifically, in light of the expected differences in dielectric susceptibilities between grain interiors and grain-boundary regions (with the interiors having much higher susceptibility), we apply a series dielectric mixing model to explain our experimental data.
Figure 3 gives temperature-dependent K' and tan 6 data for a series of specimens prepared in this study. The sample which was both pressed and annealed at 700°C was characterized by a wide grain-size distribution (30- 100 nm, (g.s.) =70nm). Secondary heat treatment at 900°C resulted in grain growth'to (g.s.) = 90nm, with the presence of a small number of grains as small as 30 nm or as large as 0.2 urn. Microstructures for the specimens with (g.s.) reported as 0.17, 0.24, 0.33 and 0.60 um contained no grains smaller
c +■< en C o U o
•c +-» O <D
r—! <o
• 1—(
Q
12000
10000
8000
6000
4000
2000
Temperature (°C)
FIGURE 3 Measured value of dielectric constant and loss tangent for BaTi03 ceramics prepared in the present study, as a function of temperature. The grain sizes ranged from 0.07- 1 lm and were prepared by pressing at 8GPa and 700°C, followed by heat treatment in air.

GRAIN SIZE EFFECT ON THE DIELECTRIC PROP 343
than 0.1 urn or larger than 1 um. To illustrate the density of the materials in this study, Figure 4 gives a bright field TEM photomicrograph for a specimen heat treated at 900°C for 30 min in air ((g.s.) =90nm), recorded in a region of small grain size. All of the materials reported in Figure 3 were substantially dense, as determined by direct observation with SEM and TEM. They contained a small amount of well-dispersed and isolated submicron porosity, and were judged to be >98% of theoretical density. Loss tangent data are given as an indication of the quality of the specimens. That is, the dielectric constant data reported for materials annealed at increasing temperature should not be thought to be comprised of any lossy conductive contributions. Measured values of the DC resistivity were in excess of 5x 1012 ft-cm. The data in Figure 3 indicate a number of important findings:
i) The room-temperature K' values for dense BaTi03 ceramics with a grain size less than lOOnm are greater than 2000.
ii) A dielectric anomaly is clearly present at the ferroelectric transformation temperature, Tc, for BaTi03 ceramics with a grain size less than 100 nm.
iii) Tc (120°C on cooling) is not shifted to lower temperature with grain size reduction below 2 um for dense ceramic BaTi03.
iv) The dielectric maximum at Tc, and values of K' at T > Tc, decrease with decreasing grain size below 2 um, which is different from the results of Kinoshita and Yamaji reported for larger-grain materials[6].
FIGURE 4 Bright field transmission electron photomicrographs illustrating the dense microstructure for a high pressure-consolidated BaTi03 ceramic, subsequently heat-treated at atmospheric pressure in air at 900°C for 30 min.

344 M. H. FREY et al.
The first (i) of these observations (i.e., K' « 2000) is contrary to our results for thin-layer BaTi03
[1]. While the reported flattened temperature characteristics of K' for thin layers of fine microstructure can be, in part, attributable to grain size, it appears that the low values commonly reported for the calculated K' (« 50-300) are likely to be the result of a combination of a grain size and other effects. For example, the apparent dielectric constant has been shown to decrease continuously for BaTi03 thin layers with decreasing thickness below 1 um [11]. The decrease in apparent K' is likely to result from an external electrode interface effect. The second (ii) and third (iii) observations above are relevant to reports that BaTi03
particles of size less than 100 nm are cubic and nonferroelectric at room temperature1121. Our results indicate that the published conclusions of Uchino et al., based upon XRD experiments carried out on BaTi03
particles'121, should not be applied to polycrystalline ceramic materials of comparable grain size. That is, BaTi03 polycrystals with a grain size less than 100 nm clearly exhibit dielectric characteristics of a ferroelectric transformation at the normal Tc. This conclusion is supported by our previous results for an investigation into the structure and phase transformation characteristics of BaTi03 polycrystals with decreasing grain size below 100 nm[3]. In the present study, a small negative shift in Tc for the BaTi03 ceramics reported in Figure 3, as compared with the Tc for coarse- grain (20 um) specimens (Tc= 123°C) was observed. That is, after an initial shift in Tc from 123 to 120°C (with decreasing grain size from 20 to 1.7 urn), no further change in Tc was observed. This shift is likely to result from an elastic clamping effect for individual crystallites in all of the fine-grain ceramics (g.s. < 1.7 um) of this study [13]. The value of 123°C for Tc for the coarse-grain specimen, instead of 130°C, indicates that the materials in this study do contain some substituents. For example, elemental analysis revealed the presence of impurities at the following levels; 0.4 wt% Sr, 0.07 wt% Ca, and 0.03 wt% Mg, most likely derived from the barium related source. It is noteworthy that similarly reduced values of Tc for ceramic specimens in the previous studies by Kinoshita and Yamaji [ ] and by Arlt and coworkers[7] call into question claims of remarkable purity. The fourth (iv) observation above, that of decreasing values of apparent K' at T> Tc with decreasing grain size below 1.7 urn, is next considered in more detail. For the remainder of this report, calculated values of the apparent dielectric constant, based upon direct impedance measurements, or upon the microstructural model, are designated by K1.
Figure 5 gives Curie-Weiss characteristics for the data reported in Fig- ure 3. Values calculated for the Curie constant from these data are

w
GRAIN SIZE EFFECT ON THE DIELECTRIC PROP
0.0008
345
0.0007
0.0006
0.0005
0.0004
0.0003
0.0002
0.0001
0
V T=e
Vj= 0.000220 s
\|/2 = 0.000152s
y3 = 0.000090 N
\|/4 = 0.000060s \ ^ y5 = 0.000050 A\^ V = 0.000025 \^
60 80 100 120 140 160 180
Temperature (°C) 200
FIGURE 5 Curie-Weiss characteristics for the BaTi03 ceramics prepared in the present study.
essentially equal (C- 1.7xl05 K) for ceramics of different grain sizes, while the minimum dielectric stiffness (l/K' at Tc) increased continuously with decreasing grain size (or increasing grain boundary area per grain volume). These results can be interpreted in terms of a brick-wall model for the distribution of different dielectric phases in a diphasic dielectric[14]. That is, the interior grain volumes may undergo the ferroelectric transformation in the presence of an incoherent, and thus somewhat defective or disordered, grain-boundary region. It will be shown in this paper that a grain-boundary region with a width of only two lattice spacings, or 8 A, and a temperature- independent dielectric constant of 130 can explain the reduction in K' through series dielectric mixing! These characteristics for a boundary region are judged to be reasonable, based on high resolution transmission electron microscopy observations, as shown in Figure 6, and reported values of K'2
for titania (Ti02) and nonferroelectric titanates in general. Figure 7 gives a schematic representation of the brick-wall model for a diphasic dielectric comprised of isolated grains and a continuously connected grain-boundary region. As explained previously, for K\ > K'2, electric flux fringes away from the boundary regions oriented parallel to the flux passage, which results in series dielectric mixing for such high-^T ceramic microstruc- tures[14]. The apparent dielectric constant {K') is given by:

346 M. H. FREY et al.
?
FIGURE 6 High resolution transmission electron photomicrograph illustrating the boundary region between adjacent crystalline grains in a BaTi03 ceramic post-treated at 900°C for 30min
FIGURE 7 Brick-wall model for a diphasic microstructure, where isolated primary and continuously connected boundary phases are characterized by different values of their dielectric constants, K\ and K'2, respectively.
1 Y1 Vl gV2
K\ + K', (1)
where v, is the volume fraction for phase i and g is a geometric factor, g is equal to the fraction of the boundary phase that can be expected to interrupt

GRAIN SIZE EFFECT ON THE DIELECTRIC PROP 347
electric flux passage, which is determined by the grain geometry. A value of g = 2/6 represents the condition of K\ ~> K'2 for cube-shaped grains in Figure 7. For spherical grains g —> 1. For diphasic dielectrics in the BaTi03- NaNb03 system, Payne and Cross determined a value of g = 0.8[13' 15]. This value is more realistic, considering the truncated polyhedral shape taken by grains in any real ceramic microstructure.
With regard to the single-phase BaTi03 ceramics of this study, grain interiors are proposed to undergo the normal ferroelectric transformation, even for grain sizes below 100 nm. While the high-^T', isolated phase undergoes a ferroelectric transformation, the series-connected \ow-K2 grain- boundary region serves to dilute the overall K' at all temperatures. Curie- Weiss behavior is changed in the following manner. Since,
r' = r c
(above Tc) (2)
then
K
T-9
C Al (3)
where C is the bulk Curie constant, 9 is the extrapolated Curie-Weiss temperature, and K2 is taken to be independent of temperature. The volume fractions for the two phases in the cubic brick-wall model for grain cores of width d\, and boundaries of width d2, are given by:
Vl
v2
1+-
1-1 +
(4)
(5)
and Eq. (3) can be rewritten as:
Y1 T-9
d\ K< <S?2
-3n
(6)
By using the Curie-Weiss data for the larger grain size (1.7 (xm) material, 6 was determined by extrapolation to the temperature axis. Thus, by extrapolating the lines of l/K' vs. Temperature to 9, values were interpreted on the intercept for the impedance factor, ip, for the finer grain-sized materials (Fig. 5):

348 M. H. FREY et al.
, gn g K2 A2
1-1 + dx
-3-
(?)
That is, at T = 6 for the ultrafine-grain-sized materials (and as the Curie- Weiss (Eq. (2)) and series dielectric-mixing rules (Eq. (3)) indicate), non-zero values of \/K' are derived only for the boundary regions (v2). Thus, the characteristics of these regions can be determined from the extrapolated data at this particular temperature. These analyses were carried out for the Curie-Weiss plots in Figure 5 (0=11O°C), and the intercept values for ip are indicated. Larger-grain size specimens, e.g., 20|im (TC=123°C and 6= 113°C) were judged to be inappropriate for the determination of V>, since the temperature characteristics were shifted upward by 3°C with respect to the finer-grain specimens. This was attributed to stress relaxation in multidomain microstructures.
To demonstrate the applicability of the series dielectric-mixing model to the actual data, hypothetical values for ip were calculated using Eq. (7), and compared with the experimental data. The results are given in Figure 8. The experimental results are clearly consistent in form with the series model. In
0.00030
> 0.00025
o O 0.00020 a
O 0.00015
g J> 0.00010 M-l
B i—i
0.00005
0.00000 0.0
111 _J
11 V =
1
K' T
§V2 g [l-U+Cd^)]-3]
=e 2 2
d2 = 8Ä
- in n -ns K'2= 100
A K'2= 130
\
K'2= 160
• Experiment
1
^ ^X^^rrr—-—— , ■ ... i
0.2 0.4 0.6 0.8
Grain Size, dl (jim) 1.0
FIGURE 8 Experimentally determined boundary impedence factor, i/>, as a function of grain size, compared with predicted values from the brick-wall model, using the values cited for K'2, d2 and g.

GRAIN SIZE EFFECT ON THE DIELECTRIC PROP 349
light of the previous discussion for g = 0.8 for polycrystalline dielectrics, values of d2 = 8 Ä, g = 0.8, and K'2 = 100, 130, and 160 were used in Fig- ure 8[14' 15]. These reasonable values for d2, K2, and g give good fit to the experimental data. Independent confirmation of the values used for d2 and K2 would be difficult, if not impossible, but the ratio is important. Although the nature of the continuous low-X^ phase is not known in terms of its exact thickness and dielectric constant, we conclude that the supression of K' for ultrafine grain BaTi03 clearly results from a series dielectric-mixing effect, especially when the interfacial surface area to volume ratio starts to become significant in sub-micron grain structures.
Figure 9 further demonstrates the strong correlation between measured characteristics and the series-mixing model, now below Tc. The dependence of measured values for K' at a single temperature (e.g., 70°C) on submicron grain size is now considered. To avoid the complicating effects of phase transformations (and following other treatments'71) measured values of Ä^'at 70° C for grain sizes below 1 urn were used, along with the best-fit value for K'2 from Figure 8. Eqs. (1), (4) and (5) allow the calculation of K[, the dielectric constant for the grain interiors, for different grain sizes. A single
IW
G «3
■4-> (*) G o U o
■Ö o
JD 13
G
!3 a*
<
DIAIU
• 4000
•
3000 1 \ gv2
K' K\ K', 2000 d2 = 8Ä
K'2 = 130
1000 -*- -► g = 0.8
j Single Domain
Twinned Grains Ki = 4800 (Model)
Grains
i , , , i
• Experiment
n i ■ i
0.0 0.5 1.0 1.5
Grain Size, d (\im) 2.0
FIGURE 9 Effect of grain size on dielectric constant measured at 70°C for ceramics prepared in the present study, together with the behavior predicted using the series-mixing model for microstructures with a constant value of K\ = 4800.

350 M. H. FREY et al.
value of K\ = 4800 correlates closely with the grain-size dependence of K' for BaTi03 of grain size less than 0.5 urn, which are likely to be comprised of substantially single-domain and stressed grains[3]. Thus, we again conclude that the series-mixing model is appropriate for the description of the dielectric properties of ultrafine-grain BaTi03. The constant value of K\ = 4800 at 70°C is reasonable in light of the enhanced dielectric constant which has been so often measured for fine-grain BaTi03. In Figure 9, the effects of competing influences on K' can be seen. With decreasing grain size, unrelieved transformation stress first enhances K', followed by an increased dilution effect from the boundary regions. At larger grain sizes (e.g., > 0.5 um) stress relaxation by domain formation leads to a progressive
decrease in K'[4]. Due to its low density («90%th by SEM) and different preparation
method, data for the specimen with an average grain size of 40 nm were not included in Figures 3 and 5. It is important to note that the 40 nm material did indeed exhibit Curie-Weiss characteristics (C = 1.7x10⁵K) similar to the previously reported microstructures. The data were not included in Figures 3 and 5 because the substantial porosity content resulted in an additional dilution of K' values (e.g., K' = 970, tan 0 = 0.05 at 70°C); but Curie-Weiss characteristics for BaTi03 ceramics with a grain size as small as 40 nm is a significant finding111! This demonstrates that ferroelectricity can be expected at such a fine size, given the appropriate boundary
conditions. Finally, Figure 10 gives P-E data determined for BaTi03 ceramics of grain
sizes below 1 um. Polarization-reversal characteristics were observed for BaTi03 ceramics with grain sizes as fine as 40 nm. With decreasing grain size below 1 urn, the measured remanent polarization (Pr) decreased continu- ously. This decrease in Pr, with grain size reduction, coincided with the development of clamped boundary conditions for individual grains, due to the absence of stress release by twin formation. This conclusion is based in part upon a microstructure investigation reported previously[3]. Measured values for the coercive field (Ec) did not increase with grain size reduction, in contrast to the behavior reported for sputter-deposited BaTi03 thin layers'161. The direct measurement of ferroelectricity for ceramics of such a small grain size contrasts with measurements reported previously for chemically prepared thin layers with grain sizes up to 50nm[17]. For alkoxide-derived thin layers, no hysteresis behavior was reported. Thus, we conclude that while a reduced value of measurable remanent polarization does characterize BaTi03 ceramics with a grain size well below 1 urn, the complete suppression of ferroelectricity in integrated thin-layers of similar

GRAIN SIZE EFFECT ON THE DIELECTRIC PROP 351
0.40
u c o
••Ö cd N
•c 'o Pu
0.00 -
-0.40
10Hz 25°C
^^^5^" 0.33 (im
/Z^^ 007 urn / l^/^?*'°04^™
-1.25 0 1.25
Electric Field (MV/m) FIGURE 10 Polarization-reversal characteristics for ultrafine-grain BaTi03 ceramics.
grain size is not an effect of grain size alone. Other factors, including shrinkage stresses on rigid substrates, and external electrode interfaces, must be considered to explain the absence of polarization reversal in chemically prepared thin layers. For example, in-plane stress has been shown to influence the ferroelectric properties of BaTi03 thin layers[18].
CONCLUSIONS
A number of original findings were reported in this work. Curie-Weiss characteristics were observed for ultrafine-grain BaTi03 ceramics. A series dilution effect, which became pronouced with decreasing grain size, was explained by consideration of an increasing contribution from interfacial grain boundary regions. Specifically, for decreasing grain size below 1.7 um, the decreasing values observed for K' above Tc (unlike Ref. [6]) were explained in terms of series mixing of a \ow-K'{K'2 ~ 130) boundary region which separated transforming grain cores. Below Tc, values of K' in the temperature range of stability for the ferroelectric tetragonal phase, and for grain sizes ranging from 70 nm to 0.5 um, were also well-described by the series-mixing model. At 70°C, a constant value of K\ — 4800 was determined for grain cores. Ferroelectricity, in terms of Curie-Weiss

352 M. H. FREY et al.
characteristics and direct P-E measurements, was observed for BaTi03
ceramics with decreasing grain size to 40 nm. The results are different from the structural characteristics reported by others for fine "pseudocubic" BaTi03 particles; and the dielectric properties for chemically prepared thin layers. A high value of K' > 2000 was determined for bulk ceramic BaTi03
in this work with a grain size below 100 nm. This value exceeds those previously reported for thin layers of a similar grain size. Thus, concerning the anomalous properties reported for integrated thin-layers, grain size alone should not be considered for the suppression of ferroelectricity and the low values of dielectric constant. Other effects, such as stress and interfacial electrode effects, should be considered for integrated devices. The important effect of an increasing contribution from grain boundaries in nanocrystalline ceramic microstructures is the main reason for the effective dilution in dielectric constant. The grain cores were ferroelectric based upon the K' -T transformational characteristics, Curie-Weiss behavior and P-E hysteresis measurements.
A ckno wledgements
The research was supported by the Basic Energy Sciences Division, U. S. Department of Energy under Grant No. DEFG02-91ER45439, a Fellow- ship from the Fannie and John Hertz Foundation, the New Energy Development Organization of Japan, and an ISHM Educational Founda- tion Student Research Grant. We acknowledge the use of electron microscopy facilities in the Center for Microanalysis of Materials. The assistance of Ms. L. Chang with high-pressure forming is gratefully acknowledged.
References
[1] Frey, M. H. and Payne, D. A. (1993). Appl. Phys. Lett, 63, 2753. [2] Frey, M. H. and Payne, D. A. (1995). Chem. Mater, 7, 123. [3] Frey, M. H. and Payne, D. A. (1996). Phys. Rev. B, 54, 3158. [4] Frey, M. H., Xu, Z., Han, P. and Payne, D. A. (1997). Cer. Trans, (in press). [5] Kniepkamp, H. and Heywang, W. (1954). Zeitschrift für Angewandte Physik, 6, 385-90. [6] Kinoshita, K. and Yamaji, A. (1976). J. Appl. Phys., 47, 371. [7] Arlt, G., Hennings, D. and de With, G. (1985). J. Appl. Phys., 58, 1619. [8] Shaikh, A. S., Vest, R. W. and Vest, G. M. (1989). IEEE Trans. Ultrason., Ferroel. and
Freq. Control, 36, 407. [9] Bruggeman, D. A. G. (1935). Ann. d. Phys., 24, 636.
[10] Buessem, W. R., Cross, L. E. and Goswami, A. K. (1966). /. Am. Ceram. Soc, 49, 33. [11] Yano, Y., Iijima, K., Daitoh, Y., Terashima, T., Bando, Y., Watanabe, Y., Kasatani, H.
and Terauchi, H. (1994). /. Appl. Phys., 76, 7833.

GRAIN SIZE EFFECT ON THE DIELECTRIC PROP 353
[12] Uchino, K., Sadanaga, E. and Hirose, T. (1989). J. Am. Ceram. Soc, 72, 1555. [13] Samara, G. A. (1971). Ferroelectrics, 2, 277. [14] Payne, D. A. and Cross, L. E. (1984). in Microstructure and Properties of Ceramic
Materials, Eds. T. S. Yen and J. A. Pask, Science Press, Beijing, 380. [15] Payne, D. A. (1973). Ph.D. Thesis, Pennsylvania State University. [16] Surowiak, Z., Nogas, E., Margolin, A. M., Biryukov, S. V. and Zakharchenko, I. N.
(1991). Ferroelectrics, 115, 21. [17] Xu, Z., Chae, H. K., Frey, M. H. and Payne, D. A. (1992). Mater. Res. Soc. Symp. Proc,
271, 339. [18] Desu, S. B. (1994). Phy's. Stal. Sol. (a), 141, 119.

Ferroetectrics, 1998, Vols. 206-207, pp. 355-363 © 1998 OPA (Overseas Publishers Association) Reprints available directly from the publisher Amsterdam B.V. Published under license Photocopying permitted by license only under the Gordon and Breach Science
Publishers imprint. Printed in India.
ELASTIC PROPERTY CHARACTERIZATION IN THIN SAMPLES OF SUB-WAVELENGTH
IN THICKNESS
WENWU CAO
Department of Mathematics and Materials Research Laboratory, The Pennsylvania State University, University Park, PA 16802
(Received 24 February 1997)
A conflict exists in ultrasonic measurements between the resolution which requires higher frequency, and the penetration depth which requires long wavelength. Traditional pulse-echo method for elastic property measurements fails when the sample becomes too thin to allow the separation of repeated echoes. A data processing technique is described here which may provide a solution to this conflict. Elastic properties were successfully measured in samples as thin as 5% of the wavelength A.
Keywords: Ultrasonic; thin layers; sub-wavelength; high resolution; penetration depth
INTRODUCTION
One of the most powerful techniques for elastic property characterization is ultrasonic method. The pulse-echo technique[1_4] has been well developed and widely used in characterizing solid materials. Sound velocity, which directly reflect the elastic property, can be measured through the time delay between consecutive echoes. Ultrasound is also a major tool in medical diagnosis in which the elastic properties are known and the pulse-echo pattern is used to form the imaging of an object inside a body. Because pulse-echo technique is to send a tone-burst ultrasonic signal into the structure and measure the time lagging between consecutive echoes, its resolution is limited by the pulse-width. Using a good broadband short ringdown transducer, one can achieve an axial resolution of 1-2A, where A is the wavelength. Both transmission and reflection mode operations in
355

356 W. CAO
ultrasonic measurements will produce similar echo patterns but different amplitudes depending on the acoustic impedance matching between the medium and the sample. A pair of parallel surfaces of the sample will serve as the reflection planes so that a series of echoes will be generated as shown in Figure 1. The time delay between the adjacent echoes is the time for an acoustic pulse to go through the sample one round trip.
It is hard to achieve sub-wavelength resolution as one can imagine from Figure 1. The pulse separation reflects the sample thickness. If the sample is too thin, these consecutive echoes will overlap to produce a global profile. As demonstrated in Figure 2, when the delay time of two consecutive echoes is less than the ringdown time of the transducer, they cannot be distinguished. The overlapping problem becomes worse for materials with low attenuation because the third echo, the fourth echo, and so on, will all contribute to the measured echo profile, making the measurement impossible.
Although the resolution of ultrasonic technique can be increased through increasing operating frequency, the attenuation increases even faster with frequency. Generally speaking, the attenuation is proportional to fß, with 1 < ß < 2 for ordinary materials and ß > 2 for lossy materials. In other words, higher frequency ultrasonic waves would have much shallower penetration depth, which makes the detection of bonding layer or any imbedded thin object almost impossible using ultrasonic technique, because low frequency waves do not see it while high frequency signals cannot penetrate the structure.
0.6
0.4 1
,..,,,,, | ' ' 1 '
-
0.2 -
0 , 1... „„...,... •_
7 - "o
E < -0.2 x -
\ . -0.4 First Through Echo "
-0.6 -_
n a • i
-
20 25 30 35 4 Time(^ s)
FIGURE 1 The echoes caused by the repeated reflections inside the sample. The signal is obtained from a through mode operation using a 2 MHz center frequency broadband trans- ducer.

ELASTIC PROPERTY IN THIN SAMPLES 357
FIGURE 2 Echo overlapping in a thin sample, (a) The two consecutive echoes if not interfere with each other, (b) The actually observed overlapped signal.
The challenge is how to achieve high resolution and deep penetration at the same time. Obviously, the only way to address this problem is to use low frequency signal and achieve sub-wavelength resolution. A method is described in this paper which can be used to measure samples as thin as 5% of A.
DATA PROCESSING SCHEME
For a thin sample, the received signal from transmission ultrasonic measurement will be a mixture of consecutive transmitted signals due to the multiple reflections within the sample. If we do not consider the attenuation of the sample, the received signal, x(r, t), can be written in terms of the input signal function s(r, t) in the following form:
x(r,t) = T2lTu J^Rlisft i=0
(r - I) (2z + 1)/ (1)
where T2\ and Tl2 are the transmission coefficients from the medium to the sample and from the sample to the medium, respectively, i?2i is the reflection coefficient from sample to the medium, / is the thickness of the sample, Vm
and Vs are the sound velocities of the medium and the sample, respectively. Although the multi-reflections within the sample are not desired in the
traditional ultrasonic measurement, such multi-reflections do actually carry

358 W. CAO
strong signature of the sample. One can obtain the desired information using more elaborate signal processing schemes.
A simple and direct way to abstract the time of flight inside the sample is to find the response function, h{t), so that the transmitted singal x(t) becomes the convolution of the input singal s(i) and h(t),
/oo
h{r)s{t - r)dT ■CO
(2)
For simplicity, we have shifted the time reference and set the space variable to be zero at the exit surface of the sample.
For an ideal case, the response function of the sample is simply a series of
^-functions:
oo
h{t) = ^2AJ6(t-At), (3)
where
A = T2iTl2Ru, At = y- (4)
In principle, if one can derive the response function h(t) from the measured signals, the round trip time At for wave to travel inside the sample can be easily obtained from the peak separation of the ^-function series. Unfortunately, there is no easy way to get "clean" data in practical measurements. All the signals are convoluted by instrumental response functions and being added to certain level of noises, both acoustically and
electronically. In transmission mode operation, the input signal s(t) and the transmitted
signal x(t) can be obtained by removing and placing the sample in the acoustic pathway, respectively. The experiementally observed signals (quantities with an over-bar) are not clean and may be written in the following forms:
a) Observed input signal:
4t)= com [g(t),s(t)}+ns(t) (5)
b) Observed transmitted signal:
xji) = conv[gO), conv [h(t), s{t)}] + nx(t) (6)

ELASTIC PROPERTY IN THIN SAMPLES 359
where g{t) is the response function of the experimental set-up, ns(t) and nx(t) represent the noises that are being added to the true signals.
In order to develop a universal method, we like to avoid the task of having to characterize each instrument for its response function g(t). This can be done by defining a new function k(t) to be the modified signal input,
k(t) = com[g(t),s(t)], (7)
and utilizing the property of convolution integral:
com[g{t),conv[h(t),s(t)]]=conv[h(t),com[g(t),s(t)]] (8)
Hence, the input and transmitted signals become
IfJ) = k(t) + ns(t) (9)
x(t) = conv[h(t),k(t)] + nx(t) (10)
The response function can be formally written in the frequency domain as[5]:
X(f),,n X{f)K*{f) H(f)=-pr7l<P(f)= rJ,„* M (n)
where </>(/) is a Weiner optimal filtering factor [5] which can be written in terms of the power spectra of x(t) and nx(t).
In order to derive the power spectrum of the noise nx(t), we can perform multiple sampling, i.e., taking the average of m\ times measurements of the transmitted signal (x(t)) and then taking another average of m2 times measurements (x(t)) , with m2>m\. It can be shown that the noise power spectrum may be replaced by these averages and the Weiner optimal filtering factor (/)(f) can be written as the following[6],
m\rri2 +W = 1-7 ^7=2 (l*»i(/)r - \^2(f)\z) (i2)
(mi -m2)\X(f)\
From Eqs. (11) and (12), the spectrum of the sample response function h(t) is given by
H{f)=X^wTm (13)
Then the response function of the specimen, h(t), can be obtained from H(f) using inverse Fourier Transform. We have implemented the FFT

360 W. CAO
algorithm in the data processing program so that the analysis is almost real
time.
RESULTS
This signal processing scheme described above has been applied to a set of brass shims purchased from Precision Brand, Downers Grove, Illinois. The thickness of the shims ranges from 0.004"-0.025". Figures 3 and 4 show the measurement results on a 0.004" and a 0.008" thick brass shims, respectively. Figures 3(a) and 4(a) are the input and transmitted signals, which were
o > <D
TJ 3 *^ Q. E <
1
0.8
0.6
0.4
0.2
0
-0.2
-0.4
-0.6
. ' iii! i i , i | i i i i i ' ' ' .
; i Input Signal (a)
-i
: Received Signal ~:
-
. , , I
f\j>^= ]
V. i . ,
-_
500 1000 1500 2000 Time (ns)
2500
100
Time (ns) 200
FIGURE 3 (a) The input signal to the sample and the received signal after the pulse went through the sample and (b) The response function derived from (a). The sample thickness is 0.004".

ELASTIC PROPERTY IN THIN SAMPLES 361
o > 55 -o 3
"5. E <
1
0.8
0.6 p
0.4 F-
0.2
0
-0.2
-0.4
-0.6
T~~
n Input Signal
/'/ (a)
1=0.008"
Received Signal
500 1000 1500 2000 2500
Time (ns)
o c 3 •*— 03 10 c o Q. (0 <D
DC
0 50 100 150 200 250 300 350 400
Time (ns)
FIGURE 4 (a) The input signal to the sample and the received signal after the pulse went through the sample and (b) The response function derived from (a). The sample thickness is 0.008".
observed independently. The time shift between the input and the transmitted signals cannot be measured directly because the time difference is too small. Figures 3(b) and 4(b) are the calculated corresponding response functions for the two cases. The separation between the peaks of the response function is the time lagging between consecutive reflections inside the sample.
The sound velocity calculated using time difference between the peaks of the response function is given in Table I. One can see that the measurements are very consistent and accurate. The average sound velocity is 4480.4 m/s which gives a value for the elastic constant cu = 17.0xl010 N/m2. No obvious change of the elastic property with size was observed in this thickness range as shown in Table I.

362 W. CAO
TABLE I Longitudinal velocity and elastic constant cu for brass shims. (70% Brass, 30% Zinc; p = 8.4697 g/cm3) ^
Sample Thickness (inch) Longitudinal Velocity (mis) C)i(1010JV/M )
4431.8 16.635 4519.6 17.301
0.004" °-005" .,„„, 0 006" 4456.1 16.81»
4490.6 17.080 4526.7 17.355 4457 7 16.830
0.008" 0.015" 0.025"
During measurements, the number of observations used for noise spectrum calculation are: mx = 5 and m2=10. Minor changes were found when the averages were taken at different ml and m2 number of observations but is well within the experimental error. Using the center frequency of the transducer as a measure, the 0.004" thick sample is less than 5% of the
wavelength A = 2.24 mm. As shown in Figures 3 and 4 the response function is far from a ^-function
series, however, one can clearly distinguish the peak positions. It is found that the response function becomes less sensitive as the thickness decreases. The peaks of the response function are sharper in the case of the 0.008" thick sample than in that of the 0.004" thick sample as shown in Figures 3 and 4. Using the 2 MHz transducer, the method reaches its limit at 0.003". All the peaks got smeared out when the sample becomes thinner than 0.002".
SUMMARY AND CONCLUSIONS
A data processing scheme is introduced here to extend the resolution of the ultrasonic pulse-echo method. Using the filtered response function and a 2 MHz broadband transducer, the sound velocity was measured for a set of brass samples and the thinnest sample is less than 5% A of the center fre- quency. This result is very encouraging since the sub-wavelength resolution is the only way to resolve the intrinsic conflict of high resolution and deep penetration in ultrasonic technology. This technique may be used to study the bonding layer in composite structures and interfaces. Further extension of the method to higher frequencies and multi-layer structure is under investigation.
A cknowledgment
This research is sponsored by the Office of Naval Research under grant
#N00014-96-l-1173.

ELASTIC PROPERTY IN THIN SAMPLES 363
References
[1] Papadakis, E. P. (1976). "Ultrasonic Velocity and Attenuation: Measurement Methods with Scientific and Industrial Applications", in Physical Acoustics Principles and Methods, XII, Edited by W. P. Mason and R. N. Thurston (Academic, New York), 211-31 A.
[2] Bolef, D. I. and Menes, M. (1960). "Measurement of Elastic Constants of RbBr, Rbi, CsBr and Csl by an Ultrasonic C. W. Resonance Tecnhique", J. Appl. Phys., 31, 1010-1017.
[3] Mcskimin, H. L. (1961). "Pulse Superposition Method for Measuring the Velocity of Sound in Solids", /. Acoust. Soc. Am., 33, 12-16.
[4] Cao, W. and Barsch, G. R. (1988). "Elastic Constants of KMnF3 as Functions of Temperature and Pressure", Phys. Rev. B, 38, 7947-7958.
[5] Press, W. H., Flannery, B. P., Saul A., Teukolsky and Vetterling, W. T. (1986). in Numerical Recipies, University Press.
[6] Cao, W. and Yuan, X. (1998). "A Signal Processing Scheme for Sound Velocity Measurement in Thin Samples", to be published.

Ferroelectrks, 1998, Vols. 206-207, pp. 365-379 Reprints available directly from the publisher Photocopying permitted by license only
i 1998 OPA (Overseas Publishers Association) Amsterdam B.V. Published under license
under the Gordon and Breach Science Publishers imprint.
Printed in India.
FUTURE ISSUES IN FERROELECTRIC MINIATURIZATION
J. F. SCOTT
School of Physics, University of New South Wales, Sydney 2052, Australia
(Received 24 February 1997; In final form 18 April 1997)
A status report is given on the physical limitations imposed by both thickness and cross- sectional area in ferroelectric thin films in real devices, particularly random-access computer memories (RAMs).
Keywords: Ferroelectric miniaturization; polarization; thin films
1. INTRODUCTION
There are two kinds of thermal stability to worry about in ferroelectrics: The first is the stability of the net polarization with regard to depolarization fields at the surfaces. This kind of stability or instability has worried scientists for many years and was a source of concern in the effort to commercialize ferroelectric thin films (in thin films surface effects are of course greater than in bulk and may dominate electrical behaviour). The second kind of thermal instability is actual electrical breakdown (shorting) in applied fields. These two kinds of thermal instability are unrelated and will be dealt with separately below.
2. LIMITS IMPOSED BY THICKNESS - THERMAL STABILITY OF FERROELECTRICITY
2.1. Depolarization Instabilities
Much of the early work on depolarization instabilities in ferroelectric thin films was done at IBM. Indeed it is not an exaggeration to say that some of
365

366 J. F. SCOTT
this work sounded the death knell for the 1955-1972 IBM program to make ferroelectric thin-film memories. The work has application to the more general issue of finite-size effects in ferroelectrics, including depolarization effects in very small (submicron) particles, as well as films. But in the particular case of ferroelectric thin films Batra and Silverman[1] were specific enough to make a numerical calculation: In triglycine sulfate (a typical ferroelectric) films thinner than 400 nm on semiconductor substrates cannot be ferroelectric! They are unstable against depolarization fields. The history of theoretical work in this sub-discipline is interesting. Based on the analogous work in thin- film magnets by Mills [2] and in particular the mean-field formulation by Lubensky and Rubin [3], Tilley and Zeks developed a very detailed theory [4], culminating with recent numerical calculation[5] that includes Thomas-Fermi screening in the metal electrode carefully. The key equation in this work is given below in Eq. (1). The critical term is dP/dz, the dependence of polarization upon depth in the film. This equation is solved via integration by parts to yield an Euler-Lagrange equation which, with suitable boundary conditions, generates P(z) and transition temperatures versus film thickness.
Note that a qualitative feature of the theory is the result that the difference in film and bulk Curie temperatures is proportional to reciprocal
film thickness \jd.
F/A =f ({eW/dzf + (1 + t)P2 - 2P4 + P6}dz+[fe/(2S)](P2+ + Pi)
(1)
where F/A is the free energy per unit surface area of the film; P, a polarization scaled to the bulk polarization; *, reduced temperature (T- T^k)/T*u]k; £, the correlation length in bulk; and/, a free energy scale. P± is the surface charge at top and bottom of the film (assumed to be a delta-function). The term S can be positive or negative and characterizes the material. There are no microscopic theories for the sign or magnitude of 6; it is an empirical, phenomenological parameter of the theory.
Tilley calculates a minimum ferroelectric film thickness of 90 nm for typical "strong" ferroelectric (with Curie constant C such as that in barium titanate). And even more recent work by S. Li et al. at Argonne lowers the minimum thickness further to ca. 50 nm by incorporating anisotropy in the theory and considering the first-order characteristics of Eq. (1) carefully. Thus, over the past 25 years the theoretical value for minimum ferroelectric film thickness has decreased an order of magnitude. Unfortunately for the theoreticians, the experimental value has dropped even more rapidly! The

FUTURE ISSUES IN MINIATURIZATION 367
first submicron ferroelectric thin films were probably made by Mike Sayer (approximately 300 nm of lead zirconate titanate in 1984). But by 1986 one could do 100 nm with relative ease. In 1992 both Symetrix and McDonnell- Douglas achieved 25 nm in PZT via solgel spin-on deposition. And in 1995 Fridkin's group in Moscow achieved 15 nm in PVF2 via Langmuir-Blodgett techniques, with full ferroelectric switching demonstrated in each case.
The result is that as of this writing no one knows how thin a ferroelectric film can be made and still have switchable, apparently stable polarization. Perhaps 5 nm? Most recently J. Karasawa et al. [Integ. Ferroelec, 1997] find 6 nm in PbTi03 spectroscopically. Similar uncertainty affects esti- mates for ferroelectricity in small spherical particles. In that case there is a further issue of strain ("surface tension") and density, neither of which is truly independent of particle size and both of which complicate inferences. Most recently T. Yamamoto [Integ. Ferroelec, 1997] calculates 2.5 nm in
PZT. A related problem is the stability of individual domains. Suppose a theory
tells us that ferroelectrics are unstable at thicknesses less than, say, 50 nm. What does that mean? The thermodynamic ground state of a bulk ferroelectric is a single domain with no walls. If a theory says that this is unstable at thicknesses less than 50 nm, what then is stable? A paraelectric state? Or a state with many very small domains? And does stable mean on a time-scale of 109 years or 10~9 seconds? (Quartz is not a thermodynamically stable form of silicon dioxide, but it lasts a very long time). Progress in addressing this issue has been made by Roytburd in a series of papers spanning two decades, who showed that the stable domain size gets smaller as film thickness in ferroelectrics decreases, and by Erbil's group at Georgia Tech, who did detailed numerical calculations[6] based upon surface strain. Rather pretty data on domain size versus grain size in PZT ceramics were published by Huffman et al.[7]. They found that grains of diameter 0.6 to 1.6 microns had domains 0.05-0.09 microns long by 0.02-0.07 microns wide, whereas grains between 0.2 and 0.6 microns in size have much smaller domains, typically 0.035 x 0.015 microns (35 x 15 nm). This experimental dependence of domain size upon grain size is somewhat faster than the square-root dependence expected from theoretical work but in qualitative agreement. Since ferroelectric memory switching speed is apt to depend significantly on domain size, this indicates that very fine-grained ceramic films will probably make superior devices in comparison with large-grain ceramics. Readers' attention is also drawn to the recent work of Tagantsev et al. [8], who relate depolarization effects (and hence film thickness) to fatigue and show that they may have a different sign than effects due to

368 J. F. SCOTT
charge depletion near ferroelectric interfaces or surfaces; see also Yoo and Desu [9]. We note that theories of magnetic domains cannot be borrowed for ferroelectrics; domain walls in magnets are very wide, whereas those in ferroelectrics can be as short as a few atoms.
Besides being of general interest from the point of view of overall ferroelectric stability, the theory of Tilley and of Tilley and Zeks is useful in that it displays explicitly the non-uniform electrical polarization P(z) as a function of distance z into the film. In simple textbook theories P is independent of z; but no realistic theory supports that. The dependence of P{z) can be complicated and P(T) for ferroelectrics whose phase transitions are first-order (almost all real ferroelectric crystals); in this case, as shown by Duiker, Scott et al.[10], decreasing film thickness (at a constant temperature, such as room temperature) can produce a situation in which the surface orders but the interior of the film does not; this requires a threshold for a parameter in the theory.
2.2. Thermal Breakdown
Dielectric breakdown in ferroelectric thin films is in general not very different from melting in metals (impulse or dc thermal) or spark discharge in gases (avalanche). Truly electronic breakdown processes typically occur in dielectrics only at cryogenic temperatures and in materials with very low electrical conduction (compared to thermal conduction), such as mica. Thus a description of breakdown processes in oxide ferroelectrics will be similar to that given for a wide range of solids, as discussed in O'Dwyer's text. The basic equation for thermal failure is given below in Eq. (2).
CvdT/dt - V • (KV T) = aE2B (2)
where C is the specific heat; T, temperature; t, time; K, the thermal conductivity; a, the electrical conductivity; and EB, the field required to initiate breakdown.
The terms "impulse thermal" and "dc thermal" are used to describe situations in which the second term or the first, respectively, can be ignored in Eq. (2). For the case of exponential electrical conduction
a{T) = aoexvi-Q/kT) (3)
(which is known from Scott, Ross et al. [11] to be dominant in PZT or BST above 500 kV/cm) this yields in the impulse approximation appropriate to

FUTURE ISSUES IN MINIATURIZATION 369
fast rise-times tc of applied voltages, an exact analytic expression for break- down field
EB[(3CvK)/(a0$tc)]l/2Texp($/2kT) (4)
where k is Boltzmann's constant. For known ceramic PZT parameters Eq. (4) yields a theoretical maximum
breakdown field of 8 MV/cm, which is within a factor of two agreement with the highest experimental numbers reported to date of 14 MV/cm.
Dielectric breakdown in ferroelectrics is not purely thermal; electronic properties of both the dielectric film and the electrode play a key role in quantitative relationships. In this sense the phenomenon is best described as avalanche - electrically initiated, followed by thermal run-away. A rather good qualitative understanding is provided by Eq. (5) below [12]:
eEB\ = chv (5)
Here e is the electron charge; A, the mean-free path of electrons injected from the cathode into the ferroelectric; c, an empirical constant of order unity, hv is in Von Hippel's theory a quantized but unspecified energy; Scott, Azuma et al. [13] have identified hv with the constant potential of the ferroelectric-electrode interface, so that the combined Von Hippel-Scott equation can be rewritten as
eEBX = ($M - $FE) (6)
where i>M,FE are respectively the metal and ferroelectric work functions. For PZT and BST it is known [14] that $FE should be replaced by $FE<, where the prime designates a n impurity level (surface donor state). (Note that Eq. (6) must be modified where $ or $' of the ferroelectric is greater than that of the metal electrode).
Dey et al. have shown [15] that doping PLT/Pt films with Ni, Cr or Ti produces ohmic contacts, whereas Pt, Au, or Ag forms Schottky contacts; this shows the role of traps very clearly in controlling the electrical properties of ferroelectric thin films and that simple band diagrams cannot explain such behaviour. This conclusion was also emphasized by Scott [14]; see Wouters et al. also [16l
Eq. (6) does a good job in fitting the breakdown field data of PZT on a variety of metal electrodes. The slope is given by the mean-free path (c assumed equal to unity), which is about 0.1 nm in PZT at ambient temperatures (varying linearly with voltage at low voltages'171). The

370 J- F. SCOTT
intercept yields a trap energy about 0.85 eV below the known PZT work function. This is due to surface traps (donors) and is discussed by Scott, Galt et al.[18]. Note that sub-monolayer coverage of oxygen on the Pt [111] electrode surface significantly increases the electrode work function. This will occur in PZT/Pt or BST/Pt devices as deposited, but will increase (worsen) with time and voltage cycling as the oxygen vacancy concentration
near the cathode increases. The electronic-initiation avalanche model predicts a large variance in
the breakdown time (but not the breakdown field); this is confirmed
experimentally. Earlier attempts to verify Eq. (6) on iron and aluminum electrodes yielded
very good results for breakdown in gases [19] but very bad results for
breakdown in liquids [20]. It is important in making such tests of Eq. (6) that rather old values be
used for the metal work functions, such as 2.98 eV for Al and 3.67 eV for Ag. More modern values are for clean surfaces in heated, outgassed' conditions; but that does not correspond to actual ferroelectric memory deposition conditions. It is known [21] that a single atomic layer of oxygen on a Pt [111] surface raises its work function by 0.3 eV. This not only affects the testing of Eq. (6) greatly, but it is probably a primary influence in increasing electrical conductivity in fatigued ferroelectric films, where repetitive cycling generates oxygen vacancies near the cathode and oxygen ions at the anode. Oxide electrodes, including high-temperature super- conductor oxides and ruthenium or iridium oxide on BST and on PZT
greatly ameliorate this process [22]. In addition to the dependence upon electrode work function, thermal
breakdown in ferroelectric films depends upon temperature T, capacitor area A, film thickness d, and ramp rate \jtc in important ways. These are
described below. Thickness dependence: Various models of breakdown (d.c. thermal, im-
pulse thermal, avalanche, and the defect theory of Gerson and Marshall[23]
that involves connected voids) have quite different and specific predictions for the dependence of EB(d). Impulse thermal theory is rigorously independent of d. The slow logarithmic dependence of breakdown field on l/dpredicted by avalanche theory best fits the PZT data. The dependence on capacitor area is best described by Gerson-Marshall linked-defect conduc- tion path theory [24]. The dependence upon ramp rate [13] fits impulse thermal models. In summary, no simple theory describes all facets of breakdown in PZT (or BST) well. The best model is probably that of

FUTURE ISSUES IN MINIATURIZATION 371
electronic initiation (avalanche) followed by impulse thermal processes that involve grain boundaries or other connected defects.
It is important that dielectric breakdown in ferroelectric thin films occurs at specific current density thresholds / and not at specific voltage or field thresholds. This was first shown in strontium titanate and BST by Waser and Klee [25], with a rather uniform breakdown resistivity of a few Mil-cm. This implies that independent of the exact microscopic conduction mechanism (Schottky, Poole-Frenkel, Fowler-Nordheim, ionic), failure will occur at a value of J that produces thermal run-away, i.e., the onset of impulse thermal breakdown. This observation has caused a great deal of research on understanding and minimizing leakage current in ferroelectric thin film devices. In addition to producing dielectric breakdown, leakage current produces undesirable heating. In a DRAM a realistic estimate of maximum tolerable leakage current is 100 nA/cm2 across a 100 nm-thick film [26]. Understanding how to achieve this with different ferroelectric film materials and electrodes is important. BST is a simple case: The leakage is Schottky-dominated up to about 400 kV/cm [27]; but by varying processing conditions the "knee" in the J(V) curve can be pushed out from 1 V to 3 V, above which Fowler-Nordheim tunneling becomes significant. This was first shown by Scott, Azuma et al. and studied is greater detail as a function of temperature and field by Waser et al. In PLT Lee et al. found voltage regimes very similar to those revealed in BST by Scott, Azuma et al. in PLT Schottky emission is dominant between 2 and 7 V (ca. 200 nm thick), with Fowler-Nordheim dominant above 16 V.
Scott, Azuma et al. verified both the temperature dependence and voltage dependence in the Schottky regime:
log(//r2) = const, x Vl/2 (7)
below 7 V and the voltage dependence in the Fowler-Nordheim regime above,
log(//K2) = const, x V~x (8)
It is more difficult to discriminate between Schottky and Poole-Frenkel emission. This is important for our physical understanding, since Poole- Frenkel is a bulk effect, whereas Schottky tunneling is surface-limited; but the T- and F-dependences are the same for the two processes, which differ by a factor of two in absolute magnitude. Li and Lu[28] were able to show in barium titanate films that either process can dominate, depending upon whether surface trap density exceeded a certain threshold value. In our cases

372 J. F. SCOTT
of interest we are able to show that Schottky emission dominates, not Poole- Frenkel, by the asymmetry of conduction through top and bottom electrodes of different material. Such studies show that in BST and PZT the current carriers are only injected electrons (no holes) despite the fact that bulk BST and PZT are/?-type. The probable band structure for BST or PZT on Pt electrodes is p-type film with an «-type inversion layer at the electrode interface. This model is based upon the macroscopic analysis in Eq. (6) and the microscopic evidence for «-type regions of oxygen vacancy concentra- tion given by Scott, Zuleeg et al. [29].
Although electrons injected from the cathode are the primary charge carriers in BST and PZT, holes may play an important role at breakdown. There are strong indications of "double injection" (hole injection from anode and simultaneous electron injection from cathode) in strontium bismuth tantalate-niobate, and in more general silicon-chip failure mechanisms (Groeseneken et al. [30]). For pure barium titanate it is known that double injection occurs only under optical illumination. In SBT the possible occurrence of double injection is signaled both by the sharp transition from a quadratic to cubic J(V) dependence and also by an apparent negative differential resistivity and hysteretic J(V) behaviour. The latter is probably due to quasi-reversible breakdown at grain boundaries.
3. LIMITS IMPOSED BY CAPACITOR AREA - INTRINSIC SIZE EFFECTS (SCALING TO SUBMICRON SIZE)
Reduction in switched charge for finite-area capacitors is a well-known problem in electrostatics. Fringing fields have significant effects in switched charge reduction. An important parameter is aspect ratio. For a circular disk of diameter 2 microns and thickness 200 nm (aspect ratio of 10:1) the fringing field produces about a 7% reduction in switched charge. The correction increases nonlinearly (ca. 23% at 5:1, depending upon exact geometry). Note that the latest NEC devices have a square cell with length 0.7 microns and an aspect ratio of about 5:1.
Unfortunately the conformal transformations utilized to estimate numerically the corrections to two-dimensional finite-size capacitors fail for low aspect ratios. In this case one is tempted to solve (on a computer) the full three-dimensional Laplace equation. However, Laplace's equation is not valid in the time-dependent switching case of interest (except for a few special cases, such as TEM waves in coaxial lines, Laplace's equation cannot be used in time-varying situations). Thus, the general problem of switching

FUTURE ISSUES IN MINIATURIZATION 373
in a ferroelectric thin-film capacitor whose area is comparable to the square of its thickness is tricky.
Semiquantitative results can be seen from the simple calculation that follows: For a finite slab of width a and length b in the xy-plane, one obtains the charge density on the capacitor top plate, assuming a very thin dielectric film, as
p(x)=iree0{h(ex-l)]-1 (9)
from which the total switched charge is obtained by integration over x (the infinite charge density x = 0 arises from the assumption of vanishingly small film thickness), whence
Q = b\og(ea - I) - ab. (10)
In the limit of small a this yields
Q^bloga, (11)"
so that switched charge Q becomes proportional not to a, but to log a. This is shown to agree with the recent experiments of Amanuma et al. [31]. Although not mentioned in their publications, the switched charge measured by Amanuma et al. on submicron SBT capacitors was for "virgin" runs of previously unswitched films. Under these circumstances it seems reasonable that some of the lines of force in the capacitors might terminate on sidewalls and not on the anode and cathode, especially at low, sub-saturation voltages (ca. 2 V). At larger fields of 5 V (250 kV/cm) these lines of force might straighten out.
These problems of scaling with capacitor area are much more severe in PZT than in SBT; Faure et al. report[32] that coercive field increases from 1.0 V to 4.0 V in 300 nm thick PZT as the capacitor area is reduced down to 80 um2.
4. LIMITS IMPOSED BY ELECTRODE INTERFACE - RECENT RESULTS ON STRONTIUM BISMUTH TANTALATE (SBT)
SBT, a layer-structure perovskite, has become the material of choice for many integrated ferroelectric thin-film applications for three primary reasons: 1) It exhibits negligible fatigue; 2) It has low leakage currents (typically lOOx less than in PZT of the same thickness and electrodes); and

374 J. F. SCOTT
3) It can be prepared in extremely thin films without loss of bulk characteristics. In the latter regard, the dielectric constant of PZT decreases from 1300 to 100-200 when made in 45 nm films, but in SBT the dielectric constant remains near 600 at all measured thicknesses d. This suggests that the damage layer near the electrode interface is very thin in SBT, possibly because of the growth of Bi-oxide layers on the metal electrode rather than an initial AB03 perovskite block.
It was recently observed by Tachiki et al.[33] that layer structure perovskites of form M'M2a Bi2fe 03c (here M' is an alkaline earth or lead; T is Ti, Ta, or Nb) are ferroelectric for c-odd, but non-ferroelectric for c- even. There are many crystals of this structure, ranging from 09, On, 015, ..., 027 (c = 3,4, ...,9). The probable reason the c-even series are non- ferroelectric is that they are cell-doubled antiferroelectrics. This is evident initially for SrBi4Ti4Oi5 superlattice X-ray diffraction lines published by Scott and Ross and in the more general cases from the detailed study by I. M. Reaney (Euroceram V. Aveiro, Portugal, 5 Sept. 1996).
At this stage SBT films have been produced via sol-gel spin-on, sputtering, MOD "mist" deposition, and a "flash" CVD process in which a relatively viscous, low vapour-pressure liquid is evaporated just before deposition (Isobe et al; Desu et al). The only real limitation in the use of SBT is that its processing temperature is rather high (ca. 800°C) which prevents the use of certain metallization (e.g., aluminum). Below we discuss new experimental data concerning the structure of its fluorite precursor phase and the question of what happens to the relatively volatile bismuth during processing.
When ferroelectric PZT is processed, the material goes through three phases: The initial deposition is in the form of an amorphous film. At a few hundred degrees, this film converts to a pyrochlore phase that is not ferroelectric under ambient conditions. Either a furnace anneal for 30-90 minutes or RTP (rapid thermal processing) for 90 seconds up to ca. 800° C transforms the pyrochlore to the desired simple perovskite structure. The lowest temperature at which the pyrochlore-perovskite conversion can be complete is 450°C (Wersing [34]).
Similarly, SBT is put down as an amorphous film and converted at low temperatures to a defective fluorite phase. The fact that the fluorite phase is defective was developed in great detail by Zhou[35]. This quasi-cubic phase has two of the eight nearest neighbor oxygens for each Ta-ion missing, so that the resulting coordination is a six-fold octahedron, rather that eight- fold (perfect fluorite structure). Rodriguez et al. suggested [36] that the Sr, Bi, and Ta (and/or Nb) ions all randomly occupy the Ta-sites in this fluorite phase, despite the fact that they have very different ionic radii. This hypothesis is confirmed in detail by our EXAFS data, obtained on the

FUTURE ISSUES IN MINIATURIZATION 375
Tsukuba synchrotron source (Hartmann, Gutleben, Scott et al. [37]). The Ta—O ionic separation is exactly the same, 0.195 ±0.005 nm, in both the fiuorite phase and the Aurivillius layer-structure phase. That explains why the transformation from fiuorite to layer-structure phase is so easy: The coordination number and bond lengths are identical in the two phases, so that a rigid rotation of Ta06 octahedra plus stacking of bismuth oxide layers brings one phase into the other. In this respect we note that stable phases of SBT do not require precise positioning of the bismuth oxide layers; defects involving missing AB03 blocks are common.
The second question concerns the location of Bi in SBT. It is known that the volatile bismuth is often deficient in as-grown films. It diffuses into both top and bottom Pt electrodes. This XPS depth profile reveals that it passes entirely through 300 nm of Pt to "wet" the top surface of the top electrode. This surface Bi concentration cannot have come entirely from sputtering chamber contamination, because it is 30% elemental metallic bismuth, whereas only fully oxidized Bi would be expected from chamber contamination. This interpretation is also supported by evidence in the Pt bottom electrode, which is unlikely to arise from any Bi contamination in the Pt sputtering system. These data would suggest that a barrier layer on the Pt electrodes to prevent Bi diffusion might be considered. We note that severe reactions between bismuth oxide and Pt electrodes are well known in the earlier literature'38'391, and that Bi diffusion from SBT through a thick Pt electrode into a Ta (not Ti) adhesion layer on the Si substrate was first demonstrated by Atsuki et al, using Auger electron spectroscopy [40].
The phase diagram for Bi-Pt given by Massalski and others shows that two intermetallic compounds readily form: BiPt and Bi2 Pt. BiPt melts at 765 C; Bi2 Pt, at 660 C. Thus both could be produced during rapid-thermal processing (RTP) or furnace anneal at ca. 800 C. Most important is the fact that Bi2 Pt coexists with the liquid Bi/Pt phase down to 270 C. This implies extreme reactivity of Bi on Pt at very modest temperatures.
Depth profiles of this sort are particularly good ways to analyze interdiffusion. Earlier it had been noted [41'42] that heavy-ion beam scattering could be used to probe diffusion of Sr and oxygen in BST. The results of the Iodine-124 heavy-ion beam scattering on SBT are confirmed by XPS data. It is important that such depth studies be made on films without rough interfaces; the typical SBT/Pt interface is smooth, so that heavy-ion scattering depth profiles are meaningful. Even light ions such as residual carbon from the organic carriers used in MOD deposition of BST gave a characteristic signature, revealing typically 200 ppm residue [41]. A lateral XPS scan across the surface area of these BST capacitors revealed

376 J. F. SCOTT
that the carbon comes in lumps and is not uniformly distributed [43]. These lumps are reminiscent of the Pt hillocks on PZT/Pt/Ti that arise from the electro-chemistry of Ti (put down as an adhesion layer since otherwise Pt mechanically peels off Si) attracting oxygen through Pt to form rutile. Both hillocks and blisters were independently discovered [44' 45] in 1991. They are eliminated simply by making the Pt thicker and carefully annealing it. More recent studies of these blisters is given by Spierings et al. [46l
The most recent EXAFS data from Tsukuba [Hartmann, Scott et al, unpublished] show that the oxygen, tantalum, and total density of states, n(E) versus E, agree very well with theoretical calculations of J. Robertson et al. [Appl. Phys. Lett., 69, 1704 (1996)], but the Bi experimental peak is narrower than theoretically predicted and at slightly lower energy.
5. LIMITS IMPOSED BY GRAIN SIZE - SWITCHING IN THIN FILMS
5.1. Stadler Model
Through the 1950s and 1960s a switching model was in general use for ferroelectrics that assumed three steps: In homogeneous nucleation of domains at defect sites, primarily at the electrode-ferroelectric interface; forward-growth of needle-like domains parallel and antiparallel to the applied field until they transverse the ferroelectric from cathode-anode; sideways growth of these domains until they fill the complete volume of the ferroelectric. Experimental switching current data J{i) were modeled using this scenario with three fitting parameters: a critical radius for nucleating domains, above which forward growth began; a single relaxation or growth time; and the spontaneous polarization. A good example of switching currents J(t) fitted to this model is given by Araujo et al.[47]. It is found that the rate-limiting time is different in different ferroelectric materials; in GASH (guanadinium aluminum sulfate hexahydrate) it is the nucleation time (hence the radius of the nuceating domains); in perovskite oxides such as barium titanate, it is the sideways growth; in TGS (triglycine sulfate), all three steps are comparable in time. The forward-growth time is easy to estimate, since it is approximately d/v, where d is the film thickness and v, the speed of sound; for a one-micron film, this is approximately 1 ns.
In this model the current transients are fitted to
J(t) = A{Rt - 1 + g-*)exp[-J?(l -Rt + 0.5R2t2 - e~Rt)} (12)

FUTURE ISSUES IN MINIATURIZATION 377
which has the three parameters Ps = A/(4Rk2), a relaxation time l/R, and a dimensionless parameter k related to critical domain nucleation size. For KN03 thin films, Ps = 15 ± 2 mC/cm2; R = 120±10 ns and k = 10.5 ± 0.3 (corresponding to ca. 1.0 nm critical domain radius).
5.2. Ishibashi Model
Ishibashi developed a switching model[48] in which the dimensionality of the system plays a key role, which is not explicit in the preceding theory described above. His theory also has three parameters: The average dimension n of the growing domains (which may be non-integer); a characteristic time t0; and a polarization. Thus, one parameter, Ps, is the same in each model. The current transients are fitted to
/(/) = (2PsAn/to)(t/to)n-lexp[-(t/ton (13)
where A is the capacitor area. This formula fits /(/) data in PZT very well[49]. Independent of the precise
shape of the displacement current transient, Ishibashi's model yields a useful dimensionless parameter: The product of the current density maximum Jm
and the time at which that maximum occurs tm, divided by the polarization Ps, yields a ratio of order 1-2 that is calculated in the theory. Ratios less than one are characteristic of broad, usually asymmetric, J(t), as in TGS or GASH; ratios much greater than unity imply very sharply peaked current transients (as in barium titanate or KNO3). For well-annealed PZT, this ratio is 1.65 ± 0.2, and fitting the J(t) formula above gives an average dimension of domains as 2.5. For Ishibashi's model, n = 2.5 domains predict a ratio of JmtmjPs = 1.646, showing at least excellent self-consistency of the theory.
Most recent papers on /(/) data use the Ishibashi model. By fitting the displacement current transient J(t) in PZT thin films with fine-grained (2r = 40 nm) microstructure, Duiker et al. [10] were able to extract both the bulk nucleation rate (i? = 7xl028s_1m~3) and the average domain wall velocity (v = 440 m/s). As Dalton et al. pointed out originally[50], the Avrami solutions are impossible for finite grains, but the finite-grain model [10]
yields a peak current at a time given by
f(max) = (l/v)[(vD/Rk)mD+l) - rc] (13)
where D is the dimensionbality of domain growth; k = 47r/3 for D = 3; and rc
is a critical nucleation size for a domain.

378 J- F. SCOTT
If we neglect rc in the equation above, we find for PZT an intrinsic switching time, not limited by RC-time constants, of
/(max) = (l/v)[(9v/47ri?)]1/4 = 600 ps, (14)
which agrees rather well with that measured independently [51'52] by Larsen
et al. and by Dey of 900 ps. Equally interesting is Duiker's approximate expression (small-grain limit),
explicitly relating this time to the distance L between domain nucleation points (i.e., the size of domains in fine-grained ceramics). He finds
f(max) = (lnlO)/(ÄL7)). (15)
Equating this expression with the preceding one, we find L=800 nm for D = 3. Since L>r = 40 nm, this implies that Duiker's model is self-consistent for PZT only if domain walls move through grain boundaries (or coherently switch adjacent cells). That is, the domains must be much larger than the grain diameters, by about x20. This is compatible with the atomic force microscopy data of Gruverman et al. [53] on fine-grained PZT films.
References
[1] Batra, I. P. and Silverman, B. D. (1972). Sol. St. Commun., 11, 291. [2] Mills, D. L. (1971). Phys. Rev. B, 3, 3887. [3] Lubensky, T. C. and Rubin, M. H. (1975). Phys. Rev. B, 12, 3885. [4] Tilley, D. R. and Zeks, B. (1984). Sol. St. Commun., 49, 823. [5] Tilley, D. R. (1993). Ferroelectric Ceramics, Eds. N. Setter and E. L. Colla (Birkhauser,
Berne), 163. [6] Kwak, B. S. et al. (1994). Phys. Rev. B, 49, 14865. [7] Huffman, M., Zhu, J. and Al-Jassim, M. M. (1993). Ferroelectrics, 140, 191. [8] Tagantsev, A. K. et al. (1994). Meg. Ferroelec, 4, 1; 6, 309 (1995). [9] Yoo, I. K. and Desu, S. B. (1992). Phys. Stat. Sol. A, 133, 565.
[10] Duiker, H. M. et al. (1990). /. Appl. Phys., 68, 5783. [11] Scott, J. F. et al. (1996). MRS Bull, 21, 33. [12] Von Hippel, A. (1937). Ergeb. exakt Naturwiss., 14, 118 (1935); Z. Phys., 98, 580 (1936);
J. Appl Phys., 8, 815. [13] Scott, J. F. et al. (1994). Meg. Ferroelec, 4, 61. [14] Scott, J. F. (1995). Meg. Ferroelec., 9, 1. [15] Dey, S. K. et al. (1995). Meg. Ferroelec, 8, 715. [16] Wouters, D. J., Wilems, G. J. and Maes, H. E. (1995). Microelectronic Eng., 29, 249. [17] Dekker, A. J. (1954). Phys. Rev., 94, 1179. [18] Scott, J. F. et al. (1995). Meg. Ferroelec, 6, 189. [19] Dakin, T. W. and Berg, D. (1962). Progress in Dielectrics, Eds. J. B. Birks and J. Hart
(Academic Press, New York). 4, 165. [20] Sharbaugh, A. H. and Watson, P. K., Ibid., 4, 226. [21] Nowotny, J. and Sloma, N. (1988). Surface and Near-Surface Chemistry of Oxide Ceramic
Materials, Eds. J. Nowotny and L. C. Dufour (Elsevier, Amsterdam). [22] Robblee, L. S. et al. (1986). MRS Proc, 55, 303.

FUTURE ISSUES IN MINIATURIZATION 379
[23] Gerson, R. and Marshall, T. C. (1959). J. Appl. Phys., 30, 1650. [24] Scott, J. F. (1995). Science and Technology of Electroceramic Thin Films, Eds. O. Auciello
and R. Waser (Kluwer, Dordrecht), 249. [25] Waser, R. and Klee, M. (1992). Meg. Ferroelec, 2, 288. [26] Fazan, P. (1994). Meg. Ferroelec, 4, 247. [27] Scott, J. F. et al. '(1992). Proc. ISAF, '92, Eds. M. Liu et al. (IEEE, Piscataway, NJ), 356. [28] Li, P. and Lu, T. M. (1991). Phys.: Rev. B, 43, 14261. [29] Scott, J. F. et al. (1994). Meg. Ferroelec, 4, 85. [30] Groeseneken, G. et al. (1996). ISSCC Conf., San Diego. [31] Amanuma, K. and Kunio, T. (1996). Jpn. J. Appl. Phys., 35, 5229. [32] Faure, S. P., Gaucher, P. and Ganne, J. P. (1992). MRS Proc, 243, 129. [33] Tachiki, M. et al. (1996). Jpn. J. Appl. Phys., 38, L719. [34] Wersing, W. (1996). Ferroelectrics, 202, 83. [35] Zhou, W. (1992). J. Sol. St. Chem., 101, 1. [36] Rodriguez, M. et al. (1996). Meg. Ferroelec [37] Hartmann, A. J. et al., Ferroelectrics Letters (in press). [38] Garton, G. et al. (1972). /. Crystal Growth, 13, 588. [39] Elwell, D. et al. (1972). Ibid., 16, 67. [40] Atsuki, T. et al. (1995). J. Appl. Phys., 34, 5906. [41] Stannard, W. B. et al. (1995). Microelectronic Eng., 29, 193; Meg. Ferroelec, 9, 245 (1995). [42] Johnston, P. N. et al. (1997). Meg. Ferroelec, 16, 765. [43] Scott, J. F., Hartmann, A. J. et al. (1996). MRS Proc. (in press). [44] Rou, S. H, Kingon, A. I. et al. (1991). MRS Proc, 243, 81. [45] Araujo, C. A., Scott, J. F. et al. (1991). MRS Proc.,230, 277. [46] Spierings, G. A. C. M. et al. (1993). Meg. Ferroelec, 3, 283. [47] Araujo, C. A. et al. (1986). Appl. Phys. Lett., 48, 1439. [48] Ishibashi, Y. (1986). Appl. Phys. Lett., 24, Suppl. 3, 126. [49] Scott, J. F. et al. (1988). J. Appl. Phys., 64, 787. [50] Dalton, N. W., Jacobs, J. T. and Silverman, B. D. (1964). Phys.. Rev., 133A, 1034. [51] Larsen, P. K. et al. (1991). Appl. Phys. Lett., 59, 611. ISIF''92,.Colo. Springs, Co. [52] Dey, S. K., ISIF '92. [53] Gruverman, A. et al. (1996). Appl. Phys. Lett, (in press).

Ferroelectrics, 1998, Vols. 206-207, pp. 381-392 Reprints available directly from the publisher Photocopying permitted by license only
i 1998 OPA (Overseas Publishers Association) Amsterdam B.V. Published under license
under the Gordon and Breach Science Publishers imprint.
Printed in India.
PIEZOELECTRICITY IN FERROELECTRIC THIN FILMS: DOMAIN AND STRESS ISSUES
S. TROLIER-MCKINSTRY3, J. F. SHEPARD, jR.a, J. L. LACEYa, T. SUa, G. ZAVALAb and J. FENDLERb
a Materials Research Laboratory and Materials Science and Engineering Department, Pennsylvania State University;
h Department of Chemistry, Syracuse University
(Received 24 February 1997; In final form 2 May 1997)
As ferroelectric thin films are investigated as alternative sensors and actuators for microelectromechanical systems, it is becoming important to understand which mechanisms control the magnitude of the observed piezoelectric properties. It is well known that in bulk soft lead zirconate titanate actuators, over half the room temperature response is in fact associated with domain wall contributions to the properties. However, recent studies on bulk ceramics have demonstrated that the complexity of the domain structure, and the mobility of the twin walls depend on the grain size. This leads to appreciable degradation in the dielectric and piezoelectric properties for grain sizes below a micron. This has significant consequences in thin film actuators since a lateral grain size of one micron is often the upper limit for the observed grain size. In addition, since the pertinent domain walls are ferroelastic as well as ferroelectric, the degree of stress imposed on the film by the substrate can also clamp the observed piezoelectric response. To investigate the importance of these factors, controlled stress levels were imposed on several types of ferroelectric thin films while the dielectric and electromechanical properties were measured. It was found that for undoped sol-gel lead zirconate titanate thin films, the extrinsic contributions to the dielectric and electromechanical properties make very modest contributions to the film response. No significant enhancement in the properties was observed even when the film was brought through the zero global stress condition. Comparable results were obtained from laser ablated films grown from hard and soft PZT targets. Finally, a similar lack of twin wall mobility was observed in atomic force microscopy experiments. The consequences of this, as well as several alternative methods to increase the available piezoelectric coefficients and achievable strains in ferroic films will be presented.
Keywords: Thin film; lead zirconate titanate; domain wall motion
381

382 S. TROLIER-MCKINSTRY et tu.
INTRODUCTION
Thin film piezoelectrics are an attractive means of actuation for miniature components, since piezoelectricity scales well, particularly from an energy density standpoint, relative to many other means of generating controlled motions. While oriented ZnO is currently the most widely used thin film piezoelectric in microelectromechanical systems (MEMS), several ferro- electric compositions offer efficient electromechanical transduction coupled with an order of magnitude improvement in the piezoelectric coefficients. Consequently, in MEMS, introduction of ferroelectric thin films is an area of strong interest[1_5]. In developing films for such uses, it is helpful to understand which factors contribute to the observed piezoelectric proper- ties, as this has important repercussions in terms of the magnitude of the piezoelectric coefficients available as well as the aging characteristics of the films. Thus, this paper describes the role of intrinsic and extrinsic contributions to the piezoelectric properties of bulk and thin film lead zirconate titanate (PZT). It is suggested that in most PZT thin films under a micron in thickness, domain walls contribute less to the piezoelectric properties than is typical for bulk ceramics.
INTRINSIC AND EXTRINSIC RESPONSE IN LEAD ZIRCONATE TITANATE CERAMICS
In bulk polycrystalline Pb(Zr!_xTix)03 ceramics, the room temperature dielectric and piezoelectric properties result from a combination of the intrinsic response of the material (that which can be characterized by averaging the response expected from a single domain single crystal) and extrinsic, or domain wall contributions. In terms of the dielectric constant, both ferroelectric and ferroelectric-ferroelastic domain wall motions can enhance the measured permittivity. However, since there is no spontaneous strain difference between 180° domains in PZT, for piezoelectricity, domain wall contributions are due to reversible and irreversible non-1800 domain wall motions. Extrinsic contributions to the piezoelectric properties of PZT are well known to be responsible for the difference between hard and soft PZTs.
Several reports quantifying the role of extrinsic properties are available in the literature. In particular, through measurements of the temperature dependence of d33, Zhang et al.[6] demonstrated that in soft PZT, approximately one half of the room temperature piezoelectric properties

PIEZOELECTRICITY IN THIN FILMS 383
are extrinsic in origin. As the temperature decreases to OK, thermally activated domain wall motions can be frozen out, so the properties of hard and soft PZT materials converge and approach those predicted from phenomenological arguments (which do not account for domain contribu- tions)[7]. On the basis of hydrostatic measurements, Zhang et al.[8]
calculated that in both undoped and in soft PZT ceramics, approximately 60% of the room temperature d3i is attributable to domain wall motion. Similarly, through application of the Rayleigh law, Damjanovich et al.[9]
assigned ~19% of the room temperature d33 of PZT near the morphotropic phase boundary to be due to irreversible domain wall motion, while irreversible wall motion contributed ~30% of the response in PZT 63/37. The remaining extrinsic response is presumably due to reversible wall motion.
Since many MEMS applications require high piezoelectric coefficients and large achievable strains, it would be desirable to exploit extrinsic contributions to the film piezoelectric properties in order to decrease required film thicknesses and driving voltages. Thin films do, however, demonstrate several fundamental differences from bulk ceramic materials. In particular, most thin film grain sizes are well under 1 (im, which is markedly smaller than that in conventionally prepared ceramics. In addition, thin films are often non-stoichiometric, have high defect densities, and are constrained by large biaxial stresses associated with a combination of the deposition conditions and with thermal expansion coefficient mismatches between the film and the substrate. Each of these factors could appreciably influence domain wall mobilities in thin film systems, and so it is useful to look at their relative roles in controlling film properties.
The role of grain size in PZT ceramics has been discussed by Kim[10]. He demonstrated that when Nb-doped PZT 52/48 ceramics are prepared with clean grain boundaries, the materials demonstrate sharp phase transitions, and negligible changes in properties for grain sizes above 1 um. Below that size, the dielectric constant, the piezoelectric coefficients, the remanent polarization, and the lattice distortion as measured by X-ray begin to decrease. In contrast, fine powders with the same particle sizes showed grain size-independent spontaneous strains, implying that the three-dimensional stresses in the polycrystalline ceramic are responsible for the changes in the spontaneous strain in ceramics. Consequently, some of the observed change in properties was intrinsic.
Perhaps more significant in terms of controlling the properties of fine- grained material, however, were the concurrent changes in the domain struc- ture. Via transmission electron microscopy (TEM), Cao and Randall[11]

384 S. TROLIER-MCKINSTRY et al.
demonstrated that the size of twin domains in PZT ceramics drops with the square root of the grain size over the size range of 0.2 to 10 um. For grains under ~0.2um in extent, the domain size drops even more quickly. Accompanying the smaller twin domain size was a decrease in the complexity of the domain structure. This point is particularly important, as twin walls have been observed to be related across grain boundaries in PZT ceramics[10'12]. Poling thus requires a cooperative motion of the walls in multiple grains. If there are few variants available per grain, this may inhibit the poling efficiency. Moreover, the domain wall mobility should decrease with increasing domain density[13].
The net result of these effects was a drop in both the saturation and the remanent polarizations as well as the piezoelectric coefficients as a function of decreasing grain size[9]. Thus, as the grain size was reduced from 1 um to 0.2 um, the room temperature remanent polarization decreased from 38uC/cm2 to 30uC/cm2, while the piezoelectric charge coefficient, d33
decreased from 460pC/N to 350pC/N. Measurements made at 10 K showed far smaller changes in the properties, strongly suggesting that the grain size effects observed were primarily extrinsic, rather than intrinsic, in origin. Since most thin films have grain sizes under 0.5 um, it becomes a significant question as to whether it will be possible to generate appreciable domain wall contributions to dielectric properties in thin films.
A second significant difference between ceramics and thin films is the stress state of the materials. In bulk ceramics, the average stress on each particle is approximately hydrostatic, whereas in thin films, the stress is largely biaxial. Since PZT is ferroelastic as well as ferroelectric, stresses should strongly influence the film properties (particularly through domain wall mobilities). Consequently, size effects may differ for thin films relative to bulk ceramics.
Given these possible domain pinning mechanisms in films, it is worthwhile considering whether or not truly "soft" piezoelectric properties can be achieved in PZT for MEMS devices. To date, there is no convincing evidence for randomly oriented thin films less than one micron thick with piezoelectric coefficients which surpass those of a hard bulk PZT (—220 pm/V at the morphotropic phase boundary). It is interesting, then, to determine whether non-1800 domain walls can be made mobile in thin films. To investigate this question, this paper focuses on the interaction between the film dielectric and electromechanical properties and applied stresses for both undoped and doped PZT compositions.

PIEZOELECTRICITY IN THIN FILMS 385
DOMAIN WALL MOBILITY IN FERROELECTRIC THIN FILMS
Undoped sol-gel PZT 52/48 films were prepared as described elsewhere[14]
using a methoxyethanol solvent approach and a PbO top coat prior to crystallization to eliminate the formation of a lead-deficient pyrochlore surface layer[15]. Following rapid thermal annealing at 700°C for 60 seconds, the films were polycrystalline, with an approximately random orientation. The PZT was in a residual stress state of ~ 100 MPa tension. To determine whether it was possible to stress-induce ferroelastic wall motion, the samples were placed in a state of uniform biaxial stress by clamping the wafer over a cavity which could be either evacuated or pressurized[16]. The stress state in the film could then be calculated using large deflection plate theory and published values of the elastic moduli of Si[17] and PZT[18J. Figure 1 shows the changes in the low-field dielectric response of an undoped sol-gel PZT film ~250 nm thick as a function of applied biaxial stress.
Several points are evident from the data: first, the dielectric constant drops as the film is placed in tension and shows a shallow maximum when stressed compressively. Secondly, the changes even for applied stresses on the order of 140 MPa relative to the unstressed state are small, typically under 5%. Third, the dielectric constant recovers almost completely on unloading from either stress state. The dielectric loss showed little change
a. o
BÜ
0.050
0.025
0.000 -
-0.025
-0.050 -100
■ 1 1 ' ' i ■ ' '
o 0 •
o •
o
• o
• • o
• - o *
Stress Dec. Stress Inc.
■ o • ■
• •
o
8 8 •
•
• o s 8°:
, , 1 , 1 i . . .
-50 0 50
Applied Gas Pressure (kPa)
100
FIGURE 1 Capacitance as a function of cavity pressure for an unpoled undoped sol-gel PbZro.52Tio.48O3 thin film measured in uniform pressure biaxial stress rig. Data for increasing and decreasing pressure are shown. Similar changes were observed during multiple cyclings of the stress state.

386 S. TROLIER-MCKINSTRY et al.
for the entire stress range. Similar behavior was observed for poled and
unpoled samples. These data are in strong contrast to biaxial stress measurements on poled
bulk PZT ceramics. In particular, when measured along a direction perpendicular to the biaxial stress, both hard and soft PZT compositions showed a decrease in the capacitance of ~50% or more for compressively stressed material. These changes were attributed largely to changes in the domain structure[19]. That is, a compressive biaxial stress should force the polarization direction to orient perpendicular to the stressing plane, which, in turn, leads to changes in the dielectric properties measured. On unloading, the bulk soft PZT returned to ~70% of its initial value, while the hard PZT-4 recovered more fully. For the thin films, on the other hand, the reversibility of the stress-induced changes, coupled with their small magnitude, strongly suggests that it is not possible to force much ferroelastic reorientation of domains over the stress range investigated. Indeed, when the high field properties of the films were measured, there was no appreciable variation in the coercive field of the film for stress levels between -140 MPa and 140 MPa. Instead, when placed in additional tension, the hysteresis loop bent slightly toward the horizontal axis, and when placed in compression, it rotated slightly toward the vertical axis. A similar difficulty in inducing 90° domain reorientation was observed in X- ray measurements as a function of the poling field for a sol-gel PZT 40/60 film on Pt-coated Si by Tuttle et al.[20].
It is also interesting to note that the maximum in the dielectric constant measured for the films occurs approximately where the applied stress state counterbalances the residual stress state after processing (See Fig. 2). However, it is clear from the relatively small increase in the dielectric constant and loss at this point, as well as the modest changes in the coercive field, that domain walls do not become appreciably more mobile at the maximum. Consequently, although the residual stress value in films may modulate the low and high field properties of PZT somewhat, if non-180° domains exist in the grains, the pinning sites which clamp their motion must be on a local scale. Grain boundaries, crystal defects, and the film-substrate interface are three likely pinning sites in these films.
Very similar behavior was observed in PZT thin films grown by pulsed laser deposition from commercial hard (PZT-8) and soft (PZT-5A) targets'211. Films of these compositions were examined to determine whether domain wall mobility could be increased via donor doping, as is typically done in bulk ceramics. The films were grown at room temperature on Pt-coated Si substrates, and were subsequently crystallized by rapid

PIEZOELECTRICITY IN THIN FILMS 387
>
<D
Ml e
V
0.025
0.020
0.015
0.010
0.005
0.000
-0.005
i i i i i 1 ' ' 1 ' i 1 1 ' - • • :
• o • • o o • -
: o • :
• 0 o . • o ■
OO \
'- '- ; • Stress Dec. 1 ■
- o Stress Inc. 1 • -
; 1 . . . . i . . i 1 "-
-200 -150 -100 -50
Principle Stress (MPa)
FIGURE 2 Normalized change in capacitance for an unpoled undoped PbZro.52Ti0 4803 film as a function of the applied compressive stress. Electrode diameter = 1.5mm.
thermal annealing. The films were polycrystalline, with some degree of (100) orientation. The surface grain size was ~0.1 |xm, though it is possible that there was substructure at a finer scale. Figure 3 shows graphs of the effect of applied biaxial tension and compression on the measured capacitance for the two types of films. The observed behavior is similar to that seen in the undoped sol-gel PZT films. That is, the changes in the low field properties are small (a few percent) for stresses up to ~ 140 MPa, and largely reversible. There was no appreciable irreversible wall motion even in the film grown from the soft target. The low domain wall mobility even in the soft PZT film compositions is consistent with the observations that both types of films have similar dielectric constants (> 1000) and nearly identical coercive fields (~120kV/cm) (See Fig. 4). Very little change in the electrical properties was noted when a sol-gel PbO coating on the ablated film was used during the rapid thermal annealing to minimize Pb vacancies. Possible explanations for the low domain wall mobility in the soft composition films include the small grain size of the thin films, high defect densities, or segregation of the dopants to the grain boundaries so that the grains are not "soft". The incorporation of at least some of the dopants into the PZT-5A films is strongly suggested by the fact that the dielectric loss in the soft compositions is consistently lower than that of either hard or undoped films. TEM work to confirm the location of the dopants in the laser ablated films is currently underway. Given the relatively modest changes in properties as a function of

388 S. TROLIER-MCKINSTRY et al.
-a u N
*»—i
13 S (-< o
u c a 'o cS OH cd U
1.02
1 -
0.98 :
0.96 -
0.94
0.92
N •H
13
1-c o
O C
1 1 ! . | 1 1 . 1 | 1 1 1 1 1
'^V PZT-8 (hard) ; A A ^^^
-A -'A
• " A"--.
; PZT-5A (soft) A.
1 1
'":A
. . , 1 , , . . 1 . . . ,
(a)
5 10 15 Pressure (psi)
20 25
1.03
.02 l
1.01
'o 0.99 C3
c^
U 0.98
, I I , .1.1 ' ' ' w :r 8' (hafd;
~K^^*~^ i7f>-----; L
1 :
/?' .-* s-- ■ I^PZT5A (soft) :
■
\
(b)
0.0 5.0 10 15 Pressure (psi)
20
FIGURE 3 Capacitance as a function of cavity pressure for laser ablated PZT thin films grown from commercial hard and soft PZT targets, (a) applied tensile stress (b) applied compressive stress. Electrode diameter 0.3 mm.
applied biaxial stress, the macroscopic residual stress state is not believed to dominate the low domain wall mobilities.
A third demonstration of limited ferroelastic domain wall mobility was obtained in atomic force microscopy measurements of the piezoelectric coefficients of an undoped sol-gel PZT film on a platinized silicon substrate. Piezoelectric measurements were made by bringing the AFM tip into contact with the film, poling the film locally with a dc voltage, and then applying a small alternating field between the bottom electrode and the tip. The tip was then used to follow the electrically induced displacement. Additional details on the experimental procedure are given elsewhere'221. Figure 5 shows the normalized J33 as a function of the force holding the tip

PIEZOELECTRICITY IN THIN FILMS 389
-60 10s -30 10 0 10° 30 10"
Electric Field (V/m) 60 10"
FIGURE 4 Polarization-electric field hysteresis loops for PZT films grown from PZT-8 and PZT-5A targets under the same conditions.
in contact with the sample. The data decrease monotonically with increasing contact force. On decreasing the load, the piezoelectric coefficient recovers, demonstrating that mechanical depoling is negligible for these conditions. If the load is treated as approximately uniaxial, then these data make an interesting contrast to data on bulk PZT. Several groups have demonstrated that when compressively loaded along the poling axis, soft PZTs show a small increase in d33, followed by a rapid reduction associated with ferroelastic switching. On the other hand, hard PZTs show a substantial maxima in the observed d33 with increasing stress, and on decreasing the stress, d3i recovers to a higher value than the original number. This behavior is attributed to the mechanical stress depinning the originally inactive non- 1800 domain walls so that they can contribute to the macroscopic behavior. At higher stresses, it is believed that ferroelastic switching occurs, accounting for the decreased d33 at high stress levels. As the stress is released, the hard PZT re-poles due to the defect dipoles, so the piezoelectric coefficient rises. The increased zero stress values are then associated with the contribution from the de-pinned non-1800 domain walls. The harder the PZT, the higher the stress required to induce de-poling [23'24]. In contrast,

390 S. TROLIER-MCKINSTRY et al.
1.200-
~g 1.000-
^? 0.800-
a 0.600- a B V-i
jg 0.400-
0.200-
f • Increasing Force
O Decreasing Force
f
o • 9*s*
• ? |
1 I ' ' ' ' i ■ 5 10
1 i ■ 15
1 I ' 20
■ I ■ ■ ■ i 25 30
Contact Force (|i.N)
FIGURE 5 Change in the measured rf33 coefficient as a function of AFM tip contact force for an undoped sol-gel PZT film. The excitation conditions were kept constant.
the sol-gel PZT film shows no increase in d33 over the observed range attributable to de-pinning inactive walls, as well as no irreversible ferroelastic wall motion (See Fig. 5). The decrease in piezoelectric coefficient with increasing contact force in the films, then, could be due simply to mechanically clamping the response with the AFM tip. Such an effect should also occur in bulk materials, and would be most evident if domain reorientation could be eliminated.
On the basis of all of these experiments it is not clear that extrinsic contributions to properties can be utilized to enhance the piezoelectric properties of thin films. This may ultimately limit the magnitude of the piezoelectric coefficients which can be achieved in PZT films under a micron in thickness. It may, however, affect aging of the properties, as well as stabilize the high drive properties.
ALTERNATIVE MEANS TO HIGHER ELECTROMECHANICAL COEFFICIENTS
Although it may not be possible to prepare PZT films with soft piezoelectric properties, there are some alternative routes to developing larger strains and/or higher piezoelectric coefficients for MEMS actuators, including using

PIEZOELECTRICITY IN THIN FILMS 391
higher drive levels, preparing oriented films, or utilizing phase change or electrostrictive compositions. Indeed, one of the attractive aspects of many thin films is the high measured breakdown strengths (~1 MV/cm). Thus, even though the piezoelectric coefficients may be degraded by the loss of the extrinsic contribution to properties, it is possible to reach high strain values due to the field strengths which can be applied. A second alternative is to examine oriented films. As has been demonstrated by Theis and Schlom[25], even in the case of epitaxial films, domain walls may be clamped at the substrate due to elastic considerations, and so may not be free to contribute to properties. However, discounting that contribution, oriented films clearly display higher remanent polarizations than randomly oriented films (i.e. (001) PZT films with remanent polarizations of ~55u€/cm2 have been prepared, whereas polycrystalline films generally show remanent polariza- tions of ~20-35 |j.C/cm2)[26]. It remains to be seen how much improvement this can offer the piezoelectric properties. A third approach would be to move away from standard piezoelectric compositions to utilize either antiferroelectric-ferroelectric phase change materials or electrostrictive compositions. In the former case, several groups have demonstrated strain levels of >0.2% in PbZr03 - based compounds for actuator applica- tions'27'285. This is clearly competitive with PZT, and should be quite attr- active for MEMS. Less work has been done in electrostrictive compositions. It would be particularly interesting to examine the strain-field behavior for both unbiased and field-biased materials. It is not clear yet what role film stresses have in affecting the properties of either family of materials.
CONCLUSIONS
PZT thin films can be integrated into MEMS devices to produce high energy density actuation. Excellent properties have been demonstrated by several groups throughout the world. Relative to bulk PZT, however, most PZT thin films show negligible extrinsic contributions to the dielectric and piezoelectric properties. This may provide an upper limit to the piezoelectric coefficients available unless an alternative contribution to the electro- mechanical properties can be tapped.
Acknowledgements
Work supported by NSF grants DMR-9223847 and DMR-9502431 and by DARPA through grant DABT63-95-C-0053.

392 S. TROLIER-MCKINSTRY et al.
References
[1] Luginbuhl, Ph., Racine, G.-A., Lerch, Ph., Romanowicz, B., Brooks, K. G., de Rooij, N. F., Renaud, Ph. and Setter, N. (1996). Sensors and Actuators, A54, 530.
[2] Muralt, P., Kohli, M., Maeder, T., Kholkin, A., Brooks, K., Setter, N. and Luthier, R. (1995). Sensors and Actuators, A48, 157.
[3] Chen, H. D., Udayakumar, K. R., Gaskey, C. J. and Cross, L. E. (1995). Appl. Phys. Lett, 67,3411.
[4] Udayakumar, K. R. et al. (1994). Ferroelectrics, 160, 347. [5] Polla, D. and Francis, L. F. (1996). MRS Bull., 21(7), 59. [6] Zhang, X. L., Chen, Z. X., Cross, L. E. and Schulze, W. A. (1983). J. Mat. Sei., 18, 968. [7] Haun, M. J. (1988). Thermodynamic Theory of the Lead Zirconate - Lead Titanate Solid
Solution System, Ph. D. Thesis, The Pennsylvania State University. [8] Zhang, Q. M., Wang, H., Kim, N. and Cross, L. E. (1994). J. Appl. Phys., 75, 454. [9] Damjanovich, D., Demartin, M., Chu, F. and Setter, N. (1996). Proc. 10,h Int. Symp. Appl.
Ferro., 251. [10] Namchul Kim (1994). Grain Size Effect on the Dielectric and Piezoelectric Properties in
Compositions which are Near the Morphotropic Phase Boundary of Lead Zirconate - Lead Titanate Based Ceramics, Ph. D. Thesis, The Pennsylvania State University.
[11] Cao, W. and Randall, C. (1996). J. Phys. Chem. Sol, 57, 1499. [12] Demczyk, B. G, Rai, R. S. and Thomas, G. (1990). J. Am. Ceram. Soc, 73, 615. [13] Arlt, G and Pertsev, N. A. (1991). /. Appl. Phys., 70, 2283. [14] Hendrickson, M., Su, T., Trolier-McKinstry, S., Rod, B. J. and Zeto, R. J. (1996). Proc.
10'h Int. Symp. Appl. Ferro., 683. [15] Tani, T., Lakeman, C. D. E., Li, J. F., Xu, A. and Payne, D. A. (1994). Ceram. Trans., 43,
89. . [16] Shepard, J. F., Trolier-McKinstry, S., Hendrickson, M. A. and Zeto, R. (1996). Proc. 10
Int. Symp. Appl. Ferro., 161. [17] Brantley, W. (1973). J. Appl. Phys., 44, 534. [18] Tuchiya, T., Itoh, T., Sasaki, G. and Suga, T. (1996). J. Ceram. Soc. Jpn., 104, 159. [19] Brown, R. F. (1961). Can. J. Phys., 39, 741. [20] Tuttle, B. A., Garino, T. J., Voight, J. A., Headley, T. J., Dimos, D. and Eatough, M. O.,
in Science and Technology of Electroceramic Thin Films, O. Auciello and R. Waser (Eds.) (Kluwer Academic Publishers, The Netherlands 1995), pp. 117-132.
[21] Piezokinetics, Inc. [22] Zavala, G, Fendler, J. H. and Trolier-McKinstry, S. (1997). J. Appl. Phys., 81, 7480. [23] Meeks, S. W. and Timme, R. W. (1975). J. Appl. Phys., 46, 4334. [24] Zhang, Q. M., Zhao, J., Uchino, K. and Zheng, J. (1997). J. Mat. Res., 12, 226. [25] Theis, C. D. and Schlom, D. G. (1996). MRS Proc, 401, 171. [26] Foster, C. et al. (1996). MRS Proc., 401, 139. [27] Gaskey, C. J., Udayakumar, K. R., Chen, H. D. and Cross, L. E. (1995). J. Mater. Res.,
10, 2764. [28] Yamakawa, K, Trolier-McKinstry, S. and Dougherty, J. P. (1996). Proc. 10' Int. Symp.
Appl. Ferro., 405.

Ferroelectrics, 1998, Vols. 206-207, pp. 393-405 Reprints available directly from the publisher Photocopying permitted by license only
] 1998 OPA (Overseas Publishers Association) Amsterdam B.V. Published under license
under the Gordon and Breach Science Publishers imprint.
Printed in India.
STRUCTURE CONTROL OF PULSED-LASER- DEPOSITED Pbo.6Sro.4Ti03/Lao.5Sro.5Co03 THIN
FILMS ON VARIOUS SUBSTRATES
CHEN-CHIA CHOUa, CHUN-SHU HOUa
and HSIU-FUNG CHENG b
a Department of Mechanical Engineering, National Taiwan University of Science and Technology, Taipei 106, Taiwan, Republic of China;
Department of Physics, National Taiwan Normal University, Taipei 117, Taiwan, Republic of China
(Received 24 February 1997; In final form 15 May 1997)
Structure development is an important issue for the growth of ferroelectric thin film. In the present experiment, Pbo.6Sro.4Ti03(PSrT)/Lao.5Sro.5Co03 (LSCO) thin films have been grown on various substrates, such as: single crystal Si with (100) and (111) orientations, Au/Si, Pt/Si and glass, using XeCl excimer laser (wavelength = 308 nm) under various processing conditions. X-ray diffraction results show that highly (100)-oriented LSCO films can -be deposited successfully under appropriate processing conditions regardless the type of the substrate. PSrT films can be deposited upon LSCO layer with the same structure arrangements if LSCO can develop desired structures. It appears that appropriate processing parameters are more important than lattice parameter consideration for growing LSCO films using pulsed laser deposition. Microstructure investigations indicate that the substrate with an amorphous surface layer may help the development of the desired structure.
Keywords: PSrT; LSCO; PLD; microstructure; wavelength
1. INTRODUCTION
The success of pulsed laser deposition (PLD) in preparing thin films of high Tc superconductors has provoked interest in using this technique for processing ferroelectric thin films for device applications [1]. Most works on ferroelectric thin films have focused on the platinum electrode system which exhibits good adhesion to lead based perovskite films. However, its adhesion to Si02 is poor [2] and Pt will react with Si to form a suicide significantly below 600°C[3]. To improve adhesion, a thin layer of Ti is
393

394 C.-C. CHOU et al.
introduced between the Pt and Si02. The polarization fatigue of PZT capacitors on Pt/Ti/Si02/Si substrates has been observed and attributed to mobile oxygen vacancies and Schottky depletion regions due to the work function mismatch at the electrode/PZT interface™. When the electrode of the PZT capacitor is replaced by a conducting oxide such as CaRu03
[5], La0.5Sro.5Co03 (LSCO) ^ or YBa2Cu307 (YBCO) [8'9], outstanding fatigue resistance has been reported. It has also been shown that some properties of LSCO are superior to those of YBCO, and that LSCO is an excellent material to be used as lattice matched electrodes for ferroelectric devices to reduce fatigue-related degradation [1'10]. However, in most cases LSCO films were grown on (100) oxide single crystals17'11'121 in order to derive epitaxy structure or (100) texture. If it is possible to grow thin films with the desired structure by means of choosing appropriate processing parameters, it will then be simpler and much more cost-effective. The purpose of the present work is therefore to derive a suitable LSCO electrode/buffer layer, in which preferred texture and low resistivity are required, for ferroelectric Pbo.6Sro.4Ti03 (PSrT) films on various substrates and to understand how the microstructure and properties of the films would be affected if the substrate varies.
2. EXPERIMENTAL
The target material of LSCO was prepared by the mixed oxide method using powders of La203 (99.9%), SrC03 (99.5%) and C0O (99.5%). The La203
was baked at 200 to 300°C for 30 minutes to dehydrate the powders, as hydrated water may hinder the sintering of the materials. The mixed powders were calcined at 1000°C for an hour. After ball-milling, the powders were compacted with a cold-isostatic press at 40000 psi and sintered at 1200°C for 5 hours. A similar process was followed for preparation of the PSrT target.
PLD of PSrT/LSCO films was carried out on various substrates such as Si(100), Si(lll), Pt/Si(100), polycrystalline Au/Si(100) and glass using a XeCl excimer laser (Lamda Physik 200) with a wavelength of 308 nm. Some Si substrates were cleaned by a 40% HF solution before the deposition of LSCO. Deposition conditions were an oxygen partial pressure (Po2 = 0.1 mbar; laser energy density (Ed) = 2.8 J/cm2; substrate temperature deposition (Td) = 640°C, repetition rate (r.r.) = 5 Hz and deposition period (/d)= 10 minutes were used for experiments.
The structure of the deposited films was analyzed using X-ray diffractometry (XRD) (Rigaku DMAX-B, rotating anode) with a copper

PULSED-LASER-DEPOSITED THIN FILMS 395
target. The scanning rate of 3°/min was adopted for rough scan from 20° to 68° and of 0.5° or 0.2°/min for local fine scan. In order to avoid picking up artifacts due to a double diffraction of the silicon substrate which may produce intensity overlapped with LSCO (110) peak, a standard operation procedure has been established. That is, the long edge of a rectangular silicon substrate cut from a wafer was always parallel to the [011]Si and a calibration curve has been made to monitor the (200)Si intensity as a function of the mounting angle. One finds that if the [01 T]Si is one the plane of X-ray scanning, the (200)Si double diffraction vanished. Therefore, mounting the specimens on the XRD holder consistently, the artifact can be removed. To assure the reliability of the data, experiments with a particular growth condition were performed at least three times or even more. The percentage of various oriented grains was calculated based upon the diffraction pattern of the target and the following formula [13]:
Ahkl = ^hkl / VmOO + ^110 + ^lll)
^hkl — (^Md) films / U hkl)ceramics
-CoO = (-^100 + ^200 "• I" -^nOo) / n
The microstructure of the specimens was investigated using both transmission and scanning electron microscopy (TEM (Jeol 2000FXII) and SEM (Cambridge Instrument S360)) and the interfaces of the films were studied by means of high resolution transmission electron microscopy (HRTEM) (Jeol 4000EX). Resistivity measurements were performed using a commercial 4-point resistivity analyzer (Napson RT-7) and Polarization- Voltage (P- V) measurements were made with a Radiant Technologies RT- 66A tester.
3. RESULTS AND DISCUSSION
Figure 1 shows the XRD patterns of the LSCO and PSrT targets for PLD process. The highest intensity reflection in LSCO is (110) and other peaks are consistent with the JCPDS card. PSrT targets with different Sr contents were prepared. The c/a ratio decreases with higher Sr content. In the present experiment PSrT with x = 0.4 were employed. The intensities of peaks were used for the calculation of the percentage of various oriented grains.
Deposition of LSCO thin films on Si(100) and Pt/Ti/SiO2/Si(100) has been performed under various conditions and the optimal deposition conditions have been summarized [14]. In the course of LSCO film

396 C.-C. CHOU et al.
(a) La0.5Sr„.5CoO3 (36-1394)
Tiflipi'ir|Tfii|iiri[iiii|mi|iin|iiriyiii|iriij 20 25 30 35 40 45 50 55 60 65 70
29 (degree)
(b) Pb0(iSr„ „Ti03
— O g — Si
ifi|(m[rm|iiii iiiiiiiiiiimiirili|iiii|Hii| 20 25 30 35 40 45 50 55 60 65 70
fln(rtii]Tirr|ii
26 (degree)
FIGURE 1 X-ray diffraction patterns showing relative intensities of the reflections of (a) LSCO and (b) PSrT ceramic targets.
deposition, well controlled film crystallography has been obtained. Figure 2 shows the results of X-ray diffraction patterns of the LSCO thin films deposited on various substrates using PLD with the conditions mentioned. The significance of this result is that no matter what kind of substrate is, primarily (100) oriented LSCO thin films can be acquired all the time. The deposited LSCO films on silicon single crystal substrates with (100) and/or (111) orientation, Figures 2a and 2b, show similar tendency as those on polycrystalline or preferred-oriented metal films such as Au/Si(100) and Pt/ Si02/Si, Figures 2c and 2d and even those on amorphous substrates such as glass, Figure 2e. It is clearly seen that the deposited LSCO thin films were highly (mOO) preferred-oriented. Although a (110) peak was also observed, the amount of (110) oriented grains is small under the optimal deposition conditions from the calculation based upon the formula shown above. The

PULSED-LASER-DEPOSITED THIN FILMS 397
LSCO on various substrates T^Ot ;PO2=0.1mbar Ed=2.8 J/cm2; t j=10 min t«=15 min; r.r.=5Hz
A Au • PtSi A AuSi or (AuxOy\
111 p| r r 11111 ri-j-ii 111 ■ 111111 it 111 ■ 111111111111
20 25 30 35 40 45 50 55 60 65
20 (degree)
FIGURE 2 X-ray diffraction patterns showing highly (100) preferred-oriented pulsed laser deposited LSCO thin films on various substrates.
results appear to imply the LSCO is quite insensitive to the substrate structure if appropriate processing conditions were adopted.
In growing LSCO thin films, not only the structure of the films is important, but the electrical resistivity also demands considerable attention. Figure 3 shows the room temperature resistivity, the lattice parameter and the fraction of textured grains of the LSCO films on a Si(100) substrate as a function of oxygen partial pressure. It is found that films grown at oxygen partial pressures below 0.3 mbar show comparable resistivity values as reported in previous works'1' 2' 10' n' 14' 15]. The resistivity increases as the oxygen partial pressure during film deposition is increased above 1.0 mbar. Similar to the resistivity, the fraction of the grain orientations and the lattice parameter are also greatly affected by oxygen partial pressure. The lattice parameter of the films probably deviate from that of the bulk LSCO due to the amount of oxygen vacancy, which is very similar to the situation in oxide superconductors [16' 17]. However, for the fraction of crystal orientation, it is relatively difficult to find a specific trend with oxygen pressure.
Figure 4 shows the room temperature resistivity, the lattice parameter and proportion of textured grains of the LSCO films on a Si(100) substrate as a

398 C.-C. CHOU et al
y average bulk lattice parameter (c)Lattice r v Parameter
(mOO)^
(110) ▲ (b) Orientation AA\ ^> Distribution
0.5
I I | I I I I | I I I I |
1.0 1.5 2.0
Po2 (mbar)
FIGURE 3 (a) Room temperature resistivity, (b) fraction of orientation distribution and (c) lattice parameter of the LSCO films on Si(100) as a function of oxygen pressure.
average bulk lattice parameter (c)Lattice Parameter
1 | ' | I | ' I ' I ' I ' I ' I ' I 400 450 500 550 600 650 700 750 800 850
Temperature (°C)
FIGURE 4 (a) Room temperature resistivity, (b) fraction of orientation distribution and (c) lattice parameter of the LSCO films on Si(100) as a function of the substrate temperature.
function of the substrate temperature. The lattice parameter of a deposited film shows no clear relation with the substrate temperature. However, the film texture is greatly dependent on the substrate temperature. In fact, the substrate temperature provides the driving force for nucleation and growth of the deposited films. Thermal energy helps atomic diffusion and the final

PULSED-LASER-DEPOSITED THIN FILMS 399
structure development may be attributed to the free energy variation of the texture at a certain temperature range. However, it is difficult to quantify the texture development in terms of a process parameter due to the complexity of the PLD process. For LSCO films deposited on Si(100), a substrate temperature between 500 and 650°C is appropriate to form a (lOO)-oriented texture and low resistivity LSCO films on a Si(100) substrate. Polycrystalline LSCO film tends to form above 700°C and (110)LSco texture was development below 500°C and the films become amorphous under 400°C. The substrate temperature and the oxygen partial pressure therefore play the role of determining the crystallinity and stoichiometry of the films.
Similarly, the effect of energy density was also studied. Figure 5 shows that the lattice parameter of the deposited LSCO film was not influenced by energy density. But the (lOO)-oriented texture and the film conductivity were greatly enhanced. This effect is probably due to a more complete atomic arrangement at a higher laser energy density. The lowest resistivity we derived was 58|xficm, comparable to the reported ones [1' 2' 10' n' 14' 15]. On the other hand, low resistivity films often come with strong (100) texture of the LSCO electrode. This appears to suggest the anisotropic behavior of the LSCO resistivity. However, the LSCO films deposited at a substrate temperature of 500° C with a high (110) texture, Figure 4 and some
IP3"8" Ä 3.8-
3.8-
100 ■
SS 60 | at * *£ 20
0
3.8 -^ average bulk lattice parameter
3£-
(n*0) ♦ (110) A
(c)U«ice RranetEr
firflO)
(b)Qientaäon Distribution
(110)
il re w
7 6 5 4 - 3 — 2 —.
0
(a) Resistivity
iin|uii|iin|iiii|iiii|iin[ini|
1.0 1.5 20 25 ao 35 40 45
Ed(J/crrr)
FIGURE 5 (a) Room temperature resistivity, (b) fraction of orientation distribution and (c) lattice parameter of the LSCO films on Si(100) as a function of energy density of the laser beam.

400 C.-C. CHOU et cd.
polycrystal films imply that films with other orientations can also show low resistivity if appropriate processing conditions were employed. This implies that the resistivity variation of LSCO may primarily be attributed to the crystallinity or stoichiometry changes, but not due to the texture. As long as the necessary energy was provided, good quality films can be obtained and consequently a low resistivity can be achieved. Comparing with previous work[1I], it might be more appropriate to suggest that the electrical resistivity of LSCO is close to be isotropic.
PSrT films were deposited upon the LSCO layers. Figure 6 shows the XRD patterns of the PSrT thin films on LSCO films with different orientations. The LSCO films with different orientations can be controlled by choosing appropriate processing conditions. For the (raOO)-oriented film growth, the processing parameters are T'd = 640oC, JPO2=0.1mbar and £'d = 2.8J/cm2. With similar processing parameters but 7d = 450°C and 700°C, (110)-oriented and polycrystal films can be grown. Figures 6a and 6b are patterns for bulk LSCO and PSrT for comparison and Figure 6c shows a polycrystalline LSCO film and the deposited PSrT film is also polycrystal- line. Figure 6d is a PSrT film on a strong (110)-oriented LSCO and the PSrT film shows strong (110) texture too. Similarly, Figure 6e show that PSrT film follows the same structure arrangement as that of LSCO. Therefore, it is
(c) PSrT polyciystalline PoHXl mbar Ta-500 'C
28 (degree)
FIGURE 6 X-ray diffraction patterns showing crystal structures of (a) LSCO bulk; (b) PSrT bulk, and structure arrangements of the PSrT films on top of (c) polycrystalline LSCO film; (d) LSCO film with (110) texture; (e) LSCO film with (mOO) texture.

PULSED-LASER-DEPOSITED THIN FILMS 401
clear, if we can control the structure of the buffer LSCO layer, the growth of the PSrT films with the same structure is easily achieved. The electric polarization-electric field (P-E) curves of PSrT films on a LSCO and a Pt electrode are shown in Figure 7. Both curves indicate that PSrT films have ferroelectric properties.
Microstructure investigations that provide the information about the interfacial condition and the atomic arrangements in the films may shed some light on the deposition mechanism. Figure 8 shows an HRTEM micrograph of the plan view of a deposited LSCO film on Si(100). The average local dimension of the grains is about 10 to 30 nm. Several grains show almost exact (lOO)-oriented arrangement and most of grains reveal one dimensional lattice fringe. Tilting the specimen, one finds that the (100) zone of each grain is not far away. Comparing with the XRD patterns, it is clear
-150 -120 -90 -60 A
(a) PSrT/LSCO/Si
'30 60 90 120 150
Ec (kV/cm)
Pr=7.5 uC/cm2
P,=28.5 nC/cm2
E0=33 kV/cm
(b) PSrT/Pt/Si 30 —|
P (uC/cm2) .-"""'"/ 20 — /
10 -^
t\
11!!' i,-1 i' .!■••;[■■'' I ' I ' I ' I 100 -80 -60 A0 -20 1
.• -10 — .•'20 40 60 80 100
...- Ec (kV/cm)
■ ..to — Pr=10 uC/cm2
,•*' P,=27.5 (iC/cm2
-30 — Ec=26.7 kV/cm
FIGURE 7 P-E curves of the PSrT films on (a) LSCO/Si02/Si; (b) Pt/Si substrates.

402 C.-C. CHOU et al.
FIGURE 8 HRTEM micrographs showing the structure image of highly (100) textured LSCO films, (a) cross-section, LSCO/Pt/LSCO/SiO2/Si(100); (b) plan view, LSCO/SiO2/Si(100).
that most grains are aligned with (100) preferred orientation. Figure 9 shows the HRTEM micrographs of the interfaces of LSCO films on two Si(100) substrates. One substrate is deposited with LSCO directly after cutting from a commercial silicon wafer and the other is carefully cleaned by 40% HF before deposition. It is clearly seen that there is a quite thick amorphous-like layer in between LSCO film and Si substrate for specimen without cleaning, Figure 9a. On the other hand, the specimen after cleaned by HF solution shows a direct contact of LSCO film and Si substrate, Figure 9b. Carefully analyzing the micrographs, one may find that strains and dislocations form around the interface because of large lattice mismatch in two materials. The Si02 layer formed on silicon substrate obviously plays an important role, that is, if an amorphous layer exists on the substrate, it presumably excludes or reduces the influence of the structure and lattice parameters of the substrate on the texture of the grown films. For a clean LSCO/Si interface, it

PULSED-LASER-DEPOSITED THIN FILMS 403
FIGURE 9 HRTEM micrographs showing the interfaces of LSCO films on two Si(100) substrates, (a) A Si(100) substrate deposited with LSCO directly after cut from a commercial silicon wafer; (b) A Si(100) substrate carefully cleaned by 40% HF before LSCO deposition.
appears that LSCO buffer layer shows a tendency to derive an "appropriate" crystal orientation by producing new grains or distorted atomic arrangements. Therefore, the formation of LSCO films on Si substrates with and without HF cleaning show different interfacial structures and produce similar film arrangements in the final results.
To demonstrate this, glass substrates were employed, and the deposited LSCO films show excellent (100) texture, as seen in Figure 2e, indicating that an amorphous layer on a substrate does help the formation of the (100) texture of a LSCO film. Considering the reproducibility of the results and analyzing more quantitatively, LSCO deposition on Si(100) and Si(lll) substrates without cleaning by HF solution were carried out repeatedly. The statistical results show reproducible preferred orientations on all Si substrates. The amount of (100)- and (HO)-oriented grains were calculated and it is found that Si(100) and Si(lll) substrates without cleaning show

404 C.-C. CHOU et al.
similar average amount of (mOO)-oriented grains, i.e., 93±6% and 93±7%. This indicates that LSCO on Si(100) has similar tendency to form (mOO) texture on Si(l 11). One may also notice that the LSCO thin films on metallic electrodes also show high ratio of (100) texture, but comparably the (110) peaks are higher, indicating that the lattice parameter and the structure of a substrate may show influence, but not crucial in the PLD growth of LSCO. However, it is difficult to make a concrete conclusion how the substrate structure and the lattice parameter play the role in the present case. More rigorous investigations and inplane X-ray experiments need to be carried out to clarify the exact mechanism.
4. CONCLUSION
LSCO films with both well controlled (lOO)-oriented texture and low resistivity have been grown on various substrates under appropriate processing conditions in the present experiment. X-ray diffraction results show that PSrT films can be deposited upon LSCO layer with the same structure arrangements if LSCO can develop the desired structures. It appears that the appropriate processing parameters are more important than the lattice parameter consideration for growing LSCO films using the pulsed laser deposition. Microstructure investigations indicate that the substrate with an amorphous surface layer may help the development of the desired structure.
A cknowledgements
The authors are grateful to Professor I. N. Lin of National Tsing-Hua University, Taiwan, Republic of China for helpful discussion and substantial support in many aspects and to Ms. H. Z. Chiu of Precision Instrument Center of National Science Council, Taiwan for helping with HRTEM investigation. This work was partly supported by National Science Council of Taiwan, Republic of China, under contract Nos. NSC 86-2216- E-011-032 and NSC 85-2112-M-003-002.
References
[1] Ramesh, R., Gilchrist, H., Sands, T., Keramidas, V. G., Haakenaasen, R. and Fork, D. K. (1993). Appl. Phys. Lett., 63, 3592.
[2] Dat, R., Lichtenwalner, D. J., Auciello, O. and Kingon, A. I. (1994). Appl Phys. Lett., 64, 2673.

PULSED-LASER-DEPOSITED THIN FILMS 405
[3] Wittmer, M. (1983). J. Appl. Phys., 54, 5081. [4] Ishiwara, H., Hikosaka, K. and Furukawa, S. (1979). J. App. Phys., 50, 5302. [5] Olsson, E. and Char, K. (1994). Appl. Phys. Lett., 64, 1292. [6] Lee, J., Ramesh, R. and Keramidas, V. G. (1995). Appl. Phys. Lett., 66, 337. [7] Ghonge, S. G, Goo, E., Ramesh, R., Haakenaasen, R. and Fork, D. K. (1993). Appl.
Phys. Lett., 64, 3407. [8] Boikov, Y. A., Esayan, S. K., Lvanov, Z. G, Brorsson, G, Claeson, T., Lee, J. and Safari,
A. (1992). Appl. Phys. Lett., 61, 528. [9] Rauch, W., Behner, H., Gieres, G, Sipos, B., Seebock, R. J., Eibl, O., Kerner, R., Solkner,
G. and Gornik, E. (1992). Appl Phys. Lett., 60, 3304. [10] Ramesh, R., Lee, J., Sands, T., Keramidas, V. G and Auciello, O. (1994). Appl. Phys.
Lett., 64, 2511. [11] Cheung, J. T., Morgan Peter, E. D., Lowndes, D. H., Zheng, X.-Y. and Breen, J. (1993).
Appl. Phys. Lett., 62, 2045. [12] Jo, W., Kim, K. H. and Noh, T. W. (1995). Appl. Phys. Lett., 66, 3120. [13] Cheng, H. F., Yeh, M. H., Liu, K. S. and Lin, I. N. (1993). Jpn. J. Appl. Phys., 32, 5656. [14] Hou, C. S., Chou, C. C. and Cheng, H. F. (1996). Eighth International Conference on Solid
Films and Surfaces (ICSFS-8), p. 114. [15] Bozovic, I., Kim, J. H., Harris, J. S., Eom, C. B., Phillips, J. M. and Cheung, J. T. (1994).
Phys. Rev. Lett., 73, 1436. [16] Zhou, Z. and Navrotsky, A. (1992). J. Mater. Res., 7, 2920. [17] Zheng, J. P. and Kwok, H. S. (1993). Appl Phys. Lett., 63, 1.

Ferroelectrics, 1998, Vols. 206-207, pp. 407-430 Reprints available directly from the publisher Photocopying permitted by license only
i 1998 OPA (Overseas Publishers Association) Amsterdam B.V. Published under license
under the Gordon and Breach Science Publishers imprint.
Printed in India.
LOCAL STRUCTURE AND THE PHASE TRANSITIONS OF BaTi03
B. RAVELa, E. A. STERN3, R. I. VEDRINSKIIb
andV. KRAIZMANb
a Department of Physics, University of Washington, Seattle, WA, USA, 98195-1560; b Rostov State University, Zorghe 5, Rostov, 344104, Russia
(Received 5 May 1997; In final form 19 June 1997)
We have measured and analyzed the Extended X-ray Absorption Fine Structure (EXAFS) of BaTi03 at the barium k edge and the X-ray Absorption Near Edge Structure (XANES) at the titanium K edge. Our structural data show that the sequence of phase transitions in this material as the temperature increases is explained by a disordering of domains wherein the local structural environment remains approximately rhombohedrally distorted at all temperatures around both metal sites. As the temperature is raised, the long range correlations between these local distortions change, resulting in the observed sequence of phase transitions. Our measurements confirm the model of eight-site disorder used to explain the phase diagram of BaTi03. We show that EXAFS and XANES are sensitive probes of both the magnitude and direction of the local structural distortions which accompany ferroelectricity and therefore are sensitive probes of the microscopic mechanism of ferroelectricity.
Keywords: BaTi03; ferroelectricity; XAFS; XANES; phase transition; perovskite
1. THE PHASE TRANSITIONS OF BaTi03
Because BaTi03 has a relatively simple crystal structure and a rich ferroelectric and structural phase diagram, it has been one of the most exhaustively studied ferroelectric materials since its discovery as a ferro- electric in 1946[1]. Despite years of experimental and theoretical attention, the question of whether the phase transitions of BaTi03 are predominantly of the displacive or order-disorder type remains open. In this paper, we present new X-ray Absorption Fine Structure (XAFS) data showing that the phase transitions of BaTi03 are predominantly of the order-disorder type.
407

408 B. RAVEL et al.
Because of its high Curie-Weiss constant and zone-centered soft mode [2\ BaTi03 has long been considered an example of a material whose structural transitions are of the displacive type. In low temperature phases of a displacive crystal some or all of the constituent atoms are displaced from sites of point centrosymmetry. These displacements are of the same symmetry as the macroscopic order parameter. In the case of BaTi03, the ferroelectric phase transitions involve rotations of the macroscopic polarization. In the lowest temperature, rhombohedral phase the polariza- tion is parallel to a (111) crystal axis. Upon heating BaTi03 undergoes transitions to orthorhombic, tetragonal, and finally cubic phases, wherein the macroscopic polarization aligns parallel to an orthorhombic (Oil) axis then to a tetragonal (001) axis before vanishing in the cubic phase. These transitions are summarized in Table I.
In Cochran's[2] displacive model, the atomic displacements are driven by softenings of the appropriate phonon modes as the transition temperature is approached from above. The mode becomes unstable as its frequency goes through zero, producing the displacement of the lower temperature and lower symmetry phase. This model not only successfully explains the structural and ferroelectric phase transitions, but also the Raman spectrum[3] and much of the thermodynamics of the BaTi03 system.
In 1968, Comes et al., [4' 51 published photographs of diffuse scattering sheets between the Bragg peaks in three of the four phases of KNb03, which is isostructural to BaTi03 and undergoes the same sequence of phase transitions. These sheets could not be explained by Cochran's displacive model. They showed that qualtiative agreement with their observations could be obtained by application of an order-disorder model first proposed for BaTi03 two years earlier by Bersuker [6]. In Refs. 4 and 5, Comes et al, state that they interpret their measurements of BaTi03 with this same order- disorder mechanism.
An order-disorder crystal is characterized by local atomic configurations which do not necessarily share symmetry elements with the macroscopic
TABLE I The phases and transition temperatures of BaTi03, PbTi03, and EuTi03. The cubic phases of these materials are paraelectric. All lower symmetry phases are ferroelectric
material descriptions of phase transitions
BaTi03 rhombohedral > orthorhombic > tetragonal > cubic 183 K 278 K 393 K
PbTi03 tetragonal > cubic 763 K
EuTi03 cubic at all temperatures

STRUCTURE AND PHASE TRANSITIONS OF BaTiOj 409
order parameter. From calculations of the local adiabatic potential, Bersuker suggested that the titanium atom sits in one of eight potential minima which are displaced from the cell center in the eight (111) directions, as shown in Refs. 4 and 6. In the lowest temperature phase, there is long range correlation in all three Cartesian directions between titanium atoms in adjacent unit cells. Thus, in the rhombohedral phase, all the titanium atoms are displaced in the same (111) direction. At each of the three phase transition temperatures, correlation is lost in one of the three directions. This results in a disordering of the titanium atoms among the (111) directions. In the orthorhombic phase, the titanium atoms occupy one of two (111) positions such that the displacements from cell to cell are correlated over long range in two Cartesian directions and uncorrelated in the third. At the transition to the tetragonal phase, the correlations are lost in a second direction, thus four of the (111) positions are equally occupied by the titanium atoms. Finally in the cubic phase, correlations in the remaining direction vanish and all eight (111) sites are randomly occupied.
In all phases the local displacements are rhombohedral and these rhombohedral displacements disorder such that their average over long length scales gives the observed crystallographic structure. Whenever disorder is present, the symmetry of the macroscopic order parameter, in this case the polarization, may be different from the symmetry of the local displacements. The Bragg peaks observed in the experiment by Comes et al, arise from the average structure and the diffuse scattering between the peaks indicate that disorder is present. Comes et al, interpreted the existence of the planes of diffuse scattering to indicate that the local rhombohedral displacements of the titanium atoms have long correlation lengths in directions perpendicular to the planes.
This order-disorder model is not unique in providing qualitative agreement with the diffuse sheets measured by Comes et al. In 1969 Hüller[7] showed that a displacive model allowing for correlated motions of the titanium atoms also gave qualitative agreement with the observed sheets. As Hüller pointed out in his paper, a direct test of these competing models was lacking at the time.
Performing a direct test of the local atomic configurations in the various phases of BaTi03 is important and is the topic of this paper. Although the model of soft phonon modes and displacive structural transitions has enjoyed success qualitatively explaining many of the macroscopic and thermodynamic properties of BaTi03, there are quantitative discrepancies and a number of measurements in the literature which are not well explained by a displacive model. These include measurements of infrared reflectivity[8],

410 B. RAVEL et cd.
cubic phase X-ray diffraction[9], electron spin resonance[10], and impulsive stimulated Raman scattering111'12]. Furthermore, knowing the true local atomic configurations in BaTi03 throughout its various phases would be crucial to a successful theory of the microscopic mechanism of phase transitions in this material. First principles calculations of crystal structure and phase transitions typically take atomic configurations as their initial input parameters. The details of the interactions within the crystal can only be properly understood with knowledge of the true microscopic structure. Recent XAFS measurements on a variety of perovskite ferroelectrics and anti-ferroelectrics including PbTi03 [13'14], KTao.91Nbo.09O3[15], NaTa03 [16], Na0 82Ko.i8Ta03 [16] and PbZr03 [17] have shown order-disorder character in their phase transitions which were originally believed to be displacive. The connection between the off-center displacements of the disordered structure and the softening of the transverse optical phonon modes has been successfully explained[18] for PbTi03 and KNb03. In this paper we wish to examine the possibility of order-disorder character in the phase transitions
of BaTi03. We have used XAFS to determine the local atomic configurations of
BaTi03 in a temperature range which spans all four structural and ferroelectric phases. XAFS is the right tool for differentiating between these two models as it provides a direct probe of local structure. XAFS is not dependent on long-range order, thus structurally disordered crystals can be treated equivalent^ to well-ordered materials. It is sensitive to order below an Ängstrom scale, thus directly measures local effects that are inaccessible to many other experimental techniques. XAFS is sensitive to atomic species, thus the local structure about different components of a material can be measured.
XAFS measures the energy dependence of the absorption coefficient for the excitation of a deep core electron into the continuum. The X-ray absorption coefficient is measured as a function of energy in a range below and above the excitation energy of some deep core state of an atom in the material. At energies below the excitation energy, the absorption coefficient is small. At the excitation energy of the deep core electron, there is a large jump in the absorption coefficient. If the resonant atom were in free space, this spectrum would be a decaying step function. In condensed matter, in the presence of surrounding atoms, the absorption coefficient has an oscillatory fine structure in the region around and above the edge1191. The frequency spectrum of these oscillations depends on the distances to the surrounding atoms and is caused by the interference between the outgoing photoelectron and the scattering from the surrounding atoms.

STRUCTURE AND PHASE TRANSITIONS OF BaTi03 411
The oscillatory fine structure x{K) measured by XAFS can be expressed as a sum over all scatterings from the atoms surrounding the excited atom. Considered as a sum of scattering paths, the theoretical XAFS spectrum is expressed[19] in the following form:
X(k) = Im V NJS0FJ^ e' (2fcÄ,-+$y(fe))e-(2fc2<7y2+2y R/\(k)) ( j )
The subscript j denotes the various scattering configurations in the problem. The photoelectron wave number, k, is related to the energy of the incoming photon by k = ^/2m{E- Eo)/h2. Here E is the energy of the incoming photon and E0 is the excitation energy. This equation contains both atomic and condensed matter contributions. The functions F}{k), and $j{k) are the scattering amplitudes and scattering phase shifts for each sacttering configuration. \{k), the photoelectron mean free path, is dominated by lifetime of the excited state. F/k), %{k), and \{k) depend on the absorbing atom and are obtained from the ab initio program FEFF6.[20] The condensed matter contributions to x(k) are Rj, the mean interatomic distances, Nj, the coordination of the atoms at distance Rj, and <Tj, the mean square displacements about the Rj. Equation 1 assumes harmonic motion of the backscattering atoms. Anharmonic corrections to a2 are of negligible size in BaTi03.
Table II shows the near neighbor distances about each of the metal sites in BaTi03 for each of the local configurations predicted by the displacive model. By the order-disorder model, we expect the rhombohedral local symmetry to persist into the higher temperature phases. Each possible local structure in Table II has a unique set of N's and R's for use in Equation 1. Since XAFS is sensitive only to the short range structure, it is particularly suited to distinguishing between these two models.
In this work we present data on the Extended XAFS (EXAFS) region of the barium K edge as well as on the X-ray Absorption Near Edge Structure (XANES) regin of the titanium K edge. The EXAFS is that part of the XAFS spectrum more than ~20 eV above the excitation energy. For the EXAFS data presented in Sec. Ill, we use Equation 1 to optimize the structural contributions in a fit to our data using a non-linear least-squares minimization. This is done with FEFFIT, a part of the UWXAFS3.0[21' 22]
analysis package. The XANES region is that part of the XAFS spectrum in the vicinity of the excitation edge. In Sec. IV we present XANES data on oriented single crystal samples and show that these XANES spectra are

412 B. RAVEL et al.
TABLE II Multiplicities and lengths of the various near neighbor bond lengths in BaTi03 for the various local symmetries predicted by the displacive model. In the order-disorder model the rhombohedral local structure persists in all phases. All distances are in Angstroms and were determined from the crystallographic data in Ref. 27 at 40 K, 250 K, 300 K for the three „low temperature phases. The cubic distances assume the perovskite structure with a = 4.016 A
local Ba-Ba and symmetry Ba-0 Ba-Ti Ti-Ti Ti-0
3x2.786 1x3.370 rhombohedral 6x2.828 3x3.430 6x4.003 3x1.827
3x2.886 3x3.501 1x3.583
3x2.141
1x2.793 4x2.808 2x3.426 2x3.986 2x1.875
orthorhombic 2x2.837 4x3.468 4x4.018 2x1.997 4x2.854 2x3.532 2x2.146 1x2.897
4x2.808 1x1.829
tetragonal 4x2.824 4x3.417 4x3.991 4x2.000 4x2.868 4x3.522 2x4.035 1x2.206
cubic 12x2.839 8x3.478 6x4.016 6x2.008
sensitive to the angular distribution of the local structure. Taken together, these EXAFS and XANES data show that an order-disorder mechanism predominantly determines the local structure of BaTi03 and that the crystallographic structure and thermodynamic properties of BaTi03 are understood as ensemble or time averages of the disordered local structures.
2. EXPERIMENTAL DETAILS
Our EXAFS measurements were performed on powdered BaTi03 obtained from Aldrich. The particle size of this powder was small compared to the absorption length of the sample and was uniformly dispersed into a quantity of graphite powder. Using small particles, we avoided systematic measure- ment error[23] due to the inherent size inhomogeneities of the powder. The mixture of graphite and BaTi03 was cold pressed into a pellet for easy handling. These measurements were made in the transmission geometry[19]. Low temperatures were obtained with a Displex cryostat and high temperatures with a furnace of our own design. Both apparatus controlled temperature within ±3 K. We measured the barium K edge EXAFS at 9 temperatures with at least two temperatures in each of the four phases.
Our titanium K edge XANES measurements were performed on a single crystal sample of BaTi03 at room temperature in its tetragonal phase. The BaTi03 single crystal was of dimensions 4 mm x 2 mm x 1.5 mm. It was

STRUCTURE AND PHASE TRANSITIONS OF BaTi03 413
etched [24] to release surface strain, and one of the 4 mm x 2 mm faces was polished. The crystal was poled, thus producing a large single crystal with a surface mostly free of 90° domains. By examining the BaTi03 sample under crossed polarizers and at 200x magnification, we found that the polished surface and the bulk of the crystal were a single domain. To assure that the surface of the crystal maintained the same polarization as the bulk, the sample was kept under a 600 V/cm electric field during both storage and data collection. The polished surface was used for data collection. Since the penetration depth of the X-rays at the titanium K edge energy 4966 eV is several microns, the XANES measurement is dominated by the bulk and any small 90° domains remaining on the surface would have negligible impact on the measurement. Our apparatus only allowed us to collect data on the single crystal BaTi03 sample at room temperature.
For comparison to the BaTi03 XANES, we measured the titanium .£edge XANES of a PbTi03 single crystal at room temperature in its tetragonal phase. The PbTi03 crystal was an irregularly shaped wafer about 300 um thick. It was examined under crossed polarizers and a mostly single domain region of approximate dimensions 700 um x 700 um was found. The crystal was placed behind a copper mask which exposed the single domain region to the 500 um x 500 um beam used in the experiment. The content of 90° domains in the illuminated region was less than 5% and surface effects were again negligible due to the long penetration depth of the X-rays.
The single crystal XANES data were taken in the fluorescence geometry[19]. For both single crystal experiments, sample orientations were chosen such that the region around the absorption edge showed no evidence Bragg peaks, which would give spurious structure to the XANES signals. Temperature dependent titanium K edge XANES measurements were made on powder BaTi03 samples prepared in the manner described above and obtained in the transmission geometry.
For both the BaTi03 and PbTi03 single crystal measurements, the X-ray beam was incident upon a surface of the crystal which was parallel to the crystallographic c axis. In the fluorescence measurement geometry, the incident beam strikes the surface at some angle, typically about 45°. We could therfore orient the c axis perpendicular to the X-ray polarization vector I, which is transverse to the direction of propagation of the beam, but not parallel to e. Instead we measured the spectrum with the samples in an orientation such that cos-1 (e-c) = ö«45°. By measuring the PbTi03
sample at three angles 6 and fitting the peak height to a cos2(0) behavior, we determined that 6 = 50.6(8)° for the room temperature XANES measurement. The BaTi03 sample was aligned by eye to 0 = 45(3)°.

414 B. RAVEL et al.
The spectra with e parallel to the aa plane were measured directly. The spectra for e\\c were found by /xc(£) = (fi0-nasm2(9y)/cos2(6).
All measurements were performed at beamline XI1A at the National Synchrotron Light Source (NSLS). A silicon (111) crystal was used to monochromate the X-rays for the titanium K edge experiments and a (311) crystal was used at the barium K edge. A bending magnet generates the X- rays at XI1 A. Optimal energy resolution with these optics is about 0.5 eV at the titanium edge and about 2 eV at the barium edge. The linear polarization of the X-rays was maintained by positioning the sample in the orbital plane of the synchrotron. The monochromator crystals were detuned by about 20% to remove harmonic content from the beam.
3. EXAFS MEASUREMENTS ON BaTi03
A. EXAFS Data and Data Analysis
In previous work on PbTi03 [13,14], we showed by analyzing both the lead L„i and titanium K edge EXAFS, that the local distortion of the titanium atom in PbTi03 is in a tetragonal direction and that it persists into the cubic phase. From this local structural information, we determined that the mechanism of the tetragonal to cubic phase transition is predominantly order-disorder, but also includes a small displacive component as the mag- nitude of the titanium displacement decreases somewhat with increasing
temperature. It was our wish to repeat this analysis for BaTi03, but there is an
experimental difficulty with BaTi03 that is not present with PbTi03. The range of data available imposes a natural bandwidth limiting the information content of the EXAFS signal. The information content of the signal limits the number of parameters that can be determined with the data. It is also used to evaluate error bars and to compare the goodness of fit of different structural models. The information content of the EXAFS signal is determined by the Nyquist criterion[25' 26] as Nf= 2AkAR/ir + 2 where Ak is the extent of the signal as a function of photoelectron wave number and AR is the spatial extent of the signal in the conjugate distance space used to evaluate the parameters in the fit. The range AR corresponds to the furthest distance from the absorbing atom for which structural information may be
obtained in the fit. The excitation energy of the titanium K edge is at 4966 eV and the energy
of the barium Lni edge is at 5247 eV. This spectrum is shown in Figure 1.

STRUCTURE AND PHASE TRANSITIONS OF BaTi03 415
2.5 I c g Q. I f\ /\ *S~^~/ *_ O 2.0 / ^"^ 03 y J2 < Ti tfedge ■D <D 1.5 ~ N
"Öj I E / O 10 r\ ^ -— - z V \y^
Bai -/„edge 0.5 -
n n S. . 4900 5000 5100 5200 5300
Energy (eV) 5400
FIGURE 1 The XAFS spectrum of BaTi03 in an energy range spanning the titanium K edge at 4966 eV and barium Lln edge at 5247 eV. The XANES feature discussed in Sec. IV is shown in the dashed box.
The energy range between the edge steps corresponds to k = S.2 A-1. Because of the large systematic uncertainties in the determination of the background function ^0 at low photoelectron wave number for transition metal oxides, the useful data range is quite small, Ak^5.0A^1. In analysis of the titanium K edge of other titanium perovskites, we fit our data between 1.2 and 4.0 A corresponding to AR = 2.8 A and to Nj ~ 10.9. We found that to define our structure adequately we needed to consider at least fourteen parameters. The data range is thus inadequate to properly define the structure. By co-refining these data with the barium K edge data, six of these variables could be used commonly in the two data sets. Although a co- refinement formally removes the information content restriction, we found that most of these variables were very closely coupled with the background function fi0 and could not be determined in a statistically significant manner. Consequently we used only the barium K edge EXAFS for this work.
We measured the barium K edge EXAFS on powdered samples at 9 temperatures between 35K and 750K, a range spanning all four phases. To test the order-disorder model with these data, we created theoretical fitting standards using FEFF6 and the rhombohedral crystal structure[27] of BaTi03 at 40K. An example of the measured spectrum at 35 K is shown in Figure 2. The fine structure x(k) is isolated from the spectrum by the technique of Ref. 28. x(k) is shown in the inset to Figure 2. The contributions from these paths as calculated by FEFF6 were varied

416 B. RAVEL et al.
37300 37500
Energy (eV) 37700 37900
0 2 4 6 8 10 12
Wavenumber (A"1)
FIGURE 2 Absorption spectrum ji (E) for the barium K edge of BaTi03. The dashed line is the background function u0(£) found form the technique of Ref. 28. The inset plots the fine structure x(k), weighted by k2 to show the detail.
according to Equation 1. The values for N were set as indicated by the rhombohedral local symmetry as shown in Table II. To determine the path lengths R of Equation 1, we used the five structure parameters shown in Table IV as possible fitting variables and from these determined R for each path. Using these five structural parameters as fitting parameters, our fitting model allows the possibility of the cubic, centrosymmetric local structure. The remaining fitting parameters considered were a2 for each of the single scattering (SS) paths, phase corrections parameterized as E0 variations for each species of backscattering atom, and an amplitude correction for the titanium backscatterers. The parameters for all multiple scattering (MS) paths considered in the fits were determined from this set of fitting variables without introducing new variables. For the fits shown in Figure 3, ten free parameters were used. The fitting ranges, information content, and statistical parameters of these fits are shown in Table III. The range in R space included SS and MS paths out to the fifth coordination shell.
Fits to the data at several temperatures using the rhombohedral local structure are shown in Figure 3. We found good agreement to the data using the rhombohedral model at all temperatures. In other work[29], S$ for barium was found to be 1.00(5) and so was set to 1 for these fits. The phase corrections[30] for the three types of backscatterers were expressed as shifts

STRUCTURE AND PHASE TRANSITIONS OF BaTi03 417
0.15
0.10
0.05
0.00
CM
< 0.15
5 0.10
0.05
0.00
0.15
0.10
0.05
0.00
| 600 K -
II I u
i /V^ 300 K -
' / \?\ 35 K ' 9 ^ V
>0°b otA*o V-i V. .-a
0.0 1.0 2.0 3.0 4.0 5.0 Distance (Angstroms)
6.0 7.0
FIGURE 3 Fits to the 35 K, 300 K and 600 K data using the rhombohedral local structure. The amplitude of the complex Fourier transforms of the data and fits are shown. The limits of the fits are depicted by the dashed lines.
TABLE III Fourier transform ranges (Ak), fitting ranges (AR), number of independent points (JV7), the number of parameters used in the fits (P), number of degrees of freedom (v), reduced chi-square (xl), and R-factor (fractional misfit) for the fits to the rhombohedral structure for BaTi03. The ten free variables in these fits were 3 phase corrections, 5 <r2's, the lattice constant a, and <5<vx(£) was weighted by k for all Fourier transforms
temperature Ak AR N, P V xl K
35K [3, 15] [1.6, 5.7] 32.0 10 22.0 84.8 0.0088 150K [3, 15] [1.6, 5.7] 32.0 10 22.0 74.1 0.0062 200K [3, 14] [1.6, 5.7] 29.5 10 19.5 41.8 0.0056 250K [3, 13] [1.6, 5.7] 27.0 10 17.0 48.5 0.0049 300K [3, 12] [1.6, 5.7] 24.5 10 14.5 72.3 0.0045 350K [3, 12] [1.6, 5.7] 24.5 10 14.5 22.7 0.0057 450K [3, 10] [1.6, 5.7] 19.5 10 9.5 12.6 0.0009 600K [3, 10] [1.6, 5.5] 18.4 10 8.4 15.4 0.0008 750K [3, 10] [1.6, 5.5] 18.4 10 8.4 11.2 0.0025
of E0 and were found to be -2.18(70) eV for oxygen, -3.89(87) eV for titanium, and -2.75(1.54) eV for barium relative to the nominal value of 37441eV. The measured c2's were fit with an Einstein temperatures[19]
shown in Table VI. The lattice constant a showed a thermal expansion from 4.001(1) Ä to 4.041(9) Ä between 35 K and 750 K. The parameter 60x varied smoothly from 0.015(6) to 0.027(4) in that temperature range. The other three structural parameters in Table IV showed no change from their initial values outside of their uncertainties and so were fixed to their 40 K values.

418 B. RAVEL et al.
TABLE IV Fitting parameters used in the fits of the barium K edge data to the rhombohedral local structure. The initial values[27] are for the 40 K crystal structure. Three of these parameters had little impact on the quality of our fits and were consistent with their initial values at all temperatures. For the results in Table III these values were fixed to their initial values. They are indicated in the second column
par am. description initial value
a measured the rhombohedral lattice constant
4.0035 Ä
a set the rhombohedral angle 89.84°
STi set the rhombohedral displace- ment of the titanium atom
-0.015
«0, measured the displacement of the oxygen atom in the x and y
directions
0.009
«o.. set the displacement of the oxy- gen atom in the z direction
0.018
B. Interpretation of the EXAFS Data
Although the success of the rhombohedral structural model is good evidence to support an order-disorder model in BaTi03, it is not compelling by itself. We repeated the analytical approach described above on the data in the orthorhombic, tetragonal, and cubic phases. In each of these phase, we used the average structure as the fitting model and created fitting standards with FEFF6 using these average structures. We used the mutiplicities N given in Table II and varied R for each path according to the values of the structural parameters appropriate to the orthorhombic, tetragonal, and cubic phases. In Table V we compare the reduced chi-squares xl for the orthorhombic, tetragonal, and cubic models with the xl from the rhombohedral fitting model. As discussed in Ref. 21, the uncertainty in a good EXAFS measurement is generally dominated by systematic errors. The statistical errors of the measurement are small compared to the uncertainty of the fitting standards and of the removel of the background function /i0. In evaluating xl> we normalize by the estimated statistical uncertainty and
TABLE V A comparison of reduced chi-square for the different local structural models in the orthorhombic, tetragonal, and cubic phases
temp. xl (rhomb.) xl (ortho.) Xl (tetr.) xl (cubic.)
200K 250K
41.8 48.5
32.6 47.9
300K 350K
72.3 22.7
71.1 22.3
450K 600K 750K
12.6 15.4 11.2
12.2 10.4 10.8

STRUCTURE AND PHASE TRANSITIONS OF BaTi03 419
TABLE VI Einstein temperatures for the five single scattering paths considered in the barium K edge fits to the rhombohedral model
SSpath &E
1st shell O 630(99) K 2nd shell Ti 267(5) K 3rd shell Ba 161(4)K 4th shell O 449(80) K 5th shell Ba 152(6)K
would get xl ~ 1 if the statistical errors were dominant. That xl is> in
general, larger than 1 even for fits that looks good upon inspection and give physically reasonable results indicates that systematic errors dominate. We account for this by scaling the error bars on our fitting parameters by a factor of Xv Note that the absolute error in these fits is quite small as the R- factors shown in Table III are less than 1%. The measured values of xl provide a means to compare different fitting models. If the x2's of the two models differ by more than a factor of 1 + (2\/2/'\fv), that the model with the smaller xl is significantly better. As shown in Table V, there is no preference for the rhombohedral model by this criterion.
To distinguish the structural models, we rely on physical arguments. In the fits to the tetragonal and cubic phase data using the tetragonal or cubic local symmetry as our fitting model, we found that <r2's obtained from the minimizations were consistently larger than those found using the rhombohedral local symmetry. These values are shown in Table VII for the cr2's of the barium-titanium bonds. These larger <r2's can be understood in two ways. They can result from a softening of the effective spring constant connecting the atoms. This seems unphysical. As shown in Table II, the barium-titanium bond lengths change by at most 3%, but the change in a2 is much larger. A softening of the spring constant would result in a faster increase of a2 with raising temperature. The results shown in Table VII show discontinuities at each of the phase transitions when the average structure fitting models are used, but the rate of change of a2 with increasing temperature is the same regardless of which structural model is used. A softening of the effective spring constant is inconsistent with the measure- ments. In fact, the temperature dependence of a2 assuming a rhombohedral local structure gives a temperature dependence consistent with a force constant which fits the single Einstein temperature given in Table VI. The second explanation is more physically reasonable. The fit using the cubic local symmetry requires a larger a2 to compensate for the static disorder of the true rhombohedral local symmetry. The rhombohedral fitting model has an inherent amount of static disorder due to the set of barium-titanium path

420 B. RAVEL et al.
lengths used to create the fitting standards. Using the R's and TV's shown in Table II and the static cumulant formulas of Ref. 31, the rhombohedral model has a built-in static disorder of 0.0038 A2. The cubic model has no static disorder, thus requires an enhanced a2 to compensate for its neglect. The orthorhombic and tetragonal models have built-in static disorders of 0.0017 A2 and 0.0028 Ä2 respectively. The CT
2'S shown in Table VII for the
orthorhombic, tetragonal, and cubic phases are systematically larger than for the rhombohedral model. In each case, within their uncertainties, these <T
2'S are those of the rhombohedral model plus a static component to correct
for neglecting the contribution of the rhombohedral model plus a static component to correct for neglecting the contribution of the rhombohedral
disorder. The physical behavior of the <r2s in the rhombohedral fitting model is a
strong argument in favor of the order-disorder model over the displacive model in BaTi03. However, the distinction between the displacive and order-disorder models on the basis of our barium K edge EXAFS data may not be fully compelling. To further resolve this ambiguity, we now examine the Ti K edge XANES spectra.
4. XANES MEASUREMENTS ON BaTi03 AND PbTi03
A. XANES Data
The barium K edge EXAFS data in the previous section could not distinguish the order-disorder and displacive models with statistical significance by use of xl- The titanium K edge EXAFS failed to provide significant information on this question due to its limited k range. Fortunately there is more information in the titanium K edge spectrum that we will now consider.
TABLE VII <r2s of the barium-titanium distance in the high-temperature cubic phase as measured using the rhombohedral and cubic local symmetries. The values for the rhombohedral model come from the Einstein temperature shown in Table VI. All numbers have units of A2
rhombohedral orthorhombic tetragonal cubic
200 K 250 (K)
0.0038(4) 0.0046(5)
0.0070(3) 0.0077(4)
300 K 350 K
0.0055(7) 0.0064(8)
0.0075(10) 0.0085(12)
450 K 600 K 750 K
0.0083(10) 0.0111(12) 0.0140(11)
0.0137(10) 0.0175(10) 0.0170(14)

STRUCTURE AND PHASE TRANSITIONS OF BaTi03 421
Figure 4 shows the XANES spectra of polycrystalline EuTi03, BaTi03, and PbTi03 at room temperature. EuTi03 is a cubic perovskite and the titanium atom resides in a centrosymmetric site and its XANES spectrum shows a tiny peak in the region where both BaTi03 and PbTi03 have large peaks. As this data was obtained on a randomly distributed powder, these measurements are of averages over all possible orientations relative to the X-ray beam.
Figures 5 and 6 show our measurements of PbTi03 and BaTi03 single crystals at room temperature. At this temperature both materials are in their tetragonal phases. In both figures the upper trace is the spectrum for the polarization of the X-rays parallel to the crystallographic c-axis and the lower trace is for the polarization parallel to the aa plane.
Figure 7 shows the temperature dependence of the peak in the titanium K edge for poly-crystalline BaTi03. Data was obtained at temperatures in each of the crystallographic phases, of which the data at 80 K, 300 K and 790 K are shown.
We do not present single crystal data in the cubic phase of BaTi03. In the cubic phase, the special information provided by exploiting the angular dependence of the single crystal measurement is lost. In the case of a displacive transition the special direction in the crystal vanishes at Tc while in the case of the order-disorder model the direction of the local displacement randomizes. In either case, the single crystal data would be identical to the polycrystalline data. Thus we only present the polycrystal- line data shown in Figure 7 as it is much simpler to collect.
A A- o / \ / i- 1.5 f \ft\A O 1 H s\ \ f CO / li"^ \ \ r
J2 1 II \\ // < 1 // ^—-^ T3 / // 0) / // N 1.0 I f\ f CO jjj E ' ' / / / 1— o 1 / Vi^^ / 1 I z: PbTi03 _y J^-^ 1 1
0.5 ' f\ ' ^—^—^ i BaTi03 jAf /
n n EuTi03 _\y—;
4950 4960 4970 4980 Energy (eV)
4990
FIGURE 4 XANES spectra of polycrystalline EuTiQ3, BaTi03 and PbTi03 at 300 K.

422 B. RAVEL et al.
O CO
< T3 CD N
"co E o
1.5 - -
1.0 - r 1 / A AJ
0.5 E//c
_>=-__ J , Ella
4950 4960 4970 4980 Energy (eV)
4990
FIGURE 5 XANES of PbTi03 with the X-ray polarization parallel (top) and perpendicular (bottom) to the crystallographic c-axis.
'4950 4960 4970 4980 Energy (eV)
4990
FIGURE 6 XANES of BaTi03 with the X-ray polarization parallel (top) and perpendicular (bottom) to the crystallographic c-axis.
B. Interpretation of the XANES Data
At the titanium K edge, a \s electron having initial angular momentum 1 = 0 is excited. Because dipole transitions dominate in (i{E) the final state of the photoelectron will be of angular momentum /= 1 due to the dipole final state selection rule. The interaction between the photoelectron excited by the

STRUCTURE AND PHASE TRANSITIONS OF BaTiO, 423
4950 4970 Energy (eV)
4990
FIGURE 7 XANES of polycrystalline BaTi03 at temperatures in the rhombohedral (80 K), tetragonal (300 K), and cubic (590 K) phases.
polarized radiation and a single crystal is illustrated in Figure 8. The directional sense of the excited / = 1 photoelectron is determined by the direction of polarization of the incoming photons. As the photoelectron has no amplitude in directions perpendicular to the direction of polarization, n(E) will contain no information concerning the local environment about the titanium atom perpendicular to the polarization.
XANES spectra of transition metal oxides are strongly dependent of the symmetry of the transition metal site. Titanium and other transition metals possess unoccupied electron states of d character. These states are inaccessible to the dipole excitation of an s electron. The displacement of the transition metal from its site of centrosymmetry drives the mixing of p character from the surrounding oxygen octahedron with the d character of the transition metal atom. The presence of a large peak in the XANES spectrum before the main rise in the spectrum is the signature of a large displacement of the transition metal atom from its site of point centrosymmetry. In the absence of this displacement, the peak is tiny or absent. It is convenient to parameterize the distortion from centrosymmetry by a vector d. Assuming that this distortion is a small perturbation to the structure and treating it by perturbation theory, the area A under the peak is related to dby
A oc ((e -d)). (2)

424 B. RAVEL et al.
FIGURE 8 lattice.
Schematic of the interaction between the / = 1 photoelectron and a square
where the angle brackets represent an ensemble average, possibly over relative orientations of e and d. In the case of polarized radiation incident on a single domain single crystal, the peak is sensitive to the direction of d. Equation 2 is a simplication suitable to our discussion of a more general statement for displacements within a structure of^ arbitrary symmetry for which the area is related to the components of d through a fourth rank tensor. In the case of a rhombohedral distortion and polycrystalline data, the parameter d is the displacement of the titanium atom from the midpoint
of the oxygen octahedron. Equation 2 has been confirmed by a multiple scattering theory of
XANES. In previous results[32'33] by Vedrinskii, Kraizman and their collaborators, good agreement was found between calculated and measured spectra in titanium containing perovskites. Figure 9 shows examples of this agreement for EuTi03 and PbTi03. These calculations reproduce well the peak in the presence of a local distortion such as that in PbTi03 and show no peak for the undistorted EuTi03. They also confirm the angular dependence of Equation 2 as they reproduce well[32] the angular dependent

STRUCTURE AND PHASE TRANSITIONS OF BaTiO, 425
4960 4970 4980 Energy (eV)
4990
FIGURE 9 A comparison of calculationI33] (solid) and measurement (circles) for the pre-edge structure of polycrystalline EuTi03 and PbTi03.
XANES discussed below. From studies of various titanium containing perovskites, the relation of Equation 2 was confirmed.
Examining the polycrystalline data shown in Figure 4 with Equation 2, it follows that the titanium atom sits in a non-centrosymmetric site in BaTi03
and PbTi03, as there is a distinctive peak in each of these spectra. However information about the direction of Jis not available in polycrystalline data. To determine the direction of d, we examine the single crystal spectra of PbTi03 and BaTi03 shown in Figures 5 and 6. We immediately see a significant variation in the oriented spectra of PbTi03 but only a small variation in the spectra of BaTi03. As discussed in the following paragraphs, the PbTi03 data indicate a tetragonal titanium distortion, i.e. Jis along a (001) axis, while the BaTi03 data indicate a nearly rhombo- hedral displacement, i.e. dapproximately along a (111) axis.
To understand why the BaTi03 and PbTi03 XANES data indicate these directions for the titanium distortions, consider the local environments about the titanium atom predicted by the displacive and eight-site models. They are depicted in the cartoon shown in Figure 10. Figure 10a shows the tetragonal titanium distortion predicted by the displacive model for a crystallographically tetragonal phase. The titanium atom, depicted by the head of the arrow, is displaced in the (001) direction. The entire crystal is tetragonally distorted and the macroscopic polarization points along a tetragonal axis. If the polarization vector of the X-rays is parallel to the

426 B. RAVEL et al.
r
t 4
V
i <
II—o—o—
o—o—it—
(a) (b) FIGURE 10 Cartoon representing the local structures of tetragonal BaTi03 in the displacive (a) and order-disorder (b) models. The macroscopic polarization P is in the c direction. The large arrow between the panel indicates the direction of the macroscopic polarization and the c-axis of the crystal. The black circles represent the barium atoms, the heads of the arrows represent the titanium atoms, and the oxygen atoms have been left out.
crystallographic c axis, thus parallel to d, the area A under^the peak will be large. If the polarization is perpendicular to d, then e • d = 0 and A will vanish. This picture is consistent with the PbTi03 data but not with the BaTi03 data. Previous EXAFS measurements[I3' 14] proved the tetragonal local structure of PbTi03. A local tetragonal distortion of the titanium atom in BaTi03, though, would be inconsistent with its XANES spectra, as the peak does not vanish when the polarization is perpendicular to the c axis.
Figure 10b shows a two-dimensional "four-site" schematic of the eight- site model for a crystallographically tetragonal phase. In this model, the titanium atom is always displaced towards the corner of the unit cell. In three dimensions this displacement is in a (111), or rhombohedral, direction. In this phase, the titanium displacement is randomly distributed among those directions with a positive component along the c-axis. In each unit cell, the local distortion and the local dipole point in a rhombohedral direction. When these vectors are averaged over the entire crystal, the observed displacement and macroscopic polarization point in a tetragonal
direction. XAFS, however, is sensitive only to the local structure. When the pola-
rization of the X-rays is parallel to the crystallographic c-axis in Figure 10b, I and d form a 45° angle. When the polarization is perpendicular to the crystallographic c-axis, e and d again form a 45° angle. In both orientations
cos -i/ = (e-d) = 45°, thus A\\=A±; This is close to the behavior of the data in Figure 6. These spectra demonstrate that the order-disorder model describes the tetragonal phase of BaTi03.

STRUCTURE AND PHASE TRANSITIONS OF BaTi03 427
In the range of temperatures shown in Figure 7, the area under the peaks changes from 0.20(6) eV at 80 K to 0.15(4) eV at 590 K. By Equation 2,the magnitude of <? decreases by only about 13% from its value of 0.19(5)A as measured from our 35 K EXAFS data. In this temperature range, the thermal root mean square displacement of the titanium atom from its site near the center of the oxygen octahedron expected given the values of a2 for the titanium-oxygen bond are much too small to account for the size of the peak[34]. Since the local distortion persists well into the cubic phase, these data, like the polarization dependent data in Figure 6, cannot be explained by the displacive model. Together with the barium EXAFS results, these XANES spectra demonstrate that the local displacement of the titanium atom in BaTi03 is in a rhombohedral direction at all temperatures and that an order-disorder model explains the dominant behavior of the local structure throughout its the phase transitions. The small displacive component of d is smooth through the various phase transitions and \d\ > 0 at all temperatures.
5. DISCUSSION
We have measured the barrium K edge EXAFS of BaTi03 as a function of temperature in a range spanning all four phases. We have shown that a rhombohedral distortion of the local structure can explain the data at all temperatures. This interpretation of the EXAFS, however, is not unique. A displacive model can also adequately fit the EXAFS data, although the order-disorder model is preferable by physical argument. To resolve this ambiguity we measured polarization and temperature dependent titanium K edge XANES. The behavior of the XANES data are inconsistent with a displacive model, but can be explained by an order-disorder model. The presence of an order-disorder behavior in the phase transitions of BaTi03 is consistent with similar behavior observed in various other perovskites including PbTi03
tl3'14], KTa0.9iNb0.09O3[15], NaTa03
[16], Na0.82K0.i8- Ta03
[16] and PbZr03[17] and appears to be systematic in these materials.
While our results clearly demonstarte the presence of local distortions both below and above the ferroelectric to paraelectric transition in BaTi03, many properties of BaTi03 such as the observed soft mode are well explained by a displacive model. This is not a contradiction. As observed by the authors of Ref. 35, the soft mode properties are determined by the correlated collective displacements within a crystal while the local displacements measured by XAFS are determined only by short-range

428 B. RAVEL et al.
correlations. A recent model by Girshberg and Yacoby[18] considers this possibility by coupling local displacements with a soft mode. In KNb03, the soft mode in the presence of the local displacement of the niobium atom[151
is found not to be overdamped and their calculations reproduce infrared and hyper-Raman measurements[36] of KNb03. Given the many similarities between KNb03 and BaTi03, we believe that the model of Girshberg and Yacoby applies here as well.
It is important to understand the Raman specturm of BaTi03 in the context of our results. The temperature dependence of the BaTi03 Raman spectrum clearly shows[3] the behavoir expected if the local structure is the same as the average crystallographic structure in each of the phases. The critical difference between the XAFS and Raman measurements is their time scales. The lifetime of the Raman excitation is around 10~9 sec while the lifetime of the XAFS excitation is determined by the lifetime of the core hole vacated by the X-ray, about 1.5xl(T15 sec. The two results can be made consistent by assuming that the titanium atoms hop between the various sites allowed by the order-disorder model in each phase on a time scale between the Raman and XAFS lifetimes. Thus the XAFS measurement is a snapshot of a dynamic system that is temporally averaged by the Raman measurement. This hopping explains the observation of disorder behavior in the infrared reflectivity[8], cubic phase X-ray diffraction[9], electron spin resonance1101, and impulsive stimulated Raman scattering[11'I2] experiments mentioned in Sec. I and does not contradict thermodynamic properties of BaTi03 which average over time scales much longer than the hopping time.
The thermal diffuse scattering results of Holma et al.[37] also merit comment. They found superior agreement to their data with Hiiller's model of dynamic correlations[7] than with Comes' simple application[4] of eight- site static disorder. We suggest that dynamic correlations in the motion about the disordered atom positions coexist with hopping between the disordered sites. Recent first principles calculations[38'39] of BaTi03 show exactly this behavior and may be sufficient to account for the observed profiles of the diffuse sheets. This behavior is consistent with the model of Girshberg and Yacoby.
Finally we wish to revisit Figure 6 as it contains one more hint of the true local structure of BaTi03. The peaks in the parallel and perpendicular orientations are of similar area, but not quite the same. The areas under these peaks are A\\ = 0.39(04) eV and AL =0.17(02^ eV. Applying Equation 2 to these areas we find them consistent with d lying 11.7(1.1)° towards the c axis away from the (111) axis. This is a believable result for the tetragonal phase. The presence of a macroscopic polarization reasonably

STRUCTURE AND PHASE TRANSITIONS OF BaTi03 429
could bias the locations of the minima in the local adiabatic potential slightly away from the (111) axes in the direction of the macroscopic polarization. Our measurements show a slightly altered case of the eight-site model wherein the strain introduced by the macroscopic polarization is accommodated by the appropriate displacements of the adiabatic minima away from the (111) axes. Although we cannot resolve this sort of fine detail about the local structure with statistical significance using the barium K edge EXAFS data, this modified eight-site model provides a complete explana- tion of our XANES data.
6. SUMMARY AND CONCLUSIONS
The EXAFS data at the barium K edge as a function of temperature on polycrystalline samples of BaTi03 are consistent with an eight-site model for the displacements from the cubic sites. The model assumes local displace- ments in all phases along the eight (111) directions. The macroscopic, spontaneous polarizations in the three ferroelectric phases and the absence of a macroscopic polarization in the paraelectric phase are explained by the disordering of the local displacements as suggested by Bersuker [61 and Comes et al.[4] The definitive proof of the eight-site model for the local structure comes from the XANES as the orientation of the X-ray polarization is varied relative to the c axis of the tetragonal phase. Our XAFS results give qunatitative information about the displacements of the eight-site model. The titanium atoms are displaced from the center of the surrounding oxygen octahedron by 0.19(5) A at 35 K. This displacement diminishes to 0.16(5) A by 750 K. The displacements in the tetragonal phase are actually displaced from the (111) direction by 11.7(1.1)° towards the c axis. Our single crystal measurements were performed under an electric field along the c axis in the tetragonal phase. We did not measure the rotation of the distortion towards the direction of the electric field as a function of the strength of the electric field. Our orignal intent in applying the field was to pole the crystal and to maintain a large single domain. In the future, we hope to investigate the dependence of this rotation on the strength of the applied electric field.
References
[1] Wul, W. and Goldman, I. M. (1946). C. R. Acad, Sei. Russ., 46, 139. [2] Cochran, W. (1960). Advances in Physics, 9, 387.

430 B. RAVEL et al.
[3] Burns, G. and Dacol, F. (1978). Phys. Rev. B, 18, 5750. [4] Comes, R., Lambert, M. and Guinier, A. (1968). Solid State Communications, 6, 715. [5] Comes, R., Lambert, M. and Guinier, A. (1970). Ada Crystallographica, A26, 244. [6] Bersuker, I. (1966). Phys. Lett., 20, 589. [7] Hüller, A. (1969). Solid State Communications, 1, 589. [8] Gervais, F. (1984). Ferroelectrics, 53, 91. [9] Itoh, K., Zeng, L., Nakamura, E. and Mishima, N. (1985). Ferroelectrics, 63, 29.
[10] Muller, K., in Nonlinearity in Condensed Matter, edited by A. Bishop (Springer, Heidelberg, 1986), p.234.
[11] Dougherty, T. P., Wiederrecht, G. P., Nelson, K. A., Garret, M. H., Jenssen, H. P. and Warde, C. (1992). Science, 258, 770.
[12] Dougherty, T. P., Wiederrecht, G. P., Nelson, K. A., Garret, M. H., Jenssen, H. P. and Warde, C. (1994). Phys. Rev. B, 50, 8996.
[13] Sicron, N, Ravel, B., Yacoby, Y., Stern, E. A., Dogan, F. and Rehr, J. J. (1994). Phys. Rev. B, 50, 13168.
[14] Ravel, B., Sicron, N., Yacoby, Y., Stern, E. A., Dogan, F. and Rehr, J. J. (1995). Ferroelectrics, 164, 265.
[15] Hanske-Petitpierre, O., Yacoby, Y., Mustre de Leon, J., Stern, E. A. and Rehr, J. J. (1991). Phys. Rev., B, 44, 6700.
[16] Rechav, B. et al. (1994). Phys. Rev. Lett., 72, 1352. [17] Sicron, N, Yacoby, Y. and Stern, E. A., J. Phys. IV, (Colloques) (to be published April,
1997). [18] Girshberg, Y. and Yacoby, Y. (1997). Sol. St. Comm., 103(7), 425. [19] Stern, E. A. and Heald, S. M., in Handbook of Synchrotron Radiation, edited by E. E.
Koch (North-Holland, New York, 1983) Chap., 10, pp. 995-1014. [20] Zabinsky, S. I. et al. (1995). Phys. Rev. B, 52, 2995. [21] Stern, E. A. et al. (1995). Physica B, 208 & 209, 117. [22] The UWXAFS3.0 analysis package described here is © The University of Washington.
For applicability, availability and licensing information contact E. A. Stern at stern @ Phys. Washington, edu.
[23] Lu, K. Q. and Stern, E. A. (1983). Nuc. Inst. Meth., 212, 475. [24] Garret, M. H., Chang, J. Y., Jenssen, H. P. and Warde, C. (1991). Ferroelectrics, 120, 167. [25] Brillouin, L., Science and Information Theory (Academic Press, New York, 1962). [26] Stern, E., Phys. Rev. B, 48, 9825. [27] Kwei, G H., Lawson, A. C, Billinge, S. J. L. and Cheong, S. W. (1993). J. Phys. Chem.,
97, 2368. [28] Newville, N. et al. (1993). Phys. Rev. B., 47, 14126. [29] Haskel, D. et al, to be published in Phys. Rev. B (unpublished). [30] Haskel, D., Ravel, B., Newville, M. and Stern, E. A. (1995). Physica B, 208&209, 151. [31] Bunker, G. (1983). Nuc. Inst. Meth., 207, 437. [32] Kraizman, V. L., Novakovich, A. A, Vedrinskii, R. V. and Timoshevskii, V. A. (1995).
Physica B, 208&209, 35. [33] Vedrinskii, R. V., Kraizman, V. L., Novakovich, A. A., Urazhdin, S. V., Ravel, B. and
stern, E. A., J. Phys. IV (Colloques) (to be published April 1997). [34] Ravel, B. and Stern, E., J. Phys. IV(Colloques), (to be published April 1997). [35] Stern, E. A. and Yacoby, Y. (1996). J. Phys. Chem. Solids, 57, 1449. [36] Vogt, H., Fontana, M. D., Kugel, G E. and Günter, P. (1986). Phys. Rev. B, 34, 410. [37] Holma, M., Takesue, N. and Chen, H., Ferroelectrics, 164, 237. [38] Padilla, J., Zhong, W. and Vanderbilt, D. (1996). Phys. Rev. B, 53, R5969. [39] Krakauer, H. (1997). Ferroelectrics in this volume.

Ferroelectrics, 1998, Vols. 206-207, pp. i-ii Reprints available directly from the publisher Photocopying permitted by license only
i 1998 OPA (Overseas Publishers Association) Amsterdam B.V. Published under license
under the Gordon and Breach Science Publishers imprint.
Printed in India.
AUTHOR INDEX
Proceedings of the 1997 Williamsburg Workshop on Ferroelectrics
Volumes 206, Numbers (1-4) & 207, Numbers (1-2)
Bhalla, A. S. 123 Blinc, R. 11 Borstel, G. 69 Bussmann-Holder, A. 47
Cann, D. P. 325 Cao, W. 355 Chen, H. 55, 219, 231 Chen, I.-W. 231, 245 Cheng, H.-F. 393 Chou, C.-C. 293, 393 Cohen, R. E. 1
Dalai, N. S. 103 Davies, P. K. 231 Dmowski, W. 231
Egami, T. 231 Evans, Jr., H. T. 123
Fendler, J. 381 Frey, M. H. 337
Ghosez, Ph. 205 Gonze, X. 205 Guo, R. 123
Han, P. 337 Hou, C.-S. 393
Katiyar, R. S. 307 Khachaturyan A. G. 157 Kim, B.-G, 79 Kim, J.-J. 79 Kitamura, M. 55 Klymachyov, A. N. 103 Kraizman, V. 407
Krakauer, H. 1, 133 Kubo, H. 219
Lacey, J. L. 381 Lasota, C. 133 Lee, C.-C. 293 Li, J.-F. 275
McCauley, D. E. 325 Mele, E. J. 31 Michenaud, J.-P. 205 Musevic, I. 11 Mueller, V. 113
Pattnaik, R. 93 Payne, D. A. 337 Postnikov, A. V. 69 Poteryaev, A. I. 69
Rabitz, H. 265 Ramer, N. J. 31 Randall, C. A. 325 Rappe, A. M. 31 Ravel, B. 407
Säghi-Szabö, G. 1 Skarabot, M. 11 Scott, J. F. 365 Semenovskaya, S. 157 Shepard, Jr., J. F. 381 Siny, I. G 307 Stern, E. A. 407 Su, T. 381
Takesue, N. 219 Tan, Q. 275 Teslic, S. 231 Toulouse, J. 93 Trolier-Mckinstry, S. 381 Tsai, D.-S. 293

ii AUTHOR INDEX
Vanderbilt, D. 181 Xu, Z. 337 Vendrinskii, R. I. 407 Viehland, D. 275 Yu, R. 133 Vugmeister, B. E. 265
Zavala, G. 381 Wang, C.-Z. 133 zhanS> Q- M. 113 Wang, Y. 245 zhong> w- 181

School of Industrial and Manufacturing Science y^JTCtTTTlf^lCl' I UNIVER! IVERSITY
FERROELECTRICS AND THEIR APPLICATIONS
Cranfield University Cranfield
Bedfordshire MK43 OAL England
Fax+44 (0) 1234 750875 Telex 825072 CRANbN G
Tel +44(0)1234 750111
Ferroelectric materials permeate a vast range of industrial, military, commercial and domestic applications, including: piezoelectric gas ignitors, sounders, microphones, hydrophones, accelerometers (eg in air bags) RF and microwave filters in radio & TV, IR detectors for burglar alarms and light switches and the multi-layer capacitors which are indispensable components in all pieces of electronic equipment. They thus impinge on everyone's lives in many ways but are, nevertheless, a poorly understood group of materials. A new set of engineering applications of these materials is emerging, such as: in 'smart' materials which are beginning to be used in the control of vibrations and noise in helicopters; as the active materials in a new range of uncooled thermal imagers (eg for military and firefighting applications); as the actuators for low-cost ink-jet printers, 'smart' automotive suspensions and video recorder heads. In thin film form they will be used for the next generation of static and dynamic silicon memories and the sensing and actuation elements in the emerging field of silicon microsystems.
The Department of Advanced Materials at Cranfield University's School of Industrial and Manufacturing Science is pioneering a new residential short course on Ferroelectrics and their Applications. This unique course will meet a growing need for a deeper understanding of these materials and how they are applied in a wide range of devices.
The 5 day course will be presented at Masters level and has been set up to give engineers and scientists using or wishing to use these materials the opportunity to develop their knowledge under the tuition of some of the world's leading figures in this technology. To supplement lectures, example and practical classes will be used to teach parts of the course.
A firm grounding will be laid in the basic properties of the materials and how these relate to crystal structure and materials form. The properties of, and fabrication techniques for, single crystal, polymeric, and especially ceramic and thin film ferroelectrics will all be reviewed with reference to particular materials examples. The major current emerging applications for ferroelectrics will be surveyed and the rationale for selecting particular materials will be discussed. Future trends in the industry will also be explored and discussed.
Cranfield is Britain's leading centre for post-graduate teaching and applied research and development in industrial technology and is Britain's top academic earner for industrial and commercial research. Cranfield's determination to remain at the top in wealth creation in the UK and overseas will be reflected in the relevance of this course to meeting industry needs.
The School of Industrial and Manufacturing Science combines a Wide range of expertise in key scientific, technological and management fields, and already plays an important part in providing continuing professional development and applied research. It is able to provide services across the complete spectrum of industrial need; from materials research and development, through design, manufacturing, quality management and manufacturing management, thus creating a unique academic centre for one-stop shopping in industry.
For more information contact: " Mrs Marion Walls. Tele: 01234 754043 Fax: 01234 751572
PRESS RELEASE -JMMEÖJATE

Electroceramics VI 1998
International Symposium Oä Applications of Ferroelectrica
European Conference on. Applications of Polar Dielectrics
International Conferences on Functional Electroceramics and
Thin Films, Polar and Ferroelectric Materials and
their Applications
First Announcement
Congress Centre Montreux Switzerland
24 - 27 August 1998
Contact address:
ELECTROCERAMICS VI LC-DMX-EPFL
CH-1015 LAUSANNE E-Mail: [email protected]
http://dmxwww.epfl.ch/lc/electro/home.html
(Pfl ECOLE POLYTECHNIQUE FEDERALE DE LAUSANNE

SECOND ANNOUNCEMENT The Fifth International Symposium on
Ferroic Domains and Mesoscopic Structures (ISFD-5)
6-10 April, 1998 The Perm State Conference Center
215 Innovation Boulevard State College, Pennsylvania 16801 USA
This is an international symposium series with a mission to exchange research information on the study of domains and mesoscopic structures in ferroic materials. The last four consecutive symposia were hosted in Russia, France, Poland and Austria and the symposium proceedings were published as special issues of Ferroelectrics. This is the first time the symposium will be held in the United States. It is intended to bring together scientists and engineers all over the world who are engaged in different aspects of domains and meso- scopic structural studies, including fundamental research, microstructural fabrication, material property characterization and practical devices.
Theme of ISFD-5
The meeting themes concern domains and other mesoscopic structures in ferroelastic and ferroelectric materials. Such materials are widely used in practical applications. One of the most important types of ferroelastic mate- rials is the shape memory alloy, which could be used for thermal engines and outer space preshaped devices. Ferroelectrics are used in capacitors, so they exist in practically every electronic device. The strong piezoelectric effect of ferroelectric materials also makes them ideal for transducers, actuators and sensors. In recent years, the fast development of thin film technology has spurred development of ferroelectric nonvolatile memory devices.
Scientists have long realized that all these useful properties in ferroic materials are impacted by the domain microstructures. In order to better tai- lor these properties, a more fundamental understanding of mechanisms and improved ways to control these microstructures are urgently needed. There are many challenging problems associated with these microstructures, such as phase transitions, boundary effects, thermal processes, fabrication condi- tions and characterization methods. It requires multiple disciplines to tackle these problems. This ISFD-5 will bring together experts from all over the world to exchange their research results and to form international collabora- tions to advance the fundamental understanding and the technologies asso- ciated with domain phenomena.

SCIENTIFIC PROGRAM
There will be both theoretical and experimental components to this sympo- sium. We plan to have seven sessions and the focus of each is outlined below:
1. Phase Transitions and Mesoscopic Structures The majority of ferroic materials are produced through a temperature dri- ven structural phase transformation. The transformation can be either sec- ond order or first order. The low temperature phase usually has a lower sym- metry and therefore consists of more than one variant. The transformation kinetics can be different from material to material and the microstructure can also be controlled by temperature and mechanical boundary conditions. This session will focus on the phase transformation process and the transfor- mation kinetics. It will also include studies of domain formation processes and the varieties of irregular mesoscopic structures that can be formed dur- ing the phase transition. Computer simulation of microstructural formation will also be one of the topics in this session.
2. Domain Dynamics The main focus of this session is the dynamics of domains and other microstructures. It is known particularly in bulk materials that the mobility of domain walls plays an important role in the macroscopic properties. The mobility of domain walls depends strongly on the defect dopants which can either pin or facilitate the domain wall motion. There are many fascinating topics relating to fabrication, modeling and domain dynamics. In addition, hysteresis in the switching process will be a topic in this session. It will also include research on the nucleation and growth of domain microstructures and the effects of external electrical and stress fields.
3. Characterization Techniques Traditional techniques for the observation of domains and mesoscopic structures include transmission electron microscopy, scanning electron microscopy and optical microscopies. These techniques, although successful, have their limitations. In recent years, many observation techniques have been developed, such as atomic force microscopy, dielectric microscopy, elec- tron holography and high energy X-ray methods. This session will review some of the new work from traditional techniques and update the partici- pants on several new observation techniques.
4. Constrained Domains in Thin Films It is found that the behavior of domains and the formation of microstruc- tures are quite different in thin film systems compared to bulk materials. Fundamental questions of dimensionality effects and mechanical boundary conditions are of great interest to the scientific community. This session will

be devoted to the microstructural study of thin film systems. Topics will range from theory, to fabrication, to characterization, all the way to devices. Invited speakers have been asked to discuss the difference between bulk and thin film domain structures and their influence in material properties.
5. Phenomenology, Group Theory and Microscopic Modeling In structural phase transitions, there is a symmetry change associated with the formation of the ferroic phase. Such symmetry changes are predictable based on group theory. Using the invariant energy, one can describe the phase transition and many physical properties of a ferroic system using Landau-Ginzburg-Devonshire phenomenological theory. There are also many theoretical models based on first principle calculations that predict ferroic phase transitions. Computer simulations of the formation of domain microstructures will also be included and reviewed in this session.
6. Application of Domain Structures Besides enhancing the physical properties of bulk materials, domains also have unique merits for some practical applications, for example, 3-dimen- sional recording through electro-optical effects, periodic domains for blue laser generation, etc. This session will be devoted to innovative applications of domains and the influence of domains in device performance.
7. Liquid Crystals and Polymers There are many similarities between ferroelectric liquid crystals and solids in terms of domain structures. On the other hand there are also important differences, particularly in terms of symmetry considerations. The domain pattern in liquid crystals are determined by flow and boundary conditions rather than the symmetry of the parent phase. Defects are critical for the final stable configurations in liquid crystals. This session will include both theoretical descriptions and experimental investigations on liquid crystal and polymer systems.
General Chair Professor Wenwu Cao Dept. of Mathematics and
Materials Research Laboratory 164 Materials Research Laboratory The Pennsylvania State University University Park, PA 16802 USA Phone: (814) 865-4101 Fax: (814) 865-2326 email: [email protected]
Local Chair Professor Susan Trolicr-McKinstry Dept. of Mat. Sei. and Engr. and
Materials Research Laboratory 149 Materials Research Laboratory The Pennsylvania State University University Park, PA 16802 USA Phone: (814) 863-8348 Fax: (814) 865-2326 or 865-7593 email: [email protected]

Technical Chair Professor Clive A. Randall
Dept. of Mat. Sei. and Engr. and Materials Research Laboratory
151 Materials Research Laboratory The Pennsylvania State University
Univesity Park, PA 16802 USA Phone: (814) 863-1328
Fax:(814)865-2326 email: [email protected]
ADDITIONAL ORGANIZATION COMMITTEE MEMBERS
Professor L. Eric Cross Materials Research Laboratory 187 Materials Research Laboratory The Pennsylvania State University University Park, PA 16802 USA
Professor Robert E. Newnham Department of Materials Science and
Engineering 251 Materials Research Laboratory The Pennsylvania State University University Park, PA 16802 USA
Professor Dorian Hatch Department of Physics Brigham Young University Provo, UT 84602 USA
Professor Manfred Wuttig Department of Materials and Nuclear
Engineering University of Maryland College Park, MD 20742-2115 USA
INTERNATIONAL ADVISORY COMMITTEE
C. Boulesteix (France) L. F. Cross (USA) D. Feng (China) J. Fousek (Czech Rep.) T. Hahn (Germany) J. Hatano (Japan) B. Hilczer (Poland)
Y. Ishibashi (Japan) V. Janovec (Czech Rep.) A. Krumins (Latvia) R. Le Bihan (France) G. Rosenman (Israel) E. Salje (United Kingdom) H. Schmid (Switzerland)
J. F. Scott (Australia) A. V. Shil'nikov (Russia) L. A. Shuvalov (Russia) I. Stasyuk (Ukraine) G. Van Tendeloo (Belgium) V. K. Wadhawa (India) H. Warhanek (Austria)
INVITED AND PLENARY SPEAKERS INCLUDE {partial listing):
L. Bursill (plenary) M. Chen R. Cudney D. Damjanovic P. Davies
A. DeSimone V. Dravid S. Ducharme T Egami I. Eng
C. Foster W. Hässler D. Hatch S. Jiang A. Khachaturyan

A. Kholkin O. Larentoritch J. Levy V. Müller N. Pertsev J. Privratska
I. Reaney G. Roseman E. Salje (plenary) S. Streiffer A. Tagantsev V. Topolov
A. Turik B. Tuttle (plenary) S. Wada M. Wuttig
ABSTRACT
See the "Abstract Guide" enclosed for preparation and submission of abstracts. Those submitting abstracts will be sent the Gordon and Breach guidelines for the paper to be published in Ferroelectrics.
Abstracts due: 21 November 1997
IMPORTANT DATES
21 November 1997 30 January 1998 15 February 1998 6 April 1998 7-10 April 1998
Abstract Deadline Pre-Registration Deadline Deadline for Cancellation ISFD-5 Registration and Reception ISFD-5 Symposium
REGISTRATION INFORMATION
All symposium attendees must register. The completed "Advance Registra- tion Form" and registration fees should be sent to the appropriate address listed on the form. The symposium registration fee includes all conference materials, admittance to all technical sessions, coffee breaks, reception, ban- quet. On-site registration will be done at the conference center. For advance registration at the reduced rate, the remittance (in US Dollars) must accom- pany the Advance registration Form by 15 February 1998.
Pre-Registration Deadline: 30 January 1998 Deadline for Cancellation: 15 February 1998
COMPANIONS PROGRAM
Please see the "Registration Information" included in this packet for com- plete details.
ACCOMMODATION INFORMATION
See the "Accommodation Information" included in this packet for complete details.

FINANCIAL ASSISTANCE TO PARTICIPANTS
A limited amount of funds are available to support some speakers from out- side the United States. This is mainly to meet the registration cost and par- tial local expenses. In either case a formal written request, stating the justification and funds needed, should be sent to the General Chair and must be received by 21 November 1997.
STUDENT ASSISTANCE
A limited amount of funds are also available for student assistance to the symposium. If assistance is needed, a request must be made in writing to the General Chair. Requests must be received by 21 November 1997. Decision will be based on need and quality of the abstract for the presentation.
UNIVERSITY POLICIES
Access - Penn State encourages qualified individuals with disabilities to par- ticipate in its programs and activities. If you anticipate needing special accommodations or have questions about the physical access provided, please contact Tina Confer at (814) 865-1154 before your visit. Cancellation - The University may cancel or postpone any course or activity because of insufficient enrollment or other unforeseen circumstances. If a program is cancelled or postponed, the University will refund registration fees but cannot be held responsible for any other related costs, charges, or expenses, including cancellation/change charges assessed by airlines or travel agencies.
This publication is available in alternative media on request. The Pennsyl- vania State University is committed to the policy that all persons shall have equal access to programs, facilities, admission, and employment without regard to personal characteristics not related to ability, performance, or qualifications as determined by University policy or by state or federal authorities. The Pennsylvania State University does not discriminate against any person because of age, ancestry, color, disability or handicap, national origin, race, religious creed, sex, sexual orientation, or veteran status. Direct all inquiries regarding the non discrimination policy to the Affirmative Action Director, The Pennsylvania State University, 201 Willard Building, University Park PA 16802-2801; tel. (814) 863-0471; TDD (814) 865-3175.

ABSTRACT GUIDE
TITLE: INSTRUCTIONS FOR PREPARING ABSTRACT
A. A. FIRST, B. SECOND and C. C. THIRD
Department of Important Research, Well Known Institution Street, City, State, Postal Code
This sample abstract illustrates the format for preparing abstracts for The Fifth International Symposium on Ferroic Domains and Mesoscopic Structures (ISFD-5). The abstract should describe succinctly the results being reported.
Authors must prepare their abstract for direct reproduction in the abstract book. The abstract will appear precisely as the author prepared it. Abstracts must be typed neatly on plain white paper, single spaced with type size no smaller than elite (12 characters/inch, 10 point size). The typewritten title- authors-text material must fit into a 6.0 in wide x 7.5 in long rectangle. The title must be all in capitals, underlined (or bold), and centered. Leave one blank line under the title and type the authors' names, centered and in capitals, underline presenting author. Centered on the next lines, type the affiliation and address. Leave one blank line and begin the body of the abstract. Any references or sup- port acknowledgments must be included within the text of the abstract. Line drawings may be included within the text, but gray scale images do not repro- duce well. The name and particulars of the corresponding author, along with any of the listed sentences that are applicable (as shown below) must lie outside the 6.0 in x 7.5 in rectangle containing the title-authors-text information.
Mail the original of your abstract with copy on disk to: (please indicate word processing program used)
Ms. Tina M. Confer 187 Materials Research Laboratory The Pennsylvania State University
University Park, PA 16802-4800 USA (814)865-1154
(814) 863-7846 (fax) email: [email protected]
Dr. A. A. First Department of Important Research
Well Known Institution 1234 Street, City, State, Postal Code
Phone: (012) 345-6789, Fax: (098) 765-4321 E-mail: [email protected]

Type any of the following sentences that apply:
• I prefer a poster presentation. • I prefer an oral presentation. • My presentation requires special facilities: VCR/Monitor, etc., describe.
REGISTRATION INFORMATION
Participant Fees and Information: The symposium registration fee includes all conference materials, admit- tance to all technical sessions, coffee breaks, reception, banquet.
Advance Registration: On-Site Registrat ion:
Participants $325.00 Participants $400.00
Students $115.00 Students $150.00
Companion/Guest Fees and Information: Guest Reception Ticket $30.00 Guest Banquet Ticket $30.00
Companion/Guest Sightseeing Program (all fees include admission fees and lunch):
April 7 - Bellefonte, Pennsylvania ($30.00) Bellefonte was established in 1795, hometown of five Pennsylvania gover- nors, Bellefonte beckons with a special Victorian enchantment all its own. Renowned for an abundance of graceful mid- and late-19th century archi- tecture, from loving maintained private homes to stately public building, Bellefonte proudly maintains it ties to the past.
You will leave from The Penn Stater at 9:30 a.m. and travel to Bellefonte for the guided walking and riding tour of Victorian Bellefonte. The guide will blend local history and legend into an enjoyable narrative. Lunch will be at the Gamble Mill restaurant where you can relax in the warm surrounding of old wood, brick and stone. After lunch the tour continues and shopping if time permits. Departure from Bellefonte will be approximately around 3:30 p.m. with arrival back at The Penn Stater scheduled for 4:00 p.m.
April 8 - Belleville, Pennsylvania/Tour of Penn's Cave($25.00) This day will start with departure from The Penn Stater at approximately 9:00 a.m. with arrival at Belleville around 10:00 a.m. Once at the Belleville Market you will experience an outdoor shopping adventure where you can purchase anything from antiques, collectibles, produce, to baked goods. This adventure is situated in the heart of Amish and Mennonite country.

You will leave Belleville around 11:30 a.m. and travel to Perm's Cave, Centre Hall, Pennsylvania, where you will enjoy lunch and then tour the cavern. Perm's Cave is America's only all-water cavern, you'll learn of the tragic love of the French trapper for a beautiful Indian princess as you take a one-mile boat tour of the cavern - be sure to wear a sweater or light jacket as the case is a constant 50 degrees all year around. There is a gift shop for souvenirs. Approximate arrival time back to The Penn Stater is 4:00 p.m.
April 9 - Boalsburg, Pennsylvania ($30.00) Your day will begin by leaving The Penn Stater by 9:00 a.m. to tour historical Boalsburg. This excursion will consist of visiting the Pennsylvania Military Museum which offers a tribute to the nation's armed forces. Memorabilia from Ben Franklin's citizen soldiers, "the Associators," to the troop in Desert Storm focus attention on solider from the Commonwealth who fought for the United States; and tour Columbus Chapel and Boal Mansion - this is the only tangible link in the United States to Christopher Columbus.
Lunch will be at the Duffy's Tavern, originally a stagecoach inn. You will enjoy the tradition of detectable dining and warm hospitality begun so long ago. Your day will continue with shopping on your own in downtown histor- ical Boalsburg Village where shops containing merchandise of quilts, col- lectibles and customized gifts make this time a really shopping adventure.
Weather in Central Pennsylvania April weather is usually cool and damp with much precipitation. Visitors should keep these conditions in mind and bring appropriate clothing. A pair of comfortable walking shoes is recommended.
ACCOMMODATION INFORMATION
This symposium, hosted by the Materials Research Laboratory of The Pennsylvania State University, will be held at The Penn Stater Conference Center, State College, Pennsylvania. The Penn Stater is within five miles of the State College/University Park Airport. Airline service is available through USAir Express, Northwest Airlink, and United Express. Rental car, limousine and taxi services are available at the airport. Private and charter aircraft may fly into the airport and be accommodated overnight, with fuel and maintenance services available. Please check with your local travel agent of current schedules and international connections available through the fol- lowing international airports with commuter service to Stater College (SCE); Dulles (IAD), Washington, DC; Pittsburgh (PIT), Pennsylvania; and Detroit (DTW), Michigan.

For your convenience a block of rooms have been reserved at the follow- ing hotels for the evenings of Sunday, 5 April, through Friday, 10 April 1998. You are responsible for making your own hotel accommodations. Upon making your reservation, please indicate that you are attending the "ISFD-5 Conference" and give the meeting dates. A guarantee of one night's deposit is required to secure your reservation. Reserved block of rooms at each hotel will be held until 5 March 1998. After this date accommodations will be available on a 'first-come, first-serve' basis.
The Penn State Conference Center 215 Innovation Boulevard State College, PA 16801 Phone: (814) 863-5000 Fax:(814)863-5001 Single Occupancy: $93+tax/night Double Occupancy: $103+tax/night
Imperial Motor Inn 118 South Atherton Street State College, PA 16801 Telephone: (814) 237-7686 Single Occupancy: $45+tax/night Double Occupancy: $55+tax/night
Sleep Inn 111 Village Drive State College, PA 16802 Telephone: (814) 235-1020 Single or Double Occupancy: $47+tax/night (includes Continental Breakfast)
Hampton Inn 1101 East College Avenue State College, PA 16801 Phone:(814)231-1590 Fax:(814)238-7320 Single or Double Occupancy: $64+tax/night (includes Continential Breakfast)
The Atherton Hotel 125 S. Atherton Street State College, PA 16801 Phone:(814)237-2100 Fax:(814)237-1130 Single Occupancy: $72+tax/night Double Occupancy: $76+tax/night
Conference Coordinator:
Ms. Tina M.Confer 187 Materials Research Laboratory The Pennsylvania State University
University Park, PA 16802 Phone:(814)865-1154 Fax:(814)863-7846
e-mail: [email protected]

ADVANCE REGISTRATION FORM (ISFD-5)
International Symposium on Ferroic Domains and Mesoscopic Structures
The Penn State Conference Center (formerly Scanticon)
State College, Pennsylvania 6-10 April, 1997
Attendee Information Symposium Registration Fees
Name: Particinants Fees: (Last
Title (Professor, Dr.
Companv:
Address:
, First, Middle Initial)
etc): Advance (deadline 30 January 1998) 0 Participants: D Students:
On-Site: D Participants: D Students:
D Participant will attend the recept a Participant will attend the banqu
Companion/Guest Fees*: D 7 April-Bellefonte D 8 April-Belleville/Penns Cave D 9 April-Boalsburg D Companion/Guest Reception D Companion/Guest Banquet
* Sightseeing fees include all admi and lunch.
$325.00 $115.00
$400.00 $150.00
City: on.
State:
Zip Code: $30.00 $25.00 Country:
Telephone: $30.00
Fax: $30.00 $30.00
Email:
Companion Name: ssion fees
Please make all checks/money orders payable in US Dollars to:
"The Pennsylvania State University"
Total Cost Enclosed:
CONTACT PERSON
Conference Coordinator for this symposium is Ms. Tina M. Confer. You may con- tact her regarding lodging, registration and transportation information
Ms. Tina M. Confer 187 Materials Research Laboratory The Pennsylvania State University
University Park, PA 16802 Phone:(814)865-1154
Fax:(814)863-7846 e-mail: [email protected]
Please directly contact members of the organization committee for technical questions. All of the enclosed information is available on the world web at the following address:
http://www.math.psu.edu/cao/isfd5.html

CALL FOR PAPERS
2nd Asian Meeting on Ferroelectrics, International (AMF-2)
tu be held in Singapore, 8-11, December 1998
Organized by
School of Electrical and Electronic Engineering Nanyang Technological University, Singapore
Co-Sponsored by IEEE Singapore Section Singapore Data Storage Institute
Singapore Institute of Materials Research & Engineering Gordon and Breach Science Publishers
SCOPE The meeting is devoted to all aspects of ferroelectrics and related materials and phenomena. This meeting will provide an excellent opportunity to share up-dated theories and technologies among researchers in academia and industry. The scope of the meeting will be similar to that of IMF's and ISAF's conferences. The scientific program will include invited and con- tributed presentations on theoretical, experimental and applications of fer- roelectrics. Particular attention will be paid to new developments in fundamental research areas and various practical applications. Topics of interest include but not limited to:
• Theories and Fundamental Phenomena of Ferroelectrics • Measurements and Characterizations • Crystals and Ceramics • Ferroelectric Polymer and Liquid Crystals • Glass and Amorphous Systems, Nanostructures and Composites • Dielectric, Piezoelectric and Pyroelectric Properties • Optical Properties and Nonlinear Phenomena • Domains and Domain Boundaries • Surface, Interfaces and Defects • Disordered Systems • Incommensurate Phases and Discommensuration • Relaxor Ferroelectrics

• Processing of Ferroelectric Materials • Ferroelectric Thin Films and Memory Integration • Applications: Sensors, Actuators, Transducers, and Microwave Devices • Ferroelectrics and Microelectro-Mechanical Systems (MEMS) • Electrooptics, Displays and Infrared Imaging • Energy Storage, Wireless Communication and Optical Data Storage
ABSTRACT SUBMISSION You are invited to submit abstracts of 150-200 words before 1 March 1998 to the Conference Secretariat. The abstracts should start with TITLE OF PAPER (CAPITALS, central justified, bold, "Times Roman" 14 point), fol- lowed by authors' full names, affiliation, address ("Times Roman" 12 points) and underline the author's name who will present the paper. All the contents ("Times Roman" 12 points), figures and references of an abstract should be contained in one page A4 paper only. Please use pencil to indicate your preferred topic session at the top-right corner (i.e., [A], [B]....[R]). As the abstracts will be printed, please mail the original abstracts to the Conference Secretariat. Fax or email versions are not acceptable. If more information is needed, please contact the Executive Committee or the Conference Secretariat.
CONFERENCE PROCEEDINGS The proceedings of this meeting will be published as a special issue of Ferro- electrics by Gordon & Breach Science Publishers. The original manuscripts with additional two copies of all invited and contributed papers presented at this meeting should be mailed to the Conference Secretariat before the commencement of the meeting or submitted to the Conference Secretariat at the Registration Desk on the first day of the meeting. All papers will be re- viewed.
DATES AND DEADLINES 1 March 1998 Abstract Deadline 1 July 1998 Notification of Acceptance 1 September 1998 Early-Registration Deadline
IMPORTANT NOTE This meeting is a self-supported event. There is no any financial assistant program.

GENERAL CHAIRMAN
Professor Yao Xi, Director Electronic Material Research Laboratory,
Xi'an Jiao Tong University, Xi'an 710049, China
CONFERENCE ADVISORY COMMITTEE
Associate Professor Er Meng Hwa, Dean (Chairman)
School of Electrical & Electronic Engineering. Nanyang Technological University. Singapore
Associate Professor Low Teck Seng, Director Data Storage Institute, Singapore
Professor C. Fong Shih, Director Institute of Materials Research & Engineering, Singapore
INTERNATIONAL ADVISORY COMMITTEE
A.S. Bhalla L.E. Cross (co-chairman) R. Gerhard-Multhaupt N. Ichinose Y. Ishibashi (co-chairman) S.I. Kwun S.B. Lang Min Nai Beng A. Safari J.F. Scott N. Setter K. Uchino Yin Zhi Wen
ORGANIZATION COMMITTEE
H. Banno Chong Tow Chong H.L.W. Chen S.B. Desu Guo Ru Yen Li Ai Kang K.S. No T. Takanaka Tan Hong Siang (co-chairman) R.P. Tandon Yin Qing Rui (co-chairman) Zhang Liang Ying

PROGRAM COMMITTEE
D.C. Dube M.S. Jang SJ. Park T. Shiosaki (co-chairman) V.Ya. Shur D.R. Tilley T.Y. Tseng B.A. Tuttle Xiao Ding Quan Xu Yu Huan K. Yoshino Zhong Wei Lei (co-chairman) Zhu Wei Guang
EXECUTIVE COMMITEE Dr. Weiguang Zhu
(Chairman) School of Electrical and Electronic Engineering,
Nanyang Technological University, Nanyang Avenue, Singapore 639798
Tel: (65) 799-1429, Fax: (65) 792-0415 Email: [email protected]
Dr. Chang Kuan Teck Data Storage Institute,
10 Kent Ridge Crescent, Singapore 119260
Associate Professor Lim Leong Chew Institute of Materials Research and Engineering,
10 Kent Ridge Crescent, Singapore 119260
Mr. Tse Man Siu School of Electrical and Electronic Engineering,
Nanyang Technological University, Nanyang Avenue, Singapore 639798
Dr. Yao Kui School of Electrical and Electronic Engineering,
Nanyang Technological University, Nanyang Avenue, Singapore 639798
CONFERENCE SECRETARIAT
Ms Goh Bee Dee / Ms Merlin Toh Nanyang Technological University Centre for Continuing Education AMF-2 Conference Secretariat Administration Annex #04-06
Nanyang Avenue, Singapore 639798 Tel: (65) 799-4723, Fax: (65) 793-0997
Email: [email protected]

PRELIMINARY REGISTRATION (AMF-2)
2nd Asian Meeting on Ferroelectrics, International
to be held in Singapore, 8-11 December, 1998
(Please photocopy this form for additional registrations)
) Please send me the second announcement.
) I plan to attend this conference and accompanying persons will be interested in the social program.
) I plan to present a paper at this conference. The tentative title is:
Family Name:
Organization:
Address:
Given Name: (Prof/Dr/Mr/Mrs/Ms)
Country:
Telephone:
Email:
Fax:
Names and addresses of individuals who might be interested in this conference are:
Name: Name:
Organization:,
Address:
Organization:
Address:
Countrv: .Country:
Fax:
Email:.
Fax:
Email:
*Please type or printin block letters and mail it to the Conference Secretariat.

ISRF-II The Second International Seminar on
Relaxor Ferroelectrics Dubna, Russia, June 23-26,1998
The Frank Laboratory of Neutron Physics of the Joint Institute for Nuclear Research is organizing, with the support of the Institute of Crystallography and the Physics - Technical Institute of the RAS, the second International Seminar on Relaxor Ferroelectrics to be held in Dubna, Russia from June 23 to 26, 1998.
Programme Profile
- atomic structure of relaxor ferroelectrics; - chemical (compositional) ordering; - dielectric measurements; - nonlinear properties; - effect of external electric fields; - phase diagrams; - radiospectroscopy; - lattice dynamics (neutron and light scattering); - other physical properties; - theoretical models; - ceramic preparation and crystal growth; - related materials; - application.
The following types of presentations are proposed: invited talks (3(M0 min), oral contributions (15-25 min) and posters.
The language of the Seminar is English.
ORGANIZING COMMITTEE
L.A. Shuvalov — chairman V.V. Lemanov — vice chairman
A.M.Balagurov — vice chairman S.B. Vakhrushev — Programme Committee chairman V.Yu. Kazimirov — scientific secretary
B.N. Savenko — member A.V. Belushkin — member
S.A. Gridnev — member N.N. Krainik — member
V.P. Sakhnenko — member

The deadline for submitting abstracts and sending back the preregistration form is February 10, 1998. All abstracts should bear an indication of the author(s)' preference as to the type of presentation.
Abstracts should be written in English and prepared in camera-ready form (font size 12 pt), on the one side of the good quality paper, within the typing area 16 y 24 cm2, including title (printed in capitals), author(s) name(s), affiliation(s), address(es), figures and references, using 1.5 line spacing.
The Organizing Committee will inform the author(s) of their report admission and the form of presentation before March 31, 1998.
The Seminar proceedings will be published in "Ferroelectrics". The Registration Fee (to be paid on registration):
- $400 for a participant; - $200 for an accompanying person; - $200 for students and young (up to 33 years old) scientist.
The Fee includes limousine transportation from Moscow airport or railway station to Dubna and back, a hotel accommodation (with breakfast, for five nights), the copy of the Seminar Proceedings, and banquet. Participants should notify the ISRF- II secretariat of their arrival and departure details two days, excluding Saturdays and Sundays, before their arrival/departure dates.
ORGANIZATION AND RELEVANT ADDRESSES:
Chairman of the Organizing Committee
Prof. L.A. Shuvalov A.V. Shubnikov Institute of Crystallography of RAS
117333 Moscow, Leninsky avenue, 59 Russia
Tel: (7) 095-135-02-51 Fax: (7) 095-135-10-11
Chairman of the Programme Committee
Dr. S.B. Vakhrushev A.F. Ioffe Phys.-Tech. Institute of RAS
194021 St. Petersburg Polyteknicheskaya st. 26
Russia Tel: (7) 812-515-92-06 Fax: (7) 812-515-67-47
E-mail: [email protected]
International Advisory Committee
V.L. Aksenov, Russia E. Husson, France R. Blinc, Slovenia G.V. Kozlov, Russia L. Cross, USA J- Schreiber, Germany E. Curtens, Switzerland W. Kleemann, Germany M.D. Glinchuk, Ukraine L.A. Shuvalov, Russia

Contact address
V.Yu. Kazimirov Frank Laboratory of Neutron Physics Joint Institute for Nuclear Research
141980 Dubna, Moscow region, Russia Tel: (7) 096-21-655-04 Fax: (7) 096-21-658-82
Telex: 911621 Dubna SU E-mail:[email protected]
ISRF-II
Application to attend the Second International Seminar on
Relaxor Ferroelectrics Dubna, Russia, June 23-26,1998
Name:
Institution and address:
Tel: .
Fax:.
Telex:
E-mail:
Title of report:.
This form should be sent together with the abstract before February 10, 1998 to the address above. The application form could be sent by E-mail to the V.Yu. Kazimirov.

CALL FOR PAPERS
10th International Symposium on Integrated Ferroelectrics
Monterey, California, March 1, 2,3, 4,1998
Chairmen: CA. Paz de Araujo and R. Panholzer
Technical Program Chairmen: O. Auciello and CM. Foster
Tutorial Chairman: R. Ramesh
The 10th annual International symposium on Integrated Ferroelectrics will be March 1, 2, 3, and 4, 1998 at the Hyatt Regency Hotel in Monterey, CA.
This celebration of ISIF's tenth anniversary comes at the time when substantial progress has been made in the basic science and technological applications of ferroelectric thin films, which open a potentially bright future for science and new technologies. Based on the work presented at previous ISIFs and other confer- ences and the work reported in the literature, we think that ISIF 98 provides an appropriate forum for a critical review of the science and technology of the two main ferroelectric materials being investigated for application to NVFRAMs.
The work on high permittivity thin films suggest that these materials may play a fundamental role in a new generation of DRAMS.
The field of ferroelectric/piezoelectric materials is also experiencing an explo- sive growth due to the potential applications in MEMS technologies.
Another important field that is attracting the attention of funding from various agencies is the field of pyroelectric sensors.
Authors are invited to submit a 300-word abstract by September 30, 1997. Topics include but are not limited to:
ferroelectric memories ferroelectric and pyroelectric CCDs high dielectric constant materials for ULSI DRAMs integrated optics optical storage radiation-related subject such as radiation hardness fundamental properties process and substrates process integration new devices and architecture device modeling materials processing and integration supporting circuitry and applications

ferroelectric ASICs smart tags and RF ID devices neural networks microsensor and actuators bypass capacitors GaAs/ferroelectric devices reliability applications and new products biomedical
Please print abstracts on 8V2 x 11 paper with the title centered in UPPER CASE, leaving two line spaces, then the author(s) name(s) and affiliation CENTERED. Two-pages of pictures or figures of supporting data may be included. Abstracts will be juried and authors will be informed of acceptance and the allotted time for presentation as soon as possible. If the abstract is sent via FAX, please follow up with an original and two copies.
Mail all abstracts by September 30,1997 to:
Alona S. Miller, Symposium Coordinator University of Colorado at Colorado Springs P.O. Box 7150 Colorado Springs, CO 80933-7150 Phone: 719-262-3488, FAX: 719-594-4257 e-mail: [email protected] For Federal Express: 1420 Austin Bluffs Parkway Colorado Springs, CO 80907
Final Deadline for Abstracts September 30,1997
Symposium Registration Fee
Before After February 1 February 1
General $300 $375 U.S. Government Employee $250 $325 All Eligible Students $45 $60
The registration fee, except student rate, entitles registrants to one copy of the Symposium Proceedings. Copies will be available at $55.00. Note: There will be no refunds on registrations cancelled after February 1.

Hotel Accommodations Hyatt Regency Monterey Single Double
$130.00 $150.00
The Hyatt Regency agrees to hold a block of rooms until February 2, 1997, at which time the hotel will release the unused portion of the group room block. Reservations received after this date will be honored on a space available basis. Phone: (408) 372-1234, Fax: (408) 375-3960.
Tutorial Sessions
Three tutorial sessions, which will run consecutively, are planned for Sunday, March I, from 1:00 to 6:00 p.m. The topics for the Tutorial Sessions will be announced at a later date. Tuition is $200.00 per person for the 3 sessions.
The Tutorial Sessions organizer is Dr. R. Ramesh. For further information on the Tutorial Sessions, please contact Dr. Ramesh at University of Maryland, Col- lege Park, MD 20742. Phone: 301-405-7364, Fax: 301-314-9467. There will be no refunds made for the Tutorial Sessions after February 15, 1998.
Poster Session
ISIF 98 will again feature a Poster Session. Please indicate with your abstract if you prefer the Poster Session.
Organization/Company Exhibits
If your organization or company wishes to have an exhibit or display during the Symposium, please send your display proposal to Alona Miller at the ISIF office in Colorado Springs, Colorado.
Associated Meetings
The ISIF Advisory Board (Robert Jones, Chairman) will have a general meeting with all attendees invited.
ISIF Advisory Board
S. Baik O.G. Ramer Chair: R.E. Jones S.K. Dey T Shiosaki Ex-Officio: R. Panholzer D.B. Dimos B.A. Tuttle CA. Paz de Araujo C. Mazure D. Wouters O. Auciello
Monterey Bay Aquarium Tour and Buffet Dinner
In celebration of the 10th anniversary on Monday, March 2 at 7:00 p.m.

PIEZOELECTRICITY AND PYROELECTRICITY DATABASE (PPDB)
The database used in Professor Sidney B. Lang's "Guide to the Literature of Piezolectricity and Pyroelectricity" which appears semiannually in Ferroelectrics is now accessible on the Gordon and Breach Internet website.
The current version of the Piezoelectricity and Pyroelectricity Database (PPDB) contains references to most of the publications on piezoelectricity and pyroelectricity during the period 1990-1993, with a small number from 1994. The database will be updated with an additional 500-1000 new references about twice a year. In order to make the database as comprehensive as possible, references are included even if piezoelectricity and/or pyroelectricity formed a very minor part of the contents of the publication. The current database contains 6091 references.
References are given for articles in journals, chapters in proceedings or books, books, patents, theses and reports. Full bibliographic information is given so that the reader can locate the publication. Additional information such as conference presentation data, language (if other than English) and patent assignees is given where available.
The URL for accessing PPDB is http://www.gbhap-us.com/c3/lit_guide/
Information in the PPDB can be accessed in two ways: (1) Direct search of the database on the Internet or (2) Downloading of the entire database and a public- domain search engine to the user's computer. Full instructions are supplied.
Any problems with the PPDB or suggestions should be sent to:
Prof. Sidney B. Lang Department of Chemical Engineering Ben-Gurion University of the Negev 84105 Beer Sheva, Israel Fax: +972-7-6472916 E-mail: [email protected]

FERROELECTRICS and related materials
NOTES FOR CONTRIBUTORS
As Gordon and Breach moves into the delivery of journals in electronic format, it is essential that authors prepare their manuscripts according to established specifications. The effective- ness of the search capabilities offered by electronic delivery will depend upon the care used by authors in preparing their manuscripts. Therefore, contributors are strongly encouraged to follow these instructions closely while preparing a manuscript for submission, and to check the manuscript for compliance with these notes before submitting it for publication.
Gordon and Breach online "offices" enable our authors to submit abstracts and full-text articles in virtually any file format, from anywhere in the world, at any time. Visit http:$$ www.gbhap.com Ferroelectrics and related materials to access a full range of internet author services.
MANUSCRIPTS Manuscripts should be typed with double-spacing and submitted in triplicate. In addition, authors are requested to supply one extra copy of the article-opening page (should include the paper title, list of author(s) and affiliation(s), abstract and keywords) and the article reference section, for publication in Ferroelectrics Communications. (Further information on Ferroelec- trics Communications, which previews the research of more detailed papers submitted for possible publication in Ferroelectrics, Ferroelectrics Letters Section and Integrated Ferroelec- trics, may be found at the end of these Notes for Contributors.) Authors are requested to forward their manuscripts to either the Editor:
G. W. Taylor Princeton Resources P.O. Box 211 Princeton, New Jersey 08542-0211, USA
or one of the Associate Editors:
Sidney B. Lang Jan Petzelt Koiehi Toyoda Department of Chemical Institute of Physics Research Institute of Electronics Engineering Academy of Sciences of Shizuoka University Ben Gurion University of the Czech Republic Hamamatsu 432 the Negev 180 40 Prague 8 Japan Beer Sheva 84105 Liben Na Slovance 2 Israel The Czech Republic
Submission of a paper to Ferroelectrics will be taken to imply that it represents original work not previously published, that it is not being considered for publication elsewhere, and that if accepted it will not be published elsewhere in the same form, in any language, without the consent of the Editors and the publisher. It is a condition of the acceptance by the Editors of a manuscript for publication that the publisher acquires automatically the copyright in the manuscript throughout the world.
Manuscript length: The maximum length preferred is 35 units, where a unit is a double-spaced typed page or one figure. Longer papers, or papers not following the prescribed editorial format, cannot be guaranteed prompt publication.
Abstract: Each manuscript requires a leading abstract of approximately 100-150 words sum- marizing the significant coverage and findings.
Keywords: Each manuscript requires three to six keywords which characterize the contents of the paper.
AIP's (American Institute of Physics) Physics and Astronomy Classification Scheme: In addi- tion to Keywords, each author is encouraged to provide three to six classification codes from the AIP classification scheme.

FIGURES All figures should be numbered with consecutive arabic numbers, have descriptive captions, and be referred to in the text. Keep figures separate from the text, but indicate an approximate position for each in the margin. Captions should be collected on a separate sheet.
Preparation: Figures submitted must be of a high enough standard for reproduction. Line drawings should be prepared in black ink on white paper with all lettering and symbols included. Alternatively, good sharp photoprints ('glossies') are acceptable. Photographs int- ended for halftone reproduction should be good, original glossy prints, of maximum contrast. Clearly label each figure with the author's name and figure number; indicate "top" where this is not obvious. Redrawing or retouching of unusable figures will be charged to authors.
Size: The preferred width of submitted line drawings is 20 to 23 cm with capital lettering 4 mm high, to accommodate reduction to single-column width. Photographs for halftone reproduc- tion should be about twice the desired size.
Color Plates: Whenever the use of color is an integral part of the research, or where the work is generated in color, the journal will publish the color illustrations without charge to authors. Reprints in color will carry a surcharge. Please write to the publisher for details.
TABLES Number tables consecutively with roman numerals and give each a clear descriptive caption at the top. Avoid the use of vertical rules in tables. Indicate in the margin where the typesetter should place tables.
EQUATIONS Wherever possible, equations should be typed with subscripts and superscripts clearly in- dicated. It is helpful to identify unusual symbols in the margin.
Units: Acceptable abbreviations will be found in the Style Manual of the American Institute of Physics and similar manuals. Metric units are preferred.
REFERENCES Indicate references in the text by superior arabic numbers enclosed in square brackets; collect and type the full list in numerical order on a separate page at the end of the paper. Listed references are arranged as follows:
[1] J. C. Slater, J. Chem. Phys. 9, 16 (1941). [2] F. Jona and G. Shirane, Ferroelectric Crystals (Pergamon Press, Oxford, 1962), pp. 186-7.
It is assumed that with the development of the World Wide Web (WWW), authors and/or the publisher will propose distribution of articles or parts of articles on the WWW. If the HTTP address of a referenced article on the WWW is known, this information should be added at the end of the reference using the following style:
(www http://www.blouk.com/article.html> where http://www.blouk.com/article.html is the HTTP address.
FOOTNOTES Authors are encouraged to minimize the use of footnotes. A footnote may include the designa- tion of a corresponding author of the paper, current address information for an author (if different from that shown in the affiliation), and traditional footnote content. Information concerning grant support of research should appear in a separate Acknowledgments section at the end of the paper, not in a footnote. Acknowledgments of the assistance of colleagues or similar notes of appreciation also properly belong in an Acknowledgments section, not in footnotes.
Footnotes should be indicated in the text by the following symbols: * (asterisk or star), f (dagger), ftdouble dagger), f (paragraph mark), § (section mark), || (parallels), # (number sign). Do not use numerals for footnote call-outs, as they may be mistaken for bibliographical reference call-outs or exponents. Type each footnote at the bottom of the manuscript page on which its text call-out appears.
Footnotes within a table should be indicated by the same symbols listed above. Reinitialize symbol sequence within tables. Type footnotes to a table directly beneath the table.

TEXT CALL-OUTS TO FIGURES, TABLES, SECTIONS, SCHEMES Text call-outs to figures, tables and other elements are the basis for searching articles on electronic delivery. Therefore, the proper designation of text call-outs to figures and other elements is essential to the success of electronic delivery. When referring to a figure, table or other element within an article, always call the element by its full name: "See Table I", "Figure 1 illustrates...", "Refer to Scheme 1". Do not use ambiguous call-outs (for example, "1 illus- trates...") that do not clearly denote the element being referred to.
SUBMISSION OF ARTICLES ON DISK The publisher welcomes article submission on disk. Disks should be submitted with the final hard copy manuscript. The disk files and hard copy must match exactly.
Articles prepared on most word processors are acceptable. If equations and/or scientific symbols have been imported into the article from another program, please provide details of the program used and the procedures followed. If author-created macros have been used, please include them as well.
When typing the article, do not include design or formatting information. Type all text flush left, unjustified and without hyphenation. Do not use indents, tabs or multi-spacing. If an indent is required, please note it by a line space; also mark the position of the indent on the hard copy manuscript. Indicate the beginning of a new paragraph by typing a line space. Leave one space at the end of a sentence, after a comma or other punctuation mark, and before an opening parenthesis. Be sure not to confuse lower case letter "1" with numeral "1", or capital letter "O" with numeral "0". Distinguish opening quotes from closing quotes. Do not use automatic page numbering or running heads.
Tables and displayed equations may have to be rekeyed by the typesetter from your hard copy manuscript.
Illustrations that are available in an electronic format are acceptable; please supply them on a separate disk. Please clearly indicate on the disk the file format and/or program used to produce them, and supply a high-quality hard copy of each illustration as well.
If more than one disk is submitted, please number each disk. Please mark each disk with the journal title, author name, abbreviated article title, and file names. Retain a back-up copy of each disk submitted and pack the disks carefully before shipping. Complete the Disk Specifications form that appears at the back of the journal (forms may also be obtained from the publisher, journal Editor or one of the Associate Editors) and submit it with the disks and hard copy manuscript.
SUBMISSION OF ANIMATION Author-supplied animation related to articles accepted for publication will be included in the journal CD-ROM and published on the World Wide Web at no cost to authors. Animations are limited to a time duration of 30 seconds. Animation should be submitted to the journal Editor or one of the Associate Editors with the final manuscript, after it has completed the refereeing process.
Animations in the following forms (in order of preference) can be accepted from authors: • Video tape • AVI or QuickTime files • A sequence of still images
The following formats can be accepted: • all uncompressed formats widely used on PC, Mac and UNIX • JPEG for colored and compressed images • TIFF with a group IV compression for black and white compressed images • FLI and FLC format from AutoDesk
Authors who submit animations are requested to provide the following information: • Video tape - format used • AVI or QuickTime files - version and system used for disk file creation • Sequence of still images - format used, version and system used for disk file creation
Authors who are unable to supply video tape, AVI or QuickTime files may provide the publisher with a set of sequential still images. Note than an animated sequence will consist of 13 to 15 still images per second of animation; e.g., if an animated sequence is 10 seconds in duration, it is made up of 130 images. Authors who are unable to submit in any of the above-mentioned formats are advised to contact the publisher to discuss other options prior to submission.

Animation should be mentioned in the text. Indicate an approximate location for the anima- tion call-out in the margin.
PROOFS Authors will receive page proofs (including figures) by airmail for correction, which must be returned to the typesetter within 48 hours of receipt. Please ensure that a full postal address is given on the first page of the manuscript, so that proofs are not delayed in the post. Authors' alterations in excess of 10% of the original composition cost will be charged to authors.
REPRINTS Twenty-five free reprints will be supplied to the first-named author of a published manuscript. Additional reprints may be ordered by completing the appropriate form sent with page proofs.
PAGE CHARGES There are no page charges to individuals or institutions. See the journal inside back cover for information on the publisher's per page charge voucher and voluntary page charge programs.
FERROELECTRICS COMMUNICATIONS
Ferroelectrics Communications, a bi-monthly, rapid communication, companion publication to Ferroelectrics, Ferroelectrics Letters Section and Integrated Ferroelectrics, offers authors the opportunity to announce their work while it is being refereed for publication in Ferroelectrics, Ferroelectrics Letters Section and Integrated Ferroelectrics, both to speed communication within the community and to provide researchers with a means of establishing the priority of their work.
Ferroelectrics Communications paper edition features:
Synoptics - refereed papers which preview the research in papers that have been submitted for possible publication in Ferroelectrics, Ferroelectrics Letters Section and Integrated Ferroelectrics. Length: A Synoptic may consist of an expanded abstract of 200-300 words or a 2-3 page (including figures) short preview of research. Language: The language of this publication is English. Abstract: Each Synoptic submitted in the form of a short communication must have a 100-200 word abstract. Keywords: Each Synoptic must have 3-6 keywords.
Abstracts and References - abstracts and references of all papers submitted for possible publi- cation in Ferroelectrics, Ferroelectrics Letters Section and Integrated Ferroelectrics.
Ferroelectrics Communications World Wide Web edition will feature the abstracts and refer- ences of Synoptics and the abstracts and references of all articles submitted for possible publi- cation in Ferroelectrics, Ferroelectrics Letters Section and Integrated Ferroelectrics.
SUBMISSION A Synoptic must be submitted with the corresponding journal article it previews to the journal editor or one of the Associate Editors. The Abstract and References of every paper submitted to Ferroelectrics, Ferroelectrics Letters Section and Integrated Ferroelectrics will be published in Ferroelectrics Communications while the corresponding papers are undergoing refereeing for possible publication.
Notes for Contributors for Ferroelectrics Communications are available from any of the associ- ate editors or the journal editor of Ferroelectrics, Ferroelectrics Letters Section and Integrated Ferroelectrics, or from the publisher.

Journal name
Disk Specifications
Date
Paper title
Paper Reference Number,
Corresponding author.
Address
Telephone.
Fax
Postcode
Disks Enclosed (file names and descriptions of contents)
Text
Disk I,
Disk 2
Disk 3
PLEASE RETAIN A BACK-UP COPY OF ALL DISK FILES SUBMITTED.
GORDON AND BREACH PUBLISHERS HARWOOD ACADEMIC PUBLISHERS

Figures
Disk I
Disk 2
Disk 3
Computer make and model.
Size/format of floppy disks
D 3.5" □ 5.25"
D Single sided D Double sided
D Single density □ Double density D High density
Operating system
Version
Word processor program _
Version
Imported maths/science program.
Version
Graphics program
Version
Files have been saved in the following format
Text:
Figures:
Maths:
PLEASE RETAIN A BACK-UP COPY OF ALL DISK FILES SUBMITTED.
GORDON AND BREACH PUBLISHERS • HARWOOD ACADEMIC PUBLISHERS

COLOR PLATE I. see N. J. RAMER et al., Figure 1. FERROELECTRICS, Volumes 206(1-4) and 207(1-2)

COLOR PLATE II. see N. J. RAMER et al., Figure 2. FERROELECTRICS, Volumes 206(1-4) and 207(1-2)

COLOR PLATE III. see N. J. RAMER et al., Figure 3. FERROELECTRICS, Volumes 206(1-4) and 207(1-2)

COLOR PLATE IV(A). see N. J. RAMER et al, Figure 4A. FERROELECTRICS, Volumes 206(1-4) and 207(1-2)
COLOR PLATE IV(B). see N.J. RAMER et al., Figure 4B. FERROELECTRICS, Volumes 206(1-4) and 207(1-2)

(Continued from inside front cover)
Ordering Information Published monthly. Subscriptions are renewed on an annual basis. 1998 Volume(s): 205-219
Orders may be placed with your usual supplier or at one of the addresses shown below. Journal subscriptions are sold on a per volume basis only; single issues of the current volume are not available separately. Claims for nonreceipt of issues will be honored if made within three months of publication of the issue. See Publication Schedule Information. Subscriptions are available for microform editions; details will be furnished upon request.
All issues are dispatched by airmail throughout the world.
Subscription Rates. Base list subscription price per volume: ECU 376.00.* This price is available only to individuals whose library subscribes to the journal OR who warrant that the journal is for their own use and proivide a home address for mailing. Orders must be sent directly to the Publisher and payment must be made by personal check or credit card.
Separate rates apply to academic and corporate/government institutions. Postage and handling charges are extra.
*ECU (European Currency Unit) is the worldwide base list currency rate; payment can be made by draft drawn on ECU cur- rency in the amount shown or in subscriber's local currency at the current conversion rate set by Publisher. Subscribers should contact their agents or the Publishers. All prices are subject to change without notice.
Publication Schedule Information. To ensure your collection is up-to-date, please call the following numbers for infor- mation about the latest-issue published: + 44 (0) 118-956-0080 ext. 391; +1 973 643-7500 ext. 290; or web site: http://www.gbhap.com/reader.htm. Note: If you have a rotary phone, please call our Customer Service at the numbers listed below.
Orders should be placed through one of the addresses below:
IPD Marketing Services PO Box 32160 PO Box 310 Newark, NJ 07102 USA Queen's House. Don Road Telephone: +1 800 545-8398 St. Helier, Jersey Fax: +1 973 643-7676 Channel Islands JE4 0TH Telephone: +44(0) 118-956-0080 Fax: +44(0)118-956-8211
Kent Ridge, PO Box 1180 Yohan Western Publications Singapore 911106 Distribution Agency Republic of Singapore 3-14-9, Okubo, Shinjuku-ku Telephone: +65 741-6933 Tokyo 169, Japan Fax: +65 741-6922 Telephone: +81 3 3208-0186
Fax: +81 3 3208-5308
Enquiries can also be sent bye-mail: < [email protected] > and the world wide web: http://www.gbhap.com.
Rights and Permissions/Reprints of Individual Articles Permission to reproduce and/or translate material contained in this journal must be obtained in writing from the Publisher.
This publication and each of the articles contained herein are protected by copyright. Except as allowed under national "fair use" laws, copying is not permitted by any means or for any purpose, such as for distribution to any third party (whether by sale, loan, gift, or otherwise); as agent (express or implied) of any third party; for purposes of advertising or promotion: or to create collective or derivative works. A photocopy license is available from the Publisher for institutional subscribers that need to make multiple copies of single articles for internal study or research purposes. Any unauthorized reproduction, transmis- sion or storage may result in civil or criminal liability.
Copies of articles may be ordered through SCAN, the Publisher's own document delivery service. SCAN provides customers with the current contents and abstracts to all Gordon and Breach and Harwood Academic jounals. Please contact one of the addresses listed above to receive SCAN, or view current contents and abstracts directly on the Web at http://www.gbhap.com. and for ordering.
The Publisher is also a member of Copyright Clearance Center.
The Canada Institute for Scientific and Technical Information (CISTI) provides a comprehensive, worldwide document deliv- ery service for Gordon and Breach/Harwood Academic journals. For more information, or to place an order for a copyright- cleared Gordon and Breach/Harwood Academic document, please contact Client Assistant, Document Delivery, CISTI, National Research Council Canada. Ottawa, Canada, KIA OS2 (Tel: 613-993-9251; Fax: 613-993-7619; e-mail: < [email protected] >).
Voluntary Page Charges The United States National Science Foundation has extended the allowance of page charge funds for payments to journals regardless of the Publisher's commercial status. Previously this was reserved for only nonprofit soci- ety-sponsored journals. Voluntary page charge payments are now accepted for this journal, and authors may elect to pay any amount up to a maximum of $25.00 per page. Payments will be refunded in the form of a voucher at 100% value of total pay- ment. This voucher can be used by the author or the author's university library for any product or service offered by the Publisher, and thereby can be used to supplement library funding.
Article Vouchers The principal author of each article will receive a voucher for his contribution in the amount of ECU 15.00 (US $20.00, Yen 3,000), which can also be used to purchase the Publisher's products directly or through university libraries, thereby reducing costs of publications to those authors supporting the journal. This journal is sold CIF with title passing to the purchaser at the point of shipment in accordance with the laws of The Netherlands. All claims should be made to your agent or the Publisher.