Study of the relaxor behavior in BaTi1−xHfxO3 (0.20≤x≤0.30) ceramics
7
Study of the relaxor behavior in BaTi 1x Hf x O 3 (0.20 x 0.30) ceramics Shahid Anwar * , P.R. Sagdeo, N.P. Lalla UGC-DAE Consortium for Scientific research, University campus, Khandwa road, Indore 452001, M.P., India Received 5 March 2007; received in revised form 3 July 2007; accepted 8 July 2007 Available online 29 July 2007 Abstract The influence of Hf doping on the structure and dielectric properties of BaTiO 3 has been studied. For this purpose Ba(Ti 1x Hf x )O 3 ceramics were prepared through solid-state reaction route at close compositions, having x ¼ 0.20, 0.22, 0.23 and 0.30. The study was aimed to locate the exact hafnium concentration for normal to relaxor crossover in these ceramics. X-ray diffraction followed by Rietveld refinement, reveals the formation of single phase with Pm3m cubic structure. Temperature and frequency dependence of real (3 0 ) and imaginary (3 00 ) parts of the dielectric permittivity have been studied in the temperature range of 90e350 K, at frequencies between 0.1 kHz and 100 kHz. The dielectric permittivity variations with temperature show deviation from CurieeWeiss behavior and strong frequency dispersion. The deviation from CurieeWeiss behavior, discontin- uous jump along with the change in the slope of T m vs Hf concentration plot, and the degree of relaxation (g) approaching w2, indicate a crossover from normal to relaxor ferroelectrics. Substitution of Hf 4þ for Ti 4þ in BaTiO 3 introduces structural disorder, causing perturbations like local electric and strain fields. These perturbations reduce the long-range polar order resulting in relaxor behavior. Ó 2007 Elsevier Masson SAS. All rights reserved. Keywords: Ferroelectric; Structural; X-ray diffraction (XRD) 1. Introduction Ever since the discovery of BaTiO 3 as a high permittivity fer- roelectric ceramic in 1943, pure and doped BaTiO 3 have been widely studied for its use as passive components in electronic industries, e.g. as capacitors. Since BaTiO 3 has characteristic anomalies in the dielectric constant near the ferroelectrice paraelectric transition temperature (w393 K), to make it suit- able for low-temperature applications, several homovalent and hetrovalent substitutions have been tried [1,2]. The dielectric response of relaxors is quite different than that of the normal ferroelectrics. Relaxors show the occurrence of strong frequency dispersion in its dielectric permittivities, ab- sence of macroscopic polarization and anisotropy at tempera- tures much below T m (the temperature at which the dielectric permittivity shows a maximum). The high dielectric permittiv- ity in the vicinity of phase transition makes relaxors an excellent candidate for multi-layered ceramic capacitors and other piezo- electric and ferroelectric devices [1,2]. To extend their applica- bility to modern electronics, detailed information of their physical properties are always required [3e5]. The relaxor behavior is correlated with the cationic disorder at the same crystallographic site and has been extensively studied in lead- containing compound and solid solutions, such as PMN, PLZT, etc. [3,6,7]. However, due to the toxicity of lead, these com- pounds bear a possible hazard, which has recently stimulated the development of lead-free ceramics exhibiting relaxor prop- erties [5,8]. Doped BaTiO 3 is found to be a good replacement for the lead-based relaxor systems. Doping in ceramics is a common way to modify and improve the material performance. Several dopants like Ca, Zr, Ce, etc, have been tried and enhanced ferro- electric properties have been obtained [4,5,9]. Among these Ba(Ti 1x Zr x )O 3 has received renewed attention due to its enhanced properties both in single crystals and ceramics [5]. Hafnium doped BaTiO 3 has recently come up as a new lead- free relaxor ceramic [8,10]. * Corresponding author. Tel.: þ91 9993125744; fax: þ91 7312462294. E-mail addresses: [email protected] (S. Anwar), [email protected]. in (N.P. Lalla). 1293-2558/$ - see front matter Ó 2007 Elsevier Masson SAS. All rights reserved. doi:10.1016/j.solidstatesciences.2007.07.023 Available online at www.sciencedirect.com Solid State Sciences 9 (2007) 1054e1060 www.elsevier.com/locate/ssscie
-
Upload
independent -
Category
Documents
-
view
2 -
download
0
Transcript of Study of the relaxor behavior in BaTi1−xHfxO3 (0.20≤x≤0.30) ceramics
Available online at www.sciencedirect.com
Solid State Sciences 9 (2007) 1054e1060www.elsevier.com/locate/ssscie
Study of the relaxor behavior in BaTi1�xHfxO3 (0.20� x� 0.30) ceramics
Shahid Anwar*, P.R. Sagdeo, N.P. Lalla
UGC-DAE Consortium for Scientific research, University campus, Khandwa road, Indore 452001, M.P., India
Received 5 March 2007; received in revised form 3 July 2007; accepted 8 July 2007
Available online 29 July 2007
Abstract
The influence of Hf doping on the structure and dielectric properties of BaTiO3 has been studied. For this purpose Ba(Ti1�xHfx)O3 ceramics wereprepared through solid-state reaction route at close compositions, having x¼ 0.20, 0.22, 0.23 and 0.30. The study was aimed to locate the exacthafnium concentration for normal to relaxor crossover in these ceramics. X-ray diffraction followed by Rietveld refinement, reveals the formationof single phase with Pm3m cubic structure. Temperature and frequency dependence of real (30) and imaginary (300) parts of the dielectric permittivityhave been studied in the temperature range of 90e350 K, at frequencies between 0.1 kHz and 100 kHz. The dielectric permittivity variations withtemperature show deviation from CurieeWeiss behavior and strong frequency dispersion. The deviation from CurieeWeiss behavior, discontin-uous jump along with the change in the slope of Tm vs Hf concentration plot, and the degree of relaxation (g) approaching w2, indicate a crossoverfrom normal to relaxor ferroelectrics. Substitution of Hf4þ for Ti4þ in BaTiO3 introduces structural disorder, causing perturbations like local electricand strain fields. These perturbations reduce the long-range polar order resulting in relaxor behavior.� 2007 Elsevier Masson SAS. All rights reserved.
Keywords: Ferroelectric; Structural; X-ray diffraction (XRD)
1. Introduction
Ever since the discovery of BaTiO3 as a high permittivity fer-roelectric ceramic in 1943, pure and doped BaTiO3 have beenwidely studied for its use as passive components in electronicindustries, e.g. as capacitors. Since BaTiO3 has characteristicanomalies in the dielectric constant near the ferroelectriceparaelectric transition temperature (w393 K), to make it suit-able for low-temperature applications, several homovalent andhetrovalent substitutions have been tried [1,2].
The dielectric response of relaxors is quite different than thatof the normal ferroelectrics. Relaxors show the occurrence ofstrong frequency dispersion in its dielectric permittivities, ab-sence of macroscopic polarization and anisotropy at tempera-tures much below Tm (the temperature at which the dielectric
* Corresponding author. Tel.: þ91 9993125744; fax: þ91 7312462294.
E-mail addresses: [email protected] (S. Anwar), [email protected].
in (N.P. Lalla).
1293-2558/$ - see front matter � 2007 Elsevier Masson SAS. All rights reserve
doi:10.1016/j.solidstatesciences.2007.07.023
permittivity shows a maximum). The high dielectric permittiv-ity in the vicinity of phase transition makes relaxors an excellentcandidate for multi-layered ceramic capacitors and other piezo-electric and ferroelectric devices [1,2]. To extend their applica-bility to modern electronics, detailed information of theirphysical properties are always required [3e5]. The relaxorbehavior is correlated with the cationic disorder at the samecrystallographic site and has been extensively studied in lead-containing compound and solid solutions, such as PMN, PLZT,etc. [3,6,7]. However, due to the toxicity of lead, these com-pounds bear a possible hazard, which has recently stimulatedthe development of lead-free ceramics exhibiting relaxor prop-erties [5,8]. Doped BaTiO3 is found to be a good replacement forthe lead-based relaxor systems. Doping in ceramics is a commonway to modify and improve the material performance. Severaldopants like Ca, Zr, Ce, etc, have been tried and enhanced ferro-electric properties have been obtained [4,5,9]. Among theseBa(Ti1�xZrx)O3 has received renewed attention due to itsenhanced properties both in single crystals and ceramics [5].Hafnium doped BaTiO3 has recently come up as a new lead-free relaxor ceramic [8,10].
d.

1055S. Anwar et al. / Solid State Sciences 9 (2007) 1054e1060
In our earlier communications [10,11] we have presented thepreliminary studies on the occurrence of relaxor behavior forx¼ 0.30 hafnium (Hf) substituted BaTiO3. Knowledge of theexact substitution level required for the relaxor transition is im-portant for the study of basic physics related to relaxor phenom-ena. In some systems anomalies have been reported at thenormal to relaxor transition boundary [12]. Keeping in viewthe importance of doping concentration for relaxor transition,here in this study, we present the results of the structural and di-electric investigations on Ba(Ti1�xHfx)O3 (BHT) ceramicsmade at narrower composition between x¼ 0.20 and x¼ 0.30.The variation in dielectric behavior has been monitored throughpermittivity vs temperature measurements in the temperaturerange of 90e350 K, at frequencies of 0.1 kHz, 1 kHz, 10 kHzand 100 kHz. We observed emergence of relaxor behavior forx� 23, i.e. for Ba(Ti0.77Hf0.23)O3 and above.
2. Experimental
Ba(Ti1�xHfx)O3 ceramics, with 0.20� x� 0.30, i.e. Ba(Ti0.80
Hf0.20)O3 (BHT20), Ba(Ti0.78Hf0.22)O3 (BHT22), Ba(Ti0.77
Hf0.23)O3 (BHT23) and Ba(Ti0.70Hf0.30)O3 (BHT30), were pre-pared following the conventional solid-state reaction route, usinghigh purity (99.99%) ingredient powders of BaCO3, TiO2 andHfO2. These ingredients were preheated at 150 �C for 6 h to re-move the adsorbed moisture, if any. The dried powders wereweighed in stoichiometric proportions and wet-mixed, takingacetone as mixing medium. After well mixing, grinding and dry-ing, the mixture was calcined at 1100 �C for 6 h. The calcinedpowder was reground, mixed with binder (polyvinyl alcohol),and pelletized into 15 mm diameter pellets at 100 kN/cm2 pres-sure. The pellets were then sintered at 1250 �C for 12 h. Keepingin view the small difference in the Hf doping concentration, it isimperative to describe here the feasibility of such doping. In thepresent case, the powders were weighed with an electronic bal-ance (Mettler AE240) having significant least count of <50 mg.To minimize the relative composition errors arising due to han-dling (weighing, mixing, etc.) of the ingredients, the stoichiomet-ric weights for all the synthesized ceramics were calculated insuch a way that the end product always remains same, 5 g inthe present case. The difference in the weight of HfO2 for 1%change in its concentration, e.g. from BHT22 to BHT23, willbe 0.03559 g, which is w700 times the significant least count.Thus after a careful weighing, BHT compounds at 1% of Hf sub-stitution level difference can be significantly prepared withoutmuch errors. The successful formation of BHT compoundswith 1% of Hf concentration difference was confirmed throughthe occurrence of systematic in the structural and dielectric prop-erties of the synthesized ceramics, as described in the following.
The final sintered pellets were gently crushed to fine pow-der and subsequently annealed at 600 �C for w10 h to removethe residual strain present in the grains, before its detailedstructural and phase purity characterizations. The structuralcharacterization was carried out using powder X-ray diffrac-tion (XRD), with Cu Ka radiation employing Rigaku makeqe2q diffractometer mounted on a rotating anode X-ray gen-erator working at 10 kW output power. Electroding of the flat
surfaces of the pellets were carried out by painting the surfaceswith high temperature silver paint and then firing them at500 �C for 15 min. Dielectric permittivity (30) and dielectricloss (tan d) measurements were carried out from room temper-ature down to 90 K during heating and cooling cycles at tem-perature intervals of 0.5 K. The measurements were performedusing a computer interfaced programmable LCR meter (Hioki-3532) and a Lakeshore make temperature controller with a Pt-100 temperature sensor. The Pt-100 temperature sensor wasused in 4-probe configuration. The applied ac signal was var-ied in the frequency range of 102e105 Hz with peak-to-peakamplitude of 1.0 V. The stability of temperature measurementwas better than 20 mK in the entire studied temperature range.Thus the measurement ensures that no anomaly is left unno-ticed in the studied temperature range.
3. Results and discussions
3.1. Structural studies
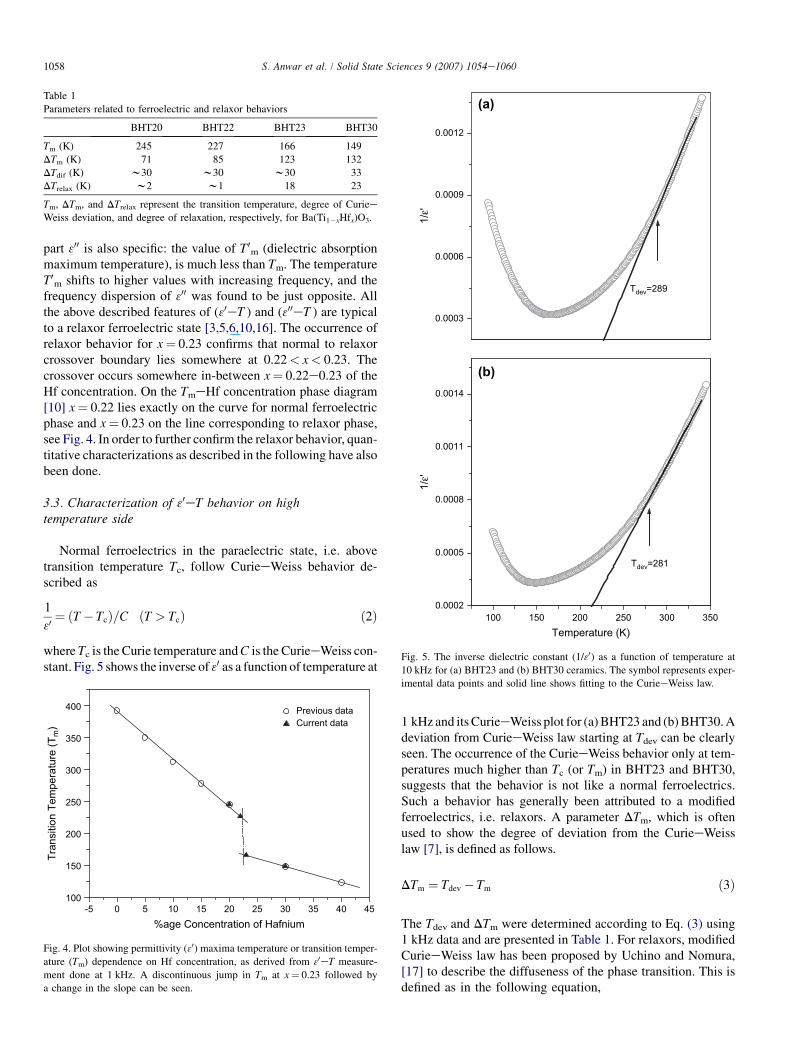
The XRD data of all the BHT compositions with 0.20�x� 0.30 were subjected to Rietveld refinement for structuraland phase purity characterizations. The refinement was per-formed using Fullprof software [13]. A pseudo-Voigt functionwas chosen to model the profile shape. The structure was re-fined with cubic phase, having Pm3m space group. Fig. 1 de-picts a typical Rietveld refined powder XRD data of theBHT23 ceramic. The continuous line in Fig. 1 shows the Riet-veld fit to the observed data, which is shown as circles. Thequality of fit ensures the Pm3m cubic phase. The absence ofany unaccounted diffraction peak confirms the single phase na-ture of the synthesized BHT ceramics. The refined cubic latticeparameters were plotted against Hf concentration in the latticeparameter phase diagram as given earlier [10]. It is found that
0 5 10 15 20 25 30 35 40
4.00
4.02
4.04
4.06
20 40 60 80 100 120
Observed dataFitted dataBragg PositionDifference
Inte
nsity
(a.u
)
2θ
Lat
tice
Para
met
er (A
)
%age Concentration of Hafnium
a/bcCubicCurrent Study
Fig. 1. Rietveld refined XRD pattern of Ba(Ti0.77Hf0.23)O3. The figure shows
the observed (circle), fitted (line), Braggs peaks and difference between ob-
served and calculated patterns. Inset shows the lattice parameter variation
with hafnium concentration.

1056 S. Anwar et al. / Solid State Sciences 9 (2007) 1054e1060
the lattice parameters of the newly synthesized compositions ofBHT trace exactly the same curve in the phase diagram. The lat-tice parameterecomposition phase diagram, including the newpoints is shown as inset in Fig. 1. The systematic shift in the lat-tice parameters of the presently studied BHT compositions isitself a confirmation that the 1% change in Hf concentrationhas effectively been taken place. This can be vividly confirmedfrom Fig. 2a, which shows systematic lower angle shift of oneof the high angle peaks, (211) of the studied BHT compositions,with increasing Hf content. These shifts indicate that the substi-tution of Hf effectively results in expansion of the cubic latticeparameter.
The fact that the substitution of Hf is taking place only on theTi site or it is partially replacing Ba also, was realized from thefollowing two arguments given based on Rietveld refinementand a plot, as given in Fig. 2b. Fig. 2b shows the experimentallymeasured and simulated cubic lattice parameters. For checking
55.5 56.0
BHT20BHT22BHT23BHT30
Inte
nsity
(a.u
)
Angle (2θ)
4.01 4.02 4.03 4.04 4.05 4.06 4.07
4.01
4.02
4.03
4.04
4.05
4.06
4.07
4.08
Sim
ulat
ed la
ttice
par
amet
er (a
Sim
)
Experimental observed Lattice parameter (aExp)
(a)
(b)
Fig. 2. (a) Enlarged view of X-ray diffraction profiles of a high angular peak
for BHT20, BHT22, BHT23 and BHT30 ceramics. A systematic shift can be
clearly seen with Hf concentration. (b) Circles show a plot between theoreti-
cally simulated and experimentally observed lattice parameter, line showing
straight line fitting to it.
the partial occupancy of Hf at Ba and Ti site both, we refined theXRD data of BHT23. For achieving the comparable c2 value forthe above model, to that obtained for the model in which Hf oc-cupies only the Ti site, we got the total Hf occupancy equivalentto w48% of the Hf concentration, which is quite unfeasible forBHT23. This dictates the infeasibility of any significant partialoccupancy of Hf at Ba site. Moreover due to the large differencein the ionic radius of Ba (1.61 A) and Hf (0.71 A), this sub-stitution will create instability of the perovskite unit cell[14,15]. A rather better proof that Hf is being substituted onlyat the Ti site can be obtained from the plot given in Fig. 2b.This plot shows the experimental lattice parameters (aExp), asobtained through Rietveld refinement, on x-axis and the simu-lated cubic lattice parameters aSim(x), on y-axis. The simulatedlattice parameter aSim(x) corresponds to the BHT with x Hf con-tent, and is defined as
aSimðxÞ ¼ a0 þDdionðxÞ ð1Þ
where a0 is the lattice parameter of reference cubic phase(BHT10) and Ddion(x) is the difference of the effective diametersof ions at the B site for a general BHT composition with respectto that of the reference composition BHT10. The effective ionicdiameter at B site has been taken as the weighted average of theionic diameters of Hf4þ(1.42 A) and Ti4þ(1.21 A) [14]. BHT10has been taken as the reference because only at this compositionthe tetragonal to cubic transformation completes and above this,all compositions are cubic, see inset of Fig. 1. From Eq. (1) it isclear that if Hf goes only to the Ti site, the plot shown in Fig. 1bmust be a straight line with a slope of 45�. The slope obtained inthe present case is w49�, which is very close to ideal case (45�).The occurrence of straight line with a slope close to 45�, con-firms that Hf goes to the Ti site only.
3.2. Dielectric studies
Fig. 3a depicts the temperature dependence of real (30) andimaginary (300) parts of the dielectric constant of Ba(Ti1�xHfx)O3
ceramics with x¼ 0.20, 0.22 at various frequencies and Fig. 3brepresents that for x¼ 0.23, 0.30, respectively. The paraelectricto ferroelectric phase transition for these doped ceramics hasconsiderably diffused and the transition temperature (Tc) hasalso decreased as that of the BaTiO3. It should be noticed thatthe permittivity vs temperature curves for x� 0.22 (BHT20and BHT22) show only a broad diffuse transition instead of threephase transitions as observed in pure or low (x¼ 0.05) Hf dopedBaTiO3 [10]. The three phase transitions observed in BaTiO3
have got pinched and merged into one round 30 peak for higher x.No frequency dispersion in real and imaginary parts wasobserved. The details of the parameters are given in Table 1.
But for x� 0.23 (BHT23 and BHT30) ceramics, the behaviorchanges quite drastically, as shown in Fig. 3b. There is a broadand diffuse peak in 30eT curve exhibiting dispersion in Tm cor-responding to 30eT maximum. It shifts to higher temperature athigher frequencies. A frequency dispersion took place forT� Tm, the value of 30 decreases when frequency increases.The temperature and frequency variations of the imaginary

1057S. Anwar et al. / Solid State Sciences 9 (2007) 1054e1060
500
1500
2500
3500
0
100
Heating/Coolingat 1kHz
BHT20
ε'
100 150 200 250 300 350500
1500
2500
3500
Temperature (K)
100 kHz
0.1 kHz
ε'
ε''
0
1000
2000
3000
0
50
100
50 100 150 200 250 300 350
1000
2000
3000
ε'
Temperature (K)
Heating/Coolingat 1kHz
BHT22
ε''
ε'
0.1 kHz
100 kHz
0100200300
1000
2000
3000 Heating/Coolingat 1kHz
BHT30
ε'
1000
2000
3000 0.1 kHz
100 kHz
ε'
100 150 200 250 300 350
0
100
200
300
0.1 kHz
100 kHz
0.1kHz1kHz10kHz100kHz
ε''
Temperature (in K)
ε''1000
2000
3000
0100200
1000
2000
3000
100 150 200 250 300 350
0
100
200
300
Heating/Coolingat 1kHz
BHT23
ε'
ε''
0.1 kHz
100 kHz
ε'
0.1 kHz
100 kHz
Temperature (K)
ε''
(a)
(b)
Fig. 3. (a) Temperature dependence of 30 and 300 of BHT20 and BHT22 at 0.1 kHz, 1 kHz, 10 kHz and 100 kHz. (b) Temperature dependence of 30 and 300 of BHT23
and BHT30 at 0.1 kHz, 1 kHz, 10 kHz and 100 kHz.
1058 S. Anwar et al. / Solid State Sciences 9 (2007) 1054e1060
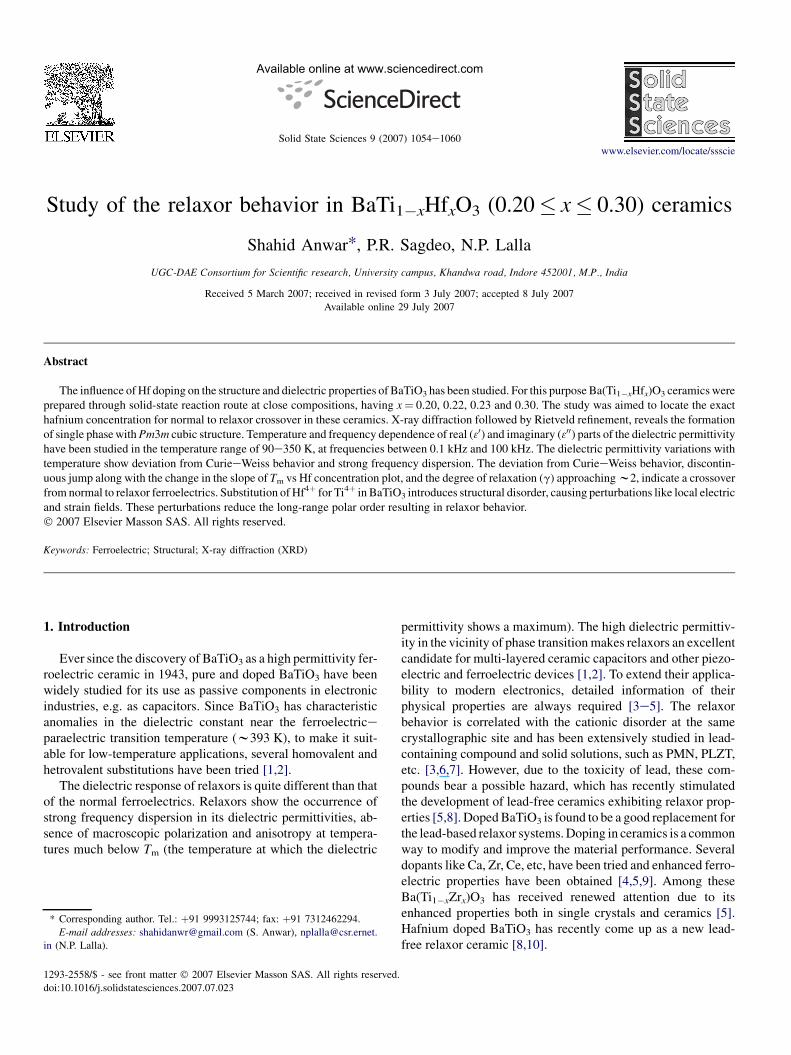
part 300 is also specific: the value of T0m (dielectric absorptionmaximum temperature), is much less than Tm. The temperatureT0m shifts to higher values with increasing frequency, and thefrequency dispersion of 300 was found to be just opposite. Allthe above described features of (30eT ) and (300eT ) are typicalto a relaxor ferroelectric state [3,5,6,10,16]. The occurrence ofrelaxor behavior for x¼ 0.23 confirms that normal to relaxorcrossover boundary lies somewhere at 0.22< x< 0.23. Thecrossover occurs somewhere in-between x¼ 0.22e0.23 of theHf concentration. On the TmeHf concentration phase diagram[10] x¼ 0.22 lies exactly on the curve for normal ferroelectricphase and x¼ 0.23 on the line corresponding to relaxor phase,see Fig. 4. In order to further confirm the relaxor behavior, quan-titative characterizations as described in the following have alsobeen done.
3.3. Characterization of 30eT behavior on hightemperature side
Normal ferroelectrics in the paraelectric state, i.e. abovetransition temperature Tc, follow CurieeWeiss behavior de-scribed as
1
30¼ ðT� TcÞ=C ðT > TcÞ ð2Þ
where Tc is the Curie temperature and C is the CurieeWeiss con-stant. Fig. 5 shows the inverse of 30 as a function of temperature at
-5 0 5 10 15 20 25 30 35 40 45100
150
200
250
300
350
400 Previous dataCurrent data
Tran
sitio
n Te
mpe
ratu
re (T
m)
%age Concentration of Hafnium
Fig. 4. Plot showing permittivity (30) maxima temperature or transition temper-
ature (Tm) dependence on Hf concentration, as derived from 30eT measure-
ment done at 1 kHz. A discontinuous jump in Tm at x¼ 0.23 followed by
a change in the slope can be seen.
Table 1
Parameters related to ferroelectric and relaxor behaviors
BHT20 BHT22 BHT23 BHT30
Tm (K) 245 227 166 149
DTm (K) 71 85 123 132
DTdif (K) w30 w30 w30 33
DTrelax (K) w2 w1 18 23
Tm, DTm, and DTrelax represent the transition temperature, degree of CurieeWeiss deviation, and degree of relaxation, respectively, for Ba(Ti1�xHfx)O3.
1 kHz and its CurieeWeiss plot for (a) BHT23 and (b) BHT30. Adeviation from CurieeWeiss law starting at Tdev can be clearlyseen. The occurrence of the CurieeWeiss behavior only at tem-peratures much higher than Tc (or Tm) in BHT23 and BHT30,suggests that the behavior is not like a normal ferroelectrics.Such a behavior has generally been attributed to a modifiedferroelectrics, i.e. relaxors. A parameter DTm, which is oftenused to show the degree of deviation from the CurieeWeisslaw [7], is defined as follows.
DTm ¼ Tdev � Tm ð3Þ
The Tdev and DTm were determined according to Eq. (3) using1 kHz data and are presented in Table 1. For relaxors, modifiedCurieeWeiss law has been proposed by Uchino and Nomura,[17] to describe the diffuseness of the phase transition. This isdefined as in the following equation,
0.0003
0.0006
0.0009
0.0012
(a)
Tdev=289
1/ε'
100 150 200 250 300 3500.0002
0.0005
0.0008
0.0011
0.0014
(b)
Tdev=281
1/ε'
Temperature (K)
Fig. 5. The inverse dielectric constant (1/30) as a function of temperature at
10 kHz for (a) BHT23 and (b) BHT30 ceramics. The symbol represents exper-
imental data points and solid line shows fitting to the CurieeWeiss law.

1059S. Anwar et al. / Solid State Sciences 9 (2007) 1054e1060
0.4 0.8 1.2
-6
-5
BHT-30
0.6 1.0 1.4
-6
-5
BHT-23
log(T-T m)
log(
1/-1
/m
)
log(T-T m)
log(1/-1/
m )'
Fig. 6. Plot of log(1/30 � 1/30m) versus log(T� T30m) for BHT23 and BHT30 ceramics at 10 kHz. Symbol represents experimental data and solid line shows fitting.
1
30� 1
30m¼�T� T30m
�g
C1
ð4Þ
where g and C1 are modified constants, with 1� g� 2. The ex-ponent g defines the character of the phase transition. For thelimiting cases, i.e. for g¼ 1 and g¼ 2, expression (4) reducesto CurieeWeiss law for normal ferroelectrics and quadratic de-pendent for ideal relaxors, respectively [6,9,10]. Thus the valueof g can also characterize the relaxor behavior. The value of theexponent g also quantifies the degree of the diffuseness of thephase transition. It can be derived from least square fit oflog(1/30 � 1/30m) vs log(T� T30m) plot as shown in Fig. 6. We ob-tained the value of the parameter g to be 1.86 (BHT23) and 1.88(BHT30), which are close to 2, suggesting the occurrence ofrelaxor behavior [9]. The diffuseness of the phase transitioncan also be described empirically by a parameter DTdif as de-fined by the following equation [9,18].
DTdif ¼ T0:930mð100 HzÞ � T30mð100 HzÞ ð5Þ
Here T0:930mð100 HzÞ is the temperature corresponding to 90% ofthe maximum dielectric constant (30m) in the high temperature
side at 100 Hz. T30mð100 HzÞ is the dielectric maxima temperatureat 100 Hz. The diffuseness DTdif obtained from the availabledata is also presented in Table 1. Yet another parameter, whichis used to characterize the degree of relaxation behavior in thefrequency range of 100 Hz to 100 kHz, is described [15] asfollows.
DTrelax ¼ T30mð100 kHzÞ � T30mð100 HzÞ ð6Þ
The value of DTrelax is determined from the permittivity dataand is presented in Table 1. The above characterization doneon the basis of CurieeWeiss law and the value of empirical pa-rameters like DTm, g, DTdif and DTrelax suggest that the per-mittivity of BHT20 and BHT22 are of normal ferroelectricsand that of BHT23 and BHT30 are of relaxors. For composi-tion x� 0.23, CurieeWeiss law follows at a temperature muchhigher than Tm. Thus large deviation from the CurieeWeissbehavior, large relaxation temperature DTrelax, and g y 2,suggests that compositions above x¼ 0.22 are relaxors.
5.4 5.6 5.8 6.0 6.2 6.4
4
5
6
7
8
9
10
11
12
13
14
6.0 6.2 6.4 6.6 6.8 7.0 7.24
5
6
7
8
9
10
11
12BHT-23
Ln (f
req.
)
1000/T
BHT-30
Ln (freq.)
1000/T
Fig. 7. Frequency dependence of Tm for BHT23 and BHT30 ceramics. The symbols and solid line indicate data points and fit to VogeleFulcher relationship,
respectively.

1060 S. Anwar et al. / Solid State Sciences 9 (2007) 1054e1060
The frequency dependence of Tm is shown in Fig. 7 as ln f vs1000/Tm plot. This frequency dependence of Tm is empiricallyevaluated using VogeleFulcher relation as in the following.
f ¼ f0 exp
��Ea
kB
�Tm� Tf
��
ð7Þ
Here Ea is the activation energy, Tf the freezing temperature ofpolarization-fluctuation, and f0 is the pre-exponential factor.The value of Ea, Tf and f0 for BHT23 and BHT30 is tabulatedin Table 2. Similar values have been reported for BaTi0.75Zr0.25O3
[18] too.When reflecting on the occurrence of relaxor behavior in
any kind of oxide, either perovskite or TTB, it appear due toexistence of lattice disorder and polar nanodomains at temper-ature much higher than Tm. Various experimental evidencespresent in the literature suggest that the relaxor behavior inthese materials does not occur in the absence of disorder[15,19]. Random lattice disorder produced by chemical substi-tution in ABO3 perovskite can lead to the formation of dipolarimpurities and defects that have profound influence on thestatic and dynamic properties of these materials. The existenceof these nanopolar domains has been recognized to play an im-portant role in the occurrence of relaxor behavior [9,10,18]. Inthe present case also the relaxor ferroelectric behavior in BHTwith x� 0.23 appears to be due to the presence of these nano-polar domains only. When Hf replaces Ti, the crystal structureand the ferroelectricity of BaTiO3 gets modified. The substitu-tion of Ti4þ ions by Hf4þ, which has a larger ionic radius of0.71 A than that of Ti4þ 0.605 A [14], causes random latticedisorder. The replacements of Ti4þ by Zr4þ ions are well stud-ied [5,18]. The increasing substitution decreases the Curietemperature, which is related to the ionic radius [9,10,15]. Ithas been suggested that polar nanodomains are responsiblefor the relaxational behavior in PMN, PLZT and other systems[3,6,7]. When these nanodipolar entities possess more thanone equivalent orientation, they may undergo dielectric relax-ation in an applied ac field. The substitution of Hf tends tomake the distance between off-center Ti dipoles larger andthus weakening the correlation between these dipoles andalso distorting the oxygen octahedra. The distorted BO6 octa-hedra gives rise to the local electric and strain fields. These
Table 2
Parameters Ea (activation energy), Tf (freezing temperature) and f0 (pre-
exponential factor) obtained after the VogeleFulcher fitting of BHT23 and
BHT30 ceramics
Compositions Ea (eV) Tf (K) f0 (Hz)
BHT23 0.087 119 1.55� 1012
BHT30 0.14 78.5 1.53� 1013
local fields are usually random in nature and tend to breakthe large ferroelectric domains into nanopolar domains, whichstabilize at low temperatures [5,9,16]. The competition be-tween long-range ordering owing to strong correlation of theoff-center Ti dipoles and the random fields induced by Hf dop-ing induces relaxor behavior.
4. Conclusions
Based on the above described results and discussions on thestructural and dielectric studies on BHT ceramics with closeHf compositions between 0.20� x� 0.30, it can be concludedthat although the tetragonal to cubic phase transformation occursat x w 0.10 as shown in our previous study, the normal to relaxorferroelectric crossover boundary lies in-between 0.22< x< 0.23of Hf substitution. It has bee shown that Hf goes only at the Tisite. The temperature dependent dielectric studies at various fre-quencies show that the permittivity maxima are diffusive anddispersive with respect to frequency. This is a characteristic ofrelaxor behavior. The quantitative evaluation of other empiricalparameters like DTm, g, DTdif and DTrelax are also in accordancewith the dispersive phase transition, characterizing the relaxorbehavior.
References
[1] B. Jaffe, W.R. Cook, H. Jaffe, Piezoelectric Ceramics, Academic, London,
1971.
[2] Y. Sakabe, T. Takagi, K. Wakino, D.M. Smith, in: J.B. Blum, W.R. Cannon
(Eds.), Advances in Ceramics, vol. 19, Am. Ceram. Soc. Inc., Ohio, 1986,
p. 103.
[3] L.E. Cross, Ferroelectrics 76 (1987) 241 151 (1994) 305e320.
[4] J.N. Lin, T.B. Wu, J. Appl. Phys. 68 (1990) 985.
[5] J. Ravez, A. Simon, Eur. J. Solid State Inorg. Chem. 37 (1997) 1199.
[6] Z.Y. Cheng, R.S. Katiyar, X. Yao, Aqiang Guo, Phys. Rev. B 55 (1997)
8165.
[7] D. Viehland, S.J. Jang, L.E. Cross, M. Wuttig, Phys. Rev. B 46 (1992)
8003.
[8] V. Tura, L. Mitoseriu, Europhys. Lett. 50 (6) (2000) 810.
[9] Chen Ang, Zhi Jing, Zhi Yu, J. Phys.: Condens. Matter. 14 (2002) 8901.
[10] Shahid Anwar, P.R. Sagdeo, N.P. Lalla, J. Phys.: Condens. Matter. 18
(2006) 3455.
[11] Shahid Anwar, P.R. Sagdeo, N.P. Lalla, Solid State Commun. 138 (2006)
331.
[12] J. Ravez, A. Simon, Eur. J. Solid State Inorg. Chem. 160 (2001) 260.
[13] J. Rodriguez-Carvajal, Physica B 192 (1993) 55e69.
[14] R.D. Shannon, Acta Crystallogr. A 32 (1976) 751e767.
[15] A.S. Bhalla, R. Guo, R. Roy, Mater. Res. Innovations 4 (2000) 3.
[16] P. Victor, R. Ranjith, S.B. Krupanidhi, J. Appl. Phys. 94 (12) (2003)
7702.
[17] K. Uchino, S. Nomura, Ferroelectr. Lett. Sect. 44 (1982) 55.
[18] Yu Zhi, Ang Chen, Guo Ruyan, A.S. Bhalla, J. Appl. Phys. 92 (2002)
2655.
[19] G.A. Samara, J. Phys.: Condens. Matter. 15 (2003) R367.