The strength of PIN-PMN-PT single crystals under bending with a longitudinal electric field
9
The strength of PIN–PMN–PT single crystals under bending with a longitudinal electric field This article has been downloaded from IOPscience. Please scroll down to see the full text article. 2011 Smart Mater. Struct. 20 055006 (http://iopscience.iop.org/0964-1726/20/5/055006) Download details: IP Address: 131.84.11.215 The article was downloaded on 03/05/2011 at 17:00 Please note that terms and conditions apply. View the table of contents for this issue, or go to the journal homepage for more Home Search Collections Journals About Contact us My IOPscience
-
Upload
independent -
Category
Documents
-
view
0 -
download
0
Transcript of The strength of PIN-PMN-PT single crystals under bending with a longitudinal electric field

The strength of PIN–PMN–PT single crystals under bending with a longitudinal electric field
This article has been downloaded from IOPscience. Please scroll down to see the full text article.
2011 Smart Mater. Struct. 20 055006
(http://iopscience.iop.org/0964-1726/20/5/055006)
Download details:
IP Address: 131.84.11.215
The article was downloaded on 03/05/2011 at 17:00
Please note that terms and conditions apply.
View the table of contents for this issue, or go to the journal homepage for more
Home Search Collections Journals About Contact us My IOPscience

Report Documentation Page Form ApprovedOMB No. 0704-0188
Public reporting burden for the collection of information is estimated to average 1 hour per response, including the time for reviewing instructions, searching existing data sources, gathering andmaintaining the data needed, and completing and reviewing the collection of information. Send comments regarding this burden estimate or any other aspect of this collection of information,including suggestions for reducing this burden, to Washington Headquarters Services, Directorate for Information Operations and Reports, 1215 Jefferson Davis Highway, Suite 1204, ArlingtonVA 22202-4302. Respondents should be aware that notwithstanding any other provision of law, no person shall be subject to a penalty for failing to comply with a collection of information if itdoes not display a currently valid OMB control number.
1. REPORT DATE 05 MAY 2011 2. REPORT TYPE
3. DATES COVERED 00-00-2011 to 00-00-2011
4. TITLE AND SUBTITLE The Strength Of PIN-PMN-PT Single Crystals Under Bending With ALongitudinal Electric Field
5a. CONTRACT NUMBER
5b. GRANT NUMBER
5c. PROGRAM ELEMENT NUMBER
6. AUTHOR(S) 5d. PROJECT NUMBER
5e. TASK NUMBER
5f. WORK UNIT NUMBER
7. PERFORMING ORGANIZATION NAME(S) AND ADDRESS(ES) Naval UnderseaWarfare Center,Newport,RI,02841
8. PERFORMING ORGANIZATIONREPORT NUMBER
9. SPONSORING/MONITORING AGENCY NAME(S) AND ADDRESS(ES) 10. SPONSOR/MONITOR’S ACRONYM(S)
11. SPONSOR/MONITOR’S REPORT NUMBER(S)
12. DISTRIBUTION/AVAILABILITY STATEMENT Approved for public release; distribution unlimited
13. SUPPLEMENTARY NOTES Smart Materials and Structures, Volume 20, Number 5, (May 2011)
14. ABSTRACT The effect of an electric field on the bending behavior of [001] oriented and poled relaxorPb(In1/2Nb1/2)O3?Pb(Mg1/3Nb2/3)O3?PbTiO3 (PIN?PMN?PT) single crystals was measured using a fourpoint bending apparatus with a longitudinal electric field applied to the bar during bending. The surfacefinish and electric field amplitude were observed to affect the bending strength. Polished surfaces improvethe tensile strength, while also polishing the edges resulted in a significantly larger increase in strength.Application of a DC electric field in the polarization direction during the tests reduced the strength. Thefour point bending apparatus also produces both tensile and compressive stress?strain curves for thematerial. Uniaxial compressive loading with an electric field in the [001] direction was carried out tocompare the stress versus strain behavior measured in bending with that measured in uniaxialcompression. Although the uniaxial compression behavior displays effects of a rhombohedral toorthorhombic phase transformation, this behavior is not observed on the compressive side in the bend bars.
15. SUBJECT TERMS
16. SECURITY CLASSIFICATION OF: 17. LIMITATION OF ABSTRACT Same as
Report (SAR)
18. NUMBEROF PAGES
9
19a. NAME OFRESPONSIBLE PERSON
a. REPORT unclassified
b. ABSTRACT unclassified
c. THIS PAGE unclassified
Standard Form 298 (Rev. 8-98) Prescribed by ANSI Std Z39-18

IOP PUBLISHING SMART MATERIALS AND STRUCTURES
Smart Mater. Struct. 20 (2011) 055006 (7pp) doi:10.1088/0964-1726/20/5/055006
The strength of PIN–PMN–PT singlecrystals under bending with a longitudinalelectric fieldP Zhao1, S Goljahi1, W Dong1, T Wu1, P Finkel2, R Sahul3,K Snook3, J Luo3, W Hackenberger3 and C S Lynch1
1 Department of Mechanical and Aerospace Engineering, University of California LosAngeles, 420 Westwood Plaza, Los Angeles, CA 90095, USA2 Naval Undersea Warfare Center, Newport, RI 02841, USA3 TRS Technologies, 2820 East College Avenue, State College, PA 16801, USA
Received 25 January 2011, in final form 17 March 2011Published 6 April 2011Online at stacks.iop.org/SMS/20/055006
AbstractThe effect of an electric field on the bending behavior of [001] oriented and poled relaxorPb(In1/2Nb1/2)O3–Pb(Mg1/3Nb2/3)O3–PbTiO3 (PIN–PMN–PT) single crystals was measuredusing a four point bending apparatus with a longitudinal electric field applied to the bar duringbending. The surface finish and electric field amplitude were observed to affect the bendingstrength. Polished surfaces improve the tensile strength, while also polishing the edges resultedin a significantly larger increase in strength. Application of a DC electric field in thepolarization direction during the tests reduced the strength. The four point bending apparatusalso produces both tensile and compressive stress–strain curves for the material. Uniaxialcompressive loading with an electric field in the [001] direction was carried out to compare thestress versus strain behavior measured in bending with that measured in uniaxial compression.Although the uniaxial compression behavior displays effects of a rhombohedral to orthorhombicphase transformation, this behavior is not observed on the compressive side in the bend bars.
(Some figures in this article are in colour only in the electronic version)
1. Introduction
Pb(In1/2Nb1/2)O3–Pb(Mg1/3Nb2/3)O3–PbTiO3 (PIN–PMN–PT) is under development to increase the phase stabilityand temperature range of relaxor rhombohedral single crys-tals. Results reported in the literature indicate that certaincompositions are piezoelectric over a broader range of tem-peratures than Pb(Mg1/3Nb2/3)O3–PbTiO3 (PMN–PT) singlecrystals [1–6]. This work focuses on the mechanical propertiesof the PIN–PMN–PT crystals and presents the results of bendtesting of PIN–PMN–PT single crystal bars with longitudinalelectric field loading during the bending. Although themain purpose of the tests was to identify the effect of anelectric field on the tensile strength of the bars, the approachalso produced tensile and compressive stress–strain curves.Rather unexpectedly, the nonlinear behavior associated witha compressive stress induced rhombohedral to orthorhombicphase transformation that occurs under uniaxial compressionwas missing. This observed stress–strain behavior as well
as a proposed explanation for the suppression of the phasetransformation are presented.
Fracture behavior of ferroelectric materials is well knownto be affected by the polarization state of the material.Many authors have reported the effect of polarization onVicker’s indentations, with indentation cracks growing largerperpendicular to the polarization direction. Roedel et al[7–10] and other authors [11, 12] have performed experimentalfracture mechanics as a function of polarization directionon ferroelectric specimens and found that the polarizationdirection affects the fracture properties. This includes compacttension specimens to obtain the effect of polarization directionon fracture toughness and the use of bend bars to study R-curves and to study v-K behavior [13–16]. Other authorsalso reported fracture testing as a function of polarizationdirection [12, 17].
There have been a few fracture experiments done withsimultaneous electrical and mechanical loading. Doubletorsion was used by Koepke et al [18] and the electric field was
0964-1726/11/055006+07$33.00 © 2011 IOP Publishing Ltd Printed in the UK & the USA1

Smart Mater. Struct. 20 (2011) 055006 P Zhao et al
Figure 1. (a) Micrograph of the edge of the first set of bars with only the surfaces polished, and (b) of the second set of bars with the edgesalso polished.
Table 1. PIN–PMN–PT specimen geometry, surface finish technique and failure stress.
Specimen number Dimension (mm) Surface finish Failure stress (MPa) Electric field (MV m−1)
PIN–PMN–PT 1 3 × 4 × 25 no edges polished 13.5 0.73PIN–PMN–PT 2 3 × 4 × 25 no edges polished 18.5 0.73PIN–PMN–PT 3 3 × 4 × 25 no edges polished 21 0PIN–PMN–PT 4 3 × 4 × 25 no edges polished 22 0PIN–PMN–PT 5 3 × 4 × 25 no edges polished 26 0PIN–PMN–PT 6 3 × 4 × 18 edges polished 42 0.5PIN–PMN–PT 7 3 × 4 × 18 edges polished 47 0.5PIN–PMN–PT 8 3 × 4 × 18 edges polished 48 0PIN–PMN–PT 9 3 × 4 × 18 edges polished 70 0PIN–PMN–PT 10 3 × 4 × 18 edges polished 85 0
shown to change the direction of crack propagation. Severalpapers [19–22] reported the fracture behavior of ferroelectricssubjected to the mechanical loading and transverse electricfield. Su et al [23] conducted fracture tests under tensileloading and longitudinal electric field. In all cases, the largesteffect of polarization on fracture behavior appears to occurwhen the crack plane is perpendicular to the polarization.
Compression testing of ferroelectric materials withconcurrent electric field loading has been used to characterizethe constitutive behavior of a number of ferroelectric materials.Early work of Lynch et al [24] presented the uniaxial stress–strain–electric field behavior of lead lanthanum zirconatetitanate (8/65/35 PLZT). This technique was later appliedto Pb(Zn1/3Nb2/3)O3–4.5%PbTiO3 (PZN–4.5%PT) and toPMN–xPT [001] cut relaxor single crystals with x rangingfrom 27% to 32%. The single crystal work resulted inclear indications of stress and electric field driven phasetransformations [25–29].
2. Experiments
2.1. Specimen preparation
The Bridgman growth technique was used to produce a largePIN–PMN–PT single crystal boule. The orientation of thecrystal was determined using an x-ray diffraction systemand crystals were cut into bend bars with the [001], [010],and [100] axes oriented with the length, depth and widthof the bars. Two different sets of single crystal bars were
produced for testing. Dimensions of the first set of bars were25 mm × 3 mm × 4 mm and dimensions of the second setwere 18 mm × 3 mm × 4 mm. Growing the crystals is a timeconsuming process and obtaining large numbers of bars 25 mmin length turned out to be problematic. The second set of barswas shorter in order to reduce the amount of single crystalmaterial that was used in each test. Bars were cut and polished,and then subjected to bending with and without electric field.The first set of bars had the four larger surfaces polished toa mirror finish, but some small chipping was apparent at theedges as seen in figure 1(a). The second set of bars had thelarge surfaces polished to a mirror finish, but also had theedges polished. Figure 1(b) shows that the edge chipping wasreduced. Wires were attached to the 3 mm × 4 mm surfaces ofthe polished bars using silver epoxy.
A total of ten specimens were tested, five without edgespolished and five with edges polished. Table 1 lists thespecimen numbers and the dimensions. Strain gages weremounted to the center of the span on each of the two4 mm × 25 mm or 4 mm × 18 mm surfaces. These were usedto monitor the tensile and compressive strain during the tests.Table 1 also includes the peak loads and electric fields appliedto each bar. The applied electric field on the first set of barswas 0.73 MV m−1. On the second of bars, the electric field wasreduced to 0.5 MV m−1 in order to avoid occasional electricalarcing that destroyed specimens.
A 4 mm × 4 mm × 12 mm single crystal PIN–PMN–PTspecimen was produced for compression testing with electricfield. Strain gages were mounted at the center of two opposing
2
Smart Mater. Struct. 20 (2011) 055006 P Zhao et al
Figure 2. Measured electric displacement D versus electric field Eloop of a PIN–PMN–PT crystal.
4 mm × 12 mm surfaces so that longitudinal strain could bemeasured. The specimen surfaces were not polished. Thespecimen was baked overnight in a 30 ◦C oven prior to loading.
2.2. Properties of PIN–PMN–PT
The composition of xPIN–(1-x-y)PMN–yPT is not accuratelyknown for the bars provided and thus is not reported inthis work. The composition is rhombohedral and near therhombohedral to orthorhombic morphotropic phase boundary.Measurements of the physical properties are reported.
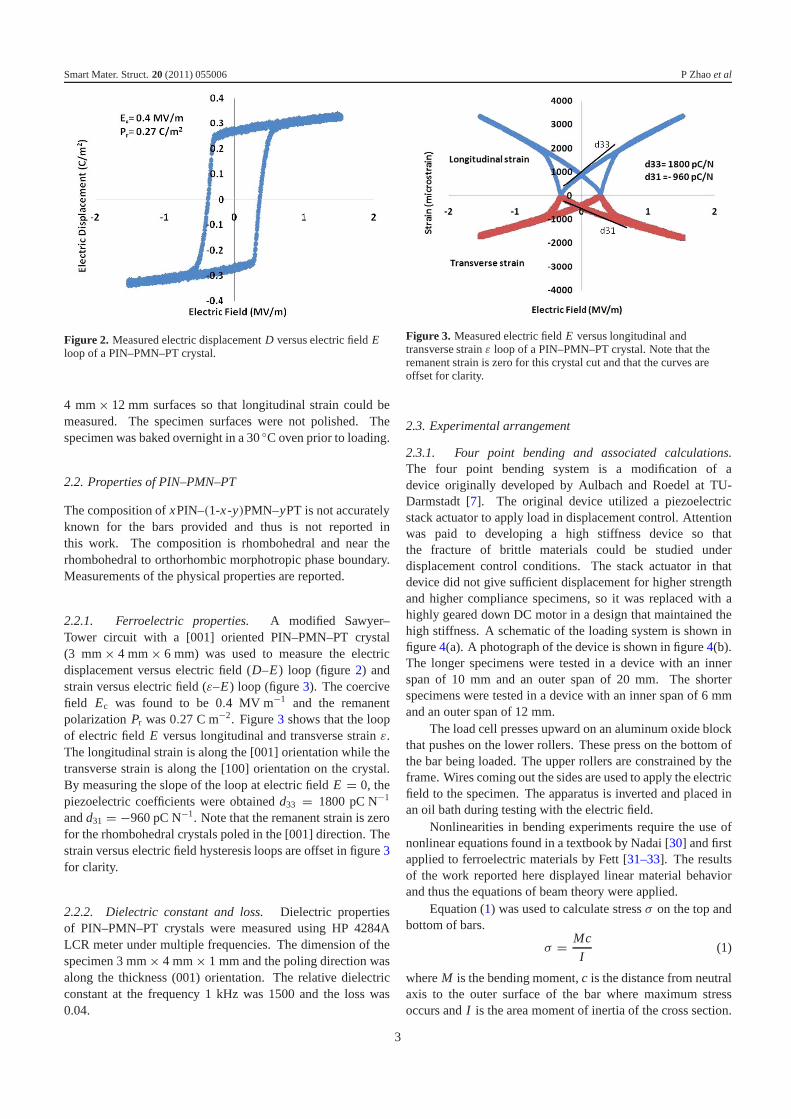
2.2.1. Ferroelectric properties. A modified Sawyer–Tower circuit with a [001] oriented PIN–PMN–PT crystal(3 mm × 4 mm × 6 mm) was used to measure the electricdisplacement versus electric field (D–E) loop (figure 2) andstrain versus electric field (ε–E) loop (figure 3). The coercivefield Ec was found to be 0.4 MV m−1 and the remanentpolarization Pr was 0.27 C m−2. Figure 3 shows that the loopof electric field E versus longitudinal and transverse strain ε.The longitudinal strain is along the [001] orientation while thetransverse strain is along the [100] orientation on the crystal.By measuring the slope of the loop at electric field E = 0, thepiezoelectric coefficients were obtained d33 = 1800 pC N−1
and d31 = −960 pC N−1. Note that the remanent strain is zerofor the rhombohedral crystals poled in the [001] direction. Thestrain versus electric field hysteresis loops are offset in figure 3for clarity.
2.2.2. Dielectric constant and loss. Dielectric propertiesof PIN–PMN–PT crystals were measured using HP 4284ALCR meter under multiple frequencies. The dimension of thespecimen 3 mm × 4 mm × 1 mm and the poling direction wasalong the thickness (001) orientation. The relative dielectricconstant at the frequency 1 kHz was 1500 and the loss was0.04.
Figure 3. Measured electric field E versus longitudinal andtransverse strain ε loop of a PIN–PMN–PT crystal. Note that theremanent strain is zero for this crystal cut and that the curves areoffset for clarity.
2.3. Experimental arrangement
2.3.1. Four point bending and associated calculations.The four point bending system is a modification of adevice originally developed by Aulbach and Roedel at TU-Darmstadt [7]. The original device utilized a piezoelectricstack actuator to apply load in displacement control. Attentionwas paid to developing a high stiffness device so thatthe fracture of brittle materials could be studied underdisplacement control conditions. The stack actuator in thatdevice did not give sufficient displacement for higher strengthand higher compliance specimens, so it was replaced with ahighly geared down DC motor in a design that maintained thehigh stiffness. A schematic of the loading system is shown infigure 4(a). A photograph of the device is shown in figure 4(b).The longer specimens were tested in a device with an innerspan of 10 mm and an outer span of 20 mm. The shorterspecimens were tested in a device with an inner span of 6 mmand an outer span of 12 mm.
The load cell presses upward on an aluminum oxide blockthat pushes on the lower rollers. These press on the bottom ofthe bar being loaded. The upper rollers are constrained by theframe. Wires coming out the sides are used to apply the electricfield to the specimen. The apparatus is inverted and placed inan oil bath during testing with the electric field.
Nonlinearities in bending experiments require the use ofnonlinear equations found in a textbook by Nadai [30] and firstapplied to ferroelectric materials by Fett [31–33]. The resultsof the work reported here displayed linear material behaviorand thus the equations of beam theory were applied.
Equation (1) was used to calculate stress σ on the top andbottom of bars.
σ = Mc
I(1)
where M is the bending moment, c is the distance from neutralaxis to the outer surface of the bar where maximum stressoccurs and I is the area moment of inertia of the cross section.
3

Smart Mater. Struct. 20 (2011) 055006 P Zhao et al
(a) (b)
Figure 4. (a) Sketch of the four point bending system with electric field and (b) photograph of the loading apparatus.
The bending moment was calculated using equation (2)
M = Ps/2 (2)
where P is the load that is applied to the bars and s is thedistance between outer and inner rollers (see figure 4(a)).
During the test, the data from the load cell and theWheatstone bridge strain gage amplifier were recorded.Equation (3) was applied to calculate the load P on the bars.
P = Lo × g
0.105(3)
where Lo is the voltage output from the load cell, g is 9.8 m s−2
and load cell factor is 1/0.105 kg V−1.Equation (4) was applied to covert the signal output from
the Vishay strain gage amplifier into microstrain.
ε = 2So
Fg× 1000 (4)
where So is the voltage output from the strain gage amplifier,Fg is strain gage factor, 2.030.
2.3.2. Uniaxial compression with electric field. Thecompression with electric field measurements were performedusing a system located at NUWC Division Newport, similarto the arrangement described in [26]. This system appliesconcurrent electric field and uniaxial mechanical load toelectroactive materials.
Electric field and stress were introduced via the electrodeson the two 4 mm × 4 mm faces of the specimen. Two straingages were attached in series and the strain measurementswere averaged between the two sides to eliminate possibleeffects from bending moments on the sample. The load frameprovided load control in the longitudinal direction so that thespecimen was free to move under constant uniaxial stresswhen the electric field was varied. The stress, strain, electricfield, and polarization data were low-pass filtered and recordedthrough a four channel data acquisition board. A diagram ofthe experimental arrangement is shown in figure 5.
Figure 5. A sketch of the experimental arrangement for concurrentuniaxial compressive stress and electric field loading. Electrical andmechanical loads were applied to the two 4 mm × 4 mm faces. Twostrain gages were mounted at the center of two opposing4 mm × 12 mm faces to measure strain along the length of thespecimen.
3. Experimental results
3.1. Bend bar results
In the first set of PIN–PMN–PT crystals, three specimenswere tested under bending to failure. The peak stress levelat the fracture point ranged from 21 to 26 MPa. Twoadditional specimens were first subjected to a small mechanicalpreload followed by an electric field of 0.73 MV m−1 and thenmechanical loading to failure. The peak stresses were 18.5 and13.5 MPa.
In the second set of crystals, three specimens weresubjected to bending stress until failure. The peak stress levelat the fracture point ranged from 48 to 85 MPa. Two specimenswere subjected to a small mechanical preload followed by anelectric field of 0.5 MV m−1 and then mechanical loading tofailure. The peak stresses were 42 and 47 MPa.
The measured stress–strain curves presented below do notshow error bars. The error in the instrumentation is less than1% and error bars would be about the same size as the datamarkers.
4

Smart Mater. Struct. 20 (2011) 055006 P Zhao et al
Figure 6. The measured stress versus strain curve with electric fieldE = 0.
Figure 6 shows the measured tensile and compressivestress and strain curves from a crystal under bending stresswith no electric field. The behavior is linear and symmetricin tension and compression. The peak stress and strain at thefracture point were 70 MPa and 2100 με for this specimen.
Figure 7 shows the measured tensile and compressivestress and strain behavior for a crystal with a bias electricfield applied. A small preload of 3 MPa was applied to thespecimen and the tensile and compressive stress and strainrelation exhibited linear behavior. Next an electric field of0.5 MV m−1 was applied. The tensile and compressive strainboth increased (bar extension) with the electric field increasing.Note that the tensile side of the bar elongated more than thecompressive side of the bar. The application of electric fieldin the presence of a small bending moment increased thecurvature of the bar. Finally, mechanical loading was applieduntil the specimen failed. The crystal displayed linear behaviorduring the mechanical loading. The peak stress at the fracturepoint was 42 MPa. The tensile strain and compressive strainat the fracture point were 1800 and −580 με. The tensilestrain was larger than the compressive strain since the electricfield caused the extension of the crystal along the longitudinaldirection. The decrease of stress as the electric field wasapplied was due to the reduction in cross sectional dimensionsperpendicular to the electric field associated with d31, and thestiff loading apparatus.
3.2. Compression with electric field results
Data was recorded for stress driven strain at several differentconstant bias electric field levels at room temperature. Table 2defines the test parameters. The stress cycle consisted of onehalf of a triangle wave from a load of −0.63–68.75 MPa andback with a loading rate of 10 N s−1.
Figure 8 shows plots of the results of the compression withelectric field experiment. At zero electric field, there is a strongnonlinearity at around 40 MPa. This nonlinearity decreases asthe electric field is increased. At 0.2 MV m−1, the nonlinearityis almost absent in the mechanical loading range.
Figure 7. The measured stress versus strain curve with electric fieldE = 0.5 MV m−1 applied after a small mechanical preload followedby mechanical loading to failure.
Table 2. Test conditions for II-33 mode specimen.
Electric field (kV m−1) Stress (MPa)
0 −0.63 → −68.75 → −0.6341.67 −0.63 → −68.75 → −0.6383.33 −0.63 → −68.75 → −0.63
125 −0.63 → −68.75 → −0.63166.67 −0.63 → −68.75 → −0.63208.33 −0.63 → −68.75 → −0.63
4. Discussion
Figure 9 shows a bar chart of the specimen failure strengthsorted in ascending order. The electric field is shown onthe same plot to indicate which specimens had an electricfield applied. The first five specimens without polished edgesdisplayed the lowest tensile strength. The average strength ofthe polished specimens was more than two times that of theunpolished specimens. The electric field consistently reducedthe strength of both sets of bars.
The behavior of the material in compression underbending load and under uniaxial load was considerablydifferent. In bending the compressive stress versus strainbehavior was linear whereas in uniaxial compression there wasa distinct nonlinearity associated with a phase transformationfrom rhombohedral to orthorhombic symmetry. It appearsthat the suppression of the phase transformation in bendingis the result of constraints placed on the bars by the bendinggeometry. These constraints occur from both the depth of thespecimen and from strain gradients through the thickness of thespecimen.
The stress field in the four point bending geometry isdepicted in figure 10. This geometry results in tensile stressat the top and compressive stress at the bottom of the bar asshown. When the material at the top of the bar is elongatedby the tensile stress, there must be an associated out of planecontraction associated with the Poisson’s ratio. Similarly, onthe compressive side of the bar there must be an out of planeexpansion. This leads to an anticlastic shape of the cross
5

Smart Mater. Struct. 20 (2011) 055006 P Zhao et al
(a) (b)
Figure 8. Measured uniaxial compressive stress and strain behavior for a PIN–PMN–PT crystal at different bias electric fields shown in(a) 3D and (b) 2D.
Figure 9. Plot of the strength of the bending bars with unpolishededge (specimens 1–5) and polished edge (specimens 6–10). Anelectric field of 0.73 MV m−1 was applied to specimens 1 and 2. Noelectric field was applied to specimens 3–5 and 8–10. An electricfield of 0.5 MV m−1 was applied to specimens 6 and 7.
section. Thin plates in bending have a ‘snap through behavior’at a critical strain level that changes the deformation fromthe initial anticlastic shape (potato chip) to a uniform strainthrough the thickness. This is typically zero strain in the outof plane direction in a linear elastic deformation. Many ofthe bars had both longitudinal and transverse strain gages onthe top and bottom surfaces. These strain gages indicated anout of plane Poisson’s ratio contraction on the top surface andout of plane expansion on the bottom surface that is consistentwith the beam theory analysis. This is also indicative of a stateof uniaxial stress at both the top and bottom surfaces, so onewould expect a phase transformation at the same stress level inboth the bending and the uniaxial compression tests.
Attention is now turned to possible effects of the crystalstructure interacting with the geometry that may induceconstraints on the phase transformation in bending. PIN–PMN–PT single crystals have a rhombohedral structure. The[001] cut crystal has eight possible rhombohedral variantsas depicted in figure 11(a). After poling with an electricfield along the length of the bar in the [001] direction,four of the crystal variants are populated (figure 11(b)).
Figure 10. Stress that occurs in a bar subjected to four pointbending.
Figure 11. Phase transformation and crystal variants. (a) [001] cutcrystal with rhombohedral structure; (b) after poling; (c) tetragonalstructure under tension; (d) orthorhombic structure undercompression.
Large electric field loading in the [001] direction in PMN–32%PT crystals results in a rhombohedral to tetragonal phasetransformation with a large elongational strain (figure 11(c)).Compressive loading in the [001] direction results in arhombohedral to orthorhombic phase transformation with alarge associated contractional strain (figure 11(d)). This is
6

Smart Mater. Struct. 20 (2011) 055006 P Zhao et al
similar to the behavior of PMN–PT single crystals [26, 28]and the previously measured field driven phase transformationbehavior of PIN–PMN–PT single crystals [29] under combinedelectric field and stress. Based on the compression data atzero electric field, a rhombohedral to orthorhombic phasetransformation was expected to occur on the compression sideof the bend bar once the stress exceeded 40 MPa. However,this behavior was not observed during any of the bending tests.
The compressive stress induced phase transformationdepicted in figure 11(d) involves a contraction in the stressdirection and an expansion in the transverse directions. Ifwe now consider a thin sheet of material on the compressiveside of the beam, the phase transformation requires that thematerial expand in the out of plane direction. With the crystal[001], [010], [100] orientations aligned with the length, depthand width of the bar, all of the rhombohedral to orthorhombictransformation systems require an out of plane expansion.This is constrained by the untransformed material slightlydeeper into the beam. This geometric constraint explains theobserved suppression of the phase transformation when thesingle crystals are loaded in bending.
Since the crystals are brittle oxide materials, their strengthis governed by fracture mechanics. The largest crack-like flawgoverns failure in tension. Equation (5) gives the relationshipbetween fracture toughness and failure stress σ∞ for a Mode Icrack in an elastic material.
σfail = KIc
f√
πa(5)
where KIc is the mode I fracture toughness, f is a factorthat depends on crack geometry and is typically around one,and a is the crack length. This equation indicates that as theflaw sizes in the specimen are reduced through polishing, thetensile strength goes up. This is consistent with the observedincrease of tensile strength when the edges of the bars werepolished, reducing the size of the initial crack-like flaws inthe specimens. The electric field across the flaws decreasesthe fracture toughness. In these experiments the flaws arenot controlled, making it difficult to discuss the electric fieldcontributions to fracture quantitatively.
5. Conclusions
Two sets of bars were produced for bending with and withoutelectric field. One set had the large surfaces polished andthe second set had the edges polished as well. Polishingthe edges reduced the size of the surface flaws present andthus increased the failure strength. Application of an electricfield interacted with the surface flaws and reduced the failurestrength. Although insufficient tests were run to enable a moredetailed statistical analysis of the results, the effects were quitelarge. Polishing can increase the strength of the bars by a factorof two or more and an electric field can reduce the strength bya similar factor.
The constraint of the phase transformation by the bendinggeometry was not anticipated and has ramifications for possibletransformation toughening associated with domain switchingor phase transformations in the region near a crack tip. The
crack tip region is typically in a state of plane strain witha high degree of geometric constraint on the out of planedeformation except very near the location where the crackintersects the surface. The results of this work suggest thatthere will be little or no transformation toughening of thecracks that lead to failure. It is possible that rotating thecrystal cut of the beam 45◦ about its long axis so that the[011] orientations are aligned perpendicular to the compressivestress direction would remove the geometric constraint andallow the transformation to take place at both the tensileand the compressive surfaces. If this is the case, there mayalso be an orientation dependent component of transformationtoughening. These are topics for future investigation.
Acknowledgments
The authors would like to thank TRS Technologies forsupporting this work through an SBIR from the US Office ofNaval Research (ONR), grant N00014-09-C-0488. PF wouldalso like to acknowledge full support by ONR.
References
[1] Zhang S et al 2009 J. Appl. Phys. 105 104506[2] Zhang S et al 2008 J. Appl. Phys. 104 064106[3] Lee H J et al 2010 Adv. Funct. Mater. 20 3154[4] Liu X et al 2009 J. Appl. Phys. 106 074112[5] Liu X et al 2010 Appl. Phys. Lett. 96 012907[6] Wang X et al 2010 Mater. Sci. Eng. B 170 1[7] Dos Santos e Lucato S L et al 2002 J. Mech. Phys. Solids
50 2333[8] Kounga Njiwa A B et al 2006 Eng. Fract. Mech. 73 309[9] Kounga Njiwa A B et al 2007 Acta Mater. 55 675
[10] Oates W S et al 2004 J. Am. Ceram. Soc. 87 1362[11] Jones J L, Salz C R J and Hoffman M 2005 J. Am. Ceram. Soc.
88 2788[12] Kolleck A, Schneider G A and Meschke F A 2000 Acta Mater.
48 4099[13] Karastamatis T et al 2003 J. Euro. Ceram. Soc. 23 1401[14] Dos Santos e Lucato S L et al 2001 Acta Mater. 49 2751[15] Chen W et al 2001 J. Am. Ceram. Soc. 84 593[16] Dos Santos e Lucato S L 2003 J. Am. Ceram. Soc. 86 1037[17] Meschke F, Kolleck A and Schneider G A 1997 J. Eur. Ceram.
Soc. 17 1143[18] Koepke B G and McHenry K D 1979 Ferroelectrics 28[19] Heyer V et al 1998 Acta Mater. 46 6615[20] Gehrig F, Jelitto H and Schneider G A 2008 Acta Mater.
56 1359[21] Ma W and Cross L E 2003 Appl. Phys. Lett. 82 3293[22] Zhang Y, Cheng X and Qian R 2003 Mater. Sci. Eng. A 351 81[23] Su Y J et al 2004 Acta Mater. 52 3753[24] Lynch C S 1996 Acta Mater. 44 4137[25] Liu T, Lynch C S and McLaughlin E A 2007 J. Intell. Mater.
Syst. Struct. 18 409[26] McLaughlin E A, Liu T and Lynch C S 2005 Acta Mater.
53 4001[27] McLaughlin E A, Liu T and Lynch C S 2004 Acta Mater.
52 3849[28] Liu T and Lynch C S 2006 Continuum Mech. Thermodyn.
18 119[29] Finkel P, Robinson H, Stace J and Amin A 2010 Appl. Phys.
Lett. 97 122903[30] Nadai A (ed) 1950 Theory of Flow and Fracture of Solids
(New York: McGraw-Hill)[31] Fett T et al 1998 J. Mater. Sci. Lett. 17 261[32] Fett T, Munz D and Thun G 1998 J. Am. Ceram. Soc. 81 269[33] Fett T, Munz D and Thun G 1998 J. Mater. Sci. Lett. 18 1899
7