The Process Improvement Notebook (PIN
143
The Process Improvement Notebook
Transcript of The Process Improvement Notebook (PIN

'HSDUWPHQW�RI�WKH�1DY\
7RWDO�4XDOLW\�/HDGHUVKLS�2IILFH
�����-HIIHUVRQ�'DYLV�+LJKZD\��6XLWH�����
$UOLQJWRQ��9$������������
The
Process
Improvement
Notebook

About the TQL OfficeThe mission of the Total Quality Leadership (TQL) Office, Office of the Under Secretary of the Navy is to assist the Department of the Navy leaders in their quality-focused improvement efforts through education, consultation, information sharing, networking, and technical advice.
The TQL Office provides technical advice as well to a number of organizations inside and outside of government. It has responsibilities in six key areas: TQL education and training; consultant services; new technologies; assessment; networking and liaison; and information and communication.
Education and TrainingThe TQL Office is responsible for managing the technical and conceptual content of the Department of the Navy (DON) TQL curriculum. This work involves designing and developing courses as well as training instructors. The staff advises the DON on integration of TQL material into the training pipeline.
Information and CommunicationThe TQL Office educates the DON about TQL policies and initiatives through a newsletter (TQLeader), articles and reports, and presentations at conferences and meetings. It is developing a computer-based quality information network to facilitate communication with DON organizations.
Networking and Liaison
The TQL Office has much to share with other organizations, both government and private, and much to learn from them. Staff members participate in TQL-related networks and professional organizations. As resources permit, the TQL Office sponsors TQL conferences and seminars.
Consultant Services
TQL Office members provide technical advice to the Under Secretary of the Navy and other senior Navy and Marine Corps leaders on the application of TQL principles and methods within the DON and on strategic planning. Advice may also take the form of recommendations on policy as well as on Defense Performance Review initiatives.
Assessment
Systems are needed to assess the way in which TQL implementation is enhancing mission accomplishment in DON organizations. The TQL Office is designing and developing feedback mechanisms for that purpose as well as developing innovative approaches to improve overall organizational effectiveness.
New Technologies
Technology can provide critical support to DON quality improvement efforts. The job of the TQL Office is to assess new technologies related to organizational change and process improvement and translate them into applications for the DON.

The Process Improvement Notebook (PIN)
Debbie Faast, Michael White,Monica Aguirre & Carol BehrNavy Personnel Research and Development Center
Archester HoustonDepartment of the Navy Total Quality Leadership Office
Amy CulbertsonNavy Personnel Research and Development Center

iii
Foreword
The Process Improvement Notebook (PIN) is a tool for quality improvement teams to document and communicate their process improvement activities. It is designed to assist teams in telling the process improvement story from initial actions to the improved state. Communication is a key component of the quality approach, encouraging organizations to continuously improve their methods and the products and services delivered to customers.
The PIN is to be used to support the application of concepts and skills provided by the Department of the Navy (DON) Total Quality Leadership (TQL) curriculum, especially the Systems Approach to Process Improvement, Methods for Managing Quality, and Team Skills and Concepts courses. It can be used to support DON TQL process improvement efforts regardless of the setting (i.e., fleet or shore, military or civilian, headquarters or field units). The PIN helps capture the major ideas, recommendations, and efforts of teams in a concise, consistent format. This enhances the ability of teams to communicate throughout the organization and externally as needed. It also provides archival information for future improvement efforts.
Linda M. Doherty, Ph.DDirector
Department of the NavyTotal Quality Leadership Office

iv
Acknowledgments
Many people were instrumental in the development of this document. We offer special thanks to Antonio Rodriguez, of the Total Quality Leadership (TQL) Office, for the advice and knowledge he provided when reviewing the PIN. We acknowledge and appreciate the contributions of Julie Jackson, also of the TQL Office. Her recommendations and attention to detail during the course of publishing the PIN added much to the quality of this document.
Also thanks are given to the many Naval Leader Training Unit instructors and TQL coordinators and quality advisors, whose efforts made this a better document.

v
Contents
Introduction.......................................................................... 1
Format of the PIN ..................................................2
Users of the PIN.....................................................4
Resources for PIN Users........................................5
Communicating with PIN Forms.......................... 6
The Process Improvement Notebook.....................6
Storyboarding Process Improvement
Activities...........................................................7
Forming Quality Teams ...................................................... 9
Quality Team Charter ..........................................10
Team Composition...............................................14
Team Meeting and Action Plan ...........................16
Team Member Self Assessment Survey ..............20
Tally Sheet for the Team Member Self
Assessment .....................................................22
Identifying and Segmenting Customers............................25
Who Are Our Customers?....................................26
Customer Affinity Diagram.................................28
Identifying Customer Requirements.................................31
Customer Background Information .....................32
Customer Interview Form....................................34

vi
Contents
Product/Service Assessment Form...................... 38
Quality Characteristics Worksheet...................... 40
Selected Processes............................................... 42
Describing the Process and Potential Causesof Quality ........................................................................... 45
Brainstorming Form ............................................ 46
Multivoting Worksheet ....................................... 48
Affinity Diagram of Potential Causes
of Quality ....................................................... 50
Flow Chart........................................................... 52
Cause and Effect Diagram................................... 54
Establishing Data Collection Procedures......................... 57
Outcome and Output Measures........................... 58
Process Measures ................................................ 60
Data Collection Plan............................................ 62
Collecting and Analyzing Data.......................................... 65
Data Collection Sheet.......................................... 66
Check Sheet......................................................... 68
Pareto Chart of Causes of Quality....................... 70
Histogram Worksheet.......................................... 74
Scatter Diagram Worksheet ................................ 78
Run Chart ............................................................ 82

vii
Contents
Variables Control Chart (X and R) ......................84
Variables Control Chart (X and s)........................88
Individual Values and Moving Range
(X, mR) ...........................................................92
Attribute Control Chart........................................96
Taking Action on Special and Common Causes ..............99
Control Chart Interpretation...............................100
Special Cause Improvement ..............................102
Common Cause Improvement ...........................104
Approval of Common Cause Improvement.......106
Types of Process Causes....................................108
Change Implementation Plan.............................110
References..........................................................................111
Appendix: Team Dynamics Forms..................................115
Team Development Plan....................................116
Team Dynamics Survey.....................................118
Tally Sheet for Team Dynamics Survey............122
Summary of Team Dynamics Survey................126
Graph of Team Dynamics Survey .....................130
Team Dynamics Action Plan .............................132

1
Introduction
The Process Improvement Notebook (PIN) is a tool for quality improvement teams to document and communicate their process improvement activities. It is designed to assist teams in telling the process improvement story from initial actions to the improved state. Communication is a key component of the quality approach, encouraging organizations to continuously improve their methods and the products and services delivered to customers.
The following summarizes the primary information sources used in the development of the PIN:
❑ Department of the Navy (DON) Total Quality Leadership (TQL) courses (Department of the Navy, 1992a, 1993a, 1993b, 1994a, 1994b; Rodriguez, Konoske, & Landau, 1994; Silberstang, 1995);
❑ DON publications on TQL (Department of the Navy, 1992b, 1992c, 1994c; Doherty & Howard, 1993; Garrett, 1990; Houston & Dockstader, 1993; Suarez, 1992; Wasik & Ryan, 1993);
❑ DON surveys and interviews used over the past decade to assess quality improvement efforts (Kidder, 1995; Navy Personnel Research and Development Center, 1985a, 1985b, 1986, 1987a, 1987b, 1993a, 1993b);
❑ DON TQL instructors, TQL coordinators, and quality advisors in DON organizations;
❑ Quality management books consistent with the DON TQL approach (Deming, 1986; Ishikawa, 1982; Kume, 1985; Wheeler & Chambers, 1992).

2
Format of the PIN
The PIN is designed as a manual to assist quality improvement teams to highlight important information related to process improvement. Each section of the PIN contains forms and instructions for how to complete the forms. Typically the form is on the left hand side of the manual, and the instructions for that form are on the right hand side.
The PIN is accompanied by a separate PIN Forms Packet that contains full size, unbound copies of all PIN forms. A separate packet is provided so additional copies of PIN forms can be made in automatic-feed copy machines. If preferred, the originals in the PIN Forms Packet can be used by teams to record process improvement activities. Additional copies of the PIN Forms Packet can be ordered from the Aviation Supply Office, Philadelphia, if desired. The stock number for the PIN Forms Packet is 0120-LF-021-6200. It is recommended that one set of PIN Forms Packet originals be placed in a file so as to ensure high quality originals will always be available for making copies. If teams cannot locate or order a PIN Forms Packet, then copies can be made using the forms in this manual as originals.
PIN forms are placed in sections where their use may apply. But many PIN forms can be used in a number of places in the plan-do-check-act (PDCA) improvement cycle. Thus, the location of the forms in a particular section of the improvement process suggests an application, but does not imply its use only in that particular part of the process. It also does not imply the required use of any particular techniques in specific places in the PDCA cycle.
All PIN forms (except the Quality Team Charter form) have a line at the top of the form that says:
This space can be used by teams in a number of ways.
Date:Process: / /

3
When a quality improvement team is chartered, a process will be named and described on their team charter form. This process name can then be listed on each PIN form used to document activities related to that process. Always filling in the process name will assist in keeping clear activities related to a specific improvement effort, since usually a number of efforts will be going on at the same time. Often a team might not have a clear idea what the process is that they are studying - in this case, the name of the team, a topic name, or other information can be recorded on the line.
Filling in the date line on the form is helpful in tracking when the activities occurred. It is particularly useful if the team modifies or updates any of the information on the form, for they can track the sequence of changes by using the date information. Use the space in a way that best fits the process improvement effort.
PIN forms may be used by teams following any of the DON models and approaches to quality improvement. These models, such as the Process Improvement Model (Houston & Dockstader, 1993), the Systems Approach to Process Improvement Model (Rodriguez, Konoske, & Landau 1994), the Methods for Managing Quality Model (Department of the Navy, 1994b), the Starter Kit approach (Department of the Navy, 1992c), Basic Tools for Process Improvement (Department of the Navy, 1996) and the New Starter Kit for Basic Process Improvement (Department of the Navy, 1996) focus on different aspects and levels of specificity of quality improvement.
For more information on approaches to quality improvement, see the various DON publications and training courses listed in the reference section (Department of the Navy, 1992a, 1992b, 1992c, 1993a, 1993b, 1994a, 1994b; Rodriguez, Konoske, & Landau, 1994; Silberstang, 1995).
Reviewing PIN forms when beginning a new step in the improvement process can help clarify what information teams might want to know to proceed. It also helps clarify what information teams could document and communicate to others. The PIN does not profess to cover all the possible information that could be documented by quality improvement teams. It also does not imply the required use of any particular techniques in the PDCA cycle.

4
Users of the PIN
The primary users of the PIN will most likely be Process Action Teams (PATs), who are typically most involved in the detailed aspects of defining processes, developing measures, and collecting and analyzing data.
But PIN forms also relate to the activities of higher-level quality improvement teams, often referred to as the Executive Steering Committee (ESC) and Quality Management Boards (QMBs). These teams are most likely to use the forms in the front section of the PIN related to defining customers and their requirements, and chartering quality improvement teams.
Those individuals serving as links between quality improvement teams may find PIN forms particularly useful in summarizing and reporting process improvement efforts. PIN forms can help with both upward and downward communication between quality improvement teams. They can also facilitate communication with others in the organization, along with external customers and suppliers.
To be most effective, quality improvement teams need to make sure that their chartering team provides them with information associated with customers, their requirements, and quality characteristics associated with those requirements. Ideally ESCs and QMBs would complete the charter form and the customer forms before chartering PATs. If not, then PATs need to collect information concerning customer requirements and quality characteristics before proceeding with their process improvement activities.

5
Resources for PIN Users
The following DON TQL courses serve as the basic resources for quality improvement teams:
❑ Fundamentals of Total Quality Leadership
❑ Team Skills and Concepts
❑ Implementing Total Quality Leadership
❑ Methods for Managing Quality
❑ Systems Approach to Process Improvement
Besides the DON TQL courses, PIN users may want to consult the following resource materials for information on process improvement methods and tools:
❑ The Memory Jogger Plus by Brassard (1989)
❑ The Team Handbook by Scholtes (1988)
❑ Statistical Methods for Quality Improvement by Kume (1985)
❑ Understanding Statistical Process Control by Wheeler and Chambers (1992)
TQL coordinators and quality advisors can assist teams in documenting process improvement activities and capturing this information with PIN forms. Since the DON TQL courses provide more in-depth information about process improvement activities, we strongly recommend that the TQL coordinator/quality advisor attend the DON TQL courses listed above.

6
Communicating with PINForms
Completed PIN forms can be used to communicate process improvement activities by:
❑ Creating a Process Improvement Notebook
❑ Storyboarding Process Improvement Activities
The Process Improvement Notebook
Selected PIN forms can be used to create a notebook that tells the story of process improvement. This notebook is similar in concept to the displaying of information in the QC Story or the QC Journal (Kume, 1985; Schultz, 1989, Tomasek, 1992). Teams place selected completed forms in the notebook as they move through phases of process improvement.
The notebook can be used to educate new team members as to the activities of the team: where they have been, where they are, and where they are going relative to the process improvement cycle. A new Commanding Officer can be given completed notebooks as examples of process improvement efforts that have occurred at the organization. The notebook can also be shared with customers to explain the efforts the organization is making to better meet their requirements. The notebook also serves as permanent documentation concerning process improvement efforts at the organization.
The choice of what PIN forms to place in the notebook will depend on the specific process improvement efforts. Although the team may want to document their activities using all the PIN forms, including all forms in the notebook may make it too long. The team should use their judgement on how to best summarize their activities using PIN forms. Forms not placed in the notebook can be maintained in a file

7
folder and referred to as needed. They may be particularly useful when specific questions are asked or detailed information about the process is requested.
Storyboarding Process Improvement Activities
PIN forms may also be used to storyboard the team’s process improvement activities in a way that is accessible to all interested parties. Storyboarding communicates process improvement activities through pictures, graphs, and simple text. Storyboards are usually displayed in places where people can easily view them, such as on a wall in a central hallway of the organization. Storyboards are particularly useful in communicating process improvement-related information and events as they occur.
The following figure shows how particular PIN forms could be displayed as a storyboard. This is just an example - the team needs to select those forms that make the most sense for their particular situation.
Acquisition Process ImprovementDate Chartered
QualityTeam Charter
Product/ServiceAssess-ment Form
QualityCharac-teristicsWorksheet
FlowChart
ProcessMeasures
SpecialCause Improve-ment
AttributeControlChart Common
Cause Action Plan
Change Imple-mentationPlan
VariablesControlChart

8
PIN forms can also be displayed with photographs, large size text, diagrams, and customer comments to present an informative display. See the Team Skills and Concepts course (Department of the Navy, 1992a) and the Methods for Managing Quality course (Department of the Navy, 1994b) for more information on storyboarding.

9
Forming Quality Teams
The success of the organization’s TQL effort hinges on the effectiveness of the teams it charters. Obtaining a clear charter is key to the team's success—without it the team is likely to flounder and be uncertain of their purpose, level of effort, and timeline.
In DON organizations, TQL activities typically start with the formation of an Executive Steering Committee (ESC), the team that guides the quality transformation. The ESC identifies the organization’s customers, products and services provided to these customers, and how well those products and services are meeting customer needs. Quality Management Boards (QMBs) are cross-functional in nature and are often made up of middle managers who oversee or are involved in the process being studied. Process Action Teams (PATs) are chartered to assist with the definition of measures, and the actual data collection and analyses.
The challenges for quality improvement teams are many, starting at their inception. For instance, quality improvement teams are often formed, yet they lack a clear understanding of their charter and purpose. This can result in another common experience, namely, that quality teams engage in important process improvement activities but do not document their activities in a way that can be effectively communicated to others. Lastly, teams often improve processes, yet these changes are not institutionalized, resulting in the process reverting back to old operating procedures over time, particularly when there is turnover of employees who held the knowledge of the process improvement efforts.
Experience working with TQL teams in organizations has shown the negative consequences when process improvement activities are not clearly defined, documented, and communicated (Kinlaw, 1992; Miller, 1991). The following PIN forms are provided to assist teams to be as effective as possible, starting with a well-formulated team charter. Additional PIN forms, including a Team Development Plan and Team Dynamics Survey, may be found in the Appendix.
10
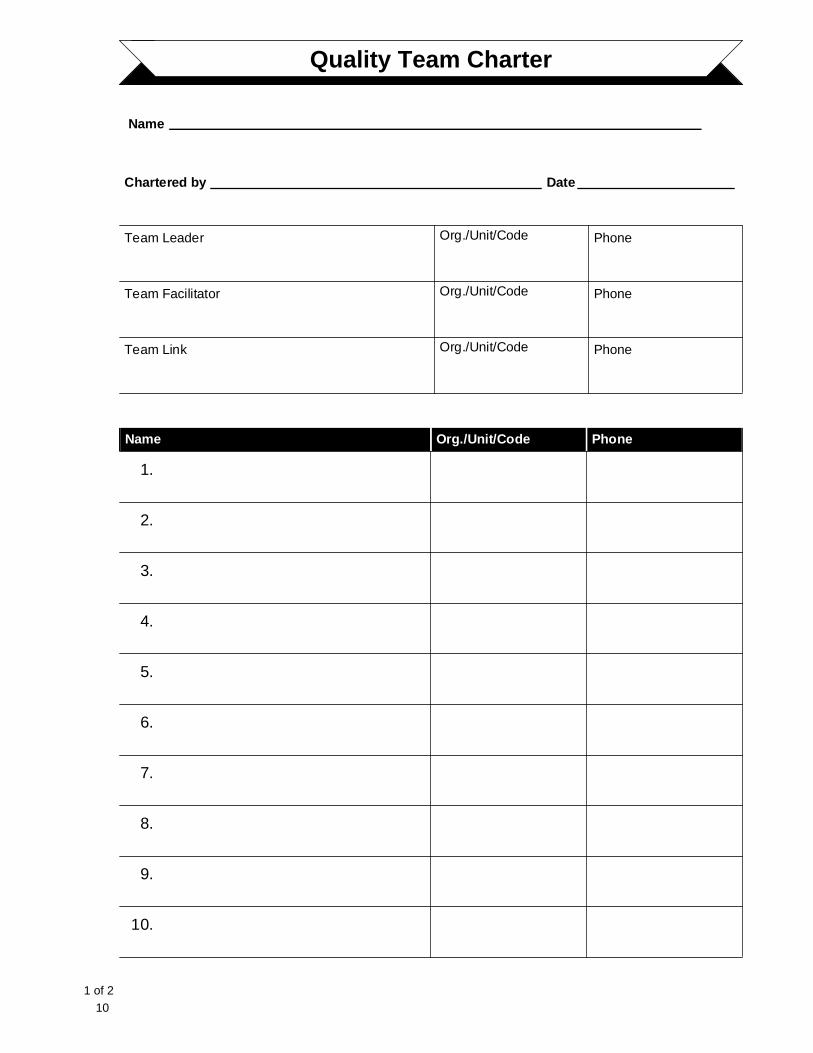
Quality Team Charter
Name
Chartered by _____________________________________________ Date _____________________
Team Leader Org./Unit/Code Phone
Team Facilitator Org./Unit/Code Phone
Team Link Org./Unit/Code Phone
Name Org./Unit/Code Phone
1.
2.
3.
4.
5.
6.
7.
8.
9.
10.
1 of 2
11
✍ Quality Team Charter
Instructions
1. Make copies of the form so that it may be used again.
2. Indicate the “Name” that will be used when referring to the team.
3. Indicate who chartered the team and when it was started (“Date”).
4. Identify who will serve as the leader of the team.
5. Identify who will serve as the facilitator of the team. If there is no facilitator, write N/A in the space on the form.
6. Identify who will serve as the “Team Link” to other quality improvement teams.
7. List the members to serve on the team.

12
Quality Team Charter (Continued)
Process Selected for Improvement
Process Improvement Goal(s)
Resources
Reporting Requirements
Suggested Timeline
2 of 2

13
✍ Quality Team Charter (Continued)
Instructions
8. Provide a short description of the process selected for improvement on page 2 of the charter. Also describe the products and/or services related to the selected process, and the customers who use these products and/or services.
9. Describe the goals of the team’s process improvement efforts. Indicate how these goals relate to requirements specified by the customer.
10. Indicate the resources (e.g., team members’ time, funding for training and materials, assistance of other members in the organization) available to the team. Clarify how much time the sponsoring team expects members to spend in meetings and on process improvement.
11.Clarify the team’s reporting requirements: to whom do they report, how frequently, and in what format. Also clarify when they need to report to their sponsoring team before making decisions and initiating changes.
12.Provide a suggested timeline for reporting to the sponsoring team, and a general idea of when the sponsoring team expects results.
13.The charter form can be updated as more is learned about the scope of the improvement effort. See the DON Implementing Total Quality Leadership course (DON, 1993b) for more information on team charters.

14
Team Composition
Team Member’s Name Org./Unit/Code Phone/FAX/E-mail Comments
Date:Process: / /

15
✍ Team Composition
The Team Composition form is used to describe the membership of quality improvement teams. The comments section can be used to record changes in team membership. The team leader is usually the one who keeps the form up-to-date.
Instructions
1. The team leader and/or the quality advisor can circulate the form at the first meeting.
2. Team members write their names, organization/unit/code, and phone numbers on the form.
3. The team leader can make copies of the completed form for all team members to use as a phone, FAX, or E-mail listing.
4. If members leave the group, record the date and reason they are no longer part of the group in the comments section.
5. If new members are added to the group, record the date and the name of the team member they are replacing in the comments section.

16
Team Leader: _____________________________________________ Start time: _____________
Advisor: __________________________________________________ End time: _______________
Members Present
Yes/No
Present
Yes/No
1. 7.
2. 8.
3. 9.
4. 10.
5. 11.
6. 12.
Agenda Time topic will be given
Time topicwill be given
1. 5.
2. 6.
3. 7.
4. 8.
Reports Made
Topic Reported by
Team Meeting and Action Plan
1 of 2
Date: / /Process:

17
✍ Team Meeting and Action Plan
The Team Meeting and Action Plan form helps the team leader to record information about the meeting, such as who was present, reports that were given, and decisions or recommendations that were made. This information is important not only for documentation purposes, but it also can be used to update team members who were not present at the meeting.
The Team Meeting and Action Plan form also encourages teams to think in terms of action items, to assign responsibility to specific people, and to decide when they will report back to the group. Listing action items on the form tracks them over time, since they are conveniently listed on each team meeting form. It also shows whether one or two team members are doing all the work—something that is to be avoided. Action items documented in this way also make team members aware of the team's progress and of their role in continuing this progress.
Instructions
1. Make copies of this form and use them at the first and all subsequent meetings.
2. Indicate the team leader, advisor (if there is one), and when the meeting actually starts.
3. Record attendance of team members.
4. Indicate the agenda items and an estimated amount of time that will be spent on each item.
5. Record reports made, and who made each report.

18
Team Meeting and Action Plan (Continued)
Decisions and Recommendations
Action Items When By Whom
Next Meeting (Date and Location)
Agenda Items for Next Meeting
2 of 2
Date:Process: / /
19
✍ Team Meeting and Action Plan (Continued)
Instructions
6. Document all decisions and recommendations.
7. Indicate action items, a projected completion date (in the “When” column), and who is responsible for the action item (in the “By Whom” column).
8. Indicate the projected date and location of the next meeting.
9. Record agenda items for the next meeting at the bottom of this form. The team leader can distribute copies of the completed form to team members shortly after the meeting to summarize what happened. It is particularly helpful for those who were absent from the meeting to review in order to get up to speed with the team.
10.The team leader can prepare a new meeting form prior to the next meeting, consulting the last meeting form for agenda and action items.
11.The team leader fills in the information as it applies prior to the meeting, and then distributes copies to team members a few days before the meeting as a reminder.

20
TQL PRINCIPLES (e.g., DON approach, systems theory, Deming’s 14 points) 1 2 3 4 5
PROCESS IMPROVEMENT APPROACH (e.g., PDCA cycle) 1 2 3 4 5
MANAGEMENT AND PLANNING TOOLS (e.g., use of the affinity diagram, tree diagram, prioritization matrix) 1 2 3 4 5
BASIC GRAPHIC TOOLS (e.g., use of flowcharts, control charts, histograms) 1 2 3 4 5
STATISTICS (e.g., calculation and analysis of means, standard deviations, ranges) 1 2 3 4 5
GROUP FACILITATION (e.g., problem solving, conflict resolution, keeping team on track) 1 2 3 4 5
GROUP LEADERSHIP (e.g., decision making, goal setting, motivating team members, meeting time lines) 1 2 3 4 5
LISTENING SKILLS (e.g., paraphrasing, asking questions, demonstrating sincere interest, empathizing, using nonverbal cues) 1 2 3 4 5
WRITING SKILLS (e.g., preparing presentations/briefings, authoring written documents) 1 2 3 4 5
PRESENTATION SKILLS (e.g., delivering presentations/briefings to groups) 1 2 3 4 5
OTHER ___________________________________ 1 2 3 4 5
OTHER ___________________________________ 1 2 3 4 5
OTHER ___________________________________ 1 2 3 4 5
Subjects
Please rate your knowledge/skill in the following TQL subjects. Honest ratings will help your team functionmore effectively. If you have relevant skills not listed here, write them in the “OTHER” category.
Team Member Self Assessment Survey
Date:Process: / /
NoneA Little
SomeA Lot
Extensive

21
✍ Team Member Self Assessment Survey
The Team Member Self Assessment Survey is designed to summarize information about the knowledge and skills of team members. The team leader and/or quality advisor can hand these forms out at the first meeting and explain that the purpose is to assess the team’s strengths and weaknesses in terms of TQL-related knowledge and skills. Emphasis needs to be given to the fact that this assessment is effective only if people honestly report the level of their knowledge and skills. The information will be used to plan the team’s training needs and will not be used to single out certain team members who have less TQL training or experience.
Instructions
1. Copies of the Team Member Self Assessment Survey form are made for each team member.
2. The team leader and/or quality advisor explains how to complete the form and that accurate information is needed for the assessment process to be useful. It is also explained that each team member’s ratings will be combined with the others, so no one has to feel singled out.
3. Each team member assesses whether or not he/she has the particular knowledge or skill listed.
4. The forms are turned in and compiled using the next form, the Team Self Assessment Tally Sheet.

22
TQL PRINCIPLES (e.g., DON approach, systems theory, Deming’s 14 Points) .................................
PROCESS IMPROVEMENT APPROACH (e.g., PDCA cycle) ................................................
MANAGEMENT AND PLANNING TOOLS (e.g., use of the affinity diagram, tree diagram, prioritization matrix) ................................................
BASIC GRAPHIC TOOLS (e.g., use of flowcharts, control charts, histograms) .................
STATISTICS (e.g., calculation and analysis of means, standard deviations, ranges) .....................
GROUP FACILITATION (e.g., problem solving, conflict resolution, keeping team on track) ..........
GROUP LEADERSHIP (e.g., decision making, goal setting, motivating team members, meeting time lines) .............................................................
LISTENING SKILLS (e.g., paraphrasing, asking questions, demonstrating sincere interest, empathizing, using nonverbal cues) ......................
WRITING SKILLS (e.g., preparing presentations/briefings, authoring written documents) ...............
PRESENTATION SKILLS (e.g., delivering presentations/briefings to groups) .........................
OTHER ________________________________
OTHER ________________________________
OTHER ________________________________
Subjects
Use this form to tally the results of each team member’s Self Assessment Survey.
Tally Sheet for the Team Member Self Assessment
Date:Process: / /
5
NoneA Little
Some
A Lot
Extensive
3 41 2

23
✍ Tally Sheet for the Team Member Self Assessment
1. The results from the Team Self Assessment Survey are tallied onto the Team Self Assessment Tally Sheet.
2. The ratings of each member are recorded onto this one form by putting a tally under the appropriate column for each rating circled by the team member. Thus if the first member rated his/her knowledge level of TQL PRINCIPLES as a “3” (Some), a tally mark is made under the “3” column on the Team Self Assessment Tally Sheet. If this same member rated his/her knowledge level of the PROCESS IMPROVEMENT APPROACH as “4” (A lot), a tally mark is made for the PROCESS IMPROVEMENT APPROACH statement under the “4” column on the Tally Sheet.
3. Similarly, the ratings for the first team member are all transferred to the Tally Sheet. Then the second team member’s ratings are transferred to the Tally Sheet in the same fashion.
4. After the information from all the team members is transferred to the tally sheet, the tally marks for each category are totaled (write and circle the total in each box).
5. The team leader and/or quality advisor can then make a copy of the results for each team member.
6. The team can then discuss the results and identify training needs. Plans concerning training can be recorded on the Team Development Plan located in the Appendix.

24

25
Identifying and SegmentingCustomers
The ultimate goal of any process improvement effort is to better satisfy the needs of the customer. Thus, before formulating any process improvement goals, the organization must first assess who are their customers — who are they in business to support? Thinking about customers can raise fundamental questions about the purpose and mission of the organization. The following questions from Deming (1986) are useful to stimulate thinking about customers:
❑ Who makes the decisions about whether to buy your product or service?
❑ How do you distinguish between quality as your customer perceives it and quality as your managers and work force perceive it?
❑ How does the quality of your product, as your customer sees it, agree with the quality that you intended to give him/her?
❑ Do your customers think that your product lives up to their expectations?
❑ What do you know about the problems of your customers in the use of your products? What tests do you make of your products in service?
❑ Do you depend on complaints from customers to learn what is wrong with your product or service?
❑ Are your customers satisfied with the service that you provide? If yes, what is satisfactory about it? How do you know?
❑ Will your customers of today be your customers a year hence? Two years hence?

26
Customer Products/Services Used
Who Are Our Customers?

27
✍ Who Are Our Customers?
Information concerning customers can be gathered from a number of sources. After reviewing the questions from Deming (1986), the team can use the Who Are Our Customers? form to summarize thoughts on customers.
Instructions
1. Distribute the list of customer questions on the last page and this form to team members. Ask them to jot down notes in regards to the questions, and then fill out the form.
2. At the next team meeting ask every member to share their notes to the questions. Post all members’ Who Are Our Customers? forms on the wall for all to view.
3. After discussing each team member’s form, summarize the group’s information on a new copy of the Who Are Our Customers? form.

28
Customer Affinity Diagram
Date:Process: / /
Segment
Segment
Customers
Segment
Customers
Segment
Customers
Customers

29
✍ Customer Affinity Diagram
Since most organizations have many customers, it is typical for organizations to separate customers into smaller subgroups, often referred to as segments, using a variety of methods. Most organizations segment customers based on what products and/or services they use. Customer segmentation assists in defining the requirements of different groups. It also provides a basis for understanding similarities among customers. It also clarifies which customers may be impacted by improvement efforts focused on particular products or services.
Instructions
1. Take the information recorded on the Who Are Our Customers? form, and write the name of each customer on a 3x5 index card or post-it. If you have information about the product or service used by that customer, note that also on the card/post-it.
2. Place the cards/post-its so they can be seen by all team members. Review each card with the team, and indicate products or services used if this information is not already noted.
3. Using the affinity diagram process (Brassard, 1989; Brassard & Ritter, 1994), ask team members to sort the customers into four groups based on similarities they have. These segments can relate to the products or services they use, their organizational location, and their relationships with the organization. The affinity diagram process usually requires no talking among group members while engaged in the task. It also gives each member the opportunity to change the placement of any items in any group.
4. Allow members to continue the sorting process without any discussion until all members can accept the current sorting. Then discuss the groupings and come up with a segment name for each grouping.
5. Record both the name of the segment and the list of customers in that segment on the Customer Affinity Diagram form. Use multiple copies of the form as needed.

30
✍ Customer Affinity Diagram (Continued)
6. Note that customers can be segmented in a number of different ways. Use the segmentation that makes the most sense in regards to the emphasis of the particular improvement effort. The team may want to use the affinity process a number of times to generate various segmentations of customers, and then discuss which segmentation makes the most sense for the task at hand.

31
Identifying CustomerRequirements
In addition to defining customers, the team must also address what those customers want, and how to measure whether they are getting what they want. Customers’ needs and expectations are usually tapped through their reactions to the use of current products or services. Customers are often concerned with requirements related to quality, cost, and timeliness. It is recommended that members meet with customers face-to-face several times during this phase of process improvement. Several forms are provided to assist with identifying and defining customer requirements.

32
Customer Background Information
What products and/or services has this customer acquired or used from your organization in the past?
How often does this customer acquire products/services from you?
How long has this customer been using your products/services?
How much of your budget is related to products/services for this customer?
Does this customer have any pattern in the acquisition or use of your products/services?
Does any complaint data exist to help clarify customer requirements?
Do other customer satisfaction data exist?
Does this customer refer other organizations to you? Who?
Date:Process: / /

33
✍ Customer Background Information
Use this form to gather information about customers before meeting with them. This type of information is sometimes referred to as archival or historical data. Most organizations maintain information regarding the types of products and/or services delivered to customers, when, in what quantity, etc. Financial databases may provide indicators of the amount of business provided to particular customers. Service-related departments often have information regarding complaints made by customers, along with requests for particular capabilities.
Instructions
1. Gather the information discussed on the form from databases, records, and information from employees.
2. Summarize the information gathered on the Customer Background Information form.
3. Take a completed copy of this form with you when going to meet with customers to obtain clarification of their needs and how well those needs are currently being satisfied. The meeting with the customer may start by you sharing the information on the Customer Background Information form.
4. Also take a copy of the next form, the Customer Interview form, when going to meet with customers to discuss their needs.

34
1
Customer Interview Form
Interviewer(s) Date(s)
What products and services do we currently provide?
What are the most important features or characteristics of the products/services we provide you?
1 of 3
Date:Process: / /
Phone:Customer:
Organization:Customer’s
Department/Division:
Interviewer: Length of interview:

35
✍ Customer Interview Form
Use this form to summarize information collected during interviews with customers. Use a separate form for each customer. By making copies of the form, you can use it both during the interview, and as a summary of the most critical information collected from customers.
Instructions
1. In preparation for the customer interview, review any information you were able to collect for the Customer Background Information form.
2. The Customer Interview Form provides general areas to cover in a customer interview. These questions are general in nature so as to apply to the majority of customers. They are stated in a way that allows customers to address those things most important to them. Space is provided for questions the interviewer wants to add, or for information that comes up during the interview.
3. Fill in the information at the top of the form, including the customer’s name, phone number, organization, department/division. Also note who conducted the interview, and how long the interview took.
4. When recording customer information on the form, write down the customer’s exact words so you don’t add interpretation or bias at this point of data collection.
5. Certain techniques also help customers communicate what they want, such as reviewing lists of features/options, inquiring about past use of a product and/or service, or asking about products/services provided by competitors. Experience interviewing customers will give you skills to elicit detailed information about what customers desire.

36
Customer Interview Form (Continued)
2 of 3
What aspects of our products/services are you satisfied with?
What needs improving?

37
Customer Interview Form (Continued)
Additional Comments and Observations
3 of 3

38
Concerns/SuggestionsI* S✟
Product/Service Assessment Form
Date:Process: / /
Characteristic Ratings of Importance and Satisfaction
Low High1 2 3 4 5
Low High1 2 3 4 5
Customer: Product/Service:
Importance
Satisfaction
Concerns/SuggestionsI* S✟Low High1 2 3 4 5
Low High1 2 3 4 5
Importance
Satisfaction
Concerns/SuggestionsI* S✟Low High1 2 3 4 5
Low High1 2 3 4 5
Importance
Satisfaction
Concerns/SuggestionsI* S✟Low High1 2 3 4 5
Low High1 2 3 4 5
Importance
Satisfaction

39
✍ Product/Service Assessment Form
This form assists in summarizing the wealth of information gathered during customer interviews along with documenting customers’ current satisfaction and priorities. Use one form for each customer.
Instructions
1. Use the information summarized on the Customer Interview form to identify product/service characteristics important to your customers.
2. Identify the product/service on the top of the form. Use separate forms for each product/service. List the characteristics for the identified product/service on this form, using multiple copies of the form as needed to record additional characteristics.
3. Take the completed forms and additional blank copies of the form with you to meet with the customer again to discuss if the information you have listed is correct and complete. If a characteristic has been left off, add it to the list.
4. Ask the customer to then rate both the importance of and satisfaction with each characteristic using the 5-point scale provided. Record these ratings on the form.
5. If need be, jot notes under the name of the “characteristic” column to clarify why the customer is or is not satisfied, ideas for improvements, etc.
6. Review the ratings once the customer has gone through the entire list of product/service characteristics. As a general rule of thumb, characteristics rated as high in importance (a “4” or “5”) but low in satisfaction (a “1” or “2”) suggest those characteristics to focus on first.

40
Quality Characteristics Worksheet
Quality Characteristics Measure(s) of Quality Characteristics
Date:Process: / /
Customer: Product/Service:

41
✍ Quality Characteristics Worksheet
Process improvement efforts focus on connecting customer requirements to product/service characteristics to quality characteristics that can be measured. This form records the quality characteristics associated with the product/service characteristics that will be the focus of the improvement effort. Since most customers have difficulty answering general questions about requirements and characteristics, the information recorded on PIN forms will serve as something to which customers can react.
Instructions
1. List the customer, the product/service, and the quality characteristics identified as those you will target based on customer comments and information on the Product/Service Assessment Form.
2. Describe measure(s) that could be indicators of those quality characteristics. Include in that description any instruments or tools used to measure, and the procedures of measurement.
3. Meet with the customer to review your list of quality characteristics and measures for each.
4. Make any revisions necessary based on customer feedback.
5. Update the information on the Quality Characteristics Worksheet. Also discuss with the customer whether current measures seem to be good indicators for gauging their requirements.
6. If no measures exist, jot down thoughts on what measures could be developed. Also record any other information about measures the customer may provide.

42
Process Identified for Change
Process Improvement Goal
Products/Services Effected
Customer Impact
Selected Processes
Date:Process: / /

43
✍ Selected Processes
Customer requirements are the basis for selecting processes upon which to focus improvement efforts. Select processes that are thought to impact the product/service characteristics important to the customer. Quality characteristics help to identify what about a process needs improving, along with measuring the impact of improvement efforts. Selecting these processes is part of specifying what is the goal of process improvement. This information can be summarized on the Selected Processes form.
Instructions
1. Briefly describe the process chosen for improvement. Use one form for each process. Note the reasons for selecting this process.
2. Describe the process improvement goal or desired change in the products or services associated with the process improvement effort.
3. Describe the products/services that will be affected by process improvement activities.
4. Identify the desired customer impact of the process improvement effort.

44

45
Describing the Process andPotential Causes of Quality
PIN forms in this section summarize information resulting from team brainstorming and idea-generating efforts related to describing the process under consideration. A process is a set of causes and conditions that repeatedly come together to transform inputs into output (Department of the Navy, 1994c). A process can be thought of as a sequence of steps or a series of tasks or operations that results in a product or service.
A number of tools and techniques are helpful in describing processes (Brassard, 1989; Brassard & Ritter, 1994). The PIN forms in this section record the team’s ideas about how the process works, and key components of the process. The Flow Chart form and the Cause and Effect diagram can be used by the team to summarize the process they are working to improve. These forms can be used in many places in the PDCA cycle. They are to be copied and used as many times as needed throughout the process improvement effort.

46
Brainstorming Form
Date:Process: / /
Topic of Brainstorming Session:
Idea Votes Idea Votes

47
✍ Brainstorming Form
This form is designed to record the ideas generated after a brainstorming session. Make as many copies of this form as needed to record all the ideas generated, or a summary of the ideas generated. The information recorded on the Brainstorming Form can then be used with the next two forms, Multivoting Worksheet and the Affinity Diagram of Potential Causes of Quality. It is a good idea to record all the ideas raised during your brainstorming sessions, for they can be revisited as part of your continuous improvement efforts.
Instructions
1. Write the topic of the brainstorming session on a board so that all team members can see.
2. Ask the team members to call out any ideas they have on potential causes of quality as it relates to the topic.
3. Record each idea on the Brainstorming Form. If a transparency of the brainstorming form is made and an overhead projector is used, then all team members can see the list of ideas as it is generated. If a chalk board, white board, or flip chart is available, ideas can be listed here and copied onto the Brainstorming Form after the session is completed.
4. Remind team members that there are to be no comments, laughs, questions, or other discussion of ideas until the brainstorming process is through.
5. Photocopies of this form can be used for additional ideas.
6. The results from a brainstorming session may be used with prioritization and categorization tools to clarify the process and potential key relationships.
7. The small line following each idea is provided so information regarding the priority of ideas can be easily recorded on the Brainstorming Form.

48
Multivoting Worksheet
Condensed List of Ideas No. of Top 3 Votes No. of Top 3 Votes
Potential Causes of Quality
Date:Process: / /
Topic:No. of Top 10 Votes

49
✍ Multivoting Worksheet
Multivoting is a technique designed to reduce the total number of ideas generated in brainstorming to a more manageable number.
Instructions
1. Use the Brainstorming Form to develop the list of ideas regarding causes of quality influencing the process improvement goal (or the topic under consideration). Number the original ideas.
2. Make copies of the completed brainstorming form for each team member.
3. Ask each team member to select the ten ideas they believe are most influential to the topic under consideration and to put a star by these ten.
4. Read off each idea and ask team members to raise a hand if this was one of their top ten. Record that number on the small line to the right of the idea on the Brainstorming Form.
5. Go down the list, count and record how many people picked each idea as one of their top ten.
6. Look at the number of votes for each item. The ten items with the largest number of votes are recorded on the Multivoting Worksheet, under the heading “Condensed List of Ideas.” Also record the number of votes for each idea under the “No. of Top Ten Votes” column.
7. Repeat the voting process on the “Condensed List of Ideas,” with group members voting on the top three potential causes of quality.
8. Read off each idea on the “Condensed List of Ideas” and ask team members to indicate if this was one of their top three. Record that count under the “No. of Top Three Votes” column.
9. Record the three ideas with the most votes under the “Potential Causes of Quality” heading in rank order with the idea with the most votes being listed first.
10.Review the results and see if the team agrees that the most important issues are listed under the “Potential Causes of Quality.” Discuss why these are seen to be the most influential causes of quality, and

50
Affinity Diagram of Potential Causes of Quality
Date:Process: / /
Category Name:
Category Name:
Category Name:
Category Name:
51
✍ Affinity Diagram of Potential Causes of Quality
The Potential Causes of Quality form is designed to record the results of an affinity process in such a way that they can then be used to construct a cause and effect diagram.
Instructions
1. Transfer all of the individual ideas resulting from a brainstorming or similar idea generating session onto 3x5 index cards or post-its.
2. Lay out the cards/post-its so they can be seen by all group members.
3. Ask the group members to silently sort the cards/post-its into groups based on their relationships to one another and their impact on process quality.
4. Allow members to move cards/post-its until everyone can live with the sorting.
5. Discuss each category, and, as a team, give the category a name.
6. Record the category name on the Potential Causes of Quality.
7. Under the name write all the comments associated with the category. You may want to order these in terms of their potential influence to the category. Those with the largest effect are listed prior to the others.
8. If you have more than 4 categories, use an additional copy of the form.
9. This information can then be used to construct a flow chart or cause and effect diagram focusing on what are believed to be the most probable causes of quality.
52
Flow Chart
StepSymbol
(Draw symbol)Description of
Activity
Directionof Flow
Connector (to another diagram or page)
Start/Stop Document
Date:Process: / /
Flow Chart Symbols
Decision Point
Activity

53
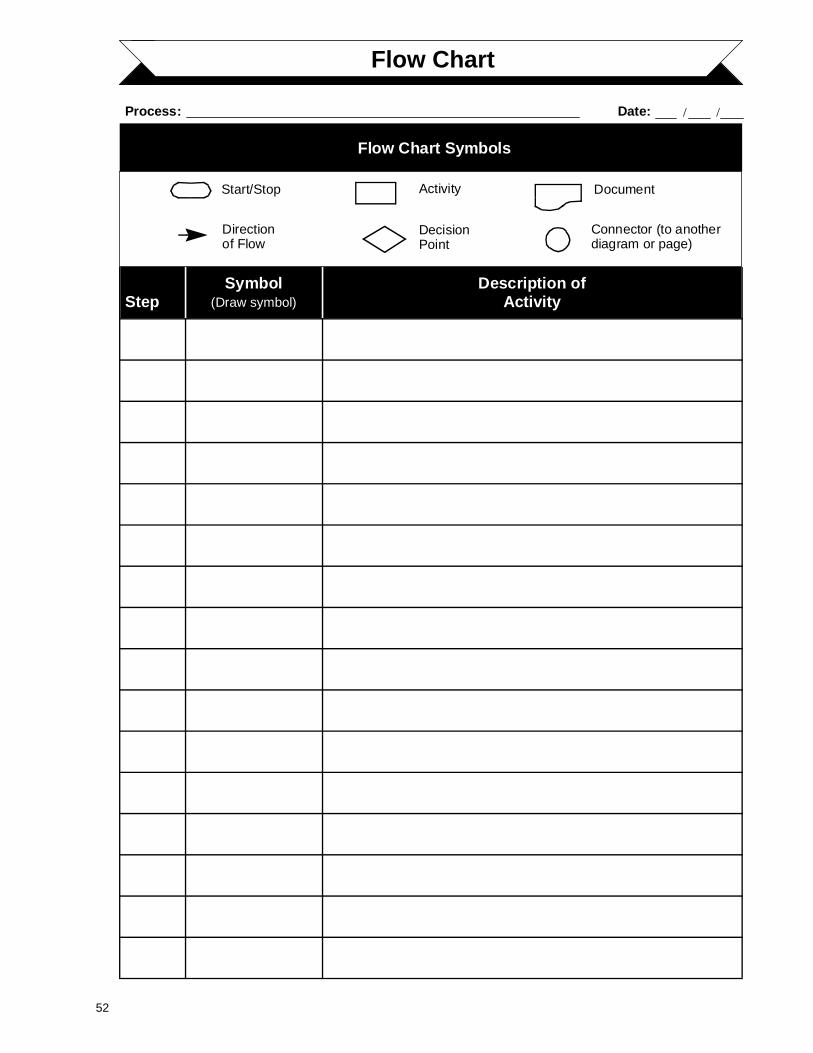
✍ Flow Chart
Flow charts depict the sequence of steps and decisions in a process, and can display the steps of processes at a number of different levels of specificity. Flow charts are useful for identifying boundaries of processes and places where measurements are important. They are also useful as communication devices and training instruments. They also document how the process operated before improvement efforts were initiated.
Instructions
1. Label the process the flow chart represents.
2. Use the Step box to number each process step in its appropriate order. These numbers are useful because steps are often forgotten. You can add a step 1a or 1b later in the form, and the numbering shows that these steps go between step 1 and 2 when you draw the completed flow chart.
3. Map out each step in the process, beginning with inputs from suppliers through to outputs to customers. It is important to map out how the process actually works, not how it’s supposed to work. This may require some information from those actually involved in the process.
4. For each step, draw the symbol that applies in the “Symbol” column (see the flow chart symbols for examples).
5. For each step, write a description or explanation in the “Description of Activity” box.
6. Use the information in this form to draw the flow chart on a plain piece of paper.

54
Cause and Effect Diagram
Date:Process: / /

55
✍ Cause and Effect Diagram
The cause and effect diagram is a common tool used by process improvement teams to describe potential causes of quality impacting on a particular effect. Cause and effect diagrams can be used at varying levels of specificity, and can be applied at a number of different times in process improvement efforts. It is very effective in summarizing and describing a process and factors impacting on the output of that process. Use this tool as it fits with your particular process improvement efforts. It is possible that you will have a number of cause and effect diagrams depicting various aspects of the team’s process improvement efforts.
Instructions
1. The information documented on PIN forms can be used to construct a cause and effect diagram. Review the Team Charter, the Brainstorming Form, Affinity Diagram of Potential Causes of Quality, and the Flow Chart for information to display in terms of a cause and effect diagram.
2. The Cause and Effect Diagram form provides four categories of potential causes of quality. The common categories of personnel, machine, methods, and materials work with the form. The team can also substitute other category names if desired. Constructing your own cause and effect diagram on a blank sheet of paper may be most appropriate, particularly if there are more than four categories of potential causes of quality. A number of excellent sources are available to provide you with more information on constructing Cause and Effect diagrams (Brassard, 1989; Brassard & Ritter, 1994; Ishikawa, 1982).
3. Indicate on the box at the far right of the form when it is turned horizontally what effect, output, or improvement goal is being portrayed.
4. Label the remaining boxes to show the categories of potential causes of quality.

56
✍ Cause and Effect Diagram (Continued)
5. On each of the four diagonal lines, draw smaller horizontal lines to represent subcategories, and indicate on these lines information that is thought to be related to the cause. Draw as many lines as are needed, making sure that the information is not too crowded and is legible.
6. Use the diagram as a discussion tool to help better understand how to proceed with process improvement efforts. The diagram can also be used to communicate the many potential causes of quality that impact on the effect/output/improvement goal.

57
Establishing Data Collection Procedures
Efforts to improve processes focus on establishing current levels of performance and variation, and assessing changes in performance and variation due to process improvement efforts. Typically three types of measures are useful to process improvement activities:
Outcome measures: Measures of customers’ reactions to the product or service provided. Customer satisfaction is a typical outcome measure. Does the product/service satisfy customer needs?
Output measures: Measures of the actual product or service, often expressed in terms of physical dimensions and/or capabilities.
Process measures: Measures of the actual processes that are used to study variation and the impact of improvement efforts on variation.
In practical use, quality improvement teams typically begin with outcome measures, and tie those outcome measures to output measures. From there, attention is directed to measures of some aspect of the process thought to impact the output and outcome. See the DON TQL course curriculum for more information on the different types of measures (DON, 1994b; Rodriguez, Konoske & Landau, 1994).

58
Process Improvement Goal
Outcome Measures
Output Measures
Outcome and Output Measures
Date:Process: / /

59
✍ Outcome and Output Measures
Process improvement efforts typically begin with information from customers that they are not satisfied or their needs are not being met. It is from here that process improvement efforts are often initiated. Practical experience shows that quality improvement efforts often start with indicators on outcome measures. These outcome measures are then tied back to output measures of a particular product and/or service. From there, output measures are related to actual measures of the process.
This form focuses on outcome and output measures. These two types of measures are important for they relate to different aspects of process improvement. If the goals of the improvement efforts are well-specified in terms of what customers desire, then improvements in the process should lead to improvement on the outcome measures. If output measures of particular products and/or services reflect things important to customers, then stabilization and improvement of the process should lead to improved output measures, and in turn improved outcome measures.
Instructions
1. Describe the process improvement goal. If more than one goal exists, use separate forms for each goal.
2. Describe the outcome measures in terms of name, and the type of data, method of measurement, whether historical data exists on these measures, and the usefulness of that historical data.
3. Describe the output measures that relate to the improvement goal and outcome measures in terms of name, type of data, method of measurement, and whether historical data exists.

60
Process Measures
Process Improvement Goal
Process Variable
Existing Measures
Name Description
Measures to Develop
Name Description
Date:Process: / /

61
✍ Process Measures
Process measures are those measures used to gauge the impact of improvement activities on the process itself. It is very likely that measures will have to be developed to tap into critical aspects or variables in the process. Those working in the process are often best able to generate ideas on meaningful process measures.
Instructions
1. List the process improvement goal.
2. Record the process variable (aspect of the process) under consideration. Use one form for each process variable if you have more than one.
3. Describe any existing measures for this process variable.
4. List ideas for new measures of the process variable. Record the name of the measure, and a short description of what it is.

62
Data Collection Plan
What measure is to be collected?
How will the data be collected?
When will the data be collected?
Where will the data be collected?
Who will collect the data?
Date:Process: / /

63
✍ Data Collection Plan
The Data Collection Plan summarizes the important information about this critical task on to one form. Complete the form for each measure for which data will be collected. It is likely that this form will be used many times during process improvement activities.
Instructions
1. Describe the type of data that will be collected for each measure under consideration. Use one sheet for each measure.
2. Specify how the data will be collected. Systematic procedures concerning the construction of a recording form, consistent use of the recording form, and data sampling must be formalized and described here. This includes such details as the number of digits after the decimal point to use when recording all types of data (including measures of time), as well as rounding procedures. Record these procedures in the space provided.
3. Describe the appropriate time interval to be used in data collection in the “When” section. This interval will be determined by the cycle time of the process.
4. Describe where the data will be collected. All measurements must occur in the same location.
5. Record the names of the individuals who will carry out the specific data collection task.

64

65
Collecting and Analyzing Data
There are many tools for collecting and analyzing data. The PIN forms in this section cover the common methods used for data collection and analysis. There are many other methods and formats that can be used to collect and analyze data. Often quality improvement teams find it most useful to construct their own data collection sheets.
Inclusion of particular data analysis forms does not suggest that all teams must use these particular techniques. Teams need to determine which analysis techniques relate to their particular situations and goals, and use the PIN forms accordingly. The control chart forms will most likely be useful to all quality improvement teams, since control charts are the basis upon which data are analyzed for special and common cause variation.

66
Measure
Measurement Date Time Where Who
Date:Process: / /
Data Collection Sheet

67
✍ Data Collection Sheet
This form can be used as a data collection sheet to record the collection of data for any kind of measure. This form can also serve as a model that is modified by the team to best suit the particular data collection effort. Use multiple copies of this form as needed.
Instructions
1. Write the name of the measure and a short description at the top of the form that includes equipment or tools used to measure and any notes on the measurement procedure. If you plan to collect a lot of data, describe the measure and then make copies of the form for data collection.
2. Record the value of the measure in the column labeled “Measurement.” Conventions concerning the desired decimal place to record or the rounding of the value should already be clear and specified on the Data Collection Plan form.
3. Record the date of each measure taken, in the “Date” column.
4. Record the exact time each measure was taken, in the “Time” column. The precision of this aspect of the data collection will vary with the nature of the measure and should be decided prior to data collection.
5. Describe the location where each data point was taken in the “Where” column.
6. Record the name of the person who collected each data point in the column labeled “Who.”
7. Use this data as input to any of the data analysis forms in this section.

68
Check Sheet
Date:Process: / /M
eas
ure:
Inte
rval
/Cat
egor
yT
otal
Dat
e
Tot
al

69
✍ Check Sheet
The check sheet is a basic form that can be used in any data collection effort. Teams often want to construct their own check sheets tailored to their situations. A simple check sheet form is provided as an example.
Instructions
1. Label the measure for which data will be collected.
2. Determine the type of data you are going to be recording: continuous (e.g., weights, measurements) or discrete (e.g., categories of product types, types of customer complaints).
3. If measuring continuous data, indicate the measurement intervals in the “Interval/Category” column.
4. If measuring discrete data, list the categories in the “Interval/Category” column.
5. For each measurement taken, indicate the date and the interval or category in which it falls by checking the appropriate box on the check sheet.
6. The “Total” space allows you to add all the checks in a row and/or in a column. These totals may be helpful for plotting the information as a pareto chart.
7. The data from the check sheet can be summarized in a number of ways, such as with a pareto chart or histogram. Forms for both of these tools follow.

70
Topic/Measure
Interval/Category Frequency Percentage Rank
Total
Pareto Chart of Causes of Quality
Date:Process: / /
1 of 2

71
✍ Pareto Chart of Causes of Quality
A pareto chart can help identify the relative contribution of factors to process variation. Those factors found to have the most affect on process variation should be addressed first.
Instructions
1. Describe the topic or measure that is being plotted (e.g., reasons for customer complaints).
2. Write the names of the categories under the “Interval/Category” heading. Intervals/categories indicate the types of events that will be counted for the variable of interest (e.g., cracks, scratches).
3. Record the number of occurrences (counts) under the “Frequency” heading. This information can be collected using check sheets, and then summarized on this form.
4. Calculate the percentage for each category by dividing the frequency in each category by the sum of all frequencies. Record the answers in the “Percentage” column.
5. Rank the categories by the total value under the “Frequency” column. Record the “Rank” in the right hand column.

72
Pareto Chart of Causes of Quality (Continued)
Date:Process: / /
2 of 2
Top
ic/M
easu
re:
Mea
sure
men
tS
cale
Inte
rval
/Cat
egor
y

73
✍ Pareto Chart of Causes of Quality (Continued)
6. Use the graph paper to plot your results. Write the names of the categories under the “Interval/Category” heading on the x-axis of the graph paper. List the Interval/Category names in rank order, with the most frequent listed first. Space the heading as is appropriate for the number of different intervals/categories you have. Often it is helpful to draw a slanted line off the side of the graph in the margin and then write the names on the lines.
7. Indicate the measurement scale on the y-axis (vertical axis).
8. Plot the data in order of rank so the data are displayed in decreasing order along the horizontal axis (x-axis).
9. If desired, calculate the cumulative percentage by summing percentages for each interval/category. This also can be plotted on the graph, if desired.

74
Histogram Worksheet
Topic/Measure
Class Number
Class Intervals Mid-Value Frequency Tally
Frequency TotalLower Upper
Date:Process: / /

75
✍ Histogram Worksheet
Histograms can be used to see how much variation exists in a specific process variable.
Instructions
1. Collect and record your data using a check sheet or similar form.
2. Write the topic or name of the measure and a short description in the “Topic/Measure” box.
3. Determine the number of classes into which the data are grouped. The appropriate size of the interval will depend on the data and on the extent to which it is necessary to depict small scale differences between data points.
4. Identify these classes by number under the “Class Number” heading. Record these classes in ascending order, from lowest to highest.
5. Identify the largest and smallest values in the data set for each class. Record this information under the “Class Intervals” heading, the smallest value in the class listed under “Lower,” and the largest value in the class listed under “Upper.” The mid-value for the class is listed in the “Mid-Value” column.
6. For each data point that falls into a class, record a tally under the “Frequency Tally” column.
7. Total the number of data points in each class. Record this total under the column “Frequency Total.”

76
Histogram Worksheet (Continued)
Mea
sure
men
tS
cale
Cla
ss In
terv
als
Top
ic/M
easu
re:
Date:Process: / /

77
✍ Histogram Worksheet (Continued)
Instructions
8. Plot the results on the graph paper provided. Indicate what is being graphed on the “Topic/Measure” line.
9. Use the class interval boundaries to define the horizontal axis scale.
10.Use the frequency total values to determine the height of the bar for each class.
11.Draw bars for each class to show the distribution of the data.

78
Scatter Diagram Worksheet
X Variable (Horizontal Axis) Y Variable (Vertical Axis)
OrderX
VariableY
Variable OrderX
VariableY
Variable
Date:Process: / /

79
✍ Scatter Diagram Worksheet
Scatter diagrams are used to understand the association between two variables. The Scatter Diagram Worksheet records and organizes data for constructing a scatter diagram.
Instructions
1. Define the “X Variable” in the appropriate space on the form. This variable is often thought of as the cause variable, and is typically plotted on the horizontal axis.
2. Define the “Y Variable” in the appropriate space on the form. This variable is often thought of as the effect variable, and is typically plotted on the vertical axis.
3. Number the pairs of x and y variable measurements consecutively. Record each pair of measures for x and y in the appropriate columns. Make sure that the x measures that correspond to the y measures remain paired so that the data are accurate.
4. Plot the x and y data pairs on the graph paper provided. This is done by locating on the horizontal axis the x value, then locating on the vertical axis the y value, and then drawing a point where these two points intersect on the graph.
5. Study the shape that is formed by the series of data points you just plotted. In general, conclusions can be made about the association between two variables (referred to as x and y) based on the shape of the scatter diagram. Scatter diagrams that display associations between two variables tend to look like elliptical spheres to straight lines.
6. Scatter diagrams where the plotted points appear in a circular fashion show little or no correlation between x and y.

80
Scatter Diagram Worksheet (Continued)
Date:Process: / /
x V
aria
ble:
y V
aria
ble:

81
✍ Scatter Diagram Worksheet (Continued)
7. Scatter diagrams where the points form a pattern of increasing values for BOTH variables shows a positive correlation: as values of x increase, so do values of y. The tighter the points are clustered in a linear fashion, the stronger the positive correlation, or association between the two variables.
8. Scatter diagrams where one variable increases in value while the second variable decreases in value show a negative correlation between x and y. Again, the tighter the points are clustered in a linear fashion, the stronger the association between the two variables.
9. The actual strength of the association between the two measures can be calculated. See Ishikawa (1982) for more information about the scatter diagrams and correlations.

82
Run ChartU
NIT
OF
ME
AS
UR
E
PR
OC
ES
S
ME
AS
UR
EM
EN
T D
ES
CR
IPT
ION
DA
TE
12
34
56
78
910
1112
1314
1516
1718
1920
2122
2324
25
NO
TES
CO
UN
T
TIM
ED
AT
E
COUNTS
12
34
56
78
910
1112
1314
1516
1718
1920
2122
2324
25

83
✍ Run Chart
Run charts are used to reveal patterns in data over time. They can also be used to document when the process returns to a stable state. Run charts can use any number of different measurement scales, such as frequency counts, percentages, and interval measurements. This form helps you to record and plot your data.
Instructions
1. At the top of the form, describe the unit of measure used to record the data (e.g., inches, degrees). Also describe the measure, the process with which it is associated, and the period of time (“Date”) covered by the control chart.
2. At the bottom of the form, record the date, time, and count in the appropriate columns.
3. Compute the center line using either the median or mean. Then plot the center line on the graph.
4. Plot each data point on the graph paper provided. Then connect the dots with a ruler.
5. In interpreting the Run Chart, follow two general rules of thumb. Investigate patterns of nine points above or below the center line, or any upward or downward trends of seven points. For more information, refer to Rodriguez, Konoske, & Landau (1994).
Note: This chart was developed by Rodriguez, Konoske, & Landau (1994).

84
Variables Control Chart (X and R)
12
34
56
78
910
1112
1314
1516
1718
1920
2122
2324
25
MEASURE OF LOCATION MEASURE OF VARIATION
TIM
ED
ATE
12
34
56
78
910
1112
1314
1516
1718
1920
2122
2324
25
VA
RIA
TIO
N
LOC
AT
ION
SU
M
1 2 3 4 5
SUBGROUP,SAMPLE
MEASUREMENT
1 of 2
UN
IT O
F M
EA
SU
RE
PR
OC
ES
S
ME
AS
UR
EM
EN
T D
ES
CR
IPT
ION
DA
TE

85
✍ A Variables Control Chart X and R
The control chart serves as a tool to assess and describe process variation. The Variables Control Chart is used with continuous scale data. For more information about this control chart, see Rodriguez, Konoske, & Landau (1994), or Wheeler & Chambers (1992).
Instructions
1. At the top of the form, describe the unit of measure used to record the data (e.g., inches, degrees). Also describe the measure it is associated with and the period of time (“Date”) covered by the control chart.
2. At the bottom of the form, list the date and time for each measurement, and the value of the measure. For the first measurement of the first subgroup/sample, record the value of the measure in the row labeled “1” under the column labeled “1.” For the first measurement of subsequent subgroups/samples, record these values in the rows labeled 2, 3, 4, 5 under the column labeled “1.”
3. Total the values in this first column (labeled “1”), and record this value in the “SUM” box.
4. Indicate the location for each subgroup/sample by calculating the mean. The mean is calculated by dividing the sum of the values by the number in the subgroup/sample. Write this value in the “LOCATION” box.
5. Indicate the variation for the subgroup/sample by calculating the range. The range is calculated by subtracting the smallest (lowest) value in the subgroup/sample from the largest (highest) value in the subgroup/sample. Write this value in the box labeled “VARIATION.”
6. Continue recording data in a similar fashion on the bottom of the form. The form supplies space for 25 measurement recordings.
Note: This control chart form was developed by Rodriguez, Konoske, & Landau (1994).

86
Variables Control Chart (X and R) (Continued)
Rul
es fo
r D
efin
ing
Spe
cial
Cau
se S
igna
ls
1. A
ny p
oint
out
side
of t
he c
ontr
ol2.
Tw
o ou
t of t
hree
suc
cess
ive
poin
ts
4. E
ight
suc
cess
ive
poin
ts fa
ll on
Rul
e 1
Ru
le 2
UC
L
LCL
Zon
e A
Zon
e B
Zon
e C
Zon
e C
Zon
e B
Zon
e A
Rul
e 3
UC
L
LCL
Zone
A
Zone
B
Zone
C
Zone
C
Zone
B
Zone
A
Rul
e 4
LCL
UC
L
limits
.fa
ll on
the
sam
e si
de o
f the
cen
ter
line
in z
one
A o
r be
yond
.
3. F
our
out o
f fiv
e su
cces
sive
val
ues
fall
on th
e sa
me
side
of t
he c
ente
rlin
e in
zon
e B
or
beyo
nd.
the
sam
e si
de o
f the
cen
ter
line.
n =
___
___
k = _
____
_ D
4 =
___
___
A2 =
___
___
Fo
rmul
as(X
and
R)
Tab
le o
f Con
stan
ts
nA
2D
3D
4
21.
880
—3.
268
31.
023
—2.
574
40.
729
—2.
282
50.
577
—2.
114
60.
483
—2.
004
70.
419
0.07
61.
924
80.
373
0.13
61.
864
90.
337
0.18
41.
816
100.
308
0.22
31.
777
110.
285
0.25
61.
744
120.
266
0.28
31.
717
130.
249
0.30
71.
693
140.
235
0.32
81.
672
DE
SC
RIP
TIO
ND
AT
E/T
IME
2 of 2
Σ X k=
A2R
= _
____
_
=__
___
UC
LX =
X +
A2R
= _
____
_
LC
LX
= X
- A
2R
= _
____
_
X
Σ R k=
R=
____
_
UC
LR
= D
4R
= _
____
_
LCL
R =
D
3R
= _
____
_

87
✍ Variables Control Chart (X and R) (Continued)
7. Indicate the number of measures in the subgroup/sample on page 2 of the control chart form in the right-hand box (n = __________).
8. Indicate the number of samples on page 2 of the control chart form (k = __________).
9. Fill the appropriate values of the constants on page 2 of the control chart form, selecting the values from the Table of Constants that most closely match your subgroup/sample size (n).
10.Calculate the Upper Control Limit (UCLx) and Lower Control Limit (LCLx) for the means using the formulas on page 2.
11.Plot the means and UCLx and LCLx for the means on page 1 of the form labeled “MEASURE OF LOCATION.” The center line can also be plotted (X).
12.Calculate the UCLR and LCLR for the ranges using the formulas on page 2.
13.Plot the ranges and UCLR and LCLR for the ranges on page 1 of the form labeled “MEASURE OF VARIATION.” The center line can also be plotted (R).
14.Review the rules for defining special cause signals on page 2 of the control chart form.
15.Circle in colored ink any special cause signals.
16.Use the space on page 2 of the control chart form labeled “DATE/TIME” and “DESCRIPTION” to record any notes regarding measurements, calculations, the occurrence of special cause signals, and possible reasons for variations in the process.

88
Variables Control Chart (X and s)
12
34
56
78
910
1112
1314
1516
1718
1920
2122
2324
25
MEASURE OF LOCATION MEASURE OF VARIATION
TIM
E
DA
TE
12
34
56
78
910
1112
1314
1516
1718
1920
2122
2324
25
VA
RIA
TIO
N
LOC
AT
ION
SU
M
1 2 3 4 5
SUBGROUP,SAMPLE
MEASUREMENT
1 of 2
UN
IT O
F M
EA
SU
RE
PR
OC
ES
S
ME
AS
UR
EM
EN
T D
ES
CR
IPT
ION
DA
TE

89
✍ Variables Control Chart (X and s)
The X and s control chart is another common chart used by process improvement teams typically for larger sized subgroups/samples (e.g., n > 15). For more information about this control chart, see Rodriguez, Konoske, and Landau (1994), or Wheeler and Chambers (1992).
Instructions
1. At the top of the form, describe the unit of measure used to record the data (e.g., inches, degrees). Also describe the measure with which it is associated and the period of time (“Date”) covered by the control chart.
2. At the bottom of the form, list the date and time for each measurement, and the value of the measure. For the first measurement of the first subgroup/sample, record the value of the measure in the row labeled “1” under the column labeled “1.” For the first measurement of subsequent subgroups/samples, record these values in the rows labeled 2, 3, 4, 5 under the column labeled “1.”
3. Total the values in this first column (labeled “1”), and record this value in the “SUM” box.
4. Indicate the location for each subgroup/sample by calculating the mean. The mean is calculated by dividing the sum of the values by the number in the subgroup/sample. Write this value in the “LOCATION” box.
5. Indicate the variation for the subgroup/sample by calculating the standard deviation. The standard deviation is calculated for each subgroup/sample using the following formula:
6. Continue recording data in a similar fashion on the bottom of the form. The form supplies space for 25 measurement recordings.
Note: This control chart form was developed by Rodriguez, Konoske, & Landau (1994).
Σ(X - X)2
s =n - 1 =
Σ X2 - (ΣX)2
n
n - 1

90
Variables Control Chart (X and s) (Continued)
Rul
es fo
r D
efin
ing
Spe
cial
Cau
se S
igna
ls
1. A
ny p
oint
out
side
of t
he c
ontr
ol2.
Tw
o ou
t of t
hree
suc
cess
ive
poin
ts
4. E
ight
suc
cess
ive
poin
ts fa
ll on
Rul
e 1
Rul
e 2
UC
L
LCL
Zon
e A
Zon
e B
Zon
e C
Zon
e C
Zon
e B
Zon
e A
Rul
e 3
UC
L
LCL
Zone
A
Zone
BZo
ne C
Zone
C
Zone
B
Zone
A
Rul
e 4
LCL
UC
L
limits
.fa
ll on
the
sam
e si
de o
f the
cen
ter
line
in z
one
A o
r be
yond
.
3. F
our
out o
f fiv
e su
cces
sive
val
ues
fall
on th
e sa
me
side
of t
he c
ente
rlin
e in
zon
e B
or
beyo
nd.
the
sam
e si
de o
f the
cen
ter
line.
For
mul
as(X
and
s)
Tab
le o
f Con
stan
ts
DE
SC
RIP
TIO
ND
AT
E/T
IME
2 of 2
nA
3B
3B
4
22.
659
—3.
267
31.
954
—2.
568
41.
628
—2.
266
51.
427
—2.
089
61.
287
0.03
01.
970
71.
182
0.11
81.
882
81.
099
0.18
51.
815
91.
032
0.23
91.
761
100.
975
0.28
41.
716
110.
927
0.32
21.
678
120.
886
0.35
41.
646
130.
850
0.38
21.
619
140.
817
0.40
71.
593
150.
789
0.42
81.
572
n = _
____
_ k
= _
____
_
B3
= _
____
_ B4
= _
____
_ A3
= _
____
_
UC
Ls =
B4s
= __
____
Σ X k=
X=
____
_
UC
Lx =
X+
A3s
= _
____
_
LCL
x =
X–
A3s
= __
____
LCL
s =
B3s
= __
____
A3s
= _
____
_
Σ s k=
s=
____
_

91
✍ Variables Control Chart (X and s) (Continued)
7. Indicate the number of measures in the subgroup/sample on page 2 of the control chart form in the right-hand box (n = __________).
8. Indicate the number of samples on page 2 of the control chart form (k = __________).
9. Fill the appropriate values of the constants on page 2 of the control chart form, selecting the values from the Table of Constants that most closely match your subgroup/sample size (n).
10.Calculate the Upper Control Limit (UCLx) and Lower Control Limit (LCLx) for the means using the formulas on page 2.
11.Plot the means and UCLx and LCLx for the means on the graph paper labeled “MEASURE OF LOCATION.” The center line can also be plotted (X).
12.Calculate the UCLs and LCLs for the standard deviations using the formulas on page 2.
13.Plot the ranges and UCLs and LCLs for the standard deviations on page 1 of the form labeled “MEASURE OF VARIATION.” The center line can also be plotted (s).
14.Review the rules for defining special cause signals on page 2 of the control chart form.
15.Circle in colored ink any special cause signals.
16.Use the space on page 2 of the control chart form labeled “DATE/TIME” and “DESCRIPTION” to record any notes regarding measurements, calculations, the occurrence of special cause signals, and possible reasons for variations in the process.

92
12
34
56
78
910
1112
1314
1516
1718
1920
2122
2324
25
INDIVIDUAL VALUES (X) MOVING RANGE (mR)
23
45
67
89
1011
1213
1415
1617
1819
2021
2223
24
Individual Values and Moving Range (X, mR)
Attribute data
NO
TE
S
TIM
E
DA
TE
1
mRX
1 of 3
UN
IT O
F M
EA
SU
RE
PR
OC
ES
S
ME
AS
UR
EM
EN
T D
ES
CR
IPT
ION
DA
TE
25
Variables data

93
✍ Individual Values and Moving Range
This control chart is used when there is only one measurement value; in other words, a sample size of n = 1. It can also be used to measure variation of counts and percentages when each count/percentage is treated as a single observation. For more information about this control chart, see Rodriguez, Konoske, and Landau (1994), or Wheeler and Chambers (1992).
Instructions
1. At the top of the form, describe the unit of measure used to record the data. Also describe the measure, the process it is associated with, and the period of time (“DATE”) covered by the control chart.
2. At the bottom of the form record the measurements, with just one measurement listed in each column.
3. Use the formulas on page 2 of the form to calculate the necessary information for the control chart.
4. Plot the center line, the control limits, and the data points.
5. Assess whether the control limits are inflated. If so, use the formulas provided on page 3 to recalculate the control limits, using the median range.
6. Plot the information with the revised control limits on a new copy of page 1 of the form.
7. Review the rules for defining special cause signals on page 2 of the control chart form.
8. Circle in colored ink any special cause signals.
9. Use the spaces on page 2 and page 3 of the control chart form labeled “DATE/TIME” and “DESCRIPTION” to record any notes regarding measurements, calculations, the occurrence of special cause signals, and possible reasons for variations in the process.
Note: This control chart form was developed by Rodriguez, Konoske, & Landau (1994).

94
Individual Values and Moving Range (X, mR) (Continued)
Rul
es fo
r D
efin
ing
Spe
cial
Cau
se S
igna
ls
1. A
ny p
oint
out
side
of t
he c
ontr
ol2.
Tw
o ou
t of t
hree
suc
cess
ive
poin
ts
4. E
ight
suc
cess
ive
poin
ts fa
ll on
Rul
e 1
Rul
e 2
UC
L
LCL
Zon
e A
Zon
e B
Zon
e C
Zon
e C
Zon
e B
Zon
e A
Rul
e 3
UC
L
LCL
Zone
A
Zone
B
Zone
C
Zone
C
Zone
B
Zone
A
Ru
le 4
LCL
UC
L
limits
.fa
ll on
the
sam
e si
de o
f the
cen
ter
line
in z
one
A o
r be
yond
.
3. F
our
out o
f fiv
e su
cces
sive
val
ues
fall
on th
e sa
me
side
of t
he c
ente
rlin
e in
zon
e B
or
beyo
nd.
the
sam
e si
de o
f the
cen
ter
line. D
ES
CR
IPT
ION
DA
TE
/TIM
E
2 of 3
Cal
cula
tions
for
mR
cha
rt:
Cen
ter
line:
mR
= Σ
mR
= _
____
_ =
____
__k-
1U
CL m
R =
3.2
68 m
R =
(3.2
68)
(___
__) =
___
___
Cal
cula
tions
for
X c
hart
:
Cen
ter
line:
X =
ΣX
= _
____
_ =
__
____
kU
CL
X =
X +
2.6
60 m
R =
___
__ +
(2.6
60)
= __
____
LCL
X =
X -
2.66
0 m
R =
___
__ –
(2.
660)
= _
____
_
(For
mu
las
are
base
d on
a tw
o-po
int m
ovin
g ra
nge)

95
Individual Values and Moving Range (X, mR) (Continued)
Rul
es fo
r D
efin
ing
Spe
cial
Cau
se S
igna
ls
1. A
ny p
oint
out
side
of t
he c
ontr
ol2.
Tw
o ou
t of t
hree
suc
cess
ive
poin
ts
4. E
ight
suc
cess
ive
poin
ts fa
ll on
Ru
le 1
Ru
le 2
UC
L
LCL
Zon
e A
Zon
e B
Zon
e C
Zon
e C
Zon
e B
Zon
e A
Ru
le 3
UC
L
LCL
Zon
e A
Zon
e B
Zon
e C
Zon
e C
Zon
e B
Zon
e A
Rul
e 4
LCL
UC
L
limits
.fa
ll on
the
sam
e si
de o
f the
cen
ter
line
in z
one
A o
r be
yond
.
3. F
our
out o
f fiv
e su
cces
sive
val
ues
fall
on th
e sa
me
side
of t
he c
ente
rlin
e in
zon
e B
or
beyo
nd.
the
sam
e si
de o
f the
cen
ter
line. D
ES
CR
IPT
ION
DA
TE
/TIM
E
3 of 3
Rev
isin
g C
ontr
ol L
imits
II
If co
ntro
l lim
its a
re i
nfla
ted,
an
d th
e fo
llow
ing
two
con
ditio
ns
are
pres
ent,
revi
sio
n o
f con
trol
lim
its is
in o
rder
:(1
) V
ery
few
sig
nals
are
pre
sent
in th
e or
igin
al X
cha
rt(2
) 2
.660
R >
3.1
44 R
Cen
ter
line:
mR
= _
___
__
UC
LR =
3.8
65 m
R =
(3.
865)
(__
___
) =
____
__
Cen
ter l
ine:
X =
___
___
UC
LX =
X +
3.1
44 m
R =
___
__ +
(3.
144)
= (
____
__)
= _
____
_
LCL
X =
X –
3.1
44
mR
= _
____
– (
3.14
4) =
(__
____
) =
____
__
~~
~ ~
~
~

961 of 2
Attribute Control Chart
UN
IT O
F M
EA
SU
RE
PR
OC
ES
S
ME
AS
UR
EM
EN
T D
ES
CR
IPT
ION
DA
TE
12
34
56
78
910
1112
1314
1516
1718
1920
2122
2324
25
NO
TE
S
CO
UN
T
TIM
ED
AT
E
COUNTS
12
34
56
78
910
1112
1314
1516
1718
1920
2122
2324
25
p np c u

97
✍ Attribute Control Chart
This control chart is used with attribute, or categorical data. This type of data is based on counts or values calculated from counts. Attribute data can be plotted on this form as a np-chart, p-chart, c-chart, or u-chart. See Rodriguez, Konoske, and Landau (1994), or Wheeler and Chambers (1992) for more information and the appropriate formulas for each of these control charts.
Instructions
1. At the top of the form, describe the unit of measure used to record the data, describe the measure, the process it is associated with, and the period of time (“DATE”) covered by the control chart. Also check the type of control chart on the right side of the form.
2. At the bottom of the form record the measurements with one measurement listed in each column.
3. Use the appropriate formulas to calculate the necessary information for the control chart. Write the formulas used on page 2 of the form under the heading “Calculations.”
4. Plot the center line, the control limits, and the data points.
5. Review the rules for defining special cause signals on page 2 of the control chart form.
6. Circle in colored ink any special cause signals.
7. Use the spaces on page 2 of the control chart form labeled “DATE/TIME” and “DESCRIPTION” to record any notes regarding measurements, calculations, the occurrence of special cause signals, and possible reasons for variations in the process.
Note: This control chart form was developed by Rodriguez, Konoske, & Landau (1994).

982 of 2
Attribute Control Chart (Continued)
Rul
es fo
r D
efin
ing
Spe
cial
Cau
se S
igna
ls
1. A
ny p
oint
out
side
of t
he c
ontr
ol2.
Tw
o ou
t of t
hree
suc
cess
ive
poin
ts
4. E
ight
suc
cess
ive
poin
ts fa
ll on
Rul
e 1
Rul
e 2
UC
L
LCL
Zon
e A
Zon
e B
Zon
e C
Zon
e C
Zon
e B
Zon
e A
Rul
e 3
UC
L
LCL
Zon
e A
Zon
e B
Zon
e C
Zon
e C
Zon
e B
Zon
e A
Rul
e 4
LCL
UC
L
limits
.fa
ll on
the
sam
e si
de o
f the
cen
ter
line
in z
one
A o
r be
yond
.
3. F
our
out o
f fiv
e su
cces
sive
val
ues
fall
on th
e sa
me
side
of t
he c
ente
rlin
e in
zon
e B
or
beyo
nd.
the
sam
e si
de o
f the
cen
ter
line. D
ES
CR
IPT
ION
DA
TE
/TIM
E
Cal
cula
tions

99
Taking Action on Specialand Common Causes
The PIN forms in this section summarize findings and actions based on the quality improvement team’s data collection and analysis efforts. The types of special and common cause variation found in the process are summarized, along with the actions taken to reduce first special, then common cause variation. The effects of changes to the process are also summarized, along with the steps to make sure that process improvements are maintained. These forms are crucial to documenting and communicating the efforts of quality improvement teams.

100
Special Cause Improvement
Date:Process: / /
Describe Special Cause Selected
Actions Taken
Effects of Changes

101
✍ Special Cause Improvement
This form summarizes actions taken to address special causes, and the results of those actions. One form is used for each special cause selected for change.
Instructions
1. Briefly describe the special cause that was identified for change, referring back to the control chart forms for specific information concerning the special cause variation.
2. Describe the specific actions taken to address the special cause.
3. Describe the effects that resulted from these actions. Note changes in measures indicating the effects of the change.

102
Common Cause Improvement
Describe Common Cause Selected and Recommended Change
Rationale
Operations/Departments/Individuals Effected by Change
Proposed Timeline and Resources Required for Change
Date:Process: / /

103
✍ Common Cause Improvement
This form summarizes a plan for making changes to the process to reduce common cause variation. This form can be sent to the appropriate authority for approval. One form is to be used for each common cause.
Instructions
1. Describe the common cause selected. Also describe the recommendations or ideas for improving the process associated with the common cause.
2. Summarize the data supporting the recommended change under the “Rationale” heading.
3. List the “Operations/Departments/Individuals Affected by Change.” Briefly summarize the way in which the proposed changes will effect these groups.
4. Estimate the timeline required to test the recommended change. Also, describe the resources (e.g., time, money, equipment, expertise) required to make the change.

104
Approval of Common Cause Improvement
Approval of Selected Cause
Rationale
Change Agent
Resources Allocated
Timeline
Date:Process: / /

105
✍ Approval of Common Cause Improvement
This form is designed to communicate approval of the plan to reduce common cause variation.
Instructions
1. Describe the approved change under the “Approval of Selected Cause” heading.
2. Briefly describe the “Rationale” for approving this change.
3. List the name(s) of the individual(s) assigned responsibility to carry out the changes, collect the necessary data, and record the effect of the change on outputs under the “Change Agent” heading.
4. Describe the “Resources Allocated” to the team for implementing the approved change(s).
5. Project the time period allotted to test the change under the “Timeline” heading.

106
Types of Process Causes
Date:Process: / /
Special Causes of Variation
Common Causes of Variation
Impact of Improvement

107
✍ Types of Process Causes
This form summarizes the types of special and common cause variation found in the process. It provides a quick summary of the two types of variation, and what was done to improve the process in terms of eliminating both special and common causes of variation.
Instructions
1. Review prior PIN forms to summarize the team’s process improvement efforts.
2. List the special causes of variation and actions taken to reduce this type of variation.
3. List the common causes of variation and the actions taken to reduce this type of variation.
4. Indicate how changes to the process actually had an impact on measures, particularly those reflecting customer satisfaction with the improved product/service.

108
Change Implementation Plan
Cha
nge
Impl
emen
tatio
n R
epor
tDate:Process: / /
Rep
ort m
ade
by
Rep
ort m
ade
to
Rec
omm
enda
tions
Dec
isio
ns
1 of 2

109
✍ Change Implementation
This form can be used to record communication of a Change Implementation Plan. In addition, it lists the implementation activities, and provides a means to track completion of each activity.
Instructions
1. Indicate who reported on the Change Implementation Plan, and to whom the report was made.
2. List recommendations and decisions made, and the reason for those decisions. If a recommendation is rejected, explain why it was rejected (e.g., insufficient resources, conflicts with higher-level policy).
3. On page 2 of the form, list the activities needed to implement change. Include any plans for formal training, new process specifications, new responsibilities for employees, new work methods, and steps taken to inform customers of the improvement actions.
4. Also indicate who will take the lead on each activity listed under the “Person Responsible” column.
5. Record both the estimated start date and estimated end date in the appropriate columns.
6. Record the actual start date and actual end date as they occur.

110
Change Implementation Plan (Continued)
2 of 2
Act
ivity
Per
son
Res
pons
ible
Sta
rt D
ate
Est
imat
edA
ctua
l
End
Dat
e
Est
imat
edA
ctua
l
Pro
cess
:

111
References
Brassard, M. (1989). The memory jogger plus. Methuen, MA: GOAL/QPC.
Brassard, M., and Ritter, D. (1994). The memory jogger II. Methuen, MA: GOAL/QPC.
Deming, W. E. (1986). Out of the crisis. Cambridge, MA: Massachusetts Institute of Technology.
Department of the Navy. (1992a). Team skills and concepts. Washington, DC: Author.
Department of the Navy. (1992b). Total Quality Leadership source guide. Washington, DC: Author
Department of the Navy. (1993a). Fundamentals of Total Quality Leadership (Revised edition). Washington, DC: Author.
Department of the Navy. (1993b). Implementing Total Quality Leadership (Revised version). Washington, DC: Author.
Department of the Navy. (1994a). Senior leader’s seminar (Revised edition). Washington, DC: Author.
Department of the Navy. (1994b). Methods for managing quality (Revised edition). Washington, DC: Author.
Department of the Navy. (1994c). Department of the Navy Total Quality Leadership glossary. Washington, DC: Author.
Department of the Navy. (1996). The new starter kit for basic process improvement. Washington, DC: Author.
Doherty, L. M., & Howard, J. D. (1993). Total Quality Leadership: Strategic transformation in the Department of the Navy. Paper presented at the Annual Federal Quality Institute Conference, Washington, DC.

112
Garrett, L. H. III. (1990). DON Executive Steering Group guidance on Total Quality Leadership (TQL). Washington, DC: Department of the Navy.
Houston, A., & Dockstader, S. L. (1993). A Total Quality Leadership process improvement model (TQLO 93-02). Washington, DC: Total Quality Leadership Office.
Ishikawa, K. (1982). Guide to quality control. White Plains, NY: Kraus International Publications.
Kidder, P. J. (1995). Total quality leadership assessment survey. Washington, DC: Department of the Navy.
Kinlaw, D. C. (1992). Continuous improvement and measurement for total quality: A team-based approach. San Diego, CA: Pfeiffer & Company.
Kume, H. (1985). Statistical methods for quality improvement. White Plains, NY: Quality Resources.
Miller, L. M. (1991). Managing quality through teams: A workbook for team leaders and members. Atlanta, GA: The Miller Consulting Group, Inc.
Navy Personnel Research and Development Center. (1993a). Total Quality Leadership climate survey. San Diego, CA: Author.
Navy Personnel Research and Development Center. (1993b). Total quality implementation survey. San Diego, CA: Author.
Rodriguez, A., Konoske, P., & Landau, S. (1994). Systems approach to process improvement. Washington, DC: Department of the Navy.
Scholtes, P. (1988). The team handbook. Madison, WI: Joiner Associates Inc.
Schultz, L. E. (1989). The quality journal. Leadership Expectation Setting Seminar presented by Process Management Institute, Inc., Bloomington, MN.

113
Silberstang, J. (1995). Charting the course: The Department of the Navy Total Quality Leadership curriculum guide (TQLO 95-01). Washington, DC: Author.
Suarez, J.G. (1992). Three experts on quality management: Philip B. Crosby, W. Edwards Deming, Joseph M. Juran (TQLO 92-02). Washington, DC: Department of the Navy.
Tomasek, H. (1992). Improve processes with the quality journal. Quality Progress, 25, 49-54.
Wasik, J., & Ryan, B. (1993). TQL in the fleet: From theory to practice (TQLO 93-05). Washington, DC: Department of the Navy.
Wheeler, D. J., & Chambers, D.S. (1992). Understanding statistical process control. Knoxville, TN: SPC Press.

114

115
✍ Appendix: Team Dynamics Forms
The forms in this Appendix can assist quality improvement teams to plan and track team member training and development, and to assess and enhance the dynamics and functioning of the team.
Team Development Plan ........................................................ 116
Team Dynamics Survey ......................................................... 118
Tally Sheet for the Team Dynamics Survey .......................... 122
Summary of the Team Dynamics Survey............................... 126
Graph of the Team Dynamics Survey .................................... 130
Team Dynamics Action Plan.................................................. 132

116
Team Development Plan
Date:Process: / /
Name
Objective
Tool/Course
When
Where
Date Completed
Name
Objective
Tool/Course
When
Where
Date Completed
Name
Objective
Tool/Course
When
Where
Date Completed

117
✍ Team Development Plan
This form can be used to summarize team training needs and to document the completion of the training over time.
Instructions
1. Make copies of this form so the originals may be used again. Each block on the form relates to a particular team member. You will most likely need 2 copies of the form, which provides 6 blocks for 6 team members. Use as many copies of the form as are needed to cover all team members.
2. List the name of the team member who will receive training.
3. Describe the objective of receiving the training.
4. Describe how the team members will receive training in the Tool/Course section. Some possible options are attending a DON course, attending a course offered by the organization, or attending a course offered by other public or private organizations. See the DON TQL Curriculum Guide (Silberstang, 1995) for more information on DON quality courses. Other methods of skill development include distribution of reading materials, viewing videotapes, and attending seminars.
5. Project the date when the team member will receive the training.
6. List where the training will occur.
7. Indicate the projected completion date of the training.
8. Complete the second block on the form for the second team member, and the third block for the third team member.
9. Revise this form to record when training has been completed. It can also be used by the team to gauge how well the established training goals are being met.

118
This survey assesses each team member’s perceptions of how well we are functioning as a team. Readeach item and then indicate how much you agree or disagree with it. Be honest in your feedback. The resultswill be tallied and then discussed by the team so as to improve our effectiveness.
1. Our meetings begin and end on time. 1 2 3 4 5
2. We usually follow an agenda. 1 2 3 4 5
3. Most of our time is spent on important issues. 1 2 3 4 5
4. The team meets as often as needed. 1 2 3 4 5
5. Absenteeism at team meetings is not a problem. 1 2 3 4 5
6. There is follow-up on action items decided in previous meetings. 1 2 3 4 5
7. The team leader keeps the group focused. 1 2 3 4 5
8. The team advisor is effective. 1 2 3 4 5
9. All team members actively participate in meetings. 1 2 3 4 5
10. It is clear to me what my role is on the team. 1 2 3 4 5
11. No one person dominates our team meetings. 1 2 3 4 5
12. Responsibilities are distributed equally among team members. 1 2 3 4 5
Team Meetings
Roles and Responsibilities
Neither Disagree
Strongly Disagree
Disagree
Nor Agree
Agree
Strongly Agree
Date: / /
1 of 3
Team Dynamics Survey
Process: / /
1 of 3
Neither Disagree
Str ongly Disagree
Disagree
Nor Agree
Agree
Strongly Agree

119
✍ Team Dynamics Survey
The Team Dynamics Survey has been developed to tap areas of team effectiveness. The results from this survey provide the team with data that can serve as a discussion tool for how the team members can improve their functioning. The Team Dynamics Survey evaluates team functioning in the following areas: Team Meetings, Roles and Responsibilities, Communication, Decision Making, Climate, and Overall Effectiveness.
The survey results will be most useful if team members provide honest feedback. A team may choose to have the organization’s quality advisor distribute, collect, and tally the survey results to preserve anonymity and encourage honest feedback. It is recommended the team complete the survey after 10-12 team meetings. Subsequent assessments are recommended periodically, every several months or as the team moves through phases of the process improvement cycle.
Instructions
1. Copies of the survey are made for each team member.
2. The team leader and/or quality advisor can distribute the survey to all team members, explaining its purpose, and emphasizing that all members are encouraged to provide honest feedback. Ask members to answer all the questions.
3. Each team member completes the survey based on his/her perceptions of the group during the first 10-12 meetings.
4. The team leader and/or quality advisor collects the surveys by the end of the meeting, and tallies the results using the Tally Sheet (begins on page 124), the Summary form (begins on page 128), and the Graph form (page 132).

120
13. Team members communicate effectively with one another. 1 2 3 4 5
14. I offer information in order to promote group discussion. 1 2 3 4 5
15. Team members generally don’t interrupt one another. 1 2 3 4 5
16. I can present alternate views to the team. 1 2 3 4 5
17. Team discussions are usually constructive. 1 2 3 4 5
18. I let other team members know that I appreciate their input. 1 2 3 4 5
19. Team members pay attention when I contribute to the discussion. 1 2 3 4 5
20. Team members who are absent from a meeting are kept informed. 1 2 3 4 5
21. This team has an effective process for making decisions. 1 2 3 4 5
22. We use data to help us make decisions. 1 2 3 4 5
23. I can influence decisions made by the team. 1 2 3 4 5
24. Decisions are usually made by consensus. 1 2 3 4 5
Communication
Decision Making
Team Dynamics Survey (Continued)
2 of 3
Neither Disagree
Strongly Disagree
Disagree
Nor Agree
Agree
Strongly Agree
Strongly Disagree
Neither Disagree
Str ongly Disagree
Disagree
Nor Agr ee
Agree
Strongly Agree
Team Dynamics Survey (Continued)
2 of 3

121
25. New ideas and ways of doing things are encouraged by team members. 1 2 3 4 5
26. This team offers an atmosphere conducive to working together. 1 2 3 4 5
27. Team members appreciate my contributions to the group. 1 2 3 4 5
28. Team members treat each other with respect. 1 2 3 4 5
29. There is an atmosphere of trust among team members. 1 2 3 4 5
30. This team can accomplish what it is chartered to do. 1 2 3 4 5
31. I am motivated to make this team do the best we can do. 1 2 3 4 5
32. We are an effective team.1 2 3 4 5
33. I am proud to be part of this team.1 2 3 4 5
Climate
Overall Effectiveness
Neither Disagree
Strongly Disagree
Disagree
Nor Agree
Agree
Strongly Agree
Team Dynamics Survey (Continued)
3 of 3
Neither Disagree
Str ongly Disagree
Disagree
Nor Agree
Agree
Strongly Agree

122
Tally Sheet for the Team Dynamics Survey
Use this form to tally the results of the Team Dynamics Survey.
1 2 3 4 5
1. Our meetings begin and end on time.
2. We usually follow an agenda.
3. Most of our time is spent on important issues.
4. The team meets as often as needed.
5. Absenteeism at team meetings is not a problem.
6. There is follow-up on action items decided in previous meetings.
7. The team leader keeps the group focused.
8. The team advisor is effective.
9. All team members actively participate in meetings.
10. It is clear to me what my role is on the team.
11. No one person dominates our team meetings.
12. Responsibilities are distributed equally among team members.
Team Meetings
Roles and Responsibilities
Date:Process: / /
1 of 3
Strongly Disagree
Disagree
Neither Disagree
Nor Agree
Agree
Strongly Agree

123
✍ Tally Sheet for the Team Dynamics Survey
The tally sheet helps you combine the Team Dynamics Survey results for all respondents to the survey. The results from this form can be used to provide feedback, but will most likely be used as input into the Summary of the Team Dynamics Survey form.
Instructions
1. Make copies of the Tally Sheet for the Team Dynamics Survey.
2. Record the results for each survey on the Tally Sheet. For example, if a survey respondent on question #1 circled a “4” (Agree), then a mark would be made under the Agree (4) heading for question #1 on the Tally Sheet.
3. Do the same for each item on the survey.
4. Then go to the next survey and record the responses for each item in the same manner.
5. After recording all of the ratings on the Tally Sheet, add up all of the tally marks for each box. Write and circle this number in each of the boxes.
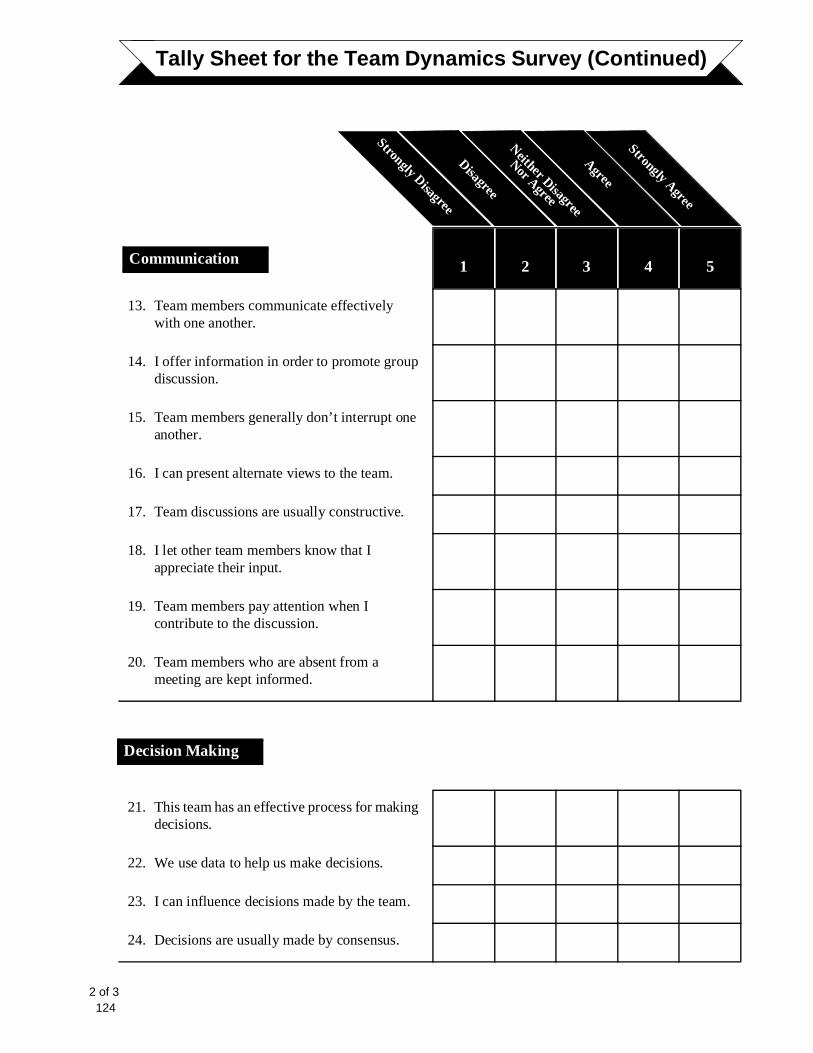
124
Tally Sheet for the Team Dynamics Survey (Continued)
2 of 3
1 2 3 4 5
13. Team members communicate effectively with one another.
14. I offer information in order to promote group discussion.
15. Team members generally don’t interrupt one another.
16. I can present alternate views to the team.
17. Team discussions are usually constructive.
18. I let other team members know that I appreciate their input.
19. Team members pay attention when I contribute to the discussion.
20. Team members who are absent from a meeting are kept informed.
21. This team has an effective process for making decisions.
22. We use data to help us make decisions.
23. I can influence decisions made by the team.
24. Decisions are usually made by consensus.
Communication
Decision Making
Strongly Disagree
Disagree
Neither Disagree
Nor Agr ee
Agr ee
Strongly Agree

125
Tally Sheet for the Team Dynamics Survey (Continued)
25. New ideas and ways of doing things are encouraged by team members.
26. This team offers an atmosphere conducive to working together.
27. Team members appreciate my contributions to the group.
28. Team members treat each other with respect.
29. There is an atmosphere of trust among team members.
30. This team can accomplish what it is chartered to do.
31. I am motivated to make this team do the best we can do.
32. We are an effective team.
33. I am proud to be part of this team.
Climate
Overall Effectiveness
3 of 3
1 2 3 4 5
Strongly Disagree
Disagree
Neither Disagree
Nor Agree
Agr ee
Strongly Agree

126
Summary of the Team Dynamics Survey
Total number of team members who took the survey __________ Disagree
Neither Agree nor Disagree Agree
n % n % n %
1. Our meetings begin and end on time.
2. We usually follow an agenda.
3. Most of our time is spent on important issues.
4. The team meets as often as needed.
5. Absenteeism at team meetings is not a problem.
6. There is follow-up on action items decided in previous meetings.
Total
7. The team leader keeps the group focused.
8. The team advisor is effective.
9. All team members actively participate in meetings.
10. It is clear to me what my role is on the team.
11. No one person dominates our team meetings.
12. Responsibilities are distributed equally among team members.
Total
Team Meetings
Roles and Responsibilities
Use this form to summarize the results from the Tally Sheet for the Team Dynamics Survey. Date:Process: / /
1 of 3

127
✍ Summary of the Team Dynamics Survey
It is common to collapse the rating categories when summarizing survey results so that simple comparisons can be made between the number of negative, neutral, and positive responses to a question. This form will help you do this.
Instructions
1. Record the number of team members who completed the survey on the Summary form.
2. Add together the number of people who answered “Strongly Disagree” (1) or “Disagree” (2) on the Tally Sheet for question #1. Record this sum on the Summary form in the Disagree column, labeled “n” for the number of responses.
3. Calculate the percent of respondents who “Disagree” by dividing the number in column “n” by the total number of team members who took the survey, and then multiplying this number by 100. Record this number under the % sign in the “Disagree” column.
4. As an example, if the Tally Sheet showed that three people responded “Strongly Disagree” and one person responded “Disagree” to question #1, the number “4” (3 + 1 = 4) would be placed on the Summary form in the column “n” for question #1. If 10 people answered the survey, then the percent who disagree is found by dividing 4 by 10, and then multiplying this number by 100 [4/10 = 0.40 x 100 = 40%].
5. Since the neutral category is not collapsed, just transfer the value under “Neither Agree nor Disagree” to the Tally Sheet, and calculate the percentage accordingly.
6. Combine the “Agree” (4) and the “Strongly Agree” (5) categories. Record this sum in the fifth column on the Summary form, labeled “n,” next to question #1. Calculate the percentage accordingly. Repeat these steps for each question on all the surveys.
7. The results can then be graphed to visually summarize the survey findings on the Graph of the Team Dynamics Survey form.

128
DisagreeNeither Agree nor Disagree Agree
n % n % n %
13. Team members communicate effectively with one another.
14. I offer information in order to promote group discussion.
15. Team members generally don’t interrupt one another.
16. I can present alternate views to the team.
17. Team discussions are usually constructive.
18. I let other team members know that I appreciate their input.
19. Team members pay attention when I contribute to the discussion.
20. Team members who are absent from a meeting are kept informed.
Total
21. This team has an effective process for making decisions.
22. We use data to help us make decisions.
23. I can influence decisions made by the team.
24. Decisions are usually made by consensus.
Total
Communication
Decision Making
Summary of the Team Dynamics Survey (Continued)
2 of 3

129
Disagree
Neither Agree nor Disagree Agree
n % n % n %
25. New ideas and ways of doing things are encouraged by team members.
26. This team offers an atmosphere conducive to working together.
27. Team members appreciate my contributions to the group.
28. Team members treat each other with respect.
29. There is an atmosphere of trust among team members.
Total
30. This team can accomplish what it is chartered to do.
31. I am motivated to make this team do the best we can do.
32. We are an effective team.
33. I am proud to be part of this team.
Total
Climate
Overall Effectiveness
Summary of the Team Dynamics Survey (Continued)
3 of 3
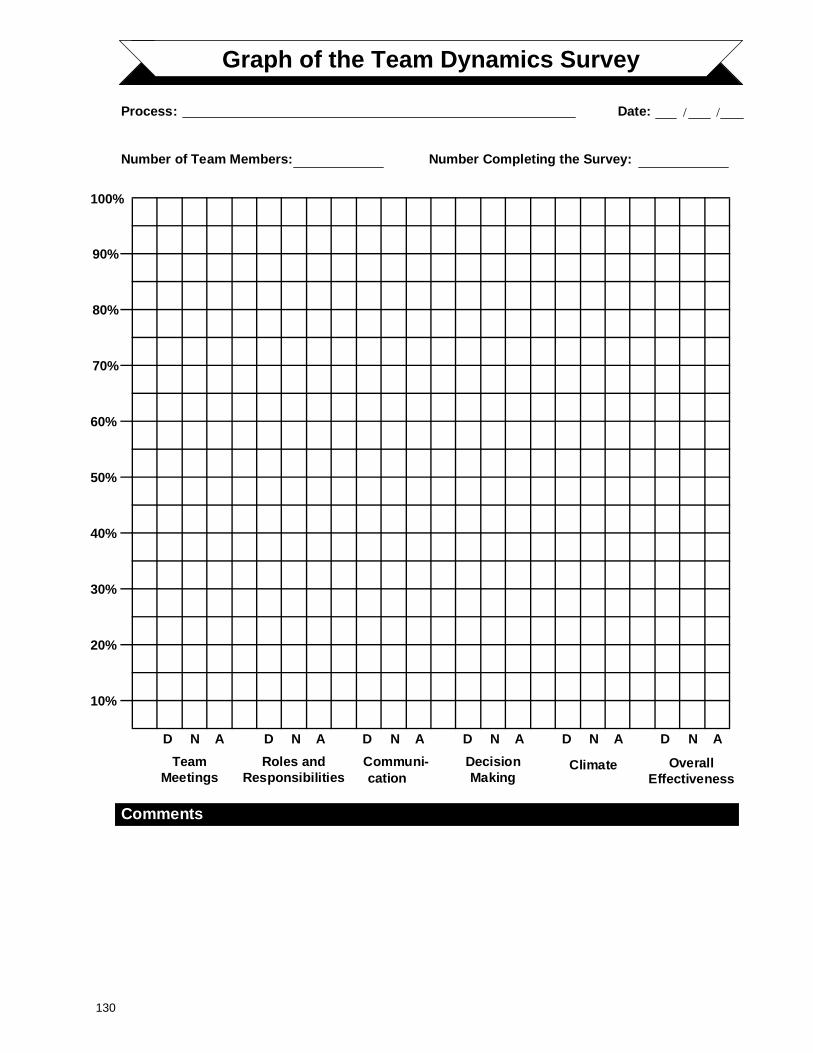
130
Graph of the Team Dynamics Survey
Number Completing the Survey:
Date:Process: / /
Number of Team Members:
TeamMeetings
Roles andResponsibilities
Communi- DecisionMaking
Climate OverallEffectiveness
100%
90%
80%
70%
60%
50%
40%
30%
20%
10%
Comments
D N A D N A D N A D N A D N A D N A
cation

131
✍ Graph of the Team Dynamics Survey
This form can be used to display the survey results in a graphical form.
Instructions
1. Go back to the Summary of the Team Dynamics Survey form. Use this form to total the survey responses in the six areas tapped by the survey.
2. For example, calculate the Disagree responses for Team Meetings by summing the number under the column labeled “n” for the first 6 questions. Write this number in the box in the row with the label of “Total.”
3. To calculate the percent who disagreed to team meeting items, determine the appropriate number to divide by to get the accurate percentages. This divisor is calculated by multiplying the number of members who took the survey by the number of questions in that section of the survey. For team meetings, the divisor is 6 (for the number of questions) by, say 10, (for 10 people who completed the survey). Thus the divisor is 60 (6 x 10). If your total for the “n” column under the disagree heading is 12, then the percentage who disagree to Team Meeting items: 12/60 x 100 = 20%. Note that you cannot just sum down the “%” columns, for these are row percents and not column percents, which is what is calculated here.
4. Calculate the “n” and percent of all three types of responses (Disagree, Neither Agree nor Disagree, and Agree) for each of the six survey areas.
5. Graph the percentage who disagree for each of the six areas of the Team Dynamics Survey using bars with a hatch mark pattern. Using yet another pattern, graph with bars the percentage who neither agree or disagree for each of the six areas. Using yet a third pattern, graph with bars the percentage who agree for each of the six areas.
6. The team leader/quality advisor can then make copies of both the Summary form and the Graph of the Team Dynamics Survey, and distribute them to team members for review and discussion.

132
Team Dynamics Action Plan
Team Meetings
Strengths Improvements Needed
Roles and Responsibilities
Strengths Improvements Needed
Communication
Strengths Improvements Needed
Decision Making
Strengths Improvements Needed
Climate
Strengths Improvements Needed
Other
Strengths Improvements Needed
Date:Process: / /
1 of 2

133
✍ Team Dynamics Action Plan
This form is designed to record team discussion of the results of the Team Dynamics Survey. It also summarizes action items to address team weaknesses.
Instructions
1. Make copies of the form so it can be used again. Hand out copies of the summary results to all team members.
2. Discuss the survey results in terms of the six areas:
❑ Team Meetings
❑ Roles and Responsibilities
❑ Communication
❑ Decision Making
❑ Climate
❑ Overall Effectiveness.
3. Record comments regarding strengths and improvements needed.
4. Summarize areas needing improvement on the Team Dynamics Action Plan. Some ways to handle team weaknesses may be to obtain training, or to go through team building exercises.
5. Discuss and record action items that will help the team to improve its interaction and effectiveness.

134
Team Dynamics Action Plan (Continued)
Action Items When By Whom
2 of 2

'(3$570(17�2)�7+(�1$9<
74/2)),&(
74/2�3XEOLFDWLRQ�1R�������
'HSDUWPHQW�RI�WKH�1DY\����7RWDO�4XDOLW\�/HDGHUVKLS�2IILFH�����-HIIHUVRQ�'DYLV�+LJKZD\����6XLWH���������$UOLQJWRQ��9$������������