Aircraft emission mitigation by changing route altitude: A multi-model estimate of aircraft NOx...
12
Aircraft emission mitigation by changing route altitude: A multi- model estimate of aircraft NO x emission impact on O 3 photochemistry Ole Amund Søvde a, * , Sigrun Matthes b , Agnieszka Skowron c , Daniela Iachetti d , Ling Lim c , Bethan Owen c , Øivind Hodnebrog a , Glauco Di Genova d , Gianni Pitari d , David S. Lee c , Gunnar Myhre a , Ivar S.A. Isaksen a, e a Center for International Climate and Environmental Research e Oslo (CICERO), Oslo, Norway b Deutsches Zentrum für Luft- und Raumfahrt, Institut für Physik der Atmosph€ are, Oberpfaffenhofen, Germany c Dalton Research Institute, Manchester Metropolitan University, Manchester, United Kingdom d University of L’Aquila, L'Aquila, Italy e Department of Geosciences, University of Oslo, Oslo, Norway highlights graphical abstract Multi-model study on the aircraft NOx-related effect on the atmosphere. New inventory for aircraft NO x emissions, representative for year 2006. The total RF due to NO x emissions is found to be about 5 mW m 2 . Shifting cruise altitudes up or down by 2000 ft changes RF by about 2 mW m 2 . Contrail-avoiding measures will likely give small NO x impact. article info Article history: Received 10 February 2014 Received in revised form 19 June 2014 Accepted 23 June 2014 Available online 24 June 2014 Keywords: Aircraft NO x emissions Chemical impact Radiative forcing Multimodel comparison Contrail avoiding measures abstract The atmospheric impact of aircraft NO x emissions are studied using updated aircraft inventories for the year 2006, in order to estimate the photochemistry-related mitigation potential of shifting cruise alti- tudes higher or lower by 2000 ft. Applying three chemistry-transport models (CTM) and two climate- chemistry models (CCM) in CTM mode, all including detailed tropospheric and stratospheric chemis- try, we estimate the short-lived radiative forcing (RF) from O 3 to range between 16.4 and 23.5 mW m 2 , with a mean value of 19.5 mW m 2 . Including the long-lived RF caused by changes in CH 4 , the total NO x - related RF is estimated to about 5 mW m 2 , ranging 1e8 mW m 2 . Cruising at 2000 ft higher altitude increases the total RF due to aircraft NO x emissions by 2 ± 1 mW m 2 , while cruising at 2000 ft lower altitude reduces RF by 2 ± 1 mW m 2 . This change is mainly controlled by short-lived O 3 and show that chemical NO x impact of contrail avoiding measures is likely small. © 2014 The Authors. Published by Elsevier Ltd. This is an open access article under the CC BY-NC-ND license (http://creativecommons.org/licenses/by-nc-nd/3.0/). 1. Introduction In this multi-model study we assess how conceptual changes to aircraft flight altitude can alter the impact of aircraft NO x emissions on atmospheric gas phase chemistry. Aircraft NO x emissions have * Corresponding author. E-mail address: [email protected] (O.A. Søvde). Contents lists available at ScienceDirect Atmospheric Environment journal homepage: www.elsevier.com/locate/atmosenv http://dx.doi.org/10.1016/j.atmosenv.2014.06.049 1352-2310/© 2014 The Authors. Published by Elsevier Ltd. This is an open access article under the CC BY-NC-ND license (http://creativecommons.org/licenses/by-nc-nd/3.0/). Atmospheric Environment 95 (2014) 468e479
Transcript of Aircraft emission mitigation by changing route altitude: A multi-model estimate of aircraft NOx...
lable at ScienceDirect
Atmospheric Environment 95 (2014) 468e479
Contents lists avai
Atmospheric Environment
journal homepage: www.elsevier .com/locate/atmosenv
Aircraft emission mitigation by changing route altitude: A multi-model estimate of aircraft NOx emission impact on O3 photochemistry
Ole Amund Søvde a, *, Sigrun Matthes b, Agnieszka Skowron c, Daniela Iachetti d,Ling Lim c, Bethan Owen c, Øivind Hodnebrog a, Glauco Di Genova d, Gianni Pitari d,David S. Lee c, Gunnar Myhre a, Ivar S.A. Isaksen a, e
a Center for International Climate and Environmental Research e Oslo (CICERO), Oslo, Norwayb Deutsches Zentrum für Luft- und Raumfahrt, Institut für Physik der Atmosph€are, Oberpfaffenhofen, Germanyc Dalton Research Institute, Manchester Metropolitan University, Manchester, United Kingdomd University of L’Aquila, L'Aquila, Italye Department of Geosciences, University of Oslo, Oslo, Norway
h i g h l i g h t s
* Corresponding author.E-mail address: [email protected] (O.A. Søvde
http://dx.doi.org/10.1016/j.atmosenv.2014.06.0491352-2310/© 2014 The Authors. Published by Elsevier
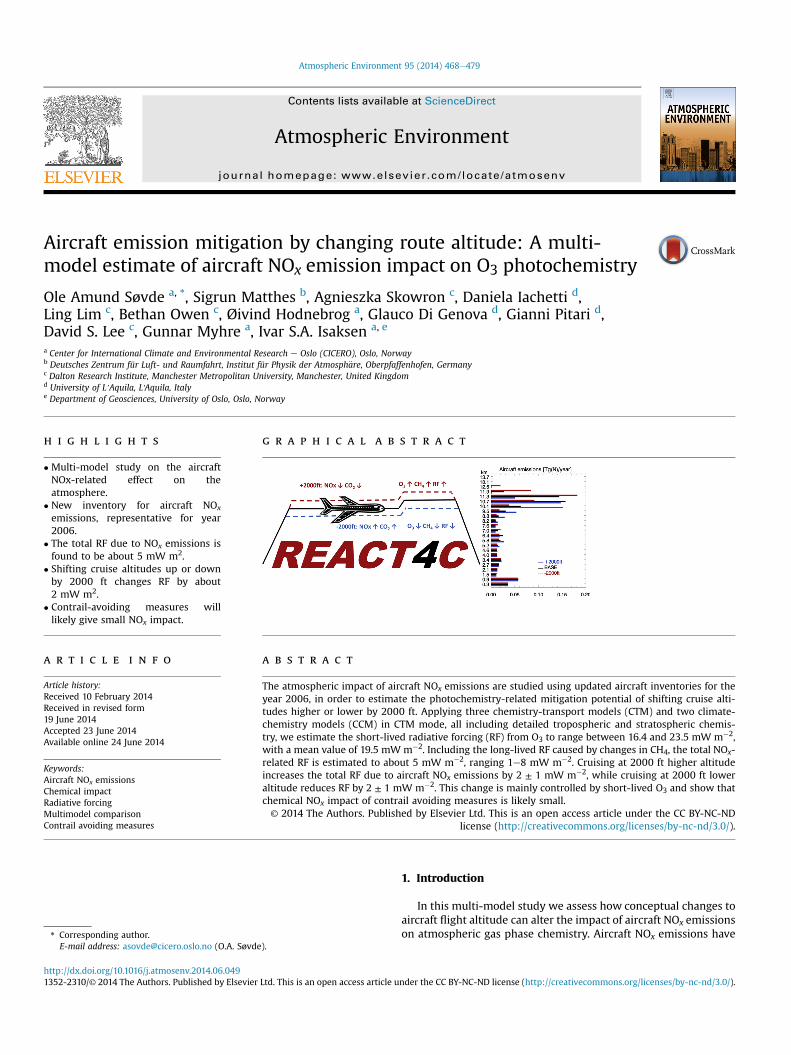
g r a p h i c a l a b s t r a c t
� Multi-model study on the aircraftNOx-related effect on theatmosphere.
� New inventory for aircraft NOx
emissions, representative for year2006.
� The total RF due to NOx emissions isfound to be about 5 mW m2.
� Shifting cruise altitudes up or downby 2000 ft changes RF by about2 mW m2.
� Contrail-avoiding measures willlikely give small NOx impact.
a r t i c l e i n f o
Article history:Received 10 February 2014Received in revised form19 June 2014Accepted 23 June 2014Available online 24 June 2014
Keywords:Aircraft NOx emissionsChemical impactRadiative forcingMultimodel comparisonContrail avoiding measures
a b s t r a c t
The atmospheric impact of aircraft NOx emissions are studied using updated aircraft inventories for theyear 2006, in order to estimate the photochemistry-related mitigation potential of shifting cruise alti-tudes higher or lower by 2000 ft. Applying three chemistry-transport models (CTM) and two climate-chemistry models (CCM) in CTM mode, all including detailed tropospheric and stratospheric chemis-try, we estimate the short-lived radiative forcing (RF) from O3 to range between 16.4 and 23.5 mW m�2,with a mean value of 19.5 mW m�2. Including the long-lived RF caused by changes in CH4, the total NOx-related RF is estimated to about 5 mW m�2, ranging 1e8 mW m�2. Cruising at 2000 ft higher altitudeincreases the total RF due to aircraft NOx emissions by 2 ± 1 mW m�2, while cruising at 2000 ft loweraltitude reduces RF by 2 ± 1 mW m�2. This change is mainly controlled by short-lived O3 and show thatchemical NOx impact of contrail avoiding measures is likely small.© 2014 The Authors. Published by Elsevier Ltd. This is an open access article under the CC BY-NC-ND
license (http://creativecommons.org/licenses/by-nc-nd/3.0/).
).
Ltd. This is an open access article u
1. Introduction
In this multi-model study we assess how conceptual changes toaircraft flight altitude can alter the impact of aircraft NOx emissionson atmospheric gas phase chemistry. Aircraft NOx emissions have
nder the CC BY-NC-ND license (http://creativecommons.org/licenses/by-nc-nd/3.0/).
O.A. Søvde et al. / Atmospheric Environment 95 (2014) 468e479 469
long been known to affect atmospheric O3 (e.g. Johnston, 1971;Hesstvedt, 1974; Hidalgo and Crutzen, 1977), and research on theradiative impacts of aircraft emissions were recently summarisedby Lee et al. (2010), later to be revisited by Myhre et al. (2011).Aircraft engines produce different types of exhaust gases and par-ticles. Of gases, NOx and H2O aremost important for the reactive gasphase chemistry, affecting O3 production and loss through theO3eNOx chemistry (Johnston, 1971; Hidalgo and Crutzen, 1977;Johnson et al., 1992; Schumann, 1997; Dameris et al., 1998; Greweet al., 2002; Gauss et al., 2006). Emitted particles may affect theatmospheric composition by providing surfaces for heterogeneousreactions (e.g. Lee et al., 2010). Aircraft emissions also producecontrail cirrus (e.g. Burkhardt and K€archer, 2011; Yi et al., 2012) andCO2. Such changes will affect the radiative balance, imposing aradiative forcing (RF). However, our focus is on reactive gas-phasechemistry only, more specifically on the effect of NOx emissionsfrom aircraft.
The atmospheric impact of emissions of short-lived gases havein general been found to depend strongly on where they areemitted (Berntsen et al., 2006), including aircraft NOx emissions(Stevenson and Derwent, 2009; K€ohler et al., 2013), in compliancewith earlier work showing that radiative forcing from O3 is stron-gest in the upper troposphere and lower stratosphere (UTLS) due tolow temperatures and clean background atmosphere (e.g. Wangand Sze, 1980; Lacis et al., 1990; Hansen et al., 1997; Forster andShine, 1997). Could relatively simple mitigation strategies foraircraft emissions reduce the atmospheric impact? In light of thisquestion, we assess here two mitigation options using idealisedemission inventories in sophisticated chemistry-transport models(CTM).
During the EU project Reducing Emissions from Aviation byChanging Trajectories for the benefit of Climate (REACT4C), threesets of aircraft emission inventories were produced, to assess theNOx impact of shifting aircraft cruise altitudes by one flight level, i.e.representative for typical contrail-avoiding measures.
Related studies were carried out in the project TradeOff (Gausset al., 2006; Stordal et al., 2006), and recently Fr€omming et al.(2012) re-investigated TradeOff inventories. Related studies havealso been carried out for a possible future stratospheric fleet(Grewe et al., 2007; Pitari et al., 2008; Søvde et al., 2007). Here, weuse 3 CTMs and 2 climate-chemistry models (CCM) run in CTMmode. Important improvements from previous studies are themulti-model approach, update to more recent aircraft traffic in-ventories, increasedmodel resolution, and that all models comprisedetailed chemistry in the troposphere and the stratosphere, fullycovering the UTLS where most aircraft have their cruise altitudeand hence main emissions.
The models are described in Section 2, and the aircraft emissioninventories in Section 3. Atmospheric impacts are presented inSection 4 and the changes in RF in Section 5. We summarise thestudy in Section 6.
2. The models
Five different models are used in this study; MOZART-3, ULAQ-CTM, EMAC QCTM, Oslo CTM2 and Oslo CTM3. A short descriptionof the models and their basic set-ups are presented next. InSupplementary Material (SM) Sect. S1, a model overview table ispresented and additional information on annual emission numbersis given. We note that our models are spun up for at least 4 years,which we have found sufficient for this study. Except for ULAQ-CTM, the models are driven by or nudged to real meteorologyfrom the European Centre for Medium-Range Weather Forecasts(ECMWF), as will be explained.
2.1. MOZART-3 CTM
TheModel for OZone and Related Tracers, version 3 (MOZART-3)is a three dimensional CTM, comprehensively evaluated byKinnison et al. (2007) and extensively used for different applicationstudies (Gettelman et al., 2004; Park et al., 2004; Sassi et al., 2004;Liu et al., 2009; Wuebbles et al., 2011; Skowron et al., 2013). Thehorizontal resolution is T42 (z2.8� � 2.8�) and the vertical domainextends from surface to 0.1 hPa with 60 hybrid layers. Verticalresolution is 700e900 m at aircraft cruise altitudes (250e200 hPa).The transport of chemical compounds as well as hydrological cycleis driven by the meteorological fields from ECMWF Interim 6-hreanalysis (ERA-Interim).
MOZART-3 is built on the framework of the transport modelMATCH (Model for Atmospheric Transport and Chemistry, Raschet al., 1997) and accounts for advection, convection, boundarylayer exchanges and wet removal and dry deposition. Advection oftracers is performed following the numerically fast flux-form semi-Lagrangian scheme of Lin and Rood (1996). Convective mass fluxesare re-diagnosed by MATCH, using the shallow and mid-levelconvection scheme of Hack (1994) and deep convective transportformulation of Zhang and McFarlane (1995).
MOZART-3 represents detailed chemical and physical processesin the troposphere and the stratosphere. The chemical mechanismconsists of 108 species, 218 gas-phase reactions and 71 photolyticreactions including the photochemical reactions associated withorganic halogen compounds. The species included within thismechanism are members of the Ox, NOx, HOx, ClOx and BrOx
chemical families, along with CH4 and its degradation products. Anon-methane hydrocarbon oxidation scheme is also represented.The kinetic and photochemical data are from Sander et al. (2006).
The anthropogenic (non-aviation) and biomass burning surfaceemissions are taken from Lamarque et al. (2010), while the biogenicsurface emissions are taken from POET (Granier et al., 2005). Allsurface emissions represent year 2000. NOx emissions from light-ning are distributed according to the location of the convectiveclouds based on Price et al. (1997) with a vertical profile followingPickering et al. (1998).
2.2. EMAC QCTM
The EMAC QCTM is the global ECHAM/MESSy AtmosphericChemistry (EMAC) run in a quasi-CTM mode. EMAC is a numericalchemistry and climate simulation system that includes submodelsdescribing tropospheric and middle atmosphere processes andtheir interaction with oceans, land and human influences (J€ockelet al., 2010). It uses the second version of the Modular Earth Sub-model System (MESSy2, J€ockel et al., 2010). The core atmosphericmodel is the 5th generation European Centre Hamburg generalcirculation model (ECHAM5, Roeckner et al., 2003, 2006). Freetroposphere dynamics (up to about 200 hPa) are nudged towardsthe analysed ECMWF meteorology, and in this study aviationemission interact only on chemical processes, and not with modeldynamics (Deckert et al., 2011). A horizontal resolution of T42 with90 vertical hybrid pressure levels up to 0.01 hPa is used. Verticalresolution is ~660 m at aircraft cruise altitudes.
This results in realistic atmospheric dynamics, and clouds aretreated in a standard EMAC scheme (Sundqvist, 1978; Lohmann andRoeckner, 1996). An aerosol climatology (Tanr�e et al., 1984) is usedfor the calculation of the radiation field and separate climatologiesare used in the troposphere (Kerkweg, 2005) and stratosphere forH2SO4 (Stratospheric Aerosol and Gas Experiment e SAGE) toprovide aerosol surfaces for heterogeneous chemistry. Gas phasechemistry is calculated with the MECCA1 chemistry submodel(Sander et al., 2005) consistently from the surface to the
O.A. Søvde et al. / Atmospheric Environment 95 (2014) 468e479470
stratosphere. The applied chemical mechanism includes fullstratospheric complexity, but neglects the sulphur and halogenfamilies in the troposphere. It has been evaluated by J€ockel et al.(2006).
Anthropogenic emissions are taken from Lamarque et al. (2010),while biomass burning is from GFEDv3.1. Biomass burning isdistributed in one level only (140 m thick). Lightning NOx isdistributed horizontally following Grewe et al. (2001), and verti-cally following Pickering et al. (1998). A base value of 5 Tg (N) yr�1 isapplied, for which the meteorological conditions may impose a5e10% variation on annual basis. Total emissions are listed in SMSect. S1, where surface NOx also includes a soil source. Otheremissions depending on meteorological conditions are the soilsource with a base value of 7 Tg (N) yr�1, and the isoprene emis-sions having a base value of 315 Tg (C) yr�1. Also for these theannual variation caused by meteorology is 5e10%.
2.3. ULAQ-CTM
The University of L’Aquila model is a global scale climate-chemistry coupled model (ULAQ-CCM, Pitari et al., 2002; Eyringet al., 2006; Morgenstern et al., 2010) extending from the surfaceto the mesosphere (0.04 hPa) and operated here in CTM mode.Dynamical data, i.e. velocity stream-function and velocity potential,are provided by the background GCM run in a reference case, withno feedbacks of aviation induced changes. Horizontally, a T21spectral resolution is used in a 6� � 5� grid. Vertically the modelspans 126 log-pressure levels (~560 m spacing).
The ULAQ-CCM has been fully described in Pitari et al. (2002)and also in Eyring et al. (2006) and Morgenstern et al. (2010) forthe SPARC-CCMVal model inter-comparison and validation cam-paigns. Since then, some important updates have been made in themodel: (a) increase of horizontal and vertical resolution to T21 and126 layers as described above; (b) inclusion of a numerical code forthe formation of upper tropospheric cirrus cloud ice particles(K€archer and Lohmann, 2002); (c) update to Sander et al. (2011)recommendations for cross sections of species, and the parame-terisation of Minschwaner et al. (1993) for the SchumanneRungebands, based on fixed-temperature opacity distribution functionformulation; (d) upgrade of the radiative transfer code for calcu-lations of photolysis, solar heating rates and top-of-atmosphereradiative forcing. The oceanic surface temperature is assimilatedfrom the Hadley Centre for Climatic Prediction and Research; theparameterisation of periodic natural forcings (solar cycle, quasi-biennial oscillation) is included on-line.
The chemistry module (Pitari et al., 2002) is organised withlong-lived and surface-flux species CH4, N2O, CFCs, HCFCs, CO,NMVOC, NOx) and with all medium and short-lived speciesgrouped in the families Ox, NOy, HOx, CHOx, Cly, Bry, SOx and aero-sols. In total there are 40 transported species and 26 species atphotochemical equilibrium. For aerosols there are 57 size cate-gories. The model includes the major components of stratosphericand tropospheric aerosols (sulphate, carbonaceous, soil dust, seasalt, PSCs). Aircraft NOx emissions are emitted as the NOx familyspecies, and partitioned by applying photochemical equilibria be-tween nitrogen species.
The updated radiative transfer module operating on-line in theULAQ-CCM, is a two-stream delta-Eddington approximation model(Toon et al., 1989). It is used for chemical species photolysis ratecalculations in ultra-violet (UV) to visible (VIS) wavelengths and forsolar heating rates and radiative forcing in UV-VIS-near-infraredbands. The ULAQ model calculations of photolysis rates and sur-face and top-of-atmosphere radiative fluxes have been validated inthe framework of SPARC and AEROCOM inter-comparison cam-paigns (Chipperfield et al., 2013; Randles et al., 2013).
2.4. Oslo CTM3
The Oslo CTM3 (Søvde et al., 2012) is a three dimensional off-line CTM. It is a recent upgrade of Oslo CTM2 (see Section 2.5).The improvements from Oslo CTM2 to CTM3 includes improvedtransport scheme parameterisation, wet scavenging processes,lightning parameterisation and calculations of photodissociationrates, as described by Søvde et al. (2012). Themodel is driven by 3-hforecasts generated by the Integrated Forecast System (IFS) of theECMWF, cycle 36r1. Horizontal resolution is T42, and vertically themodel domain spans 60 layers between the surface and 0.1 hPa.Vertical resolution is 700e900 m at aircraft cruise altitudes.
How the forecast data are put together is explained by Søvdeet al. (2012). Advection of chemical species is carried out usingthe improved second order moments scheme (Prather et al., 2008;Søvde et al., 2012). Convective transport of tracers is based on theconvective upward flux from the ECMWF model, allowing forentrainment or detrainment of tracers depending on the changes inthe upward flux. Detrainment rates are read from the meteoro-logical data, possibly increasing or decreasing the mixing withambient air as the plume rises (Søvde et al., 2012). Turbulentmixing in the boundary layer is treated according to the Holtslag K-profile scheme (Holtslag et al., 1990).
Oslo CTM3 comprises comprehensive tropospheric chemistry,accounting for the most important parts of theO3eNOxehydrocarbon chemistry cycle (Berntsen and Isaksen,1997), the tropospheric sulphur cycle (Berglen et al., 2004), andalso comprehensive stratospheric chemistry as explained in Søvdeet al. (2008). Also included are tropospheric nitrate aerosols and seasalt aerosols. For the chemistry calculations, the quasi steady stateapproximation (QSSA) chemistry solver (Hesstvedt et al., 1978) isused.
Surface emissions are taken from RETRO (RETRO Emissions,2006), except for biomass burning, which is taken from theGlobal Fires Emission Database version 3 (GFEDv3). Due to a con-version error, the Oslo CTM3 (and Oslo CTM2) assumed GFEDv3NOx to be NO2 instead of NO, giving about 3 Tg (N) yr�1 instead ofthe correct 4.7 Tg (N) yr�1. We have not had the possibility to re-runthe simulations with correct value, but assume increasing surfaceNOx emissions by 3e4% will not change the impact of aircraftemissions noticeably. Emissions of NOx from lightning is describedby Søvde et al. (2012), where the emissions are distributed throughthe year based on the amount of convection in the meteorologicaldata.
2.5. Oslo CTM2
The Oslo CTM2 (Søvde et al., 2008) is the previous version ofOslo CTM3. It is widely used in previous studies (e.g. Berntsen andIsaksen, 1997; Berglen et al., 2004; Isaksen et al., 2005; Søvde et al.,2007, 2011). The chemistry schemes in Oslo CTM2 and Oslo CTM3are the same; tropospheric and stratospheric chemistry is included,as is the tropospheric sulphur scheme. Due to computational con-straints, CTM2 does not include tropospheric nitrate aerosols andsea salt aerosols in this study. The model resolution is the same asfor CTM3, as are the meteorological data used to drive the model.
Compared to CTM3, the CTM2 advection of chemical species iscalculated by the older second-order moment method (Prather,1986). Convective transport is similar to CTM3, but does not usedetrainment rates from meteorological data, thus having a some-what more effective transport to higher altitudes (Søvde et al.,2012). Turbulent mixing is treated as in CTM3; according to theHoltslag K-profile scheme (Holtslag et al., 1990).
Surface emissions are the same as for CTM3. NOx emissionsfrom lightning differ from CTM3, and are coupled on-line to the
O.A. Søvde et al. / Atmospheric Environment 95 (2014) 468e479 471
convection in the model using the parameterisation proposed byPrice et al. (1997), along with their seasonal variation, asdescribed by Berntsen and Isaksen (1999). In this work, we haveupdated the vertical distribution of lightning NOx emissions to bethe same as in Oslo CTM3. The old treatment often placedlightning NOx at too high altitudes, even into the stratosphere.Effectively, the new treatment reduces UTLS NOx, giving largerimpact of the aircraft NOx emissions. This update is further dis-cussed in SM Sect. S3.
3. Aircraft emissions
REACT4C aircraft emissions inventories are produced using theFAST global aircraft movements and emissions model, one of themodels approved for use by the International Civil Aviation Orga-nization (ICAO)’s Committee on Aviation Environmental Protection(CAEP) Modelling and Database Group (MDG) (ICAO, 2013). FASThas been previously used in various applications such as the im-pacts of emissions trends (Lee et al., 2009; Owen et al., 2010; Olsenet al., 2013) and NOx impacts on atmospheric chemistry (Gausset al., 2006; Skowron et al., 2013).
The base case inventory is generated from 6 weeks of flightmovements data from the year 2006, derived for the CAEP Round 8(CAEP/8) MDG work programme (ICAO/CAEP, 2009), and found tobe representative when extrapolated to an annual basis. Movementdata are compiled from radar data of North American and Europeanairspace, which covers ~80% of global civil aviation traffic. Theremaining movements from the rest of the world are obtained fromthe Official Airline Guide (OAG). All flights were assumed to followgreat circle trajectories, but with distance (and consequently fuel)correction applied using an empirical formula derived during theCAEP/8 Goals Modeling Work (ICAO/CAEP, 2009). This great circlecorrection is used to estimate actual distance and fuel burnt. Theaircraft emissions are modelled using 42 aircraft types represen-tative of the 2006 global fleet.
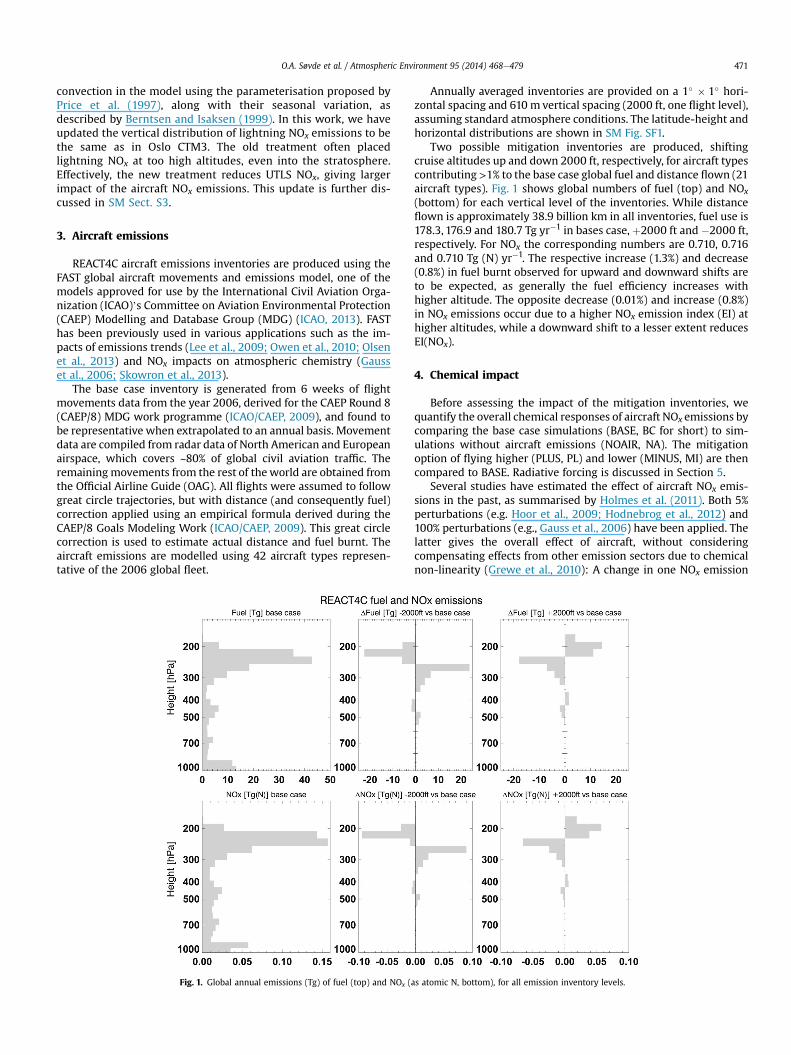
Fig. 1. Global annual emissions (Tg) of fuel (top) and NOx (a
Annually averaged inventories are provided on a 1� � 1� hori-zontal spacing and 610 m vertical spacing (2000 ft, one flight level),assuming standard atmosphere conditions. The latitude-height andhorizontal distributions are shown in SM Fig. SF1.
Two possible mitigation inventories are produced, shiftingcruise altitudes up and down 2000 ft, respectively, for aircraft typescontributing >1% to the base case global fuel and distance flown (21aircraft types). Fig. 1 shows global numbers of fuel (top) and NOx
(bottom) for each vertical level of the inventories. While distanceflown is approximately 38.9 billion km in all inventories, fuel use is178.3, 176.9 and 180.7 Tg yr�1 in bases case, þ2000 ft and �2000 ft,respectively. For NOx the corresponding numbers are 0.710, 0.716and 0.710 Tg (N) yr�1. The respective increase (1.3%) and decrease(0.8%) in fuel burnt observed for upward and downward shifts areto be expected, as generally the fuel efficiency increases withhigher altitude. The opposite decrease (0.01%) and increase (0.8%)in NOx emissions occur due to a higher NOx emission index (EI) athigher altitudes, while a downward shift to a lesser extent reducesEI(NOx).
4. Chemical impact
Before assessing the impact of the mitigation inventories, wequantify the overall chemical responses of aircraft NOx emissions bycomparing the base case simulations (BASE, BC for short) to sim-ulations without aircraft emissions (NOAIR, NA). The mitigationoption of flying higher (PLUS, PL) and lower (MINUS, MI) are thencompared to BASE. Radiative forcing is discussed in Section 5.
Several studies have estimated the effect of aircraft NOx emis-sions in the past, as summarised by Holmes et al. (2011). Both 5%perturbations (e.g. Hoor et al., 2009; Hodnebrog et al., 2012) and100% perturbations (e.g., Gauss et al., 2006) have been applied. Thelatter gives the overall effect of aircraft, without consideringcompensating effects from other emission sectors due to chemicalnon-linearity (Grewe et al., 2010): A change in one NOx emission
s atomic N, bottom), for all emission inventory levels.
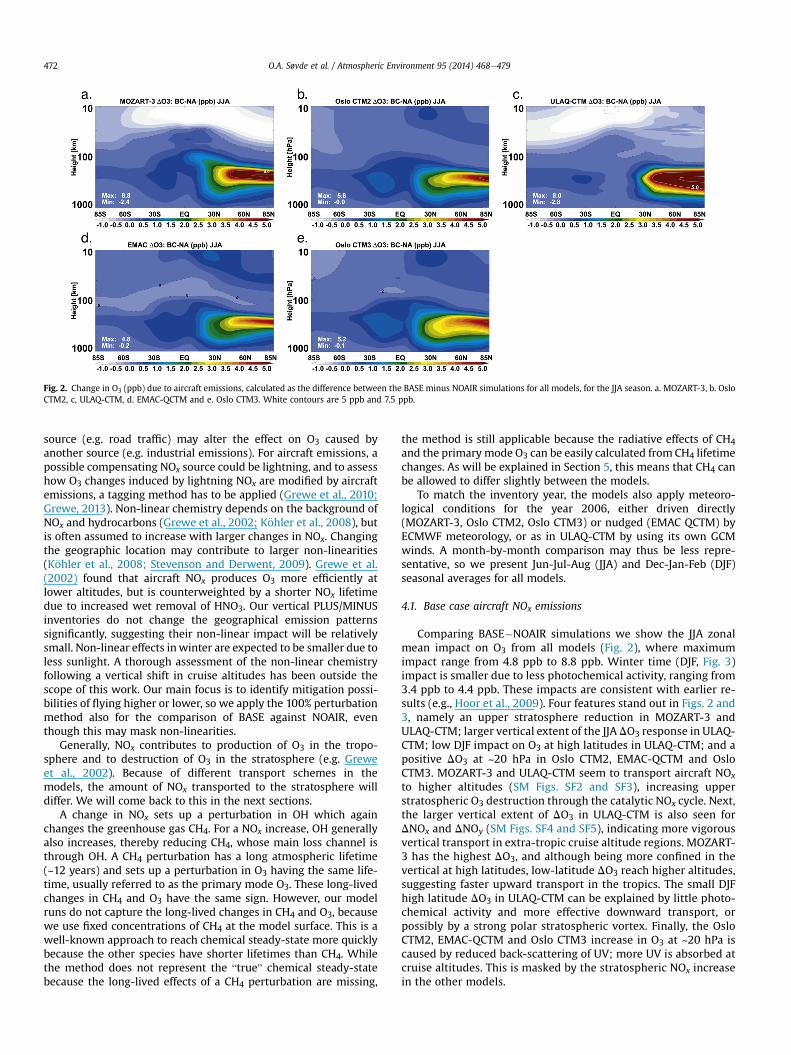
Fig. 2. Change in O3 (ppb) due to aircraft emissions, calculated as the difference between the BASE minus NOAIR simulations for all models, for the JJA season. a. MOZART-3, b. OsloCTM2, c, ULAQ-CTM, d. EMAC-QCTM and e. Oslo CTM3. White contours are 5 ppb and 7.5 ppb.
O.A. Søvde et al. / Atmospheric Environment 95 (2014) 468e479472
source (e.g. road traffic) may alter the effect on O3 caused byanother source (e.g. industrial emissions). For aircraft emissions, apossible compensating NOx source could be lightning, and to assesshow O3 changes induced by lightning NOx are modified by aircraftemissions, a tagging method has to be applied (Grewe et al., 2010;Grewe, 2013). Non-linear chemistry depends on the background ofNOx and hydrocarbons (Grewe et al., 2002; K€ohler et al., 2008), butis often assumed to increase with larger changes in NOx. Changingthe geographic location may contribute to larger non-linearities(K€ohler et al., 2008; Stevenson and Derwent, 2009). Grewe et al.(2002) found that aircraft NOx produces O3 more efficiently atlower altitudes, but is counterweighted by a shorter NOx lifetimedue to increased wet removal of HNO3. Our vertical PLUS/MINUSinventories do not change the geographical emission patternssignificantly, suggesting their non-linear impact will be relativelysmall. Non-linear effects inwinter are expected to be smaller due toless sunlight. A thorough assessment of the non-linear chemistryfollowing a vertical shift in cruise altitudes has been outside thescope of this work. Our main focus is to identify mitigation possi-bilities of flying higher or lower, so we apply the 100% perturbationmethod also for the comparison of BASE against NOAIR, eventhough this may mask non-linearities.
Generally, NOx contributes to production of O3 in the tropo-sphere and to destruction of O3 in the stratosphere (e.g. Greweet al., 2002). Because of different transport schemes in themodels, the amount of NOx transported to the stratosphere willdiffer. We will come back to this in the next sections.
A change in NOx sets up a perturbation in OH which againchanges the greenhouse gas CH4. For a NOx increase, OH generallyalso increases, thereby reducing CH4, whose main loss channel isthrough OH. A CH4 perturbation has a long atmospheric lifetime(~12 years) and sets up a perturbation in O3 having the same life-time, usually referred to as the primary mode O3. These long-livedchanges in CH4 and O3 have the same sign. However, our modelruns do not capture the long-lived changes in CH4 and O3, becausewe use fixed concentrations of CH4 at the model surface. This is awell-known approach to reach chemical steady-state more quicklybecause the other species have shorter lifetimes than CH4. Whilethe method does not represent the “true” chemical steady-statebecause the long-lived effects of a CH4 perturbation are missing,
the method is still applicable because the radiative effects of CH4and the primary mode O3 can be easily calculated from CH4 lifetimechanges. As will be explained in Section 5, this means that CH4 canbe allowed to differ slightly between the models.
To match the inventory year, the models also apply meteoro-logical conditions for the year 2006, either driven directly(MOZART-3, Oslo CTM2, Oslo CTM3) or nudged (EMAC QCTM) byECMWF meteorology, or as in ULAQ-CTM by using its own GCMwinds. A month-by-month comparison may thus be less repre-sentative, so we present Jun-Jul-Aug (JJA) and Dec-Jan-Feb (DJF)seasonal averages for all models.
4.1. Base case aircraft NOx emissions
Comparing BASE�NOAIR simulations we show the JJA zonalmean impact on O3 from all models (Fig. 2), where maximumimpact range from 4.8 ppb to 8.8 ppb. Winter time (DJF, Fig. 3)impact is smaller due to less photochemical activity, ranging from3.4 ppb to 4.4 ppb. These impacts are consistent with earlier re-sults (e.g., Hoor et al., 2009). Four features stand out in Figs. 2 and3, namely an upper stratosphere reduction in MOZART-3 andULAQ-CTM; larger vertical extent of the JJA DO3 response in ULAQ-CTM; low DJF impact on O3 at high latitudes in ULAQ-CTM; and apositive DO3 at ~20 hPa in Oslo CTM2, EMAC-QCTM and OsloCTM3. MOZART-3 and ULAQ-CTM seem to transport aircraft NOx
to higher altitudes (SM Figs. SF2 and SF3), increasing upperstratospheric O3 destruction through the catalytic NOx cycle. Next,the larger vertical extent of DO3 in ULAQ-CTM is also seen forDNOx and DNOy (SM Figs. SF4 and SF5), indicating more vigorousvertical transport in extra-tropic cruise altitude regions. MOZART-3 has the highest DO3, and although being more confined in thevertical at high latitudes, low-latitude DO3 reach higher altitudes,suggesting faster upward transport in the tropics. The small DJFhigh latitude DO3 in ULAQ-CTM can be explained by little photo-chemical activity and more effective downward transport, orpossibly by a strong polar stratospheric vortex. Finally, the OsloCTM2, EMAC-QCTM and Oslo CTM3 increase in O3 at ~20 hPa iscaused by reduced back-scattering of UV; more UV is absorbed atcruise altitudes. This is masked by the stratospheric NOx increasein the other models.

Fig. 3. Change in O3 (ppb) due to aircraft emissions, calculated as the difference between the BASE minus NOAIR simulations for all models, for the DJF season.
O.A. Søvde et al. / Atmospheric Environment 95 (2014) 468e479 473
Except for being transported to high altitudes in MOZART-3 andULAQ-CTM, the modelled NOx ¼ NO þ NO2 is largely consistentbetween the models, with JJA maxima of about 47e64 ppb, exceptULAQ-CTM which has about twice this value. In winter the modelsagree better on maximum values (56e70 ppb), which is shifted tomid-latitudes due to lack of sunlight at high latitudes. In general,the models agree on tropospheric NOx and the inter-hemispherictransport. Similar features are found in NOy and all non-HNO3 ni-trogen species (SM Figs. SF4eSF7). Larger impacts are accompaniedby higher background values of NOx and NOy (SM Figs. SF10eSF17),indicating slower removal of atmospheric NOy in ULAQ-CTM thanin the other models. Higher background NOx could also result in asmaller O3 production efficiency.
Model differences in O3 are thus mainly due to differences intransport or wet scavenging of NOx or O3 itself. These processes areimportant for determining the background distributions. Thetransport differences between the models should be sorted out inthe future; it has unfortunately been out of scope of this work. OsloCTM2 has typically lower background NOx than Oslo CTM3, therebyhaving a larger impact of aircraft NOx on O3 (SM Figs. SF10eSF12and Figs. SF14eSF16). Such changes are e.g. due to less wetremoval of HNO3, or slightly higher winter time NOx emissionsfrom lightning (Søvde et al., 2012), and should be expected to differin the other models also.
All models except ULAQ-CTM have the largest impact on NOx
and NOy in winter when aircraft at high latitudes fly morefrequently in the stratosphere due to a lower tropopause, andhence the aircraft emissions are less subject to tropospheric wetremoval. The reverse seasonal cycle in ULAQ-CTM is probably dueto more removal of HNO3 on ice cirrus during winter, but less wetscavenging during summer.
4.2. Plus 2000 ft aircraft NOx emissions
The O3 impact of increasing cruise altitude by 2000 ft is shownin Figs. 4 and 5, for JJA and DJF, respectively. In the region ofmaximum impact, i.e. 30�Ne90�N at ~200 hPa, the JJA DO3 is about2 ppb compared to the BASE case. DJFDO3 is expectedly smaller dueto reduced photochemical activity, giving increases of up to0.4e1.2 ppb compared to BASE. Otherwise, DJF and JJA show similarfeatures. Oslo CTM2 and Oslo CTM3 have the largest winter time
impact on DO3, probably due to the lower background NOx givingmore effective O3 production.
Compared to BASE, all models show O3 reductions at higherstratospheric altitudes, with largest impacts for the models havinglargest stratospheric impact in BASE�NOAIR. An upward shift ofcruise altitude reduces tropospheric NOx, and thus slightly O3. Thisreduction is largest in ULAQ-CTM where it also stretches equator-wards. Oslo CTM2 and CTM3, however, have no visible tropo-spheric reduction in the JJA zonal mean. On average, our modelsshow an O3 column increase of ~0.03 DU, consistent with previousstudies (Gauss et al., 2006; Fr€omming et al., 2012). An increase isalso consistent with K€ohler et al. (2008).
In the region of maximum aircraft impact, a dipole structure canbe seen in ULAQ-CTM (30�N, 275 hPa, Fig. 4), showing up moreclearly in DNOx and D(NOyeHNO3) (SM Figs. SF18eSF21). The DNOx
dipole is also seen in MOZART-3 and EMAC QCTM in JJA and in allmodels in DJF. The winter time dipole structures show up moreclearly because more emissions are emitted in the stratospherewhere the stable air acts to keep the sharp gradients in the vertical.This also applies for the mentioned dipole structures for O3.Although the dipole is tilted differently in ULAQ-CTM, all modelsare generally consistent when it comes to changes in reactive ni-trogen species.
Cruise region NOx changes vary from �4% to ~10% in summerand �10% to ~30% in winter (SM Figs. SF24eSF25), suggesting thatnon-linearities play a small role in summer butmay be important inwinter. We also note that the small winter DNOy in ULAQ-CTM (SMFigs. SF23 and SF5) is probably due to more efficient HNO3 loss oncirrus ice in winter.
4.3. Minus 2000 ft aircraft emissions
Lowering the cruise altitude by 2000 ft reduces the impact onO3 (Figs. 6 and 7). In the region of maximum impact, summertime DO3 is reduced by up to 1e2 ppb compared to the BASEcase. This reduction is smaller in winter due to less photo-chemical activity.
In general, this response is almost opposite of PLUS�BASE. Themodels show an increase in upper-stratospheric O3, most pro-nounced in the models where BASE�NOAIR has the strongeststratospheric impact. A slight increase in O3 in the lower
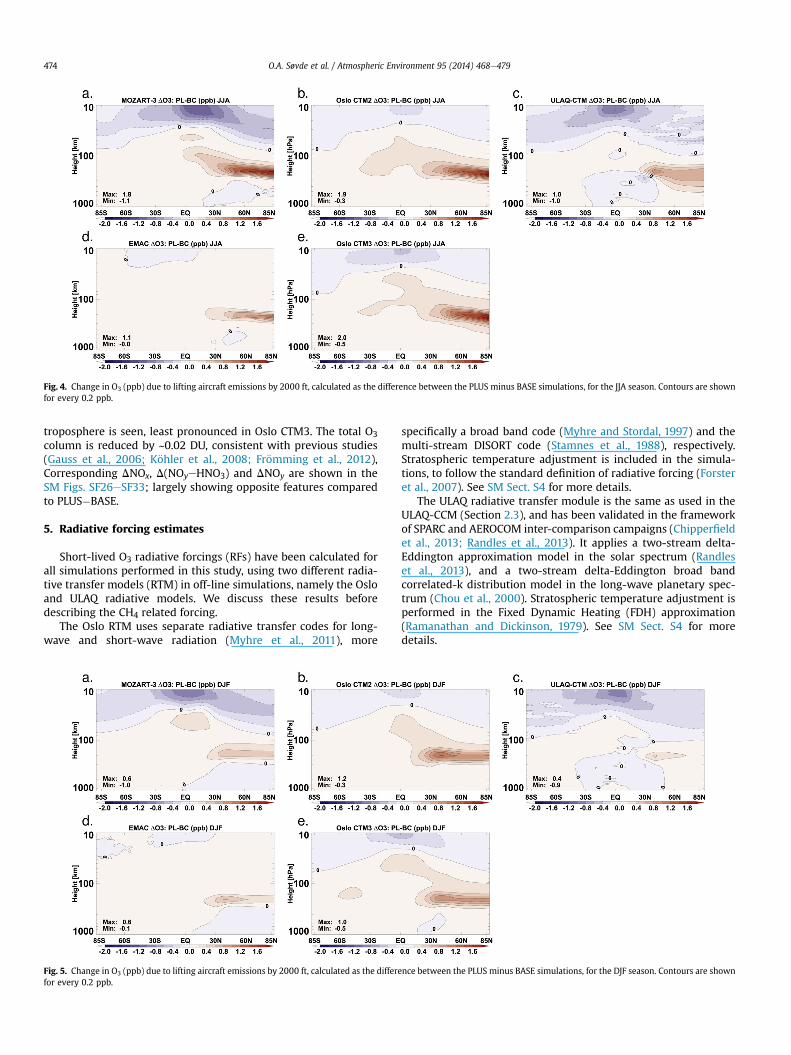
Fig. 4. Change in O3 (ppb) due to lifting aircraft emissions by 2000 ft, calculated as the difference between the PLUS minus BASE simulations, for the JJA season. Contours are shownfor every 0.2 ppb.
O.A. Søvde et al. / Atmospheric Environment 95 (2014) 468e479474
troposphere is seen, least pronounced in Oslo CTM3. The total O3column is reduced by ~0.02 DU, consistent with previous studies(Gauss et al., 2006; K€ohler et al., 2008; Fr€omming et al., 2012),Corresponding DNOx, D(NOyeHNO3) and DNOy are shown in theSM Figs. SF26eSF33; largely showing opposite features comparedto PLUS�BASE.
5. Radiative forcing estimates
Short-lived O3 radiative forcings (RFs) have been calculated forall simulations performed in this study, using two different radia-tive transfer models (RTM) in off-line simulations, namely the Osloand ULAQ radiative models. We discuss these results beforedescribing the CH4 related forcing.
The Oslo RTM uses separate radiative transfer codes for long-wave and short-wave radiation (Myhre et al., 2011), more
Fig. 5. Change in O3 (ppb) due to lifting aircraft emissions by 2000 ft, calculated as the differefor every 0.2 ppb.
specifically a broad band code (Myhre and Stordal, 1997) and themulti-stream DISORT code (Stamnes et al., 1988), respectively.Stratospheric temperature adjustment is included in the simula-tions, to follow the standard definition of radiative forcing (Forsteret al., 2007). See SM Sect. S4 for more details.
The ULAQ radiative transfer module is the same as used in theULAQ-CCM (Section 2.3), and has been validated in the frameworkof SPARC and AEROCOM inter-comparison campaigns (Chipperfieldet al., 2013; Randles et al., 2013). It applies a two-stream delta-Eddington approximation model in the solar spectrum (Randleset al., 2013), and a two-stream delta-Eddington broad bandcorrelated-k distribution model in the long-wave planetary spec-trum (Chou et al., 2000). Stratospheric temperature adjustment isperformed in the Fixed Dynamic Heating (FDH) approximation(Ramanathan and Dickinson, 1979). See SM Sect. S4 for moredetails.
nce between the PLUS minus BASE simulations, for the DJF season. Contours are shown

Fig. 6. Change in O3 (ppb) due to lowering aircraft emissions by 2000 ft, calculated as the difference between the MINUS minus BASE simulations, for the JJA season. Contours areshown for every 0.2 ppb.
O.A. Søvde et al. / Atmospheric Environment 95 (2014) 468e479 475
Annual RFs for short-lived O3 are listed in Table 1 for all modelruns, separated into short wave forcing (SW), long wave forcingadjusted for stratospheric temperature change (LW) and netforcing (Net), showing that the two RTMs agree fairly well,especially for LW. For the BASE�NOAIR, our models produce netannual RF ranging from 16.4 mW m�2 to 23.5 mW m�2, with amean of ~19.5 mW m�2. MOZART-3 has the smallest RF due tothe smallest SW contribution, even though its LW forcing isslightly higher than for ULAQ-CTM. Oslo CTM2 and CTM3 havehigher RFs, and differ internally by about 1.3 mW m�2, mainlycaused by LW. Net RF between the RTMs differs by about 0e5%,while LW about 5e15% and SW 15e20%. This is in line withStevenson et al. (2013).
Annual mean RF differences between the models mainly origi-nate during winter time, while in summer the models agree better(SM Sect. S5). Noticeable lower winter time RFs in ULAQ-CTM and
Fig. 7. Change in O3 (ppb) due to lowering aircraft emissions by 2000 ft, calculated as the dishown for every 0.2 ppb.
partly in MOZART-3 correspond well with their smaller tropical O3perturbations in the zonal means, and can also be seen in thehorizontal RF distribution (SM Sect. S5). This strengthens theindication that ULAQ-CTM and to some extent MOZART-3 havestronger tropical upwelling than the other models. We also notethat relative differences in monthly O3 RF between the RTMs aresimilar to their annual mean differences.
Scaling to 1 Tg (N) yr�1 emissions, we find the short-lived O3 RFfrom aircraft to be 27.4 mW m�2, comparing well with the27.3 ± 9.7 mW m�2 of Holmes et al. (2011). Our results are some-what higher than the QUANTIFY studies (Myhre et al., 2011;Hodnebrog et al., 2012) giving ~21 mW m�2, i.e. we have a highersensitivity per emission. However, because of the differences inspatial and temporal distribution of REACT4C and QUANTIFYemissions, such a direct comparison should be carried out with care(Skowron et al., 2013).
fference between the MINUS minus BASE simulations, for the DJF season. Contours are
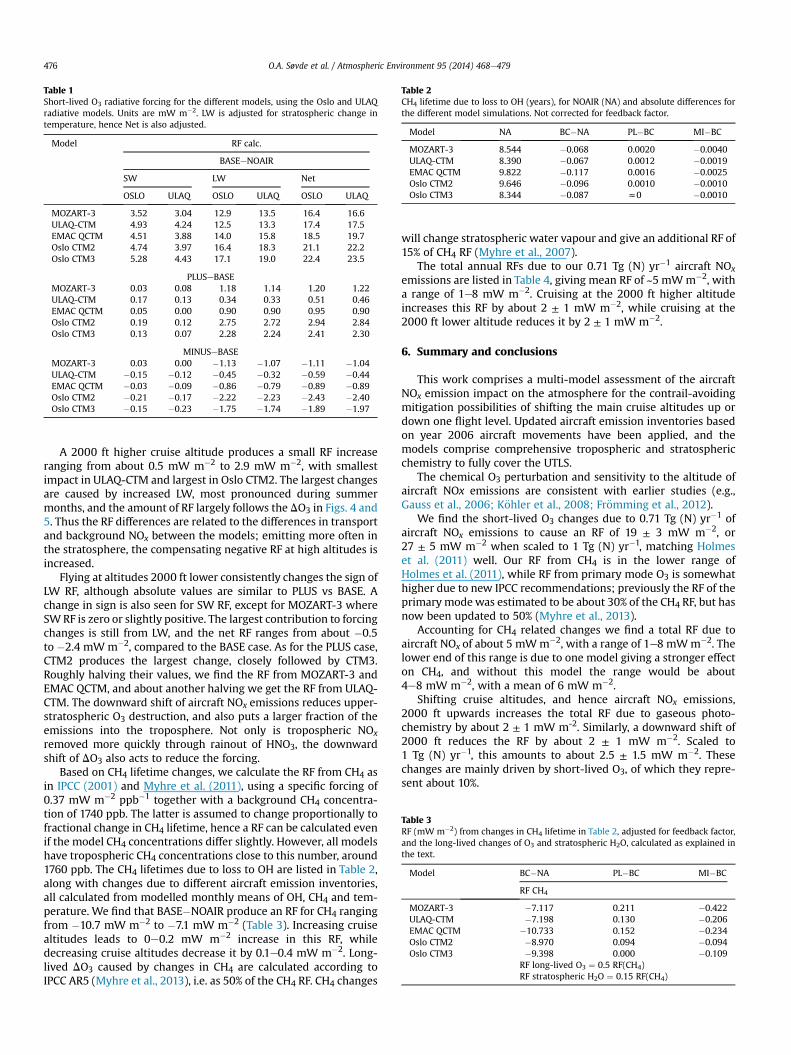
Table 1Short-lived O3 radiative forcing for the different models, using the Oslo and ULAQradiative models. Units are mW m�2. LW is adjusted for stratospheric change intemperature, hence Net is also adjusted.
Model RF calc.
BASEeNOAIR
SW LW Net
OSLO ULAQ OSLO ULAQ OSLO ULAQ
MOZART-3 3.52 3.04 12.9 13.5 16.4 16.6ULAQ-CTM 4.93 4.24 12.5 13.3 17.4 17.5EMAC QCTM 4.51 3.88 14.0 15.8 18.5 19.7Oslo CTM2 4.74 3.97 16.4 18.3 21.1 22.2Oslo CTM3 5.28 4.43 17.1 19.0 22.4 23.5
PLUSeBASEMOZART-3 0.03 0.08 1.18 1.14 1.20 1.22ULAQ-CTM 0.17 0.13 0.34 0.33 0.51 0.46EMAC QCTM 0.05 0.00 0.90 0.90 0.95 0.90Oslo CTM2 0.19 0.12 2.75 2.72 2.94 2.84Oslo CTM3 0.13 0.07 2.28 2.24 2.41 2.30
MINUSeBASEMOZART-3 0.03 0.00 �1.13 �1.07 �1.11 �1.04ULAQ-CTM �0.15 �0.12 �0.45 �0.32 �0.59 �0.44EMAC QCTM �0.03 �0.09 �0.86 �0.79 �0.89 �0.89Oslo CTM2 �0.21 �0.17 �2.22 �2.23 �2.43 �2.40Oslo CTM3 �0.15 �0.23 �1.75 �1.74 �1.89 �1.97
Table 2CH4 lifetime due to loss to OH (years), for NOAIR (NA) and absolute differences forthe different model simulations. Not corrected for feedback factor.
Model NA BC�NA PL�BC MI�BC
MOZART-3 8.544 �0.068 0.0020 �0.0040ULAQ-CTM 8.390 �0.067 0.0012 �0.0019EMAC QCTM 9.822 �0.117 0.0016 �0.0025Oslo CTM2 9.646 �0.096 0.0010 �0.0010Oslo CTM3 8.344 �0.087 z0 �0.0010
Table 3RF (mW m�2) from changes in CH4 lifetime in Table 2, adjusted for feedback factor,and the long-lived changes of O3 and stratospheric H2O, calculated as explained inthe text.
Model BC�NA PL�BC MI�BC
RF CH4
MOZART-3 �7.117 0.211 �0.422ULAQ-CTM �7.198 0.130 �0.206EMAC QCTM �10.733 0.152 �0.234Oslo CTM2 �8.970 0.094 �0.094Oslo CTM3 �9.398 0.000 �0.109
RF long-lived O3 ¼ 0.5 RF(CH4)RF stratospheric H2O ¼ 0.15 RF(CH4)
O.A. Søvde et al. / Atmospheric Environment 95 (2014) 468e479476
A 2000 ft higher cruise altitude produces a small RF increaseranging from about 0.5 mW m�2 to 2.9 mW m�2, with smallestimpact in ULAQ-CTM and largest in Oslo CTM2. The largest changesare caused by increased LW, most pronounced during summermonths, and the amount of RF largely follows the DO3 in Figs. 4 and5. Thus the RF differences are related to the differences in transportand background NOx between the models; emitting more often inthe stratosphere, the compensating negative RF at high altitudes isincreased.
Flying at altitudes 2000 ft lower consistently changes the sign ofLW RF, although absolute values are similar to PLUS vs BASE. Achange in sign is also seen for SW RF, except for MOZART-3 whereSWRF is zero or slightly positive. The largest contribution to forcingchanges is still from LW, and the net RF ranges from about �0.5to �2.4 mW m�2, compared to the BASE case. As for the PLUS case,CTM2 produces the largest change, closely followed by CTM3.Roughly halving their values, we find the RF from MOZART-3 andEMAC QCTM, and about another halving we get the RF from ULAQ-CTM. The downward shift of aircraft NOx emissions reduces upper-stratospheric O3 destruction, and also puts a larger fraction of theemissions into the troposphere. Not only is tropospheric NOx
removed more quickly through rainout of HNO3, the downwardshift of DO3 also acts to reduce the forcing.
Based on CH4 lifetime changes, we calculate the RF from CH4 asin IPCC (2001) and Myhre et al. (2011), using a specific forcing of0.37 mW m�2 ppb�1 together with a background CH4 concentra-tion of 1740 ppb. The latter is assumed to change proportionally tofractional change in CH4 lifetime, hence a RF can be calculated evenif the model CH4 concentrations differ slightly. However, all modelshave tropospheric CH4 concentrations close to this number, around1760 ppb. The CH4 lifetimes due to loss to OH are listed in Table 2,along with changes due to different aircraft emission inventories,all calculated from modelled monthly means of OH, CH4 and tem-perature. We find that BASE�NOAIR produce an RF for CH4 rangingfrom �10.7 mW m�2 to �7.1 mW m�2 (Table 3). Increasing cruisealtitudes leads to 0e0.2 mW m�2 increase in this RF, whiledecreasing cruise altitudes decrease it by 0.1e0.4 mW m�2. Long-lived DO3 caused by changes in CH4 are calculated according toIPCC AR5 (Myhre et al., 2013), i.e. as 50% of the CH4 RF. CH4 changes
will change stratospheric water vapour and give an additional RF of15% of CH4 RF (Myhre et al., 2007).
The total annual RFs due to our 0.71 Tg (N) yr�1 aircraft NOx
emissions are listed in Table 4, giving mean RF of ~5 mWm�2, witha range of 1e8 mW m�2. Cruising at the 2000 ft higher altitudeincreases this RF by about 2 ± 1 mW m�2, while cruising at the2000 ft lower altitude reduces it by 2 ± 1 mW m�2.
6. Summary and conclusions
This work comprises a multi-model assessment of the aircraftNOx emission impact on the atmosphere for the contrail-avoidingmitigation possibilities of shifting the main cruise altitudes up ordown one flight level. Updated aircraft emission inventories basedon year 2006 aircraft movements have been applied, and themodels comprise comprehensive tropospheric and stratosphericchemistry to fully cover the UTLS.
The chemical O3 perturbation and sensitivity to the altitude ofaircraft NOx emissions are consistent with earlier studies (e.g.,Gauss et al., 2006; K€ohler et al., 2008; Fr€omming et al., 2012).
We find the short-lived O3 changes due to 0.71 Tg (N) yr�1 ofaircraft NOx emissions to cause an RF of 19 ± 3 mW m�2, or27 ± 5 mW m�2 when scaled to 1 Tg (N) yr�1, matching Holmeset al. (2011) well. Our RF from CH4 is in the lower range ofHolmes et al. (2011), while RF from primary mode O3 is somewhathigher due to new IPCC recommendations; previously the RF of theprimary modewas estimated to be about 30% of the CH4 RF, but hasnow been updated to 50% (Myhre et al., 2013).
Accounting for CH4 related changes we find a total RF due toaircraft NOx of about 5 mWm�2, with a range of 1e8 mWm�2. Thelower end of this range is due to one model giving a stronger effecton CH4, and without this model the range would be about4e8 mW m�2, with a mean of 6 mW m�2.
Shifting cruise altitudes, and hence aircraft NOx emissions,2000 ft upwards increases the total RF due to gaseous photo-chemistry by about 2 ± 1 mW m-2. Similarly, a downward shift of2000 ft reduces the RF by about 2 ± 1 mW m�2. Scaled to1 Tg (N) yr�1, this amounts to about 2.5 ± 1.5 mW m�2. Thesechanges are mainly driven by short-lived O3, of which they repre-sent about 10%.
Table 4Total changes in RF (mW m�2) from short-lived O3, long-lived O3, CH4 and the in-crease of stratospheric H2O due to CH4 changes. To include the range of RF for short-lived O3 from both RTMs, two numbers are listed for each entry.
Model BC�NA PL BC MI�BC
MOZART-3 4.65/4.81 1.55/1.57 �1.80/�1.73ULAQ-CTM 5.32/5.52 0.75/0.77 �0.92/�0.80EMAC QCTM 0.83/1.99 1.20/1.15 �1.27/�1.27Oslo CTM2 6.30/7.43 3.09/2.99 �2.59/�2.55Oslo CTM3 6.88/7.95 2.41/2.30 �2.07/�1.97Mean 5.2 1.8 �1.8
O.A. Søvde et al. / Atmospheric Environment 95 (2014) 468e479 477
We have not assessed the potential of aircraft aerosol emissionsto affect the radiative budget. Aerosols may absorb or scatter light,and also have an impact on NOx by providing surfaces for conver-sion to HNO3. The latter effect is small and reduces the aircraft-induced O3 by ~10% (Iachetti et al., 2014, personal communica-tion, in preparation).
Burkhardt and K€archer (2011) found AIC RF to be about31 mW m�2, and Myhre et al. (2013) suggest 50 mW m�2. WhileFr€omming et al. (2012) and Fichter et al. (2005) studied cruisealtitude shifts and found linear contrail RF changes smaller orcomparable to RF of short-lived O3, the linear contrail RF is onlyabout 10% of total contrail cirrus RF (Burkhardt and K€archer, 2011).Thus, the potential for AIC RF changes is larger; if it can be reducedsubstantially by flying higher or lower, the accompanying NOx-related RF will be small. As explained in Section 3, the long-livedCO2 will also be affected by a vertical cruise altitude shift. Howev-er, comparing RFs with very different lifetimes requires a choice ofemission scenario and also a time horizon. Lee et al. (2010) foundthe historically accumulated RF(CO2) to be 28 mWm�2, which is ofthe order of the short-lived O3 instantaneous RF, meaning thateventually CO2 will control the total aviation climate impact. Ourvertical shifts in cruise altitudes change aircraft CO2 emissions byless than 1%, and using specific RF from Myhre et al. (2013) thefollowing changes in instantaneous annual RF(CO2) are about0.01 mW m�2 yr�1, which is small compared to the NOx and AICRFs. Assuming sustained aircraft emissions, the consequentialchange in surface temperature when flying higher or lower willmainly be caused by NOx and AIC, even after 100 years. We stress,however, that CO2 is still important for the total climate impact ofaircraft.
A contrail study could in principle be set up for our inventories,but this has been outside the scope of our work. Also, there are veryfew models calculating aerosol and cirrus effects; building a multi-model comparison for these would increase the confidence in theirresults.
Acknowledgements
This work was carried out within the EU project REACT4C, grantnumber ACP8-GA-2009-233772. We acknowledge Emily Gray forstarting the work on MOZART-3.
Appendix A. Supplementary data
Supplementary data related to this article can be found at http://dx.doi.org/10.1016/j.atmosenv.2014.06.049.
References
Berglen, T.F., Berntsen, T.K., Isaksen, I.S.A., Sundet, J.K., 2004. A global model of thecoupled sulfur/oxidant chemistry in the troposphere: the sulfur cycle.J. Geophys. Res. 109 (D19310), D19310. http://dx.doi.org/10.1029/2003JD003948.
Berntsen, T., Fuglestvedt, J., Myhre, G., Stordal, F., Berglen, T.F., 2006. Abatement ofgreenhouse gases: does location matter? Clim. Change 74 (4), 377e411. http://dx.doi.org/10.1007/s10584-006-0433-4.
Berntsen, T., Isaksen, I.S.A., 1997. A global 3-D chemical transport model for thetroposphere, 1, Model description and CO and Ozone results. J. Geophys. Res.102 (D17), 21239e21280. http://dx.doi.org/10.1029/97JD01140.
Berntsen, T.K., Isaksen, I.S.A., 1999. Effects of lightning and convection on changes inupper tropospheric ozone due to NOx emissions from aircraft. Tellus 51B,766e788. http://dx.doi.org/10.1034/j.1600-0889.1999.t01-3-00003.x.
Burkhardt, U., K€archer, B., 2011. Global radiative forcing from contrail cirrus. Nat.Clim. Change 1, 54e58. http://dx.doi.org/10.1038/nclimate1068.
Chipperfield, M., Liang, Q., Bekki, S., Douglass, A., Kinnison, D., Plummer, D.,Prather, M., Sinnhuber, B., 2013. Sparc Report No. 6: Lifetimes of StratosphericOzone-depleting Substances, Their Replacements, and Related Species, Chapter5: Model Estimates of Lifetimes. www.sparc-climate.org/publications/sparc-reports/sparc-report-no6/.
Chou, M.-D., Suarez, M.J., Liang, X.-Z., Yan, M.M.-H., 2000. Technical Report Series onGlobal Modeling and Data Assimilation, NASA/TM-2001-104606. A ThermalInfrared Radiation Parameterization for Atmospheric Studies, vol. 19.
Dameris, M., Grewe, V., K€ohler, I., Sausen, R., Brühl, C., Grooß, J.-U., Steil, B., 1998.Impact of aircraft NOx emissions on tropospheric and stratospheric ozone. PartII: 3-D model results. Atmos. Environ. 32 (18), 3185e3199. http://dx.doi.org/10.1016/S1352-2310(97)00505-0.
Deckert, R., J€ockel, P., Grewe, V., Gottschaldt, K.-D., Hoor, P., 2011. A quasi chemistry-transport model mode for EMAC. Geosci. Model Dev. 4 (1), 195e206. http://dx.doi.org/10.5194/gmd-4-195-2011.
Eyring, V., Butchart, N., Waugh, D.W., Akiyoshi, H., Austin, J., Bekki, S., Bodeker, G.E.,Boville, B.A., Br”uhl, C., Chipperfield, M.P., Cordero, E., Dameris, M., Deushi, M.,Fioletov, V.E., Frith, S.M., Garcia, R.R., Gettelman, A., Giorgetta, M.A., Grewe, V.,Jourdain, L., Kinnison, D.E., Mancini, E., Manzini, E., Marchand, M., Marsh, D.R.,Nagashima, T., Newman, P.A., Nielsen, J.E., Pawson, S., Pitari, G., Plummer, D.A.,Rozanov, E., Schraner, M., Shepherd, T.G., Shibata, K., Stolarski, R.S., Struthers, H.,Tian, W., Yoshiki, M., 2006. Assessment of temperature, trace species, and ozonein chemistry-climate model simulation of the recent past. J. Geophys. Res. 111,D22308. http://dx.doi.org/10.1029/2006JD007327.
Fichter, C., Marquart, S., Sausen, R., Lee, D.S., 2005. The impact of cruise altitude oncontrails and related radiative forcing. Meteorol. Z. 14 (4), 563e572. http://dx.doi.org/10.1127/0941-2948/2005/0048.
Forster, P., Ramaswamy, V., Artaxo, P., Berntsen, T., Betts, R., Fahey, D., Haywood, J.,Lean, J., Lowe, D., Myhre, G., Nganga, J., Prinn, R., Raga, G., Schulz, M., VanDorland, R., 2007. Contribution of working group i to the fourth assessmentreport of the intergovernmental panel on climate change. In: Solomon, S.,Qin, D., Manning, M., Chen, Z., Marquis, M., Averyt, K., Tignor, M., Miller, H.(Eds.), Climate Change 2007: the Physical Science Basis. Cambridge UniversityPress, Cambridge, United Kingdom and New York, NY, USA.
Forster, P.F., Shine, K.P., 1997. Radiative forcing and temperature trends fromstratospheric ozone changes. J. Geophys. Res. 102 (D9), 10841e10855. http://dx.doi.org/10.1029/96JD03510.
Fr€omming, C., Ponater, M., Dahlmann, K., Grewe, V., Lee, D.S., Sausen, R., 2012.Aviation-induced radiative forcing and surface temperature change in de-pendency of the emission altitude. J. Geophys. Res. 117 (D19), D19104. http://dx.doi.org/10.1029/2012JD018204.
Gauss, M., Isaksen, I.S.A., Lee, D.S., Søvde, O.A., 2006. Impact of aircraft NOx emis-sions on the atmosphere e tradeoffs to reduce the impact. Atmos. Chem. Phys.6, 1529e1548. http://dx.doi.org/10.5194/acp-6-1529-2006.
Gettelman, A., Kinnison, D.E., Brasseur, G., Dunkerton, T., 2004. Impact of monsooncirculations on the upper troposphere and lower stratosphere. J. Geophys. Res.109, D22101. http://dx.doi.org/10.1029/2004JD004878.
Granier, C., Lamarque, J.F., Mieville, A., Muller, J.F., Olivier, J., Orlando, J., Peters, J.,Petron, G., Tyndall, G., Wallens, S., 2005. POET, A Database of Surface Emissionsof Ozone Precursors. Available on internet at http://www.aero.jussieu.fr/projet/ACCENT/POET.php.
Grewe, V., 2013. A generalized tagging method. Geosci. Model Dev. 6 (1), 247e253.http://dx.doi.org/10.5194/gmd-6-247-2013.
Grewe, V., Brunner, D., Dameris, M., Grenfell, J.L., Hein, R., Shindell, D., Staehelin, J.,2001. Origin and variability of upper tropospheric nitrogen oxides and ozone atnorthern mid-latitudes. Atmos. Environ. 35 (20), 3421e3433. http://dx.doi.org/10.1016/S1352-2310(01)00134-0.
Grewe, V., Dameris, M., Fichter, C., Lee, D.S., 2002. Impact of aircraft NOx emissions.Part 2: effects of lowering the flight altitude. Meteorol. Z. 11 (3), 197e205.http://dx.doi.org/10.1127/0941-2948/2002/0011-0197.
Grewe, V., Stenke, A., Ponater, M., Sausen, R., Pitari, G., Iachetti, D., Rogers, H.,Dessens, O., Pyle, J., Isaksen, I.S.A., Gulstad, L., Søvde, O.A., Marizy, C.,Pascuillo, E., 2007. Climate impact of supersonic air traffic: an approach tooptimize a potential future supersonic fleet e Results from the EU-projectSCENIC. Atmos. Chem. Phys. 7, 5129e5145. http://dx.doi.org/10.5194/acp-7-5129-2007.
Grewe, V., Tsati, E., Hoor, P., 2010. On the attribution of contributions of atmospherictrace gases to emissions in atmospheric model applications. Geosci. Model Dev.3 (2), 487e499. http://dx.doi.org/10.5194/gmd-3-487-2010.
Hack, J.J., 1994. Parameterization of moist convection in the NCAR communityclimate model (CCM2). J. Geophys. Res. 99 (D3), 5551e5568. http://dx.doi.org/10.1029/93JD03478.
Hansen, J., Sato, M., Ruedy, R., 1997. Radiative forcing and climate response.J. Geophys. Res. 102, 6831e6864. http://dx.doi.org/10.1029/96JD03436.
O.A. Søvde et al. / Atmospheric Environment 95 (2014) 468e479478
Hesstvedt, E., 1974. Reduction of stratospheric ozone from high-flying aircraft,studied in a two-dimensional photochemical model with transport. Can. J.Chem. 52 (8), 1592e1598. http://dx.doi.org/10.1139/v74-231.
Hesstvedt, E., Hov, €O., Isaksen, I.S.A., 1978. Quasi steady-state approximation in airpollution modelling: comparison of two numerical schemes for oxidant pre-diction. Int. J. Chem. Kinetics X, 971e994. http://dx.doi.org/10.1002/kin.550100907.
Hidalgo, H., Crutzen, P.J., 1977. The tropospheric and stratospheric compositionperturbed by NOx emissions of high-altitude aircraft. J. Geophys. Res. 82,5833e5866. http://dx.doi.org/10.1029/JC082i037p05833.
Hodnebrog, Ø., Berntsen, T.K., Dessens, O., Gauss, M., Grewe, V., Isaksen, I.S.A.,Koffi, B., Myhre, G., Olivi�e, D., Prather, M.J., Stordal, F., Szopa, S., Tang, Q., vanVelthoven, P., Williams, J.E., 2012. Future impact of traffic emissions on atmo-spheric ozone and OH based on two scenarios. Atmos. Chem. Phys. 12 (24),12211e12225. http://dx.doi.org/10.5194/acp-12-12211-2012.
Holmes, C.D., Tang, Q., Prather, M.J., 2011. Uncertainties in climate assessment forthe case of aviation NO. Proc. Natl. Acad. Sci. 108 (27), 10997e11002. http://dx.doi.org/10.1073/pnas.1101458108.
Holtslag, A.A.M., DeBruijn, E.I.F., Pan, H.-L., 1990. A high resolution air mass trans-formation model for short-range weather forecasting. Mon. Wea. Rev. 118,1561e1575. http://dx.doi.org/10.1175/1520-0493(1990)118<1561:AHRAMT>2.0.CO;2.
Hoor, P., Borken-Kleefeld, J., Caro, D., Dessens, O., Endresen, O., Gauss, M., Grewe, V.,Hauglustaine, D., Isaksen, I.S.A., J€ockel, P., Lelieveld, J., Myhre, G., Meijer, E.,Olivie, D., Prather, M., Poberaj, C.S., Shine, K.P., Staehelin, J., Tang, Q., vanAardenne, J., van Velthoven, P., Sausen, R., 2009. The impact of traffic emissionson atmospheric ozone and OH: results from QUANTIFY. Atmos. Chem. Phys. 9,3113e3136. http://dx.doi.org/10.5194/acp-9-3113-2009.
ICAO, 2013. International Civil Aviation Organization. http://www.icao.int/environmental-protection/Pages/modelling-and-databases.aspx. last accessed(29.04.13.).
ICAO/CAEP, 2009. International Civil aviation Organization (ICAO)/Committee onAviation Environmental Protection (CAEP), Agenda Item 4: Modeling and Da-tabases Task Force (MODTF Goals Assessment Results. In: ICAO/CAEP WorkingPaper, Steering Group Meeting, Salvador, Brazil, 22e26 June 2009.
IPCC, 2001. Climate Change 2001: the Scientific Basis. Contribution of WorkingGroup I to the Third Assessment Report of the Intergovernmental Panel onClimate Change. Cambridge University Press, Cambridge, United Kingdom andNew York, NY, USA, p. 881.
Isaksen, I.S.A., Zerefos, C., Kourtidis, K., Meleti, C., Dalsøren, S.B., Sundet, J.K.,Grini, A., Zanis, P., Balis, D., 2005. Tropospheric ozone changes at unpolluted andsemipolluted regions induced by stratospheric ozone changes. J. Geophys. Res.110 (D2), D02302. http://dx.doi.org/10.1029/2004JD004618.
J€ockel, P., Kerkweg, A., Pozzer, A., Sander, R., Tost, H., Riede, H., Baumgaertner, A.,Gromov, S., Kern, B., 2010. Development cycle 2 of the Modular Earth SubmodelSystem (MESSY2). Geosci. Model Dev. 3 (2), 717e752. http://dx.doi.org/10.5194/gmd-3-717-2010.
J€ockel, P., Tost, H., Pozzer, A., Brühl, C., Buchholz, J., Ganzeveld, L., Hoor, P.,Kerkweg, A., Lawrence, M., Sander, R., Steil, B., Stiller, G., Tanarhte, M.,Taraborrelli, D., van Aardenne, J., Lelieveld, J., 2006. The atmospheric chemistrygeneral circulation model ECHAM5/MESSY1: consistent simulation of ozonefrom the surface to the mesosphere. Atmos. Chem. Phys. 6 (12), 5067e5104.http://dx.doi.org/10.5194/acp-6-5067-2006.
Johnson, C., Henshaw, J., McInnes, G., 1992. Impact of aircraft and surface emissionsof nitrogen oxides on tropospheric ozone and global warming. Nature 355(6355), 69e71. http://dx.doi.org/10.1038/355069a0.
Johnston, H.S., 1971. Reduction of stratospheric ozone by nitrogen oxide catalystsfrom supersonic transport exhaust. Science 173, 517e522. http://dx.doi.org/10.1126/science.173.3996.517.
K€archer, B., Lohmann, U., 2002. A parameterization of cirrus cloud formation: ho-mogeneous freezing of supercooled aerosols. J. Geophys. Res. 107, 4010,. http://dx.doi.org/10.1029/2001JD000470.
Kerkweg, A., 2005. Global Modelling of Atmospheric Halogen Chemistry in theMarine Boundary Layer. Ph.D. Thesis. University of Bonn, Germany. Available at:http://hss.ulb.uni-bonn.de/2005/0636/0636.htm.
Kinnison, D.E., Brausser, G.P., Walters, S., Garcia, R.R., Marsh, D.R., Sassi, F.,Harvey, V.L., Randall, C.E., Emmons, L., Lamarque, J.F., Hess, P., Orlando, J.J.,Tie, X.X., Randel, W., Pan, L.L., Gettelman, A., Granier, C., Diehl, T., Niemeier, U.,Simmons, A.J., 2007. Sensitivity of chemical tracers to meteorological parame-ters in the MOZART-3 chemical transport model. J. Geophys. Res. 112, D20302.http://dx.doi.org/10.1029/2006JD007879.
K€ohler, M.O., R€adel, G., Dessens, O., Shine, K.P., Rogers, H.L., Wild, O., Pyle, J.A., 2008.Impact of perturbations to nitrogen oxide emissions from global aviation.J. Geophys. Res. 113 (D11), D11305,. http://dx.doi.org/10.1029/2007JD009140.
K€ohler, M.O., R€adel, G., Shine, K.P., Rogers, H.L., Pyle, J.A., 2013. Latitudinal variationof the effect of aviation NOx emissions on atmospheric ozone and methane andrelated climate metrics. Atmos. Environ. 64, 1e9. http://dx.doi.org/10.1016/j.atmosenv.2012.09.013.
Lacis, A.A., Wuebbles, D.J., Logan, J.A., 1990. Radiative forcing of climate by changesin the vertical-distribution of ozone. J. Geophys. Res. 95, 9971e9981. http://dx.doi.org/10.1029/JD095iD07p09971.
Lamarque, J.-F., Bond, T.C., Eyring, V., Granier, C., Heil, A., Klimont, Z., Lee, D.,Liousse, C., Mieville, A., Owen, B., Schultz, M.G., Shindell, D., Smith, S.J.,Stehfest, E., Van Aardenne, J., Cooper, O.R., Kainuma, M., Mahowald, N.,McConnell, J.R., Naik, V., Riahi, K., van Vuuren, D.P., 2010. Historical
(1850e2000) gridded anthropogenic and biomass burning emissions of reac-tive gases and aerosols: methodology and application. Atmos. Chem. Phys. 10(15), 7017e7039. http://dx.doi.org/10.5194/acp-10-7017-2010.
Lee, D.S., Fahey, D.W., Forster, P.M., Newton, P.J., Wit, R.C.N., Lim, L.L., Owen, B.,Sausen, R., 2009. Aviation and global climate change in the 21st century. Atmos.Environ. 43 (34), 3520e3537. http://dx.doi.org/10.1016/j.atmosenv.2009.04.024.
Lee, D.S., Pitari, G., Grewe, V., Gierens, K., Penner, J.E., Petzold, A., Prather, M.J.,Schumann, U., Bais, A., Berntsen, T., Iachetti, D., Lim, L.L., Sausen, R., 2010.Transport impacts on atmosphere and climate: Aviation. Atmos. Environ. 44(37), 4678e4734. http://dx.doi.org/10.1016/j.atmosenv.2009.06.005.
Lin, S.J., Rood, R.B., 1996. A fast flux form semi-lagrangian transport scheme on thesphere. Mon. Weather Rev. 124, 2046e2070. http://dx.doi.org/10.1175/1520-0493(1996)124<2046:MFFSLT>2.0.CO;2.
Liu, Y., Liu, C.X., Wang, H.P., Tie, X.X., Gao, S.T., Kinnison, D., Brasseur, G., 2009.Atmospheric tracers during the 2003e2004 stratospheric warming event andimpact of ozone intrusions in the troposphere. Atmos. Chem. Phys. 9,2157e2170. http://dx.doi.org/10.5194/acp-9-2157-2009.
Lohmann, U., Roeckner, E., 1996. Design and performance of a new cloud micro-physics scheme developed for the ECHAM general circulation model. Clim.Dynam. 12, 557e572. http://dx.doi.org/10.1007/BF00207939.
Minschwaner, K., Salawitch, R.J., McElroy, M.B., 1993. Absorption of solar radiationby O2: implications for O3 and lifetimes of N2O, CFCl3, and CF2Cl2. J. Geophys.Res. 98, 10543e10561. http://dx.doi.org/10.1029/93JD00223.
Morgenstern, O., Giorgetta, M.A., Shibata, K., Eyring, V., Waugh, D.W.,Shepherd, T.G., Akiyoshi, H., Austin, J., Baumgaertner, A.J.G., Bekki, S.,Braesicke, P., Brühl, C., Chipperfield, M.P., Cugnet, D., Dameris, M.,Dhomse, S., Frith, S.M., Garny, H., Gettelman, A., Hardiman, S.C.,Hegglin, M.I., J€ockel, P., Kinnison, D.E., Lamarque, J.-F., Mancini, E.,Manzini, E., Marchand, M., Michou, M., Nakamura, T., Nielsen, J.E.,Olivi�e, D., Pitari, G., Plummer, D.A., Rozanov, E., Scinocca, J.F., Smale, D.,Teyss�edre, H., Toohey, M., Tian, W., Yamashita, Y., 2010. Review of theformulation of present-generation stratospheric chemistry-climate modelsand associated external forcings. J. Geophys. Res. 115, D00M02. http://dx.doi.org/10.1029/2009JD013728.
Myhre, G., Nilsen, J.S., Gulstad, L., Shine, K.P., Rognerud, B., Isaksen, I.S.A., 2007.Radiative forcing due to stratospheric water vapour from CH4 oxidation. Geo-phys. Res. Lett. 34, L01807. http://dx.doi.org/10.1029/2006GL027472.
Myhre, G., Shindell, D., Br�eon, F.-M., Collins, W., Fuglestvedt, J., Huang, J., Koch, D.,Lamarque, J.-F., Lee, D., Mendoza, B., Nakajima, T., Robock, A., Stephens, G.,Takemura, T., Zhang, H., 2013. Anthropogenic and natural radiative forcing.Climate Change 2013: the Physical Science Basis. Contribution of WorkingGroup I to the Fifth Assessment Report of the Intergovernmental Panel onClimate Change. Cambridge University Press, Cambridge, United Kingdom andNew York, NY, USA.
Myhre, G., Shine, K., R€adel, G., Gauss, M., Isaksen, I., Tang, Q., Prather, M., Williams, J.,van Velthoven, P., Dessens, O., Koffi, B., Szopa, S., Hoor, P., Grewe, V., Borken-Kleefeld, J., Berntsen, T., Fuglestvedt, J., 2011. Radiative forcing due to changes inozone and methane caused by the transport sector. Atmos. Environ. 45 (2),387e394. http://dx.doi.org/10.1016/j.atmosenv.2010.10.001.
Myhre, G., Stordal, F., 1997. Role of spatial and temporal variations in the compu-tation of radiative forcing and GWP. J. Geophys. Res. 102 (D10), 11181e11200.http://dx.doi.org/10.1029/97JD00148.
Olsen, S.C., Wuebbles, D.J., Owen, B., 2013. Comparison of global 3-D aviationemissions datasets. Atmos. Chem. Phys. 13, 429e442. http://dx.doi.org/10.5194/acp-13-429-2013.
Owen, B., Lee, D.S., Lim, L., 2010. Flying into the Future: Aviation Emissions Sce-narios to 2050. Environ. Sci. Technol. 44 (7), 2255e2260. http://dx.doi.org/10.1021/es902530z.
Park, M., Randel, W.R., Kinnison, D.E., Garcia, R.R., Choi, W., 2004. Seasonal varia-tions of methane, water vapor, ozone, and nitrogen dioxide near the tropo-pause: Satellite observations and model simulations. J. Geophys. Res. 109,D03302. http://dx.doi.org/10.1029/2003JD003706.
Pickering, K.E., Wang, Y.S., Tao, W.K., Price, C., Muller, J.F., 1998. Vertical distributionsof lightning NOx for use in regional and global chemical transport models.J. Geophys. Res. 103 (D23), 31203e31216. http://dx.doi.org/10.1029/98JD02651.
Pitari, G., Iachetti, D., Mancini, E., Montanaro, V., Marizy, C., Dessens, O., Rogers, H.,Pyle, J., Grewe, V., Stenke, A., Søvde, O.A., 2008. Radiative forcing from particleemissions by future supersonic aircraft. Atmos. Chem. Phys. 8, 4069e4084.http://dx.doi.org/10.5194/acp-8-4069-2008.
Pitari, G., Mancini, E., Rizi, V., Shindell, D.T., 2002. Impact of Future Climate andEmission Changes on Stratospheric Aerosols and Ozone. J. Atmos. Sci. 59,414e440. http://dx.doi.org/10.1175/1520-0469(2002)059<0414:IOFCAE>2.0.CO;2.
Prather, M.J., 1986. Numerical advection by conservation of second-order moments.J. Geophys. Res. 91 (D6), 6671e6681. http://dx.doi.org/10.1029/JD091iD06p06671.
Prather, M.J., Zhu, X., Strahan, S.E., Steenrod, S.D., Rodriguez, J.M., 2008. Quantifyingerrors in trace species transport modeling. Proc. Natl. Acad. Sci. USA 105 (50),19617e19621. http://dx.doi.org/10.1073/pnas.0806541106.
Price, C., Penner, J., Prather, M., 1997. NOx from lightning 1. Global distributionbased on lightning physics. J. Geophys. Res. 102 (D5), 5929e5941. http://dx.doi.org/10.1029/96JD03504.
Ramanathan, V., Dickinson, R., 1979. The role of stratospheric ozone in the zonal andseasonal radiative energy balance of the earth-troposphere system. J. Atmos.Sci. 36 (6), 1084e1104.
O.A. Søvde et al. / Atmospheric Environment 95 (2014) 468e479 479
Randles, C.A., Kinne, S., Myhre, G., Schulz, M., Stier, P., Fischer, J., Doppler, L.,Highwood, E., Ryder, C., Harris, B., Huttunen, J., Ma, Y., Pinker, R.T., Mayer, B.,Neubauer, D., Hitzenberger, R., Oreopoulos, L., Lee, D., Pitari, G., Genova, G.D.,Rose, F.G., Kato, S., Rumbold, S.T., Vardavas, I., Hatzianastassiou, N.,Matsoukas, C., Yu, H., Zhang, F., Zhang, H., Lu, P., 2013. Intercomparison ofshortwave radiative transfer schemes in global aerosol modeling: results fromthe AeroCom Radiative Transfer Experiment. Atmos. Chem. Phys. 13,2347e2379. http://dx.doi.org/10.5194/acp-13-2347-2013.
Rasch, P.J., Mahowald, N.M., Eaton, B.E., 1997. Representations of transport, con-vection, and the hydrological cycle in chemical transport models: Implicationsfor the modeling of short-lived and soluble species. J. Geophys. Res. 102 (D23),28127e28138. http://dx.doi.org/10.1029/97JD02084.
RETRO Emissions, 2006. Reanalysis of the Tropospheric Chemical Composition Overthe Past 40 years. http://retro.enes.org/.
Roeckner, E., B€auml, G., Bonaventura, L., Brokopf, R., Esch, M., Giorgetta, M.,Hagemann, S., Kirchner, I., Kornblueh, L., Manzini, E., Rhodin, A., Schlese, U.,Schulzweida, U., Tompkins, A., 2003. The atmospheric general circulation modelECHAM5. Part I: Model description. Rep./MPI Fr. Meteorol. 349. Max PlanckInstitute for Meteorology, http://pubman.mpdl.mpg.de/pubman/item/escidoc:995269:2/component/escidoc:995268/Report-349.pdf.
Roeckner, E., Brokopf, R., Esch, M., Giorgetta, M., Hagemann, S., Kornblueh, L.,Manzini, E., Schlese, U., Schulzweida, U., 2006. Sensitivity of simulated climateto horizontal and vertical resolution in the ECHAM5 Atmosphere Model. J. Clim.19 (16), 3771e3791. http://dx.doi.org/10.1175/JCLI3824.1.
Sander, R., Kerkweg, A., J€ockel, P., Lelieveld, J., 2005. Technical note: the newcomprehensive atmospheric chemistry module mecca. Atmos. Chem. Phys. 5,445e450. http://dx.doi.org/10.5194/acp-5-445-2005.
Sander, S.P., Abbatt, J., Barker, J.R., Burkholder, J.B., Friedl, R.R., Golden, D.M.,Huie, R.E., Kolb, C.E., Kurylo, M.J., Moortgat, G.K., Orkin, V.L., Wine, P.H.,2011. Chemical Kinetics and Photochemical Data for Use in AtmosphericStudies. Evaluation No. 17. Tech. Rep. 10-06. Jet Propulsion Laboratory,Pasadena. California Institute of Technology. http://jpldataeval.jpl.nasa.gov/.
Sander, S.P., Finlayson-Pitts, B.J., Friedl, R.R., Golden, D.M., Huie, R.E., Keller-Rudek, H., Kolb, C.E., Kurylo, M.J., Molina, M.J., Moortgat, G.K., Orkin, V.L.,Ravishankara, A.R., Wine, P.H., 2006. Chemical Kinetics and Photochemical Datafor Use in Atmospheric Studies. Evaluation No. 15. Tech. Rep. 06-2. Jet Propul-sion Laboratory, Pasadena. California Institute of Technology. http://jpldataeval.jpl.nasa.gov/.
Sassi, F., Kinnison, D.E., Boville, B.A., Garcia, R.R., Roble, R., 2004. Effect of El Ni~no eSouthern Oscillation on the dynamical, thermal, and chemical structure of themiddle atmosphere. J. Geophys. Res. 109, D17108. http://dx.doi.org/10.1029/2003JD004434.
Schumann, U., 1997. The impact of nitrogen oxides emissions from aircraft upon theatmosphere at flight altitudes e results from the aeronox project. Atmos. En-viron. 31 (12), 1723e1733. http://dx.doi.org/10.1016/S1352-2310(96)00326-3.
Skowron, A., Lee, D.S., de Le�on, R.R., 2013. The assessment of the impact of aviationNOx on ozone and other radiative forcing responses e The importance ofrepresenting cruise altitudes accurately. Atmos. Environ. 74, 159e168. http://dx.doi.org/10.1016/j.atmosenv.2013.03.034.
Søvde, O.A., Gauss, M., Isaksen, I.S.A., Pitari, G., Marizy, C., 2007. Aircraft pollution e
A futuristic view. Atmos. Chem. Phys. 7, 3621e3632. http://dx.doi.org/10.5194/acp-7-3621-2007.
Søvde, O.A., Gauss, M., Smyshlyaev, S.P., Isaksen, I.S.A., 2008. Evaluation of thechemical transport model Oslo CTM2 with focus on Arctic winter ozone
depletion. J. Geophys. Res. 113 (D09304), D09304. http://dx.doi.org/10.1029/2007jd009240.
Søvde, O.A., Hoyle, C.R., Myhre, G., Isaksen, I.S.A., 2011. The HNO3 forming branch ofthe HO2þ NO reaction: pre-industrial-to-present trends in atmospheric speciesand radiative forcings. Atmos. Chem. Phys. 11 (17), 8929e8943. http://dx.doi.org/10.5194/acp-11-8929-2011.
Søvde, O.A., Prather, M.J., Isaksen, I.S.A., Berntsen, T.K., Stordal, F., Zhu, X.,Holmes, C.D., Hsu, J., 2012. The chemical transport model Oslo CTM3. Geosci.Model Dev. 5, 1441e1469. http://dx.doi.org/10.5194/gmd-5-1441-2012.
Stamnes, K., Tsay, S., Wiscombe, W., Jayaweera, K., 1988. Numerically stable algo-rithm for discrete-ordinate-method radiative transfer in multiple scattering andemitting layered media. Appl. Opt. 27 (12), 2502e2509. http://dx.doi.org/10.1364/AO.27.002502.
Stevenson, D.S., Derwent, R.G., 2009. Does the location of aircraft nitrogen oxideemissions affect their climate impact? Geophys. Res. Lett. 36, L17810. http://dx.doi.org/10.1029/2009GL039422.
Stevenson, D.S., Young, P.J., Naik, V., Lamarque, J.-F., Shindell, D.T., Voulgarakis, A.,Skeie, R.B., Dalsren, S.B., Myhre, G., Berntsen, T.K., Folberth, G.A.,Rumbold, S.T., Collins, W.J., MacKenzie, I.A., Doherty, R.M., Zeng, G., vanNoije, T.P.C., Strunk, A., Bergmann, D., Cameron-Smith, P., Plummer, D.A.,Strode, S.A., Horowitz, L., Lee, Y., Szopa, S., Sudo, K., Nagashima, T., Josse, B.,Cionni, I., Righi, M., Eyring, V., Conley, A., Bowman, K.W., Wild, O.,Archibald, A., 2013. Tropospheric ozone changes, radiative forcing andattribution to emissions in the Atmospheric Chemistry and Climate ModelInter-comparison Project (ACCMIP). Atmos. Chem. Phys. 13, 3063e3085.http://dx.doi.org/10.5194/acp-13-3063-2013.
Stordal, F., Gauss, M., Myhre, G., Mancini, E., Hauglustaine, D.A., K€ohler, M.O.,Berntsen, T., Stordal, E.J.G., Iachetti, D., Pitari, G., Isaksen, I.S.A., 2006. Tradeoffsin climate effects through aircraft routing: forcing due to radiatively activegases. Atmos. Chem. Phys. Discuss. 6, 10733e10771. http://dx.doi.org/10.5194/acpd-6-10733-2006.
Sundqvist, H., 1978. A parameterization scheme for non-convective condensationincluding prediction of cloud water content. Q. J. Roy. Meteor. Soc. 104,677e690. http://dx.doi.org/10.1002/qj.49710444110.
Tanr�e, D., Geleyn, J.-F., Slingo, J.M., 1984. First results of the introduction of anadvanced aerosol-radiation interaction in the ECMWF low resolution globalmodel. In: Gerber, H., Deepak, A. (Eds.), Aerosols and Their Climatic Effects. A.Deepak Publ., Hampton, VA, pp. 133e177.
Toon, O.B., McKay, C.P., Ackerman, T.P., Santhanam, K., 1989. Rapid calculation ofradiative heating rates and photodissociation rates in inhomogeneous multiplescattering atmospheres. J. Geophys. Res. 94, 16287e16301. http://dx.doi.org/10.1029/JD094iD13p16287.
Wang, W.C., Sze, N.D., 1980. Coupled effects of atmospheric N2O and O3 on theearth’s climate. Nature 286, 589e590. http://dx.doi.org/10.1038/286589a0.
Wuebbles, D.J., Patten, K.O., Wang, D., Youn, D., Martnez-Aviles, M., Francisco, J.S.,2011. Three-dimensional model evaluation of the Ozone Depletion Potentialsfor n-propyl bromide, trichloroethylene and perchloroethylene. Atmos. Chem.Phys. 11, 2371e2380. http://dx.doi.org/10.5194/acp-11-2371-2011.
Yi, B., Yang, P., Liou, K.-N., Minnis, P., Penner, J.E., 2012. Simulation of the globalcontrail radiative forcing: a sensitivity analysis. Geophys. Res. Lett. 39 (24), 28.http://dx.doi.org/10.1029/2012GL054042.
Zhang, G.J., McFarlane, N.A., 1995. Sensitivity of climate simulations to the param-eterization of cumulus convection in the Canadian climate centre general cir-culation model. Atmos. Ocean. 33 (3), 407e446. http://dx.doi.org/10.1080/07055900.1995.9649539.