Foundation For Aircraft Selection: Vasigh
55
any technology companies have an arsenal of software solutions. However, their focus should span well beyond supplying those solutions to their customers. What about helping customers identify problem areas, build- ing strategies to solve those problems, creating processes around industry best practices and looking into the future to help achieve long-term growth and success? All of these activities are essential to an airline’s health and wellbeing. That’s why we don’t just develop and sell software. We also thrive in the area of consulting services so our customers know, well before purchasing and implementing new technology, that their investments are sound and necessary. We have made significant investments in our consulting practice. And what makes our consultants unique isn’t neces- sarily their high-level of education or their passion for technology. Certainly, those attributes are important. However, what distinguishes them is that many of our consultants come directly from the airline industry. As former airline executives, they under- stand the business, and they are passionate about improving the air transport industry. Our consulting team also includes former management consultants from McKinsey, KPMG, and Deloitte & Touche. Combined, our 100-plus subject matter experts possess more than 1,000 years of airline expe- rience. We built this team with the primary purpose of helping airlines around the world be the best they can be. It goes without saying that we work in a complex industry that changes at a phenomenal rate. Managing daily operations and ensuring that travelers arrive safely at their destinations is a significant responsibility. That task combined with examining ways to improve the overall operation can be taxing for air- line leaders. And sometimes it’s downright overwhelming, but it’s necessary since becoming complacent in our environment won’t sustain an airline for long. That’s where consulting ser- vices come into play. Discovering new ways of doing business that drive pro- ductivity, lower costs, achieve substantial revenue growth and promote customer loyalty is crucial in this volatile, constantly changing industry. Whether it’s using Net Promoter Score ® to measure your customers’ satisfaction levels, finding new methods for planning and managing partnerships with other air- lines to expand your network and generate additional revenue, taking a new approach to pricing and revenue management to achieve optimal results or moving from a reactive to a proactive management style to improve the overall business, our consultants can evaluate your airline from an objective perspective and help drive the change your airline needs. We cover these and more topics in our special section to give you a small sampling of the types of projects our consulting team undertakes. What’s more, you don’t have to implement one of our solutions to take advantage of these services. Plain and simple, we specialize in business pro- cess consulting, organizational structure redesign and change management, so no matter the nature of your business challenge, our subject matter experts can partner with you to resolve your issues. I hope you enjoy this issue of Ascend, and I look forward to working with you to achieve the results you, your customers, your employees and your shareholders expect. a ... with Hugh Jones President, Sabre Airline Solutions M perspective Special Section: Strategic Planning For Your Airline — A Consulting Perspective
Transcript of Foundation For Aircraft Selection: Vasigh

any technology companies have an arsenal of software solutions. However, their focus should span
well beyond supplying those solutions to their customers. What about helping customers identify problem areas, build-ing strategies to solve those problems, creating processes around industry best practices and looking into the future to help achieve long-term growth and success?
All of these activities are essential to an airline’s health and wellbeing. That’s why we don’t just develop and sell software. We also thrive in the area of consulting services so our customers know, well before purchasing and implementing new technology, that their investments are sound and necessary.
We have made significant investments in our consulting practice. And what makes our consultants unique isn’t neces-sarily their high-level of education or their passion for technology. Certainly, those attributes are important. However, what distinguishes them is that many of our
consultants come directly from the airline industry. As former airline executives, they under-stand the business, and they are passionate about improving the air transport industry.
Our consulting team also includes former management consultants from McKinsey, KPMG, and Deloitte & Touche. Combined, our 100-plus subject matter experts possess more than 1,000 years of airline expe-rience. We built this team with the primary purpose of helping airlines around the world be the best they can be.
It goes without saying that we work in a complex industry that changes at a phenomenal rate. Managing daily operations and ensuring that travelers arrive safely at their destinations is a significant responsibility. That task combined with examining ways to improve the overall operation can be taxing for air-line leaders. And sometimes it’s downright overwhelming, but it’s necessary since becoming complacent in our environment won’t sustain an airline for long.
That’s where consulting ser-vices come into play. Discovering new ways of doing business that drive pro-ductivity, lower costs, achieve substantial revenue growth and promote customer loyalty is crucial in this volatile, constantly changing industry.
Whether it’s using Net Promoter Score ® to measure your customers’ satisfaction levels, finding new methods for planning and managing partnerships with other air-lines to expand your network and generate additional revenue, taking a new approach to pricing and revenue management to achieve optimal results or moving from a reactive to a proactive management style to improve the overall business, our consultants can evaluate your airline from an objective perspective and help drive the change your airline needs.
We cover these and more topics in our special section to give you a small sampling of the types of projects our consulting team undertakes. What’s more, you don’t have to implement one of our solutions to take advantage of these services. Plain and simple, we specialize in business pro-cess consulting, organizational structure
redesign and change management, so no matter the nature of your business challenge, our subject matter experts can partner with you to resolve your issues.
I hope you enjoy this issue of Ascend, and I look forward to working with you to achieve the results you, your customers, your employees and your shareholders expect. a
... with Hugh Jones
President, Sabre Airline Solutions
M
perspective
Special Section: Strategic Planning For Your Airline —A Consulting Perspective

In It For The “Long10 Haul” Norwegian Air Shuttle offers long-haul flights at low costs
14 GOL’s Upswing GOL applies more accurate, timely data
18 Modern Skies
SMART NAS aims to accelerate transformation of the U.S. National Airspace System
Swinging The 22 Profit Pendulum
Repairing maintenance and fuel costing
27 System Failure
Diminishing the impact of an airport technology malfunction
Flight Numbering 30 Alternatives
Alternative options for numbering flights have become a necessity
Foundation For 34 Aircraft Selection
Technical, operational and financial analyses for aircraft selection
ASCEND I TABLE OF CONTENTS
PROFILE INDUSTRY
ascend
14
30

62 Knowledge Is Power
Travel industry leverages Big Data for competitive advantage
44
Voice Of The Customer Net Promoter Score drives sustained revenue growth Proactive Over Reactive Proactive management must prevail in the ever-evolving airline industry
Partnering For Success Finding the right kind of partnerships
Codeshare Alerts Monitoring codeshare partner pricing and inventory availability
56
A System View The strategic value of operations
59 Creating, Communicating
And Connecting Strategic planning for pricing and revenue management
Real-Time 66 Revenue ReportingKeep an eye on revenue realization for every seat sold
69 The Art Of CalibrationUnleashing the power of network planning 74 Secret IngredientA proven method for airlines to grow their contracted corporate business
78 Morale BoostNew shift- and vacation-bidding technology improves employee satisfaction levels
47
50
54
COMPANYSPECIAL SECTION SOLUTIONS
ASCEND I TABLE OF CONTENTS
ascend
69
66
Norwegian Turns Up The Heat With Affordable Long-Haul Service
Norwegian Air Shuttle ASA (Norwegian) challenges airlines to think differently about long-haul transportation with its extremely low pricing.
Our Heros When Norwegian Air Shuttle entered the Norwegian domestic market 12 years ago, it challenged a well-estab-lished and long-lasting airline monopoly. Therefore, the airline appropriately adorned the tails of its aircraft with Norwegian personalities who have pushed the boundaries, challenged the established and inspired others. Those personalities, who the airline refers to as “our heros,” include famous figures such as Norwegian Explorer Fridtjor Nansen, Writer Camilla Collett, Actress Asta Nielsen, Author Elsa Beskow and Poet Johan Ludvig Runeberg.
Pho
tos:
Nor
wei
gian
Airl
ines
IN FOR THE “LONG HAUL”
By Christen Garcia I Ascend Contributor
Offering affordable trans-Atlantic air transportation opens doors to possibilities and opportunities once unimaginable by breaking down one of the largest barriers for international travelers — expensive roundtrip airfare. For the budget-conscious traveler, long-haul travel becomes more of a reality, enabling people such as Lauren to see the world and experience foreign cultures.
But with the airline’s strategy still in its early stages, some questions remain: Is this just the beginning of a potential major movement by airlines competing in the trans-Atlantic market? Will other LCCs around the world follow suit, or will they maintain their long-standing practice of providing low-cost competition in local markets only?
What does this mean for traditional network carriers?
A number of major airlines have flown routes between London Gatwick and the United States for decades. However, despite the credibility they have established over the years, compet-ing with new low-cost entrant Norwegian in this territory will be no simple task.
“Launching long-haul routes between London Gatwick and the United States is an important part of our strategy to expand internationally and obtain a stronger foothold in markets outside Scandinavia,” Norwegian Chief Executive Officer Bjørn Kjos told MailOnline.com.
Norwegian’s strategy indicates its intent to compete with major airlines and win
market share by introducing extremely low fares (while the fares come with a certain amount of complimentary services, naturally there are some optional expenses such as meals, fees for checked bags, reserved seats, etc). Travelers are some of the most price-sensitive consumers in the global marketplace, displaying incredibly high levels of patience and diligence in their search for inexpensive airfares. Most of them utilize the Internet, which enables them to compare fares from various air-lines on dozens of websites. Norwegian’s fares hardly come close to what most major airlines charge for roundtrip trans-Atlantic routes, which ultimately makes the price-conscious traveler’s purchasing decision a simple one.
Norwegian’s overall expansion strategy may pose a serious threat to long-established, full-service carriers, possibly giving them a sense of urgency to adapt and respond quickly to remain relevant and competitive. To do so, they will need to either lower their prices in these particular markets to more closely match Norwegian’s fares, differentiate them-selves by building and sustaining best-in-class service or, perhaps, a combination of the two.
Powered By TechnologyClearly, the Boeing 787 Dreamliner is a
big enabler for Norwegian’s new service. However, the airline’s success also depends on its ability to effectively reach travelers worldwide as they search for affordable trans-Atlantic fares. This is where technol-ogy plays a significant role.
As part of its low-cost, long-haul strate-gy, Norwegian entered its content into the Sabre® global distribution system, enabling Sabre® Connected travel agencies to sell the airline’s total seat inventory with real-time, interactive confirmation.
“By moving into the long-haul busi-ness, it’s extremely important to have cost control/focus” said Lars Sande, senior vice president of sales for Norwegian. “Having the newest, most cost-efficient aircraft, and having high utilization is vital. We also need to be efficient on the commercial side. Offline marketing is way too expen-sive, and it’s hard to measure the effect of money spent. So moving forward, digital marketing and wide, efficient distribution is key. It’s important that customers find us in the channels in which they buy their tickets in the markets we step into.
We feel we get that with our partnership with Sabre Travel Network®. To succeed selling tickets in the U.S. market, Sabre is important.”
This move enables Norwegian to con-nect its new service offerings with the global demand. In addition, it provides the airline with access to more sales oppor-tunities than ever before, as well as the ability to generate revenue far beyond the limits within its local markets. In addition, as Norwegian continues to expand into new markets, it will have access to more-sophisticated distribution solutions, further securing its growing global footprint.
As for the future of long-haul travel, there is a method to Norwegian’s mad-ness. However, only time will tell how the industry at large will respond to the airline’s long-haul, high-quality service strategy. a
Christen Garcia is a process consultant for Sabre Travel
Network®. She can be contacted at [email protected].
xperiencing the vast array of cultures around the globe first-hand is one of life’s priceless opportunities. Yet, these traveling opportunities are often altered, cut short or eliminated due to
the hefty price tag typically accompanying them. The main culprit? Roundtrip airfare, which often constitutes a large majority of the overall cost of a trip abroad.
What if the cost was drastically reduced, making long-haul transportation more affordable and the total cost of interna-tional travel a more-realistic option for travelers on a budget? This is exactly what Norwegian aims to do — offer a truly unbeatable price for long-haul air transpor-tation to the budget-conscious traveler. As of May 2013, Norwegian stands as the only European low-cost carrier to offer trans-Atlantic routes to London from New York, Los Angeles and Fort Lauderdale, starting at rates under US$300 for a one-way ticket.
Norwegian’s StoryNorwegian has grown substantially in its
20 years in business. It is Europe’s third-largest low-cost carrier and the continent’s ninth-largest airline in terms of passengers boarded. In 2008, it announced its first destination outside of Europe — a non-stop route from Scandinavia to Dubai.
On the heels of this announcement came yet another, stating plans to fly to a variety of other intercontinental destina-tions, including New York, Fort Lauderdale and Bangkok as well as cities in North Africa.
Fast forward to present day. Norwegian offers trans-Atlantic flights at incredibly low rates and provides affordable options to those desiring to travel abroad. As part of the airline’s strategy to offer low fares and high-quality service — including WiFi onboard, direct-to-plane for those not checking bags, in-flight entertainment, SMS ticket, etc. — it plans to expand in the near future to other U.S. destinations including Orlando, Florida; and Oakland/San Francisco and Los Angeles, California; as well as European destinations such as Budapest, Hungary; Sicily, Italy; and Santorini, Greece.
How is Norwegian able to offer long-haul flights at such reasonable rates? Much of the airline’s success is credited to the Boeing 787 Dreamliner, Boeing’s most fuel-efficient aircraft. The airline has purchased/leased 10 Dreamliners, which enables it to fly greater distances at lower costs. The aircraft’s aerodynamic design and green infrastructure accommodates up to 330 passengers, a drastic difference from the jumbo Boeing 777 and Boeing 747 that carry up to 600 passengers. (The
Dreamliner is Boeing’s most fuel-efficient aircraft and the world’s first airplane manu-facturer to use composite materials as the primary material in the construction of its airframe. The Dreamliner is 20 percent more fuel efficient than the Boeing 767 it replaces.)
Ultimately, this means lower fuel costs for the airline, as it carries less weight in bags and passengers. In addition, it high-lights Norwegian’s business strategy by demonstrating how an airline’s selection of aircraft equipment is an important contribu-tor to the success of its business model.
Let’s put Norwegian’s strategy to a test. Lauren is a 24-year-old female who lives in the United States and graduated with a university degree. Before her full-time job begins, her dream is to travel the world. But with student loan payments looming, she is extremely price conscious.
After researching online, she discovers the cost of a roundtrip ticket from New York City to London is around US$2,000 — a large chunk of cash for anyone to part with, especially a recent graduate. Furthermore, this price does not include her hotel accom-modations, meals, cab fares, train tickets, souvenirs, entertainment, etc. Needless to say, the cost of Lauren’s dream is rapidly nearing an unthinkable amount of money.
Many airlines may not think there are enough “Laurens” in the world to con-sider Norwegian’s strategy viable, but think again. According to the Boston Consulting Group, studies show that Lauren and her
peers will be at the core of travel spend in just five to 10 years from now for both leisure and business travel. In fact, this group is projected to represent more than half of the total spend on business airfare by 2020.
In addition, this particular population seg-ment is incredibly vocal and willing to share both good and bad experiences with their social networks. Tools such as Facebook, Twitter and Instagram disperse this informa-tion to their networks instantaneously, and research indicates that this collective data will heavily influence the opinions and decisions of those it touches.
A Glance At The FutureSo what does Norwegian’s strategy mean
for the airline? In short, the airline could potentially be on the brink of a major move-ment for both the LCC model and the overall airline industry. In other words, if the airline secures long-term success with its low-fare, high-quality service strategy, it could influence and/or change the way other airlines position themselves in the trans-Atlantic market.
“Norwegian’s decision to operate high-quality services on new long-range aircraft offering good-value fares to the United States from London Gatwick is a significant industry game-changer,” said Stewart Wingate, chief executive of Gatwick Airport in London, in an interview with MailOnline.com. “This is one of the most exciting route developments since Gatwick’s change of ownership four years ago.”
ascend
ASCEND I PROFILE
ascend12 13
ASCEND I PROFILE
E
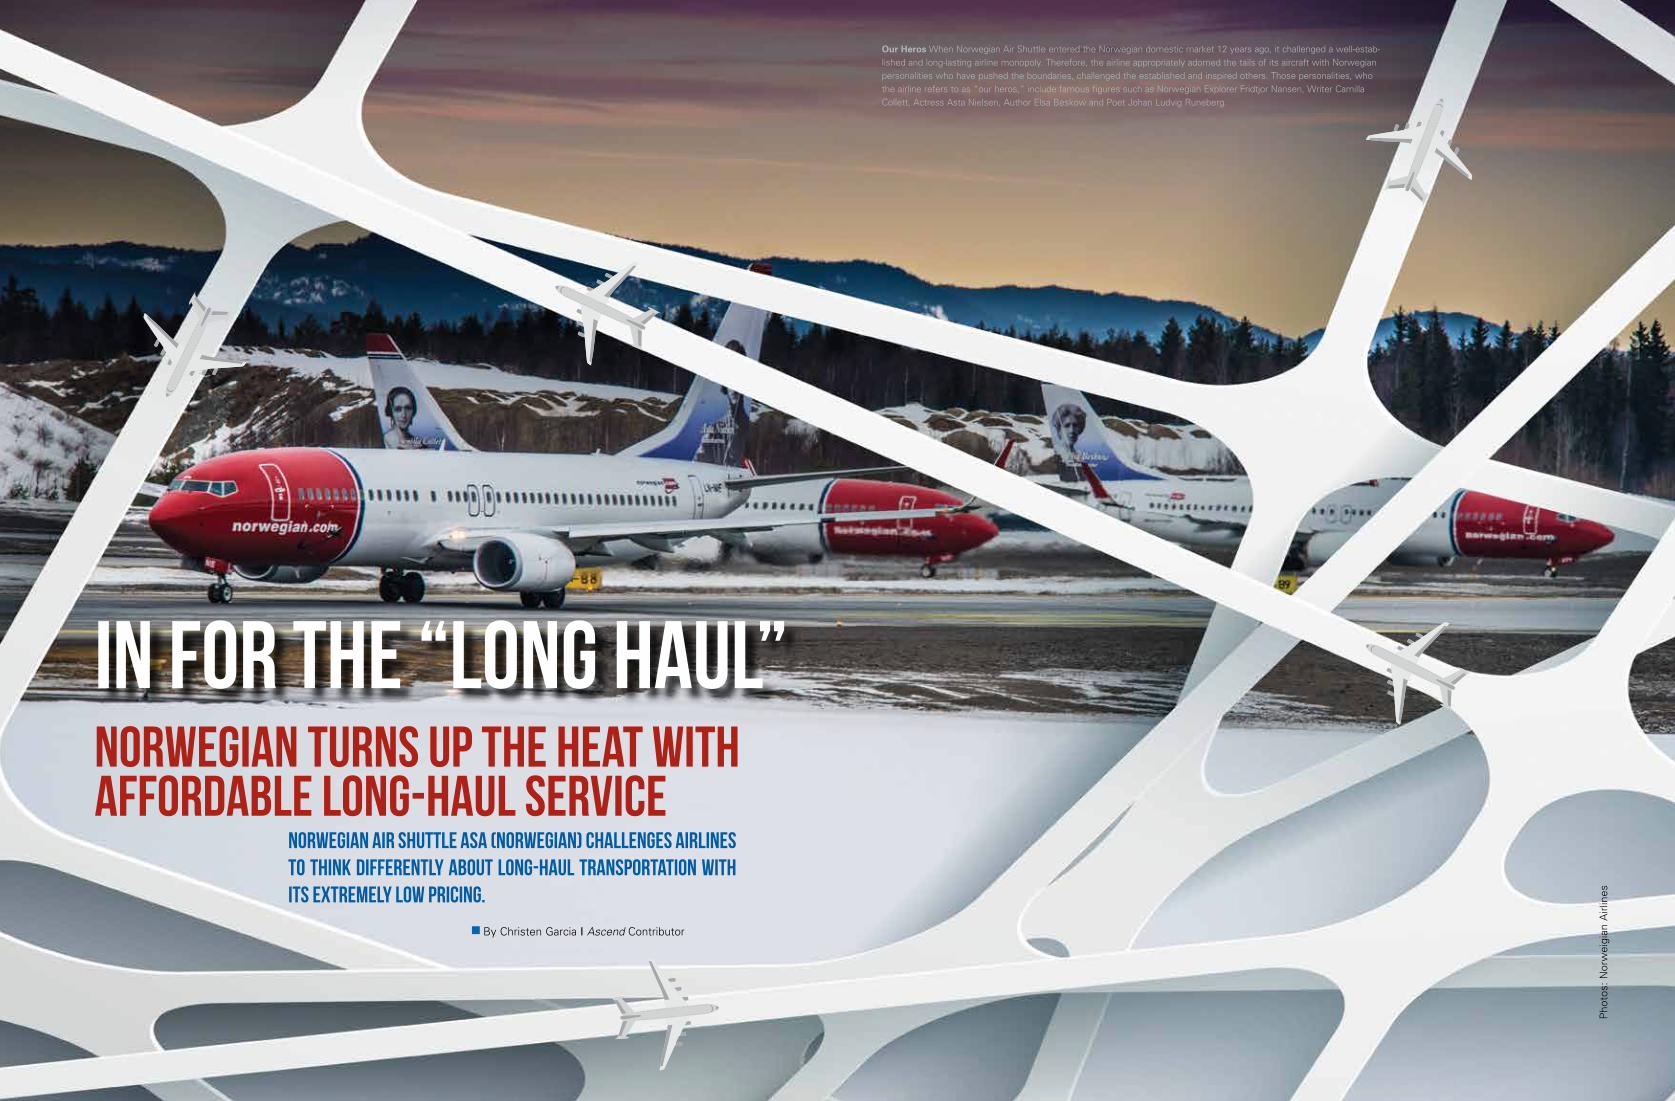
Dreamliner Goes The Distance Norwegian Air Shuttle has purchased/leased 10 Dreamliner aircraft, which it uses on longer-haul routes at lower costs. The airline received three of the aircraft last year, and it will take delivery of four more this year, one next year and two in 2016. The Dreamliner, which is 20 percent more fuel efficient, replaces the Boeing 767.
Stringent Safety Measures In addition to providing its customers with exceptional, high-quality ser-vice, Norwegian’s in-flight crewmembers, as part of its strict safety protocol, are required to use a Web-based reporting system to log irregularities. This information is used for statistical analysis and trend monitoring.

ascend ascend14 15
GOL Linhas Aéreas (GOL) leveraged its low-cost model to become a successful South American startup in the early 2000s. Then, economic headwinds deterred further upward movement. Today, GOL is applying better data sources and renewed purpose to regain traction in a challenging marketplace.
Getting Back On Track By Applying More Accurate and Timely Data
By Simone Silveira I Ascend Contributor

eing a trendsetter can lead to early success, especially for a new company. However, it can also present challenges that, left unaddressed, may trigger a downturn.
Such is the history of Brazil-based GOL, which in 2001, entered the marketplace as South America’s first low-cost carrier and forged a success story during the first several years that attracted attention throughout the airline industry.
Not only did GOL steadily increase the size of its fleet of Boeing 737 aircraft from less than 10 in 2001 to more than 140 today, it also acquired Brazil-based competitor Varig in 2007, along with the popular Smiles frequent-flyer program.
GOL was making headlines as a business phenomenon and at the same time was assem-bling a route structure that now connects not only the major metropolitan areas of Brazil but also flies to other high-profile destinations across South America. In addition, GOL has added flights to destinations in the Caribbean, as well as to Miami and Orlando, Florida.
Today, GOL — with its low-cost model — and TAM have emerged as the dominant forces among Brazil’s commercial carriers, with TAM at No. 1 in the Brazilian marketplace and GOL at No. 1 with the largest domestic operation and volume of passengers in Brazil.
Nevertheless, several developments since GOL’s early success have altered Brazil’s — as well as much of the industry’s — economic landscape. As a result, the carrier has struggled to remain among the leaders in international commercial aviation, given current business conditions.
Rising fuel costs, of course, have hit all carriers at their bottom lines.
Additional unforeseen factors, including stronger competition and a more-diverse flying public that has the economic means to fly higher-cost carriers in the region (as the middle class and incomes have risen across South America), have adversely impacted GOL’s strategic planning efforts.
GOL was founded by Grupo Áurea, which also operates Brazil’s largest bus system. Knowing the “common-citizen” nature of bus travelers provided a marketing advantage that helped bring about GOL’s early suc-cess, as the airline benefited from many South Americans’ newfound financial ability to travel not only by bus, but also on low-cost carriers.
In response, GOL expanded its route system to the extent that when the global economy slowed down in 2008 and 2009, some of its flights were half or even three-quarters empty. This served as a red flag to route planners who were trying to better manage the airline’s routings and flight fre-quencies for maximum profitability.
In Brazil, a high depreciation rate of the Real, the country’s official currency, has exacerbated what was already a difficult economic equation. In addition, ongoing labor difficulties at GOL (some of which are related to the airline’s 2012 acquisition of low-cost competitor Webjet) have added further pressure, spurring GOL execu-tives to construct a more resilient strategic plan.
During the past year, one of GOL’s primary objectives has been to effectively address prob-lem areas to staunch its deeper-than-anticipated excursion into red ink. The carrier is determined to regain the positive growth pattern it estab-lished in 2001 and sustained through its early years as an expanding business entity and phenomenon.
As GOL’s executive team pondered the options for regaining its foothold in the industry, one thing became clear. The airline needed more accurate and reliable information on eco-nomic conditions.
With better, more-timely information, the airline could make better, more-informed decisions. For example, it could easily and accurately determine which routes to include or expand and which to cut back.
Additionally, better decision-making would help strengthen the carrier’s approach to: Labor costs, Aircraft allocation, Amenities, Frequent-flyer program, Business travelers, Aircraft configurations.
GOL addressed its needs for more timely and accurate information and statistical analy-sis by implementing Sabre® AirVision™ Market Intelligence software.
The results can be clearly seen in GOL’s upward-trending financial results. In the third quarter of 2013, for example, GOL had a 21 percent increase in net passenger revenue per available seat-kilometer, representing 14 percent growth for the year.
Furthermore, net passenger-seat-kilometer yield for September 2013 showed a 25 per-cent increase year-over-year, which was largely attributed to GOL’s evolving strategy to attract high-value customers.
Other GOL financial results have exhibited similar improvement.
In addition, the true impetus in the upward trends is a direct result of strong corporate commitment. GOL’s management team real-ized the challenges it faced were largely related to the carrier’s modest approaches to finding solutions — approaches that seriously needed to become more aggressive in areas including those related specifically to data collection and analysis to provide a firm foundation for better decision-making.
Such fundamental changes do not happen without management support. Therefore, the company had to make a conscious, collec-tive decision to move forward with new systems and processes as well as renewed enthusiasm.
Since making its more visible commitment to lead the entire organization through a
highly positive cycle of change, GOL has noticeably evolved as a company.
With regard to aircraft seating, for exam-ple, GOL devised a formula to expand the room between seats in some rows from 31 to 34 inches and in other rows from 31 to 32 inches. Passenger comfort, therefore, played a large part in GOL’s decision to set the parameters for its revised aircraft-seating arrangement, called GOL+.
Increasing space between rows of seats, of course, reduces the overall number of seats on an aircraft, which also aligns with GOL’s objective to fly fuller aircraft on a greater percentage of its flights.
Considering the continually increasing competition with regard to GOL’s basic pool of potential passengers and the destina-tions GOL serves within its expansive route
network, better information was also needed to help identify new market opportunities.
And GOL has acted vigorously to identify and properly utilize that information.
In addition, the airline has established fundamental, defined procedures that appeal more directly to business travelers, including streamlining the boarding process, improv-ing on-time performance, becoming more visible with a high-profile, attractive airport presence and developing more efficient, convenient schedules not only within GOL’s own route network but through codeshare partnerships as well.
These definitive moves by GOL’s man-agement team have been aided by the carrier’s adoption of Sabre AirVision Market Intelligence, which is designed specifically to help airlines gather timelier, more accurate
information that is vitally important for mak-ing critical decisions.
Sabre AirVision Market Intelligence has also enabled GOL to monitor market seg-ments and specific markets to identify and measure the effects of competitors’ actions, as well as pinpoint agencies and markets deemed “underperforming,” as defined by the revenue-generation needs and objectives set forth by the airline’s leadership.
In addition, the software provides thorough insight into competitors’ service offerings and traffic flow, providing GOL with the capability to quantify and analyze competitive market share and react effectively based on the information.
GOL now operates more than 900 flights daily to more than 60 destinations in 13 coun-tries. And with major seasonal events such as World Cup soccer competitions at a dozen Brazilian cities this year, GOL executives know that a winning performance requires application of the best information available.
“We’re confident that Sabre AirVision Market Intelligence is the most comprehen-sive solution for our needs, delivering precise information on the competitive landscape, with passenger traffic, airline schedules and fares,” said Claudio Neves Borges, GOL’s director of schedule planning. “Accurate data is critical to the success of our com-mercial planning. It enables us to efficiently respond to market dynamics both tactically and strategically.”
In other words, GOL is once again soaring.And its greatly improved information
resources can be counted among the biggest contributors to the carrier’s positive perfor-mance. a
Simone Silveira is executive partner for Brazil, Argentina, Chile, Paraguay
and Uruguay for Sabre Airline Solutions. She can be contacted
Smiles Miles As part of the Varig acquisition, GOL inherited the popular Smiles Program, which offers numerous member benefits such as differentiated service at check-in, extra baggage allowances, access to SMILES VIP lounges, as well as access to its exclusive customer-service center.
Financial Upswing GOL, Brazil’s second-largest airline by market share and fleet size, implemented Sabre AirVision Market Intelligence to help strengthen its business in key areas such as labor costs, aircraft allocation and customer amenities through more accurate decision making. The airline is on a financial upswing as a result. For instance, it achieved a 21 percent increase in net passenger revenue per available seat-kilometer during the third quarter last year, a 14 percent growth for the year.
B
ascend
ASCEND I PROFILE
ascend16 17
ASCEND I PROFILE
Pho
tos:
GO
L

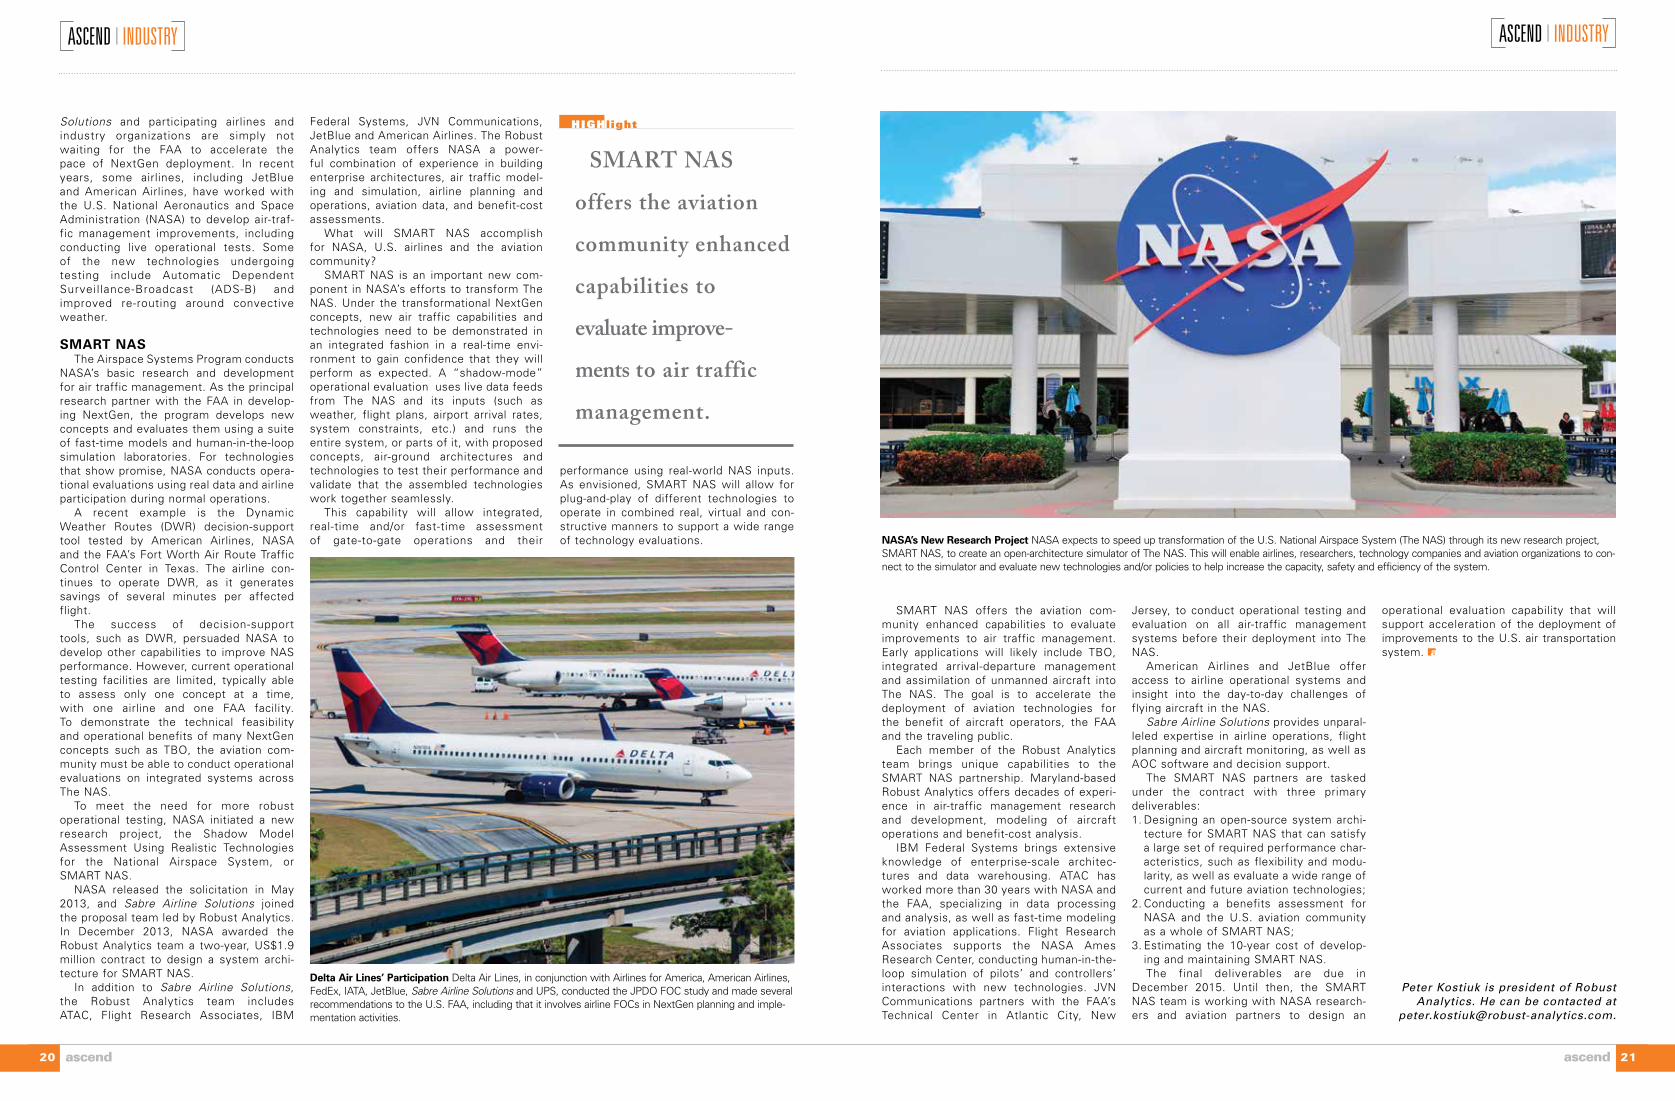
Modern Skies NASA’s SMART NAS Will Modernize The U.S. National Airspace System
NASA’s new research project — SMART NAS — aims to accelerate transformation of the U.S. National Airspace System (The NAS). The objective is to create an open-architecture simulator of The NAS, enabling stakeholders — such as airlines, researchers, technology companies and aviation organizations — to connect to the simulator and evaluate new technologies and/or policies with the goal of increasing the capacity, safety and efficiency of the system.
By Peter Kostiuk, PhD, Robust Analytics I Ascend Contributor
ASCEND I INDUSTRY
ascend 19
he Next Generation Air Transpor ta t i on Sys tem (NextGen) is the U.S. Federal Aviat ion Administrat ion’s (FAA’s) program for modernizing the U.S. air traffic manage-
ment system. NextGen aims to increase capacity, reduce flight delays and provide airlines with greater flexibility, as well as improved safety and security.
However, many industry stakeholders are disappointed by the slow pace at which new capabilities are deployed into The NAS. Airline representatives who reviewed NextGen plans also expressed concerns that airline priorities and capabilities were inadequately addressed in the FAA pro-grams. Some of their specific reservations pertained to the FAA’s simplistic focus on flight planning to the neglect of the other responsibilities and capabilities of flight operations centers (FOCs).
The concept of trajectory-based opera-tions (TBO) offers a good example of the potential for missed opportunity for more rapid deployment at lower cost and risk. Under TBO, airlines and the FAA will negotiate four-dimensional gate-to-gate flight trajectories. The underlying assump-tion is that technology exists for the flight planning and dispatching in this TBO environment. While this may be a safe assumption, many airlines are concerned about the risk of missing opportunities for broader system improvements by limiting NextGen/FOC interaction to the world of flight planning and dispatching individual flights.
Flight planning is just one of an FOC’s functions that comes under flight man-agement, which along with schedule management and network management, are the three major categories of airline operational control responsibility.
Other industry concerns about NextGen pertain to lack of clear guidance on data and information sharing, little acknowl-edgement of the lessons learned from two decades of collaborative decision making and no clarity on the rationing of scarce airport and airspace resources in the NextGen environment. All of these issues require investments by the U.S. govern-ment and aviation industry, extensive testing of new capabilities and procedures, as well as assurances that data will be safe and secure. Without agreement on these issues and clear indications the U.S. government will fully support its commit-ments, the promise of NextGen will not be achieved.
Airline And Industry ParticipationAirlines saw a need to redirect some
aspects of the NextGen program and
focus it on issues of greater interest to their operations. With their encour-agement, the U.S. Joint Planning and Development Office (JPDO) sponsored a joint government-industry study of the role of FOCs in NextGen.
The group that conducted the JPDO FOC study — including Airlines for America, American Airlines, Delta Air Lines, FedEx, IATA, JetBlue, Sabre Airline Solutions® and UPS — recommended that the FAA increase the involvement of FOCs
in NextGen planning and implementation activities, including information sharing, collaborative decision making and TBO. It also recommended that the FAA conduct collaborative experiments with FOCs to evaluate data sharing, new capabilities and methods to ration limited NAS resources.
Results from the JPDO FOC study were released in July 2012, and those who conducted the study continue to encourage the FAA to implement their recommendations. However, Sabre Airline
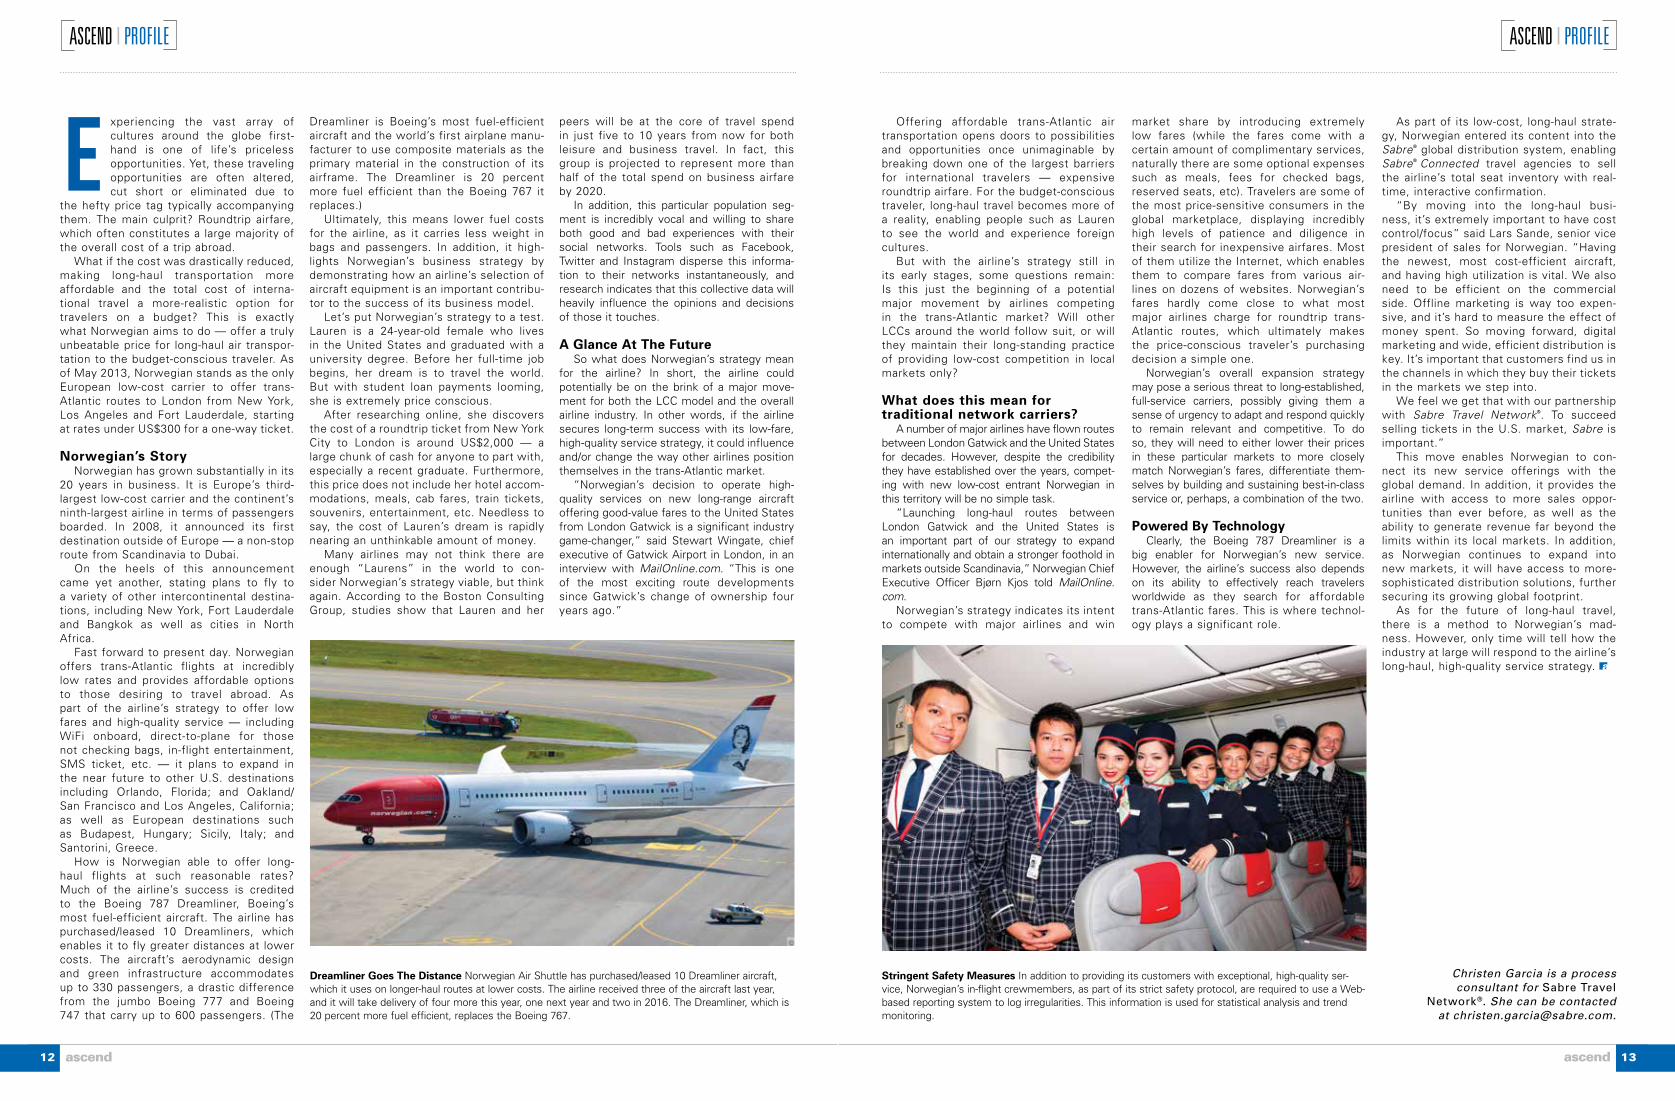
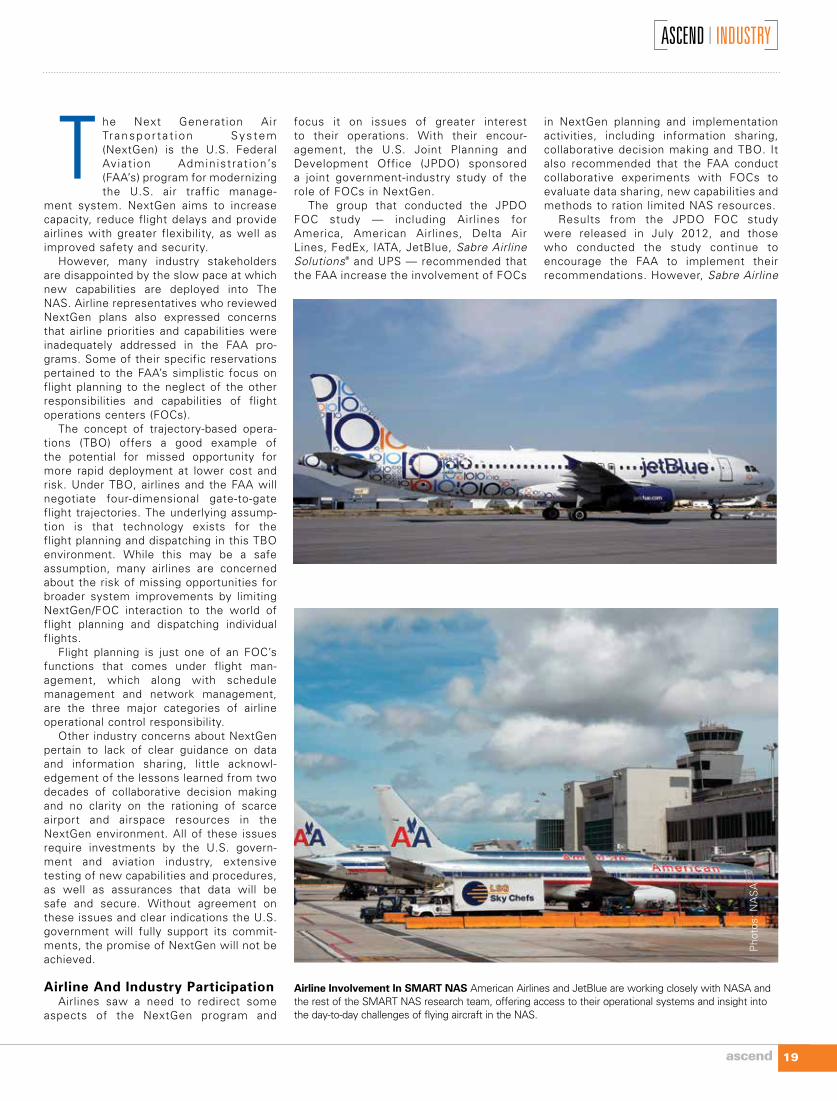
Airline Involvement In SMART NAS American Airlines and JetBlue are working closely with NASA and the rest of the SMART NAS research team, offering access to their operational systems and insight into the day-to-day challenges of flying aircraft in the NAS.
T
Pho
tos:
NA
SA
ASCEND I INDUSTRYASCEND I INDUSTRY
ascend20 ascend 21
Solutions and participating airlines and industry organizations are simply not waiting for the FAA to accelerate the pace of NextGen deployment. In recent years, some airlines, including JetBlue and American Airlines, have worked with the U.S. National Aeronautics and Space Administration (NASA) to develop air-traf-fic management improvements, including conducting live operational tests. Some of the new technologies undergoing testing include Automatic Dependent Surveil lance-Broadcast (ADS-B) and improved re-routing around convective weather.
SMART NASThe Airspace Systems Program conducts
NASA’s basic research and development for air traffic management. As the principal research partner with the FAA in develop-ing NextGen, the program develops new concepts and evaluates them using a suite of fast-time models and human-in-the-loop simulation laboratories. For technologies that show promise, NASA conducts opera-tional evaluations using real data and airline participation during normal operations.
A recent example is the Dynamic Weather Routes (DWR) decision-support tool tested by American Airlines, NASA and the FAA’s Fort Worth Air Route Traffic Control Center in Texas. The airline con-tinues to operate DWR, as it generates savings of several minutes per affected flight.
The success of decision-support tools, such as DWR, persuaded NASA to develop other capabilities to improve NAS performance. However, current operational testing facilities are limited, typically able to assess only one concept at a time, with one airline and one FAA facility. To demonstrate the technical feasibility and operational benefits of many NextGen concepts such as TBO, the aviation com-munity must be able to conduct operational evaluations on integrated systems across The NAS.
To meet the need for more robust operational testing, NASA initiated a new research project, the Shadow Model Assessment Using Realistic Technologies for the National Airspace System, or SMART NAS.
NASA released the solicitation in May 2013, and Sabre Airline Solutions joined the proposal team led by Robust Analytics. In December 2013, NASA awarded the Robust Analytics team a two-year, US$1.9 million contract to design a system archi-tecture for SMART NAS.
In addition to Sabre Airline Solutions, the Robust Analytics team includes ATAC, Flight Research Associates, IBM
Federal Systems, JVN Communications, JetBlue and American Airlines. The Robust Analytics team offers NASA a power-ful combination of experience in building enterprise architectures, air traffic model-ing and simulation, airline planning and operations, aviation data, and benefit-cost assessments.
What will SMART NAS accomplish for NASA, U.S. airlines and the aviation community?
SMART NAS is an important new com-ponent in NASA’s efforts to transform The NAS. Under the transformational NextGen concepts, new air traffic capabilities and technologies need to be demonstrated in an integrated fashion in a real-time envi-ronment to gain confidence that they will perform as expected. A “shadow-mode” operational evaluation uses live data feeds from The NAS and its inputs (such as weather, flight plans, airport arrival rates, system constraints, etc.) and runs the entire system, or parts of it, with proposed concepts, air-ground architectures and technologies to test their performance and validate that the assembled technologies work together seamlessly.
This capability will allow integrated, real-time and/or fast-time assessment of gate-to-gate operations and their
performance using real-world NAS inputs. As envisioned, SMART NAS will allow for plug-and-play of different technologies to operate in combined real, virtual and con-structive manners to support a wide range of technology evaluations.
Delta Air Lines’ Participation Delta Air Lines, in conjunction with Airlines for America, American Airlines, FedEx, IATA, JetBlue, Sabre Airline Solutions and UPS, conducted the JPDO FOC study and made several recommendations to the U.S. FAA, including that it involves airline FOCs in NextGen planning and imple-mentation activities.
SMART NAS offers the aviation community enhanced capabilities to evaluate improve-ments to air traffic management.
HIGHlight
SMART NAS offers the aviation com-munity enhanced capabilities to evaluate improvements to air traffic management. Early applications will likely include TBO, integrated arrival-departure management and assimilation of unmanned aircraft into The NAS. The goal is to accelerate the deployment of aviation technologies for the benefit of aircraft operators, the FAA and the traveling public.
Each member of the Robust Analytics team brings unique capabilities to the SMART NAS partnership. Maryland-based Robust Analytics offers decades of experi-ence in air-traffic management research and development, modeling of aircraft operations and benefit-cost analysis.
IBM Federal Systems brings extensive knowledge of enterprise-scale architec-tures and data warehousing. ATAC has worked more than 30 years with NASA and the FAA, specializing in data processing and analysis, as well as fast-time modeling for aviation applications. Flight Research Associates supports the NASA Ames Research Center, conducting human-in-the-loop simulation of pilots’ and controllers’ interactions with new technologies. JVN Communications partners with the FAA’s Technical Center in Atlantic City, New
Jersey, to conduct operational testing and evaluation on all air-traffic management systems before their deployment into The NAS.
American Airlines and JetBlue offer access to airline operational systems and insight into the day-to-day challenges of flying aircraft in the NAS.
Sabre Airline Solutions provides unparal-leled expertise in airline operations, flight planning and aircraft monitoring, as well as AOC software and decision support.
The SMART NAS partners are tasked under the contract with three primary deliverables:1. Designing an open-source system archi-
tecture for SMART NAS that can satisfy a large set of required performance char-acteristics, such as flexibility and modu-larity, as well as evaluate a wide range of current and future aviation technologies;
2. Conducting a benefits assessment for NASA and the U.S. aviation community as a whole of SMART NAS;
3. Estimating the 10-year cost of develop-ing and maintaining SMART NAS.The final deliverables are due in
December 2015. Until then, the SMART NAS team is working with NASA research-ers and aviation partners to design an
operational evaluation capability that will support acceleration of the deployment of improvements to the U.S. air transportation system. a
Peter Kostiuk is president of Robust Analytics. He can be contacted at
NASA’s New Research Project NASA expects to speed up transformation of the U.S. National Airspace System (The NAS) through its new research project, SMART NAS, to create an open-architecture simulator of The NAS. This will enable airlines, researchers, technology companies and aviation organizations to con-nect to the simulator and evaluate new technologies and/or policies to help increase the capacity, safety and efficiency of the system.

Compensating The Right Customers In The Right Way Following Flight Disruptions
Swinging theProfit PeNdulum Repairing Maintenance and Fuel Costing
By Peter Berdy I Ascend Contributor
Most airlines allocate maintenance costs and fuel consumption on a per-hour basis for route decision-making. This simple method understates or overstates costs for very short or long segments, and it can lead to errors when calculating route profitability. A better methodology for maintenance is to separate cycle-related costs from hour-related costs, and for fuel to develop a formula based on actual consumption. This improved methodology produces more accurate results and can swing the profit pendulum.

hile maintenance engineers utilize the latest tools and technology to fix airplanes, something else is in need of repair. The current process of allocating maintenance costs at the corporate level, where route
analysis is performed and fleet allocation and planning decisions are made, is outdated and, at times, inaccurate.
Many corporate analysts do not under-stand how maintenance is performed, nor do they utilize the best method for distrib-uting maintenance costs fairly across each flight in the network.
Why is this important? After years of nega-tive to slightly positive results, profit margins are finally expected to recover. In fact, they were in the 3 percent to 4 percent range worldwide last year. With such razor-thin mar-gins, mistakes can greatly impact the bottom line. As a result, decisions, such as whether to cancel a flight due to profit performance, must be carefully made.
Unfortunately, these decisions can be ill-advised when based on inappropriate alloca-tion of costs. Maintenance and fuel are areas where cost allocation can significantly swing the profit pendulum of a route.
Maintenance RealitiesAirlines follow a rigorous inspection and
maintenance program that must be approved by an airworthiness authority such as the U.S. Federal Aviation Administration or the European Aviation Safety Agency. Under the oversight of these authorities, each air-line is required to prepare a Continuous Airworthiness Maintenance Program covering both routine and detailed inspections.
These maintenance programs have evolved over time as more efficient and effective work methods have been developed. Consider the extensive number of scheduled tasks per-formed when an airplane undergoes heavy maintenance. Many years ago, these tasks had to be completed simultaneously, which removed an aircraft from service for periods as long as several weeks.
However, using approved, modern work methods, these tasks are stream-lined. An efficient maintenance program can minimize the time an airplane is out of service, balance the maintenance work-load and maximize use of maintenance facilities.
Scheduled maintenance tasks are now grouped into work packages. The concept is called block maintenance or some-times progressive maintenance. While the maintenance-check letter series of A, B, C and D are still used, checks have evolved to combine work packages.
Activities performed under an airline’s maintenance program include tasks that
must be completed at varying intervals, as specifically defined in the program. Work intervals can be based on flying hours, flight cycles, calendar time, and/or a combination of these, depending on the most appropriate parameter of the item maintained. Of the thousands of components and numerous systems on an airplane, each one has a specific maintenance interval. The task of combin-ing these components and systems by the different intervals of hours, cycles and time for cost allocation purposes can indeed be overwhelming.
Typically, maintenance costs are sepa-rated into direct and indirect expenses. Direct costs are the expenses associ-ated with the labor and materials required to perform servicing, repair, modifica-tion, restoration, inspection, testing and troubleshooting tasks. Indirect costs, or overhead, include maintenance supervi-sion, training and planning; equipment rental; and utilities. Overhead costs do not include capital expenses for facilities, spare parts, test equipment, maintenance tooling and ground-support equipment.
Direct maintenance costs can be broken down into standard groupings with costs distributed approximately as follows: Engines (40 percent), Components (20 percent), Line (20 percent), Base maintenance (20 percent).
These groupings can be a helpful guide for developing a more accurate way to allocate maintenance costs.
Maintenance Cost MethodologyThe methodology commonly used by
most airlines for estimating maintenance costs distributes expenses by block hour. The reason for selecting block hours as the basis for cost allocation is related to manufacturer recommendations for airplane maintenance checks, many of which are performed at specified flight-hour-related intervals. Airline analysts use block hours as a proxy for flight hours since block hours are a more commonly available statistic than flight hours in most airline databases. The difference between the two is that block hours include aircraft taxi time.
Allocating maintenance costs by block hour is a common practice among airlines for simplifying analysis. This approach is adequate when there is not a lot of dispersion or standard deviation from the average stage length (the average distance flown calculated by dividing total aircraft miles by the total number of departures) for a particular fleet type. Flights that deviate significantly from the average stage length, especially short segments such as tag-end flights and long-distance segments, are where maintenance costing issues may surface.
ASCEND I INDUSTRY
ascend 23
w
Departures By Distance Many carriers operate a mix of long- and short-distance flights within a single fleet type. The dispersion of Lufthansa’s Airbus A321 operations from November 2013 schedules displays that at the extremes, the airline operates stage lengths as short as 156 kilometers (Frankfurt to Stuttgart) and as long as 3,049 kilometers (Frankfurt to Amman, Jordan). The average stage length for Lufthansa’s Airbus A321 operations is 999 kilometers.
Nov 2013 Lufthansa Departures By Distance (KM)

ASCEND I INDUSTRYASCEND I INDUSTRY
ascend24 ascend 25
When there is significant deviation from the average stage length of a fleet type, maintenance expenses for short-distance segments are understated using cost-per-block-hour allocation. On the other hand, routes with long stage lengths will have overstated maintenance costs. This is because not all mainte-nance costs can be measured in block hours. The question, then, is, “How much deviation from the average is significant when calculating costs, impacting the choice of methodology, etc.”?
If the standard deviation is great (i.e., there are a lot of segments that are not close to a fleet’s average stage length), it is a good idea to modify the maintenance methodology utilized.
Cycle-Related CostsMaintenance tasks, such as shop vis-
its, replacing or overhauling life-limited parts, flaps, engine-thrust reversers, and tires and brakes, are not related to block hours. Rather, these items wear out during cycles (take offs and landings) or are required to be checked after a certain number of cycles as specified in an airline’s maintenance program. Of course, many less-obvious items require an understanding of maintenance pro-cedures to identify whether their costs should be allocated by hour, cycle or time.
Fixing Maintenance Cost Allocation
A best-practices methodology for maintenance cost allocation takes into consideration both hours and cycles. There are two ways to do this. One is to develop two unit costs, one for block hour-related costs, and the other for cycle related costs. The second is to develop a formula per block hour that incorporates cycle costs as well as block hour costs.
The result will be a more accurate approximation of maintenance costs for segments that are very short or long compared with estimates generated by a block-hours-only allocation methodology. The challenge then is to determine which costs are cycle related and which are hour related.
The method for identifying cycle-related and hour-related costs can range from relative simplicity to performing a detailed analysis. Most carriers’ accounting sys-tems provide a breakdown of the major maintenance elements, such as labor, engine and airframe overhaul, and repair costs.
To determine the unit driver of or basis for these costs, analysts should coordi-nate a review with a maintenance director or maintenance analyst to identify which costs are hour related and which are cycle-related. With a bit of preparation and analysis, these in-house maintenance
experts can educate airline management about the fundamentals of cost allocation, as well as provide insights on how main-tenance is performed. Equipped with this knowledge, airline analysts can develop an appropriate basis for cost allocation.
One approach is to separate direct labor from other maintenance costs. As a rule of thumb, about one-third of all direct labor, typically line maintenance, involves preparing the plane for its next flight, or cycle. The remaining two-thirds of direct-labor costs are assumed to be hour related.
After labor has been isolated, other direct maintenance costs can be addressed.
Hot SectionA substantial proportion of mainte-
nance expenses, approximately 40 percent, are related to engine perfor-mance. The hot section is the chamber in the engine where fuel is continu-ously burned. When an engine powers a short-distance flight, it produces a disproportionate amount of heat to gen-erate the required thrust compared with the amount for an average, or longer, flight. The heat wears down the engine hot section sooner, thereby driving up maintenance costs.
Engine manufacturers have developed formulas that calculate the engine derate value for each flight to minimize “wear and tear” and subsequently improve engine life and reliability. With this infor-mation, the derate value of any flight can be compared with the average value for a specified fleet type. From there, it is easy to use the de-rate value for each fleet type by block hour.
Indirect CostsA similar approach is used to allocate
indirect costs to cycles and block hours. Simply subtract the percentage of total hour-related direct costs from the total maintenance overhead. The remainder of maintenance overhead is considered cycle related.
Analysis Wrap-up As a result of the analysis, three ele-
ments are now available for accurately estimating maintenance costs: a rate per hour, a rate per cycle and a formula for the engine derate. The last step is to plot sev-eral points based on different block times to create a “cycle-adjusted” maintenance cost per block hour.
The distribution of maintenance costs between hours and cycles should remain fairly constant over time. Therefore, a detailed analysis of cost allocation is only necessary periodically. Rather, mainte-nance costs should be updated as needed and the maintenance formula adjusted accordingly. For example, if maintenance costs increase by 5 percent versus the prior year, the maintenance curve is adjusted by five percent.
Most airlines allocate maintenance costs on a per-hour basis. This simple method understates or overstates costs, especially for very short or long segments and can lead to incorrect conclusions about route profitability. Comparing the different methodologies for maintenance can produce significant differences in costs. Allocating maintenance using both cycles and block hours produces about one-third more costs for very short seg-ments compared to using a block-hour-only methodology. For very long segments, total maintenance costs are nearly 10 percent lower.
By using a combination of hours and cycles to develop a new maintenance cost-allocation formula, this methodol-ogy produces more accurate profitability results compared with those generated by utilizing a constant maintenance cost per hour.
Obviously, maintenance expenses vary widely based on fleet type, age and com-plexity, as well as labor costs and use of third-party MRO providers. Each airline’s operation is unique, and its maintenance cost-allocation methodology must be care-fully reviewed and continually refined to swing the profit pendulum in its favor.
FuelMany airlines allocate fuel costs by
multiplying the average fuel consump-tion per block hour by the cost of fuel at each station. This is usually done when
the actual consumption is not known or must be forecast such as for new routes. Similar to maintenance costs, this approach is adequate provided the seg-ment stage length is close to the average for that airplane type.
For networks with a lot of dispersion, this method will create distortions for
long- and short-distance segments. Why is that? Airplanes burn far less fuel dur-ing taxi compared with climb, cruise and descend. For example, for a flight of 45 minutes, the proportion of fuel consumed during taxi is about 33 percent of the total fuel burned. For a flight of two-and-a-half hours, taxi fuel is about 10 percent of
Direct Maintenance Costs The bulk of direct maintenance consists of engine costs at about 40 percent, followed by components, line and base maintenance.
Allocating Fuel Costs To allocate fuel costs, an airline should use actual consumption for each segment by aircraft type multiplied by the cost of fuel at the uplifted station. If that is not accessible, a more accu-rate formula should be created to show fuel consumption per block hour using recent historical data. It can then be used for any segment and multiplied by the appropriate cost of fuel at the uplifted station.
Maintenance Allocation Best Practices Both hours and cycles should be considered in as part of a best-practice methodology for maintenance allocation. A new formula for maintenance costs can be calculated by figuring in cycle costs. Maintenance will still be allocated on a block-hour basis; however, the correlation will be non-linear. This will result in a more accurate estimation of maintenance costs for segments that are very short or long compared to a block hours-only allocation methodology.
Maintnenance Cost Using Cycles And Hours Versus Average Cost Per Block Hour Direct Maintenance Costs By Category
FUEL CONSUMPTION PER BLOCK HOUR
A best-practice methodology for maintenance cost allocation takes into consideration both hours and cycles.
HIGHlight

ASCEND I INDUSTRY
ascend26
the total consumed. Since taxi consumes much less fuel than when the airplane is flying, the cost per block hour is lower than the average for very short segments and will be higher for long segments.
The best approach to allocate fuel costs is to use actual consumption for each segment (such as from a flight plan) by air-craft type multiplied by the cost of fuel at the uplift station. If that is not available, a more precise formula should be developed to show fuel consumption per block hour using recent historical data. This formula can then be used for any segment and then multiplied by the appropriate cost of fuel at the uplift station.
A Better MethodMost airlines allocate maintenance
costs on a per-hour basis. This simple method understates or overstates costs when looking at very short or long segments, and could lead to incorrect conclusions on route profitability.
A better methodology is to separate cycle-related costs from hour-related costs. The reasons are that a significant amount of costs are associated with cycles. Using a combination of hours and cycles can produce more accurate profitability results compared to using a constant maintenance cost per block hour.
For fuel, airlines that use the average consumption per block hour overstate fuel costs for short segments and understate costs for long segments. A more accurate method is to use actual fuel consumption from a flight plan, or if that is not avail-able, develop a formula of fuel burn based on stage length using recent historical data. a
Peter Berdy is a consultant for Sabre Airline Solutions®. He can be contacted
Aircraft Maintenance Checks
The daily check is the lowest scheduled check. It is a cursory inspection of the aircraft to look for obvious damage and deterioration. It checks for “general condi-tion and security” and reviews the aircraft log for discrepancies and corrective action for the airplane to remain airworthy.
The A Check is the next higher level of scheduled maintenance. It typically takes place at a designated maintenance station and includes the opening of access panels to check and service certain items. Some limited special tooling, servicing and test equipment is required.
C and D Checks are known as heavy checks. They typically take place at the main maintenance base of the airline or outsourced to third-party service providers where specialized manpower, materials, tooling and hangar facilities are available.
The C Check is an extensive check of individual systems and components for ser-viceability and function. It requires a thor-ough visual inspection of specified areas, components, systems, and operational or functional checks.
The D Check is a structural check including detailed visual and non-destructive test inspections of the aircraft structure. It is an intense examination of the structure for evi-dence of corrosion, structural deformation, cracking and other signs of deterioration. It involves extensive disassembly to gain access for inspection.
Today’s maintenance programs do not use a B Check interval. Tasks formerly defined for this interval have now been distributed between the A and C Checks.
A typical Phase Check is a thorough visual inspection of specified areas, components and systems and also operational or func-tional checks of specified components and systems. Each check includes the requirements of lower-check work items and portions of C and D Checks at the required task intervals. Check packages are detailed, and there are many variations of the concept.
Daily Check
A Check
B Check
Heavy Checks
Variations – Phase Checks

Technology is necessary to help effectively move passengers smoothly and efficiently through airports. Nevertheless, what happens when an airline’s check-in system goes down at the airport? Are airlines prepared to effectively process passengers when technology is disrupted?
Diminishing The Impact Of An Airport Technology Malfunction
System Failure By Jeffrey Schuyler I Ascend Contributor

n a recent business trip, I experienced a situation where the airline’s check-in system malfunctioned and passengers could not be processed. As frustration grew within the
crowd standing in the airport lobby, I watched the agents and saw a look of fear on their faces. The question at hand was, “When will the check-in system be back online?”
I stood in line with a Web check-in boarding pass and a printed copy of my itinerary and assumed I was ready to board. Even passen-gers who arrived with the necessary paperwork and only carry-on luggage discovered they were not able to check in and proceed through immigration and security.
After waiting an hour and 20 minutes, a group of airline supervisors appeared with printed passenger name lists for each flight. After a 10-minute briefing with the agents at the counter, the check-in process began. Passengers were placed in queues based on flight departure times. Most flights experienced lengthy delays, and in a hub-and-spoke opera-tion, such delays ripple through the remainder of the day’s operation.
As a former airline employee, I spent sev-eral years working behind an airport check-in counter, handwriting boarding passes and bag tags. So the solution was blatantly obvious to me: the airline should process passengers manually. Then I realized many years had passed since I had worked behind the counter.
Today, agents are not trained to handwrite bag tags and boarding passes. Therefore, even though the agents were given passenger name lists and briefed on how to proceed, I could still see the panic on their faces as they manually processed passengers through to security.
As I stood with the crowd in the lobby, supervisors continued to assure us we would not miss our flights because they were pro-cessing passengers in order of departure times. Finally, a sense of calm came over us. Still, I wondered what the airline could have done to adequately prepare for this type of disruption.
To prepare for similar situations in a way that does not disrupt the entire operation, air-lines should have a business plan that enables them to shift from automated to manual mode quickly and effectively. The process should include: Training airline agents how to handwrite bag
tags and boarding passes, as well as verify the information from the passenger lists to ensure it agrees with the passengers’ itin-eraries.
Coordinating with the local immigration offices and the security divisions to deter-mine which manually generated documenta-tion is acceptable for passengers to continue through the screening process.
ASCEND I INDUSTRY
ascend28
ASCEND I INDUSTRY
ascend 29
Customer Satisfaction Irregular events, such as power outages, can have a devastating impact on an airline and leave its customers unhappy and, sometimes, outraged. Yet, if handled the right way, the airline can end up being the hero, boosting customer satisfaction to a new level.
Designing a mutually agreeable validation stamp agents would access when such a situation arises. The validation stamp com-municates to immigration and security that all necessary checks and passenger infor-mation have been verified and allows the passenger flow to continue with minimal disruption to the operation. In addition, an emergency communications
strategy is necessary to ensure airline employ-ees and passengers are routinely updated about the situation and the actions the airline is taking to resolve the issue.
In my situation, airline supervisors con-tinued to make announcements advising that the check-in system was down, and
no information was available about when it would be back online. However, after hearing this announcement three times, I became frustrated. We knew the system was down, but what we really wanted to know was how the airline planned to manage this problem, so we could board our planes and get to our destinations.
Had a process been in place, the supervi-sors could have announced that they were switching to a manual mode and arrang-ing passengers by destination in designated queues, which would require approximately 10 to 20 minutes to prepare. This type of pro-active communication would have informed customers that an alternative process was
already in place and check-in would resume in a few minutes.
These actions allow the airline to com-municate to customers that the technology issue has been identified and, while it is not expected to be fixed in the immediate future, a plan is in place for such an event.
Another serious issue was the operational delay resulting from the 90 minutes it took for airline personnel to determine how to proceed. Had a plan been in place, the delay might have been reduced to the mere 10 to 20 minutes required to activate the alternate plan. The first few flights may have experienced a 20-minute delay, but the remainder of flights could have departed as scheduled.
A hub operation relies on aircraft to depart and return on time to maintain the structure and integrity of an airline’s operation. An alternate plan, even a simple one, can avoid disruptions, maintain customer satisfaction and, ultimately, save operational costs.
Therefore, airlines should consider which processes are currently in place and design and implement a back-up process to keep the operation on track in the event of a system outage. The manual process presents one solution. However, smartphones and tablets could also be used, providing a more-automat-ed solution. Network-enabled tablets would allow agents to continue the check-in process if local Internet connectivity was an issue. The tablets could then print boarding passes to a mobile printer carried by the agents as well. Use of the tablet as a normal check-in process provides mobility for the agents as well as a technology back up in the event of a local network failure.
Clearly, airlines should have a business plan in place to operate effectively and efficiently when conditions are less than ideal. Their abil-ity to execute proactive decisions and communicate alternate plans to customers enables them to recover from the events with minimal impact to operations and associated costs while ensuring a positive experience for customers. a
Jeffrey Schuyler is a senior management consultant for Sabre
Airline Solutions®. He can be contacted at [email protected].
Proper Training Despite a passenger check-in system malfunction, getting customers through security and to their gates in a timely manner is quite possible when an airline’s check-in and gate agents have been properly trained to effectively manage an adverse situation.
Ripple Effect A business plan whereby an airline can quickly shift from automated to manual mode can prevent serious delays that will ultimately ripple through the remainder of the day’s operations.
Pho
tos:
Shu
tter
stoc
k
O

Because airlines are only allotted four-digit flight numbers in their flight-numbering scheme, some airlines are challenged with finding creative ways to number their flights as they near the 9,999 flight-number cap. Adding a fifth digit appears to be a quick fix; however, the asso-ciated costs in doing so outweigh the benefits. Therefore, alternative options have been identified for resolving the issue without enor-mous capital outlay.
Alternative Options For Numbering Flights Have Become A Necessity
Flight NumberingAlternatives
By Peter Newell I Ascend Contributor

ASCEND I INDUSTRY
ascend 31
ssigning numbers to flights may not be viewed as one of the more excit-ing or significant airline activities. It is not as scientific as fuel-tankering or block-time analysis. It lacks the
mathematical complexity of fare-class align-ment or fuel hedging. It does not carry the important safety implications flight-operations or line-maintenance processes do. It may not be as inherently interesting as marketing research or as highly anticipated as network planning.
That said, flight numbering is much more than a random process, and it is important. Many airlines put much consideration and effort into their flight-numbering processes. In doing so, they generally follow certain required rules and optional guidelines when assigning flight numbers. While flight numbering is an ongoing process, most of the work is done biannually and is driven by IATA’s designated summer and winter seasonal dates.
IATA’s two schedule seasons corre-spond to when Daylight Savings Time is or is not observed in European Union nations. Therefore, summer season begins on the last Sunday in March, while Winter season com-mences on the last Sunday in October.
While there are some airlines that develop specific schedules for as much as four sea-sons — and some do not have any seasonal differences — the majority of airlines around the world design specific schedules for at least the two IATA seasons. It is during these major schedule change periods where airlines typically make flight number modifications.
Numbering RequirementsWhen designing a flight numbering scheme,
airlines must comply with two basic rules instated by IATA:1. An airline cannot repeat a flight number
departing from the same station on the same date.
2. Flight numbers can have no more than four numeric digits.For example, a carrier may assign a single
flight number, such as 0100, to a “through” routing of AAA-BBB-CCC-BBB-AAA. However, it cannot assign a single number to a routing of AAA-BBB-AAA-CCC because the routing involves two departures from AAA.
Airlines select their own flight numbers subject to these basic rules. However, air traffic management agencies, such as EUROCONTROL and the U.S. Federal Aviation Administration (FAA), may advise airlines to change flight numbers to avoid: Multiple flights with the same number by
the same carrier in the air simultaneously, Multiple flights with the same or similar
number (even if the carriers are different) that are scheduled to arrive at the same airport when the timing is expected to be close enough to potentially cause confusion,
Multiple flights with the same or similar number (even if the carriers are different) that would share proximate airspace during a similar time of day.For example, assume American Airlines
assigns flight number 0621 to a DFW-JFK route with a scheduled arrival of 11:25 a.m. Delta Air Lines then schedules a new ATL-LGA flight to arrive at 11:40 a.m. and assigns a flight designator of DL1621.
In this instance, the FAA would likely require Delta Air Lines to change its number to prevent confusion with the existing American Airlines flight that occupies proximate air space. Because airlines rarely anticipate such scenarios, they simply comply with change requests as received.
Historical PracticesIn addition to compliance requirements,
airlines also follow a set of internal optional guidelines designed to promote organizational consistency when assigning flight numbers. These guidelines vary by region and/or carrier, but commonly include: Even numbers for northbound and east-
bound flights and odd numbers for south-bound and westbound flights,
Odd numbers for outbound flights depart-ing from hubs and even numbers for flights returning to hubs,
Flight numbers that increase in sequence throughout the day in multiple-frequency markets,
Ranges by regional or other grouping (for example, international flights 0-199, domes-tic flights 200-999)
Ranges by connection carrier (such as 3000-3999 for the first regional carrier, 4000-4999 for the second regional carrier, etc.)
Ranges by codeshare partner (5000-5999 for one partner, 6000-6999 for another partner). Keep in mind:
Some codeshare agreements mandate use of a specified number range for certain partners.
Often marketing flight numbers add a multiple of 1000 (e.g., +3000 or +6000) to the corresponding operating flight num-ber. For example, if AeroMexico codes on DL611, it might use the flight number AM*2611 (with the asterisk indicating that it is a codeshare).
Ranges by service type (for example, 8000-8999 for charters, 9000-9899 for freighters, 9900-9999 for ferry flights, etc.). In some cases, airlines designate specific ranges for peripheral or related services such as bus or train routes.
Retiring flight numbers involved in past inci-dents,
Avoiding numbers with cultural or symbolic connections, such as 13, 666, 1313, etc.,
Assigning numbers to specific routes with historical or symbolic significance, including
8, which has symbolic positive meaning in the Far East for Asian flights; 711, which represents luck for Las Vegas flights; and 1776, representing the year of America’s Declaration of Independence, etc.
Reserving flight No. 1 for an airline’s “flag-ship” flight.By utilizing a consistent, predictable
flight-number pattern, both airline employ-ees and experienced passengers can more quickly and easily identify flight routes, types and departure terminals.
For example, a 3000-series flight num-ber may indicate to interested parties that the flight is on a regional carrier and will, therefore, depart from a specific terminal or concourse.
However, changes to traditional number-ing practices are taking place at some larger airlines. Optional fight-numbering practices routinely used by most airlines in past years are being modified or, in some cases, discarded as the industry evolves with the expansion of alliances and mega-mergers.
Trends And ObstaclesMany planning, operations and commer-
cial systems currently used by airlines are based on IT infrastructure designed 30 or more years ago. Even though the systems and the technology have evolved, the logic behind these systems comes from a time when the industry environment was far different.
When these systems were developed, few codeshare agreements existed, and it was widely believed throughout the airline industry that four digits would be more than sufficient to cover any carriers’ flight- number needs. Even the largest airlines of the era operated fewer than 2,000 flights per day, and most in the industry could not have predicted that airlines would one day need more than 9,999 flight numbers.
Therefore, industry database and soft-ware designers built the infrastructure and subsequent technology with a hard-coded limit of four digits. Only in recent years has the four-digit flight-number limit become an issue due to the upsurge of codeshare flying driven by the expansion of alli-ances. In addition, recent mega-mergers of large airlines have resulted in consolidated networks with flights close to the 9,999 maximum.
Problem ResolutionTo address the issue of insufficient flight
numbers, some airlines have modified their flight numbering practices to “save” num-bers, including: Discarding the odd/even approach and
assigning the same flight number to outbound and return flights (for example,
A

ASCEND I INDUSTRY
ascend32
AA2239 for ORD-DFW-ORD or DL1910 for ATL-DFW-ATL),
Applying “through” numbers to circuitous continuous routings (for example, same flight number for LAX-DFW-SFO),
Condensing flight-number ranges and limit-ing unused numbers within a range,
Abandoning the practice of adding a multiple of 1000 to partner operating flight numbers and simply assigning marketing flight num-bers based on the first-available number to keep ranges smaller,
Routinely reviewing and modifying existing codeshare-partner flight-number ranges,
Discontinuing “blanket codeshares” in which an airline places its code on all its partners’ flights, in favor of selective coding on partner flights.Unlike some of the more drastic changes
recently adopted by the airline industry, such as charging fees for checked baggage or moving to paperless ticketing, flight-number modifications will have minimal impact on travelers.
However, these modifications are only “stop-gap” measures. As airlines continue to add alliance and codeshare partners and participate in mergers and acquisitions, some will soon reach the 9,999 flight-number ceil-ing, even with these measures in place. In all likelihood, a more fundamental change to the aviation industry regarding how flights are numbered is necessary.
Future PossibilitiesImagine a scenario in which SkyTeam and
oneworld merge into a single alliance with all partners wanting to blanket code on all other
partners and not be limited to only coding on a limited number of selected flights. Or, suppose large network carriers such as Delta Air Lines and United Airlines merge. What then? “Stop-gap” measures will no longer be sufficient to allow mega-carriers to remain below the maximum flight-number ceiling. In fact, that limitation will likely be reached even before these potential scenarios become reality.
So what is the next step for the airline industry?
On the surface, the easiest solution is to expand flight numbers to five digits. The idea was proposed several years ago by some major airlines during the biannual IATA Schedules Information Standards Committee meeting. IT providers were asked to analyze the impact of expanding to five digits. They examined the process necessary to recode and reformat commercial and operational sys-tems, as well as update related infrastructure, and determined that the effort to implement such changes would be larger in scale than the Y2K transition had been for airlines, and the costs would be in the hundreds of millions of dollars with the potential to exceed US$1 billion.
While five-digit numeric flight numbers may not be the answer considering the excessive investment required, there are a few viable alternatives: Add a letter to the four-digit flight numbers
(e.g., UA1001X, BA950B, etc.); however, adding a non-numeric character is con-sidered an operational suffix, and some commercial systems do not treat the opera-tional suffix as part of the flight number, and some cannot even accept it.
Adding a letter to the four digits is an issue for some reservations systems (although it may be allowed in some operations sys-tems). So this could be as difficult as adding a fifth numeric digit.
Provide larger carriers with additional airline codes for use on codeshare flights.
Allow smaller carriers to sell ranges of flight numbers with their flight-designator codes to larger airlines that no longer have enough numbers on their own designator codes.
Allow airlines to have multiple designator codes.
Leverage technology, such as Sabre®
AirVision™ Codeshare Manager, that maxi-mizes the use of flight numbers (especially codeshare flight numbers) to ensure num-bers are not under used or wasted.Such alternatives are more cost effective
than moving to five-digit flight numbers, but they also require some investment and effort from both airlines and systems providers. Therefore, a thorough analysis of all options should be conducted to determine the best medium- and long-term approach.
Although additional alternatives are likely to be introduced and evaluated, it is becoming increasingly clear that a change in flight num-bering is inevitable. However, in the interim, using tools to get the maximum usage of cur-rent flight number ranges is the best short-term alternative. a
Peter Newell is a principal consultant for Sabre Airline Solutions®. He can be contacted at [email protected].
According to ATAG, livelihoods of
people in Africa depend on trade in air-freighted fruit, vegetables and flowers to the United Kingdom alone.
While air transport carries approximately
of the volume of world trade shipments, it is over 35 percent by value, according to ATAG. This means that goods shipped by air are very high-value commodities, often times perishable or time-sensitive.
1.5 million
0.5 percent Countit up
Interesting facts and figures in the airline industry.

-DQ�����������PDUNV�WKH�GDWH�RI�WKH�ӾUVW�FRPPHUFLDO�DYLDWLRQ�ӾJKW��2Q�WKDW�GD\��6W��3HWHUVEXUJ�7DPSD�$LUERDW�/LQH��637�$LUERDW�/LQH��EHFDPH�WKH�ӾUVW�FRPPHUFLDO�DLUOLQH�ZKHQ�LW�FDUULHG�D�VLQJOH�SDVVHQJHU��IRUPHU�PD\RU�RI�6W��3HWHUVEXUJ��)ORULGD��$EUDP�&��3KHLO��DFURVV�WKH�7DPSD�%D\��3KHLO�SDLG�86������HTXLYDOHQW�WR�86�������LQ�WRGD\·V�FXUUHQF\��IRU�WKH����PLQXWH�ӿLJKW�EHWZHHQ�6W��3HWHUVEXUJ�DQG�7DPSD��)ORULGD��7KH�%HQRLVW�ӿ\LQJ�ERDW�ZDV�SLORWHG�E\�7RQ\�-DQQXV��DQG�WKH�ӿLJKW�ZDV�WKH�VWDUW�RI�ZKDW�ZRXOG�EHFRPH�D�WKULYLQJ��HYROYLQJ�LQGXVWU\��,Q�WKH�����years to follow, the airline industry has made phenomenal advancements.
Landmark Moment: Happy 100th Anniversary Commercial Aviation!

Technical, Operational And Financial Analyses
FOUNDATIONFOR AIRCRAFTSELECTION
Choosing the right aircraft requires a complete evalua-tion of technical, operational and financial perspectives. While newer Airbus and Boeing aircraft, for example, have evolved to be much more cost effective in areas such as fuel burn and maintenance, each aircraft type also offers unique benefits depending on an airline’s business model. For example, analysis shows that the Airbus A319 oper-ates more efficiently for low-cost carriers (LCCs), while the Boeing 737-300 is better suited for network carriers.
By Prof. Bijan Vasigh, College of Business Embry-Riddle Aeronautical University I Ascend Contributor

ascend 37
ASCEND I INDUSTRY
Historical and Current EvaluationDetermining a single price for a specific used
aircraft type is difficult at best. Aircraft valuation and selection is a complex process. The price of an aircraft depends on many factors such as: Aircraft age, Flight hours, Noise level, Flight cycles, Size, Seat capacity, Fuel efficiency.
In general, aircraft values depreciate over time as aging structures require an increasing amount of maintenance and face the likelihood of obsolescence. Unfortunately, the rate at which maintenance costs increase is typically higher than the rate at which non-operating costs increase. (Non-operating costs are related to financial activities of an airline that are not related to the core operations, such as interest expenses, charges on obsolescence of inven-tory and the cost of disposing assets.) However, increasing operating costs will at some point exceed an aircraft’s revenue-generating ability and, thereby, terminate its economic life.
Moreover, the aircraft price also depends on exogenous forces such as fuel costs, financial crises, economic cycles, demand volatility, envi-ronmental regulations, aircraft safety and other factors affecting demand.
Recently, increasing fuel costs have prompt-ed airlines to withdraw larger, older aircraft from active service and, on some occasions, smaller planes such as regional jets as well. The global financial crisis of 2008, assumed by some to be the worst since the Great Depression of the 1930s, according to Reuters, forced many airlines to furlough employees as the price of fuel skyrocketed and consumer demand plummeted.
Because fuel prices remained high during the first half of 2008, many carriers worldwide replaced their older fleets with new, more fuel-efficient aircraft. More airlines went bankrupt in 2008 than in the aftermath of Sept. 11, 2001, resulting in another significant drop in the value of older aircraft. For example, Delta Air Lines retired more than 350 aircraft from its fleet, while adding more economically efficient aircraft.
Exogenous forces such as terrorism, air-traffic liberalization and competitive-pricing practices by startups and LCCs can also sig-nificantly alter the demand for aircraft and, therefore, change estimated values.
The Sept. 11 attacks caused a decline in the market value of most commercial aircraft. Share prices of airlines and aircraft transactions plum-meted, and many older planes were retired to the desert. According to Reuters, just a week after the tragedy, Boeing announced plans to cut 30,000 jobs over the next two years.
Technological progress that reduces the operating costs of new aircraft, environmental
regulations restricting the use of older aircraft and/or higher fuel prices also depress the value of older, less-fuel-efficient aircraft.
On the positive side, the industry is expe-riencing a discernible reduction in aircraft operating costs through the contribution of advanced technologies such as improvements in aerodynamic characteristics and advance-ment in engine design. The application of advanced composite materials to various air-craft structures, such as the Boeing 787 and Airbus A350, enhance performance and reduce weight. As a result, aircraft today are 70 percent
more fuel efficient than 40 years ago, and 20 percent more fuel efficient than 10 years ago.
The Boeing 737 MAX jetliner is expected to deliver 14 percent more fuel efficiency than the Boeing 737-800 NG. Undoubtedly, this will negatively impact the market values of Boeing 737 NGs and other classic aircraft.
As well, the Airbus A320neo is expected to provide an increase in range of approximately 500 nautical miles, in addition to an 8 percent reduction in operating costs, diminished noise production and 15 percent less fuel consumption than earlier models.
ontinued expansion of trade and tourism in emerging markets has strengthened the need for commercial aircraft. With global passenger-traffic growth project-
ed to reach 6 percent this year, Boeing expects jet sales to rise by 7.7 percent to US$112 billion.
For the first time, the airline industry passed the 3-billion-passenger milestone in 2013, according to Avolon’s 2014 New Year Outlook, which was released in January. Boeing plans to deliver 35,280 new aircraft, valued at more than US$4.8 trillion, between now and 2032.
According to an Airbus projection, air traffic will grow at 4.7 percent annually, requiring more than 29,220 new passenger aircraft and freighters at a value of nearly US$4.4 trillion.
Demand for commercial aircraft is also driven by resilient markets in Brazil, China, India and the Middle East, as well as continued moderate growth from developed markets in Europe and the United States. In fact, the number of passengers in China should more than triple, and the country’s airline fleets will double in size by 2020. Similarly, India is expected to buy more than 900 new pas-senger planes worth US$86 billion by 2027.
Air transport liberalization and stronger economic interdependence among nations require airlines to acquire more aircraft to replace aging fleets and meet future pas-senger growth. Airbus received an industry peak of 1,619 new airplane orders in 2013, a new record of aircraft backlog, according to Euronews.
With so many new and diverse aircraft types now available, the question arises as to how a prospective buyer can accurately evaluate the options offered.
First, when selecting aircraft, airlines should examine aircraft efficiency from three perspectives: Technical — Technical efficiencies are
directly related to an aircraft’s physical char-acteristics, including average airspeed, fuel burn and available seats.
Operational — Operational efficiencies are those an airline can fully or partially control during the course of normal operations, such as aircraft utilization and average stage length.
Financial — Financial characteristics are represented as the monetary impact of an aircraft’s technical and operational efficien-cies on an airline and are often expressed as fuel cost per block hour and fuel cost per ASM. In addition, maintenance and depreciation
factors are determined by the aircraft model and expressed in the form of maintenance and depreciation costs.
To illustrate these characteristics and effi-ciencies, competing narrow-body, wide-body and regional jet aircraft models from the major manufacturers were selected and analyzed
using various operational, financial and techni-cal metrics.
Each aircraft type was examined to determine how they have been used in the marketplace by airlines that have oper-ated a mix of aircraft. Individual historical and
current examples provided guidance for the selection and operation of new aircraft. For a prospective buyer to accurately evaluate the available options, it is necessary to evaluate these examples and the costs associated with them.
C
Narrow-body Comparison For Network Carriers There are numerous similarities between Boeing 737-700 and Airbus A319 operations and a few significant differences. The aircraft, with similar seat numbers and utilization per day, have significantly different average flight stage lengths. Network carri-ers that use the Boeing 737-700 compared to the Airbus A319 use it on a stage length that is 375 miles longer. When examining these aircraft from an operational and financial standpoint, it is important to realize that many of the cost differences are dependent on the airline.
Boeing 737-700 Advantages The Boeing 737-700 offers several advantages to network carriers in comparison to its competitor, the Airbus A319. The Boeing 737-700 presents cost savings on all the measured metrics. One of the most significant cost differences is in the flight crew costs of each aircraft. The Boeing 737-700 flight crew costs a significant US$160.98 less per block hour than the Airbus A319. The Boeing 737-700 also is more fuel efficient for network carriers with a cost of approximately US$65 less per block hour. When taking fleet sizes and numbers of hours network carriers fly, this quickly translates into substantial savings.
Pho
tos:
Shu
tter
stoc
k
CASM For Network Carriers Cost per Available Seat Mile (CASM) is significantly less for network car-riers that operate the Boeing 737-700. With greater fuel efficiency and longer average stage lengths, the aircraft has a CASM of US8.18 cents while the Airbus A319 costs US9.39 cents per seat mile. After factoring out fuel costs, the Boeing 737-700 still has a cost advantage over the Airbus A319. CASM, after excluding fuel costs per average seat mile, is US$3.55 and US$4.21 for the Boeing 737-700 and Airbus A319, respectively.
Block-hour Comparison The Boeing 737-700 costs significantly more for LCCs when it comes to crew costs; US$172 more than the Airbus A319 per block hour. This is directly related to Southwest Airlines’ higher crew compensation when compared to other LCCs.
ASCEND I INDUSTRY
ascend36
1,287
$4,140
912
$3,958
Average flight stage, miles
Total
Fuel, gallons per BH
Fuel
Speed, miles per block hour (BH)
Maintenance
Seats per aircraft
Flight Crew
Utilization (revenue hours/BH), %
Depreciation
Load factor, %
Aircraft Rent
Other Costs
703
$2,286
730
$2,242
390
$616
359
$552
124
$526
123
$587
86
$156
83
$124
78
$350
$206 $36
81
$417
737-700
737-700
A319
A319 US Dollars
Operational Characteristics Of Narrow-body Aircraft (Traditional Network Carriers) Cost Of Available Seat-miles (Network Carriers)
Average Block-Hour Cost Comparison (Traditional Network Carriers)
6RXUFH��&RPSLOHG�E\�WKH�author of Back Aviation Form 41
10.00
CASM
737-700
A319
8.00
6.00
4.002.00
0.00
Fuel per ASM
CASM excludingFuel
$3,720$2,981Total
Fuel
Maintenance
Flight Crew
Depreciation
Aircraft Rent
Other
$2,237$1,721
$276$296
$383$555
$52$242
$609
$162$108
$58
737-700 A319
Narrow-body Block Hour Cost Comparison (LCCs)
US Dollars
6RXUFH��&RPSLOHG�E\�WKH�author of Back Aviation Form 41
6RXUFH��&RPSLOHG�E\�WKH�author of Back Aviation Form 41
6RXUFH��&RPSLOHG�E\�WKH�author of Back Aviation Form 41

By all accounts, newer aircraft models pro-vide more efficient fuel consumption and lower operating costs. However, for some airlines, obtaining new aircraft is not always an option. Therefore, they may opt for a lower purchase price or lease option for older aircraft.
The remainder of this article provides a detailed analysis of the most popular narrow-body aircraft currently in operation. The first section compares the operating block-hour costs of a Boeing 737 with the Airbus A319 and A320 for traditional network carriers only. The second section makes the same comparison for LCCs only. The third and final section provides an over-all comparison of traditional airlines and LCCs based on total costs for the aircraft. Airlines And Their Aircraft
Several single-factor ratios are outlined to benchmark financial and operational performance for three narrow-body aircraft — Boeing 737-700, Airbus A319 and Airbus A320. These ratios can be used to compare and contrast different types of aircraft and lay the foundation for fleet planning and aircraft selection.
The Boeing 737 series is the best-selling jetliner in the history of the airline industry. More than 7,700 Boeing 737s have been pro-duced and 3,467 orders are yet to be delivered as of January. On average, 1,250 Boeing 737 aircraft are in flight at any given time, with 24 departing or landing somewhere in the world every minute. The Boeing 737-700, 737-800 and 737-900 compete directly with the Airbus A319, A320 and A321 in the narrow-body, short- to medium-haul commercial aircraft market. As of February, approximately 5,924 Airbus A320 family (comprising the A318, A319, A320 and A321) aircraft have been delivered, of which 5,723 are in active service.
These two families of aircraft are popular with LCCs. Southwest Airlines, WestJet, Virgin Blue and Ryanair use the Boeing 737 NG, while JetBlue, Virgin America and Air Asia utilize the Airbus A320 family, and easyJet flies both. These aircraft are also employed by net-work carriers. United Airlines, Delta Air Lines and American Airlines use the Boeing 737 NG family. United Airlines and Delta Air Lines also operate aircraft in the Airbus A320 family.
Regardless of the geographical location, fleet planning must be based on five funda-mental factors: Financial viability, Which aircraft best suits the network, When they are needed, How many are required, Replacement or net addition.
US Airways is currently the only U.S.-based network carrier that flies Airbus A320 aircraft but does not operate any Boeing 737 NG air-craft. Other Airbus A320 family users include Frontier Airlines and Spirit Airlines, both with more than 25 Airbus A319s in their fleet.
Operational CharacteristicsThe block-hour costs for each aircraft model
are compared for both network carriers and LCCs. Then each aircraft’s costs and the associ-ated benefits and savings are analyzed.
When comparing these aircraft from an operational and financial standpoint, it becomes clear that many of the cost differences, such as fuel costs, maintenance costs, labor costs and airport charges, are dependent on the airline. Fuel burn, for instance, is invariant, although it is indirectly affected by stage length, aircraft age and flight procedures. Nonetheless, air-lines consistently search for ways to conserve jet fuel and thereby lower their fuel costs.
However, some costs are relatively invariant to airline operations.
For example, India-based low-cost GoAir announced that it will only hire female cabin crew in the future to save £330,000 (US$538,974) a year on fuel because all-female crews weigh 33 pounds to 44 pounds less on average than mixed cabin crews. However, other costs, including crew salaries, aircraft depreciation, and aircraft and airport leases, as well as soft costs, such as high aircraft utiliza-tion, higher-density seating, efficiency through simple structures, and lean and productive personnel, are highly dependent on airline’s unique operational characteristics.
Aircraft Comparison For Network Carriers
When comparing the operational character-istics of Boeing 737-700 and Airbus A319 for network carriers, one of the most significant differences is flight crew costs. The Boeing 737-700 flight crew costs US$160.98 less per block hour than the Airbus A319. The Boeing 737-700 also is more efficient for network carriers in terms of fuel burn, with a cost of approximately US$65 less per block hour than Airbus. This number quickly translates into real savings when fleet sizes and numbers of hours flown are taken into account. When an airline decides to add an aircraft to its fleet, the effect of the operational characteristics must be taken into account.
Cost per available seat mile (CASM) is sig-nificantly less for network carriers operating the Boeing 737-700. With greater fuel efficiency and longer average stage lengths, the aircraft has a CASM of US8.18 cents, while the Airbus A319 costs US9.39 cents per seat mile. Even when fuel costs are not considered, the Boeing 737-700 still has an advantage over the Airbus A319. After excluding fuel costs per average seat mile (CASM ex-fuel) is US$3.55 and US$4.21 for the Boeing 737-700 and Airbus A319, respectively.
LCC Average Block-Hour ComparisonFor LCCs, the Boeing 737-700 crew costs
are US$172 more per block hour than the Airbus A319, which can be attributed to Southwest Airlines’ higher crew compensation compared with other LCCs.
LCCS clearly show diverse trends in opera-tional characteristics compared with those of network carriers. The Boeing 737-700 is flown on significantly shorter stage lengths with the aver-age being 491 miles less than the Airbus A319. Airlines using the Airbus A319 use the aircraft on longer stage lengths to compensate for the high fuel burns.
The Boeing 737-700 operates an average of 11.7 block hours per day while the Airbus A319 performs for approximately 11.9 block hours a day. Frontier Airlines, Spirit Airlines and United Airlines operate their aircraft for more than 11 hours a day, while Delta Air Lines and US Airways use the same aircraft for less than 10 hours a day. Because an airline cannot make money with its aircraft sitting on the ground, US Airways and Delta Air Lines would likely need to increase utilization of the Airbus A319 to become more profitable.
Load factors are 9 percent less on the Boeing 737-700, which, on average, has three fewer seats than the Airbus A319 when utilized by LCCs. By increasing daily aircraft utilization, LCCs achieve a lower CASM. (Daily aircraft utilization is the ratio of aircraft hours flown divided by the aircraft days available.)
By serving smaller, uncongested airports and focusing on point-to-point flights, LCCs maximize the number of daily block hours and, thus, aircraft utilization. On the other hand, profitability may be
adversely affected if these aircraft are deployed on routes to sparsely populated local airports, with not enough revenue.
Network Versus LCC Block-Hour Costs Generally, the costs incurred by LCCs are
lower than those of network carriers on a block-hour basis. These cost advantages enable LCCs to compete on the basis of price in a highly similar market, giving them a significant competitive advantage. Commonly, LCC enters an uncon-gested secondary airport, instead of entering a congested major airport, reducing the taxi time and fuel consumption. LCC fuel costs are US$1,721 compared with US$2,242 for network carriers due, in part, to successful fuel-hedging practices by Southwest Airlines.
Another way of interpreting cost comparisons is to identify the aircraft cost structure in terms of percentages for network carriers and LCCs, which is represented as a breakdown of the Boeing 737-700 cost structure. They have similar cost structures, but each business model has notable individual differences.
For both network airlines and LCCs, the big-gest cost is fuel, which accounts for 57 percent and 58 percent, respectively. Network carriers attribute 14 percent of total costs to mainte-nance, while LCCs attribute 10 percent for the same factor. However, LCCs show a higher percentage of flight crew costs, as mentioned previously.
Aircraft depreciation is a higher percentage of costs for LCCs, 8 percent compared with 3 percent for network carriers. However, network carriers face a significantly higher percentage of aircraft rental costs. This differential reflects the lease versus buy decision, which is made when carriers choose to work with operating lessors
of aircraft versus owning, and subsequently depreciating their planes.
Fuel-purchasing plans may contribute to the lower CASM of LCCs operating the Boeing 737-700. Southwest Airlines paid a lower price per gallon of fuel (US$1.70 compared with more than US$2 for the other carriers), achieving lower fuel costs per available seat mile (ASM) and a lower total CASM.
AirTran Airways, now part of Southwest Airlines, was able to achieve a low CASM of US5.2 cents, due, in part, to its low crew costs of US0.65 cents per ASM. Even after removing fuel costs, the CASM achieved by LCC carriers is US2.52 cents compared to US3.55 cents for network carriers.
Overall, network carriers flying the Airbus A319 pay US$564 more per block hour than LCCs. On the other hand, network carriers spend, on average, US$44 less on fuel per block hour and US$83 less on depreciation costs.
Clearly, there is not a “one-size-fits-all” approach to aircraft selection. Each aircraft serves a specific purpose for individual business models. So when airlines make adjustments to their fleets and conduct the proper analyses, it becomes evident which aircraft is better suited for particu-lar business models. These types of large investments require a certain methodology to ensure the most financially sound outcome. And it goes back to the basics of examining aircraft efficiency from operational, technical and financial perspectives. a
Prof. Bijan Vasigh is co-author of “Aircraft
Financing: Strategies for Managing Capital Costs in a Turbulent Industry.” He can
be contacted at [email protected].
ASCEND I INDUSTRY
ascend38 ascend 39
ASCEND I INDUSTRY
Block-hour Cost Comparison: Network Versus LCC When conducting a block-hour cost comparison between the Boeing 737-700 and the Airbus A319, there are similar cost structures but notable individ-ual differences. For both network airlines and LCCs, the biggest cost was fuel, which accounted for 57 percent and 58 percent of costs, respectively. For network carriers, 14 percent of total costs are attrib-utable to maintenance costs, while they were only 10 percent for LCCs. However, LCCs had a higher percentage of flight-crew costs partially due to the relatively highly-compensated Southwest Airlines flight crews. There is also a higher percentage of costs (8 percent compared to 3 percent) for LCCs in terms of aircraft depreciation. However, network carriers are confronted with significantly higher aircraft rental costs.
Operational Characteristics For LCCs Load factors are 9 percent less on the Boeing 737-700, which, on average, has three fewer seats than the Airbus A319 when utilized by low-cost carriers. LCCs can realize a lower CASM with these aircraft by increasing daily utilization. They can maximize the number of daily block hours, thereby increasing aircraft utilization, by serving smaller, uncongested airports and focusing on point-to-point flights. However, this could negatively affect profitability if the aircraft are deployed on routes to underpopulated local airports with only a competitive yield.
Pho
tos:
Shu
tter
stoc
kP
hoto
s: S
hutt
erst
ock
$3,576
$2,981
$4,140
$3,958Total
Total
Fuel
Fuel
Flight Crew
Flight Crew
Maintenance
Maintenance
Depreciation
Depreciation
Aircraft rent
Aircraft rent
Other
Other
$2,330
$1,721
$2,286
$2,242
$271
$296
$616
$552
$457
$555
$526
$587
$239
$242
$156
$124
$192
$58
$87
$108
$350
$417
$206
$36
Network
Network
LCC
LCC
A-319 Block-Hour Cost Comparison
Boeing 737-700 Block-Hour Cost Comparison
Pho
tos:
Shu
tter
stoc
k
8687Utilization (revenue hours/BH), %
Load factor, %
Seats per aircraft
Average flight stage, miles
Fuel, gallons per BH
Speed, miles per block hour (BH)
7382
1,2241,251
7431,234
694703
359381
A319 737-700
Operational Characteristics Of Narrow-body Aircraft (LCCs)
6RXUFH��&RPSLOHG�E\�WKH�author of Back Aviation Form 41
6RXUFH��&RPSLOHG�E\�WKH�author of Back Aviation Form 41
US Dollars
US Dollars

Voice Of The Customer A System View
Creating, Communicating And Connecting
Proactive Over Reactive
Partnering For Success
Codeshare Alerts
Keep Your Eyes Open
Stop Human Traffickers
More airlines today are using Net Promoter Score® (NPS®) to measure their customers’ satisfaction levels and identify where to make improvements. Companies with the highest NPS average about two-and-a-half times the revenue growth than that of the competition.
44
Change is inevitable. How change is managed differenti-ates leaders from followers. Many airline industry leaders are taking a more proactive man-agement approach that is built around short- and long-term strategies. Transitioning from a reactive state is not an easy task. Therefore, many airlines rely on external consultants to help develop strategies and drive the transformation.
Airlines can improve their revenue management efforts by systematically monitoring codeshare partner pricing and inventory availability through recent Big Data developments. As part of a larger Big Data research effort, Sabre Airline Solutions® has invested in infrastructure that permits col-lection and processing of vast amounts of airline shopping data.
47
54
50
Careful due-diligence and analy-sis is a prerequisite in partner-ing for success when planning codeshares, acquisitions, joint ventures, alliances or mergers.
Passport To Freedom
An airline’s pricing and revenue management strategy is depen-dent on a plan that enables the department’s leaders to consis-tently focus on daily operations while also focusing on long-term objectives. There is a formula to building and executing the plan that ensures optimal results.
59
56Operational groups perform the work to keep an airline’s fleet functioning and, as such, they perform extremely valuable services that allow a carrier to operate safely and efficiently. But operations must also be viewed strategically. And their strategic contribution to the bottom line — if fully understood and appreciated — can be quite significant.
SPECIAL SECTION

Alessandro Ciancimino, Vice President of Consulting, Sabre Airline SolutionsSanjay Nanda, Senior Vice President of Delivery, Care and Consulting, Sabre Airline Solutions
Introduction
n today’s volatile economic and environmental conditions, every organization is compelled to trans-form itself amidst rising pressure from competition, advancements in technology, access to information,
changing consumer behavior and increasingly complex patterns of customer demand.
Research firm Forrester recently inter-viewed a number of executives across multiple industries on the topic of leveraging consulting help in business transformation projects. Their findings indicated that: Most executives plan to use outside con-
sultants to gain domain knowledge. They want deep expertise in their particular pro-cesses and their industry, as well as access to more resources than are available inter-nally.
External advice, to complement internal strength, is the order of the day. When asked what kind of services they want the consultants to provide, executives said they want both high-level advice and opera-tional/tactical advice, and a significant por-tion want consultants to perform hands-on implementation activities.
Mentoring not replacing. They do not want consultants to produce out-of-the-shelf documentation or to completely takeover
projects. Instead, companies look to con-sultants to act as advisors. Specifically customers want:
Validation — Executives most often know what their business problems are and have ideas of how to solve them. However, they want an objective third party to vali-date assumptions and help create an action plan for implementation.
Mentoring — Leaders want consul-tants to act as coaches or change agents and teach them how to do their own strate-gic and tactical work. Consultants need to help customers build their domain knowl-edge, which is necessary to make process changes and operate the new process after the engagement is completed so they don’t revert to their old ways once consultants leave.
Tactical assistance in the implemen-tation phase — Businesses need consul-tants to help them implement the recom-mendations as well as measure perfor-mance results and benefits derived from the consulting projects.At Sabre Airline Solutions®, our consultants
help airlines gain domain knowledge through deep industry expertise and comprehensive industry data. We provide both strategic and tactical recommendations and further assist in
implementing recommendations together with the airline, validating its ideas and mentoring as change agents.
Our basic rule is that our projects must bring both tactical improvements and strategic changes in business practices. Tactical improve-ments are crucial since they generate quick results that create positive momentum around the project and provide quick returns on invest-ment. Strategic changes in business practices are key to ensure long-term and structural busi-ness improvements.
The early roots of our consulting practice were in the support of business processes and best-practice execution around the implementa-tion of our software solutions. Over time, we realized that our experience with a very large set of airlines around the world puts us in a unique position to help customers with busi-ness problems around their own economics and the best leverage of technology to generate maximum value.
Additionally, our exposure to forward-thinking airlines, next-generation business models/ideas and our own innovations in technology has helped us accelerate results for our consulting customers.
Our consulting services address specific business challenges, opportunities and/or per-formance issues facing airlines. Additionally, we
aim to help airlines perform strategic initiatives with the overall objective of improving their commercial performance, operational efficiency and brand differentiation to ultimately improve their customers’ experience.
Such services range from specific business initiatives in specific areas, such as network and fleet management, pricing and revenue management, alliances and partnerships, sales and distribution, e-commerce and merchandis-ing, business intelligence and analytics, and operations management to more strategic initia-tives like long-term business planning, merger and acquisition planning, and start-up business planning.
Consulting services are also provided as part of the implementation of our technology solu-tions, with the goal of fast tracking the adoption of the solution within the specific airline’s busi-ness environment through business process changes. This ensures rapid realization of the business benefits associated with that particular solution. This is an innovative way of deploying “solutions” that incorporate a business per-spective together with the IT perspective. And it maximizes customer satisfaction by providing a measurable, quick and substantial return on investment.
We also offer operations research consult-ing services. We leverage new operations research-based ideas on topics of high value for airlines; these ideas and models allow airlines to maximize actions even as business models in the industry evolve.
For example, standard revenue management principles and actions have become widespread in the industry and have narrowed competitive advantage. By taking advantage of cutting-edge ideas in the same space, our airline custom-ers can differentiate themselves and generate further revenue lifts.
Other examples include having developed methodologies to leverage Big Data, such as shopping data, to model customer choice in a competitive environment or to create fare alerts when an airline’s fare availability in a certain
market at a certain point in time is uncompeti-tive. Many other applications in this area have been developed to address specific customer needs with customized modelling techniques.
We understand that the dynamics in the airline industry are constantly changing and presenting new challenges in the market in addition to the growing competition in the industry. To manage these and successfully grow, airlines have to balance strategic plans and actions with a need for tactical, quick-return execution. Airlines have their own growth and business goals, and the consequence of not keeping up with the pace is significant.
We pride ourselves on being a consulting prac-tice that addresses strategic matters through tactical action plans. In fact, the strength of our consulting team spans multiple dimensions.
Exclusive Focus On The Airline Industry
We have been exclusively serving the airline industry for more than 30 years, working in every functional area within the airline business and in all regions of the world. We specialize in solving end-to-end business challenges, from startups, operational performance and network planning to partnerships and consolidations.
Our business consultants have significant industry experience on a worldwide scale. Our functional experts specialize in areas such as e-commerce and merchandizing. We’ve been there and know the challenges and opportuni-ties airlines face.
Holistic And Collaborative ApproachWhen we partner with airlines, we bring
a holistic perspective to identify opportuni-ties that will drive value and result in a positive change. We’re in it for the long term, working with airlines to move from ideas to actions that will equip them to develop and realize the vision they have for their business. Our holistic perspective and cross-functional expertise within the airline business allows us to diagnose airlines’
unique challenges, customize a solution and put it into action.
Leveraging Decision-Support Solutions And Comprehensive Industry Data
We use our industry-leading decision-support and optimization solutions during the consulting engagement to provide accurate recommenda-tions. Our data analysis is supported by the highly qualified operations research team to support industry data that might not otherwise be readily available. We have comprehensive and accurate industry data ranging from GDS data, market data, shopping data and revenue data. Such data is extensively leveraged dur-ing the engagements through our proprietary models and procedures to manage and process Big Data.
Whether the business challenge is limited to a single functional area or spans across the air-line’s organization, we help airlines identify the key levers to improve business performance, increase brand presence and achieve their vision. And most importantly, we take pride in the many instances where we have demon-strated our competencies with tangible results to an airline’s bottom line.
The articles in this special section were writ-ten by our consulting leaders and provide a sampling of our strategic consulting methodolo-gies and the benefits realized by our customers who have implemented these recommenda-tions. We look forward to visiting with you about how we can partner together to bring greater efficiencies to your airline and help you achieve your long-term goals. a
Alessandro Ciancimino can be contacted at [email protected]
and Sanjay Nanda can be contacted at [email protected].
ASCEND I SPECIAL SECTION
ascend42
I
ASCEND I SPECIAL SECTION
ascend 43
Sanjay NandaAlessandro Ciancimino

®
Jonathan P. Ewbank and Jayme B. Porkolab I Ascend Contributors

ASCEND I SPECIAL SECTION
ascend 45
ommercial and marketing departments constantly talk about the importance of customer service, customer experience and customer journey. But do they really affect an airline’s bottom
line? Absolutely.While research shows the No. 1 influence
in a passenger’s choice of airline is price, retaining existing customers and attracting new ones through word of mouth boils down to service delivery and customer experience. And that, no doubt, impacts a carrier’s bottom line.
Prior to the global financial crisis, many companies outside of the airline industry began to assess their ability to create cus-tomer loyalty through the use of a new metric called Net Promoter Score (NPS), created and owned by Satmetrix Systems, Inc.; Bain & Company, Inc.; and Fred Reichheld (Bain & Company’s loyalty guru).
The popularity of NPS has been fueled by the discovery that the metric is predic-tive of revenue growth. In fact, according to Reichheld, companies holding the highest NPS within their respective industries aver-age revenue growth that is approximately two-and-a-half times greater than that of the competition.
NPS measures a company’s customer-sat-isfaction level, identifies “detractors” who are diminishing its brand reputation and shows the percentage of customers working on behalf of the company to promote the business. NPS is
easy to understand, quantify and benchmark. It represents a single score derived from a single question: On a scale of 0 to 10, with 0 representing “not at all likely” and 10 being “extremely likely,” how likely is it that you would recommend the company, in this case “the airline,” to a friend or colleague?
Respondents that give responses from 0 to 6 are classified as “detractors,” 7 to 8 are “passives” and 9 to 10 are “promoters.” Subtracting the total number of detractors from the total number of promoters provides the company’s NPS. The NPS range is -100 to 100; with the latter being a perfect score, meaning all respondents identified themselves as company promoters.
Despite widespread success of NPS, the airline industry has been slow to adopt the metric. No doubt, this is a byproduct of airlines’ focus on cost reductions at the expense of investments in customer loyalty in order to survive the recent global financial climate. However, at least one outside research com-pany — Satmetrix — has tracked NPS for U.S. airlines during the past decade.
When NPSs are depicted with revenue growth, using a scatter plot, it becomes appar-ent that an airline’s effectiveness in maintaining customer loyalty is highly predictive of sus-tained success.
For more than 10 years, airlines that have successfully differentiated themselves with higher NPSs have enjoyed year-over-year rev-enue growth three to five times greater than the competition. The correlation coefficient between historical revenue growth and NPS is
0.89, with 1 being a perfect linear correlation. In other words, the statistical strength of the relationship is very high.
Clearly, higher customer loyalty trans-lates to steady, increased passenger revenue, because the airline is retaining current custom-ers while attracting new ones. In fact, a recent study conducted by the Temkin Group showed that 81 percent of promoters were likely to repurchase from their preferred airline com-pared with only 16 percent of detractors. Yet, the economics behind NPS go beyond reten-tion rates and into both the characteristics of promoters and detractors and the secondary affect resulting from word of mouth.
The financial impact of word of mouth is significantly greater than most company executives realize. To begin with, word of mouth is a company’s best, cheapest and most-effective advertising channel. In fact, 80 percent of consumers trust word of mouth over any other source of product information or advertising, according to Forrester Research and the Nielsen Company.
Moreover, word of mouth is nine times more effective than traditional advertising in converting unfavorable or neutral dispositions into positive attitudes. In addition, avenues for spreading positive and negative word of mouth have never been more open and fluid than they are today with the advent of social media sites such as blogs, Facebook, Twitter and LinkedIn.
Among the three categories of customers, research shows that more than 80 percent of positive referrals come from promoters and more than 80 percent of negative word of mouth comes from detractors. Interestingly, the ability of either the promoter or the detrac-tor to convert the audience varies between the two.
According to Satmetrix, promoters tend to talk to more people, but conversion rates are relatively low. In contrast, detractors typically talk to less people, but conversions rates are higher as this category tends to seek out will-ing listeners or those more likely to act upon the information given.
Previous consulting work by Bain & Company also found that the variable business cost of servicing detractors tends to be higher than promoters, because detractors are more likely to contact call centers and demand complaint resolution and less likely to utilize self-service tools such as airport kiosks. Thus, customer loss resulting from negative word of mouth, combined with increased service costs, naturally translates to a decrease in revenue and profits.
When promoters are successful in attracting a new customer, the new customer is more likely to become a promoter as well. Retention rates are higher for promoters. Therefore, they have a longer customer lifetime during which companies can generate more sales and spread out acquisition costs. In addition,
C
Determining Net Promoter Score NPS measures customer loyalty through the determination of which passengers are advocates of the company, those who are relatively passive and those who are the likeliest to diminish brand reputation to prospective consumers through negative word of mouth. A company’s NPS is determined by subtracting the percentage of detractors from the percentage of promoters.
Detractors Passives Promoters
Not at all Likely
ExtremelyLikely
Net Promoter Score = (% of Promoters)-(% of Detractors)
On a scale of 1-10, how likely is it that you would recommend (the airline) to a friend or colleague?

promoters tend to complain less, are more forgiving of a company’s transgressions (64 percent will forgive according to the Temkin Group) and are typically less sensitive to pric-ing changes. In fact, on average, promoters spend more than average annual spend rates and detractors spend less.
When considering promoter and detractor characteristics and calculating total customer worth between the categories, it should come as no surprise that there is a significant gap between promoters’ value to a company and that of detractors. In terms of word of mouth, total customer worth equals: Buyer economics + referral economics
where: Buyer economics = annual spend for a
category Referral economics = net customers
gained or lost x average annual spend Net customers gained or lost = number
of persons talked to x conversion rate This year, the consulting team for Sabre
Airline Solutions® provided an international air carrier a complete analysis of its NPS and the specific economics related to the score. The analysis revealed that the difference in annual total customer worth was approximately 50 percent between passives and detractors/pro-moters. Not only did promoters have a higher average annual spend, but their total customer worth was nearly three times that of detrac-tors when factoring in referral economics. Consider two things:1. Given the relatively low margins from which
airlines must squeeze profits, it is likely that every detractor created and sustained is costing the company a significant amount of money.
2. In the example above, every detractor shift-ed to neutral status (passive) represented a 100 percent increase in total worth to the airline; moving a customer from detractor to promoter status increased his/her total worth by almost 300 percent. Airlines around the world have taken notice
and are becoming much more engaged in tracking their NPS while looking for ways to increase it.
“NPS is core to how we make decisions,” said Robin Hayes, JetBlue’s chief commercial officer.
So how does an airline use NPS to make decisions? An airline must first find ways to retain existing promoters and swing passives and detractors to a more positive position. Doing so requires an airline to know — from the customer’s perspective — what it is doing right and wrong, or where service-level gaps exist. Of course, passengers are the source of this information, and collecting that data can be difficult.
The most popular method of tracking cus-tomer experience is through continuous survey deployment. Several airlines have increased the
number of surveys they send out. However, an airline needs to use caution to ensure it does not provoke its customer base.
Continually surveying customers tends to irritate them and actually risks creating detrac-tors. For the company’s part, the process requires ongoing analytics and manpower to sustain a practice that is extremely objective depending on the respondent’s mood, the time of day, the most recent experience, etc.
To maintain untainted responses, surveys should never be created and deployed by the airline itself. Analysis of survey responses shows that when respondents are aware a particular airline is the source of a survey, they tend to respond favorably toward the airline and not necessarily with the truth.
The answer to this dilemma is to contract a third-party surveyor, but this requires ongo-ing costs, which are generally based on the number of deployments. Therefore, the higher the quality of data, the higher the cost of the survey to an airline.
Airlines may experience greater benefits using a holistic approach that begins with NPS analytics but also includes the voice of the customer. Airlines continually gather voice-of-the-customer data with customer relationship management (CRM) software, complaint tracking, frequent flyer programs, etc. In other words, data is collected every day in customer service areas but is often not mined for customer insights.
The consulting team at Sabre Airline Solutions® has developed a holistic approach that includes NPS tracking and uses custom-er data to create continuous feedback loops to drive Lean Six Sigma principles throughout the organization. The end result is actionable data that propels revenue growth.
Working with an airline, Sabre Airline Solutions will deploy NPS surveys and provide Net Promoter Scores, along with benchmark data from its competitors, using responses from the survey and an internal database created from previously deployed surveys.
Sabre Airline Solutions has the only consulting team actively tracking NPS for both domestic and international carriers. Moreover, the accuracy of the technology company’s NPS data is superior to any other reports currently available, with margin errors between +/- 1 to 5 points (95 percent confidence level)compared with other indus-try surveys that have only been able to attain around +/- 13 to 15 points.
However, the value of NPS surveys should extend beyond individual scores themselves by identifying specific ways to increase these scores, thereby capturing possibili-ties for resultant revenue gains. To do this, survey respondents are asked to rate how important and how satisfied they are with different attributes and features of the airline
related to brand, customer effort, customer service and in-flight experience.
The data is analyzed and benchmarked against key competitors. Then the airline is given an overview of the results along with gap analysis that identifies the difference between how important the feature or attribute is to promoters and detractors and their actual satisfaction levels.
Importance levels are integral to the analy-sis. Of course, customer experience focuses on the guest journey from one touch point to the next, but it also includes setting expecta-tions and meeting those expectations. It is impossible to please everyone, but it is pos-sible to understand customer segmentation and deliver an experience that satisfies the targeted segment.
Last year, for example, Nordstrom, Target and Kohl’s each had a high Net Promoter Score. However, according to Satmetrix’s 2012 Net Promoter Industry Benchmarks survey, promoters’ comments revealed different rea-sons for their satisfaction level: Nordstrom NPS was tied to service, Target to breadth of products and Kohl’s to low prices.
In addition, high customer-satisfaction levels in categories with low importance high-light areas where internal efforts may be too heavily focused and should be shifted toward other, more pressing customer needs. This information is crucial in identifying how to retain promoters and locate specific areas where customer-satisfaction levels are low and gaps are high among detractors.
Unfortunately, identifying customer-service issues and service-level gaps does not always compel airline management to address root causes as any identified resolution costs will often times outweigh perceived benefits. The consultants will, therefore, complete the NPS analysis by matching revenue data with respon-dent data. They will identify the drivers of an airline’s NPS as well as show expected financial benefits of addressing gaps in service. In doing so, they will help an airline develop a solid NPS strategy for sustained, customer-centered profit growth.
Sabre Airline Solutions’ consulting practice is not only committed to providing quality data, but also to the analysis of “smart” data to pro-vide guidance for the future as well as a framework for continuous improvement, includ-ing the development of an action plan for airlines to increase NPS. a
Jonathan P. Ewbank is a principal consultant and Jayme B. Porkolab
is director of SabreSonic® Customer Sales & Service consulting for Sabre
Airline Solutions. They can be contacted at [email protected] and [email protected].
ascend46
ASCEND I SPECIAL SECTION


hether an airline enlists the services of a consulting firm or develops its own proactive man-agement plan, the investment and time spent to convert from
a reactive to a proactive operation are well worth the efforts and can have a profound impact on every department across an airline.
In the areas of pricing and revenue manage-ment, for example, leading carriers are adapting a competitive pricing strategy based on utiliz-ing real-time data for their markets. Through enhanced technology and the creation of new business processes, the result is “active” fares management, where pricing is adjusted in reaction to competitor pricing within the same market. Recent trends indicate that carriers are investing in Big Data to create real-time pricing models, which allow them to react quicker to market changes. Insights gained from the data result in the ability to formulate a longer-term strategy based on current market trends.
From a profitability perspective, leading-edge technologies enable airlines to examine their current network and identify underserved desti-nations that could allow for potential expansion. A market evaluation is another important ele-ment, which allows airlines to closely monitor market demand, capacity, flight frequency and type of schedule. The data collected during a market evaluation allows for forward thinking and how to best position for revenue growth.
Operations, in its nature, is a reactive depart-ment, but the use of proactive processes and communications increases efficiency and benefits travelers. According to masFlight, an aviation consulting and data analysis group, since January, flight delays and cancellations within the United States affected more than 47 million passengers. Many of these delays or cancellations can be attributed to inclement weather. These weather events, both routine and extreme, serve as an excellent example of how different departments must have the necessary proactive communications channels to successfully function.
For example, ground operations and sched-uling must work closely together to ensure that delays are minimized and quickly resolved while communicating with customer service so customers can be promptly notified. Having the correct proactive communication channels in place as well as a well-defined irregular operations strategy minimizes the effect on an airline’s operations and its customers.
Keeping the pulse on the customer is critical to any business, and with the advent of social media; it is imperative that airlines understand what their customers think and actively monitor how they are meeting customers’ expectations.
In doing so, airlines often seek assistance from independent resources, such as business consultants, to conduct a baseline assessment of individual customers, which includes mea-suring their Net Promoter Score (see related
article: Voice Of The Customer on page 44). As part of this process, in-depth research, analytics and business consulting should be conducted to benchmark the airline and understand its
customers’ expectations and satisfaction levels. This provides a holistic view of customers and helps identify the key areas where customer experience efforts should be focused. Using the
Net Promoter Score, in addition to measuring the attributes that influence an airline’s score, consultants can quantify and show not only how the airline can soar above its competitors, but the benefits it will gain from having a short- and long-term plan.
Going from a reactive to proactive setting may look like a daunting task, but it is achievable and requires a firm structure. Because an airline’s leaders and employees are heavily involved with the day-to-day challenges; fixated on solving problems as they arise, they often reach out to an objective, outside resource, such as a consul-tant, to help manage the transition through some direct steps:1. Plan and Prioritize. One of the first critical
steps is taking advantage of time and creating a prioritized scheduled, which gives airlines the ability to anticipate problems. Consultants can help an airline plan through having first-hand experience of dealing with large and complex carriers. They know the main issues airlines face, industry best practices and the necessary solutions that need to be adapted.
2. Define Processes. One of the most impor-tant parts of a proactive setting is clearly defined processes, which help ensure that all
departments are aligned and run efficiently. Well-documented processes provide more structure and reduce the potential for prob-lems. A consultant understands that no two airlines are alike, therefore, he or she can tailor processes to fit an airline’s specific needs to achieve maximum efficiency.
3. Manage Risks. Despite having robust pro-cesses in place, carriers will still face certain issues that require more attention than others. Planning activities and highlighting the areas where risk is involved helps avoid problems and determine what departments will be impacted through the changes. A consultant will be able to develop a plan for all of an air-line’s departments to efficiently manage risk from high to low probability levels.
4. Employees are Key. Morale must be high for any company to achieve long-term success, otherwise employee turnover may be high and it will be difficult to attract professionals who can help strengthen and grow the business. In a reactive management setting, morale can be low from the large amount of high pressure situations. Providing encouragement and pro-moting a positive work atmosphere will help transition to a proactive environment.
5. Continuous Improvement. One of the key factors for any company is to constantly evolve; creating an environment for continu-ous improvement. It is essential to encourage employees to look for ways to innovate and improve their areas of the business.
6. Reporting. Reporting will identify root causes of problems that need to be addressed as well as identify opportunities. This informa-tion should be shared across the organization. Consulting can assist with the development of reports and continuous feedback loops to drive Six Sigma/Lean Initiatives. Carriers must approach the future with a pro-
active standpoint, which can range from long-term flight scheduling to evaluating addi-tional markets to serve. A proactive management style will help lessen the amount of stress within the company and encourage employees to be innovators. a
Grant Perry is a senior consultant and
Megan Nieves is a practice management analyst for Sabre Airline Solutions. They can be contacted at grant.perry@sabre.
com and [email protected].
W
ascend 49
ASCEND I SPECIAL SECTION
Big Data For Quicker Reaction Times Many airlines around the world are leveraging Big Data to develop real-time pricing models in an effort to react much quicker to market changes.
According to ATAG
of global economic activity is supported by aviation, making up 3.5 percent of the world gross domestic product.
Globally, according to ATAG, the average occupancy of aircraft is around
greater than other forms of transportation.
According to Air Transport Action Group �$7$*���IOHHW�IXHO�HIILFLHQF\�ZLOO�EH�LPSURYHG�by
SHU�DQQXP�E\������
%\�������QHW�DYLDWLRQ�FDUERQ�HPLVVLRQV�will be
OHVV�WKDQ�ZKDW�WKH\�ZHUH�LQ�������DFFRUGLQJ�to ATAG.
US$2.2 trillion
79 percent
1.5 percent
50 percent
Countit up
Interesting facts and figures in the airline industry.
ascend48
ASCEND I SPECIAL SECTION
Proactive Communications Channels During the first quarter, more than 47 million passengers in the United States were affected by flight delays and cancelations. Regardless of the cause of these sched-ule interruptions, it’s critical for an airline to implement proactive communications channels across vari-ous departments, such as ground operations and scheduling.
Pho
to: S
hutt
erst
ock

Ma^�>?;�bl�ghm�Z�iZgZ\^Z'�Bml�ln\\^ll�k^eb^l�hg�Zbkebg^l��Z[bebmr�mh�]^o^ehi�Zg]�bfie^f^gm�Z�lmkZm^`b\�ib\mnk^�h_�paZm�ma^r�]^lbk^�mh�Z\ab^o^�Zm�ma^�hnml^m%�pbma�a focus on the entire operation.
Partnering For Success)LQGLQJ�7KH�5LJKW�.LQG�2I�3DUWQHUVKLSV
&DUHIXO�GXH�GLOLJHQFH�DQG�DQDO\VLV�LV�D�SUHUHTXLVLWH�LQ�SDUWQHULQJ�IRU�VXFFHVV�ZKHQ�SODQQLQJ�FRGHVKDUHV��DFTXLVLWLRQV��MRLQW�YHQWXUHV��DOOLDQFHV�RU�PHUJHUV�
By Peter Berdy I Ascend Contributor

Pho
tos:
Shu
tter
stoc
k
or decades, airlines have been look-ing for the best path to sustain their business and increase shareholder value in the face of stiff competition and uncertain economic environ-
ments. When organic growth options require taking on higher risk, or barriers to entry exist (such as bilateral limitations), partnerships with other airlines become increasingly attractive.
There are a host of options used by airlines to form partnerships, including mergers, acquisitions, joint ventures, codeshares and alliances. They are used as instruments to: Gain competitive advantage or serve as
defense mechanisms; Enter markets and break down barriers
to entry; Expand network coverage; Lower costs as airlines proceed along
paths to globalization, consolidation and sustainability. Airline partnerships have shaped the
landscape, with global alliances playing the dominant role. Approximately 58 percent of all capacity is operated by airlines in one of the big three alliances — oneworld, Star Alliance or SkyTeam. Some carriers prefer to stay out of alliances and opt instead for expanded codeshare agree-ments. For example, Etihad and Emirates list codeshare agreements with 33 and 12 airlines, respectively, and Alaska Airlines has agreements with 13 airlines.
However, many of the fundamental tenets of alliances are now being chal-lenged and new alliance approaches are being tested. Airlines are looking to greater flexibility and exploring options in develop-ing business relationships.
Recent partnership trends among carri-ers include: Looking beyond their alliance to fill
gaps. As recognition that alliances do not offer everything, members are turn-ing to other places outside their alliance to fill gaps in their network as they grow or look for new opportunities. IAG Chief Executive Officer Willy Walsh said oneworld is relaxed about its members looking beyond the alliance. Some exam-ples prove this point: oneworld found-ing member Qantas signed a five-year partnership with Emirates to replace Singapore for Dubai as a stopover point for European services. All Qantas flights to Europe will operate through Dubai under a comprehensive partnership to coordinate pricing, sales and flight scheduling. There will also be a profit-sharing agreement on flights between Australia and the United Kingdom. The partnership will help Emirates reach into the lucrative corporate market in Australia, which is also being targeted
by rival carrier Etihad. Meanwhile, one-world member airberlin is in codeshare discussions with SkyTeam member Air France.
Terminating codeshares between alli-ance members. Within Star Alliance, Lufthansa ended its codeshare agree-ments with Turkish Airlines. The specu-lation was that the relationship ended due to the strong growth by Turkish and its presence in secondary cities in Germany.
Low-cost carriers are being included in the mix. Airlines are looking into form-ing links that were unthinkable a few years ago as traditional network airlines’ service offerings have blurred and some LCCs have moved to hybrid models. In some instances, working with LCCs may be the only viable option when competition is limited (such as West Air in Canada) or where other airlines are already involved in other partnerships and the only dance partner is an LCC.
LCC subsidiaries of full-service carri-ers are becoming more common. There should be 20 alliance members with LCC subsidiaries or affiliates by the end of 2014. These subsidiaries are likely to fill gaps in markets assigned by the parent companies.
There are many groups and holding com-panies managing portfolios of airlines ranging from full to partial ownership. A few examples include IAG, Lufthansa Group, Etihad Aviation Group, Hainan Group, Irelandia Aviation and Indigo Partners. The central goal is to leverage purchasing power, coordinate planning and expand network reach, as well as to realize synergy benefits overall.
Changing rules of the playing field, such as recent pre-clearance of U.S. Customs at Abu Dhabi. Similar to preclearance facilities in Canada, Mexico and the Caribbean, pre-clearance at Abu Dhabi will help passengers avoid long U.S. Customs lines when they arrive in the United States by instead clearing cus-toms at the new facility in Abu Dhabi. The benefit is that passengers may be lured to fly direct from Abu Dhabi on Etihad Airways. Etihad happens to be the only nonstop service to the United States from Abu Dhabi. The airline is likely to reduce passenger connect times to further take advantage of pre-clear-ance. Following Abu Dhabi’s lead, Qatar has also applied for U.S. Customs pre-clearance.
Joint ventures to form new airlines. Singapore Airlines and Tata of India, for
U.S. And E.U. Domestic Capacity Share The United States is characterized by high concentration due to mergers: American Airlines, Delta Air Lines and United Airlines control 63 percent of U.S. domestic capacity, measured by ASKs. In Europe, IAG, Air France/KLM and Lufthansa Group control only 23 per-cent of E.U. domestic capacity, with the remainder spread between LCCs and smaller national carriers.
ascend 51
ASCEND I SPECIAL SECTION
F
Traditional Network Carriers’ Domestic Capacity Share
8�6��'RPHVWLF E.U. Domestic

ASCEND I SPECIAL SECTION
ascend52
ASCEND I SPECIAL SECTION
example, have joined forces to launch a new airline in India and have funded it with an initial investment of US$100 million. SIA expects commercial syner-gies by expanding in the important Indian market, while Tata Group will continue to build its aviation-related businesses such as catering, ground handling and engi-neering.Due to government restrictions on
domestic ownership and control, the battle ground for alliances continues to focus on access to emerging international markets.
In the United States, the big three network airlines, American Airlines, Delta Air Lines and United Airlines, control nearly 60 percent of U.S. domestic capacity. In Europe, the big three groups, Lufthansa Group, IAG and Air France/KLM, control only 20 percent of E.U. domestic capacity with the bulk controlled by LCCs such as RyanAir and easyJet.
Economies in Brazil, China, India and Asia have made mergers and acquisitions and new business models (example: long-range LCCs) more pronounced in the global market to gain market share and stimulate new business. The result of these trends and activities are the breaking and forma-tion of new partnership models.
Reasons To PartnerOne of the fundamental reasons that air-
lines engage in partnerships is to address competition. Airlines have found that consolidation will allow them a stronger market presence and power to claim a position of dominance.
With intense pressure on airlines to cut costs and earn profits, acquisitions offer a channel to increase scale and leverage the sheer size of the resulting partnership. Carriers have resorted to acquisition to reduce costs, increase loads and improve profitability. Strategic alliances also allow companies to leverage each other’s core competencies.
Mergers and acquisitions are usually resorted to either for increasing scale or cutting costs, while alliances are often used as a way to enter new markets. Some markets may have high barriers to entry such as regulatory constraints, established competitors or highly volatile markets that do not justify initial entry investments.
In such cases, alliances are the pre-ferred option because they allow airlines to leverage their existing knowledge and resources through collaboration. On the other hand, where barriers to entry are low, airlines can gain a very strong foot
hold in the market either through merger or through acquisition.
Synergies And Resources Along with the previous factors, syner-
gies and resources are equally important in deciding among the options available to airlines. Mergers and alliances between companies have been proven to work efficiently if there is a high level of syn-ergy between companies. Synergies can be found in corporate culture, product portfolio, strategic goals, and supply chain or logistic systems. When such synergies exist, companies can productively imple-ment a merger or form an alliance.
Similarly, for an acquisition option, an important factor is the availability of financial resources and appetite for risk. Acquisitions of money-losing airlines can take considerable time and resources to turn around their financial performance, and results are not guaranteed. Acquiring companies typically possess considerable resources and perform extensive due diligence prior to taking on a high-risk acquisition venture.
“Alliances don’t guarantee success,” IAG’s Willy Walsh said. “You need to have a robust, profitable business in its own right.”
Analyzing PartnershipsKey components to evaluating partner-
ships include addressing several “how to’s,” specifically, how to assess the partner fit, how to access an expanded passenger base, and how to realize effi-ciencies and economies of scale.
Depending on the type of partnership, there is a range of levers that can be pulled to realize synergies — network rationalization as well as airport and other facility consolidation — removing duplicate overhead, fuel purchasing and engineering savings, and working capital and balance-sheet restructuring, such as renegotiating aircraft leases.
To evaluate and measure the benefits of potential partnerships, there are steps in analysis that are typically performed.
CodesharesThe value of codeshares can be mea-
sured by simulating traffic that would move over flights with codeshares and comparing results to a baseline prior to adding the codeshare flights. To perform this simulation requires a suite of tools and data.
A scheduling tool, such as Sabre® AirVision™ Schedule Manager, is used to modify the baseline schedule to place the partner’s code on the operating air-line’s flights. A forecasting tool, such as
Sabre® AirVision™ Profit Manager, is used to forecast traffic, revenue costs and profits. Databases containing schedules, market sizes and fares as well as costs are needed. Sabre Airline Solutions® develops inputs such as market sizes, fares and schedules using a variety of data sources including its own airport data intelligence, which contains global O&D and MIDT-adjusted data, and schedules.
To analyze results, two forecasts are made: a baseline forecast representing the state prior to the codeshare, and a future forecast to measure the codeshare flights. Comparing results of the two forecasts will reveal the increased traffic, revenues and profits related to adding the
codeshare flights. Detailed analysis of the results will indicate where the benefits occur.
Alliances, Joint Ventures, Mergers, Acquisitions
Complex analysis for alliances, joint ventures, mergers and acquisitions include examining ways to unleash value to obtain the greatest benefit from these types of partnerships. Similar to codeshares, a “before-and-after” evaluation takes place.
For alliances, the application of codeshare flights is extensive. In the case of mergers, acquisitions and joint ventures, analysis will typically examine the value of using a single code instead of separate codes.
Furthermore, these types of partnerships may incorporate significant network adjust-ments to further enhance alliance value, such as:
Retiming and adding flights in overlapping markets to get better and more complete time-of-day coverage,
Re-assigning fleet to optimize aircraft uti-lization,
Synchronization of bank timings between hubs to optimize traffic feed between partners,
Adding new flights to accommodate spill that results from converting interline traf-fic to online,
Testing the addition of new markets to take advantage of a stronger network,
Partnership studies may include identi-fying the “S” curve effect, the benefit associated with partnerships offering a more complete range of services, thereby resulting in improved airline preference by consumers.In addition to scheduling and forecasting
tools, an optimization tool, such as Sabre®
AirVision™ Fleet Manager, may be used to maximize the value and deployment of fleet assets and for fleet planning. For com-plex networks, Sabre® AirVision™ Network Manager is used to minimize passenger misconnections, ensure optimization of pas-senger connections and determine new market timings.
Transparency And War GamesThe correct use of methodology, tools
and data enable transparency and the evaluation of results for all players. Each company within a partnership will be able to identify the benefits it can expect from the partnership as well as the benefits it offers its partners.
The same tools and data that have the capability to perform analysis of scale and scope for the partnership can also be applied to competitors. As a result, differ-ent scenarios can be conducted such as measuring the impact a partnership will have on principal competitors, or evaluating the effect of carriers switching alliances or forming joint ventures. These tools can also be used to simulate results of potential competitive responses.
Conducting these “war-games” scenarios can reveal insights to strengths and weak-nesses of different competitive strategies.
Independent AnalysisSabre Airline Solutions offers consult-
ing services that cover the full range of partnership analysis to assist airlines and investors independently test scenarios, perform analysis and recommend solutions. The consulting services provide several benefits to airlines, including: Leveraging deep airline knowledge and
extensive experience in performing part-nership projects. The consulting practice develops detailed, practical recommenda-
tions that can be measured and operationally implemented.
Consultants use a full portfolio of inte-grated decision-support tools to perform partnership projects.
The data analysis is supported by an operations research team that collects and analyzes industry data that might not otherwise be readily available.
The consulting team consists of experts who have mastered scheduling and planning, gained from working for air-lines around the world, and applied their expertise to help airlines successfully evaluate partnerships.
A standardized delivery methodology ensures consistency and value measure-ment.
Training and knowledge transfer ensures sustained, long-term success for airlines.There’s some art and some science in
determining which airlines make better partners and what types of partnerships are most suitable for specific airlines. The process is anything but simple; however, with the right tools and expertise, airlines can build a successful strategy around current and future partnerships that will support today’s objectives as well as those of the future. a
Peter Berdy is a consultant for Sabre Airline Solutions®. He can be
contacted at [email protected].
Successful Partnership Models Fifty-eight percent of capacity, measured by ASKs, is controlled by the three global alliances oneworld, SkyTeam and Star Alliance. Despite their dominance, other successful partnership models have evolved including holding companies, LCCs and joint ventures.
Mergers and acquisi-tions are usually resorted to either for increasing scale or cutting costs, while alliances are often used as a way to enter new markets.
HIGHlight
oneworld, 17%
Star; 22%
Others; 32%
LCCs; 10%
SkyTeam; 19%
Alliance Share by Capacity April, 2014 ASKs
ascend 53

Monitoring Codeshare Partner Pricing And
Inventory AvailabilityAirlines can improve their revenue management efforts by systematically monitoring codeshare
partner pricing and inventory availability through recent Big Data developments.
As part of a larger Big Data research effort, Sabre Airline Solutions® has invested in
infrastructure that permits collection and processing of vast amounts of
airline shopping data.
By Angela Lombardi, Joshua Hirschheimer and Joakim Kalvenes I Ascend Contributors

ASCEND I SPECIAL SECTION
irlines can improve their rev-enue management efforts by systematically monitoring codeshare partner pricing and inventory availability through recent Big Data developments.
As part of a larger Big Data research effort, Sabre Airline Solutions® has invested in infra-structure that permits collection and processing of vast amounts of airline shopping data.
When an airline enters into a partnership with another, clearly, it aims to expand its network and increase its revenue potential. However, entering into this relationship should not be taken lightly, as putting an airline code on another airline’s metal (or vice versa) can have several different impacts on an airline’s strategy.
In competitive markets, an airline’s pricing department must be totally in tune with current fares, promotions and market trends. This, too, can become increasingly difficult when working with a codeshare partner to mutually maximize revenue potentials.
The operations research consulting team for Sabre Airline Solutions has initiated an airline shopping data research and develop-ment program with a strategic airline partner. The focus of the first project in the series, Codeshare Alerts, is to optimize the use of shopping data for the purpose of monitoring the airline’s competitiveness and pricing position in the market. The expected output will provide valuable insights from daily shopping data and
assist the airline in monitoring competitor and, in this case, codeshare partner pricing activity.
Codeshare Alerts will monitor the fares of a host carrier’s partners that are available in the market on the same metal. Shopping data helps determine whether passengers are coming across shopping returns for the same itinerary marketed by both the host carrier and its partners with significant fare deviation.
Should this be true, it would indicate that the fares are out of compliance for metal-neutral carriers and might indicate that a codeshare partner is diluting revenues by placing overly aggressive fares on marketed codeshare flights, thus having a negative revenue impact on the host carrier. Provided that the host carrier and its partners have full anti-trust immunity, they can then work together to bring pricing and inventory levels back into alignment.
To further illustrate how the alerts are con-structed, how they should be interpreted and what corrective actions might be taken, con-sider the following practical example.
Two airlines have entered into a codeshare agreement and are jointly serving the LHR-SYD market. Robotic shops could be generated to mimic potential economy passengers searching online for a LHR-SYD departure leaving Jan. 11 and returning on Feb. 5. Codeshare Alerts search through the shopping returns for com-parable itineraries marketed solely by the host carrier or the partner carrier.
Shopping returns are considered to be com-parable if the point of sale, booking channel, trip
type, cabin, departure and return date/time, and operating flight numbers are equivalent. An alert will be issued if the codeshare partner’s fares deviate from the host carrier’s fares by more than a specified fare tolerance. From a practical point of view, this fare tolerance ensures that focus is placed on fare differences that warrant the effort associated with the fare correction.
The resulting Codeshare Alerts are streamed by magnitude of fare deviation and occurrence to facilitate the quick conversion of data into actionable targeted inventory or pricing actions. Alerts filters allow the selection of the operating carrier type, where all flights in an itinerary are operated by the host carrier or all flights are operated by a partner or flights are operated by both the host carrier and the partner.
Furthermore, business-rule filters allow the host carrier to implement a rich feature set such as tolerance levels by partner, tolerance by fixed amount or percentage of total fare, partner-specific and market-specific rules, reporting by ATI and non-ATI markets (to ensure compliance with anti-trust regulations), etc.
In contrast with standard fare comparison tools, Codeshare Alerts has a built-in fare pars-ing logic that accurately parses return fares by trip (outbound/inbound). This functionality enables the alerts to trigger at a lower level of granularity. Booking classes for both host marketed shopping returns as well as the code-share mapped classes for the partner marketed returns are provided, indicating whether a pric-ing or inventory action needs to be performed.
The reporting engine facilitates the produc-tion of longitudinal reports to spot systematic partner bias in the pricing structure, as well as compares fare bias by the host carrier’s partners over an extended range of departure dates.
Codeshare Alerts provides the insight required to effectively monitor partner pricing and facilitates quick and targetted corrective actions. Considering the depth of analysis, strategies and effort that goes into successful airline revenue management, it is hard to con-ceive how the tangible impacts of codeshare agreements could be overlooked.
Codeshare Alerts is offered as a consulting-supported data service. In a typical engagement, consultants will work with an airline to identify the appropriate markets and codeshare partners to monitor. Further, they will build the business-rule engine and graphical user interface. Delivery of the data is available as either a hosted service or a daily file transfer. a
Angela Lombardi and Joshua Hirschheimer are senior consultants and Joakim Kalvenes
is vice president of operations research consulting for Sabre Airline Solutions. They
can be contacted at [email protected], joshua.hirschheimer@sabre.
com and [email protected].
Actions To Avoid Dilution Comparable shopping returns marketed by both the host carrier and its codeshare partner trigger codeshare alerts on the outbound, whereby corrective inventory or pricing actions may be taken to avoid dilution.
Trip Type: RTO&D: LHRSYDDeptdate: 11/10/2013Returndate: 05/11/2013
Shopdate: 30/08/2013POS: GBBookingChan: TNfare_O&D_RT = $1,655
LHR LHRSYD SYDXXX XXX
Seg 1 Seg 2Op: XX YYMKT: XX* XX*Fare_LHRSYD_OB = $750
Seg 3 Seg 4Op: YY XXMKT: XX* XX*Fare_SYDLHR_IB = $905
Outbound Inbound
V Q Q L
Trip Type: RTO&D: LHRSYDDeptdate: 11/10/2013Returndate: 05/11/2013
Shopdate: 30/08/2013POS: GBBookingChan: TNfare_O&D_RT = $11,598
LHR LHRSYD SYDXXX XXX
Seg 1 Seg 2Op: XX YYMKT: YY* YY*Fare_LHRSYD_OB = $678
Seg 3 Seg 4Op: YY XXMKT: YY* YY*Fare_SYDLHR_IB = $920
Outbound Inbound
V Q Q L
Shopping Return: Marketing Carrier Is The Host Airline
Shopping Return: Marketing Carrier Is The Partner
ascend 55

KƉĞƌĂƟŽŶĂů� ŐƌŽƵƉƐ�ƉĞƌĨŽƌŵ� ƚŚĞ�ǁŽƌŬ� ƚŽ� ŬĞĞƉ�ĂŶ�ĂŝƌůŝŶĞ͛Ɛ�ŇĞĞƚ� ĨƵŶĐƟŽŶŝŶŐ�
ĂŶĚ͕�ĂƐ�ƐƵĐŚ͕�ƚŚĞLJ�ƉĞƌĨŽƌŵ�ĞdžƚƌĞŵĞůLJ�ǀĂůƵĂďůĞ�ƐĞƌǀŝĐĞƐ�ƚŚĂƚ�ĂůůŽǁ�Ă�ĐĂƌƌŝĞƌ�ƚŽ�
ŽƉĞƌĂƚĞ�ƐĂĨĞůLJ�ĂŶĚ�ĞĸĐŝĞŶƚůLJ͘��Ƶƚ�ŽƉĞƌĂƟŽŶƐ�ŵƵƐƚ�ĂůƐŽ�ďĞ�ǀŝĞǁĞĚ�ƐƚƌĂƚĞŐŝ-
ĐĂůůLJ͘��ŶĚ�ƚŚĞŝƌ�ƐƚƌĂƚĞŐŝĐ�ĐŽŶƚƌŝďƵƟŽŶ�ƚŽ�ƚŚĞ�ďŽƩŽŵ�ůŝŶĞ�Ͷ�ŝĨ�ĨƵůůLJ�ƵŶĚĞƌƐƚŽŽĚ�
ĂŶĚ�ĂƉƉƌĞĐŝĂƚĞĚ�Ͷ�ĐĂŶ�ďĞ�ƋƵŝƚĞ�ƐŝŐŶŝĮĐĂŶƚ͘
By Manolo Centeno, Ascend Contributor
A SYSTEM VIEWThe Strategic Value Of Operations

ASCEND I SPECIAL SECTION
nyone who has been part of an operational group in the airline industry knows that an operat-ing group’s sole fundamental duty is to run the specific activi-
ties within the group’s own operational purview right up to aircraft departure for its intended destination.
In fact, it can all be summed up fairly sim-ply. Prof. David M. Upton of Oxford University Saïd Business School has defined operations as “all the activities a firm conducts in order to deliver value to its customers. It’s the set of processes that transforms either materials or information into a product or service.”
Typically, other groups such as network planning, sales, revenue management and marketing are perceived to be more glamor-ous — and more strategically focused — than their operational counterparts.
But there are concepts that can be applied to bring out a major opportunity to realize a considerable strategic value of operations within the airline industry. Some airlines under-stand these concepts much more clearly than their competitors — and those carriers tend to develop strategic advantages based on the real value their operations produce for them and, of course, for their customers, as well.
The BasicsIn the operations field, there are two highly
relevant topics for airlines: customer satisfac-tion and competitiveness. And customers have their own ways to assess the value provided by airlines (besides the act of simply transport-ing those customers from Point A to Point B).
One of the most important values that airlines provide (after, of course, the “given” of safety) is reliability or consistency in the product they deliver to their customers.
Reliability — or quality — covers aspects from punctuality and the number of cancel-lations an airline accumulates to whether passengers arrive at the destination with their bags.
On the competitive side, airlines are gener-ally motivated by following different strategies. It is well known that airlines try to compete using different models — generally defined as the low-cost-carrier model, the ultra-low-cost-carrier model, the full-service model or a hybrid of these.
In an industry in which pricing is very com-petitive and the product is less-differentiated, operating efficiently can result in a competitive advantage if an airline can achieve lofty levels of customer service through a high level of reliability.
Many carriers today are laser focused on the passenger journey, or trying to be cus-tomer centric. However, every airline — by definition — should be customer centric, since all airlines provide a service. But customer centricity ends as soon as the airline does not
provide an acceptable and constant level of reliability.
In addition, an airline that operates effi-ciently can provide a high level of customer service and lower the costs of that service. Airlines with high levels of punctuality, for example, will have lower costs — which, in turn, will increase their operating margins.
So in a nutshell, operations should be focused on increasing productivity and improv-ing quality.
The System ViewOperations must be viewed as a system.
And airlines without a good understanding of this system create suboptimal processes that drive low quality and low productivity.
Airlines — like any other organization — take inputs (airplanes, fuel, pilots, crews, cash, etc.) and transform them into outputs. In the case of the airline industry, the output is a set of services, such as transporting passengers and their bags from Point A to Point B safely and reliably.
So how can an airline come to a realistic understanding as to whether its operations system is good, not to say performing to a measurable degree of excellence? Answering this question requires analysis of how the planning process for an airline is configured.
In the case of an airline, the planning process is the proxy for the operations system (because operations takes inputs and trans-forms them into outputs) before the airline operates its schedule.
So if planning processes only consider some aspects and not others, it is likely that the airline will produce a low-quality product, meaning a product in which passengers are delayed and cancellations run at a higher num-ber than the industry standard. It also means the airline will have to use more resources to overcome the low quality that the service is producing, which, in turn, increases costs and reduces productivity.
Things Gone WrongWhat are the aspects airlines are miss-
ing? And which drive low quality and low productivity?
The most common cause of low quality and low productivity is not considering all the constraints or operational needs to operate a particular schedule — driven by a belief that certain planning groups “own” the planning in a given time, and that other groups should not be enabled to have much influence.
Any person working in operations at an airline realizes that creating a schedule that is not opera-tionally feasible will result in a degraded operation.
Driving Revenue Levels Data indicates that on-time performance is correlated with higher operating margins. Having an efficient operation can help airlines reduce costs on several items such as customer-service recovery, misconnected/lost bags, staffing disruptions/overtime, maintenance sched-ule disruptions and flight interruption manifests (FIMs) to other airlines. Having an efficient operation can help airlines increase customer satisfaction and, therefore, increase or maintain its revenue levels.
A
Relationship Between On-Time Performance And Profitability U.S. Industry — 2013
VRXUFH��'27�)RUP����DQG�����
20%
18%
16%
14%
12%
10%
8%
6%
4%
2%
0%70% 75% 80% 85% 90% 95%
ascend 57
This can happen, for example, when the network planning group plans a schedule only taking into consideration the airline’s heavy maintenance requirements and leaving out the assignment of weekly and daily checks to the maintenance planning group and the operations control center.
From a functional point of view, this makes total sense. But from a system-transformation point of view, it makes little or no sense.
The network planning team does not have all the information available — or perhaps the manpower — to properly perform this activity.
From a system-transformation point of view, this is not the right way to address the system. In other words, it may be optimal for one busi-ness unit or subsystem, but it is effectively creating a big problem for other divisions and/or subsystems.
In the operational-management world, this is called sub-optimization.
Since the planning horizon keeps shifting as the timeframe moves closer to departure, the planned transformation system is flawed from its very inception. So a very logical solution to this problem would be enhanced collaboration between the maintenance planning and network planning teams.
Since the network planning team manages and controls the entire schedule, other operational groups should be included and consulted to assure schedule validity. Airlines that are very collab-orative between planning groups and operations groups will have a better transformation system in place, which will translate into a robust schedule.
A way to avoid the negative factors of sub-opti-mization is to establish a collaborative framework throughout all the planning phases.
Some airlines implement different models to encourage such collaboration, thus improving the transformation system. One North American airline, for example, has an operations planning group that works with the different operational groups as well as the network planning group. It functions in similar fashion to any other busi-ness-unit organization such as finance or human resources.
Other airlines have less-formal organizational structures, but may have well-defined timelines and feedback processes to significantly improve the planning. However, the only way to make this happen is in a circumstance in which the executive team understands these concepts and embraces collaboration.
The Beer GameOne way to demonstrate these concepts to
a broad base of executives is through the Beer Game.
The primary objective of the Beer Game, which was originally conceived several decades ago by a professor at MIT, is to show the players the value of collaboration and information flow. Players tend to get excited because they believe beer will be involved, but “beer” itself is actually not part of the game, it’s simply a catchy name.
And despite being an inventory-focused exercise, the Beer Game’s concepts highlight the value of collaboration in the transformation system.
Typically, the Beer Game is executed in two rounds.
In the first session, all the players are directed to minimize the cost of their specific assigned business unit (in this case, a warehouse or fac-tory). Players are notified that the unit with the lowest cost will win the game, and they are also instructed not to talk to any other group on the supply chain (they need to conjure up their own decisions).
Generally, all the players become engrossed in working diligently to fulfill the given objective. At the end, somebody wins (the lower-cost business unit). As part of the game, the total cost (the sum of all the subsystems) is also tallied and recorded.
On the second round, players are allowed to interact, and a new objective is defined. Now the objective is to minimize the total cost of the supply chain. Typically, when the game is over there is no winner, but the total cost is always significantly lower (sometimes by as much as 50 percent) than the previous run.
At the bottom line, the difference in cost is essentially the cost of lack of coordination or collaboration.
That’s a high price to pay simply due to a business unit being optimized locally instead of globally. This situation is not unique to the revenue-generation units — it could also be happening in the cost/operating units.
So the next logical point is to quantify how the executive team can establish the proper framework to embrace collaboration and track statistics showing that the organiza-tion is achieving a high level of efficiency that provides value to its customers (which, incidentally, leads into a whole different topic, beyond the realm of this article but one that will be covered in a future issue of Ascend).
Impact On The Transformation System And Environment
It’s extremely important to understand that every operations-transformation system works within an environment, such as compe-tition, regulations and new technologies. And the transformation system has an impact on this environment. The environment, in turn, has an impact on the transformation system.
Managers typically argue that they cannot control the environment, and in the majority of cases this is true.
What’s important from an operations-management point of view is to define where this environment starts and ends. In other words, what is the boundary between the transformation system and the environment?
Understanding the environment will then allow the managers to define what they can or cannot control.
Some managers understand that they can influence the environment, as well as how they interact with their transformation system. Furthermore, they understand clearly that the current environment might not be the same in the future. And this is important because these managers can realign the transformation system to minimize the environment’s impact, or they may be able to reposition it for the future.
In addition, simulation provides value in analyz-ing and trying to understand whether an airline will have enough future airport capacity. And a strong argument can be made that not having enough gates, airspace or terminal space is out of the control of the manager. But it can also be quite logically argued that different alternatives can be analyzed to deal with the current issues, and strategies can be concurrently developed to avoid the impact in the transformation system in the future.
Can the airline, for example, influence the addition of gates or the construction of a new terminal? If not, should a new city be considered that might provide the much-needed capacity? Can the current facility be better exploited — in other words, is the current facility being used to its maximum capacity? Or are the right processes in place?
Can the schedule be altered to operate larger airplanes? Do “peak” or “de-peak” factors enter the equation?
Simply accepting a hypothesis that the environ-ment can’t be changed could turn out to be a very bad assumption. And successful airline managers regularly analyze and basically understand all these factors.
So it’s misleading to assume that operations only involves boarding, checking in passengers, efficient flight-planning, dealing with irregular operations or having all the flights covered with legal crews.
Today, in fact, such a limited perspective actu-ally represents a myopic and isolated view of operations.
In the airline industry — or any other industry for that matter — operations is a transforma-tion system to provide value to customers and shareholders alike.
So having very collaborative integrated plan-ning in place and understanding the environment can definitely help an airline provide significant value to its passengers, thus also helping the car-rier gain a competitive advantage in the marketplace. a
Manolo Centeno is senior principal and practice leader for the operations
consulting group at Sabre Airline Solutions. He can be contacted at
ascend58
ASCEND I SPECIAL SECTION

Creating
Communicating
Connecting
Creating, Communicating And Connecting
By Terry McClintock I Ascend Contributor
6WUDWHJLF�3ODQQLQJ�)RU�3ULFLQJ�$QG�5HYHQXH�0DQDJHPHQW
$Q�DLUOLQH·V�SULFLQJ�DQG�UHYHQXH�PDQDJHPHQW�VWUDWHJ\�LV�GHSHQGHQW�RQ�D�SODQ�WKDW�HQDEOHV�WKH�GHSDUWPHQW·V�
leaders to consistently focus on daily operations ZKLOH�DOVR�IRFXVLQJ�RQ�ORQJ�WHUP�REMHFWLYHV��There is a formula to building and executing
the plan that ensures optimal results.

sk any leader within a pricing and revenue management department about strategic planning and you’ll quickly hear things like, “achieving if not exceeding plan,” or more
succinctly, “consistently improving financial results with the tools available — that’s what matters around here.” Yet, best-practice stra-tegic planning in the pricing and revenue management context is much more than simply exceeding financial results for a given period.
Ask these same leaders how much time in a given week is dedicated to the critical task of strategic planning. If the answer is “never enough” or perhaps “none at all,” he or she is not alone as the typically hectic daily pace of pricing and revenue management creates an environment where simply getting the core job done takes precedence.
Most airlines communicate boldly about annual (and beyond) strategic plans. The plans generally emanate from a series of annual meetings with senior leadership, and then they often get put into presentations where they are quickly broadcast through the ranks and quickly supplanted by the “crisis of the day.”
Aside from the daily business conflicts that often tend to act against successfully execut-ing on strategic plans, modern-day pricing and revenue management leadership faces
practical issues that can be placed into three categories: The staffing or people element of the equa-
tion in generating upward confidence that they have the skillsets and active thinking required to meet the plan,
General business volatility scaled against the network size and geography and can be both internally and externally driven,
The ever-increasing trend within the rev-enue management space to perform “over-the-shoulder” post-performance scoping reviews that validate performance in a near-term framework, hence causing more reac-tionary approaches.How is a pricing and revenue management
leader to transcend this cycle and create more meaningful and pertinent strategic plans such that leaders and their teams demonstrate full buy-in and the department collectively marches toward targets?
Against the likely scenario that disconnects occur between managerial outputs from stra-tegic planning and frontline employees, airlines may reach out to pricing and revenue manage-ment consultants who offer broad experience to remedy this situation. Consultants should support airline leaders in effectively translating strategic plans into daily, weekly, monthly and quarterly tasks and processes to help ensure the plan is adopted throughout the pricing and revenue management organization.
Key Plan AspectsWhat do airlines consider in terms of strate-
gic planning idea creation and ensuring they are being complete in the process?
Corporate goals naturally set the pace in terms of topline financial objectives where pricing and revenue management get assigned performance expectations. Given the operating characteristics and that the core functionality of this group is to enhance revenues, it is imperative that the department come away from the strategic planning exercise with a clear understanding of how the daily actions are going to drive the corporate goals.
The operating environment faced by carriers varies significantly across the globe and, depending on network size, can truly be multi-faceted in nature. From monitoring explosive growth of low-cost carriers (LCCs) in Asia to effectively considering ancillary strategy changes from traditional network carriers in Europe, the industry is replete with change and often implies that outside support from consult-ing guarantees a more exhaustive consideration when planning.
Economic environments can change quickly, and for a pricing and revenue management operation that is global in nature, it is vital to consistently remain aware of and continually hedge risk around an airline’s network. From addressing directional travel imbalances to understanding currency fluctuations, full consid-eration of the economic environments faced in the near future is required.
Understanding the socio-political environ-ment in which an airline operates drives another key facet as part of planning. While top-ics such as civil unrest are a less savory point of discussion, politics aside, they are part of the uniqueness of the airline industry and must be actively considered and effectively planned for as best possible.
Market dynamics and their changing nature largely drive what airlines do in the pricing and revenue management space. As such, having input from key stakeholders at levels within the organization that can effectively distill onward expectations at the regional level are often the lynchpin to “connecting the dots” of high-level strategic plans to frontline employees.
Internal needs must be considered as it relates to high-performance pricing and revenue management teams. Pricing is the “fuel” to an effective revenue management operation across both technology systems and business processes. Neither can be successful long term by operating in silos or a vacuum and, as such, integrated discussions, activities and commitments must be well aligned as part of the planning process.
Building The PlanVarious frameworks for strategic planning
permeate the industry and are effective for creating and maintaining — if not growing — a
pricing and revenue management department. The following six-step framework can be used to build an effective plan.
Step 1: Propose A Mission The mission of the strategic plan should
include a penetrating, relevant and purpose-driven set of statements easily relatable to the daily activities performed within the depart-ment, such as: Driving consistent quarterly revenue improve-
ments by offering creative and impactful generative thought leadership in conjunction with all commercial areas,
Championing both the proactive and reactive activities necessary to run a best-of-breed pricing and revenue management team.
Step 2: Definine GoalsDefining goals comprises a well-thought-out
series of achievable tenets best created with significant involvement of frontline managers to affirm precision and applicability to the current operating framework, including: Achieving and maintaining a daily standard of
completing a network review of competitor fares, rules and footnotes on a daily basis (pric-ing),
Reaching a seasonally adjusted ~10 percent revenue improvement in a given originating region (revenue management).
Step 3: Examine Internal Issues Identify and examine an exhaustive culling of
known challenges within the respective pricing and revenue management areas that merit focus in the coming year, such as: Staffing challenges at the analyst level have
led to less-than-desired consistency and reli-ability in performance, requiring more hands-on managerial time to rectify,
Group-related traffic permeates significant por-tions of the network and the sales team is incessant regarding inventory obligations dur-ing peak seasons, threatening overall yield,
Scheduling and network restrictions dictate from an operational perspective flying aircraft on a given route that has too many seats ver-sus typical market demand, driving poor load factors and financial performance.
Step 4: Examine External Issues Examining external issues requires a
broad review of the operating environment(s) faced that portrays clear points of focus that not only should be addressed, but that likely permeate much of the decision-making within pricing and revenue management, including: How to manage fares and demand optimi-
zation when operating from a high-volume region with a cut-throat competitor that perennially under-cuts the market,
Slot restrictions at a preferred but alter-nate airport lead the airline to have a
less-than desirable schedule to suit business-oriented, high-yield day trips.
Step 5: Create A SWOT Analysis The SWOT analysis encompasses a long-valued
framework within consulting focused on identifying strengths, weaknesses, opportunities and threats but one especially customizable to the particular problems typically faced in pricing and revenue management. It enables the creation of a most direct portrayal of the various pluses and minuses in a commercial context, and it is used to: Highlight business challenges from top to bot-
tom in pricing and revenue management con-text at the network, regional, country and market levels,
Pinpoint direct, effective ties to frontline employ-ees in terms of both the typical daily activities as well as recommended onward ad hoc analyses and actions.
Step 6: Formulate Strategy At the high level, the strategy is a roadmap
upon which to execute the content that bears a directly relatable path from top to bottom within the department, which should be: The most effective tool used by director- and
manager-level staff in cementing the corporate strategic plan to a daily action plan for analysts while also representing the general level of expectation within the department,
Viewed as a changeable at the micro-level against the ever-present likelihood of change. A pricing and revenue management leader’s
team is likely well experienced in completing the annual planning cycle. But how successful is the leader at influencing his or her organization to achieve the desired results?
Executing The PlanTo properly execute on the six-step strategic
planning cycle, effective channeling is required to assimilate the strategic plan throughout the pricing and revenue management organization.
Creating an environment of accountability, con-sistency and rigor is an activity often fortified by outside consulting as it can represent significant cultural shift in an organization. If the recom-mended approach is used to synthesize and build the plan properly, the outcome is more efficiently and broadly used, making execution a natural consequence.
Adherence: Walk The TalkAn inherent part of leadership is engaging
subordinates and validating through daily activities and interactions that the goals and activities are directly relatable to theirs. In the context of strategic planning for pricing, active leadership participation and visibility in activities (such as daily pricing briefings) validates the process, sets expectations and inspires the organization while enabling mutually assured confidence that the relevant elements from the strategic plan are “in action.”
From a revenue management perspective, con-sistent regional reviews of overbooking levels and yields pinpoint shortfalls and successes and set the overall theme of “find, synthesize, act” that sum-marizes sound revenue management practices.
Prioritization Of ReviewLeaders should acknowledge industry volatil-
ity and commitment to the strategic plan by consistently abiding by monthly and quarterly reviews within the department. They should determine if their directors and managers are conversant to the agreed contents of the stra-tegic plan, how it directly ties to their job function and if their people are doing the same. Not intended to be a time-consuming effort once underway, proper prioritization makes a bold commitment statement to the team while enabling the occasional course correction.
Team EffortGiven the key intersection that pricing and
revenue management occupies in the com-mercial organization of an airline, it’s important to remember that the secret to revenue successes often lies in establishing and maintaining active and honest dialogue across key departments including but not limited to sales, marketing, operations, network, scheduling and distribution. Though it is often said in jest that the job of revenue management is to say “no” — a refer-ence to the core function of setting inventory availability — in actuality, this could be restated such that the desired function of revenue man-agement is to give a “qualified yes” to any given seat request.
The bottom line is that any goal within an airline’s annual strategic plan is subject to myriad impacts — many unanticipated — and this is especially true in the pricing and revenue man-agement context. Being able to effectively lean on minor scheduling tweaks, equipment swaps, partner relationship changes or distribution adjustments can, in the end, make or break a given pricing or revenue management initiative, goal or the overall plan.
Confidence from leadership in the strategic planning context becomes contagious to the masses when properly executed. This affirmed sense of buy-in to a strategic planning process gives everyone a crystal clear, daily framework under which to complete tasks, yet still have time to think big and aggressively experiment in their daily work. In this way, the strategic is closely bonded to the practical, and best efforts ensue on agreed upon paths to revenue growth within the pricing and revenue management area. a
Terry McClintock is a manager in pricing and revenue management consulting for Sabre Airline Solutions. He can be
contacted at [email protected].
Six-step Planning Framework Building an effective pricing and revenue management plan requires a six-step framework that includes proposing a mission, defining goals, examining internal issues, exam-ining external issues, creating SWOT analysis and formulating a strategy. Once these steps have been taken, an airline is ready to implement the plan.
ASCEND I SPECIAL SECTION
ascend60
ASCEND I SPECIAL SECTION
3URSRVH�Mission
Define Goals
Examine Internal Issues
Examine External Issues
&UHDWH�6:27�Analysis
Formulate 6WUDWHJ\
A
ascend 61


An Airline’s Edge In Maximizing Return On Technology Investment A result of customer input and feedback, the Continuous Learning Series provides SabreSonic® Customer Sales & Service (CSS) clients the best in education and updated product training, en-abling them to realize maximum return on their technological investments.
Knowledge Is Power
ASCEND I COMPANY
By Jay Jain I Ascend Contributor

ascend 65
ASCEND I COMPANY
ascend64
ASCEND I COMPANY
nvesting in advanced technology is among the smartest moves companies can make, especially in the fast-moving 21st-century world of aviation and
global transportation.However, it is also critical to make full and proper use of that advanced technol-ogy — from a competitive standpoint, as well as the financial realities encountered in the day-to-day operations of a thriving business.
Sabre Airline Solutions® established the Continuous Learning Series on this funda-mental basis. Free of charge to SabreSonic CSS customers, the sessions enable them to reap maximum benefits from their tech-nology investments via regular training sessions with the greater airline commu-nity where vast knowledge is shared by all. This empowers participants to understand the technology and use it to its maximum potential.
“The session was really good and informative, and we enjoyed the inter-action with other airline partners,” said Mai Hoang Chi, reservations manager for Vietnam Airlines. “And the information shared is going to help us further improve our processes. We’re looking forward to implementing more EMDs [Electronic Miscellaneous Documents].”
In addition to educating airline agents about the technology they use, the ses-sions were also designed to address any system issues and fine tune business processes.
“The session was very informative, and we were able to identify various issues and the resolutions,” said Chantell Ausmeier, operations business support analyst for Kulula. “We had a lot of discussions about the correct steps on various things like Exchanges and EMDs, and now we feel confident about the teachings.”
“The content was very informative, and we really liked the pace and the way the entire session was conducted,” agreed Patricia Minihold, Kulula operations busi-ness support analyst.
Because aviation technology tends to advance with almost breathtaking speed and regularity, training in each increment of technological development is not just desirable, it is imperative.
Therefore, the Continuous Learning Series was initiated based largely upon the strong recommendations of numer-ous SabreSonic CSS customers who felt a certain urgency to not only acquire broader and deeper product training, but also to provide additional input on product
updates — an invaluable service that would enable airlines to get the most from their investments.
Continuous Learning Series sessions are scheduled at regular intervals at key global locations including Sabre Airline Solutions’ headquarters in Southlake, Texas, as well as its offices in London and Bangalore.
The objective is to provide the best documentation and training experience and ensure
all users have current and correct knowl-edge their airline can leverage to enhance the passenger experience and simplify the complexities of the business. It also gives airlines the opportunity to visit Sabre Airline Solutions’ offices, meet some of the experts behind the technology and experi-ence some “behind-the-scenes” activities that are relevant to the technology they use.
“The classes were very informative for us,” said Hani Nurlena Binti Mohammed, contact center representative for Malindo Airways, a Lion Air Group subsidiary. “It was a great opportunity for us to see the Sabre Airline Solutions office and meet the different teams that work with us everyday and get any issues resolved for us. The class was fun, and the trainer was superb.”
Another critical goal is to present the most complex solutions and share common best practices across the greater airline community. This gives airline users a more
thorough understanding of the technology so they can achieve optimum results.
“Through the Continuous Learning Series sessions, we have learned new techniques for automated exchanges and refunds and irregular operations technol-ogy,” said Napastanaporn Kaewwongwan, reservations and ticketing manager for Bangkok Airways. “We also learned new EMD functionality. It was great to meet the folks at the SabreSonic CSS help desk, as well as the development team at the Bangalore office. The class was fun and wonderful, and we hope to join it again.”
The VisionThe vision behind the Continuous
Learning Series is the creation of a learning organization that cost effectively shares information across the globe. And that vision has come to fruition.
When the Continuous Learning Series was launched more than a decade ago, the primary challenge was to determine appropriate topics and develop a full agenda. Still relevant today, topics for the first sessions included schedule change, codeshare, inventory, reservations and ticketing. Through the years, the sessions have evolved to include advanced courses that address topics such as Electronic Miscellaneous Documents, schedule change control, dynamic schedules,
automated exchanges and refunds, as well as SabreSonic® Check-In and codeshares.
“The training sessions gave me new insights into how we can better utilize the automated exchanges and refunds tool in line with our business needs,” said Yonaten Bekele, an application ana-lyst for Ethiopian Airlines. “The training is very interactive and insightful.”
As a learning organization, the trans-fer of knowledge spans well beyond the Continuous Learning Series. Sabre Airline University®, an online portal that houses documentation of all SabreSonic CSS solutions, enables users of the technology to download documentation anywhere in the world … anytime.
Airlines representatives can log onto Sabre Airline University and register for Continuous Learning Series sessions. Airlines can send two representatives (super users) for training to any of the three locations. Those representatives can then use the information to educate other colleagues.
In addition, Sabre Airline University is a virtual learning institute that offers essential advanced airline education to SabreSonic CSS customers.
Four Primary GoalsThere are four fundamental goals that
continue to guide the content of Continuous Learning Series sessions: Provide robust and cost-effective train-
ing sessions globally, Build a community of “super users”
within each airline able to share their knowledge across the entire organiza-tion,
Create and nurture an open environment for super users to learn and share best practices to better utilize the systems,
Provide a clear product scope and direc-tion so airlines can better understand and anticipate the patterns of industry development over time.To ensure the Continuous Learning
Series provides the information and train-ing that airline super users need and expect, feedback is gathered regularly so adjustments can be made, if necessary, and best practices can be incorporated into class agendas.
The Continuous Learning Series goes beyond learning, however. The Participants are encouraged to bring open service requests to the sessions, so they can work directly with members of the help desk to resolve issues as well as provide feedback and improve processes.
Clearly, technology is only as good as those utilizing and applying it. Ensuring that airline professionals receive the nec-essary training and education concerning the applications they use yields optimum results for airlines that have made these valuable technological investments. a
Jay Jain is a SabreSonic CSS training principal for Sabre Airline
Solutions. He may be contacted at [email protected].
Pho
tos:
Shu
tter
stoc
k
Optimizing ROI Broadened Each year, several airline representatives from around the world attend the Continuous Learning Series to gain insight into the systems they use as well as network with the greater airline community to learn about best industry practices.
IClass Topic When
And Where?Who Should Attend? What Will You Learn?
Schedule Change Control With O&D Reaccommoda-tion
This class is for CRC and schedule change personnel as well as others wishing to learn the start-to-finish processes for establishing basic flight schedules and those who need a refresher.
Some schedule change background is recom-mended but not required.
This class is for CRC, schedule change, Inventory and other personnel responsible for updating/maintaining codeshare tables as well as those who deal with flight displays in City Pair Availability.
Topics covered will include :
agreement
schedules)
This class is for carriers new to the SabreSonic Check-in system. We will cover the new look and feel of familiar processes such as check-in.
Existing SabreSonic Check-in carriers are welcome to join as well.
Topics covered will include :
Topics covered will include:
change modes
Codeshare Automation And Dynamic Schedules
Sabre Sonic Check-in Conversion
June 2-6 Kraków, Poland
Oct. 6-11 Dallas/ Fort Worth, Texas
June 9-13 Kraków, Poland
Sept. 8-12 Bangalore, India
Pho
tos:
Sab
re C
orp.

Real-Time
Revenue Reporting Keep An Eye On Revenue Realization
For Every Seat Sold
Airlines can track key revenue-centric metrics in real time and
acquire an accurate picture of their performance across different
data slices.
By Harjot Grewal and Halldor Gylfason Ascend Contributors
Flexible proration library
Data-integration platform
Drill-down capabilities
TriggersIndependent infrastructure
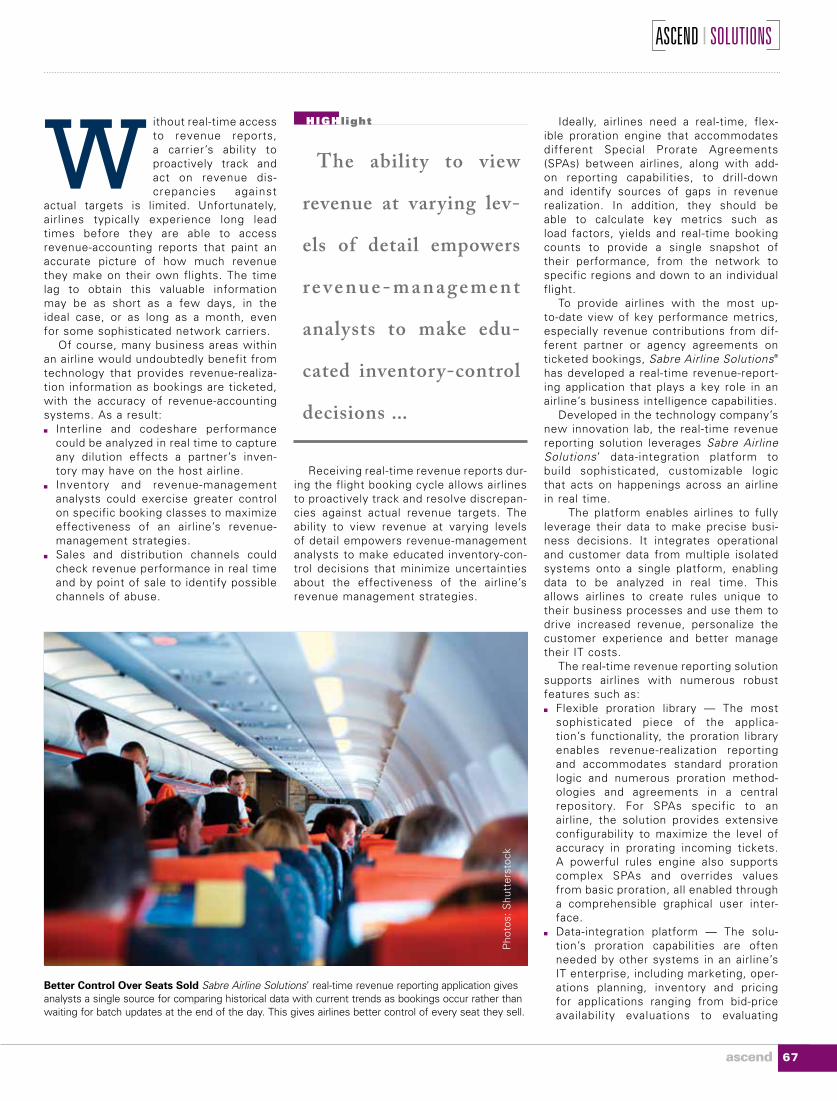
ithout real-time access to revenue reports, a carrier’s ability to proactively track and act on revenue dis-crepancies against
actual targets is limited. Unfortunately, airlines typically experience long lead times before they are able to access revenue-accounting reports that paint an accurate picture of how much revenue they make on their own flights. The time lag to obtain this valuable information may be as short as a few days, in the ideal case, or as long as a month, even for some sophisticated network carriers.
Of course, many business areas within an airline would undoubtedly benefit from technology that provides revenue-realiza-tion information as bookings are ticketed, with the accuracy of revenue-accounting systems. As a result: Interline and codeshare performance
could be analyzed in real time to capture any dilution effects a partner’s inven-tory may have on the host airline.
Inventory and revenue-management analysts could exercise greater control on specific booking classes to maximize effectiveness of an airline’s revenue-management strategies.
Sales and distribution channels could check revenue performance in real time and by point of sale to identify possible channels of abuse.
Receiving real-time revenue reports dur-ing the flight booking cycle allows airlines to proactively track and resolve discrepan-cies against actual revenue targets. The ability to view revenue at varying levels of detail empowers revenue-management analysts to make educated inventory-con-trol decisions that minimize uncertainties about the effectiveness of the airline’s revenue management strategies.
Ideally, airlines need a real-time, flex-ible proration engine that accommodates different Special Prorate Agreements (SPAs) between airlines, along with add-on reporting capabilities, to drill-down and identify sources of gaps in revenue realization. In addition, they should be able to calculate key metrics such as load factors, yields and real-time booking counts to provide a single snapshot of their performance, from the network to specific regions and down to an individual flight.
To provide airlines with the most up-to-date view of key performance metrics, especially revenue contributions from dif-ferent partner or agency agreements on ticketed bookings, Sabre Airline Solutions® has developed a real-time revenue-report-ing application that plays a key role in an airline’s business intelligence capabilities.
Developed in the technology company’s new innovation lab, the real-time revenue reporting solution leverages Sabre Airline Solutions’ data-integration platform to build sophisticated, customizable logic that acts on happenings across an airline in real time.
The platform enables airlines to fully leverage their data to make precise busi-ness decisions. It integrates operational and customer data from multiple isolated systems onto a single platform, enabling data to be analyzed in real time. This allows airlines to create rules unique to their business processes and use them to drive increased revenue, personalize the customer experience and better manage their IT costs.
The real-time revenue reporting solution supports airlines with numerous robust features such as: Flexible proration library — The most
sophisticated piece of the applica-tion’s functionality, the proration library enables revenue-realization reporting and accommodates standard proration logic and numerous proration method-ologies and agreements in a central repository. For SPAs specific to an airline, the solution provides extensive configurability to maximize the level of accuracy in prorating incoming tickets. A powerful rules engine also supports complex SPAs and overrides values from basic proration, all enabled through a comprehensible graphical user inter-face.
Data-integration platform — The solu-tion’s proration capabilities are often needed by other systems in an airline’s IT enterprise, including marketing, oper-ations planning, inventory and pricing for applications ranging from bid-price availability evaluations to evaluating
ASCEND I SOLUTIONS
ascend 67
Better Control Over Seats Sold Sabre Airline Solutions’ real-time revenue reporting application gives analysts a single source for comparing historical data with current trends as bookings occur rather than waiting for batch updates at the end of the day. This gives airlines better control of every seat they sell.
WHIGHlight
Pho
tos:
Shu
tter
stoc
k
The ability to view revenue at varying lev-els of detail empowers r e v e n u e - m a n a g e m e n t analysts to make edu-cated inventory-control decisions ...

ASCEND I SOLUTIONS
68 ascend
codeshare agreements. The data-integra-tion platform gives airlines the ability to make this data available to downstream third-party systems via standard Java API, Web services, message queues and files.
Drill-down capabilities — The data-inte-gration platform’s flexible architecture allows the tool to graphically display several dimensions of revenue analysis, including revenue contributions by point of sale and by booking class at network, region and flight levels. In addition, com-bining derived key performance indicators such as yield and load factors give an
airline the most complete performance picture.
Triggers — The platform’s integrated rules engine enables the tool to pro-vide real-time alerts and interval-based reporting that notify end users when predefined conditions have been met, such as when booking volumes or actual revenue fall below set targets. This real-time notification supports analysts and managers with proactive decision mak-ing.
Independent infrastructure — The cre-ation of the reporting tool on top of the
platform allows the solution to function independently of other airline systems. Additional capabilities will be incorpo-
rated into the solution later this year, including: “What-if” analysis capabilities — By
leveraging the solution’s what-if analysis engine, airlines can pre-empt SPAs that dilute their revenue stream through the convenience and transparency of a simu-lation capability made possible by the flexible proration library.
Building predictive modeling capabilities — As part of the commercial planning suite, the real-time revenue-reporting solution will gradually support forecast-ing capabilities on revenue, yield and other metrics through complete integra-tion with revenue-management systems. Analysts will have a single source in which to view historical performance against current trends and act as book-ings occur, instead of waiting for end-of-day batch updates on the day’s perfor-mance. This provides better control over every seat an airline sells.Real-time revenue reporting gives air-
lines the ability to view revenue contribution at varying levels of detail, so they can make proactive decisions that minimize uncer-tainties and maximize effectiveness of their revenue-realization capabilities. a
Harjot Grewal is solution manager and Halldor Gylfason is solution architect
of the Sabre Data Integration Platform for Sabre Airline Solutions. They can be contacted at harjot.grewal@sabre.
com and [email protected].
Agent Notification Timatic AutoCheck automatically checks passengers’ travel documents to ensure they meet all travel requirements. If a passenger does not have the necessary documentation for his or her trip, check-in will be restricted and the airline agent will be notified of specific documentation and visa requirements.
Personalized Customer Experience The data-integration platform combines operational and customer data from various isolated systems onto a single platform so data to be analyzed in real time. This enables airlines to create rules specific to their business processes and use them to personalize the customer experience as well as increase revenue and effectively manage IT costs.

THE ART OF CalibrationUnleashing The Power Of Network Planning
Calibration can help airlines plan better through more accurate and thorough scenario-evaluation processes. To assist airlines in achieving optimal calibration re-sults, Sabre Airline Solutions® offers an experienced team of operations-research practitioners dedicated to sharing their knowledge and expertise with airlines around the world.
By Gautam Pradhan I Ascend Contributor

ASCEND I SOLUTIONS
ascend 71
n all successful businesses, plan-ning is critical. Because entire departmental functions often revolve around it, business planning must be timely and accurate.Particularly in the airline industry, a
compelling argument can be made that busi-ness planning based on accurate and robust analyses can have a significant impact on a carrier’s bottom line.
Thorough airline business planning directly affects the performance of every organization-al function — and it involves many diverse elements of airline activity.
The network-planning process, for example, helps airlines define and execute their long-term planning initiatives around key decisions on salient factors including fleet composition, product offerings, identification of growing markets, hub design, fleeting frequency and departure-time optimization.
To systematically support these initiatives, airlines need technological capabilities encom-passing activities such as schedule creation and management, demand forecasting, profitability evaluation, and fleet and timing optimization under constraints.
Fortunately, highly sophisticated tools are available to help airlines deal with all these factors. These tools require calibration from time to time to maintain accurate and robust forecasting.
What Is Calibration?Calibration is the process by which a robust
set of parameters is created — using known information — so a model can generate what can be confidently characterized as an accept-able forecast.
By definition, parameter creation requires historical data collection and validation, sta-tistical-parameter estimation methods, and forecast-quality measurement.
Among the tools in the marketplace, Sabre®
AirVision™ Planning and Scheduling supports these decision-guiding requirements using Sabre® AirVision™ Profit Manager as the core forecasting and evaluation engine. In addition, Sabre® AirVision™ Global Demand Data serves as a primary historical market-data source for calibration, providing key inputs such as overall market sizes, historical market shares and passenger flows.
Industry-Leading Forecasting Capabilities
Profit Manager is a forecasting solution that supports complex scenario evaluations such as: New market viability; Frequency and timing changes; Codeshare, joint venture and alliance mod-
eling; Impact of competitor schedule changes; New hub structures.
The forecasting process consists of a pas-senger-connection builder, a customer-choice model that emulates passenger behavior when choosing connections, and a “spill-and-recap-ture” model to estimate traffic when demand cannot be served by available capacity.
Profit Manager enables airlines to con-trol several different parameters to model observed behavior, as well as fine-tune the forecasting results.
To maximize productivity when using the system for decision support, airlines must generate accurate forecasts. For larger airlines, this may equate to tens of thousands of market forecasts. Therefore, parameter setup and tuning are of para-mount importance.
Profit Manager requires calibration to ensure quality output throughout its prod-uct lifecycle. Calibration for Profit Manager is an iterative process by which system parameters are estimated and validated using various market and internal airline data sources.
Typical tasks that need to be performed when calibrating the system include: Defining the network — Analyzing a
larger network allows new market sce-narios to be modeled more effectively; however, it inflates the run time and
may add unnecessary bulk to stable scenarios. In addition, an airline needs to obtain data for all the markets consid-ered in the system.
Estimating economic data such as mar-ket demands, segmentations and fares.
Estimating parameters for itinerary gen-eration to balance the construction of valid itineraries as opposed to itineraries that may never, in reality, be chosen and will dilute market share in the system.
Estimating passenger-preference param-eters for the customer-choice model.
Establishing parameters for spill and recapture — Revenue management practices are simulated by defining the proper fares, load factors on closed flights, and the coefficient of variation of demand.
Measuring system performance and performing macro- and micro-level adjustments to fine tune the results.
Global Demand And Fare Estimation
As recently as a decade ago, estimating market demand for historical periods was not a significant challenge since global distribution systems (GDSs) captured most bookings, and these data points — through
i
System Accuracy Sabre AirVision Profit Manager contains a modular forecasting process with several inputs that need to be calibrated to ensure system accuracy.
ascend70
ASCEND I SOLUTIONS
subscription — have been readily available to airlines.
With the growth of low-cost carriers and online bookings, the direct channel overall is now comparable to the GDS channel in terms of bookings.
The relative booking proportions vary by market segment, such as leisure or business
travel, length of journey (short-haul versus long-haul), airline and market type (domestic versus international).
Thus, GDS data — while providing a certain richness of detail — only generates what might be properly described as an “incom-plete” picture of total demand in a market.
Global Demand Data solves this problem by:
Combining and cross referencing more than 50 data sources, including book-ings from major global distribution systems (GDSs) such as the Sabre® GDS, fare data from the Sabre GDS, and government and other agencies that report traffic at various levels. Applying algorithms to estimate demand
and fill gaps in areas with low GDS cover-age.Algorithms used in Global Demand Data
are continuously updated with enhance-ments and new data sources as they become available. Extensive validation ensures consistency of the data from one period to another, and accuracy benchmarks with airline-provided data are used to con-tinuously assess and improve the approach and process.
Additionally, Global Demand Data can be enriched with post-departure traffic data from an airline, as well as additional airline-subscribed GDS data, to increase solution accuracy.
Today, several airlines, aircraft manufac-turers and airports use Global Demand Data to power their business intelligence and network planning functions.
Importance Of CalibrationCalibration is the foundation of good
decision making. A poorly calibrated sys-tem will inevitably lead to suboptimal decisions.
A recent study conducted by Sabre Airline Solutions, which was presented to the AGIFORS Scheduling & Strategic Planning study group, quantified the impact of a poorly calibrated system on decision making.
The study utilized a benchmark-cali-brated parameter set and multiple “bad” parameter sets to create different fore-cast sets. These forecasts were used to perform fleet- and hub-timing opti-mization to generate a new schedule. Each schedule was then evaluated against the benchmark-parameter set to mea-sure the reduction in forecasted revenue opportunity.
Results for a mid-sized hub-and-spoke carrier showed that a 3 percent increase in leg-traffic error due to incorrect market sizes led to a 0.5 percent loss in total rev-enue opportunity. The study also tracked a 0.4 percent drop in revenue opportunity when the quality of connections built by the system dropped by 8 percent.
Data Sources And Calibration Methods
The data-collection and data-validation processes represent important steps in
Forecasting And Validation Parameters are iteratively fine-tuned via forecasting and validation steps that measure system accuracy of each newly updated parameter set.
Multiple Data Sources Automated processing and adjustments using more than 50 different data sources are followed by validation performed by Sabre Airline Solutions experts to ensure data integrity and quality.
ConnectionBuilder
Host Airlineand OALSchedule
ConnectionBuilder
ForecastDemand by
Itinerary
EstimateTaffic byItinerry
ForecastMarket Shareby Itinerary
Market Share Model
Market SizesSpill and
Recapture Models
Market Share
Revenue Allocation Cost Allocation
Spill And Recapture
1 � 3 4
5 6
7
ConnectionBuildingRules
RevenuesDirect CostAllocation
Rules
AssignRevenues
AssignCosts
DisplayResults
DataPreperation
Calibrate
Validate
NetworkDefinition
Forecast
Sabre/Amadeus./Travelport MIDT
Sabre GDS Fares
GDS fare data for different airlines
World Wide DataAdjustment Processing
O&DMarket Sizes & Fares
All Other DataSources
Adjustments to fares and Market Sizes are done
during the process by cross-referencing
of information between the data
sources
Sabre personnel takes steps to
cross-check, rec-oncile and adjust the data accord-ingly, giving the
best validation and accuracy as reason-
ably possible.
DataAnalysts
Robust Forecasting Process
Iterative Calibration Process
Global Demand Data Estimation Process

ascend72
ASCEND I SOLUTIONS
ensuring the success of the calibration process.
Typical market-data sources include: Passenger name record (PNR) data, also
known as Marketing Information Data Tapes (MIDT), from GDSs help estimate itinerary-level passenger preferences and correctly establish connection-build-er rules.
Population-adjusted overall-market-size data, such as Global Demand Data, that adjusts for direct-channel and low-cost-carrier bookings are critical as airlines push harder on their direct sales.
Industry data including airline sched-ules, industry minimum connect time (IMCT) data, aircraft seat configuration and airport locations.
Market intelligence that encompasses data from airports or government agen-cies, competitive-fare information, etc.
Internal airline data such as ticket cou-pon data from revenue accounting and post departure traffic data from the departure control system are critical to compute origin-and-destination (O&D) fares and yields, as well as validate passenger loads and flows on the host airline’s network.Typically, calibration of data inputs
involves estimating parameter sets at a market level — or for a logical group of markets, referred to as an “entity” — using various statistical and model-estimation techniques such as linear and logistic regression, clustering, maximum-likelihood and demand based on sampling techniques.
Extensive Validation ProcessTwo important factors determine the
usability of the calibrated parameters: Robustness of the parameters during
schedule changes and network expansion, Accuracy of the forecasted results when
compared to historical data.However, be advised: Maintaining robust-
ness may lead to calibration of parameters at high levels of aggregation — possibly at the entity or system levels — that can reduce accuracy for some individual markets.
On the other hand, calibrating all parame-ters at a market level will be time consuming and can lead to bias toward the current mar-ket conditions and may not allow for optimal performance under future schedule changes.
Accuracy of forecasted results is mea-sured by comparing system performance to historical data for the following attributes: Connection-builder results validated
against historically observed connections Market-share-model accuracy Traffic estimates against post-departure
traffic data and passenger flows using industry data (such as MIDT and internal data such as revenue accounting).Accuracy targets are specified for key
performance indicators (KPIs) defined for each of the above attributes, and Profit Manager is expected to conform to these targets. During the calibration process, KPIs must be reviewed continuously, and the rel-evant parameters are adjusted interactively to refine the calibration.
Accuracy is further improved by evaluating and identifying markets requiring parameter overrides and adjustments.
Market-level problems may indicate a pattern that affects a larger group of markets and should be thoroughly analyzed.
Key considerations in applying market-level overrides include size and schedule stability of the market, as well as the quality of data used to validate the market. Robustness can be further established by testing Profit Manager with predetermined “what-if” scenarios.
These scenarios may include the addi-tion of new markets, frequency changes, codeshare and alliance partnerships, hub redesign (using a solution such as Sabre® AirVision™ Network Manager) or refleeting (using a solution such as Sabre® AirVision™ Fleet Manager).
Achieving Optimal ResultsThe calibration service offered by Sabre
Airline Solutions provides airlines with two sets of calibrated parameters each year. Specific deliverables include market-demand and fare data, as well as parameter sets for control of itinerary building, passenger-pref-erences modeling and spill-and-recapture modeling.
Assistance is also provided in extracting schedule and industry information from data feeds subscribed to by individual airlines, such as minimum connect times, aircraft seat configurations and other relevant data, for use in Profit Manager.
Forecast-quality measurement is an inte-gral part of the process. Reports measuring several KPIs at multiple levels of detail are shared with individual airlines.
When Sabre Airline Solutions personnel perform calibration for an airline, results are presented to the airline using standard templates that can help identify problem areas that must be addressed. These tem-plates are reviewed with the airline, and methodologies to address identified issues are discussed and applied.
The technology company’s calibration experts work closely with an airline’s plan-ning department to better understand the airline’s network and data sources, which are key in the performance and delivery of calibration.
Calibrations performed by Sabre Airline Solutions benefit airlines by: Eliminating the necessity for a dedicated
in-house calibration team. As a result, airline resources can be deployed in more strategic areas such as network planning and market development, and recruiting can focus on hiring candidates with plan-ning experience rather than operations research, statistics and other technical areas specific to calibration processes.
Ensuring timely delivery of calibrated parameters for each season. An in-house calibration team may have other, more
urgent responsibilities that relegate cali-bration tasks to a lower priority level within an airline’s planning area.
Providing consistent high-quality calibra-tion processes and outputs, including vali-dating data quality and consistency among various sources, ensuring regular industry data updates, support for setting up user-defined inputs and evaluating final output parameters.
Continuously adopting evolving calibration methodologies and common best prac-tices.Airlines typically appoint one or two users
as liaisons between their larger user teams and the Sabre Airline Solutions calibration experts to ensure effective, full-operational adoption and incorporation of customer feed-back in the calibration process.
Primary responsibilities of airline users include: Internal and external data collection and
transmission to Sabre Airline Solutions; Attendance at meetings to discuss status,
progress and issues during the calibration process;
Receive and validate calibrated parameters as well as assist user teams with param-eter adoption.
Support For In-House CalibrationsSeveral airlines currently using Profit
Manager have chosen to invest in their own calibration processes and operations research teams. Sabre Airline Solutions supports these airlines in a variety of ways such as: Specialized customer care that address-
es system issues and questions related to data sources and processes,
Standardized health checks to review the end-to-end calibration process,
Training and refresher training for current and new users when enhancements to calibration modules are introduced,
Parameter updates for one or more sea-sons incorporating the latest methodolo-gies.
Unleashing The Potential Of Calibration
Consistent and accurate calibration is an integral part of the planning process, enabling airlines to produce robust, accu-rate schedule evaluations.
To help airlines effectively com-pete in the marketplace, Sabre Airline Solutions continually invests in operations research expertise and calibration-process
improvements and capabilities, such as Global Demand Data.
These investments create the foundation for decision-support systems that perform advanced network optimizations focused on improving airline schedules and unleashing the power of network planning. a
Gautam Pradhan is the manager of Sabre® AirVision™ Operations
Research for Sabre Airline Solutions. He may be contacted at
System Parameters Decisions arrived at using a “good” and a “bad” parameter set were evaluated using the “good” parameter set to measure the impact of having “bad” system parameters.
MREV�ZRUOGZLGH�DUH�VXSSRUWHG�E\�DYLD-WLRQ��2I�WKHVH�������PLOOLRQ�DUH�ZLWKLQ�the industry. The rest are through the LQGXVWU\·V�VXSSO\�FKDLQ�DQG�WRXULVP�made possible by aviation, according to ATAG.
of aviation emissions are from flights over ������NLORPHWHUV��DFFRUGLQJ�WR�$7$*�
56.6 million
80 percent
Countit up
Interesting facts and figures in the airline industry.
ASCEND I SOLUTIONS
ascend 73
Schedule
Schedule
Forecast
Forecast
Schedule
Schedule
Good Calibration
DecisionSupport
Good Calibration
Bad Calibration
Bad Calibration
DecisionSupport
Measuring The Revenue Impact Of Forecast Accuracy

A Proven Method For Airlines To Grow Their Contracted Corporate BusinessSeveral airlines rely on Sales Information Server (Sis) to grow their corporate segment, build a more effective and efficient sales team, and enhance their relationships with corporate customers. The no-risk solution reaps significant benefits for airlines around the world.
By Les Baker I Ascend Contributor
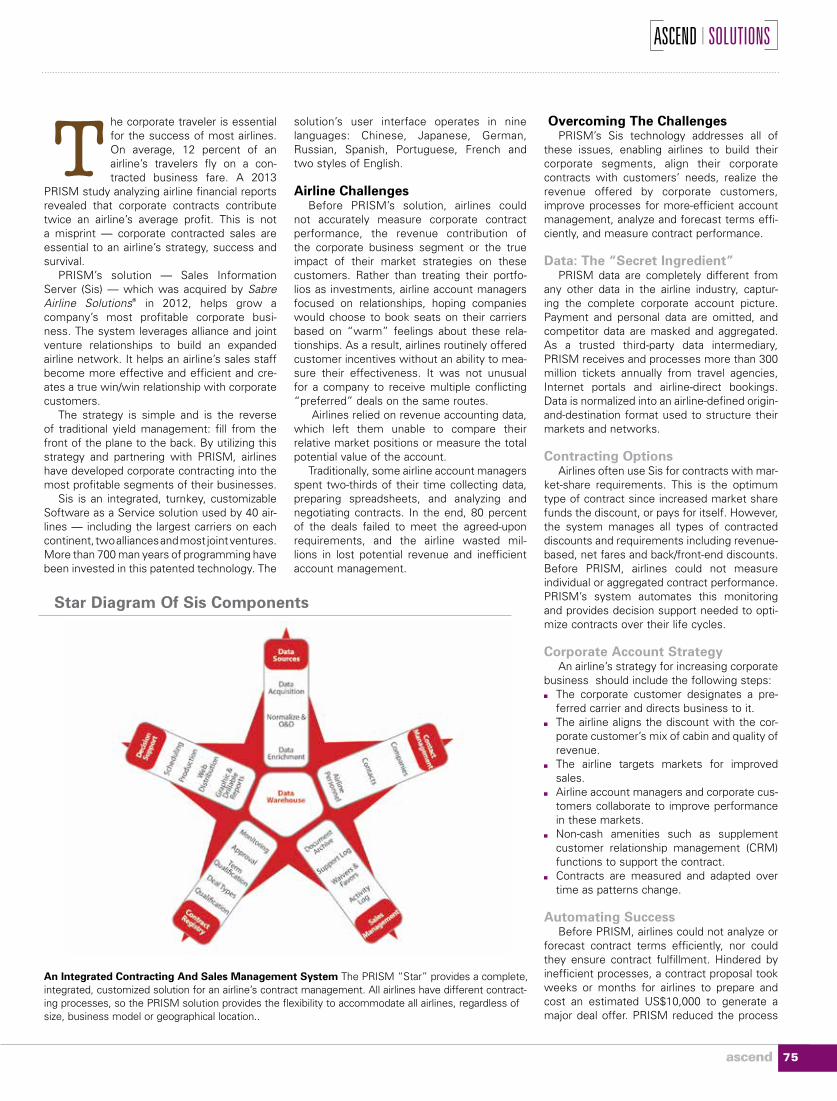
ascend 75
ASCEND I SOLUTIONS
he corporate traveler is essential for the success of most airlines. On average, 12 percent of an airline’s travelers fly on a con-tracted business fare. A 2013
PRISM study analyzing airline financial reports revealed that corporate contracts contribute twice an airline’s average profit. This is not a misprint — corporate contracted sales are essential to an airline’s strategy, success and survival.
PRISM’s solution — Sales Information Server (Sis) — which was acquired by Sabre Airline Solutions® in 2012, helps grow a company’s most profitable corporate busi-ness. The system leverages alliance and joint venture relationships to build an expanded airline network. It helps an airline’s sales staff become more effective and efficient and cre-ates a true win/win relationship with corporate customers.
The strategy is simple and is the reverse of traditional yield management: fill from the front of the plane to the back. By utilizing this strategy and partnering with PRISM, airlines have developed corporate contracting into the most profitable segments of their businesses.
Sis is an integrated, turnkey, customizable Software as a Service solution used by 40 air-lines — including the largest carriers on each continent, two alliances and most joint ventures. More than 700 man years of programming have been invested in this patented technology. The
solution’s user interface operates in nine languages: Chinese, Japanese, German, Russian, Spanish, Portuguese, French and two styles of English.
Airline ChallengesBefore PRISM’s solution, airlines could
not accurately measure corporate contract performance, the revenue contribution of the corporate business segment or the true impact of their market strategies on these customers. Rather than treating their portfo-lios as investments, airline account managers focused on relationships, hoping companies would choose to book seats on their carriers based on “warm” feelings about these rela-tionships. As a result, airlines routinely offered customer incentives without an ability to mea-sure their effectiveness. It was not unusual for a company to receive multiple conflicting “preferred” deals on the same routes.
Airlines relied on revenue accounting data, which left them unable to compare their relative market positions or measure the total potential value of the account.
Traditionally, some airline account managers spent two-thirds of their time collecting data, preparing spreadsheets, and analyzing and negotiating contracts. In the end, 80 percent of the deals failed to meet the agreed-upon requirements, and the airline wasted mil-lions in lost potential revenue and inefficient account management.
Overcoming The ChallengesPRISM’s Sis technology addresses all of
these issues, enabling airlines to build their corporate segments, align their corporate contracts with customers’ needs, realize the revenue offered by corporate customers, improve processes for more-efficient account management, analyze and forecast terms effi-ciently, and measure contract performance.
Data: The “Secret Ingredient”PRISM data are completely different from
any other data in the airline industry, captur-ing the complete corporate account picture. Payment and personal data are omitted, and competitor data are masked and aggregated. As a trusted third-party data intermediary, PRISM receives and processes more than 300 million tickets annually from travel agencies, Internet portals and airline-direct bookings. Data is normalized into an airline-defined origin-and-destination format used to structure their markets and networks.
Contracting OptionsAirlines often use Sis for contracts with mar-
ket-share requirements. This is the optimum type of contract since increased market share funds the discount, or pays for itself. However, the system manages all types of contracted discounts and requirements including revenue-based, net fares and back/front-end discounts. Before PRISM, airlines could not measure individual or aggregated contract performance. PRISM’s system automates this monitoring and provides decision support needed to opti-mize contracts over their life cycles.
Corporate Account StrategyAn airline’s strategy for increasing corporate
business should include the following steps: The corporate customer designates a pre-
ferred carrier and directs business to it. The airline aligns the discount with the cor-
porate customer’s mix of cabin and quality of revenue.
The airline targets markets for improved sales.
Airline account managers and corporate cus-tomers collaborate to improve performance in these markets.
Non-cash amenities such as supplement customer relationship management (CRM) functions to support the contract.
Contracts are measured and adapted over time as patterns change.
Automating SuccessBefore PRISM, airlines could not analyze or
forecast contract terms efficiently, nor could they ensure contract fulfillment. Hindered by inefficient processes, a contract proposal took weeks or months for airlines to prepare and cost an estimated US$10,000 to generate a major deal offer. PRISM reduced the process
T
An Integrated Contracting And Sales Management System The PRISM “Star” provides a complete, integrated, customized solution for an airline’s contract management. All airlines have different contract-ing processes, so the PRISM solution provides the flexibility to accommodate all airlines, regardless of size, business model or geographical location..
Star Diagram Of Sis Components

ascend 77
ASCEND I SOLUTIONS
across the internal airline teams that use the system, as well as the corporate customers and their travel agencies who will be guided through the business processes that Sis introduces.
Success StoriesSeveral airlines have leveraged Sis to
achieve significant results on their corpo-rate contracts, including: A U.S.-based airline went from an 89 per-
cent contract failure rate to an 83 percent success rate by using Sis performance data and training account managers.
The same airline saw corporate con-tracted revenue rise from 37 percent to 50 percent over three years.
Two carriers — one in Europe and the other in the United States — received ATI indemnification for a joint venture relationship. Joint contracts were estab-lished to provide a single document to a corporate customer, and revenue and profits from the business were shared by the two airlines.
For the first time, European corporate customers received monthly perfor-mance reports, which enabled airline account managers to meet with their top 100 accounts to develop strategies for improving performance. This resulted in US$100 million in additional revenue dur-
ing a three-year period from corporate-contracted business.
In the United States, by automating sales processes and eliminating the work of the account manager to obtain data, a carrier was able to triple the number of accounts assigned to each account manager.
An airline based in Asia developed a mid-size corporate account portfolio to comple-ment its global account strategy. Although these companies produced only 10 percent of the volume compared to that of a global account, the portfolio of these accounts grew to exceed that of the global accounts. This was due to the strong commitment the mid-size corporate customers made to direct business to the preferred carrier.
An incentive system was designed to reward account-manager performance for increasing business. The same carrier “load balanced” accounts to work was distributed equitably.
One airline established a simple discount program for customers that provided data. While any company could qualify, many companies were small- or medium-sized companies that had never had access to a discount program before. Those showing the ability to direct business received addi-tional performance-based discounts. The airline doubled its overall contracted compa-nies.
Fare filing template reports were prepared so input could be formatted more quickly. This process reduced the implementation time so corporate customers could have access to their discounts more quickly after the contract was signed.
An airline analyzed its corporate portfolio to determine routes where it was not flying. Using this consolidated information, addi-tional flights were added to new destina-tions with a mini-hub established.
Why This WorksAirline corporate contacts are foundational
to an airline’s profit and success. The ability to measure, incent and service corporate busi-ness leads to greater profits. As a result, an airline can improve yield and revenue, and sales staff can focus on direct customer activi-ties rather than administrative tasks. Sis is self-funding and risk free, and it can be used in many creative ways to help airlines grow their corporate segment. a
Les Baker is vice president of PRISM for Sabre Airline Solutions®. He can be
contacted at [email protected].
to days and, in some cases, hours using integration and automation. There are sev-eral best-practice steps for automating a deal process:
1. An airline identifies a prospective corporate customer and approaches it regarding a deal. A data release authorization is issued to request three to six months of historical
company data to analyze and forecast the proposal.
2. Once data are obtained, the airline’s sales analysis team prepares and analyzes the pro-posal. Close attention is focused on cabin, market requirements and the ability of the corporation to direct business to the carrier. The optimal customer is a premium-cabin international company that can direct busi-ness to the preferred carrier.
3. The airline prepares and presents the cus-tomer proposal. Although airlines have somewhat different contracting practices, most contracts focus on bundling markets into contract terms based on market char-acteristics, such as hub, hub-to-spoke and spoke-to-spoke, and performance expecta-tions. Airlines and corporate customers both desire realistic performance requirements.
4. As the airline and corporate customer negotiate the proposal, some terms may be adjusted. Once the proposal has been agreed upon, a contract is generated by the system for electronic approval. Fare filing reports are used internally to help speed the implementation process. Documents are archived in the system, and notes are made in the CRM component so history is preserved.
5. A prospect has become a customer. Monthly performance reports are sent automati-cally to the corporate customer and airline account manager. The account manager and customer review the information on a scheduled basis to optimize performance. If terms become unfavorable, they can be adjusted quickly.
Project ManagementAn airline’s Sis project manager has a
crucial role in ensuring the successful imple-mentation of the solution within the airline. The project manager guides the gathering and quality assurance of key data elements used to populate Sis with the airline’s corpo-rate customers and customer contacts, as well as the corresponding airline staff mem-ber assigned to each customer. The project manager also researches and confirms key customization components of the airline’s Sis application, ensuring that it is uniquely suited to how the airline conducts business and deals with its customers.
These components include online air-ports, network hubs, geographic entities, connection parameters used to construct true O&D and fare-class-to-cabin transla-tions. Following the development and setup of the airline’s Sis environment, the proj-ect manager works closely with PRISM’s implementation team to coordinate the airline’s data acquisition processes, user-support functions, new user training and industry preparation. This work contributes to a streamlined and effective rollout of Sis
Understanding Corporate Clients Before PRISM, an airline could not understand how its corporate account portfolio was preforming. Key is other airline data, which is masked and aggregated. Data is non-personal/financial so ATI and data privacy safeguards are ensured.
Worldwide Data Virtually every major company on earth provides data to PRISM on behalf of its corporate deal. Data comes in many formats and is audited and normalized using PRISM’s patented processes.
ascend76
ASCEND I SOLUTIONS
Criteria Agency Card MIDT Airline PRISM
Provide All Carriers and Suppliers
Identify Corporate Customer
Reconcile Net Segment Count
Provide Rich Segment Data
Companies 8,323
163
1,763
370
Ticketing countries
Ticketing sources
Unique data formats
PRISM Statistics
We’re Making More Room For Our Business Travelers
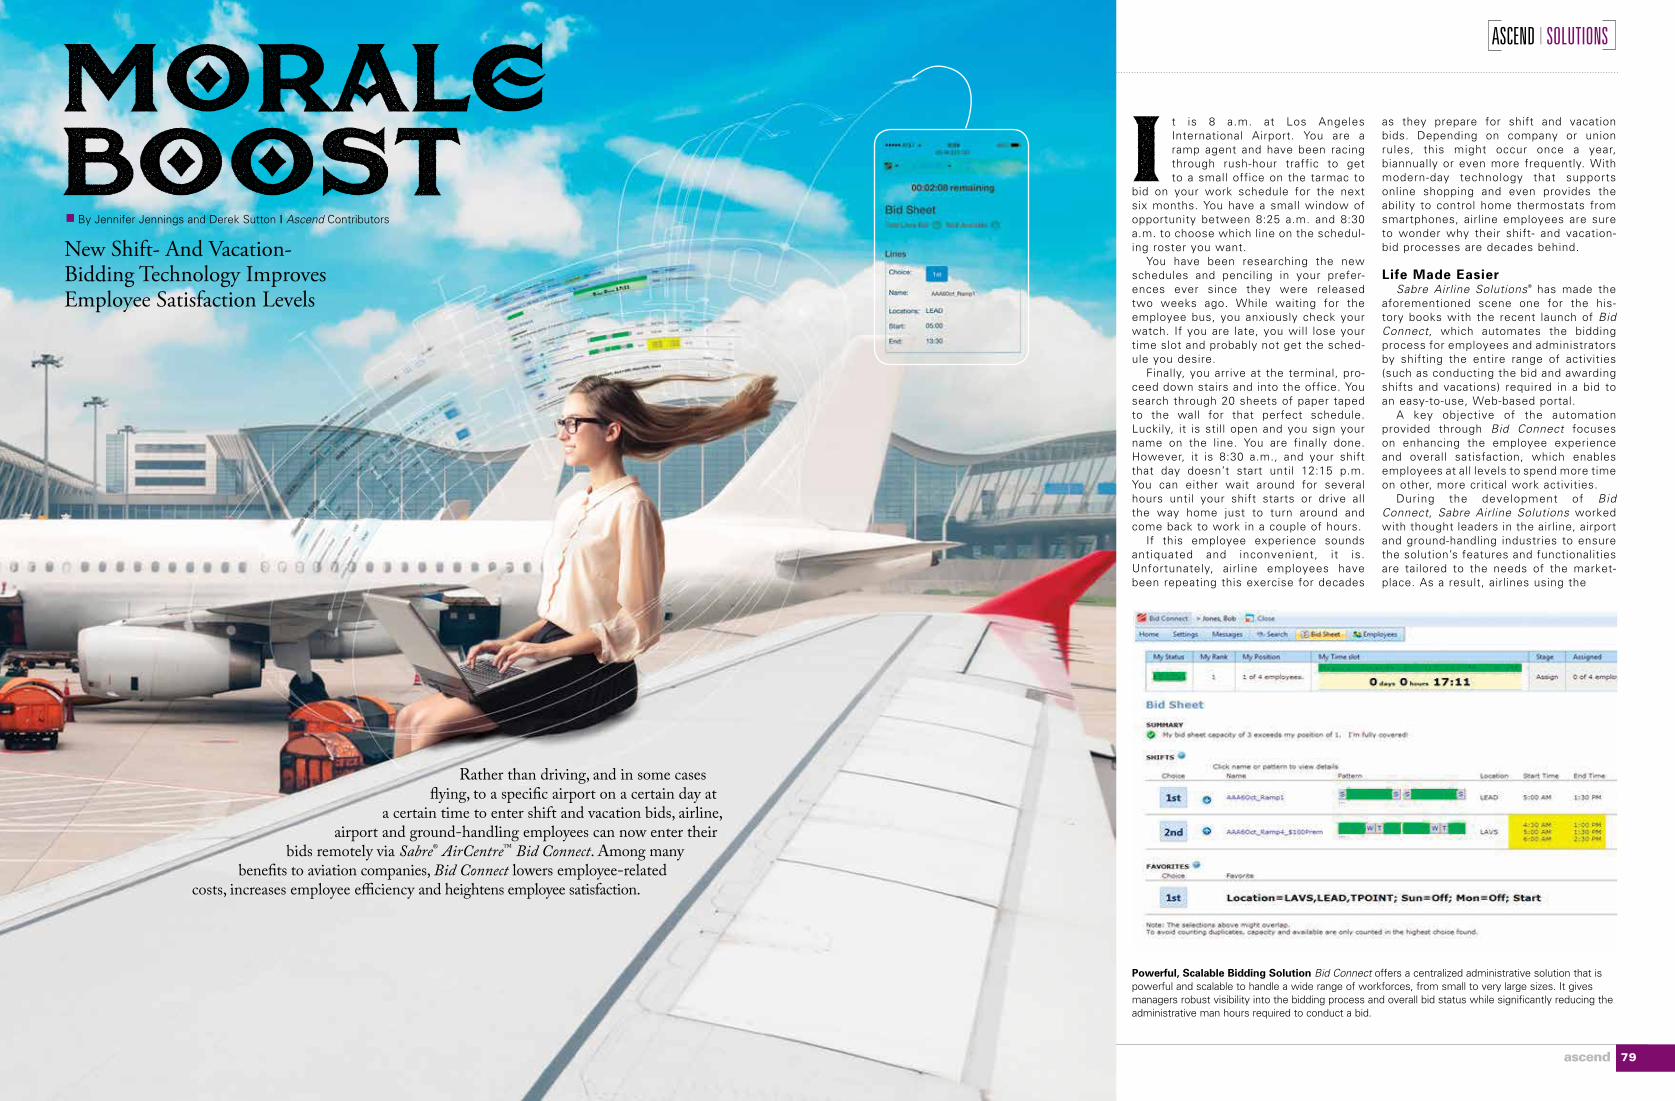
ascend 79
ASCEND I SOLUTIONS
MOrale BOOst
t is 8 a.m. at Los Angeles International Airport. You are a ramp agent and have been racing through rush-hour traffic to get to a small office on the tarmac to
bid on your work schedule for the next six months. You have a small window of opportunity between 8:25 a.m. and 8:30 a.m. to choose which line on the schedul-ing roster you want.
You have been researching the new schedules and penciling in your prefer-ences ever since they were released two weeks ago. While waiting for the employee bus, you anxiously check your watch. If you are late, you will lose your time slot and probably not get the sched-ule you desire.
Finally, you arrive at the terminal, pro-ceed down stairs and into the office. You search through 20 sheets of paper taped to the wall for that perfect schedule. Luckily, it is still open and you sign your name on the line. You are finally done. However, it is 8:30 a.m., and your shift that day doesn’t start until 12:15 p.m. You can either wait around for several hours until your shift starts or drive all the way home just to turn around and come back to work in a couple of hours.
If this employee experience sounds antiquated and inconvenient, it is. Unfortunately, airline employees have been repeating this exercise for decades
as they prepare for shift and vacation bids. Depending on company or union rules, this might occur once a year, biannually or even more frequently. With modern-day technology that supports online shopping and even provides the ability to control home thermostats from smartphones, airline employees are sure to wonder why their shift- and vacation-bid processes are decades behind.
Life Made EasierSabre Airline Solutions® has made the
aforementioned scene one for the his-tory books with the recent launch of Bid Connect, which automates the bidding process for employees and administrators by shifting the entire range of activities (such as conducting the bid and awarding shifts and vacations) required in a bid to an easy-to-use, Web-based portal.
A key objective of the automation provided through Bid Connect focuses on enhancing the employee experience and overall satisfaction, which enables employees at all levels to spend more time on other, more critical work activities.
During the development of Bid Connect, Sabre Airline Solutions worked with thought leaders in the airline, airport and ground-handling industries to ensure the solution’s features and functionalities are tailored to the needs of the market-place. As a result, airlines using the
INew Shift- And Vacation-Bidding Technology Improves Employee Satisfaction Levels
Rather than driving, and in some cases !ying, to a speci"c airport on a certain day at
a certain time to enter shift and vacation bids, airline, airport and ground-handling employees can now enter their
bids remotely via Sabre® AirCentre™ Bid Connect. Among many bene"ts to aviation companies, Bid Connect lowers employee-related
costs, increases employee e#ciency and heightens employee satisfaction.
By Jennifer Jennings and Derek Sutton I Ascend Contributors
Powerful, Scalable Bidding Solution Bid Connect offers a centralized administrative solution that is powerful and scalable to handle a wide range of workforces, from small to very large sizes. It gives managers robust visibility into the bidding process and overall bid status while significantly reducing the administrative man hours required to conduct a bid.

new technology can expect to achieve maxi-mum return on investment through streamlined bid processing, improved employee satisfac-tion, and reduction of errors and fines related to manual bid administration.
Bid Connect is the only online solution available to the travel industry that pro-vides a truly configurable, user-controlled platform for setting bidding policies, man-aging the bid process and empowering employees to better manage their bid actions. Users have access anytime and anywhere to a continuous, real-time solu-tion. The ability to bid on schedules is one of the most important benefits for employees, so ensuring the process is fair and accurate is crucial.
Inconsistent bidding policies cause confusion, lead to inequities and impact morale. Users of Bid Connect have a configurable application that aligns to the unique policies in place at their compa-nies. The solution’s employee-bid portal provides a gateway to a complete view of the employee’s leave and shift options, bids, and awards. Moreover, managers have access to the complete history of the development, execution and award of each bid, while employees can view attributes of the award process as permitted by their companies.
How Bid Connect WorksSome unique characteristics of the sys-
tem include: The ability to see one’s selections in
terms of the number of positions or vaca-tion slots available within a particular roster line or block of vacation weeks,
Search mechanisms to find what other employees are bidding on,
A comprehensive filtering tool that facili-tates submission of bids based on saved employee preferences. By providing employees with schedule
choices and allowing the system to assign shifts in accordance with seniority or other ranking rules, Bid Connect removes any potentially questionable scheduling practic-es while bringing consistency, transparency and fairness into the shift- and vacation-assignment process.
For administrators, Bid Connect provides the bid manager with full control over the configuration of the shift and vacation bids to support local policy, seniority or other award rules; vacation thresholds; vacation-day balances; employee labor pools; bidding windows; and more. It can be utilized as a stand-alone solution through Web ser-vices; however, for existing users of Sabre® AirCentre™ Airport, it can be integrated with Sabre® AirCentre™ Staff Admin.
Published rosters can be extracted from Staff Admin to active bids in Bid Connect,
while employee information and criteria key for the bidding processes are con-tinually updated. After the bidding process has concluded, rosters will be exported to Staff Admin, complete with employee names attached to rosters and vacation days listed. At this point, an airline has a complete, assigned roster.
Managing the schedule of employees on a daily basis is one of the most critical tasks for airlines. Therefore, the market demand for an automated bidding sys-tem is significant. Bid Connect closes the resource-planning loop and helps lower employee-related costs, improve employ-ee efficiency and increase employee satisfaction.
More Benefits To Come Following the initial release of Bid
Connect, Sabre Airline Solutions will also invest in advanced solution features such as: Access through a dedicated, responsive
mobile website designed for a variety of smartphones and tablet devices,
Platforms for deployment in multiple lan-guages,
Email notifications and alerts. The automation provided through Bid Connect is an essential step for airlines, airports and ground handlers in their efforts to reduce manual, intensive processes while improving employee morale. a
Jennifer Jennings and Derek Sutton are solution managers for Sabre
Airline Solutions. They can be contacted at jennifer.jennings@sabre.
com and [email protected].
ascend80
ASCEND I SOLUTIONS
Flexible And Convenient Bid Connect can be accessed through a dedicated, responsive mobile website designed for an array of smartphones and tablet devices. This adds additional flexibility and convenience to the bidding process for airline, airport and ground handler employees.
Designed For Mobile Devices

T a k i n g y o u r a i r l i n e t o n e w h e i g h t s
2014 Issue No. 2 Editor in ChiefStephani Hawkins
Art Direction/DesignCharles Urich
Associate Editor Lauren Lovelady
Contributors
Tyler Anglim, Angela Berry, Fadi Fahes, Katie Freeman, Tyra Jordan, Dana Knight, Yusuf Mauladad, Lindsay Millward, Darren Rickey, Sergey Shebalov, Simone Silveira, Nancy St. Pierre, Lena von Peltzer, George Wrigley
PublisherSabre Airline Solutions® www.sabreairlinesolutions.comAwards
APEX Awards for Publication Excellence: 2013, 2012, 2011, 2009, 2008, 2007, 2006, 2005, 2004 ECO Awards For Excellence In Environmental Communications: 2009Hermes Creative Awards: 2013, 2012, 2011, 2010, 2009, 2008 International Association of Business Communicators Bronze Quill: 2011, 2009, 2008, 2007, 2006, 2005, 2004International Association of Business Communicators Gold Quill: 2006, 2005 International Association of Business Communicators Silver Quill: 2008, 2006, 2005, 2004
Magnum Opus Awards: 2011
MarCom Platinum Award: 2013, 2010
The Communicator Award: 2013, 2012, 2011, 2010, 2008
makingcontact
Asia Pacific Theo Panagiotoulias Vice President & General Manager Phone: +65 6215 9521 Email: [email protected]
Europe, Middle East and Africa Jeremy Sykes Head of Sales Phone: +44 (0)208 538 8637 E-mail: [email protected].
The Americas Mike Douglass Vice President & General Manager Phone: +1 682 605 5349 E-mail: [email protected]
Sabre Airline Solutions, the Sabre Airline Solutions logo and products noted in italics in this publication are trademarks and/or service marks of an affiliate of Sabre Inc. All other trade-marks, service marks and trade names are the property of their respective owners. ©2013 Sabre Inc. All rights reserved. Printed in the USA.
Address Corrections And Reader InquiriesIf you have questions about this publication, suggested topics for future articles or would like to change your address, please send an email to [email protected].
To read the current issue of Ascend and past issues in digital format using your personal computer, tablet or smartphone, visit our website at www.ascendforairlines.com.
For more information about products and services featured in this issue of Ascend, please visit our website at www.sabreairlinesolutions.com or contact one of the following Sabre Airline Solutions regional representatives:
Sab
re A
irlin
e S
olut
ions
and
the
Sab
re A
irlin
e S
olut
ions
logo
are
tra
dem
arks
and
/ or
ser
vice
mar
ks o
f an
affi
liate
of
Sab
re In
c. ©
2014
All
right
s re
serv
ed.
AS
-14-
1200
54
Freedom ToMarketThe Way You Want
sabreairlinesolutions.com/Ascend
Set Your Business Free
With the industry’s broadest portfolio
of solutions, we give you the freedom to
better market, sell, serve and operate
the way you want. Partner with us and
benefit from the expertise and flexible
solutions you need to land your success.