AIRCRAFT DEPARTURE CONTROL SYSTEMS – HIDDEN ...
14
AIRCRAFT DEPARTURE CONTROL SYSTEMS – HIDDEN SAFETY RISKS Ivan Jakovljević 1 , Olja Čokorilo 2 , Gianluca Dell’Acqua 3 , Petar Mirosavljević 4 1,2,4 University of Belgrade, Faculty of Transport and Traffic Engineering, Vojvode Stepe 305, 11000 Belgrade, Serbia 3 University of Napoli “Federico II”, Via Claudio 21, I-80125 Naples, Italy Received 12 January 2017; accepted 10 July 2017 Abstract: The aviation industry subjects to be comparable with other human-technology industries where risks are always present within their system. Modern appliances, including regulation, training and technology act as superior defense system. This being the case, the paper provides an integrated theoretical and practical reflections and knowledge of planning of safety risks within the framework of safety culture that are based on typical sets of hazardous situations that may affect the aircraft operations, with the main focus on Departure Control Systems (DCS) usage. Departure Control System (DCS) provides various functions and automated key processes in pre-flight preparation. These functions can be integrated or separated between various DCS usages. From system errors, data entry to different day-to- day operations, these risks were evaluated and analyzed in over five hundred flights. The research unveiled several risks with both visible and hidden consequences related to DCS usage, distinctively affecting aircraft mass and balance. Accident probability was measured and analyzed scrupulously for each airline separately, as a combination of implicit hidden and visible risk occurrence. The risk and accident occurrence ranking was done by Fussell-Vesely importance measures (FV) and Risk Reduction Worth (RRW). The issues were defined and prioritized, thus representing the first step to risk mitigation. Keywords: safety, aviation, risk assessment, safety culture, risk management. 1 Corresponding author: [email protected] DOI: http://dx.doi.org/10.7708/ijtte.2017.7(3).02 UDC: 629.7.08 1. Introduction and Literature Review From the start point of aviation safety science as far as nowadays, experts worldwide are developing techniques and theory concerning aviation safety. In the past one hundred years there have been significant discoveries in comprehension of risks and values of aircraft operations in different contexts, but systemic factors that contribute to incidents and accidents seem to persist in the global aviation system. If we consider the investigation techniques from the late 1950s, which nowadays are regarded as “investigations for funeral purposes”, today experts are more close to proactive and predictive way to determine and understand the process, which brings safety culture as one of the most important comprehensions when one tries to provide, for example, a hazard identification, risk assessment, risk mitigation or cost-benefit assessment within the ALARP principle, etc. Aspects of safety culture are found in the shared attitudes of care and concern throughout the organization (Pidgeon and O’Leary, 1995) and in the visible commitment of senior management to safety (Droste, 1997). It is 298 Jakovljević I. et al. Aircraft Departure Control Systems – Hidden Safety Risks
-
Upload
khangminh22 -
Category
Documents
-
view
2 -
download
0
Transcript of AIRCRAFT DEPARTURE CONTROL SYSTEMS – HIDDEN ...

AIRCRAFT DEPARTURE CONTROL SYSTEMS – HIDDEN SAFETY RISKS
Ivan Jakovljević1, Olja Čokorilo2, Gianluca Dell’Acqua3, Petar Mirosavljević4
1,2,4 University of Belgrade, Faculty of Transport and Traffic Engineering, Vojvode Stepe 305, 11000 Belgrade, Serbia3 University of Napoli “Federico II”, Via Claudio 21, I-80125 Naples, Italy
Received 12 January 2017; accepted 10 July 2017
Abstract: The aviation industry subjects to be comparable with other human-technology industries where risks are always present within their system. Modern appliances, including regulation, training and technology act as superior defense system. This being the case, the paper provides an integrated theoretical and practical reflections and knowledge of planning of safety risks within the framework of safety culture that are based on typical sets of hazardous situations that may affect the aircraft operations, with the main focus on Departure Control Systems (DCS) usage. Departure Control System (DCS) provides various functions and automated key processes in pre-flight preparation. These functions can be integrated or separated between various DCS usages. From system errors, data entry to different day-to-day operations, these risks were evaluated and analyzed in over five hundred flights. The research unveiled several risks with both visible and hidden consequences related to DCS usage, distinctively affecting aircraft mass and balance. Accident probability was measured and analyzed scrupulously for each airline separately, as a combination of implicit hidden and visible risk occurrence. The risk and accident occurrence ranking was done by Fussell-Vesely importance measures (FV) and Risk Reduction Worth (RRW). The issues were defined and prioritized, thus representing the first step to risk mitigation.
Keywords: safety, aviation, risk assessment, safety culture, risk management.
1 Corresponding author: [email protected]
DOI: http://dx.doi.org/10.7708/ijtte.2017.7(3).02UDC: 629.7.08
1. Introduction and Literature Review
From the start point of aviation safety science as far as nowadays, experts worldwide are developing techniques and theory concerning aviation safety. In the past one hundred years there have been significant discoveries in comprehension of risks and values of aircraft operations in different contexts, but systemic factors that contribute to incidents and accidents seem to persist in the global aviation system. If we consider the investigation techniques from the late 1950s, which nowadays are regarded as
“investigations for funeral purposes”, today experts are more close to proactive and predictive way to determine and understand the process, which brings safety culture as one of the most important comprehensions when one tries to provide, for example, a hazard identif ication, risk assessment, risk mitigation or cost-benefit assessment within the ALARP principle, etc. Aspects of safety culture are found in the shared attitudes of care and concern throughout the organization (Pidgeon and O’Leary, 1995) and in the visible commitment of senior management to safety (Droste, 1997). It is
298
Jakovljević I. et al. Aircraft Departure Control Systems – Hidden Safety Risks

also located in an atmosphere that thrives on sharing vital information—‘informed culture’, where employees are prepared to report their errors and near-misses—‘reporting culture’, and have the trust that they will be treated fairly—‘just culture’ (Reason, 1998).
Some papers provide the literature review on sa fet y cu lture and sa fet y cl imate (Guldenmund, 2000; Gill and Shergill, 2004; Cooper, 2000; Wiegmann et al . , 2004). Furthermore, there is an overall lack of models specifying either the relationship of both concepts with safety and r isk management or with safety performance. Moreover, there is an overall lack of models specifying either the relationship of both concepts with safety and risk management or with safety performance. This paper provides theoretical and practical knowledge of modeling safety risks in the framework of safety culture based on typical set of hazards and risks affecting the aircraft operations, based on Departure Control Systems (DCS) usage. The relationship between safety management systems, and safety culture has been discussed extensively in the safety literature of high-tech and high-risk endeavors including aviation (Turner et al., 1989; Darbra et al., 2007; Ancel, 2015; etc.). The literature recognizes a variety of definitions on safety culture:
• Safety cultures ref lect the attitudes, beliefs, perceptions, and values that employees share in relation to safety (Cox and Cox, 1991).
• Safety culture is that assembly of c ha rac ter i s t ic s a nd at t it udes i n organizations and individuals which establ ishes that, as an overr iding priority, nuclear plant safety issues receive the attention warranted by
their significance (International Safety Advisory Group, 1991).
• The set of beliefs, norms, attitudes, roles, and social and technical practices that are concerned with minimizing the exposure of employees, managers, customers and members of the public to conditions considered dangerous or injurious (Pidgeon, 1991).
• The concept that the organization’s beliefs and attitudes, manifested in actions, policies, and procedures, affect its safety performance (Ostrom et al., 1993).
• In a total safety culture (TSC), everyone feels responsible for safety and pursues it on a daily basis (Geller, 1994).
• The collective mental programming towards safety of a group of organization members (Berends, 1996).
• The safety culture of an organization is t he product of ind iv idua l a nd group values, attitudes, perceptions, competencies, and patterns of behavior t hat deter m i ne t he com m it ment to, and the style and proficiency of, and organization’s health and safety management (Lee, 1996).
Building a safety culture requires deep understanding of human errors (Čokorilo, 2013). They are essentially identified as the cause of aircraft accidents (cca 70%), which led to increased automation of processes in aviation (ICAO, 1998). However, automation doesn’t always provide better safety, and it is not error-proof. A number of accidents caused by an autopilot were either result of a wrong instrument reading or software issue (Neumann, 2016). In a way, DCSs are evolving into fully automated systems for flight preparation, similar to autopilot. They were introduced as a way of cost reduction and safety growth by connecting check-in functions with load control and aircraft mass and balance.
299
International Journal for Traffic and Transport Engineering, 2017, 7(3): 298 - 311

Risks assessment is a key to safe use of DCSs, and number of authors used different methods to measure and control safety risks:
• (Distefano et al ., 2014) defined risk assessment as a basis for the Safety Management System (SMS) and a tool for decision making. The sole purpose of SMS is to prevent the accidents, by quantifying, verifying and managing safety risks (ICAO, 2 0 09). I n t hei r resea rch, authors analyzed accidents at airports by dividing them in different groups by causes (environmental conditions, runway conditions, aircraft performance characteristics, human factor).
• (Chang et al ., 2015) used two stage processes to evaluate SMS operations at three Taiwan airports according to safety r isk management, safety policy and objectives. They acquired weight and rankings for each of the SMS components and elements, and used TOPSIS method for rank ing the airports. Results provided by this research indicate areas in which the SMS must be improved, mostly by training the staff involved in implementation.
• (Oriola et al., 2014) analyzed runway accidents hazards by measuring the causes of accidents and conditions under which the accident occurred. They used the probability for each cause as a basis for fault tree diagram. Also, the risk importance is measured and ranked using the Fussell-Vesly importance measures and Risk Reduction Worth. Work ing condit ion of a irl ine and airport is defined as the critical area and mitigation is proposed.
• (Bröer, 2007) analyzed some specific aspects of risks in aviation regarding health protection affected by aircraft noise; etc.
Finally, discussing the human errors in aviation, we can look at one of the many strategies employed to reduce human error. A leading author in this area is Professor James Reason (Reason et al., 2006). He designed a system cal led “Defense in Depth” or the “Swiss cheese model” which is intended to eliminate errors within complex organizations or processes. Figure 1 provides a list of possible causes of errors during a load control and aircraft mass and balance procedure which could be observed as a slice of Swiss cheese which is full of holes. In order to avoid an error cause, (such as aircraft overweight) appropriate procedures should be built into a system at all stages, that no single error, or hole should be catastrophic. Figure 1 shows how each of the error causes could be matched by control measures. However, if several defenses are breached, or ignored, such as when wrong average mass is used for calculation or database error occurs, then enough of holes in the cheese may line up and a catastrophe may follow.
A wel l designed system or procedure should mean that er rors are spotted and therefore it is of high importance to understand the complexity of process that represents Departure Control System (DCS). Moreover, both hidden and visible risks are important components of the system and implementation of risk management is crucial for risk control and mitigation. Therefore the paper is focused on the whole process and usage of DCSs, described below.
2. Defining the Safety Risks in Aviation
Understanding the risks and reducing the number of (potential) accidents by more than 80% is possible by implemented Swiss cheese model (Hudson, 2014). Therefore, there is a need to understand root causes
300
Jakovljević I. et al. Aircraft Departure Control Systems – Hidden Safety Risks

of a potentia l damage, to predict the likelihood and severity and to measure the risks and implement adequate risk mitigation strategies or control measures (Wagner and Barker, 2014). Nowadays, different methods and tools are used in safety analysis: statistical analysis, trend analysis, normative comparisons, simulation and testing, expert panel, cost-benefit analysis (Čokorilo et al., 2014; Ericson, 2016).
W hen analyzing the threats and causes in the automated system such as DCS, it is difficult to separate human and system error. Use errors like entering the wrong figures in wrong f light at the wrong station can be easily contributed to human error (ICAO 1998), but the question arises when correct data is entered and the system gives the incorrect calculation due to bad programming, or outdated performance indicators of an aircraft. These errors can be contributed to system or to human fully –
considering that the system always performs in the way it was programmed. Use errors are spotted easily, defined and recorded, but the system errors present the most challenging issue for the safety management (Neumann, 2016). Two major risk categories are introduced:
1. Visible risks –that require immediate action and are usually identified at the moment of occurrence.
2. Hidden risks – that require detailed analysis and r isk assessment, and can remain unidentified after a long time period and a high number of occurrences.
Severity and probability of the certain risk are further analyzed for each risk individually in the following chapters. Root cause analysis (Duphily et al., 2014) leading to these risks is shown in the Fishbone Diagrams (also known as The Cause and Effect Diagram).
Fig. 1. Root Causes of Visible and Hidden Risks Presented via Fishbone Diagrams
301
International Journal for Traffic and Transport Engineering, 2017, 7(3): 298 - 311

All the events represented in the Fishbone diagrams have a certain probability of occurrence, severity and effect difference, and need to be quantified in a number of ways in order to point out the most immediate one. Decreasing causes and effects of a particular event can lead to a critical risk, and the connection seemingly doesn’t exist, or is barely prominent until it is presented in the Fishbone diagram. A combination of methods is required to point out the immediate threat, quantify and measure existing ones, and stop any future risks from happening – the Fishbone diagram is only a part of these methods. Risk matrix is a useful tool when defining the risk categories and it provides a certain selection of risks which require
most immediate action (ICAO, 2009). When evaluating weaknesses and strengths of risk matrices, it can be concluded that they can be a valuable tool for identifying the critical risks (Dujim, 2015). Severity of each particular risk will be measured by using the risk classification scheme as shown in table 1. This matrix is integrated part of the Safety Management Manual which has been created by a team of professionals from within the EHEST SMM, whose experience covers a variety of different backgrounds including EASA, National Aviation Authorities, manufacturers, operators, hel icopter associations, operator and pilot associations, etc. and it is in accordance with (EHEST, 2013; ICAO, 2013).
Table 1 Risk Severity and Likelihood of Occurrence
Consequences or severity of the incidentLikelihood of occurrence Critical - A High - B Medium - C Low - D
Almost certain – 1(80-100%) 1A 1B 1C 1D
Likely – 2(60-80%) 2A 2B 2C 2D
Possible – 3(40-60%) 3A 3B 3C 3D
Unlikely – 4(20-40%) 4A 4B 4C 4D
Rare – 5(0-20%) 5A 5B 5C 5D
Risks presented in Table 1 will be divided into next categories:
• Very high risk: 1A, 1B, 2A;• High risk: 1C, 2B, 3A;• Moderate risk: 2C, 3C, 3B, 4A, 5A;• Low risk: 1D, 2D, 3D, 4B, 4C, 5B;• Very low risk: 4D, 5D, 5C.
Hidden risks will be more analyzed in detail considering that they are rarely noticed and can have major consequences.
2.1. Visible Safety Risks
In this research, data from two widely used DCSs was measured and they were denoted as A and B. Probability that visible safety problems occurred – like aircraft out of balance or overweight is shown in table 2. These problems are defined as visible considering that the DCS will automatically show message of safety occurrence and block the user from further advancement until the issue is resolved. A third DCS had only check-in function, and
302
Jakovljević I. et al. Aircraft Departure Control Systems – Hidden Safety Risks

it was referred to as DCS C. Mass and balance done by combination of two the DCSs (B and C) is marked as DCS BC. Safety issues were also documented (aircraft out of balance or overweight - ni) and divided by total number of flights (mi) per DCS as shown in eq. 1:
i
i
mn
=iP (1)
Data was gathered from 543 f lights. Nine airlines were observed, four were low-cost
carriers. Destinations from/to which these airlines fly are Europe, Africa, North America and Central America. The f leet was mostly consisted of Airbus A319/320/321/330 aircraft; also there were A350, B737, B747, B757, Q400, and RJ85. Payload was ranging from passengers with low number of hold baggage (low-cost carriers) to high number of baggage, also cargo, mail, live animals and dangerous goods were included. Three out of nine airlines which were being observed used DCS A and four used DCS B, only two used the combination of DCS BC.
Table 2 Probability That Visible Safety Issue Will Occur
DCS A B BC
Pi 4% 3% 20%
Source: Centralized Load Control Database
Results show that the probability of mass and balance risk increases when the check-in and load control are separated via two DCSs. The reason for this occurrence is that when making the Loading Instruction Report (LIR), load control agent can’t predict the seating of the passengers, and if they are not evenly distributed, aircraft will most likely be out of trim. However, if the seating is even, and predicted number of passenger increases, it is also likely that the aircraft will be overweight.
When calculating the probability that visible risk (Pv) in DCS is going to happen, equation (2) is used:
(2)
Ranking of risk importance was done using Fussell-Vesley (FV) and risk reduction worth (RRW) as shown in table 3.
Table 3 Ranking of Visible Risks by Importance
Visible risk occurrence in DCS FV=Pi/Pv RRW=1-1/FV
DCS BC 74 0,99
DCS A 11 0,91
DCS B 11 0,91
303
International Journal for Traffic and Transport Engineering, 2017, 7(3): 298 - 311
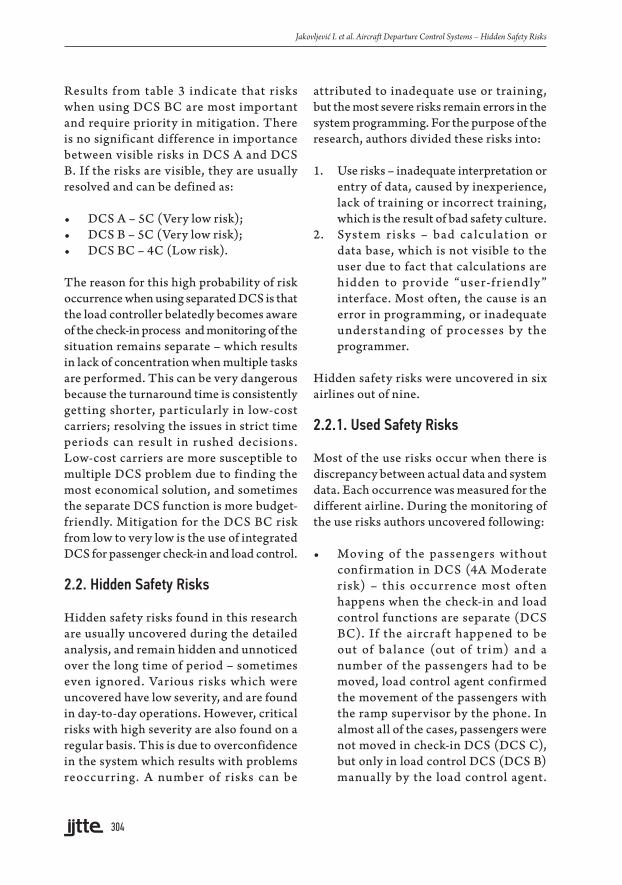
Results from table 3 indicate that risks when using DCS BC are most important and require priority in mitigation. There is no significant difference in importance between visible risks in DCS A and DCS B. If the risks are visible, they are usually resolved and can be defined as:
• DCS A – 5C (Very low risk);• DCS B – 5C (Very low risk);• DCS BC – 4C (Low risk).
The reason for this high probability of risk occurrence when using separated DCS is that the load controller belatedly becomes aware of the check-in process and monitoring of the situation remains separate – which results in lack of concentration when multiple tasks are performed. This can be very dangerous because the turnaround time is consistently getting shorter, particularly in low-cost carriers; resolving the issues in strict time periods can result in rushed decisions. Low-cost carriers are more susceptible to multiple DCS problem due to finding the most economical solution, and sometimes the separate DCS function is more budget-friendly. Mitigation for the DCS BC risk from low to very low is the use of integrated DCS for passenger check-in and load control.
2.2. Hidden Safety Risks
Hidden safety risks found in this research are usually uncovered during the detailed analysis, and remain hidden and unnoticed over the long time of period – sometimes even ignored. Various risks which were uncovered have low severity, and are found in day-to-day operations. However, critical risks with high severity are also found on a regular basis. This is due to overconfidence in the system which results with problems reoccurring. A number of risks can be
attributed to inadequate use or training, but the most severe risks remain errors in the system programming. For the purpose of the research, authors divided these risks into:
1. Use risks – inadequate interpretation or entry of data, caused by inexperience, lack of training or incorrect training, which is the result of bad safety culture.
2. System r isks – bad calculat ion or data base, which is not visible to the user due to fact that calculations are hidden to provide “user-fr iendly” interface. Most often, the cause is an error in programming, or inadequate understanding of processes by the programmer.
Hidden safety risks were uncovered in six airlines out of nine.
2.2.1. Used Safety Risks
Most of the use risks occur when there is discrepancy between actual data and system data. Each occurrence was measured for the different airline. During the monitoring of the use risks authors uncovered following:
• Moving of the passengers without confirmation in DCS (4A Moderate risk) – this occurrence most often happens when the check-in and load control functions are separate (DCS BC). If the aircraft happened to be out of balance (out of tr im) and a number of the passengers had to be moved, load control agent confirmed the movement of the passengers with the ramp supervisor by the phone. In almost all of the cases, passengers were not moved in check-in DCS (DCS C), but only in load control DCS (DCS B) manually by the load control agent.
304
Jakovljević I. et al. Aircraft Departure Control Systems – Hidden Safety Risks

Actual seating is never confirmed by the written message or the DCS from the ramp supervisor, and this leaves the possibility of aircraft taking off out of operational and even constructional limits for the balance. One safety issue occurred when the ramp supervisor moved the passengers in the opposite zones then instructed, and the aircraft took off out of operational limits.
• Manual off loading of the baggage in DCS (5C Very low risk) – when the aircraf t is over weight at Zero Fuel Mass (ZFM) off loading of the baggage is usually the solution. There were multiple situations when the load control agent reported and confirmed with the ramp supervisor the offloading, but on the movement load message (containing information about number of bags, passengers, etc.) there was a difference in the total number of bags. In these situations load control agent removes the baggage manually, but when the baggage is removed in the DCS by the check-in, the problem is mitigated.
• Introducing the baggage variation (4C Low risk) – whenever there is difference between the checked-in baggage and
manually entered bags, the baggage variation appears. This is most often the case when the ramp supervisor enters the final load data in the system. If the baggage variation is negative, usually some of the baggage didn’t make it on the flight, but if the variation is positive (as it is most often the case) the load figures are incorrect because there can’t be more baggage than checked-in. These differences are usually very small and negligent, but in one of the cases there was recorded variation of 67 bags on the A330 aircraft.
• Baggage weight difference (1D Low risk) – difference between measured weight of baggage in the check-in and at the baggage sorting area often occurs. Recorded difference is around 1.2 kg per baggage piece, which doesn’t significantly influence the safety.
W hen a n a ly z i ng t he probabi l i t y of occurrence of i risk, the equation (1) is used. DCSs are customized to fit the airline requests and as a result to this fact, some risks occur in one version of DCS, whilst they are non-existent in the other. Results are shown in table 4.
Table 4 Probability That Use Risk Will Occur
Use risk Probability Pi Severity and likelihood
Moving of the passengers without confirmation in DCS 22% 4B
Manual offloading of the baggage in DCS 4% 5C
Introducing the baggage variation 33% 4C
Baggage weight difference 94% 1D
Source: Centralized Load Control Database
2.2.2. System Safety Risks
System risks can happen as the result of a system error or bad programming and data
input. These risks are more difficult to spot, and good understanding of the processes, calculation methods and manufacturer data is needed. Calculations usually remain
305
International Journal for Traffic and Transport Engineering, 2017, 7(3): 298 - 311

hidden from the user, so the way to examine if the system is functioning properly is to use the same input data and compare the results from manual and system calculation. The following system risks were uncovered:
• Transit passenger error in multi-leg f light (5A Moderate risk) – passengers check at the departure airport for different destination airports. In each subsequent leg, transit passengers and baggage remain until the final dest inat ion. Two t y pes of errors occurred, and both are caused by the system glitch. First error happened when the system automatically changed all the transit passenger gender into male. Second error occurred when the transit passenger station changed. This resulted in severe mass differences and incorrect load sheet data in each station.
• Average passenger weight error (5C Very low risk) – in a number of flights, wrong average weights for the passengers were detected. The error ranged from a few kilograms (average 1,6 kg per passenger), up to the error when all the passengers averaged 35kg. The highest difference was quickly spotted and resolved, while the slight difference remained hidden.
• Incorrect landing index (2A Very high risk) – for certain type of aircraft (A333; A332), landing index calculation was wrong. This remained hidden for a long time period, due to the fact that it doesn’t appear on the load sheet. The result is a highly incorrect position of landing index (LI), which has severe impact on the safety. Table 5 shows measu rements f rom si x a i rcra f t . Examining and confirming the landing index was used in the process of manual calculation from manufacturer data.
Table 5 Difference Between System LI and Manual LI
System calculated LI Manually calculated LI Difference in LI
123,8 97,21 26,59
139,6 94,8 44,8
128,36 94,08 34,28
145,92 106,4 39,52
144,88 100,31 44,51
140,87 96,91 43,96
Source: Centralized Load Control Database
Probability of system risk occurrence was calculated in the table 6 using the equation (1).
306
Jakovljević I. et al. Aircraft Departure Control Systems – Hidden Safety Risks
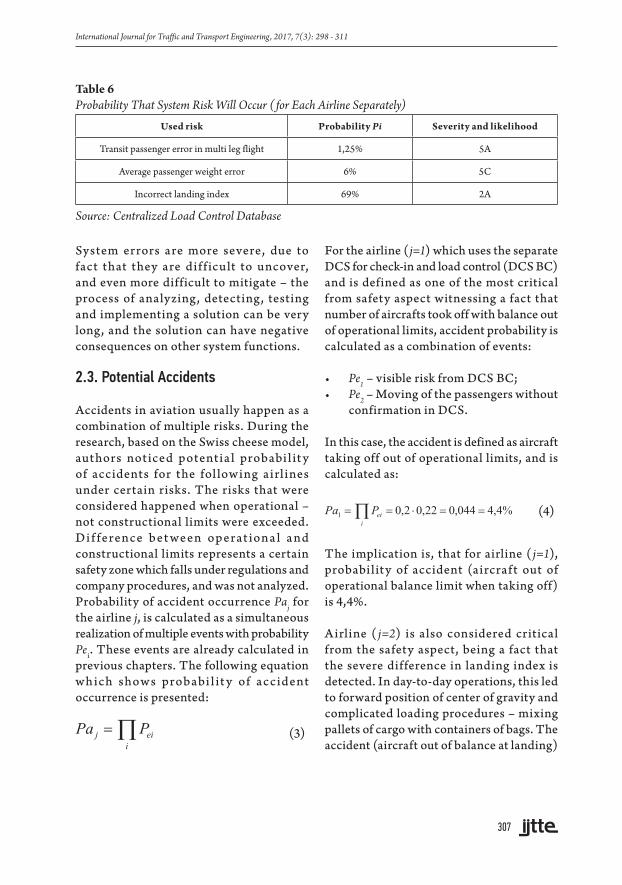
Table 6 Probability That System Risk Will Occur ( for Each Airline Separately)
Used risk Probability Pi Severity and likelihood
Transit passenger error in multi leg flight 1,25% 5A
Average passenger weight error 6% 5C
Incorrect landing index 69% 2A
Source: Centralized Load Control Database
System errors are more severe, due to fact that they are diff icult to uncover, and even more difficult to mitigate – the process of analyzing, detecting, testing and implementing a solution can be very long, and the solution can have negative consequences on other system functions.
2.3. Potential Accidents
Accidents in aviation usually happen as a combination of multiple risks. During the research, based on the Swiss cheese model, authors noticed potentia l probabi l it y of accidents for the fol lowing airl ines under certain risks. The risks that were considered happened when operational – not constructional limits were exceeded. Di f ference bet ween operat iona l and constructional limits represents a certain safety zone which falls under regulations and company procedures, and was not analyzed. Probability of accident occurrence Paj for the airline j, is calculated as a simultaneous realization of multiple events with probability Pei. These events are already calculated in previous chapters. The following equation which shows probabi l it y of accident occurrence is presented:
(3)
For the airline (j=1) which uses the separate DCS for check-in and load control (DCS BC) and is defined as one of the most critical from safety aspect witnessing a fact that number of aircrafts took off with balance out of operational limits, accident probability is calculated as a combination of events:
• Pe1 – visible risk from DCS BC;• Pe2 – Moving of the passengers without
confirmation in DCS.
In this case, the accident is defined as aircraft taking off out of operational limits, and is calculated as:
(4)
The implication is, that for airline (j=1), probability of accident (aircraft out of operational balance limit when taking off) is 4,4%.
Airline ( j=2) is also considered critical from the safety aspect, being a fact that the severe difference in landing index is detected. In day -to-day operations, this led to forward position of center of gravity and complicated loading procedures – mixing pallets of cargo with containers of bags. The accident (aircraft out of balance at landing)
307
International Journal for Traffic and Transport Engineering, 2017, 7(3): 298 - 311

occurrence probability is calculated when the two events are realized:
• Pe1 – visible risk from DCS A;• Pe2 – incorrect landing index.
And the probability is calculated as:
(5)
Airlines which have lower safety risks (j=3; j=4; j=5; j=6) of an accident (overweight or out of balance at operational limits) include following events:
• Pe1 – visible risk from DCS A;• Pe2 – visible risk from DCS B;• Pe3 – manual off loading of the baggage
in DCS;• Pe4 – introducing the baggage variation;• Pe5 – transit passenger error in multi
leg f light;
• Pe6 – average passenger weight error;• Pe7 – baggage weight difference.
Accident occurrence probability is calculated as following:
(6)
Probability that accident will occur when considering all the airlines (Pac) together is calculated as in equation:
%7)1(1 =−−= ∏j
PajPac (7)
Ranking of accident occurrence for each airline was done using Fussell-Vesley (FV) and risk reduction worth (RRW) as shown in Table 7.
Table 7 Ranking of Accident Occurrence for Each Airline by Importance
Airline j FV=Paj/Pac RRW=1-1/FV
1 59 0,98
2 37 0,97
4 2 0,56
6 2 0,53
3 1 0,06
5 1 0,05
These results ranked by importance of accident occurrence from table 7 define airline 1 as the most important. The reason is that a great number of v isible r isks appeared when using DCS BC, and resolving of the issue by moving the passengers (use risk) without confirmation from the ramp agent initiates the high risk and accident
occurrence probability. Careful inspection reveals that very high number of aircraft took of f with center of grav ity out of operational limits. Also, airline 2 is defined as critical, due to fact that the landing index is calculated in completely opposite direction in the system, and by a very large number of indexes. If this risk is combined with visible
308
Jakovljević I. et al. Aircraft Departure Control Systems – Hidden Safety Risks

risk from DCS A (aircraft out of balance), then by looking at the incorrect position of index, there is a high probability to “resolve” the issue by moving the center of gravity on the opposite direction.
3. Conclusion
Departure Control System offers efficient, fast, easy-to-use solution to mass and balance calculation. By integrating the check-in functions, movement messages, load control, the costs are lower; process is faster and overall more accurate. Strict time and use logs offer transparency, increase safety, and eliminate many risks considering the human error. However, these systems are far from error-proof, and the critical view combined with regular inspection is a key of maintaining the safety level. All the errors that plague software – form bad programming, to glitches and use errors are always present, and a key to safety is to always keep the employees aware of the background process and to let them know that the system is not always correct with its calculation. Therefore, the paper provides contribution to understanding L-S interaction within the SHELL model, whereas the block labeled “S” represents the interaction of the central liveware component “L” with software, that is, the non-physical aspects of his human machine systems. Therefore, authors analyzed three DCSs with integrated and separate functions, and they concluded that the integrated solution is a safe way to operate. Additionally, different versions of the system customized for the certain airline can contain errors within itself, which don’t appear on the other versions, so the key to safe use within the airline is periodic inspection and testing of manual and system calculations. Most dangerous risks are those very well hidden in the background
processes, and they are most difficult to mitigate, measure and implement – the imperative should be an active collaboration between users and software developers. Airline procedures also have a key role in the risk management, specifically at the point where responsibilities between the handlers, ramp agent, load control agent and the check-in is transferred.
Automation is a safe way into the future – but only with responsible use, control and risk management included in well-defined and developed safety culture.
References
Ancel, E.; Shih, A. T.; Jones, S. M.; Reveley, M.S.; Luxhøj, J.T.; Evans, J. K. 2015. Predictive safety analytics: inferring aviation accident shaping factors and causation, Journal of Risk Research 18(4): 428-451.
Berends, J.J. 1996. On the Measurement of Safety Culture (Unpublished graduation report). Eindhoven University of Technology, Eindhoven, 13-17.
Bröer, C. 2007. Aircraft noise and risk politics, Health, Risk & Society 9(1): 37-52.
Chang, Y.H.; Shao, P.C.; Chen, H.J. 2015. Performance evaluation of airport safety management systems in Taiwan, Safety Science 75: 72-86.
Čokorilo, O. 2013. Human Factor Modelling for Fast-Time Simulations in Aviation. Aircraft engineering and aerospace techology 85(5): 389 - 405.
Čokorilo, O.; De Luca, M.; Dell’Acqua, G. 2014. Aircraft safety analysis using clustering algorithms, Journal of Risk Research 17(10): 1325-1340.
Cooper, M.D. 2000. Towards a model of safety culture, Safety science 36(2): 111-136.
309
International Journal for Traffic and Transport Engineering, 2017, 7(3): 298 - 311

Cox, S.; Cox, T. 1991. The structure of employee attitudes to safety: an European example, Work and Stress 5(2): 93-106.
Darbra, R.M.; Crawford, J.F.E.; Haley, C.W.; Morrison, R. J. 2007. Safety culture and hazard risk perception of Australian and New Zealand maritime pilots, Marine Policy 31(6): 736-745.
Distefano, N.; Salvatore, L. 2014. Risk assessment procedure for civil airport, International Journal for Traffic and Transport Engineering 4(1): 62–75.
Dujim, N.J. 2015. Recommendations on the use and design of risk matrices, Safety Science 76: 21-31.
Duphily, R.J.; Harder, H.; Morehead, R.; Haman, J.; Gjerde, H.; Dubois, S.; Stout, T.; Ward, D.; Reinsel, T.; Loman, J. 2014. Root Cause Investigation Best Practices Guide (No. TOR-2014-02202). AEROSPACE CORP EL SEGUNDO CA, 110 p.
EHEST Safety Management Toolkit. 2013. Safety Management Manual. Version for Complex Operators, 2nd Edition, European Helicopter Safety Team. p. 83.
Ericson, C.A. 2016. Hazard Analysis Techniques for System Safety. Second edition, Wiley, Fredericksburg, Virginia. p. 616.
Geller, E.S. 1994. Ten principles for achieving a Total Safety Culture, Professional Safety 39(9): 18-24.
Gill, G.K.; Shergill, G.S. 2004. Perceptions of safety management and safety culture in the aviation industry in New Zealand, Journal of Air Transport Management 10(4): 231–237.
Guldenmund, F.W. 2000. The nature of safety culture: a review of theory and research, Safety Science 34(1): 215-257.
Hudson, P. 2014. Accident causat ion models, management and the law, Journal of Risk Research 17(6): 749-764.
ICAO. 2009. Safety Management Manual (SMM). Doc 9859. Second edition. Montreal, Canada. p. 263.
ICAO. 2013. Safety Management Manual (SMM). Doc 9859. Third edition. Montreal, Canada. p. 251.
ICAO. 1998. Human factors training manual. Doc 9683. Montreal, Canada. p. 12.
International Safety Advisory Group. 1991. Safety Culture (Safety Series No. 75-INSAG-4). International Atomic Energy Agency, Vienna. p. 44.
Lee, T.R. 1996. Perceptions, attitudes and behaviour: the vital elements of a safety culture, Health and Safety 10(1): 1-15.
Neumann, P.G. 2016. Risks of Automation: A Cautionary Total-System Perspective of Our Cyberfuture, Communications of the ACM 59(10): 26-30.
Oriola, A.O.; Adekunle, A.K. 2015. Assessment of runway accident hazards in Nigeria aviation sector, International Journal for Traffic and Transport Engineering 5(2): 82–92.
Ostrom, L.; Wilhelmsen, C.; Kaplan, B. 1993. Assessing safety culture, Nuclear Safety 34(2): 163-172.
Pidgeon, N.F. 1998. Safety culture: key theoretical issues, Work and Stress 12(3): 202-216.
Pidgeon, N.; O’Leary, M. 1995. Organisational Safety Culture: Implications for aviation practice. In: McDonald, N., Johnston, N., Fuller, R. (Eds.), Application of Psychology to the Aviation System, England: Aubury, pp. 47–52.
310
Jakovljević I. et al. Aircraft Departure Control Systems – Hidden Safety Risks

Reason, J. 1998. Achieving a safe culture: theory and practice, Work and Stress 12(3): 293–306.
Reason, J.; Hollnagel, E.; Paries, J. 2006. Revisiting the Swiss cheese model of accidents, Journal of Clinical Engineering 27: 110-115.
Turner, B. A.; Pidgeon, N.; Blockley, D.; Toft, B. 1989. Safety culture: its importance in future risk management. In Position paper for 2nd World Bank Workshop on Safety Control and Risk Management, Karlstad, Sweden.
Wagner, D.C.; Barker, K. 2014. Statistical methods for modeling the risk of runway excursions, Journal of Risk Research 17(7): 885-901.
Wiegmann, D.A.; Zhang, H.; Von Thaden, T.L.; Sharma, G.; Gibbons, A.M. 2004. Safety culture: An integrative review, The International Journal of Aviation Psychology 14(2): 117-134.
311
International Journal for Traffic and Transport Engineering, 2017, 7(3): 298 - 311