Comprehensive Kinetic Model for the Degradation of Methyl tert Butyl Ether by an Ozone/UV Process

Effect of Ba(Zn1/3Ta2/3)O3 and SiO2 ceramic fillerson the microwave dielectric properties of butyl rubber composites
J. Chameswary • M. T. Sebastian
Received: 22 May 2013 / Accepted: 23 July 2013 / Published online: 2 August 2013
� Springer Science+Business Media New York 2013
Abstract Butyl rubber–Ba(Zn1/3Ta2/3)O3 (BR–BZT)
composites and butyl rubber–silica (BRS) composites were
prepared by sigma mixing. The dielectric properties at
1 MHz and 5 GHz of BR–BZT and BRS composites were
investigated as a function of ceramic loading and were
found to be improved with filler loading. For a optimum
BZT loading of 0.26 vf, the BR–BZT composite have
er = 4.88, tand = 0.0022 (at 5 GHz), coefficient of ther-
mal expansion (CTE) = 112 ppm/�C, thermal conductivity
(TC) = 0.30 Wm-1 K-1 and water absorption = 0.047
vol%. The BRS composites attained er = 2.79, tand =
0.0039 (at 5 GHz), CTE = 102 ppm/�C, TC = 0.40
Wm-1 K-1 and water absorption = 0.078 vol% for the
same loading of silica. The stress–strain curves of both
composites showed good flexibility of the composite. The
measured relative permittivity and TC of both composites
were compared with different theoretical approaches.
1 Introduction
Flexible electronics is a current research area in the
microelectronic industry. Flexible electronics known as
flex circuits is a technology for building electronic circuits
by depositing electronic devices on flexible substrates [1].
A new generation of flexible circuit connectors could
produce a new class of electronic applications, such as
stretchable thermometers, biomedical devices and elec-
tronic clothing etc. [2]. The future of electronic appliances
should be flexible and stretchable in order to meet the
demand of today’s electronic industry [3]. The need for
stretchability for electronic components is reported in the
annual report of advanced packaging and interconnection
[4]. Today’s citizen carries more electronic systems near or
even inside the body. Hence the systems must be light
weight, must take the desirable shape of the object and
should follow all complex movements of these objects [4].
The ever increasing demand for high performance elec-
tronic devices needs new materials to be used as circuit
board laminates.
Extensive research is being done in the field of microwave
dielectric properties of low permittivity filler–polymer
composites [5–8]. Recently Manu et al. [9] reported the
effect of Ba(Zn1/3Ta2/3)O3 ceramic on dielectric, mechanical
and thermal properties of high density polyethylene com-
posites. Nijesh et al. [10] reported that PTFE filled with 76
wt% Ba(Mg1/3Ta2/3)O3 ceramic attained a relative permit-
tivity of 6.7 and a loss tangent of 0.003 in the X-band. Kim
and Chang [11] investigated the effect of ZnNb2O6 and
crystallinity of polymers on dielectric properties of
ZnNb2O6/polytetrafluoroethylene, polypropylene and poly-
styrene composites at 10–16 GHz. Silica loaded polymer
composites were also reported for microwave electronic
applications [12–14]. These polymer-ceramic composites
are not useful for stretchable electronic applications.
Low loss and low permittivity composites are needed for
electronic packaging applications. Recently elastomer
ceramic composites have been found to be most promising
candidates for flexible electronic applications. These
composite combines the stretchability and light weight of
elastomer with good dielectric and thermal properties of
ceramics. Namitha et al. [15] recently studied the effect of
micron and nano alumina on microwave dielectric, thermal
and mechanical properties of silicone rubber composites
J. Chameswary � M. T. Sebastian (&)
Materials Science and Technology Division, National Institute
for Interdisciplinary Science and Technology (CSIR),
Trivandrum 695019, India
e-mail: [email protected]
123
J Mater Sci: Mater Electron (2013) 24:4351–4360
DOI 10.1007/s10854-013-1410-0

and silicone rubber-micron alumina composite is found to
be good for microwave substrate applications. Tomer and
Randall [16] investigated the electrical properties of sili-
cone elastomer–BaTiO3 composites as a function of cera-
mic volume fraction (vf) and connectivity at 1 kHz.
Recently microwave dielectric properties of butyl rubber
(BR) based composites are reported by Sebastian et al.
[17–20]. Elastomer–silica composites are reported in order
to improve the dielectric and mechanical properties of
elastomer [21, 22]. Hanna et al. [21] reported the dielectric
properties of styrene–butadiene rubber–silica composites in
the frequency range from 60 to 108 Hz. Ward et al. [22]
investigated the effect of stress strain cycles on the
dielectric properties of BR vulcanizates filled with silica in
the frequency range 10-3–106 Hz.
The microwave dielectric properties of BR–BZT and BR–
silica (BRS) composites were not yet reported. In the present
work, we try to make an insight into the effect of BZT and
silica ceramic on the microwave dielectric, thermal and
mechanical properties of BR composites as a function of
ceramic volume fraction. BR is a synthetic elastomer with
excellent dielectric properties in the microwave frequencies
(er = 2.4, tand & 10-3), good mechanical flexibility, age-
ing resistance, weathering resistance etc. [23]. BZT is a good
dielectric ceramic with er = 30 and tand & 10-3 [24] and
silica is another well known ceramic with excellent dielectric
properties (er = 4, tand & 10-3), good thermal properties
etc. In the present paper we report the use of BZT and silica
ceramic fillers to improve the dielectric, thermal and
mechanical properties of BR.
2 Experimental
Ba(Zn1/3Ta2/3)O3 ceramic was prepared by following the
conventional solid state ceramic route. Stoichiometric
quantities of BaCO3, ZnO (99.9? %, Sigma-Aldrich) and
Ta2O5 (99.99 %, Treibacher Industries,) were ball milled for
24 h in distilled water using yttria-stabilized zirconia balls in
a plastic container. The slurry was dried and calcined at
1,200 �C for 4 h. The calcined powder was ground well and
sintered at 1,500 �C for 4 h. The powder was then sieved
through a 25 lm sieve. Silica was procured from Sigma
Aldrich and was dried at 100 �C for 24 h before use. BR–
Ba(Zn1/3Ta2/3)O3 and BRS composites were prepared by
sigma mixing as described in our earlier paper [25]. The
density of BZT (q & 7.96 g cm-3) is higher than that of
silica (q & 2.6 g cm-3). Hence the BR–BZT composites
were prepared up to a filler loading of 400 phr and that of
silica filled composites up to a loading of 200 phr. The
sample designation and the corresponding ceramic volume
fraction are given in Table 1. The composites were then hot
pressed at 200 �C for 90 min under a pressure of 2 MPa.
The phase purity of the ceramic powder was analyzed by
X-ray powder diffraction technique with Cu–Ka radiation
(Philips X’Pert PRO MPD X-ray diffractometer). The
microstructures of the composites were examined using a
scanning electron microscope (SEM) (Jeol Model, JSM
5600LV). The dielectric properties at 1 MHz were mea-
sured following the parallel plate capacitor method using a
LCR meter (Hioki Model, 3532-50). The microwave
dielectric properties were measured using a split post
dielectric resonator (SPDR) with the help of a vector net-
work analyzer (Agilent Technologies, E5071C, ENA Ser-
ies) [26]. The microwave dielectric properties of both
composites were also investigated after bending the sam-
ples manually by an angle of 180� and the bending cycle
was repeated for 125 times. The moisture absorption
characteristics of the composites were measured following
ASTM D 570-98 procedure [19] using the samples with
dimensions 50 mm 9 50 mm 9 2 mm. The samples were
weighed accurately and immersed in distilled water for
Table 1 Dielectric and water
absorption properties of BR–
BZT and BRS composites
a Parts/100b The corresponding ceramic
volume fraction is given in
parenthesis
Composite
material
Sample
designation
Amount of filler
(Phr)a ()ber
(1 MHz)
tand(1 MHz)
Water absorption
(vol%)
BR–BZT BR-0 0 (0) 2.44 0.0003 0.039
BR–BZT-1 10 (0.01) 2.45 0.0010 0.040
BR–BZT-2 25 (0.028) 2.50 0.0012 0.041
BR–BZT-3 50 (0.055) 2.71 0.0015 0.043
BR–BZT-4 100 (0.10) 3.11 0.0016 0.044
BR–BZT-5 200 (0.19) 3.49 0.0018 0.045
BR–BZT-6 300 (0.26) 4.45 0.0019 0.047
BR–BZT-7 400 (0.32) 5.46 0.0021 0.057
BRS BRS-1 10 (0.03) 2.51 0.002 0.048
BRS-2 25 (0.08) 2.75 0.005 0.052
BRS-3 50 (0.15) 2.83 0.006 0.059
BRS-4 100 (0.26) 3.10 0.008 0.078
BRS-5 200 (0.42) 3.37 0.010 0.091
4352 J Mater Sci: Mater Electron (2013) 24:4351–4360
123

24 h. The samples were then taken out and again weighed
after removing the excess water from the surface. The
vol% of water absorption was then calculated using the
relation,
Volume% water absorption ¼ ðWf �WiÞ=qw
Wf �Wi
qwþWi=qc
� 100
ð1Þ
where Wi and Wf are the initial and final weights of the
sample and qw and qc are the densities of distilled water
and sample respectively.
The thermal conductivity (TC) of the composites was
measured by laser flash technique using a TC analyzer
(Flash LineTM 2000, Anter Corporation, USA) by using
the relation
TC ¼ k� Cp � q ð2Þ
where k is the thermal diffusivity, Cp is the specific heat
capacity at room temperature and q is the density of the
sample.
The linear coefficient of thermal expansion (CTE) of
each composite was measured using a dilatometer (Netzsch
Model, DIL 402 PC) in the temperature range from 30 to
100 �C. Tensile tests of both BR–BZT and BRS compos-
ites were carried out in a Universal Testing Machine
(Hounsfield Model, H5K-S UTM) with a rate of grip sep-
aration of 500 mm/min.
3 Results and discussion
Figure 1 shows the XRD pattern of sintered BZT and sil-
ica. The peaks were indexed based on the JCPDS file no.
18-0201 and 89-8934 for BZT and silica respectively. The
phase purity of both the ceramics were obvious from the
XRD patterns.
Figure 2a, b shows the SEM images of silica and BZT
powder respectively. Both silica and BZT particles are
irregularly shaped and are \1 lm in size. The Fig. 2c, d
represents fractured SEM images of BRS-5 and BR–BZT-7
respectively. From the figure it is clear that the filler par-
ticles are uniformly distributed in the rubber matrix of both
composites.
Table 1 shows the dielectric and water absorption
properties of BR–BZT and BRS composites. The relative
permittivity and loss tangent of both the composites
increases with filler content. The increase in er of the
composites is mainly due to the high relative permittivity
of BZT and silica as compared to rubber matrix. The
connectivity among the filler particles increases at higher
filler content which in turn increases the relative
permittivity of the composites [27]. The loss tangent which
is the main factor affecting the frequency selectivity of a
material is influenced by many factors such as porosity,
microstructure and defects [28]. The interfacial area and
the possibility of accumulation of space charges at inter-
face of polymer–ceramic composite increases with increase
in the ceramic loading which in turn increases the dielectric
loss. The tand of BRS composite is found to be higher than
that of BR–BZT composites. This may be due to the
presence of more moisture content in the silica sample.
Hanna et al. [21] reported a similar observation in SBR–
SiO2 composites. The moisture content is an important
parameter for materials used for packaging applications.
Absorption of moisture from the working atmosphere will
degrade especially the dielectric properties since the water
is a polar molecule. It is also evident from the Table 1 that
the vol% of moisture content increases with filler content
for both BR–BZT and BRS composites. This may be due to
the hydrophilic nature of ceramic. It has been reported that
Fig. 1 The XRD pattern of a Ba(Zn1/3Ta2/3)O3 and b SiO2
J Mater Sci: Mater Electron (2013) 24:4351–4360 4353
123

materials with moisture absorption up to about 0.1 % can
be used for electronic packaging applications [29]. The
present composites exhibit moisture absorption within this
limit.
Figure 3a, b depicts the microwave dielectric properties
of BR–BZT and BRS composites at 5 GHz. The relative
permittivity of both the composites increases with filler
loading. The increased total polarizability of composite
material contributes to the increase in relative permittivity
of the composites. The relative permittivity of BZT filled
BR composites has er of 5.72 for the maximum filler
loading of 0.32 vf. The relative permittivity of BRS com-
posite is 3.09 for the maximum silica loading of 0.42 vf.
The BZT based composite has higher relative permittivity
since silica has a lower relative permittivity. From the
figure it is also clear that the dielectric loss of BR–BZT and
BRS composites shows similar trend as that of relative
permittivity with increase in filler loading. The tand of BR–
BZT composites is lower than that of silica filled com-
posites. The tand of BR–BZT-7 and BRS-5 composites at
5 GHz is 0.0025 and 0.0045 respectively. The increase in
loss of BRS composites is due to the presence of more
moisture content in silica composites than that of BR–BZT
composites which is evident from Table 1. The dipole
relaxation of water molecule in the microwave frequency
contributes to dielectric loss [30].
The precise prediction of effective relative permittivity of
the composites is very important for electronic packaging
applications. Figure 4a, b shows the comparison of experi-
mental and theoretical relative permittivity of the BR–BZT
and BRS composites at 5 GHz respectively. In the present
study, the following equations were used to predict the rel-
ative permittivity of both the composites [31].
Fig. 2 SEM image of a SiO2 powder, b Ba(Zn1/3Ta2/3)O3 powder, c fractured surface of BRS-5 and d BR–BZT-7
Fig. 3 Variation of er and tand of a BR–BZT and b BRS composites
with filler content at 5 GHz
4354 J Mater Sci: Mater Electron (2013) 24:4351–4360
123
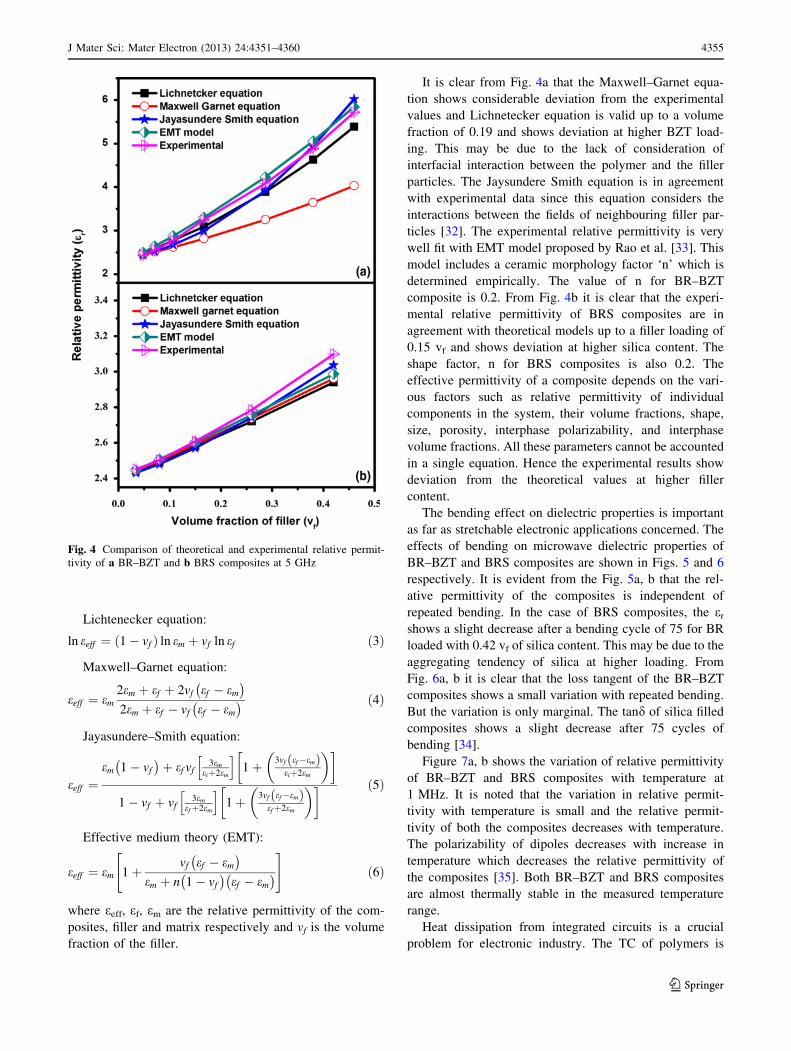
Lichtenecker equation:
ln eeff ¼ ð1� vf Þ ln em þ vf ln ef ð3Þ
Maxwell–Garnet equation:
eeff ¼ em
2em þ ef þ 2vf ef � em
� �
2em þ ef � vf ef � em
� � ð4Þ
Jayasundere–Smith equation:
eeff ¼em 1� vf
� �þ ef vf
3em
eiþ2em
h i1þ 3vf ef�emð Þ
eiþ2em
� �� �
1� vf þ vf3em
efþ2em
h i1þ 3vf ef�emð Þ
efþ2em
� �� � ð5Þ
Effective medium theory (EMT):
eeff ¼ em 1þvf ef � em
� �
em þ n 1� vf
� �ef � em
� �
" #
ð6Þ
where eeff, ef, em are the relative permittivity of the com-
posites, filler and matrix respectively and vf is the volume
fraction of the filler.
It is clear from Fig. 4a that the Maxwell–Garnet equa-
tion shows considerable deviation from the experimental
values and Lichnetecker equation is valid up to a volume
fraction of 0.19 and shows deviation at higher BZT load-
ing. This may be due to the lack of consideration of
interfacial interaction between the polymer and the filler
particles. The Jaysundere Smith equation is in agreement
with experimental data since this equation considers the
interactions between the fields of neighbouring filler par-
ticles [32]. The experimental relative permittivity is very
well fit with EMT model proposed by Rao et al. [33]. This
model includes a ceramic morphology factor ‘n’ which is
determined empirically. The value of n for BR–BZT
composite is 0.2. From Fig. 4b it is clear that the experi-
mental relative permittivity of BRS composites are in
agreement with theoretical models up to a filler loading of
0.15 vf and shows deviation at higher silica content. The
shape factor, n for BRS composites is also 0.2. The
effective permittivity of a composite depends on the vari-
ous factors such as relative permittivity of individual
components in the system, their volume fractions, shape,
size, porosity, interphase polarizability, and interphase
volume fractions. All these parameters cannot be accounted
in a single equation. Hence the experimental results show
deviation from the theoretical values at higher filler
content.
The bending effect on dielectric properties is important
as far as stretchable electronic applications concerned. The
effects of bending on microwave dielectric properties of
BR–BZT and BRS composites are shown in Figs. 5 and 6
respectively. It is evident from the Fig. 5a, b that the rel-
ative permittivity of the composites is independent of
repeated bending. In the case of BRS composites, the er
shows a slight decrease after a bending cycle of 75 for BR
loaded with 0.42 vf of silica content. This may be due to the
aggregating tendency of silica at higher loading. From
Fig. 6a, b it is clear that the loss tangent of the BR–BZT
composites shows a small variation with repeated bending.
But the variation is only marginal. The tand of silica filled
composites shows a slight decrease after 75 cycles of
bending [34].
Figure 7a, b shows the variation of relative permittivity
of BR–BZT and BRS composites with temperature at
1 MHz. It is noted that the variation in relative permit-
tivity with temperature is small and the relative permit-
tivity of both the composites decreases with temperature.
The polarizability of dipoles decreases with increase in
temperature which decreases the relative permittivity of
the composites [35]. Both BR–BZT and BRS composites
are almost thermally stable in the measured temperature
range.
Heat dissipation from integrated circuits is a crucial
problem for electronic industry. The TC of polymers is
Fig. 4 Comparison of theoretical and experimental relative permit-
tivity of a BR–BZT and b BRS composites at 5 GHz
J Mater Sci: Mater Electron (2013) 24:4351–4360 4355
123

very low, ranging from 0.14 to 0.60 Wm-1 K-1 [36] and
can be improved by addition of ceramic fillers as the TC
of ceramic is higher than that of polymers. The TC of the
composites depends on the intrinsic conductivities of filler
and matrix, shape and size of the filler, and the loading
level of filler [37]. The variation of TC of BR–BZT and
BRS composites with filler content are shown in Fig. 8.
The TC of BR is 0.13 Wm-1 K-1. As the TC of fillers
BZT (3.9) and silica (1.4) are higher than that of matrix
the TC of both BR–BZT and BRS composites increased
with filler content. The increase in TC of both the
composites at higher filler content is due to the presence
of more connecting paths between the filler particles
[38]. The TC of BR–BZT composites increases from 0.13
to 0.35 as the filler loading increases from 0 to 0.32
vf and that of BRS composites from 0.13 to 0.56 as
the silica loading increases from 0 to 0.42 vf. The TC
of the composite can be further enhanced by adding
high TC fillers such as aluminium nitride, silicon nitride
etc.
Several theoretical models or equations have been
reported [39, 40] for predicting the TC of composites. In
the present study, following models are used to predict the
TC of the composites:
Fig. 5 Variation of relative permittivity of a BR–BZT and b BRS
composites with bending
Fig. 6 Variation of loss tangent of a BR–BZT and b BRS composites
with bending
Fig. 7 The temperature dependence of relative permittivity of a BR–
BZT and b BRS composites at 1 MHz
4356 J Mater Sci: Mater Electron (2013) 24:4351–4360
123
Geometric mean model:
kc ¼ kvf
f k1�vf
m ð7Þ
Maxwell–Eucken model:
kc ¼ km
kf þ 2km þ 2vf ðkf � kmÞkf þ 2km � vf ðkf � kmÞ
� �ð8Þ
Cheng–Vachon model:
1
kc
¼ 1ffiffiffiffiffiffiffiffiffiffiffiffiffiffiffiffiffiffiffiffiffiffiffiffiffiffiffiffiffiffiffiffiffiffiffiffiffiffiffiffiffiffiffiffiffiffiffiffiffiffiffiffiffiffiffiffiffiffiCðkm � kf Þ km þ Bðkf � kmÞ
q
ln
ffiffiffiffiffiffiffiffiffiffiffiffiffiffiffiffiffiffiffiffiffiffiffiffiffiffiffiffiffiffiffiffiffiffiffiffikm þ Bðkf � kmÞ q
þ B2
ffiffiffiffiffiffiffiffiffiffiffiffiffiffiffiffiffiffiffiffiffiffiCðkm � kf Þ
p
ffiffiffiffiffiffiffiffiffiffiffiffiffiffiffiffiffiffiffiffiffiffiffiffiffiffiffiffiffiffiffiffiffiffiffiffikm þ Bðkf � kmÞ q
� B2
ffiffiffiffiffiffiffiffiffiffiffiffiffiffiffiffiffiffiffiffiffiffiCðkm � kf Þ
p þ 1� B
km
ð9Þ
where
B ¼ffiffiffiffiffiffiffiffiffiffi3vf�2
q; C ¼ �4
ffiffiffiffiffiffiffiffiffiffi2�3vf
q
Nielson model:
kc ¼ km
1þ ABvf
1� Bvf w
� �
B ¼kf
km� 1
kf
kmþ A
where w ¼ 1þ 1� vfm
v2fm
!
vf
ð10Þ
A(-3) is a function of geometry of the filler particles
and vfm is the maximum filler content.
Where kc, km, and kf are the thermal conductivities of the
composite, matrix, and filler, respectively, and vf is the
volume fraction of the filler.
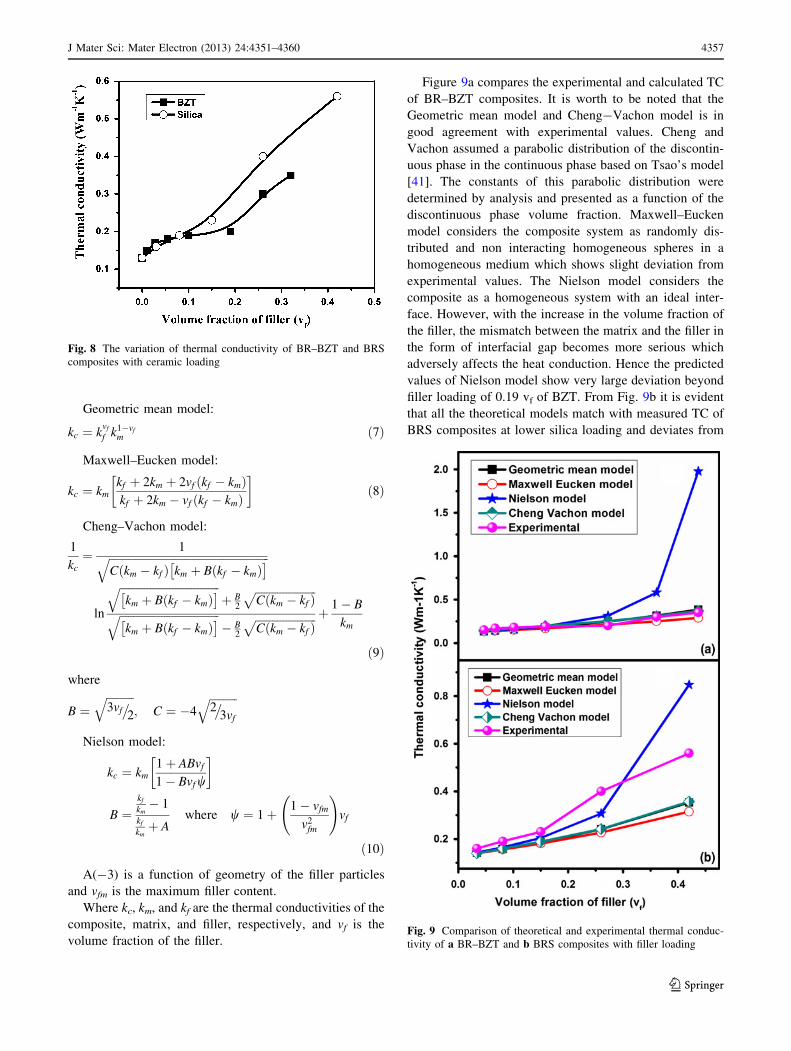
Figure 9a compares the experimental and calculated TC
of BR–BZT composites. It is worth to be noted that the
Geometric mean model and Cheng-Vachon model is in
good agreement with experimental values. Cheng and
Vachon assumed a parabolic distribution of the discontin-
uous phase in the continuous phase based on Tsao’s model
[41]. The constants of this parabolic distribution were
determined by analysis and presented as a function of the
discontinuous phase volume fraction. Maxwell–Eucken
model considers the composite system as randomly dis-
tributed and non interacting homogeneous spheres in a
homogeneous medium which shows slight deviation from
experimental values. The Nielson model considers the
composite as a homogeneous system with an ideal inter-
face. However, with the increase in the volume fraction of
the filler, the mismatch between the matrix and the filler in
the form of interfacial gap becomes more serious which
adversely affects the heat conduction. Hence the predicted
values of Nielson model show very large deviation beyond
filler loading of 0.19 vf of BZT. From Fig. 9b it is evident
that all the theoretical models match with measured TC of
BRS composites at lower silica loading and deviates from
Fig. 8 The variation of thermal conductivity of BR–BZT and BRS
composites with ceramic loading
Fig. 9 Comparison of theoretical and experimental thermal conduc-
tivity of a BR–BZT and b BRS composites with filler loading
J Mater Sci: Mater Electron (2013) 24:4351–4360 4357
123

predicted values after a filler loading of 0.15 vf. The wide
variations in filler geometry, orientation and dispersion
makes it difficult to compare composites filled with dif-
ferent materials. Moreover, the interfacial boundary ther-
mal resistance between the filler particles and the matrix,
referred to as Kapitza resistance, [42] is not taken into
account while calculating the TC of composites. It is not
possible to measure it at the molecular level where it takes
place. As a result, experimental and theoretical TC data are
often not in agreement.
Figure 10a, b shows the variation of specific heat
capacity and thermal diffusivity of BR–BZT and BRS
composites with filler loading respectively. Both the
composites shows similar trend of variation with ceramic
content. The thermal diffusivity of both the composites
increases with ceramic loading. The specific heat capacity
of composites decreases with filler volume fraction. This
may be due to the low Cp value of BZT and silica. A
similar observation was reported by Subodh et al. [43] in
PTFE–Sr2Ce2Ti5O16 composites and Aravind et al. [44] in
lead titanate/polyvinylidene fluoride composites.
The variation of CTE of BR composites filled with BZT
and silica are shown in Fig. 11. It is seen that the CTE of BR–
BZT and BRS composites decreases with filler loading as
the CTE of the fillers, BZT (4.2 ppm/�C) and silica
(0.5 ppm/�C) are lower than that of rubber matrix (191 ppm/
�C). The interfacial properties of the filler significantly affect
the CTE of the composites. The thermal expansion of com-
posites is more reduced in strong interfacial system than that
of poor interface system [45]. Recently Goyal et al. [46]
reported that the unconstrained polymer chains become
constrained upon the addition of ceramic which reduces the
thermal expansion of composites.
Figure 12 shows the stress–strain curves of BR-0, BR–
BZT-7 and BRS-5. The stress needed for elongation
increases with filler content. The interfacial adhesion plays
a major role in mechanical properties of the composites.
Todorova et al. [47] reported that the interfacial adhesion
increases with filler loading which inturn increases the
effectiveness of the stress transfer from rubber chains.
Salaeh et al. [48] reported that the mobility of molecular
Fig. 10 Variation of thermal diffusivity and specific heat capacity of
a BR–BZT and b BRS composites with ceramic loading
Fig. 11 Variation of coefficient of thermal expansion of BR–BZT
and BRS composites with ceramic loading Fig. 12 Stress–strain curves of BR–BZT and BRS composites
4358 J Mater Sci: Mater Electron (2013) 24:4351–4360
123
chains decreases due to the incorporation of ceramic par-
ticles and hence the increase in stiffness of the composite.
From the figure it is clear that the silica filled composite
shows higher reinforcement than that of BZT filled com-
posite. Silica is reported to be good reinforcing filler for
rubber composites [49, 50].
4 Conclusions
The BR–BZT and BRS composites were prepared and the
effect of ceramic loading on dielectric, thermal and
mechanical properties was investigated. The dielectric
properties of the composites were investigated at 1 MHz
and 5 GHz and were improved with ceramic loading. The
CTE and TC of both BR–BZT and BRS composites were
also improved with filler addition. The experimental rela-
tive permittivity and TC of the both composites were
compared with theoretical models. The mechanical prop-
erties show the flexibility of both composites. The BR–
BZT composite have er = 4.88, tand = 0.0022 (at 5 GHz),
CTE = 112 ppm/�C, TC = 0.30 Wm-1 K-1 and water
absorption = 0.047 vol% for a optimum BZT loading of
0.26 vf. The BRS composites attained er = 2.79, tand =
0.0039 (at 5 GHz), CTE = 102 ppm/�C, TC = 0.40
Wm-1 K-1 and water absorption = 0.078 vol% for a
optimum silica loading of 0.26 vf. The loss tangent and
moisture absorption values of BR–BZT composites are
superior to that of BRS composites. Hence the BZT filled
BR composites are suitable candidate for microwave sub-
strate applications.
Acknowledgments The authors are grateful to the Council of Sci-
entific and Industrial Research (CSIR), India for the award of Senior
Research Fellowship. The authors are thankful to Dr. P. Prabhakar
Rao and Mr. M. R. Chandran for SEM, and Mr. Brahmakumar for
tensile measurements.
References
1. B. Erik, W. William, Z. Lisong, J. Tom, T. Greg, A. B. D. Rod,
B. David, V. Nikhil, C. Robert, in Material Research Society.
Flexible Electronics Symposium, San Francisco, CA (2004)
2. D. Lucian, Science Nano-Biotechnology, July 11th (2007)
3. J. Provoost, IMEC www.Onboard-Technology.com 8–9. (2008)
4. in Flexible and Stretchable Electronics. Annual Report of
Advanced Packaging and Interconnection (2011)
5. S. George, V.N. Deepu, P. Mohanan, M.T. Sebastian, Polym.
Eng. Sci. 50, 570 (2010)
6. P.S. Anjana, V. Deepu, S. Uma, P. Mohanan, J. Philip, M.T.
Sebastian, J. Polym. Sci. Part B: Polym. Phys. 48, 998 (2010)
7. T. Joseph, S. Uma, J. Philip, M.T. Sebastian, J. Mater. Sci.:
Mater. Electron. 23, 1243 (2012)
8. K.P. Murali, S. Rajesh, O. Prakash, A.R. Kulkarni, R. Ratheesh,
Mater. Chem. Phys. 113, 290 (2009)
9. K.M. Manu, S. Soni, V.R.K. Murthy, M.T. Sebastian, J. Mater.
Sci.: Mater. Electron. (2013). doi:10.1007/s10854-013-1064-y
10. K.J. Nijesh, J.K. Stanly, K.P. Murali, R. Ratheesh, Mater. Chem.
Phys. 122, 507 (2010)
11. E.S. Kim, J.J. Chang, IEEE Trans. Ultrason. Ferroelectr. Freq.
Control 58, 1939 (2011)
12. K.P. Murali, S. Rajesh, O. Prakash, A.R. Kulkarni, R. Ratheesh,
Compos. A 40, 1179 (2009)
13. M.G. Todd, F.G. Shi, Microelectron. J. 33, 627 (2002)
14. H. Couderc, I. Preda, M. Frechette, S. Savoie, M. Reading, A.
S. Vaughan, J. Castellon, in Annual Report Conference on
Electrical Insulation and Dielectric Phenomena (CEIDP), p. 511
(2012)
15. L. K. Namitha, J. Chameswary, S. Ananthakumar, M. T. Sebas-
tian, Ceram. Int. doi:10.1016/j.ceramint.2013.02.047 (2013)
16. V. Tomer, C.A. Randall, J. Appl. Phys. 104, 074106-1 (2008)
17. J. Chameswary, L.K. Namitha, M. Brahmakumar, M.T. Sebas-
tian, Int. J. Appl. Ceram. Technol. (2013). doi:10.1111/ijac.12067
18. J. Chameswary, M.T. Sebastian, Ceram. Int. 39, 2795 (2013)
19. C. Janardhanan, D. Thomas, G. Subodh, S. Harshan, J. Philip,
M.T. Sebastian, J. Appl. Polym. Sci. 124, 3426 (2012)
20. D. Thomas, C. Janardhanan, M.T. Sebastian, Int. J. Appl. Ceram.
Technol. 8, 1099 (2011)
21. F.F. Hanna, A.A. Yehiab, A.F. Abou-Bakr, Brit. Polym. J. 5, 83
(1973)
22. A.A. Ward, B. Stoll, W. Soden, S. Herminghaus, A.M. Bishai,
F.F. Hanna, J. Macromol. Sci. Phys. B42, 1265 (2003)
23. I.K. Hakim, A.M. Bishai, A.L. Saad, J. Appl. Polym. Sci. 35,
1123 (1988)
24. S. Kawashima, M. Nishida, I. Ueda, H. Ouchi, J. Am. Ceram.
Soc. 66, 421 (1983)
25. H. Barron, Modern Synthetic Rubbers (Chapman & Hall, London,
1949)
26. M.T. Sebastian, Dielectric Materials for Wireless Communica-
tions, 1st edn. (Elsevier, Oxford, 2008)
27. S.M. David, M. Blaszkiewicz, R.E. Newnham, J. Am. Ceram.
Soc. 73, 2187 (1990)
28. N.G. Devaraju, E.S. Kim, B.I. Lee, Microelectron. Eng. 82, 71
(2005)
29. T.S. Laverghetta, Microwave Materials and Fabrication Tech-
niques (Artech House, Dedham, 1985)
30. F. Xiang, H. Wang, X. Yao, J. Eur. Ceram. Soc. 26, 1999 (2006)
31. M.T. Sebastian, H. Jantunen, Int. J. Appl. Ceram. Technol. 7, 415
(2010)
32. N. Jayasundere, B.V. Smith, J. Appl. Phys. 73, 2462 (1993)
33. Y. Rao, J. Qu, T. Marinis, C.P. Wong, IEEE Trans. Compon.
Packag. Technol. 23, 680 (2000)
34. A.A.M. Ward, B. Stoll, W.V. Soden, S. Herminghaus, A.A.
Mansour, Macromol. Mater. Eng. 278, 971 (2003)
35. L.L. Hench, J.K. West, Principles of Electronic Ceramics (Wiley,
New York, 1990)
36. I.H. Tavman, Int. Commun. Heat Mass 25, 723 (1998)
37. S. Kemaloglu, G. Ozkoc, A. Aytac, Thermochim. Acta 499, 40
(2010)
38. H. He, R. Fu, Y. Shen, Y. Han, X. Song, Compos. Sci. Technol.
67, 2493 (2007)
39. R.C. Progelhof, J.L. Throne, R.R. Ruetsch, Polym. Eng. Sci. 16,
615 (1976)
40. J.K. Carson, S.J. Lovatt, D.J. Tanner, A.C. Cleland, J. Food Eng.
75, 297 (2006)
41. G.T.N. Tsao, Ind. Eng. Chem. 53, 395 (1961)
42. J.C. Maxwell, A Treatise on Electricity and Magnetism (Dover,
New York, 1954)
43. G. Subodh, M.V. Manjusha, J. Philip, M.T. Sebastian, J. Appl.
Polym. Sci. 108, 1716 (2008)
J Mater Sci: Mater Electron (2013) 24:4351–4360 4359
123
44. M. Aravind, C.W. Ong, H.L.W. Chan, Polym. Compos. 23, 925
(2002)
45. T.H. Ho, C.S. Wang, J. Appl. Polym. Sci. 51, 2047 (1994)
46. R.K. Goyal, A.N. Tiwari, Y.S. Negi, Compos. B 47, 70 (2013)
47. Z. Todorova, N. Dishovsky, R. Dimitrov, F.E. Tantawy, A.N.
Aal, A. Al-Hajry, M. Bououdina, Polym. Compos. 29, 109 (2008)
48. S. Salaeh, N. Muensit, P. Bomlai, C. Nakason, J. Mater. Sci. 46,
1723 (2011)
49. N. Rattanasoma, T. Saowaparkc, C. Deeprasertkul, Polym. Test.
26, 369 (2007)
50. K. Boonkerd, S. Chuayjuljit, D. Abdulraman, W. Jaranrangsup,
Rubber Chem. Technol. 85, 1 (2012)
4360 J Mater Sci: Mater Electron (2013) 24:4351–4360
123
Copyright © 2022 FDOKUMEN


 O3 ceramics](https://static.fdokumen.com/doc/165x107/6327e6759f8521b2bb016ffe/structural-refinement-optical-and-electrical-properties-of-ba1-x-sm2x3zr0.jpg)


![Lower Rim Substituted p-tert -Butyl-Calix[4]arene. Part 15. Pb(II)-Ion-Selective Electrodes Based on p-tert -Butyl-calix[4]arene Thioamides](https://static.fdokumen.com/doc/165x107/6342a72ff9c0d1681b0ad302/lower-rim-substituted-p-tert-butyl-calix4arene-part-15-pbii-ion-selective.jpg)