Comprehensive Kinetic Model for the Degradation of Methyl tert Butyl Ether by an Ozone/UV Process
10
Subscriber access provided by SAN DIEGO STATE UNIV Industrial & Engineering Chemistry Research is published by the American Chemical Society. 1155 Sixteenth Street N.W., Washington, DC 20036 Article Comprehensive Kinetic Model for the Degradation of Methyl tert-Butyl Ether by an Ozone/UV Process Temesgen Garoma, and Mirat D. Gurol Ind. Eng. Chem. Res., 2008, 47 (20), 7654-7662 • DOI: 10.1021/ie800721t • Publication Date (Web): 13 September 2008 Downloaded from http://pubs.acs.org on February 2, 2009 More About This Article Additional resources and features associated with this article are available within the HTML version: • Supporting Information • Access to high resolution figures • Links to articles and content related to this article • Copyright permission to reproduce figures and/or text from this article
Transcript of Comprehensive Kinetic Model for the Degradation of Methyl tert Butyl Ether by an Ozone/UV Process

Subscriber access provided by SAN DIEGO STATE UNIV
Industrial & Engineering Chemistry Research is published by the AmericanChemical Society. 1155 Sixteenth Street N.W., Washington, DC 20036
Article
Comprehensive Kinetic Model for the Degradationof Methyl tert-Butyl Ether by an Ozone/UV Process
Temesgen Garoma, and Mirat D. GurolInd. Eng. Chem. Res., 2008, 47 (20), 7654-7662 • DOI: 10.1021/ie800721t • Publication Date (Web): 13 September 2008
Downloaded from http://pubs.acs.org on February 2, 2009
More About This Article
Additional resources and features associated with this article are available within the HTML version:
• Supporting Information• Access to high resolution figures• Links to articles and content related to this article• Copyright permission to reproduce figures and/or text from this article

Comprehensive Kinetic Model for the Degradation of Methyl tert-Butyl Ether byan Ozone/UV Process
Temesgen Garoma* and Mirat D. Gurol
CiVil, Construction, and EnVironmental Engineering Department, College of Engineering, San Diego StateUniVersity, 5500 Campanile DriVe, San Diego, California 92182
The paper presents a comprehensive kinetic model that describes the degradation of methyl tert-butyl ether(MTBE) in an ozone/UV process. First, the degradation pathways for MTBE were proposed on the basis ofmajor reaction intermediates identified during the oxidation of MTBE. The yield for each major reactionintermediate was determined by fitting experimental data to the model prediction. Accordingly, 43, 20, 15,11, and 6% of MTBE oxidized resulted in the generation of TBF, MMP, TBA, acetone, and methyl acetate,respectively. TBF oxidation resulted in the generation of HiBA, acetone, and TBA as primary intermediatesat 47, 24, and 20%, respectively. During the oxidation of TBA, 66% resulted in the generation of HiBA and34% in acetone. The kinetic model was verified using different sets of experimental data by varying theinitial concentration of MTBE, influent ozone gas concentration, and incident UV light intensity. The modelpredicted well the degradation of MTBE by an ozone/UV process. In addition, the model predicted theaccumulation and decay of primary intermediates (TBF, TBA, MMP, methyl acetate, and acetone) with slightvariations.
Introduction
Methyl tert-butyl ether (MTBE) was introduced in the late1970s and early 1980s as an antiknocking agent when lead wasphased out of gasoline. Since 1990, it has been used to fulfillthe fuel oxygenate requirements set by the U.S. Congress inthe Clean Air Act Amendment (CAAA). The CAAA mandatedcompounds that increase oxygen be added either in the winteror all year to gasoline in specific parts of the United States whereconcentrations of carbon monoxide in the winter or ozone inthe summer exceed established air quality standards. As a result,MTBE has escaped into the environment from leaking under-ground storage tanks or through accidental discharge.1,2 Oncein the environment, MTBE dissolves readily in water and moveseasily in urban stormwater, surface water, and groundwatersystems.
The widespread detection of MTBE in drinking water sources(surface water and groundwater) and treated water has causedgreat concern in the scientific communities and public healthagencies because MTBE is suspected as a possible humancarcinogen.3 Consequently, 25 states including California, whichaccounts for approximately 32% of U.S.’s MTBE consumption,have passed legislation that would completely ban or partiallyrestrict the use of MTBE in gasoline.4 However, MTBE thathas already been released into the environment will likelycontinue to degrade the groundwater and soils for several yearsto come because MTBE is known to degrade slowly bymicroorganisms.5-7
Several studies investigated the oxidation of MTBE usingbiodegradation,5-9 chemical oxidation,10 and advanced oxidationprocesses (AOPs).11-21 The objective of these studies was toestablish the degree of degradation of MTBE, to identify reactionintermediates, or in some cases to understand the reactionmechanisms. The main objective of the current study is todevelop a comprehensive kinetic model that describes thedegradation of MTBE during an ozone/UV treatment process.
The degradation of MTBE by an ozone/UV process has beeninvestigated by the authors.21
Approach
To establish the degradation pathways for MTBE, first MTBEwas oxidized in an ozone/UV process and major reactionintermediates were identified. The major reaction intermediatesidentified were also oxidized by an ozone/UV process underthe same experimental condition as for MTBE. Then, thedegradation pathways for MTBE were proposed on the basisof the major reaction intermediates identified and data reportedin the literature for the oxidation of some of the reactionintermediates using other AOPs which rely on hydroxyl radical(OH · ) as a main reaction mechanism. The kinetic model forthe degradation of MTBE was then developed on the basis ofthe proposed degradation pathways, and the yield for each majorintermediate was determined by fitting the experimental datato the model prediction. Finally, the kinetic model was verifiedusing different sets of experimental data by varying the initialconcentration of MTBE, influent ozone gas concentration, andincident UV light intensity.
As pointed out in the introduction, the oxidation of MTBEby an ozone/UV process have been investigated by theauthors.21 In the study, the reaction intermediates during theoxidation of MTBE were identified, and a good organiccarbon balance was obtained (Figure 8 of ref 21), indicatingthat most reaction intermediates have been identified andquantified. Readers are referred to prior publication21 for thedescription of the experimental setup and analytical methods.
Proposed Degradation Pathways
In the literature, degradation pathways for MTBE have beenreported using other AOPs, such as H2O2/UV,16 O3/H2O2,18 andTiO2 slurries;12 however, no information on the degradationpathways for MTBE is available for an ozone/UV process. Thedegradation of MTBE and its intermediates can be initiated bythe attack of an OH · at methyl (-CH3), methoxy (-OCH3),
* To whom correspondence should be addressed. E-mail: [email protected].
Ind. Eng. Chem. Res. 2008, 47, 7654–76627654
10.1021/ie800721t CCC: $40.75 2008 American Chemical SocietyPublished on Web 09/13/2008

formyl or carbonyl (-HCO), carboxyl (-COOH), and/or hydroxyl(-OH) groups.16,22-24 The structural formula for MTBE and itsintermediates are presented in Figure 1. The nomenclature foreach target chemical is provided in parenthesis.
Degradation Pathways for MTBE. Abstraction of H-atomsat one of the equivalent methyl groups or methoxy group ofMTBE could lead to the formation of 2-methoxy-2-methylpropionaldehyde (MMP) and tert-butyl formate (TBF), respec-tively. Additionally, abstraction of a methoxy group, two methylgroups, or methyl and methoxy group in MTBE could lead tothe generation of tert-butyl alcohol (TBA), methyl acetate, andacetone, respectively. The methyl (CH3
•) and methoxy (OCH3 · )radicals, formed as a result of these abstractions, lead to theformation of formaldehyde and formic acid through series ofreaction intermediates,25,26 and upon oxidation, formaldehydeleads to formic acid.27 Time profiles of products identified andpresented in Figure 7 of ref 21 during an ozone/UV treatmentof MTBE also reveal that TBF, TBA, MMP, methyl acetate,and acetone are primary reaction intermediates of MTBEoxidation. The proposed degradation pathway for MTBE issummarized in eq 1.
Degradation Pathways for TBA. The degradation of TBAcan be initiated by an OH · attack at any of the equivalent methylgroups or hydroxyl group and lead to the formation of hydroxy-iso-butyraldehyde (HiBA), acetone, formaldehyde, and formicacid. This agrees with time profiles of reaction intermediatesidentified and presented in Figure 9 of ref 28 during TBAoxidation using an ozone/UV process.
Degradation Pathways for TBF. The reaction intermediatesformed during an ozone/UV treatment tert-butyl formate (TBF)are presented in the Supporting Information. The degradationof TBF can be initiated by the attack of an OH · at any of theequivalent methyl groups or formyl group. Time profiles ofreaction intermediates formed during TBF oxidation indicatethat TBA, HiBA, acetone, formaldehyde, and formic acid arethe primary reaction intermediates.
Degradation Pathways for Methyl Acetate. An OH · attackat methyl or methoxy group of methyl acetate can generateacetic acid, oxalic acid, formaldehyde, and formic acid asprimary reaction intermediates. This is supported by time profilesof reaction intermediates identified during an ozone/UV treat-ment of methyl acetate. The time profiles are presented in theSupporting Information.
Degradation Pathways for Acetone. The reaction intermedi-ates formed during an ozone/UV treatment of acetone arepresented in the Supporting Information. An OH · attack at either
of the equivalent methyl groups in acetone can lead to theformation of pyruvaldehyde, acetic acid, formaldehyde, andformic acid.
Degradation of MMP and HiBA. For 2-methoxy-2-methylpropionaldehyde (MMP) and hydroxy-iso-butyraldehyde(HiBA), no product study was conducted since they are notcommercially available. The degradation of MMP could beinitiated by an OH · attack at methyl groups, methoxy group,or carbonyl group and lead to the generation of hydroxy-iso-butyraldehyde (HiBA), methyl acetate (MAC), acetone(AC), formaldehyde, and formic acid.16 The degradation ofHiBA can be initiated by an OH · attack at the methyl,carbonyl, or hydroxyl group and may lead to the formationof acetone, pyruvaldehyde, and formic acid.
Degradation Pathways for Other Intermediates. Thedegradation of other reaction intermediates, such as pyru-valdehyde, formaldehyde, and organic acids can be initiatedby OH · attack at methyl, carbonyl, carboxyl, or hydroxylgroup. The carbonyl and carboxyl radicals formed by theabstraction process can lead to the generation of carbondioxide.29
In eq 1 through eq 13, the proposed degradation pathwaysfor MTBE and its reaction intermediates are summarized. Inthese equations mass balance is provided only for the carbonatom.
(CH3)3COCH3(MTBE)
98OH· { (CH3)3COCHO
(TBF)
CCHO(CH3)2OCH3(MMP)
(CH3)3COH(TBA)
+HCHO ⁄ HCOOH(FAD⁄FOA)
(CH3)3COH(TBA)
+HCHO ⁄ HCOOH(FAD⁄FOA)
CH3COCH3(AC)
+ 2HCHO ⁄ HCOOH(FAD⁄FOA)
(1)
(CH3)3COCHO(TBF)
98OH· { (CH3)3COH
(TBA)+HCOOH
(FOA)
HOC(CH3)2CHO(HiBA)
+HCOOH(FOA)
CH3COCH3(AC)
+HCHO(FAD)
+HCOOH(FOA)
(2)
CCHO(CH3)2OCH3(MMP)
98OH·
{ HOC(CH3)2CHO(HiBA)
+HCHO ⁄ HCOOH(FAD⁄FOA)
CH3COOCH3(MAC)
+HCHO ⁄ HCOOH(FAD⁄FOA)
+CO2
CH3COCH3(AC)
+HCHO ⁄ HCOOH(FAD⁄FOA)
+CO2
(3)
(CH3)3COH(TBA)
98OH· { HOC(CH3)2CHO
(HiBA)
CH3COCH3(AC)
+HCHO ⁄ HCOOH(FAD⁄FOA)
(4)
HOC(CH3)2CHO(HiBA)
98OH· { CH3COCH3
(AC)+CO2
CH3COCOH(PYD)
+HCHO ⁄ HCOOH(FAD⁄FOA)
(5)
CH3COOCH3(MAC)
98OH· { CH3COOH
(ACA)+HCHO ⁄ HCOOH
(FAD⁄FOA)
HOCOCOOH(OXA)
+HCHO ⁄ HCOOH(FAD⁄FOA)
(6)
CH3COCH3(AC)
98OH· { CH3COCOH
(PYD)
CH3COOH(ACA)
+HCHO ⁄ HCOOH(FAD⁄FOA)
(7)
Figure 1. Structural formula of MTBE and its reaction intermediates.
Ind. Eng. Chem. Res., Vol. 47, No. 20, 2008 7655

CH3COCOH(PYD)
98OH· { CH3COCOOH
(PYA)
CH3COOH(ACA)
+CO2
HCHO ⁄ HCOOH(FAD⁄FOA)
+ 2CO2
(8)
CH3COCOOH(PYA)
98OH· { CH3COOH
(ACA)+CO2
HCHO ⁄ HCOOH(FAD⁄FOA)
+ 2CO2(9)
CH3COOH(ACA)
98OH· { HOCOCOOH
(OXA)
HCHO ⁄ HCOOH(FAD⁄FOA)
+CO2(10)
HCHO(FAD)98OH·
HCOOH(FOA)
(11)
HCOOH(FOA)98OH·
CO2 (12)
HOCOCOOH(OXA)
98OH·
2CO2 (13)
The Comprehensive Kinetic Model
On the basis of the proposed degradation pathways discussedin the previous section and summarized in eqs 1 through 13,the overall rate of change in the concentration of MTBE andits reaction intermediates in a completely mixed batch reactorcan be represented by the following expressions. It is well-known that the reaction of an OH · with organic compounds issecond-order overall.30 In the current study, the ozone/UVsystem was designed to result in an aqueous ozone concentrationbelow the minimum detectable limit of 5 µg/L by the Indigomethod.31 In addition, the reactivity of molecular ozone towardMTBE and its reaction intermediates is very low compared tothat of OH · .18 Therefore, the reaction of OH · with MTBE andits reaction intermediates is the main mechanism through whichthey are oxidized in the ozone/UV process.
d[MTBE]dt
)-kMTBE[OH · ][MTBE] (14)
d[TBF]dt
) l1kMTBE[OH · ][MTBE]- kTBF[OH · ][TBF] (15)
d[MMP]dt
) l2kMTBE[OH · ][MTBE]- kMMP[OH · ][MMP] (16)
d[TBA]dt
) l3kMTBE[OH · ][MTBE]+m1kTBF[OH · ][TBF]-
kTBA[OH · ][TBA] (17)
d[HiBA]dt
)m2kTBF[OH · ][TBF]+ n1kMMP[OH · ][MMP]+
p1kTBA[OH · ][TBA]- kHiBA[OH · ][HiBA] (18)
d[MAC]dt
) l4kMTBE[OH · ][MTBE]+ n2kMMP[OH · ][MMP]-
kMAC[OH · ][MAC] (19)
d[AC]dt
) l5kMTBE[OH · ][MTBE]+m3kTBF[OH · ][TBF]+
n3kMMP[OH · ][MMP]+ p2kTBA[OH · ][TBA]+q1kHiBA[OH · ][HiBA]- kAC[OH · ][AC] (20)
d[PYD]dt
) q2kHiBA[OH · ][HiBA]+ s1kAC[OH · ][AC]-
kPYD[OH · ][PYD] (21)
d[PYA]dt
) t1kPYD[OH · ][PYD]- kPYA[OH · ][PYA] (22)
d[ACA]dt
) r1kMAC[OH · ][MAC]+ s2kAC[OH · ][AC]+
t2kPYD[OH · ][PYD]+ u1kPYA[OH · ][PYA]- kACA[OH · ][ACA]
(23)
d[FAD]dt
) a1kMTBE[OH · ][MTBE]+ b1kTBF[OH · ][TBF]+
c1kMMP[OH · ][MMP]+ d1kTBA[OH · ][TBA]+e1kHiBA[OH · ][HiBA]+ f1kMAC[OH · ][MAC]+
g1k[OH · ]AC[AC]+ t3kPYD[OH · ][PYD]+u2kPYA[OH · ][PYA]+V2kACA[OH · ][ACA]-
kFAD[OH · ][FAD] (24)
d[FOA]dt
) a2kMTBE[OH · ][MTBE]+ b2kTBF[OH · ][TBF]+
c2kMMP[OH · ][MMP]+ d2kTBA[OH · ][TBA]+e2kHiBA[OH · ][HiBA]+ f2kMAC[OH · ][MAC]+
g2kAC[OH · ][AC]+ t4k[OH · ]PYD[PYD]+u3kPYA[OH · ][PYA]+V3kACA[OH][ACA]+
kFAD[OH · ][FAD]- kFOA[OH · ][FOA] (25)
d[OXA]dt
) r2kMAC[OH · ][MAC]+V1kACA[OH · ][ACA]-
kOXA[OH · ][OXA] (26)
where kMTBE, kTBF, kMMP, etc., are the second-order rate constantsfor the reaction of OH · with MTBE, TBF, MMP, etc., and thevalues reported in the literature and summarized in Table 1 areused. li, mi, ni, pi, qi, ri, si, ti, ui, and Vi represent the yield of reactionintermediates generated from carbon-centered parent chemicals,such as MTBE, TBF, MMP, TBA, HiBA, MAC, AC, PYD, PYA,and ACA, respectively, while ai, bi, ci, di, ei, fi, and gi representthe yield of reaction intermediates generated from methyl ormethoxy groups of MTBE, TBF, MMP, TBA, HiBA, MAC, andAC, respectively. All yield factors are determined by fittingexperimental data to model predictions in the next section.
Calibration of the Kinetic Model
To predict the degradation of MTBE and its intermediatesby an ozone/UV process for given influent ozone gas concentra-tion, incident UV light intensity, and water quality parameters,such as pH and bicarbonate concentration, the kinetic modeldeveloped for aqueous ozone photolysis by the authors40 andpresented in eqs 27-30 below were coupled with eqs 14-26and solved numerically. Detailed derivation of eqs 27-30,description of parameters, and sensitivity of the model tooperational and process parameters are provided in the refer-enced publication.40
The systems of ODEs were solved numerically using ode15s,an ODE solver available in MATLAB. Ode15s is a stiff and avariable-step solver based on the numerical differentiationformula. The variable-step feature allows ode15s to control errorby varying the step size during the simulation, reducing the stepsize to increase accuracy when a model’s values are changingrapidly and increasing the step size to avoid taking unnecessarysteps when the model’s values are changing slowly.
d[O3]
dt) nO3
- k[O3]1[OH-]-ΦPIa - 2k2∗[O3][H2O2]-
2k6[O3][OH · ]- k7∗[H2O2][OH · ]- k9
∗[OH · ][HCO3-]-
∑ kdi[O3][Mi] (27)
7656 Ind. Eng. Chem. Res., Vol. 47, No. 20, 2008

d[H2O2]
dt) γ1{k1[O3][OH-]+ΦPIa -ΦP
′ Ia′ - k2
∗[O3][H2O2]-
k7∗[H2O2][OH · ]- k9
∗[OH · ][HCO3-]} (28)
d[OH · ]dt
) 2ΦP′ Ia
′ + 2k2∗[O3][H2O2]-∑ kbi[Mi][OH · ]-
∑ kj[Sj][OH · ] (29)
The values of the yield factors were estimated by fittingexperimental data to the model predictions using lsqcurvefit,an optimization function available in MATLAB. To estimatethe values of each parameter set, two sets of experimental dataconducted under different experimental conditions were usedand the values were averaged. For each set, the initialconcentration of the target chemical, influent ozone gas con-centration, and incident UV light intensity were varied whilethe alkalinity, initial pH, and ozone gas flow rate were keptconstant at 2 mM, 7.0, and 1.5 L/min, respectively. Theexperimental conditions for the data sets used in the calibrationof the model are presented in Table 2.
The parameters (ri and fi) and Vi, which represent the yieldof intermediates from methyl acetate and acetic acid, respec-tively, were first estimated by using experimental data obtainedfrom the oxidation of methyl acetate. No experimental data wasavailable for acetic acid; however, the experimental data frommethyl acetate was used since acetic acid is the primarydegradation product of methyl acetate. By using this experi-mental data, the computer program iteratively found the bestestimates of ri, fi, and Vi by simultaneously optimizing thedifference between experimental data and model predictions formethyl acetate, acetic acid, formaldehyde, formic acid, andoxalic acid. The range and average values of ri, fi, and Vi obtainedfrom two sets of experimental data are presented in Table 3.
Next the values of si, gi, ti, and ui were estimated by usingexperimental data obtained from oxidation of acetone. Here the
computer program used previously fixed value of Vi andexperimental data obtained from oxidation of acetone tooptimize the difference between experimental data and modelpredictions for acetone, pyruvaldehyde, pyruvic acid, acetic acid,formaldehyde, formic acid, and oxalic acid. The estimated valuesof si, gi, ti, and ui are presented in Table 3.
Similarly, to estimate the parameters pi, di, qi, and ei,experimental data from the oxidation of TBA and previouslyfixed values of Vi, si, gi, ti, and ui were used. Then theexperimental data on TBF was used to estimate the yield factorsmi and bi. Finally, the yield factors li, ai, ni, and ci were estimatedby fitting experimental data obtained from the oxidation ofMTBE to model predictions. In Table 3, the range and averageof all estimated yield factors are summarized.
It is expected the yield factors for intermediates formed fromthe parent chemical add up to 1. For MTBE, the yield factors
Table 1. Reaction Rate Constants with OH · for MTBE and ItsReaction Intermediates
chemicals molecular structure k (M-1 s-1) reference
MTBE (CH3)3COCH3 3.9 ×10⁹ 14TBF (CH3)3COCHO 1.2 ×10⁹ 14TBA (CH3)3COH 7.6 ×10⁸ 32MMP CCHO(CH3)2OCH3 3.0 ×10⁹ 18HiBA HOC(CH3)2CHO 3.0 ×10⁹ 18MAC CH3COOCH3 1.2 ×10⁸ 33AC CH3COCH3 1.4 ×10⁸ 34FAD HCHO 1.0 ×10⁹ 35PYD CH3COCOH 7.0 ×10⁸ 35ACA CH3COOH 1.0 ×10⁸ 36FOA HCOOH 2.2 ×10⁹ 37OXA HOCOCOOH 5.3 ×10⁶ 38PYA CH3COCOOH 3.1 ×10⁷ 39
Table 2. Experimental Conditions for Data Used in ModelCalibrations
targetchemical
initialconcentration
(mM)
influentozone gas
concentration (mg/L)
incidentUV light
intensity (E/L-s)
MTBE 1.02 37 5.8 ×10⁻⁶
0.96 50 9.0 ×10⁻⁶
TBF 1.03 40 5.8 ×10⁻⁶
0.95 51 9.0 ×10⁻⁶
TBA 1.07 40 5.8 ×10⁻⁶
1.42 67 9.0 ×10⁻⁶
MAC 1.01 40 5.8 ×10⁻⁶
1.42 57 9.0 ×10⁻⁶
AC 0.85 40 5.8 ×10⁻⁶
1.43 54 9.0 ×10⁻⁶
Table 3. Estimated Yield Factors
parentcompound intermediates
range(%)
average(%)
(CH3)3COCH3
(MTBE)(CH3)3COCHO (TBF)a l1 ) 40-45 l1 ) 43
CCHO(CH3)2OCH3 (MMP)a l2 ) 18-22 l2 ) 20(CH3)3COH (TBA)a l3 ) 12-18 l3 ) 15CH3COOCH3 (MAC)a l4 ) 5-6 l4 ) 6CH3COCH3 (AC)a l5 ) 10-12 l5 ) 11HCHO (FAD) a1 ) 5-8 a1 ) 7HCOOH (FOA) a2 ) 21-25 a2 ) 23
(CH3)3COCHO(TBF)
(CH3)3COH (TBA)a m1 ) 19-20 m1 ) 20
HOC(CH3)2CHO (HiBA)a m2 ) 45-49 m2 ) 47CH3COCH3 (AC)a m3 ) 22-26 m3 ) 24HCHO (FAD) b1 ) 10 b1 ) 10HCOOH (FOA) b2 ) 95 b2 ) 95
CCHO(CH3)2OCH3
(MMP)HOC(CH3)2CHO (HiBA)a n1 ) 72-75 n1 ) 75
CH3COOCH3 (MAC)a n2 ) 10-12 n2 ) 11CH3COCH3 (AC)a n3 ) 10-15 n3 ) 13HCHO (FAD) c1 ) 10-13 c1 ) 12HCOOH (FOA) c2 ) 48-54 c2 ) 51
(CH3)3COH (TBA) HOC(CH3)2CHO (HiBA)a p1 ) 62-70 p1 ) 66CH3COCH3 (AC)a p2 ) 30-38 p2 ) 34HCHO (FAD) d1 ) 17-21 d1 ) 19HCOOH (FOA) d2 ) 10-12 d2 ) 11
HOC(CH3)2CHO(HiBA)
CH3COCH3 (AC)a q1 ) 24-30 q1 ) 27
CH3COCOH (PYD)a q2 ) 60 q2 ) 60HCHO (FAD) e1 ) 27-35 e1 ) 31HCOOH (FOA) e2 ) 24-28 e2 ) 26
CH3COOCH3
(MAC)CH3COOH (ACA)a r1 ) 55-68 r1 ) 62
HOCOCOOH (OXA)a r2 ) 13-18 r2 ) 16HCHO (FAD) f1 ) 40-41 f1 ) 41HCOOH (FOA) f2 ) 60-61 f2 ) 61
CH3COCH3 (AC) CH3COCOH (PYD)a s1 ) 16-46 s1 ) 31CH3COOH (ACA)a s2 ) 45-45 s2 ) 45HCHO (FAD) g1 ) 22-56 g1 ) 39HCOOH (FOA) g2 ) 18-41 g2 ) 30
CH3COCOH(PYD)
CH3COCOOH (PYA)a t1 ) 8-15 t1 ) 12
CH3COOH (ACA)a t2 ) 71-81 t2 ) 76HCHO (FAD)a t3 ) 3-5 t3 ) 4HCOOH (FOA)a t4 ) 8-9 t4 ) 9
CH3COCOOH(PYA)
CH3COOH (ACA)a u1 ) 100 u1 ) 100
HCHO (FAD) u2 ) 0 u2 ) 0HCOOH (FOA) u3 ) 0 u3 ) 0
CH3COOH (ACA) HOCOCOOH (OXA)a V1 ) 25-29 V1 ) 27HCHO (FAD)a V2 ) 25-27 V2 ) 26HCOOH (FOA)a V3 ) 46-48 V3 ) 47
HCHO (FAD) HCOOH (FOA)a 100 100
a Primary intermediates.
Ind. Eng. Chem. Res., Vol. 47, No. 20, 2008 7657
(averaged values) were as follows: l1 ) 0.43, l2 ) 0.20, l3 )0.15, l4 ) 0.06, and l5 ) 0.11, which added up to 0.95. Theyield factors for TBA (p1 ) 0.66 and p2 ) 0.34) added up to 1.For TBF, MMP, and HiBA the yield factors added up to 0.91,0.99, and 0.87, respectively. For simple structure chemicals, suchas methyl acetate and acetone, the yield factors added up onlyto 0.78 and 0.76, respectively. This is likely due to simultaneousabstraction of the methyl or methoxy groups in these chemicalsby OH · and the formation carbon dioxide directly from the
carbon atom at the center of the structure ( - c -|
).On the other hand, the yield factors for intermediates formed
from methyl or methoxy radicals may not necessarily add upto 1. For example, during TBA oxidation, HiBA and acetoneare expected to be generated (eq 4). It is only during theformation of acetone that a methyl radical is generated. Thus,the yield factors for formaldehyde (d1 ) 0.19) and formic acid(d2 ) 0.11) from the oxidation of TBA are expected to add upto the yield factor of acetone (p2 ) 0.34).
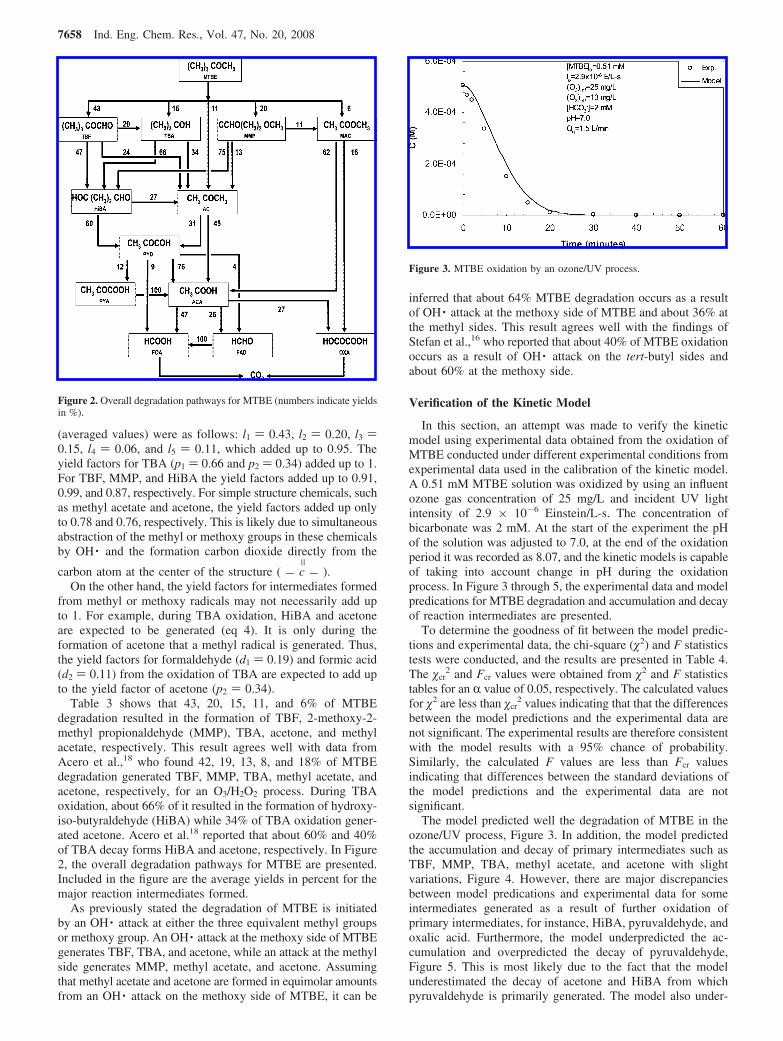
Table 3 shows that 43, 20, 15, 11, and 6% of MTBEdegradation resulted in the formation of TBF, 2-methoxy-2-methyl propionaldehyde (MMP), TBA, acetone, and methylacetate, respectively. This result agrees well with data fromAcero et al.,18 who found 42, 19, 13, 8, and 18% of MTBEdegradation generated TBF, MMP, TBA, methyl acetate, andacetone, respectively, for an O3/H2O2 process. During TBAoxidation, about 66% of it resulted in the formation of hydroxy-iso-butyraldehyde (HiBA) while 34% of TBA oxidation gener-ated acetone. Acero et al.18 reported that about 60% and 40%of TBA decay forms HiBA and acetone, respectively. In Figure2, the overall degradation pathways for MTBE are presented.Included in the figure are the average yields in percent for themajor reaction intermediates formed.
As previously stated the degradation of MTBE is initiatedby an OH · attack at either the three equivalent methyl groupsor methoxy group. An OH · attack at the methoxy side of MTBEgenerates TBF, TBA, and acetone, while an attack at the methylside generates MMP, methyl acetate, and acetone. Assumingthat methyl acetate and acetone are formed in equimolar amountsfrom an OH · attack on the methoxy side of MTBE, it can be
inferred that about 64% MTBE degradation occurs as a resultof OH · attack at the methoxy side of MTBE and about 36% atthe methyl sides. This result agrees well with the findings ofStefan et al.,16 who reported that about 40% of MTBE oxidationoccurs as a result of OH · attack on the tert-butyl sides andabout 60% at the methoxy side.
Verification of the Kinetic Model
In this section, an attempt was made to verify the kineticmodel using experimental data obtained from the oxidation ofMTBE conducted under different experimental conditions fromexperimental data used in the calibration of the kinetic model.A 0.51 mM MTBE solution was oxidized by using an influentozone gas concentration of 25 mg/L and incident UV lightintensity of 2.9 × 10⁻⁶ Einstein/L-s. The concentration ofbicarbonate was 2 mM. At the start of the experiment the pHof the solution was adjusted to 7.0, at the end of the oxidationperiod it was recorded as 8.07, and the kinetic models is capableof taking into account change in pH during the oxidationprocess. In Figure 3 through 5, the experimental data and modelpredications for MTBE degradation and accumulation and decayof reaction intermediates are presented.
To determine the goodness of fit between the model predic-tions and experimental data, the chi-square (�2) and F statisticstests were conducted, and the results are presented in Table 4.The �cr
2 and Fcr values were obtained from �2 and F statisticstables for an R value of 0.05, respectively. The calculated valuesfor �2 are less than �cr
2 values indicating that that the differencesbetween the model predictions and the experimental data arenot significant. The experimental results are therefore consistentwith the model results with a 95% chance of probability.Similarly, the calculated F values are less than Fcr valuesindicating that differences between the standard deviations ofthe model predictions and the experimental data are notsignificant.
The model predicted well the degradation of MTBE in theozone/UV process, Figure 3. In addition, the model predictedthe accumulation and decay of primary intermediates such asTBF, MMP, TBA, methyl acetate, and acetone with slightvariations, Figure 4. However, there are major discrepanciesbetween model predications and experimental data for someintermediates generated as a result of further oxidation ofprimary intermediates, for instance, HiBA, pyruvaldehyde, andoxalic acid. Furthermore, the model underpredicted the ac-cumulation and overpredicted the decay of pyruvaldehyde,Figure 5. This is most likely due to the fact that the modelunderestimated the decay of acetone and HiBA from whichpyruvaldehyde is primarily generated. The model also under-
Figure 2. Overall degradation pathways for MTBE (numbers indicate yieldsin %).
Figure 3. MTBE oxidation by an ozone/UV process.
7658 Ind. Eng. Chem. Res., Vol. 47, No. 20, 2008

predicted the accumulation of formaldehyde. This could be dueto a possible underestimation of the yield factors of formalde-hyde from MTBE and/or its primary intermediates. Overall, themodel prediction results are reasonable given the large numberof parameters fitted in the model.
The sensitivity of the kinetic model to operational conditions,such as incident UV light intensity, influent ozone gas concen-tration, and water quality in terms of bicarbonate and pH, aswell as process parameters, such as effective path length forUV light, has been presented elsewhere.40
The model could provide valuable insight into the design ofexperiments and AOPs for the oxidation of MTBE and itsintermediates. Figure 6a and 6b present the simulation for theoxidation of 0.5 mM of MTBE solution in an ozone/UV processusing an influent ozone gas concentration of 48 mg/L and incident
Figure 4. Accumulation and decay of primary intermediates during oxidation of MTBE.
Table 4. �-Square and F Statistics Tests
chi-square test F-test
�2 �cr2 F Fcr
MTBE 3.61 × 10⁻² 16.92 3.41 × 10⁻² 4.35TBF 5.00 × 10⁻⁵ 16.92 3.93 × 10⁻² 4.35MMP 6.37 × 10⁻⁶ 16.92 1.25 × 10⁻² 4.35TBA 6.68 × 10⁻⁵ 16.92 1.84 × 10⁻⁴ 4.35HiBA 3.95 × 10⁻⁵ 16.92 2.60 × 10⁻³ 4.35MAC 1.52 × 10⁻⁵ 16.92 4.00 × 10⁻³ 4.35AC 1.16 × 10-04 16.92 1.90 × 10⁻³ 4.35PYD 8.05 × 10⁻⁵ 16.92 9.18 × 10⁻² 4.35PYA 1.01 × 10⁻⁵ 16.92 3.90 × 10⁻³ 4.35ACA 6.83 × 10⁻⁴ 16.92 9.26 × 10⁻⁴ 4.35FAD 1.75 × 10⁻⁴ 16.92 7.05 × 10⁻¹ 4.35FOA 1.07 × 10⁻⁴ 16.92 1.60 × 10⁻¹ 4.35OXA 8.75 × 10⁻² 16.92 3.70 × 10⁻¹ 4.35
Ind. Eng. Chem. Res., Vol. 47, No. 20, 2008 7659

Figure 5. Accumulation and decay of secondary/tertiary intermediates during oxidation of MTBE.
7660 Ind. Eng. Chem. Res., Vol. 47, No. 20, 2008
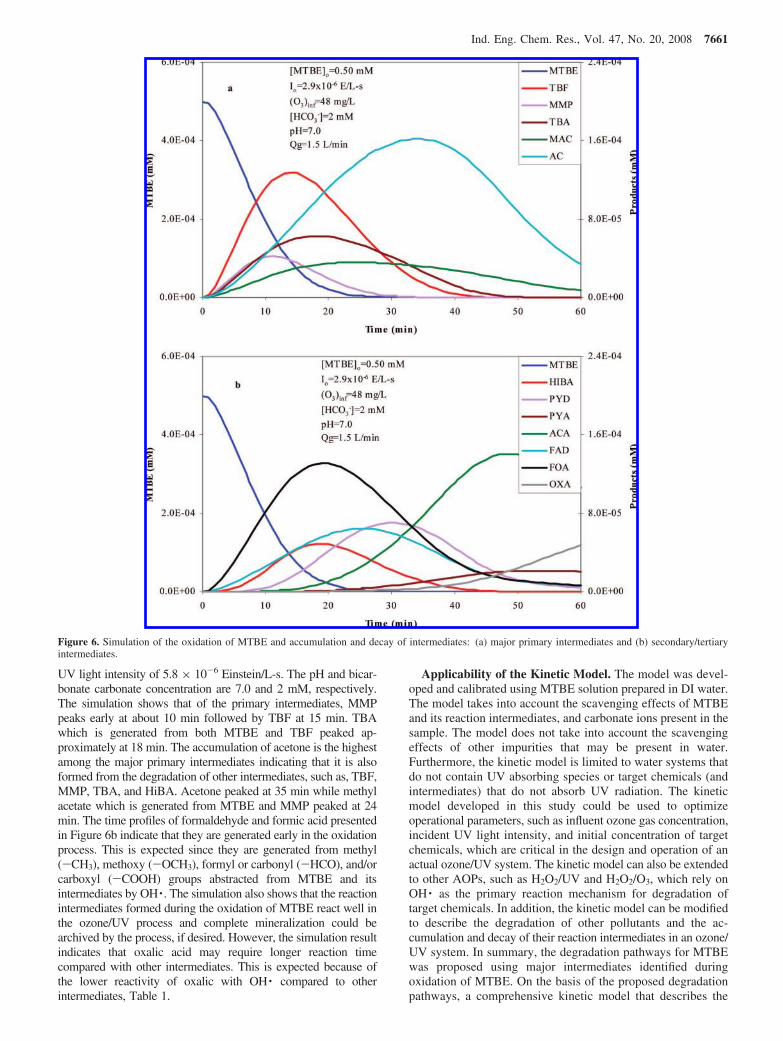
UV light intensity of 5.8 × 10⁻⁶ Einstein/L-s. The pH and bicar-bonate carbonate concentration are 7.0 and 2 mM, respectively.The simulation shows that of the primary intermediates, MMPpeaks early at about 10 min followed by TBF at 15 min. TBAwhich is generated from both MTBE and TBF peaked ap-proximately at 18 min. The accumulation of acetone is the highestamong the major primary intermediates indicating that it is alsoformed from the degradation of other intermediates, such as, TBF,MMP, TBA, and HiBA. Acetone peaked at 35 min while methylacetate which is generated from MTBE and MMP peaked at 24min. The time profiles of formaldehyde and formic acid presentedin Figure 6b indicate that they are generated early in the oxidationprocess. This is expected since they are generated from methyl(-CH3), methoxy (-OCH3), formyl or carbonyl (-HCO), and/orcarboxyl (-COOH) groups abstracted from MTBE and itsintermediates by OH · . The simulation also shows that the reactionintermediates formed during the oxidation of MTBE react well inthe ozone/UV process and complete mineralization could bearchived by the process, if desired. However, the simulation resultindicates that oxalic acid may require longer reaction timecompared with other intermediates. This is expected because ofthe lower reactivity of oxalic with OH · compared to otherintermediates, Table 1.
Applicability of the Kinetic Model. The model was devel-oped and calibrated using MTBE solution prepared in DI water.The model takes into account the scavenging effects of MTBEand its reaction intermediates, and carbonate ions present in thesample. The model does not take into account the scavengingeffects of other impurities that may be present in water.Furthermore, the kinetic model is limited to water systems thatdo not contain UV absorbing species or target chemicals (andintermediates) that do not absorb UV radiation. The kineticmodel developed in this study could be used to optimizeoperational parameters, such as influent ozone gas concentration,incident UV light intensity, and initial concentration of targetchemicals, which are critical in the design and operation of anactual ozone/UV system. The kinetic model can also be extendedto other AOPs, such as H2O2/UV and H2O2/O3, which rely onOH · as the primary reaction mechanism for degradation oftarget chemicals. In addition, the kinetic model can be modifiedto describe the degradation of other pollutants and the ac-cumulation and decay of their reaction intermediates in an ozone/UV system. In summary, the degradation pathways for MTBEwas proposed using major intermediates identified duringoxidation of MTBE. On the basis of the proposed degradationpathways, a comprehensive kinetic model that describes the
Figure 6. Simulation of the oxidation of MTBE and accumulation and decay of intermediates: (a) major primary intermediates and (b) secondary/tertiaryintermediates.
Ind. Eng. Chem. Res., Vol. 47, No. 20, 2008 7661

degradation of MTBE and its intermediates by an ozone/UVprocess was described. By using experimental data on MTBEand its intermediates, the kinetic model was calibrated by fittingexperimental data with model predictions. Accordingly, 43, 20,15, 11, and 6% of MTBE oxidized resulted in the generationof TBF, MMP, TBA, acetone, and methyl acetate, respectively.TBF oxidation resulted in the generation of HiBA, acetone, andTBA as primary intermediates at 47, 24, and 20%, respectively.During the oxidation of TBA, 66% resulted in the generationof HiBA and 34% in acetone. An attempt was made to verifythe kinetic model using different sets of experimental data onMTBE. The model predicted well the removal of MTBE. Inaddition, the model predicted the accumulation and decay ofprimary intermediates with slight variations.
Supporting Information Available: Reaction intermediatesidentified during an ozone/UV treatment of tert-butyl formate(TBF), methyl acetate, and acetone. This material is availablefree of charge via the Internet at http://pubs.acs.org.
Literature Cited
(1) Mehlman, M. A. Dangerous and cancer-causing properties ofproducts and chemicals in the oil refining and petrochemical industry 0.15.Health-hazards and health risks from oxygenated automobile fuels (MTBE)-Lessons not heeded. Int. J. Occup. Med. Toxicol. 1995, 4, 219–236.
(2) Gullick, R. W.; LeChevallier, M. Occurrence of MTBE in drinkingwater sources. J. Am. Water Works Assoc. 2000, 92, 100–113.
(3) Mehlman, M. A. Carcinogenicity of methyl-tertiary butyl ether ingasoline. Carcinog. Bioassays Prot. Public Health 2002, 982, 149–159.
(4) USEPA, State Actions Banning MTBE (Statewide): EPA-420-B-04-009, Washington, DC, 2004, http://www.epa.gov/mtbe/420b04009.pdf.
(5) Suflita, J. M.; Mormile, M. R. Anaerobic biodegradation of knownand potential gasoline oxygenates in the terrestrial subsurface. EnViron. Sci.Technol. 1993, 27, 976–978.
(6) Salanitro, J. P.; Diaz, L. A.; Williams, M. P.; Wisniewski, H. L.Isolation of a bacterial culture that degrades methyl t-butyl ether. Appl.EnViron. Microbiol. 1994, 60, 2593–2596.
(7) Steffan, R. J.; McClay, K.; Vainberg, S.; Condee, C. W.; Zhang,D. L. Biodegradation of the gasoline oxygenates methyl tert-butyl ether,ethyl tert-butyl ether, and tert-amyl methyl ether by propane-oxidizingbacteria. Appl. EnViron. Microbiol. 1997, 63, 4216–4222.
(8) Hickman, G. T.; Novak, J. T. Relationship between subsurfacebiodegradation rates and microbial density. EnViron. Sci. Technol. 1989,23, 525–532.
(9) Bradley, P. M.; Landmeyer, J. E.; Chapelle, F. H. Aerobicmineralization of MTBE and tert-butyl alcohol by stream-bed sedimentmicroorganisms. EnViron. Sci. Technol. 1999, 33, 1877–1879.
(10) Damm, J. H.; Hardacre, C.; Kalin, R. M.; Walsh, K. P. Kinetics ofthe oxidation of methyl tert-butyl ether (MTBE) by potassium permanganate.Water Res. 2002, 36, 3638–3646.
(11) Wagler, J. L.; Malley, J. P. The Removal of methyl tertiary-butylether from a model groundwater using UV/peroxide oxidation. J. NewEngland Water Works Assoc. 1994, 108, 236.
(12) Barreto, R. D.; Gray, K. A.; Anders, K. Photocatalytic degradationof methyl-tert-butyl ether in TiO2 slurriessa proposed reaction scheme.Water Res. 1995, 29, 1243–1248.
(13) Liang, S.; Palencia, L. S.; Yates, R. S.; Davis, M. K.; Bruno, J. M.;Wolfe, R. L. Oxidation of MTBE by ozone and peroxone processes. J. Am.Water Works Assoc. 1999, 91, 104–114.
(14) Chang, P. B. L.; Young, T. M. Kinetics of methyl tert-butyl etherdegradation and by-product formation during UV/hydrogen peroxide watertreatment. Water Res. 2000, 34, 2233–2240.
(15) Cater, S. R.; Stefan, M. I.; Bolton, J. R.; Safarzadeh-Amiri, A. UV/H2O2 treatment of methyl tert-butyl ether in contaminated waters. EnViron.Sci. Technol. 2000, 34, 659–662.
(16) Stefan, M. I.; Mack, J.; Bolton, J. R. Degradation pathways duringthe treatment of methyl tert-butyl ether by the UV/H2O2 process. EnV. Sci.Technol. 2000, 34, 650–658.
(17) Safarzadeh-Amiri, A. O3/H2O2 Treatment of methyl-tert-butyl ether(MTBE) in contaminated waters. Water Res. 2001, 35, 3706–3714.
(18) Acero, J. L.; Haderlein, S. B.; Schmidt, T. C.; Suter, M. J. F.; VonGunten, U. MTBE oxidation by conventional ozonation and the combinationozone/hydrogen peroxide: Efficiency of the processes and bromate forma-tion. EnViron. Sci. Technol. 2001, 35, 4252–4259.
(19) Mitani, M. M.; Keller, A. A.; Bunton, C. A.; Rinker, R. G.; Sandall,O. C. Kinetics and products of reactions of MTBE with ozone and ozone/hydrogen peroxide in water. J. Hazard. Mater. 2002, 89, 197–212.
(20) Burbano, A. A.; Dionysiou, D. D.; Richardson, T. L.; Suidan, M. T.Degradation of MTBE intermediates using Fenton’s reagent. J. EnViron.Eng. 2002, 128, 7.
(21) Garoma, T.; Gurol, M. D. Oxidation of methyl tert-butyl ether inaqueous solution by an ozone/UV process. J. EnViron. Eng., ASCE 2006,132, 1404–1412.
(22) Asmus, K. D.; Mockel, H.; Henglein, A. Pulse radiolytic study ofsite of oh radical attack on aliphatic alcohols in aqueous-solution. J. Phys.Chem. 1973, 77, 1218–1221.
(23) Schuchmann, M. N.; Sonntag, C. V. Radiation-chemistry of alcohols0.22. Hydroxyl radical-induced oxidation of 2-methyl-2-propanol in oxygen-ated aqueous-solutionsproduct and pulse-radiolysis study. J. Phys. Chem.1979, 83, 780–784.
(24) Schuchmann, M. N.; Vonsonntag, C. Hydroxyl radical inducedoxidation of diethyl-ether in oxygenated aqueous-solutionsa product andpulse-radiolysis study. J. Phys. Chem. 1982, 86 (11), 1995–2000.
(25) Rabani, J.; Klugroth, D.; Henglein, A. Pulse radiolytic investigationsof OHCH2O2 radicals. J. Phys. Chem. 1974, 78, 2089–2093.
(26) Stevens, G. C.; Hart, E. J.; Clarke, R. M. radiolysis of aqueousmethane solutions. J. Phys. Chem. 1972, 76, 3863.
(27) Chin, M.; Wine, P. H. A temperature-dependent competitive kineticsstudy of the aqueous-phase reactions of OH Radicals with formate, formicacid, acetate, acetic acid, and hydrated formaldehyde. In Aquatic and SurfacePhotochemistry; Helz, G. R, Zepp, R. G., Crosby, D. G., Eds; LewisPublishers: Boca Raton, FL, 1994; pp 85-96.
(28) Garoma, T.; Gurol, M. D. Degradation of tert-butyl alcohol in diluteaqueous solution by an O3/UV process. EnViron. Sci. Technol. 2004, 38,5246–5252.
(29) Ilan, Y.; Rabani, J. Some fundamental reactions in radiation-chemistrysnanosecond pulse-radiolysis. Int. J. Radiat. Phys. Chem. 1976,8, 609–611.
(30) Hoigne, J.; Bader, H. Role of hydroxyl radical reactions in ozonationprocesses in aqueous-solutions. Water Res. 1976, 10, 377–386.
(31) Bader, H.; Hoigne, J. Determination of ozone in water by the indigomethod. Water Res. 1981, 15, 449–456.
(32) Gordon, S.; Schmidt, K. H.; Hart, E. J. Pulse-radiolysis study ofaqueous benzene solutions. J. Phys. Chem. 1977, 81, 104–109.
(33) Onal, G. Mechanical buckling behavior of hybrid laminatedcomposite plates with inclined crack. J. Reinf. Plast. Compos. 2006, 25,1535–1544.
(34) Willson, R. L.; Greenstock, C. L.; Adams, G. E.; Wageman, R.;Dorfman, L. M. Standardization of hydroxyl radical rate data from radiationchemistry. Int. J. Radiat. Phys. Chem. 1971, 3, 211.
(35) Buxton, G. V.; Greenstock, C. L.; Helman, W. P.; Ross, A. B.Critical-review of rate constants for reactions of hydrated electrons,hydrogen-atoms and hydroxyl radicals ( ·OH/ ·O-) in aqueous-solution. J.Phys. Chem. Ref. Data 1988, 17, 513–886.
(36) Fisher, M. M.; Hamill, W. H. Electronic processes in pulse-irradiatedaqueous and alcoholic systems. J. Phys. Chem. 1973, 77, 171–177.
(37) Baxendale, J. H.; Khan, A. A. Pulse radiolysis of nitrosodimethy-laniline in aqueous solution. Int. J. Radiat. Phys. Chem. 1969, 1, 11–24.
(38) Getoff, N.; Schworer, F.; Markovic, V. M.; Sehested, K.; Nielsen, S. O.Pulse radiolysis of oxalic acid and oxalates. J. Phys. Chem. 1971, 75, 749.
(39) Kraljic, I. Kinetics of hydroxyl radical reactions in radiolysis,photolysis and the Fenton system. Chem. Ion. Excit. Proc. Conf. Radiat.Chem. Photochem. 1967, 303–309.
(40) Garoma, T.; Gurol, M. D. Modeling aqueous ozone/UV processusing oxalic acid as probe chemical. EnViron. Sci. Technol. 2005, 39, 7964–7969.
ReceiVed for reView May 3, 2008ReVised manuscript receiVed July 31, 2008
Accepted July 31, 2008
IE800721T
7662 Ind. Eng. Chem. Res., Vol. 47, No. 20, 2008


![Lower Rim Substituted p-tert -Butyl-Calix[4]arene. Part 15. Pb(II)-Ion-Selective Electrodes Based on p-tert -Butyl-calix[4]arene Thioamides](https://static.fdokumen.com/doc/165x107/6342a72ff9c0d1681b0ad302/lower-rim-substituted-p-tert-butyl-calix4arene-part-15-pbii-ion-selective.jpg)


![Structural characterization and reactivity of Cu(II) complex of p- tert-butyl-calix[4]arene bearing two imine pendants at lower rim](https://static.fdokumen.com/doc/165x107/631fe67f962ed4ca8e03e9b8/structural-characterization-and-reactivity-of-cuii-complex-of-p-tert-butyl-calix4arene.jpg)


![Multinuclear NMR Studies and Reaction with tert-Butyl Isocyanide of Dinuclear Tungsten- or Molybdenum-Palladium .mu.-Alkylidene Complexes. X-ray Structure of [PdI[.mu.-C(p-tolyl)dmba][.mu.-CO]Mo(Cp)(CN-t-Bu)2]](https://static.fdokumen.com/doc/165x107/63358a2364d291d2a3028408/multinuclear-nmr-studies-and-reaction-with-tert-butyl-isocyanide-of-dinuclear-tungsten-.jpg)