Preparation and characterization of sulfonated polyethersulfone for cation-exchange membranes
Upload
independentCategory
view
1download
0
European Polymer Journal 40 (2004) 751–762
www.elsevier.com/locate/europolj
Studies on cellulose acetate and sulfonatedpoly(ether ether ketone) blend ultrafiltration membranes
G. Arthanareeswaran, K. Srinivasan, R. Mahendran, D. Mohan *,M. Rajendran, V. Mohan
Membrane Laboratory, Department of Chemical Engineering, A.C. College of Technology, Anna University, Chennai 600 025, India
Received 10 September 2003; received in revised form 26 November 2003; accepted 28 November 2003
Abstract
New ultrafiltration membranes based on chemically and thermally stable arylene main-chain polymers have been
prepared by blending the sulfonated poly(ether ether ketone) with cellulose acetate in various compositions in N,N0-
dimethylformamide as solvent by phase inversion technique. Prepared membranes have been subjected to ultrafiltration
characterizations such as compaction, pure water flux, water content, and membrane hydraulic resistance. The pore
statistics and molecular weight cut-off (MWCO) of the membranes have been estimated using proteins such as trypsin,
pepsin, egg albumin and bovine serum albumin. The pore size increased with increasing concentrations of sulfonated
poly(ether ether ketone) in the casting solution. Similarly, the MWCOs of the membranes ranged from 20 to 69 kDa,
depending on the various polymer compositions. Surface and cross-sectional morphologies of membranes were ana-
lyzed using scanning electron microscopy. The effects of polymer compositions on the above parameters were analyzed
and the results are compared and discussed with those of pure cellulose acetate membranes.
� 2003 Elsevier Ltd. All rights reserved.
Keywords: Poly(ether ether ketone); Sulfonation; Blend membranes; Ultrafiltration; Protein rejection
1. Introduction
Cellulose acetate (CA) was one of the first membrane
polymers that has been used for aqueous based separa-
tions and used as both reverse osmosis (RO) and
ultrafiltration (UF) membranes [1]. The requirement of
more aggressive cleaning and sanitizing agents and more
chemical and mechanical resistant membranes, led to the
necessity of modifying cellulose acetate based mem-
branes [2]. The hydrophilic/hydrophobic balance as well
as the physico-chemical properties of a membrane can
easily be changed if the membrane is prepared from
multicomponent polymer mixture/blends [3]. Cellulose
acetate has been blended with polyurethane in different
* Corresponding author. Tel.: +91-4422203530; fax: 91-44-
2350240/2642.
E-mail address: [email protected] (D. Mohan).
0014-3057/$ - see front matter � 2003 Elsevier Ltd. All rights reserv
doi:10.1016/j.eurpolymj.2003.11.023
compositions, using N,N0-dimethyl formamide (DMF)
to yield membranes applied for the rejection of proteins
and metal ions [4]. Further, CA has been found to be
successful blend component with polysulfone (PS), sul-
fonated polysulfone (SPS), and epoxy resin (DGEBA) in
preparing ultrafiltration membranes [5–7]. Similarly,
poly (ether ether ketone) (PEEK) is being used as a
successful blend material in sulfonated form due to its
superior qualities.
PEEK is a highly crystalline polymer (Tg ¼ 143 �C)having very good thermal, chemical and mechanical
stability. Due to the strong intermolecular interaction
among the polymeric chains, they are practically insol-
uble in most of the solvents. As a consequence, PEEKs
are not easily modified through the common reactions of
organic chemistry and they are not able to form mem-
branes by phase inversion process [8].
However their hydrophilicity and permeability may
be increased by sulfonation [9]. Generally, sulfuric acid
ed.

752 G. Arthanareeswaran et al. / European Polymer Journal 40 (2004) 751–762
is used for sulfonation since it avoids degradation and
cross-linking reactions [8]. The synthesized hydrophilic
polymer is able to form a membrane with cellulose
acetate by the phase inversion process and optimum
membrane performance can be achieved in terms of
better flux and solute rejection. Further, separation of
proteins is found to be advantageous due to the non-
destructive nature and limited denaturation of proteins
[10]. As the sulfonated PEEK (SPEEK) is hydrophilic in
nature, the blending of SPEEK with CA would sub-
stantially reduce the fouling behavior of the resulting
membranes. Earlier studies have shown that the increase
in hydrophilicity will reduce the fouling behavior and
increase the flux [11,12].
Pore statistics, molecular weight cut-off (MWCO)
and morphological studies are the structural properties
of membranes that are essential for the applications of
membrane processes for the desired permeate quality
[13]. It has been found that a broad variety of mor-
phologically different polymeric membranes can be
prepared by changing the parameters such as composi-
tion, concentrations of polymer, solvent and additive in
the casting solutions [14,15]. The determination of
morphological characteristics is playing an important
role in evaluating the performance of the membranes.
The membrane usually consists of cylindrical pores
perpendicular to the membrane surface, whose sizes are
represented by pore size distribution. Only solute mo-
lecules smaller than membrane pore diameters are al-
lowed to transport through the membrane [16]. Most of
the commercially available membranes are specified by
the pore size or molecular weight cut-off (MWCO) value
[17], and has been found to be an important parameter,
which affects the separation characteristics of the ultra-
filtration membranes [18]. Hence, in the present inves-
tigation, CA is blended with SPEEK in polar medium
and the membrane compaction, pure water flux, water
content, membrane resistance (Rm) and protein rejection
have been determined. Solute rejection method and
scanning electron microscopy (SEM) have been used for
determining pore statistics, MWCO and morphology
and results are discussed.
2. Materials and methods
2.1. Materials
Cellulose acetate (CA) was procured from Mysore
Acetate & Chemical Co. Ltd., India; PEEK polymer was
procured from Victrex Inc. Ltd. Sulfuric acid (97–99%),
DMF and sodium lauryl sulfate (SLS) were obtained
from Qualigens Fine Chemicals, Glaxo India Ltd.,
India, which were of analytical grade. DMF was sieved
through molecular sieves (Type-4 A�) to remove mois-
ture and stored in dried conditions prior to use. Acetone
(AR) procured from Sisco Research Laboratories Pvt.
Ltd., India. Sodium monobasic-phosphate anhydrous
and sodium dibasicphosphate heptahydrate were pro-
cured from CDH Chemicals Ltd., India and used for the
preparation of phosphate buffer solutions in protein
analysis. Proteins viz., bovine serum albumin (BSA),
Mw ¼ 69 kDa, pepsin, Mw ¼ 35 kDa, and trypsin,
Mw ¼ 20 kDa were purchased from SRL Chemicals
Ltd., India. Egg albumin (EA), Mw ¼ 45 kDa was ob-
tained from Council of Scientific and Industrial Re-
search (CSIR), Bio-Chemical Center, New Delhi, India.
Deionized and distilled water was employed for the
washing of SPEEK polymers, preparation of protein
solutions and also used for the preparation of gelation
bath.
2.2. Preparation of SPEEK polymer
2.2.1. Sulfonation of PEEK
Twenty-five grams of PEEK powder was carefully
added to the 500 ml of concentrated sulfuric acid (98%).
The reaction mixture was magnetically stirred for 5 h at
50 �C. The mixture was then added to a large excess of
crushed ice where precipitation occurred. The precipi-
tated SPEEK was recovered and washed with deionized
water many times to remove the excess acid. Finally the
polymer was dried around 70 �C, and stored in a deci-
cator [8]. The ion exchange capacity (IEC) of prepared
SPEEK polymer was measured by the Fisher’s back
titration method [19] at room temperature. 1–2 g of
SPEEK was kept in 0.1 N aqueous NaOH for 24 h. The
solution was then back titrated with 0.1 N HCl using
phenolphthalein indicator. The IEC is expressed as meq.
of sulfonic groups/g of dry polymer.
2.2.2. Thermo gravimetric analysis (TGA)
The TGA was carried out using a STA 409PC ther-
mal analysis instrument. A sample of 27.4 mg of SPEEK
was dried at 200 �C to remove moisture for 30 min, and
then programmed from 20 to 900 �C at a rate of 10 �C/min under the nitrogen atmosphere.
2.2.3. Differential scanning calorimetry (DSC)
DSC measurement of PEEK and its sulfonated form
was carried out using a DSC 200PC differential scanning
calorimeter at a heating rate of 10 �C/min under nitro-
gen atmosphere. The weight of sample taken for PEEK
and SPEEK were 2.3 and 2.6 mg respectively. The glass
transition temperature Tg, was calculated at the inter-
section of the tangents to the corresponding DSC curve.
2.2.4. 1H-NMR
The 1H-NMR spectra were recorded on a JEOL
(Model GSX 400) spectrometer at a resonance fre-
quency of 399.65 MHz. For analysis, 2–5 wt.% of
SPEEK solution was prepared in DMSO-d6 solvent.

G. Arthanareeswaran et al. / European Polymer Journal 40 (2004) 751–762 753
NMR data were acquired for 32 scans at a temperature
of 23 �C. The degree of sulfonation was determined by
integration of distinct aromatic signals [20].
2.3. Preparation and characterization of polymers
The casting solution was prepared by blending CA
and SPEEK at different compositions as shown in Table
1 in the presence of DMF solvent under constant
mechanical stirring in a three necked round bottom flask
at 40–45 �C. The blend polymer compositions were
formulated on the basis of preliminary membrane
studies. The conditions maintained in casting and gela-
tion of the polymeric films are given in Table 2. The
homogeneous solution obtained was allowed to stand
for 1/2 h in order to eliminate the air bubbles. The
casting environment, viz. relative humidity and tem-
perature were standardized for the preparation of
membranes with better physical properties such as
homogeneity, thickness and smoothness. Prior to cast-
ing, a gelation bath of 2 l consists of 2.5% (v/v) DMF
and 0.2 wt.% SLS, in distilled water (non-solvent), was
prepared and kept at 20 �C [5]. Similar casting and
gelation conditions were maintained for the blend sys-
tems and for pure CA, since the thermodynamic con-
ditions would largely affect the performance of resulting
membranes [21]. The membranes were prepared by
casting using doctor blade on the glass plate and
maintaining the desired thickness by adjusting the height
of the doctor blade and fixing an oil sheet paper at both
ends of the doctor blade. After casting, the solvent
Table 1
Membrane formulations
Membrane no. Polymer (wt.%) CA (wt.%)
1 17.5 100
2 17.5 95
3 17.5 90
4 17.5 85
5 17.5 80
6 17.5 75
7 17.5 70
8 17.5 65
Table 2
Film casting conditions
Conditions
Temperature of casting solutions (�C)Temperature of casting atmosphere (�C)Humidity of casting atmosphere (�C)Period of casting (s)
Solvent evaporation time (s)
Temperature of gelation bath (�C)Period of leaching membranes in gelation bath (h)
Thickness of film on glass plate (mm)
present in the cast film was allowed to evaporate for
30± 5 s, and the cast film along with glass plate was
gently immersed into the gelation bath. The membranes
were removed from the gelation bath and washed
thoroughly with distilled water to remove all DMF and
surfactant from membranes. The thickness of prepared
membranes was measured using a micrometer (Mityu-
toyo, Japan) at various parts of the membranes. The
thickness of the membrane was maintained at 0.22 ±
0.02 mm as followed in earlier studies [4,22]. The
membranes were subsequently stored in 0.1% of for-
malin solution to prevent microbial growth.
The UF experiments were carried out in a batch type,
dead end cell (UF cell-S76-400-Model, Spectrum, USA)
with a diameter of 76 mm, fitted with a Teflon coated
magnetic paddle.
2.3.1. Compaction
The prepared membranes were cut into desired size
needed for fixing it up in the ultrafiltration kit of
38.5 cm2 area and initially pressurized with distilled
water at 414 kPa for 6 h. The water flux was measured at
every one hour. The flux generally declines initially and
attained steady state after 4–5 h of compaction. The pre-
pressurized membranes were used in subsequent ultra-
filtration experiments at 345 kPa [1].
2.3.2. Pure water flux
Membranes after compaction were subjected to pure
water flux at transmembrane pressure of 345 kPa. The
SPEEK (wt.%) Solvent (wt.%)
0 82.5
5 82.5
10 82.5
15 82.5
20 82.5
25 82.5
30 82.5
35 82.5
Range
28± 2
24± 1
55± 2
3–6
30± 5
12± 2
1–3
0.22± 0.02

754 G. Arthanareeswaran et al. / European Polymer Journal 40 (2004) 751–762
flux was measured under steady state flow i.e., after
every 1 h for 4 h. The pure water flux was determined
using an Eq. (1).
Jw ¼ QA � DT ð1Þ
where, Jw is the water flux (lm�2 h�1), Q is the quantity
of permeate (l), A is the membrane area (m2) and DT is
the sampling time (h).
2.3.3. Water content
Water content of the membranes was measured as
follows [23]. The membranes were soaked in water for
24 h and weighed after mopping with blotting paper.
These wet membranes were placed in a drier at 80–100
�C for 48 h and the dry weights were determined. From
the two values the percent water content was derived by
Eq. (2).
%Water content ¼ Ww � Wd � 100
Ww
ð2Þ
where Ww is the wet sample weight and Wd is the dry
sample weight.
2.3.4. Membrane hydraulic resistance (Rm)
Membrane hydraulic resistance is an important
parameter, which decides the productivity of the mem-
branes at a given pressure [24]. This would be of more
useful to apply the membrane for a particular environ-
ment and to identify the suitability of the membranes
for a particular membrane process. Membrane hydrau-
lic resistance (Rm), was evaluated by measuring pure
water flux at different transmembrane pressures such
as 69, 138, 207, 276 and 345 kPa after compaction.
The resistance of the membrane was evaluated from
the slope obtained by plotting the transmembrane
pressure difference (DP ) vs. water flux (Jw) using the
Eq. (3).
Rm ¼ DPJw
ð3Þ
2.3.5. Molecular weight cut-off (MWCO)
Molecular weight cut-off of the membrane was
determined by identifying an inert solute, which has the
lowest molecular weight and has solute rejection of 80–
100%, in steady state UF experiments [25]. Thus, the
proteins of different molecular weights such as, bovine
serum albumin (69 kDa), egg albumin (45 kDa), pepsin
(35 kDa) and trypsin (20 kDa) were taken for rejection
studies for the membranes with 100/0%, 90/10%, 80/
20%, 70/30%, 65/35% of CA/SPEEK compositions. The
permeate concentrations were analyzed using UV–visi-
ble spectrophotometer (Shimadzu, Model UV-160A), at
kmax ¼ 280 nm.
2.4. Application studies
2.4.1. Protein rejection
After mounting the membrane in the UF cell, the
chamber was filled with individual protein solution and
immediately pressurized under nitrogen atmosphere to
the desired level (345 kPa) and maintained constant
throughout the run. Proteins such as BSA, EA, pepsin
and trypsin were dissolved (0.1 wt.%) in phosphate
buffer (0.5 M, pH 7.2) and used as standard feed solu-
tions. For all experiments, the concentration of feed
solution was kept constant. Permeate was collected over
measured time intervals in graduated tubes and the tube
contents were analyzed for protein content by UV–
visible spectrophotometer (Shimadzu, Model UV-160A)
at kmax 280.0 nm. The percent protein separation was
calculated from the concentration of feed and permeates
[25] using Eq. (4)
%SR ¼ 1� Cp
Cf
� �� 100 ð4Þ
where Cp and Cf are concentrations of permeate and
feed, respectively.
Upon, completion of run, the ultrafiltration cell was
emptied, the membrane was removed and washed gently
with pure water to remove adherent protein solution,
and then re-inserted in the clean cell for re-measurement
of its pure water flux.
2.5. Morphological studies
Scanning electron microscopy (SEM) (LEICA Ste-
reoscan, Cambridge, UK) analyzed the morphology of
the blend membranes with different compositions. The
membranes were cut into pieces of various sizes and
mopped with filter paper. These pieces were immersed in
liquid nitrogen for 20–30 s and were frozen. Frozen bits
of the membranes were broken and kept in a desiccator.
These membrane samples were used for SEM studies
[26]. Various SEM images were taken for top surface
and cross-sectional views of the membranes of 100%,
95%, 85%, 75% and 65% of CA.
3. Results and discussion
3.1. Sulfonation of PEEK
The introduction of –SO3H groups per repeating unit
in the PEEK chain leads to a large modification of its
solubility. The physical and chemical properties of
SPEEK depend on the concentration of –SO3H group
and the nature of counter ions. Sulfonation modifies the
chemical character of PEEK, reduces the crystallinity
and consequently affects solubility.
G. Arthanareeswaran et al. / European Polymer Journal 40 (2004) 751–762 755
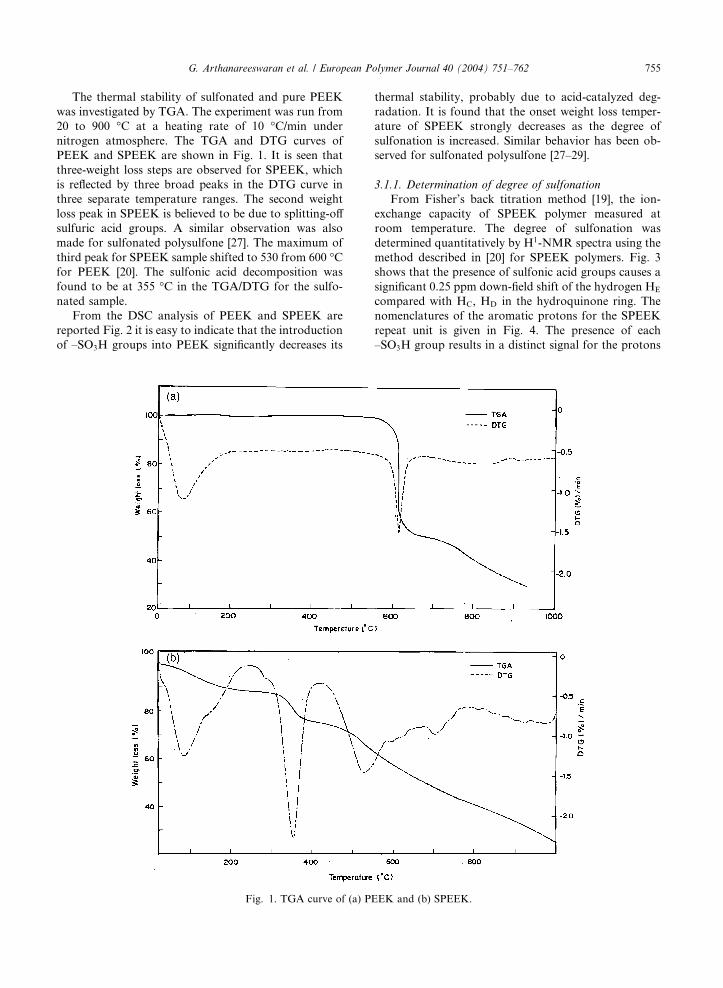
The thermal stability of sulfonated and pure PEEK
was investigated by TGA. The experiment was run from
20 to 900 �C at a heating rate of 10 �C/min under
nitrogen atmosphere. The TGA and DTG curves of
PEEK and SPEEK are shown in Fig. 1. It is seen that
three-weight loss steps are observed for SPEEK, which
is reflected by three broad peaks in the DTG curve in
three separate temperature ranges. The second weight
loss peak in SPEEK is believed to be due to splitting-off
sulfuric acid groups. A similar observation was also
made for sulfonated polysulfone [27]. The maximum of
third peak for SPEEK sample shifted to 530 from 600 �Cfor PEEK [20]. The sulfonic acid decomposition was
found to be at 355 �C in the TGA/DTG for the sulfo-
nated sample.
From the DSC analysis of PEEK and SPEEK are
reported Fig. 2 it is easy to indicate that the introduction
of –SO3H groups into PEEK significantly decreases its
Fig. 1. TGA curve of (a) PE
thermal stability, probably due to acid-catalyzed deg-
radation. It is found that the onset weight loss temper-
ature of SPEEK strongly decreases as the degree of
sulfonation is increased. Similar behavior has been ob-
served for sulfonated polysulfone [27–29].
3.1.1. Determination of degree of sulfonation
From Fisher’s back titration method [19], the ion-
exchange capacity of SPEEK polymer measured at
room temperature. The degree of sulfonation was
determined quantitatively by H1-NMR spectra using the
method described in [20] for SPEEK polymers. Fig. 3
shows that the presence of sulfonic acid groups causes a
significant 0.25 ppm down-field shift of the hydrogen HE
compared with HC, HD in the hydroquinone ring. The
nomenclatures of the aromatic protons for the SPEEK
repeat unit is given in Fig. 4. The presence of each
–SO3H group results in a distinct signal for the protons
EK and (b) SPEEK.

Fig. 2. DSC thermogram of (a) PEEK and (b) SPEEK.
756 G. Arthanareeswaran et al. / European Polymer Journal 40 (2004) 751–762
at the E position. The intensity of this HE signal yields
the estimation of HE content which is equivalent to the
–SO3H group content [20]. The 1H-NMR signal for the
–SO3H group is less easily recordable directly because
this proton is labile. The ratio between the peak area of
the distinct HE signal, (AHE) and the integrated peak
area of the signals corresponding to all the other aro-
matic hydrogens (AHA;A0 ;B;B0 ;C;D), is expressed as
nð12� 2nÞ ¼
AHEPAHA;A0 ;B;B0 ;C;D
ð06 n6 1Þ ð5Þ
where n is the number of HE per repeat unit. An estimate
of the degree of sulfonation is obtained as n� 100%.
3.2. Characterization of the blend membranes
The blend membranes were found to be compatible
up to a composition of 65/35% of CA/SPEEK in DMF.
These membranes were subjected to the characterization
and solute rejection studies and the results have been
discussed with respect to the effect of polymer blend
composition.
3.2.1. Membrane compaction
At constant operating pressure (414 kPa), the pure
water flux of CA/SPEEK blend membranes upon com-
paction was measured for every one hour. During
compaction, the water flux was found to be high initially
and declines gradually and reaches a steady state after 4
h of compaction, for all membranes as shown in Fig. 5.
This initial decline in flux may be due to the fact that the
membrane pores are being compacted leading to uni-
form pore size and steady state water flux.
3.2.2. Pure water flux
Membranes after compaction were subjected to a
pressure of 345 kPa for the measurement of pure water
flux. The flux was measured under steady state flow [30].

Fig. 4. Nomenclature of the aromatic protons for the SPEEK.
Fig. 3. 1H-NMR spectrum of SPEEK.
0
50
100
150
200
250
300
0 1 2 3 4 5 6 7Time, h
Pure
wat
erflu
x,lm
-2h-1
SPEEK (0%) SPEEK (5%)SPEEK (10%) SPEEK (15%)SPEEK (20%) SPEEK (25%)SPEEK (30%) SPEEK (35%)
Fig. 5. Effect of compaction time on pure water flux of CA/SPEEK blend membranes.
G. Arthanareeswaran et al. / European Polymer Journal 40 (2004) 751–762 757

88
90
92
94
cont
ent,
%
758 G. Arthanareeswaran et al. / European Polymer Journal 40 (2004) 751–762
The values of pure water flux are presented in the Fig. 5.
The value shows that in the blend membranes, as the
concentration of the SPEEK increases from 5% to 35%
in the increment of 5%, the water flux also increases
from 34.28 to 157.91 lm�2 h�1. This linear trend due to
the increase in SPEEK content in the blend may be due
to the hydrophilic nature of the –SO3H group present in
the membrane.
80
82
84
86
60 65 70 75 80 85 90 95 100Composition of CA, %
Wat
er
Fig. 6. Effect of water content on composition of CA in CA/
SPEEK membranes.
3.2.3. Water content
Water content is considered to be an important
parameter for membrane characterization, since the
pure water flux of the membrane can be predicted
qualitatively based on these results. Variation in the
concentration of SPEEK from 5 to 35 wt.% in the blend
membranes resulted in an increase in the water content
of the membranes from 84.9% to 93% as shown in Fig.
6. This increase in percent water content may be due to
the hydrophilic nature of the membranes due to the
presence of –SO3H group of SPEEK, as compared with
pure cellulose acetate membrane.
3.2.4. Membrane hydraulic resistance (Rm)
Resistance of the membrane was calculated from the
slope of the plot of transmembrane pressure vs. water
flux as shown in Fig. 7. The effects of concentration of
SPEEK on Rm values are given Table 3. From the values
it is obvious that as the concentration of the SPEEK in
the blend system is increased, the membrane resistance
decreased. This may be due to the fact that and increase
in SPEEK content in blend increases the void volume
0
20
40
60
80
100
120
140
160
180
0 100 200Transmembra
Pure
wat
erflu
x,lm
-2h-1
100/0 % 95/5%
90/10 % 85/15 %
80/20 % 75/25 %
70/30 % 65/35 %
Fig. 7. Effect of transmembrane pressure on pure
due to large segregated distances between polymer
chains. Further, the values are inversely proportional to
the water flux of the respective membranes.
3.2.5. Molecular weight cut-off
Based on the rejection values of the globular proteins
and the procedure followed by Sarbolouki [25], the
MWCO of the CA/SPEEK membranes has been deter-
mined and is reported in Table 3. It is seen that pure CA
membrane (100/0%), has the lowest MWCO value of 20
kDa, as the membrane has yielded 82% rejection for
300 400 500ne pressure,kPa
water flux of CA/SPEEK blend membranes.

130
180
230
280
Perm
eate
flux,
lm-2
h-1
TrypsinPepsinEgg albuminBSA
Table 3
Characteristics of CA/SPEEK blend membranes
Polymer blend composition (17.5 wt.%) Pure water flux
(lm�2 h�1) 345 kPa
Water content (wt%) Rm (kPa/lm�2 h�1) MWCO (kDa)
CA % SPEEK %
100 0 20.78 81.98 18.762 20
95 5 34.28 84.89 10.846 –
90 10 70.65 86.78 5.479 35
85 15 101.81 88.95 4.045 –
80 20 114.28 89.70 3.498 45
75 25 128.32 90.88 3.160 –
70 30 139.21 91.97 2.907 69
65 35 157.91 93.00 2.567 >69
G. Arthanareeswaran et al. / European Polymer Journal 40 (2004) 751–762 759
trypsin (20 kDa). The MWCO value has increased upon
an increase of SPEEK content in the blend and thus, at
35% SPEEK content, the MWCO was found to be >69
kDa. This increase in MWCO value may be due to
formation of a segmental gap, due to the partial phase
separation upon proportionately increasing the concen-
tration of SPEEK in the blend. Similar results have been
observed for CA and epoxy resin blend membranes,
with various blend compositions and found successful in
protein rejection applications [7].
30
80
60 65 70 75 80 85 90 95 100Composition of CA, %
Fig. 8. Effect of permeate flux of protein solutions on various
compositions of CA in CA/SPEEK membranes.
0
20
40
60
80
100
60 70 80 90 100Composition of CA, wt %
Rej
ectio
n, %
TrypsinPepsinEgg albuminBSA
Fig. 9. Effect of percentage rejection of proteins on various
compositions of CA in CA/SPEEK membranes.
3.3. Protein rejection studies
The rejection of proteins viz., BSA, EA, pepsin and
trypsin has been carried out using CA/SPEEK (100/0%,
90/10%, 80/20%, 70/30% and 65/35%) membranes. The
pH of the feed solution was kept constant at 7.2, since,
the change in pH may increase the adsorptive fouling of
the membrane [31]. Further, intermolecular forces be-
tween protein molecules and membranes will predomi-
nate and affect the efficiency of membranes if pH of the
solution changes [32].
The permeate flux of proteins such as BSA, EA,
pepsin and trypsin by 100/0%, 90/10%, 80/20%, 70/30%
and 65/35% CA/SPEEK blend membranes are shown in
Fig. 8. From the figure, it is obvious that when the
SPEEK content in the blend is increased, the flux of the
all the proteins is also increased. This is because mem-
branes with SPEEK can absorb more water on feed side
of the membrane, the transport driving force of water is,
thus, increased. Thus trypsin has shown higher flux of
297.52 lm�2 s�1 at 65/35 of CA/SPEEK compared to
other proteins in view of its low molecular weight and
smaller solute radius.
When pure CA membrane (100%) was subjected to
separation of proteins, it exhibited a higher separation
of 90%, 85.5%, 84% and 82% of BSA, EA, pepsin and
trypsin respectively as shown in Fig. 9. For CA/SPEEK
blend membranes, as the CA content decreased, the
separation also decreased for all proteins. Thus for

760 G. Arthanareeswaran et al. / European Polymer Journal 40 (2004) 751–762
90/10% CA/SPEEK blend membranes, BSA exhibited a
higher rejection of 82% and reduced to 66% for 65/35%
blend membrane compared to other proteins in order to
its higher molecular weight. Similar trend was observed
for other proteins.
Fig. 10. SEM micrographs of top surface of CA/SPEEK membranes
(d) 75/25; (e) 65/35 wt.% of CA/SPEEK blend membranes (5000· ma
3.4. Morphological studies
Morphology of the blend membranes were analyzed
by SEM with different polymer compositions and the
results are depicted in Figs. 10 and 11. At 100 wt.% of
with different blend compositions (a) 100/0; (b) 95/5; (c) 85/15;
gnification).

Fig. 11. SEM micrographs of cross-section of CA/SPEEK membranes with different blend compositions (a) 100/0; (b) 95/5; (c) 85/15;
(d) 75/25; (e) 65/35 wt.% of CA/SPEEK blend membranes (250· magnification).
G. Arthanareeswaran et al. / European Polymer Journal 40 (2004) 751–762 761
CA, membrane exhibit smaller pores distributed evenly.
As, the SPEEK composition increased in the casting
solution, the pore size increased proportionally. The
cross-section of membrane confirms the asymmetry in
the ultrastructure of the membrane. The addition of
SPEEK to CA greatly reduced the formation of mac-
rovoids. At the base CA content, increasing SPEEK
content gives substantial and systematic increases in the
membrane permeability.
4. Conclusion
A new type of polymeric blend membrane material
based on cellulose acetate and SPEEK has been devel-
oped. Sulfonation studies prove that sulfonation of
PEEK occurred in sulfuric acid at room temperature.
Thermal analysis of SPEEK shows that the stability is
almost same to that observed for the parent PEEK. DSC
analysis proves that SPEEK does not reach the glass

762 G. Arthanareeswaran et al. / European Polymer Journal 40 (2004) 751–762
transition temperature before its decomposition. The
extent of blend compatibility with various polymer
compositions using DMF as solvent has been determined
to be 65/35% of CA/SPEEK. The membranes prepared
have been characterized for their compaction, pure water
flux, water content, membrane resistance, and molecular
weight cut-off. The membrane showed higher pure water
flux and good resistance toward hydraulic pressure as
compared with pure CA membranes. These blend
ultrafiltration membranes with different compositions
were subjected to the separation of proteins such as BSA,
EA, pepsin and trypsin. SEM analysis shows that in the
blend membranes, the pore size increases with an in-
crease of sulfonated PEEK concentration.
References
[1] Kutowy O, Sourirajan S. Cellulose acetate ultrafiltration
membranes. J Appl Polym Sci 1975;19:1449.
[2] Applegate LE. Membrane separation processes. Chem Eng
1984;91:64–89.
[3] Sivakumar M, Mohan D, Rangarajan R. Preparation and
performance of cellulose acetate––polyurethane blend
membranes and their applications. Part 1. Polym Int
1998;47:311.
[4] Sivakumar M, Malaisamy R, Sajitha CJ, Mohan D,
Mohan V, Rangarajan R. Preparation and performance
of cellulose acetate––polyurethane blend membranes and
their applications. J Membr Sci 2000;169(2):215.
[5] Sivakumar M. Studies on ultrafiltration membrane based
on cellulose acetate polysulfone and polyurethane blends.
PhD thesis, Anna University, Chennai, India, 1997.
[6] Malaisamy R, Mahendran R, Mohan D. Cellulose acetate
and sulfonated polysulfone blend ultrafiltration membrane
II pore statistics, molecular cutoff, and morphological
studies. J Appl Polym Sci 2002;84:430.
[7] Mahendran R, Malaisamy R, Mohan D. Cellulose acetate
and epoxy resin blend ultrafiltration membranes: prepara-
tion characterization and applications. J Macromol Sci
2002;A39(9):1025.
[8] Jin X, Bishop MT, Ellis TS, Karasz FE. A sulfonated poly
(aryl-ether-ketone). Br Polym J 1985;17:4.
[9] Bailly C, Willians DJ, Karasz FE, Macknight WJ. The
sodium salts of sulphonated poly (aryl ether-ether-ketone)
PEEK preparation and characterization. Polymer 1987;28:
1009.
[10] Medda DA, Nguyen Q, Dellaucherie E. Biospecific ultra-
filtration: a promising purification technique for proteins.
J Appl Polym Sci 1981;9:337.
[11] Ehsani N, Parkkinen S, Nystrom M. Fractionation of
natural and model egg-white protein solutions with mod-
ified and unmodified polysulfone UF membranes.
J Membr Sci 1997;123:105.
[12] Fane AG, Fell CJD, Waters AG. The relationship between
membrane surface pore characteristics and flux of ultrafil-
tration membranes. J Membr Sci 1981;9:245.
[13] Zeman L, Wales M. Steric rejection of polymeric solutes by
membranes with uniform pore size distribution. Sep Sci
Technol 1981;16:275.
[14] Stropnik C, Germic L, Zerjal B. Morphology variety and
formation mechanisms of polymeric membranes prepared
by wet phase inversion. J Appl Polym Sci 1996;61:1821.
[15] Nguyen TD, Matsuura T, Sourirajan S. Effect of non
solvent additives on the pore size and the pore size dis-
tribution of aromatic polyamide reverse osmosis mem-
branes. Chem Eng Commun 1987;54:17.
[16] McCoy BJ. Membrane sieving of a continuous polydis-
perse mixture through distributed pores. Sep Sci Technol
1995;30:487–507.
[17] Hernandez A, Calve JI, Pradanose P, Tejerina F. Pore size
distributions in microporous membranes. A critical ana-
lysis of the bubble point extended method. J Membr Sci
1996;112:1.
[18] Snir R, Wicker L, Koehler PE, Sims KE. Membrane
fouling and molecular weight cutoff effects on the parti-
tioning of pectinesterase. J Agric Food Chem 1996;44:
2091.
[19] Fisher S, Kunin R. Routine exchange capacity determina-
tions of ion exchange resines. Anal Chem 1955;27:7.
[20] Zaidi SMJ, Mikhailenko SD, Robertson GP, Guiver MD,
Kaliaguine S. Proton conducting composite membranes
from polyether ether ketone and heteropolyacids for fuel
cell applications. J Membr Sci 2000;173:17.
[21] Barth C, Goncalves MC, Pires ATN, Roeder J, Wolf BA.
Asymmetric polysulfone and polyethersulfone membrane:
effects of thermodynamic conditions during formation on
their performance. J Membr Sci 2000;169:287.
[22] Sivakumar M, Malaisamy R, Sajitha CJ, Mohan D,
Mohan V, Rangarajan R. Ultrafiltration application of
cellulose acetate––polyurethane blend membranes. Eur
Polym J 1999;35:1649.
[23] Tamura M, Uragami T, Sugihara M. Studies on synthesis
and permeabilities of special polymer membranes, CA30
ultrafiltration and dialysis characteristics of cellulose
nitrate poly(vinylpyrolidone) polymer blend membranes.
Polymer 1981;22:829.
[24] Bhattacharyya D, McCarthy JM, Grieves RB. Charged
membrane ultrafiltration of inorganic ions in single and
multi-salt systems. AIChE J 1974;20:1206.
[25] Sarbolouukki MN. A general diagram for estimating pore
size of UF and reverse osmosis membranes. Sep Sci
Technol 1982;17:381.
[26] Brink LES, Elbers SJG, Robertsen T, Both PJ. The anti-
fouling action of polymers preadsorbed on ultrafiltration
and macrofiltration membranes. J Membr Sci 1993;76:281.
[27] Bishop MT, Karasz FE, McKnight WJ. The sodium salts
of sulfonated poly(aryl ether–ether ketone) (PEEK): pre-
paration and characterization. Polymer 1987;28:1009.
[28] Drzewinkski M, MacNight WJ. Structure and properties
of polysulfone ionomers. J Polym Sci 1985;30:4753.
[29] Noshay A, Robeson LM. Sulfonated polysulfone. J Appl
Polym Sci 1976;20:1865.
[30] Osada NI. Membrane Science & Technology. New York:
Marcel Dekker; 1992.
[31] Brinck J, Jonsson AF, Johsson B, Lindau J. Influence of
pH on the adsorptive fouling of ultrafiltration membranes
by fatty acid. J Membr Sci 2000;164:187.
[32] Koehler JA, Ulbricht M, Belfort G. Intermolecular forces
between proteins and polymer films with relevance to
filtration. Langmuir 1997;13:4162.
Copyright © 2022 FDOKUMEN