Real-time multiple-particle tracking: applications to drug and gene delivery
16
Real-time multiple-particle tracking: applications to drug and gene delivery Junghae Suh a , Michelle Dawson b , Justin Hanes a,b, * a Department of Biomedical Engineering, The Johns Hopkins University, 3400 N. Charles St., Baltimore MD, 21218, USA b Department of Chemical and Biomolecular Engineering, The Johns Hopkins University, 3400 N. Charles St., Baltimore MD, 21218, USA Received 12 May 2004; accepted 5 August 2004 Abstract Complex biological environments, such as the cell cytoplasm or the mucus lining the airways of the lungs, can pose significant barriers to efficient therapeutic drug and gene delivery. Biological barriers are particularly important in controlled drug delivery applications that utilize a large carrier particle, such as a liposome or a polymer micro- or nanosphere. The dynamic transport of particulate drug and gene delivery vehicles through these barriers is poorly understood, having been primarily studied with static methods in the past. Recently, the transport of synthetic drug and gene carriers has been investigated quantitatively with real-time particle tracking technology, providing new insight into particle behavior in complex biological environments that is guiding rational improvements in particle design. This review briefly highlights basic principles of particle tracking and its application to elucidate important phenomena that limit effective particulate drug and gene delivery. D 2004 Elsevier B.V. All rights reserved. Keywords: Drug delivery; Gene delivery; Multiple-particle tracking; Intracellular; Mucus; Diffusion; Transport; Rheology Contents 1. Introduction...................................................... 64 2. Intracellular barriers ................................................. 65 2.1. Properties of cell cytoplasm.......................................... 65 2.2. Active transport of nonviral vectors...................................... 66 2.3. Subdiffusive and immobile vectors ...................................... 66 2.4. Rapid perinuclear accumulation of gene vectors ............................... 67 0169-409X/$ - see front matter D 2004 Elsevier B.V. All rights reserved. doi:10.1016/j.addr.2004.06.001 * Corresponding author. Department of Chemical and Biomolecular Engineering, The Johns Hopkins University, 3400 N. Charles St., Baltimore MD, 21218, USA. Tel.: +1 410 516 3484; fax: +1 410 516 5510. E-mail address: [email protected] (J. Hanes). Advanced Drug Delivery Reviews 57 (2005) 63 – 78 www.elsevier.com/locate/addr
Transcript of Real-time multiple-particle tracking: applications to drug and gene delivery

www.elsevier.com/locate/addr
Advanced Drug Delivery Re
Real-time multiple-particle tracking: applications to drug
and gene delivery
Junghae Suha, Michelle Dawsonb, Justin Hanesa,b,*
aDepartment of Biomedical Engineering, The Johns Hopkins University, 3400 N. Charles St., Baltimore MD, 21218, USAbDepartment of Chemical and Biomolecular Engineering, The Johns Hopkins University, 3400 N. Charles St., Baltimore MD, 21218, USA
Received 12 May 2004; accepted 5 August 2004
Abstract
Complex biological environments, such as the cell cytoplasm or the mucus lining the airways of the lungs, can pose
significant barriers to efficient therapeutic drug and gene delivery. Biological barriers are particularly important in controlled
drug delivery applications that utilize a large carrier particle, such as a liposome or a polymer micro- or nanosphere. The
dynamic transport of particulate drug and gene delivery vehicles through these barriers is poorly understood, having been
primarily studied with static methods in the past. Recently, the transport of synthetic drug and gene carriers has been
investigated quantitatively with real-time particle tracking technology, providing new insight into particle behavior in complex
biological environments that is guiding rational improvements in particle design. This review briefly highlights basic principles
of particle tracking and its application to elucidate important phenomena that limit effective particulate drug and gene delivery.
D 2004 Elsevier B.V. All rights reserved.
Keywords: Drug delivery; Gene delivery; Multiple-particle tracking; Intracellular; Mucus; Diffusion; Transport; Rheology
Contents
1. Introduction. . . . . . . . . . . . . . . . . . . . . . . . . . . . . . . . . . . . . . . . . . . . . . . . . . . . . . 64
2. Intracellular barriers . . . . . . . . . . . . . . . . . . . . . . . . . . . . . . . . . . . . . . . . . . . . . . . . . 65
2.1. Properties of cell cytoplasm. . . . . . . . . . . . . . . . . . . . . . . . . . . . . . . . . . . . . . . . . . 65
2.2. Active transport of nonviral vectors. . . . . . . . . . . . . . . . . . . . . . . . . . . . . . . . . . . . . . 66
2.3. Subdiffusive and immobile vectors . . . . . . . . . . . . . . . . . . . . . . . . . . . . . . . . . . . . . . 66
2.4. Rapid perinuclear accumulation of gene vectors . . . . . . . . . . . . . . . . . . . . . . . . . . . . . . . 67
0169-409X/$ - s
doi:10.1016/j.ad
* Correspon
Baltimore MD,
E-mail addr
views 57 (2005) 63–78
ee front matter D 2004 Elsevier B.V. All rights reserved.
dr.2004.06.001
ding author. Department of Chemical and Biomolecular Engineering, The Johns Hopkins University, 3400 N. Charles St.,
21218, USA. Tel.: +1 410 516 3484; fax: +1 410 516 5510.
ess: [email protected] (J. Hanes).

J. Suh et al. / Advanced Drug Delivery Reviews 57 (2005) 63–7864
3. Extracellular barriers . . . . . . . . . . . . . . . . . . . . . . . . . . . . . . . . . . . . . . . . . . . . . . . . 68
3.1. Particle transport in human cystic fibrosis (CF) mucus . . . . . . . . . . . . . . . . . . . . . . . . . . . 68
3.1.1. Properties of CF mucus . . . . . . . . . . . . . . . . . . . . . . . . . . . . . . . . . . . . . . 68
3.1.2. Heterogeneous particle transport through CF mucus . . . . . . . . . . . . . . . . . . . . . . . . 68
3.1.3. Micro- and macrorheology of CF mucus. . . . . . . . . . . . . . . . . . . . . . . . . . . . . . 68
3.1.4. Effects of mucolytic agents. . . . . . . . . . . . . . . . . . . . . . . . . . . . . . . . . . . . . 70
3.2. Particle transport in gastrointestinal mucus . . . . . . . . . . . . . . . . . . . . . . . . . . . . . . . . . 70
4. Other applications . . . . . . . . . . . . . . . . . . . . . . . . . . . . . . . . . . . . . . . . . . . . . . . . . . 71
4.1. Viral gene delivery vectors . . . . . . . . . . . . . . . . . . . . . . . . . . . . . . . . . . . . . . . . . 71
4.2. Characterizing cell cytoplasm . . . . . . . . . . . . . . . . . . . . . . . . . . . . . . . . . . . . . . . . 71
4.3. Motion of plasma membrane components . . . . . . . . . . . . . . . . . . . . . . . . . . . . . . . . . . 71
5. Particle tracking technology: a brief tutorial . . . . . . . . . . . . . . . . . . . . . . . . . . . . . . . . . . . . 71
5.1. Time scale . . . . . . . . . . . . . . . . . . . . . . . . . . . . . . . . . . . . . . . . . . . . . . . . . . 72
5.2. Individual vs. ensemble transport properties . . . . . . . . . . . . . . . . . . . . . . . . . . . . . . . . . 73
5.3. Transport modes . . . . . . . . . . . . . . . . . . . . . . . . . . . . . . . . . . . . . . . . . . . . . . . 73
5.3.1. Simple diffusion . . . . . . . . . . . . . . . . . . . . . . . . . . . . . . . . . . . . . . . . . . 74
5.3.2. Anomalous subdiffusive transport . . . . . . . . . . . . . . . . . . . . . . . . . . . . . . . . . 74
5.3.3. Corralled motion . . . . . . . . . . . . . . . . . . . . . . . . . . . . . . . . . . . . . . . . . . 74
5.3.4. Active transport . . . . . . . . . . . . . . . . . . . . . . . . . . . . . . . . . . . . . . . . . . 74
5.3.5. Immobile . . . . . . . . . . . . . . . . . . . . . . . . . . . . . . . . . . . . . . . . . . . . . . 74
5.4. Diffusivities . . . . . . . . . . . . . . . . . . . . . . . . . . . . . . . . . . . . . . . . . . . . . . . . . 75
5.4.1. Microscopic diffusion . . . . . . . . . . . . . . . . . . . . . . . . . . . . . . . . . . . . . . . 75
5.4.2. Mesoscopic diffusion . . . . . . . . . . . . . . . . . . . . . . . . . . . . . . . . . . . . . . . . 75
5.4.3. Macroscopic diffusion . . . . . . . . . . . . . . . . . . . . . . . . . . . . . . . . . . . . . . . 76
5.5. 2D v. 3D tracking . . . . . . . . . . . . . . . . . . . . . . . . . . . . . . . . . . . . . . . . . . . . . . 76
5.6. Tracking resolution . . . . . . . . . . . . . . . . . . . . . . . . . . . . . . . . . . . . . . . . . . . . . 76
6. Conclusions . . . . . . . . . . . . . . . . . . . . . . . . . . . . . . . . . . . . . . . . . . . . . . . . . . . . . 77
References . . . . . . . . . . . . . . . . . . . . . . . . . . . . . . . . . . . . . . . . . . . . . . . . . . . . . . . . 77
1. Introduction
Effective drug and gene delivery to target cells is
often limited by inefficient particle transport through
complex extra- and intracellular biological environ-
ments [1]. For example, drug/gene particulate
carriers delivered to the gastrointestinal (GI) tract
or to the lungs via inhalation must be capable of
traversing mucus barriers designed to trap foreign
particulates and prevent their transport to underlying
cell surfaces [2,3]. Mucus depletion of cell mono-
layers typically dramatically improves gene trans-
fection of cells with nonviral vectors [4],
underscoring the importance of the mucus barrier.
Once in cells, gene vectors must traverse the highly
crowded cytoplasm, congested with macromolecules
and organelles, to reach the nucleus [5]. The sparse
quantitative investigations of these barriers have
focused largely on bulk particle transport properties.
In these studies, individual particle interactions with
their biological environment remain a black box.
Additionally, the dynamic interaction of drug/gene
delivery vectors with components in the extra- and
intracellular environments have often been over-
looked. Limited understanding of barriers to effi-
cient delivery hampers the rational design of
improved vectors.
To address these issues, real-time multiple-particle
tracking (MPT) technology has recently been applied
to the study of drug and gene carrier delivery
through biological environments [2,3,5,6]. As the
name implies, multiple-particle tracking involves
tracking the microscopic motion of tens of individual
particles simultaneously in real-time using video
microscopy. Particle tracking technology is valuable
in obtaining information on how, and how fast,
particles move in various environments. Data
obtained at the individual particle level can be

J. Suh et al. / Advanced Drug Delivery Reviews 57 (2005) 63–78 65
critical in revealing particle–environment interactions
and cellular processes that control overall bulk
transport properties. This information may then be
used to deduce important properties of the environ-
ment itself, such as its viscoelasticity [7] or pore
sizes [8]. Using time-resolved trajectories of par-
ticles, quantitative information (such as diffusivity
and velocity) and qualitative information (such as
directionality and transport mode) can be obtained.
Furthermore, the data from hundreds of individual
particles provides important statistical insights of the
population as a whole. Thus, MPT allows the
analysis of particle transport from the single-particle
level, to the transport of subclasses of particles, and
finally, to the ensemble-averaged transport properties
of the bulk population.
By investigating the interactions and transport
rates of vectors quantitatively at the microscopic
scale, new insights have emerged that are guiding the
development of more effective delivery systems. For
example, tracking individual drug carriers in mucus
revealed a large percentage of nanoparticles are
immobile, thereby driving the design of new carriers
that are smaller (to avoid entropic caging by mucus
components) and/or less adhesive to mucus (by
altering particle surface chemistry) [3].
Intracellular particle tracking studies of polyethy-
lenimine (PEI)/DNA nanocomplexes revealed these
gene vectors achieve rapid perinuclear accumulation
due to their active transport along microtubules [5],
thereby eliminating slow cytoplasmic transport from
the cell periphery to the perinuclear region as a
critical bottleneck to gene delivery for this system.
An increasingly large fraction of gene vectors,
however, became immobile over time in the
perinuclear region of the cell, suggesting that the
vectors may still face a formidable challenge in
entering the nucleus. Particle tracking technology
provides quantitative biophysical insights that are
expected to guide the rational evolution of drug and
gene vectors into more efficient systems.
In this review, results obtained with real-time
MPT related to the transport of particulate drug
carriers within intra- and extracellular barriers are
summarized. Next, a brief synopsis of other bio-
logical applications of particle tracking is provided.
Finally, key aspects of particle tracking technology
are briefly reviewed. The reader is directed to other
publications for further details on particle tracking
[9,10].
2. Intracellular barriers
Inefficient intracellular trafficking/transport of
relatively large nonviral gene vectors has been
suggested to be a critical barrier to efficient gene
delivery [11–14]. Indeed, the molecularly crowded
nature of the cytoplasm is known to hinder the
transport of some macromolecules [15]. Investiga-
tions of the intracellular transport of nonviral gene
vectors have mainly involved static methods, such as
electron microscopy (EM) and fixed-cell confocal
microscopy. Cytoplasmic transport, however, is a
highly dynamic process which warrants the use of
real-time, live-cell techniques. Real-time particle
tracking has been recently used to quantify the
transport of nonviral [5,6] and viral [16] gene vectors
in live cells to reveal new insights into their
intracellular transport.
2.1. Properties of cell cytoplasm
The cell cytoplasm is highly crowded by
membrane-bounded compartments (organelles such
as the endoplasmic reticulum (ER) and Golgi) and
macromolecules (mostly proteins) [17,18]. Up to
half of the cellular volume has been estimated to be
comprised of membrane-bounded compartments [18]
and the viscosity of the cytoplasm surrounding the
organelles has been estimated to be similar to 12–
13% Ficoll [19]. Actin microfilaments [20], inter-
mediate filaments, and microtubules comprising the
cytoskeleton also contribute to the heterogeneous
intracellular milieu, posing steric obstacles to
particle transport as well as binding surfaces for
particles. Endogenous organelles exhibit sub-diffu-
sive behavior (see Section 5.3 for discussion on
transport modes) [18], relying on active transport
mechanisms for efficient movement in cells. Active
transport is mediated by cytoskeleton-dependent
motor proteins such as myosin (actin-based), kinesin
(microtubule-based), and dynein (microtubule-based).
Dynein-mediated active transport, estimated to reach
velocities of 0.7 Am/s in vitro [21], would allow
vesicles (or particles) to transport 10 Am in 14 s. More
J. Suh et al. / Advanced Drug Delivery Reviews 57 (2005) 63–7866
comprehensive reviews of the cytoplasm [18] and
active transport mechanism [22,23] can be found
elsewhere.
2.2. Active transport of nonviral vectors
The intracellular transport of nonviral gene vectors
was thought to be a potential bottleneck in gene
delivery due to the highly crowded nature of the
cytoplasm [11–14]. Live-cell MPT experiments, how-
ever, revealed that polyethylenimine (PEI)/DNA
nanocomplexes are actively transported by motor
proteins along microtubules [5] (Fig. 1A and B), a
transport mechanism used by endogenous organelles
[24], as well as by invading pathogens such as
adenoviruses [25].
Actively transported gene vectors displayed trans-
port rates much greater than nonactively transported
vectors. At the short time scale of 33 ms, actively
transported gene vectors displayed effective diffusiv-
ities (Deff) similar to those not actively transported
(see Section 5 for definitions of Deff and time scale)
[6]. At a longer time scale of 3 s, however, actively
transported vectors exhibited a higher persistence of
movement, with an average Deff 30-fold greater than
nonactively transported vectors. The average velocity
of actively transported gene vectors was 0.2 Am/s
(Fig. 1C), a value including periods of saltatory
motion, therefore underestimating the maximum
achievable velocity. The trajectories of actively trans-
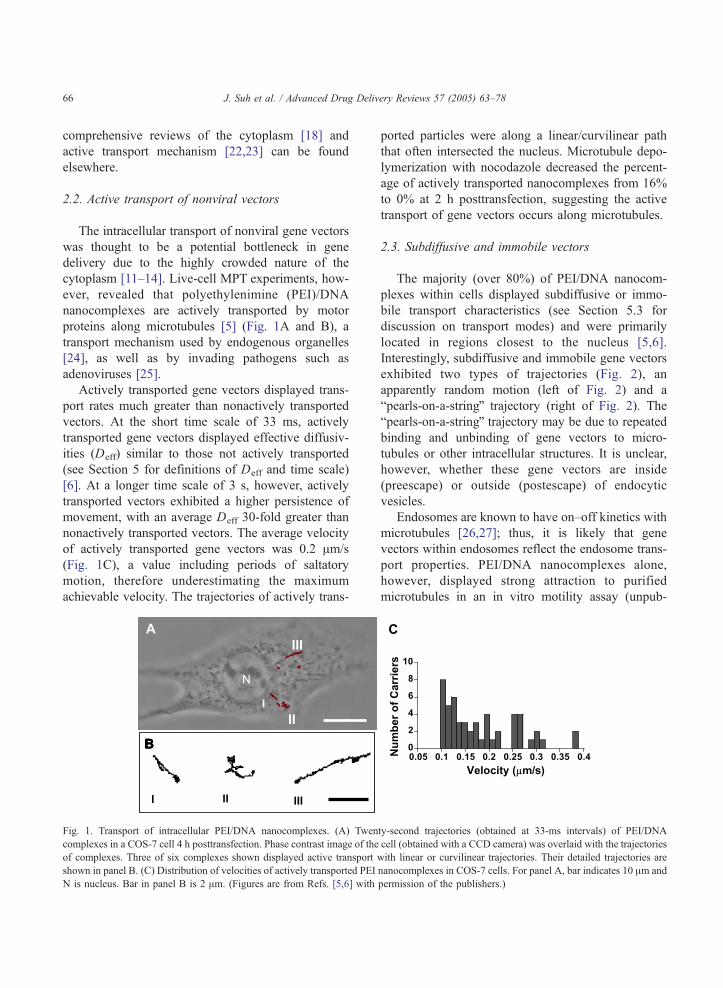
Fig. 1. Transport of intracellular PEI/DNA nanocomplexes. (A) Twen
complexes in a COS-7 cell 4 h posttransfection. Phase contrast image of the
of complexes. Three of six complexes shown displayed active transport
shown in panel B. (C) Distribution of velocities of actively transported PEI
N is nucleus. Bar in panel B is 2 Am. (Figures are from Refs. [5,6] with
ported particles were along a linear/curvilinear path
that often intersected the nucleus. Microtubule depo-
lymerization with nocodazole decreased the percent-
age of actively transported nanocomplexes from 16%
to 0% at 2 h posttransfection, suggesting the active
transport of gene vectors occurs along microtubules.
2.3. Subdiffusive and immobile vectors
The majority (over 80%) of PEI/DNA nanocom-
plexes within cells displayed subdiffusive or immo-
bile transport characteristics (see Section 5.3 for
discussion on transport modes) and were primarily
located in regions closest to the nucleus [5,6].
Interestingly, subdiffusive and immobile gene vectors
exhibited two types of trajectories (Fig. 2), an
apparently random motion (left of Fig. 2) and a
bpearls-on-a-stringQ trajectory (right of Fig. 2). The
bpearls-on-a-stringQ trajectory may be due to repeated
binding and unbinding of gene vectors to micro-
tubules or other intracellular structures. It is unclear,
however, whether these gene vectors are inside
(preescape) or outside (postescape) of endocytic
vesicles.
Endosomes are known to have on–off kinetics with
microtubules [26,27]; thus, it is likely that gene
vectors within endosomes reflect the endosome trans-
port properties. PEI/DNA nanocomplexes alone,
however, displayed strong attraction to purified
microtubules in an in vitro motility assay (unpub-
ty-second trajectories (obtained at 33-ms intervals) of PEI/DNA
cell (obtained with a CCD camera) was overlaid with the trajectories
with linear or curvilinear trajectories. Their detailed trajectories are
nanocomplexes in COS-7 cells. For panel A, bar indicates 10 Am and
permission of the publishers.)

Fig. 2. Example trajectories of subdiffusive or immobile gene
carriers. Each type of trajectory was seen for both immobile and
subdiffusive transport modes. The gene carriers were tracked for 20
s at 33 ms intervals. (Figures are from Ref. [6] with permission of
the publishers.)
J. Suh et al. / Advanced Drug Delivery Reviews 57 (2005) 63–78 67
lished observations), suggesting that gene vectors that
have escaped endosomes may also associate with
cytoskeletal elements to display the bpearls-on-a-stringQ trajectories. Therefore, an attraction of gene
carriers, either inside or outside of endocytic vesicles,
to cytoskeletal structures may account for subdiffusive
and immobile transport modes being dominant near
the cell nucleus. These results also suggest that gene
vectors that have actively transported to the perinu-
clear region and have successfully escaped vesicles
Fig. 3. Intracellular distribution of gene carriers. (A) The cytoplasm was di
the cell without quadrants and with complexes in blue. Bar is 10 Am. (B) A
Inset shows the cross-section of the cell to demonstrate the complexes were
of the gene carriers are overlaid onto phase-contrast images obtained with a
cells with intact microtubules (solid black) and in nocodazole-treated cells
intact microtubules. (Figures are from Ref. [5] with permission of the pub
may still face a formidable task in delivering their
cargo into the nucleus.
2.4. Rapid perinuclear accumulation of gene vectors
The intracellular spatial distribution of PEI/DNA
nanocomplexes was investigated by dividing the
cytoplasm of each cell into four quadrants (Q1–Q4;
Fig. 3A) [5]. PEI/DNA nanocomplexes accumulated
in the perinuclear region (Q1) within 30 min (Fig.
3B). Approximately 40% of the gene vectors were
found in the perinuclear quadrant Q1 at all time points
(Fig. 3C shows 2 h posttransfection time point) [5].
Microtubule depolymerization with nocodazole
inhibited the perinuclear accumulation of PEI/DNA
nanocomplexes (Fig. 3C), suggesting that active
transport along microtubules is required for rapid
perinuclear accumulation of PEI/DNA gene vectors.
The physical transport of PEI/DNA nanocom-
plexes through the cell cytoplasm to the perinuclear
region is not rate-limiting because the vectors are able
to exploit the microtubule-based active transport
mechanism, a strategy used by some of nature’s
efficient DNA viruses [25]. Other bottlenecks to gene
delivery in COS-7 cells must be considered, including
vided into four quadrants (Q1–Q4). N indicates nucleus. Inset shows
cell with gene vectors (green) accumulated in the perinuclear region.
intracellular. Bar is 10 Am. For panels A and B, fluorescence images
CCD camera. (C) Locations of complexes at 2 h posttransfection in
(hatched). Note the lack of perinuclear accumulation in cells without
lishers.)

J. Suh et al. / Advanced Drug Delivery Reviews 57 (2005) 63–7868
endosomal escape [28–30], nuclear import [31], and
vector unpacking [32]. Our group is currently using
MPT to investigate these other barriers.
3. Extracellular barriers
The mucus layer protecting epithelial surfaces of
tissues is a critical extracellular barrier in drug and
gene delivery, including the lungs (aerosol delivery)
and the gastrointestinal tract (oral delivery). Multiple-
particle tracking has recently been used to quantify
particle transport rates in mucus and to gain insight
into particle properties that can reduce adhesive
interactions preventing rapid transport [2].
3.1. Particle transport in human cystic fibrosis (CF)
mucus
Development of therapeutic gene delivery systems
for cystic fibrosis (CF) has been difficult [1]. One
cause of low transfection efficiency in vivo is
inefficient transport rates of gene vectors in CF
mucus, which acts as the primary extracellular barrier
in the CF lung [33,34].
3.1.1. Properties of CF mucus
Mucin fibers in CF mucus, held together by
disulfide bonds between mucin subunits and hydrogen
bonds between the fibers, form a dense mesh that is
intertwined by macromolecules such as filamentous
actin and DNA [1]. The reduced liquid content and
increased branching of mucus glycoproteins, along
with the presence of neutrophil-derived DNA and
cellular debris in CF mucus, leads to an increase in its
viscoelasticity [35]. Mucus permeability is reduced as
viscosity increases owing to increased viscous drag
and steric obstruction from multiple mucus–particle
interactions [36]. Small particles that avoid adhering
to mucus should diffuse relatively rapidly, impeded
only by viscous drag forces and the porous network of
the mucus mesh [2,37].
3.1.2. Heterogeneous particle transport through CF
mucus
The effect of drug/gene carrier size on transport
rates through mucus obtained from patients with CF
was investigated by tracking the motion of uniform
polystyrene particles of various diameters (100, 200,
and 500 nm). Transport rates of the model drug
carriers were heterogeneous to varying degrees in CF
sputum (Fig. 4). The smallest particles (100 nm)
exhibited the greatest range of transport rates, as
quantified by mean-square displacement (MSD; Fig.
4A), which may be a reflection of their ability to
access and move within pores formed by sputum
components more readily than larger particles.
Increasing the particle size led to more uniform
transport properties (Fig. 4B and C), suggesting that
larger particles are unable to transport through the vast
majority of pores available to the smaller particles and
are, thus, less affected by the microheterogeneity of
CF sputum.
Interestingly, a small fraction of particles exhibited
significantly greater transport rates than the majority.
At a time scale of 100 ms, the fastest 10% of 100 nm
particles contributed to ~80% of the ensemble MSD,
whereas the fastest 10% of 200 nm particles con-
tributed to ~60% of the ensemble (Fig. 4D). For 500
nm particles, the fastest 10% contributed to a little less
than 40% of the ensemble value. In comparison, the
fastest 10% of particles moving in a homogenous
medium, such as glycerol, contribute to roughly 10%
of the ensemble MSD. Therefore, larger particles (500
nm) displayed more homogeneous transport than
smaller particles (100 and 200 nm). These results
indicate that fast-moving boutlierQ particles signifi-
cantly affect ensemble average transport rates, an
effect that was amplified as particle size decreased.
Fast-moving boutlierQ particles may be key for
effective gene therapy for cystic fibrosis because it
is estimated only 2–5% of lung epithelial cells must be
transfected [38].
3.1.3. Micro- and macrorheology of CF mucus
The microviscosity of CF sputum was measured by
particle tracking microrheology (see Section 5.4) and
compared to the macroviscosity obtained with a
strain-controlled cone and plate rheometer [2].
Smaller particles (100 nm) moved faster on average
than slightly larger (200 nm) particles in CF sputum
(Fig. 5A). At a time scale of 10s, the ensemble
effective diffusivities of 100 and 200 nm particles in
CF sputum were 1.5�10�2 and 4.5�10�3Am2/s,
respectively. These diffusivity values show that the
microviscosities, calculated from the Stokes–Einstein

Fig. 4. Heterogeneities in particle transport rates in human CF sputum are reduced with increasing particle size. Individual MSDs of (A) 100, (B)
200, and (C) 500 nm particles. (D) The percentage contributions of the fastest 10%, 25%, and 50% particles to the ensemble mean-squared
displacement (hMSDi) is reduced with increasing particle size, confirming that the heterogeneity is reduced with increasing particle size. (Panels
A–C are from Ref. [2] with permission of the publishers.)
J. Suh et al. / Advanced Drug Delivery Reviews 57 (2005) 63–78 69
equation (see Section 5.3.1), are 15- and 7- fold lower
than the macroviscosity determined with the rheom-
eter (Fig. 5B). In light of the observation that a small
number of fast-moving particles strongly influence the
average transport rates, this result indicates there may
exist a small subpopulation of particles capable of
Fig. 5. Micro- and macrorheological properties of CF sputum. (A) Ense
diameter carboxylated polystyrene particles (nz100 particles of each
microviscosities determined with particle tracking (calculated from hMSD
particles), and macroviscosity determined with cone and plate rheomete
permission of the publishers.)
accessing pores in CF sputum filled with fluid that is
significantly less viscous than the bulk viscosity of
sputum. The microviscosity obtained with smaller 100
nm particles was lower than that of 200 nm particles,
further evidence that smaller particles have greater
access to pores in the CF sputum.
mble mean-squared displacements (hMSDi) for 100- and 200-nm-
diameter) in CF sputum (n=3 mucus samples). (B) CF mucus
i at s=10 s, equivalent to shear rate of 0.1 s�1, for 100 or 200 nm
r (shear rate of 0.1 s�1). (Figures are adapted from Ref. [2] with
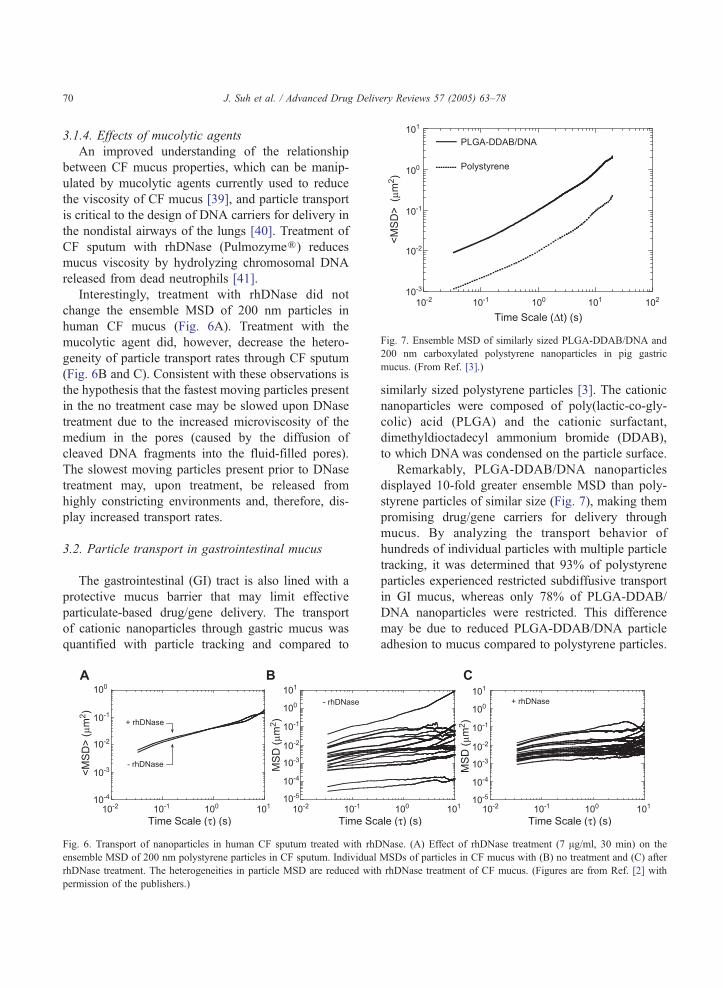
Fig. 7. Ensemble MSD of similarly sized PLGA-DDAB/DNA and
200 nm carboxylated polystyrene nanoparticles in pig gastric
mucus. (From Ref. [3].)
J. Suh et al. / Advanced Drug Delivery Reviews 57 (2005) 63–7870
3.1.4. Effects of mucolytic agents
An improved understanding of the relationship
between CF mucus properties, which can be manip-
ulated by mucolytic agents currently used to reduce
the viscosity of CF mucus [39], and particle transport
is critical to the design of DNA carriers for delivery in
the nondistal airways of the lungs [40]. Treatment of
CF sputum with rhDNase (PulmozymeR) reduces
mucus viscosity by hydrolyzing chromosomal DNA
released from dead neutrophils [41].
Interestingly, treatment with rhDNase did not
change the ensemble MSD of 200 nm particles in
human CF mucus (Fig. 6A). Treatment with the
mucolytic agent did, however, decrease the hetero-
geneity of particle transport rates through CF sputum
(Fig. 6B and C). Consistent with these observations is
the hypothesis that the fastest moving particles present
in the no treatment case may be slowed upon DNase
treatment due to the increased microviscosity of the
medium in the pores (caused by the diffusion of
cleaved DNA fragments into the fluid-filled pores).
The slowest moving particles present prior to DNase
treatment may, upon treatment, be released from
highly constricting environments and, therefore, dis-
play increased transport rates.
3.2. Particle transport in gastrointestinal mucus
The gastrointestinal (GI) tract is also lined with a
protective mucus barrier that may limit effective
particulate-based drug/gene delivery. The transport
of cationic nanoparticles through gastric mucus was
quantified with particle tracking and compared to
Fig. 6. Transport of nanoparticles in human CF sputum treated with rhDNase. (A) Effect of rhDNase treatment (7 Ag/ml, 30 min) on the
ensemble MSD of 200 nm polystyrene particles in CF sputum. Individual MSDs of particles in CF mucus with (B) no treatment and (C) after
rhDNase treatment. The heterogeneities in particle MSD are reduced with rhDNase treatment of CF mucus. (Figures are from Ref. [2] with
permission of the publishers.)
similarly sized polystyrene particles [3]. The cationic
nanoparticles were composed of poly(lactic-co-gly-
colic) acid (PLGA) and the cationic surfactant,
dimethyldioctadecyl ammonium bromide (DDAB),
to which DNAwas condensed on the particle surface.
Remarkably, PLGA-DDAB/DNA nanoparticles
displayed 10-fold greater ensemble MSD than poly-
styrene particles of similar size (Fig. 7), making them
promising drug/gene carriers for delivery through
mucus. By analyzing the transport behavior of
hundreds of individual particles with multiple particle
tracking, it was determined that 93% of polystyrene
particles experienced restricted subdiffusive transport
in GI mucus, whereas only 78% of PLGA-DDAB/
DNA nanoparticles were restricted. This difference
may be due to reduced PLGA-DDAB/DNA particle
adhesion to mucus compared to polystyrene particles.

J. Suh et al. / Advanced Drug Delivery Reviews 57 (2005) 63–78 71
Investigations are underway to understand the phys-
icochemical properties responsible for the enhanced
particle transport and to further reduce particle
interactions with mucus.
4. Other applications
Particle tracking is a useful method to characterize
the transport of proteins and colloids (e.g., drug/gene
carriers) in complex fluids with high spatio-temporal
resolution. Other biological applications include
characterizing the viscoelasticity of the cell cyto-
plasm, quantifying the motion of plasma membrane
components, and investigating the infection pathway
of viruses.
4.1. Viral gene delivery vectors
Adeno-associated viruses (AAV), often used for
gene therapy applications, were labeled with single-
dye molecules and tracked in real time to reveal
biophysical insights into their infection pathway [42].
AAV free of endosomes displayed average diffusiv-
ities twofold greater than those still inside vesicles.
Actively transported AAV exhibited velocities
between 1.8 and 3.7 Am/s, which are on the same
order of magnitude as dynein-mediated active trans-
port [24]. Active transport of AAV was dependent on
the presence of intact microtubules.
4.2. Characterizing cell cytoplasm
As models of the cell cytoplasm, viscoelastic
properties of actin solutions have been characterized
by tracking the motion of beads embedded in the gel
[8,43]. Actin gels were found to be highly heteroge-
neous, especially in the presence of actin-bundling
proteins such as fascin [43]. Such descriptions of the
cell cytoplasm have important consequences in bio-
chemistry [18] where intracellular enzymes were once
thought to be in homogeneous environments. Hetero-
geneity in the cytoplasm may cause enzymes to be
segregated and concentrated in certain regions,
thereby making intracellular reactions spatially
dependent.
Recently, the motion of beads microinjected
directly into the cytoplasm were tracked to ascertain
the viscoelastic properties of the cytoplasm in intact
cells [7]. The compliance of the cell cytoarchitecture
appears to depend on the relative distance to the cell
nucleus, with the region closest to the nucleus being
mechanically the softest.
4.3. Motion of plasma membrane components
An active area of research involving particle
tracking technology is the study of the motion of
plasma membrane components [10,44–48]. Using
gold-labeled antibodies specific for the components,
or fluorescently tagged components themselves,
researchers have quantitatively characterized the
motion of phospholipids [44,45] and transmembrane
proteins [10,46,47]. Fujiwara et al. [45] showed
phospholipids in the cell membrane undergo hop
diffusion between compartments formed by trans-
membrane proteins anchored to the underlying actin
cytoskeleton. Class I major histocompatibility com-
plex molecules (MHC I) also experienced confined
diffusion on the surface of cells, and a deficiency in
a-spectrin (a protein involved in the formation of the
underlying cytoskeleton along with actin) almost
doubled the confined area from 330 to 650 nm [47],
further defining the role of the cytoskeleton in the
mobility of plasma membrane components. Such
particle tracking studies are helping to revise our
understanding of plasma membrane structure, and
how it contributes to important cellular functions
such as cell signaling.
5. Particle tracking technology: a brief tutorial
Single-particle tracking (SPT) has been used in
the field of membrane dynamics to uncover the
transport behavior of proteins and lipids associated
with the plasma membrane [10,44–47]. MPT was
subsequently developed as a high throughput ver-
sion of SPT and has been used to deduce the
viscoelastic properties of complex fluids such as
actin solutions [8,43] and the intracellular environ-
ment [7]. This section briefly discusses the basics of
high-resolution particle tracking. Readers are
referred to Table 1 for a list of symbols and
abbreviations used in the equations and text in the
following sections.

Table 1
Listing of symbols and abbreviations used in the equations in this review
Symbol Parameter Definition
s time scale unit of time over which particle displacement is calculated
Dx, Dy or Dz displacement particle displacement in the x, y or z direction
MSD or hDr2(s)i mean-square displacement time-dependent displacement of a particle, squared
hMSDi or VDr2(s)J ensemble mean-square displacement average of individual particle MSDs
D0 time-independent diffusivity diffusivity of a particle undergoing simple diffusion
Deff or D(s) effective diffusivity or time-dependent
diffusivity
diffusivity of a particle without regard to mode of transport
hDeffi ensemble effective diffusivity average of individual particle effective diffusivities
v velocity mean velocity of a particle undergoing active or
convective motion
a anomalous exponent (value less than 1) characterizes anomalous, or sub-diffusive, particle transport
Fig. 8. Illustration of time scale for a movie obtained at 30 frames/s
J. Suh et al. / Advanced Drug Delivery Reviews 57 (2005) 63–7872
5.1. Time scale
The concept of time scale may not be intuitive at
first, but its importance to particle tracking necessi-
tates its discussion. The shortest time scale achievable
for a given experimental setup is determined by the
maximum speed of the camera and the necessary
acquisition hardware. Assuming a camera is able to
capture images at video rate, or 30 frames/s, the
shortest time scale is 33 ms. The longest time scale, of
course, depends on the length of the movie.
To illustrate the use of time scale, assume a 20-s
movie was captured at 30 frames/s, resulting in a total
of 600 frames recording the movement of a particle.
The time interval between each frame is 33 ms (Fig.
8); therefore, the change in particle displacement from
frame-to-frame can be calculated. A movie of 600
frames results in 599 displacement values. Squaring
the 599 displacements and determining the mean value
results in the mean-square displacement (MSD) at the
time scale of 33 ms. The next shortest time scale is 66
ms (Fig. 8), and there are 598 displacement values for
this time scale. At the other extreme, the largest time
scale for this example is 19,967 ms (20 s minus 33
ms), with one displacement value. Thus, time scale is
the time over which a particle is allowed to move
before calculating its displacement from an initial
point. Because the particle is given more time to move
for longer time scales, it is logical to expect that the
MSD value will increase with increasing time scale.
By examining MSD values over time scale,
insightful information on particle transport can be
obtained. For example, changes in the slope of the
MSD with respect to time scale can be used to
characterize the local dynamics of the microenviron-
ment surrounding each probe particle. In gels or
porous networks with small mesh sizes, micron-
sized particles may undergo subdiffusive transport at
short time scales; however, at larger time scales,
particle motion may appear more diffusive (see
Section 5.3 for discussion on transport modes). The
switch from subdiffusive to diffusive transport may
indicate (a) transient binding of the particles to
molecular partners or (b) the presence of soft dynamic
obstacles created by the gel microstructure, which
promote entropic caging of the particles and prevent
their bfreeQ viscous diffusion. The apparent free
viscous diffusion at longer time scales suggests
untrapping of the particle due to desorption and/or
relaxation of polymer structures (e.g., mucus fibers,
actin filaments) surrounding the particle. These two
different time-scale regimes can be intuitively under-
stood as follows. When tracked with a fast camera
(i.e., short time scales, high frequencies), particles in a
partially elastic medium may appear trapped in local
cages, and the fluid behaves like an elastic solid.
When tracked with a slow camera (i.e., long time
.
J. Suh et al. / Advanced Drug Delivery Reviews 57 (2005) 63–78 73
scales, low frequencies), the particles move from
bcage to cageQ because the fluid has had sufficient
time to relax, and the fluid behaves as a viscous
liquid. This characteristic switch from subdiffusive to
diffusive transport, or the uncaging effect, has been
observed in colloidal suspensions near the glass
transition temperature [49] and in CF sputum [2].
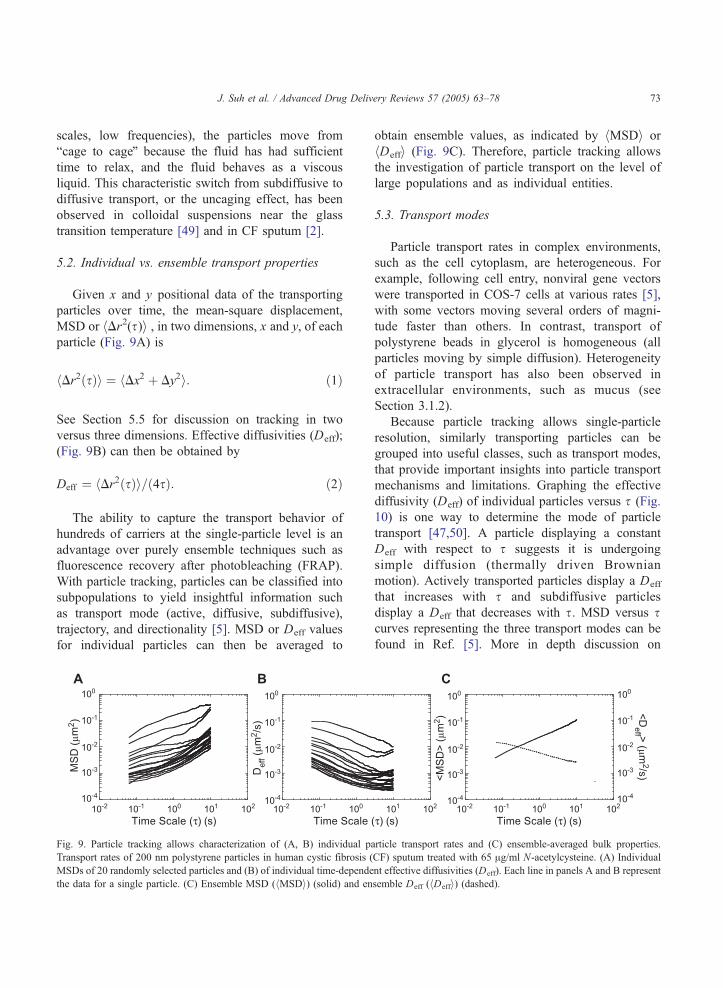
5.2. Individual vs. ensemble transport properties
Given x and y positional data of the transporting
particles over time, the mean-square displacement,
MSD or hDr2(s)i , in two dimensions, x and y, of each
particle (Fig. 9A) is
hDr2 sð Þi ¼ hDx2 þ Dy2i: ð1Þ
See Section 5.5 for discussion on tracking in two
versus three dimensions. Effective diffusivities (Deff);
(Fig. 9B) can then be obtained by
Deff ¼ hDr2 sð Þi= 4sð Þ: ð2Þ
The ability to capture the transport behavior of
hundreds of carriers at the single-particle level is an
advantage over purely ensemble techniques such as
fluorescence recovery after photobleaching (FRAP).
With particle tracking, particles can be classified into
subpopulations to yield insightful information such
as transport mode (active, diffusive, subdiffusive),
trajectory, and directionality [5]. MSD or Deff values
for individual particles can then be averaged to
Fig. 9. Particle tracking allows characterization of (A, B) individual pa
Transport rates of 200 nm polystyrene particles in human cystic fibrosis (
MSDs of 20 randomly selected particles and (B) of individual time-depende
the data for a single particle. (C) Ensemble MSD (hMSDi) (solid) and en
obtain ensemble values, as indicated by hMSDi or
hDeffi (Fig. 9C). Therefore, particle tracking allows
the investigation of particle transport on the level of
large populations and as individual entities.
5.3. Transport modes
Particle transport rates in complex environments,
such as the cell cytoplasm, are heterogeneous. For
example, following cell entry, nonviral gene vectors
were transported in COS-7 cells at various rates [5],
with some vectors moving several orders of magni-
tude faster than others. In contrast, transport of
polystyrene beads in glycerol is homogeneous (all
particles moving by simple diffusion). Heterogeneity
of particle transport has also been observed in
extracellular environments, such as mucus (see
Section 3.1.2).
Because particle tracking allows single-particle
resolution, similarly transporting particles can be
grouped into useful classes, such as transport modes,
that provide important insights into particle transport
mechanisms and limitations. Graphing the effective
diffusivity (Deff) of individual particles versus s (Fig.
10) is one way to determine the mode of particle
transport [47,50]. A particle displaying a constant
Deff with respect to s suggests it is undergoing
simple diffusion (thermally driven Brownian
motion). Actively transported particles display a Deff
that increases with s and subdiffusive particles
display a Deff that decreases with s. MSD versus scurves representing the three transport modes can be
found in Ref. [5]. More in depth discussion on
rticle transport rates and (C) ensemble-averaged bulk properties.
CF) sputum treated with 65 Ag/ml N-acetylcysteine. (A) Individual
nt effective diffusivities (Deff). Each line in panels A and B represent
semble Deff (hDeffi) (dashed).
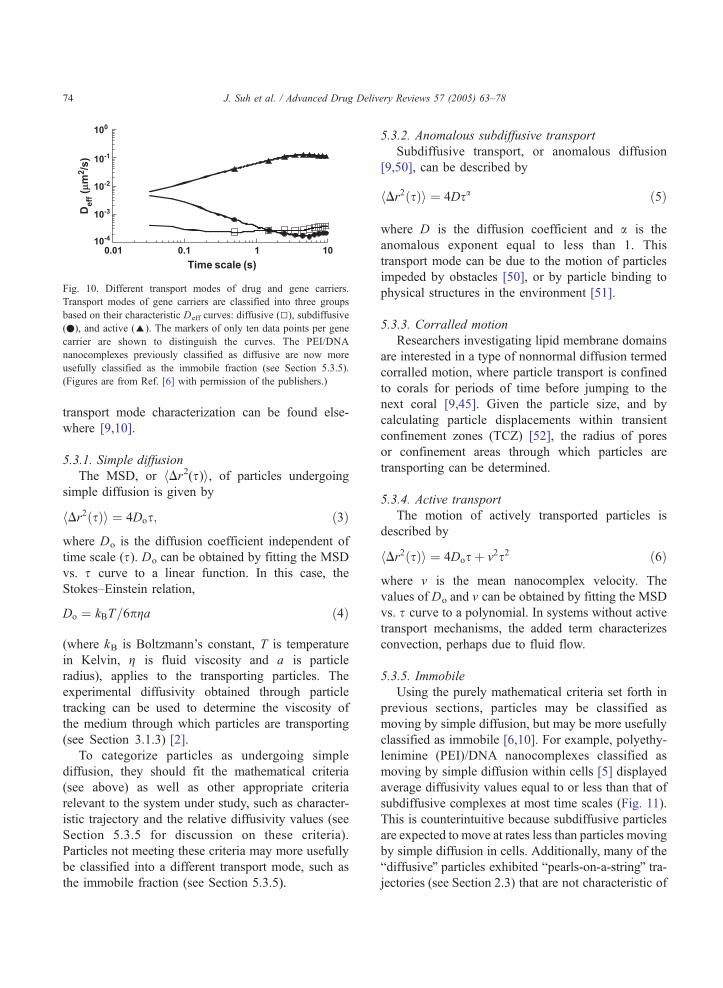
Fig. 10. Different transport modes of drug and gene carriers.
Transport modes of gene carriers are classified into three groups
based on their characteristic Deff curves: diffusive (5), subdiffusive
(.), and active (E). The markers of only ten data points per gene
carrier are shown to distinguish the curves. The PEI/DNA
nanocomplexes previously classified as diffusive are now more
usefully classified as the immobile fraction (see Section 5.3.5).
(Figures are from Ref. [6] with permission of the publishers.)
J. Suh et al. / Advanced Drug Delivery Reviews 57 (2005) 63–7874
transport mode characterization can be found else-
where [9,10].
5.3.1. Simple diffusion
The MSD, or hDr2(s)i, of particles undergoing
simple diffusion is given by
hDr2 sð Þi ¼ 4Dos; ð3Þ
where Do is the diffusion coefficient independent of
time scale (s). Do can be obtained by fitting the MSD
vs. s curve to a linear function. In this case, the
Stokes–Einstein relation,
Do ¼ kBT=6pga ð4Þ
(where kB is Boltzmann’s constant, T is temperature
in Kelvin, g is fluid viscosity and a is particle
radius), applies to the transporting particles. The
experimental diffusivity obtained through particle
tracking can be used to determine the viscosity of
the medium through which particles are transporting
(see Section 3.1.3) [2].
To categorize particles as undergoing simple
diffusion, they should fit the mathematical criteria
(see above) as well as other appropriate criteria
relevant to the system under study, such as character-
istic trajectory and the relative diffusivity values (see
Section 5.3.5 for discussion on these criteria).
Particles not meeting these criteria may more usefully
be classified into a different transport mode, such as
the immobile fraction (see Section 5.3.5).
5.3.2. Anomalous subdiffusive transport
Subdiffusive transport, or anomalous diffusion
[9,50], can be described by
hDr2 sð Þi ¼ 4Dsa ð5Þ
where D is the diffusion coefficient and a is the
anomalous exponent equal to less than 1. This
transport mode can be due to the motion of particles
impeded by obstacles [50], or by particle binding to
physical structures in the environment [51].
5.3.3. Corralled motion
Researchers investigating lipid membrane domains
are interested in a type of nonnormal diffusion termed
corralled motion, where particle transport is confined
to corals for periods of time before jumping to the
next coral [9,45]. Given the particle size, and by
calculating particle displacements within transient
confinement zones (TCZ) [52], the radius of pores
or confinement areas through which particles are
transporting can be determined.
5.3.4. Active transport
The motion of actively transported particles is
described by
hDr2 sð Þi ¼ 4Dos þ v2s2 ð6Þ
where v is the mean nanocomplex velocity. The
values of Do and v can be obtained by fitting the MSD
vs. s curve to a polynomial. In systems without active
transport mechanisms, the added term characterizes
convection, perhaps due to fluid flow.
5.3.5. Immobile
Using the purely mathematical criteria set forth in
previous sections, particles may be classified as
moving by simple diffusion, but may be more usefully
classified as immobile [6,10]. For example, polyethy-
lenimine (PEI)/DNA nanocomplexes classified as
moving by simple diffusion within cells [5] displayed
average diffusivity values equal to or less than that of
subdiffusive complexes at most time scales (Fig. 11).
This is counterintuitive because subdiffusive particles
are expected to move at rates less than particles moving
by simple diffusion in cells. Additionally, many of the
bdiffusiveQ particles exhibited bpearls-on-a-stringQ tra-jectories (see Section 2.3) that are not characteristic of

Fig. 11. Effective diffusivity (Deff) of diffusive and subdiffusive
gene carriers in live cells at short (33 ms) and long (3s) time scales.
Kruskal–Wallis test determined the Deff values for diffusive carriers
are similar at the two time scales, whereas the difference between
Deff values for subdiffusive carriers are statistically significant
( pb10�5) at the two different time scales. These bdiffusiveQ carriersare now more accurately referred to as bimmobileQ. The difference
between diffusive and subdiffusive carriers at the longer time scale
of 3 s is not statistically significant. (Figures are from Ref. [6] with
permission of the publishers.)
J. Suh et al. / Advanced Drug Delivery Reviews 57 (2005) 63–78 75
simple diffusion, thereby making transport mode
categorization dependent not only on mathematical
criteria, but also on qualitative observations. Immobile
gene vectors may be adhered to cytoskeletal elements
(thus their movements may appear Brownian, but may
merely reflect the thermal vibration of the cytoskele-
ton), or may be trapped in tight cages formed by
cellular components, including the cytoskeleton.
5.4. Diffusivities
Particle transport in complex environments may be
described with three different diffusivities: microscopic,
mesoscopic, and macroscopic diffusion coefficients.
5.4.1. Microscopic diffusion
Nanoparticles diffusing in complex biological fluids
may move in microdomains or pores that contain a
lower viscosity fluid than measured by bulk-fluid
Fig. 12. Three important length scales of transport in complex environ
rheological characterization [2]. Multiple-particle
tracking can be used to probe the viscosity in these
microdomains provided that particles are nonadhesive
and small enough to move freely in the interstitial fluid
(Fig. 12A). In these cases, the Stokes–Einstein
equation (see Section 5.3.1) is used to calculate the
microviscosity [2]. Because this equation assumes that
particles are moving by simple diffusion, the micro-
scopic diffusivity is calculated from the MSD at early
time scales when particles undergo unhindered short
range Brownian motion [10]. The validity of this
assumption depends on the combination of experi-
mental system (e.g., proteins v. larger colloids; fluid
properties) and the experimental setup (e.g., speed of
camera). For example, a colloid similar in size to the
pore within which it is moving may require a very fast
camera to capture purely diffusive transport since the
colloid comes into contact with the pore boundaries
quickly, whereas a smaller protein in the same pore
may appear purely diffusive even without the faster
camera. The microscopic diffusivity of the particle can
also be extrapolated to longer time scales, and this
btheoreticalQ curve can then be used to pose criteria on
assigning transport modes [10].
5.4.2. Mesoscopic diffusion
When the diameter of tracked particles approaches
the size of the fluid pores in complex environments,
particle transport is greatly affected by dynamics of
the fluid microstructure (Fig. 12B). In this region of
mesoscopic transport, the particle motion at early time
scales may appear hindered (caged motion); however,
at longer time scales changes in the microstructure of
the fluid can lead to the appearance of diffusive
motion. Particles undergoing this anomalous diffusion
often display biphasic behavior, where Deff decreases
with s at short time scales and approaches a constant
ments: (A) microscopic, (B) mesoscopic, and (C) macroscopic.

Fig. 13. The size of particle relative to the pore diameter, created by
highly ordered filaments in one direction, is an important parameter
in assessing the validity of the isotropic assumption. If filaments are
randomly or equally ordered in all directions, the isotropic
assumption will hold even if particle size approaches that of the
pore diameter.
J. Suh et al. / Advanced Drug Delivery Reviews 57 (2005) 63–7876
value at long time scales [50]. This constant lower
value reflects the mesoscopic diffusion coefficient. A
viscosity calculated from the mesoscopic diffusivity
(termed microviscosity in Ref. [2]) may be lower than
the viscosity measured by traditional rheological
techniques (termed macroviscosity) because the par-
ticles have access to the lower viscosity pores and,
therefore, have greater freedom in motion. By track-
ing particles undergoing mesoscopic transport, the
local environments in heterogeneous solutions (such
as mucus) can be probed and information such as pore
size can be obtained [2,8,53].
5.4.3. Macroscopic diffusion
Multiple-particle tracking can be used to determine
the bulk-fluid rheological properties with the accuracy
of traditional techniques, such as strain-controlled cone
and plate rheometry [7,54]. To accurately probe the
bulk fluid properties, the diameter of particles should
be significantly larger than the fluid pore sizes (thus the
fluid appears as a homogeneous solution to the
particles; Fig. 12C). The key advantage of particle
tracking over traditional methods is the requirement of
substantially less sample volume. For example, a cone
and plate rheometer typically requires N1 ml of sample,
whereas particle tracking in our lab has been accom-
plished reproducibly with ~10 Al of mucus sample.
5.5. 2D v. 3D tracking
As stated previously, the mean-square displace-
ment (MSD) in two dimensions, x and y, is given by
MSD ¼ hDr2 sð Þi2D ¼ hDx2 þ Dy2i: ð1Þ
By assuming the medium through which the particles
transport is locally isotropic, particle displacements in
the x, y, and z axes can be assumed to be uncorrelated.
In another words,
hDr2 sð Þi2D ¼ hDx2i þ hDy2i¼ 2=3ð Þ½hDx2i þ hDy2iþhDz2i
¼ 2=3ð ÞhDr2 sð Þi3D:
The end result is that the two-dimensional (2D) diffusion
coefficient is equal to the three-dimensional (3D) diffu-
sion coefficient (as well as equal to the one-dimensional
(1D) diffusion coefficient) in isotropic environments.
This assumption may not be valid in environments
characterized by structures highly ordered in one
direction and depends on the length scales involved.
To illustrate the importance of length scales, Fig. 13
shows two differently sized particles moving by
diffusion in two dimensions in an environment
characterized by filaments highly ordered in the x-
direction. When particle diameter is much less than the
pore diameter, particle transport in the x and y
directions will be similar, or hDx2i=hDy2i. In this
example, however, when particle diameter is on the
same order of magnitude as the pore diameter, transport
in the y direction will clearly be less than transport in
the x direction, or hDx2iphDy2i. Thus, environments
with ordered structures can be locally isotropic depend-
ing on the length scales involved.
If the isotropic assumption fails for a specific system
under study, three-dimensional transport properties can
be experimentally determined by using changes in
fluorescence intensity as a measure of movement in the
axial z-direction [55]. Microscopes equipped with a
motorized z-drive can be used to track the motion of
particles in all three axes (x, y, and z); however, particle
movements may be too rapid in certain systems to
accurately capture their three-dimensional motion.
5.6. Tracking resolution
With particle tracking, the transport of individual
particles can be obtained with resolutions smaller than
the wavelength of light [56]. Tracking resolution (the
J. Suh et al. / Advanced Drug Delivery Reviews 57 (2005) 63–78 77
ability to track the light-intensity-weighted centroid of
diffraction-limited images) is different from spatial
resolution (the ability to resolve two separate entities)
and can be obtained by two methods. The first method
involves tracking the motion of particles firmly
adhered to a coverslip, and has been reported to be
around 5 nm [43]. Thus, the tracking resolution is
better than the spatial resolution of a system. Alter-
natively, the particle tracking resolution can be
determined by fitting the MSD of particles moving
by simple diffusion (e.g., polystyrene beads moving in
glycerol) to
hDr2 sð Þi ¼ 4r2 þ 4Dos ð7Þ
where r is the resolution [57].
6. Conclusions
Real-time multiple particle tracking is a high-
resolution technology useful for quantifying the
transport of individual drug and gene carriers in
complex biological barriers, such as the cell cyto-
plasm or mucus lining the GI tract or the airways of
the lungs. Studies with particle tracking provide novel
insights into the interactions and processes involved in
the transport of drug and gene vectors through these
important barriers and promises to aid in the rational
evolution of therapeutic colloids.
References
[1] J. Hanes, M. Dawson, Y. Harel, J. Suh, J. Fiegel, in: A.J.
Hickey (Ed.), Gene Delivery to the Lung, in Pharmaceutical
Inhalation Aerosol Technology, Marcel Dekker, New York,
2003, pp. 489–539.
[2] M. Dawson, D. Wirtz, J. Hanes, Enhanced viscoelasticity of
human cystic fibrotic sputum correlates with increasing
microheterogeneity in particle transport, J. Biol. Chem. 278
(2003) 50393–50401.
[3] M. Dawson, E. Krauland, D. Wirtz, J. Hanes, Transport of
polymeric nanoparticle gene carriers in gastric mucus,
Biotechnol. Prog. 20 (2004) 851–857.
[4] C. Kitson, B. Angel, D. Judd, S. Rothery, N.J. Severs, A.
Dewar, L. Huang, S.C. Wadsworth, S.H. Cheng, D.M.
Geddes, E.W. Alton, The extra- and intracellular barriers
to lipid and adenovirus-mediated pulmonary gene transfer
in native sheep airway epithelium, Gene Ther. 6 (1999)
534–546.
[5] J. Suh, D. Wirtz, J. Hanes, Efficient active transport of gene
nanocarriers to the cell nucleus, Proc. Natl. Acad. Sci. U. S. A.
100 (2003) 3878–3882.
[6] J. Suh, D. Wirtz, J. Hanes, Real-time intracellular transport of
gene nanocarriers studied by multiple particle tracking,
Biotechnol. Prog. 20 (2004) 598–602.
[7] Y. Tseng, T.P. Kole, D. Wirtz, Micromechanical mapping of
live cells by multiple-particle-tracking microrheology, Bio-
phys. J. 83 (2002) 3162–3176.
[8] M.T. Valentine, P.D. Kaplan, D. Thota, J.C. Crocker, T. Gisler,
R.K. Prud’homme, M. Beck, D.A. Weitz, Investigating the
microenvironments of inhomogeneous soft materials with
multiple particle tracking, Phys. Rev., E Stat. Nonlinear Soft
Matter Phys. 64 (2001) 061506.
[9] M.J. Saxton, K. Jacobson, Single-particle tracking: applica-
tions to membrane dynamics, Annu. Rev. Biophys. Biomol.
Struct. 26 (1997) 373–399.
[10] A. Kusumi, Y. Sako, M. Yamamoto, Confined lateral
diffusion of membrane receptors as studied by single particle
tracking (nanovid microscopy). Effects of calcium-induced
differentiation in cultured epithelial cells, Biophys. J. 65
(1993) 2021–2040.
[11] D. Luo, W.M. Saltzman, Synthetic DNA delivery systems,
Nat. Biotechnol. 18 (2000) 33–37.
[12] C.W. Pouton, L.W. Seymour, Key issues in non-viral gene
delivery, Adv. Drug Deliv. Rev. 46 (2001) 187–203.
[13] R. Kircheis, L. Wightman, E. Wagner, Design and gene
delivery activity of modified polyethylenimines, Adv. Drug
Deliv. Rev. 53 (2001) 341–358.
[14] G.L. Lukacs, P. Haggie, O. Seksek, D. Lechardeur, N.
Freedman, A.S. Verkman, Size-dependent DNA mobility in
cytoplasm and nucleus, J. Biol. Chem. 275 (2000) 1625–1629.
[15] K. Luby-Phelps, P.E. Castle, D.L. Taylor, F. Lanni, Hindered
diffusion of inert tracer particles in the cytoplasm of mouse 3T3
cells, Proc. Natl. Acad. Sci. U. S. A. 84 (1987) 4910–4913.
[16] J.S. Suk, J. Suh, J. Hanes, Cellular uptake and intracellular
transport of viral and non-viral gene vectors in differentiated
neurons affected in Parkinson’s disease, Proc. Am. Inst. Chem.
Eng.2004, (in press).
[17] R.J. Ellis, Macromolecular crowding: obvious but under-
appreciated, Trends Biochem. Sci. 26 (2001) 597–604.
[18] K. Luby-Phelps, Cytoarchitecture and physical properties of
cytoplasm: volume, viscosity, diffusion, intracellular surface
area, Int. Rev. Cytol. 192 (2000) 189–221.
[19] L. Hou, F. Lanni, K. Luby-Phelps, Tracer diffusion in F-actin
and Ficoll mixtures. Toward a model for cytoplasm, Biophys.
J. 58 (1990) 31–43.
[20] T. Ito, A. Suzuki, T.P. Stossel, Regulation of water-flow by
actin-binding protein-induced actin gelation, Biophys. J. 61
(1992) 1301–1305.
[21] S.J. King, T.A. Schroer, Dynactin increases the processivity of
the cytoplasmic dynein motor, Nat. Cell Biol. 2 (2000) 20–24.
[22] S.F. Hamm-Alvarez, Molecular motors and their role in
membrane traffic, Adv. Drug Deliv. Rev. 29 (1998) 229–242.
[23] T.A. Schroer, Motors, clutches and brakes for membrane
traffic: a commemorative review in honor of Thomas Kreis,
Traffic 1 (2000) 3–10.
J. Suh et al. / Advanced Drug Delivery Reviews 57 (2005) 63–7878
[24] H. Lodish, A. Berk, S.L. Zipursky, P. Matsudaira, D.
Baltimore, J. Darnell, Molecular Cell Biology, 3rd ed., W.
H. Freeman, New York, 1995, pp. 1070–1078.
[25] P.L. Leopold, G. Kreitzer, N. Miyazawa, S. Rempel, K.K.
Pfister, E. Rodriguez-Boulan, R.G. Crystal, Dynein- and
microtubule-mediated translocation of adenovirus serotype 5
occurs after endosomal lysis, Hum. Gene Ther. 11 (2000)
151–165.
[26] M. Clarke, J. Kohler, J. Heuser, G. Gerisch, Endosome fusion
and microtubule-based dynamics in the early endocytic path-
way of Dictyostelium, Traffic 3 (2002) 791–800.
[27] S.J. King, C.L. Brown, K.C. Maier, N.J. Quintyne, T.A.
Schroer, Analysis of the dynein–dynactin interaction in vitro
and in vivo, Mol. Biol. Cell 14 (2003) 5089–5097.
[28] C. Plank, B. Oberhauser, K. Mechtler, C. Koch, E. Wagner,
The influence of endosome-disruptive peptides on gene
transfer using synthetic virus-like gene transfer systems, J.
Biol. Chem. 269 (1994) 12918–12924.
[29] D.W. Pack, D. Putnam, R. Langer, Design of imidazole-
containing endosomolytic biopolymers for gene delivery,
Biotechnol. Bioeng. 67 (2000) 217–223.
[30] M. Ogris, R.C. Carlisle, T. Bettinger, L.W. Seymour, Melittin
enables efficient vesicular escape and enhanced nuclear access
of nonviral gene delivery vectors, J. Biol. Chem. 276 (2001)
47550–47555.
[31] J.A. Wolff, M.G. Sebestyen, Nuclear security breached, Nat.
Biotechnol. 19 (2001) 1118–1120.
[32] D.V. Schaffer, N.A. Fidelman, N. Dan, D.A. Lauffenburger,
Vector unpacking as a potential barrier for receptor-
mediated polyplex gene delivery, Biotechnol. Bioeng. 67
(2000) 598–606.
[33] S. Ferrari, C. Kitson, R. Farley, R. Steel, C. Marriott, D.A.
Parkins, M. Scarpa, B. Wainwright, M.J. Evans, W.H.
Colledge, D.M. Geddes, E.W. Alton, Mucus altering agents
as adjuncts for nonviral gene transfer to airway epithelium,
Gene Ther. 8 (2001) 1380–1386.
[34] C. Kitson, B. Angel, D. Judd, S. Rothery, N.J. Severs, A.
Dewar, L. Huang, S.C. Wadsworth, S.H. Cheng, D.M.
Geddes, E.W.F.W. Alton, The extra- and intracellular
barriers to lipid and adenovirus-mediated pulmonary gene
transfer in native sheep airway epithelium, Gene Ther. 6
(1999) 534–546.
[35] P.G. Bhat, D.R. Flanagan, M.D. Donovan, Drug diffusion
through cystic fibrotic mucus: steady-state permeation, rheo-
logic properties, and glycoprotein morphology, J. Pharm. Sci.
85 (1996) 624–630.
[36] R.A. Cone, Mucus, in: P.L. Ogra (Ed.), Mucosal Immunology,
Academic Press, San Diego, CA, 1999, pp. 43–64.
[37] N.N. Sanders, S.C. De Smedt, E. Van Rompaey, P. Simoens, F.
De Baets, J. Demeester, Cystic fibrosis sputum: a barrier to the
transport of nanospheres, Am. J. Respir. Crit. Care Med. 162
(2000) 1905–1911.
[38] D. Geddes, E. Alton, Cystic fibrosis clinical trials, Adv. Drug
Deliv. Rev. 30 (1998) 205–217.
[39] J.M. Zahm, C. Debordeaux, C. Maurer, D. Hubert, D.
Dusser, N. Bonnet, R.A. Lazarus, E. Puchelle, Improved
activity of an actin-resistant DNase I variant on the cystic
fibrosis airway secretions, Am. J. Respir. Crit. Care Med. 163
(2001) 1153–1157.
[40] M. Fuloria, B.K. Rubin, Evaluating the efficacy of mucoactive
aerosol therapy, Respir. Care 45 (2000) 868–873.
[41] R. Mrsny, A. Daugherty, S. Short, R. Widmer, M. Siegel, G.
Keller, Distribution of DNA and alginate in purulent cystic
fibrosis sputum: implications to pulmonary targeting strat-
egies, J. Drug Target. 4 (1996) 233–243.
[42] G. Seisenberger, M.U. Ried, T. Endress, H. Buning, M.
Hallek, C. Brauchle, Real-time single-molecule imaging of the
infection pathway of an adeno-associated virus, Science 294
(2001) 1929–1932.
[43] J. Apgar, Y. Tseng, E. Fedorov, M.B. Herwig, S.C. Almo, D.
Wirtz, Multiple-particle tracking measurements of heteroge-
neities in solutions of actin filaments and actin bundles,
Biophys. J. 79 (2000) 1095–1106.
[44] G.M. Lee, A. Ishihara, K.A. Jacobson, Direct observation of
Brownian motion of lipids in a membrane, Proc. Natl. Acad.
Sci. U. S. A. 88 (1991) 6274–6278.
[45] T. Fujiwara, K. Ritchie, H.Murakoshi, K. Jacobson, A. Kusumi,
Phospholipids undergo hop diffusion in compartmentalized cell
membrane, J. Cell Biol. 157 (2002) 1071–1081.
[46] E.D. Sheets, G.M. Lee, R. Simson, K. Jacobson, Transient
confinement of a glycosylphosphatidylinositol-anchored pro-
tein in the plasma membrane, Biochemist 36 (1997)
12449–12458.
[47] Q. Tang, M. Edidin, Lowering the barriers to random walks on
the cell surface, Biophys. J. 84 (2003) 400–407.
[48] K. Ritchie, A. Kusumi, Single-particle tracking image micro-
scopy, Method Enzymol. 360 (2003) 618–634.
[49] E.R.Weeks, J.C.Crocker,A.C. Levitt,A. Schofield,D.A.Weitz,
Three-dimensional direct imaging of structural relaxation near
the colloidal glass transition, Science 287 (2000) 627–631.
[50] M.J. Saxton, Anomalous diffusion due to obstacles: a Monte
Carlo study, Biophys. J. 66 (1994) 394–401.
[51] M.J. Saxton, Anomalous diffusion due to binding: a Monte
Carlo study, Biophys. J. 70 (1996) 1250–1262.
[52] C. Dietrich, B. Yang, T. Fujiwara, A. Kusumi, K. Jacobson,
Relationship of lipid rafts to transient confinement zones
detected by single particle tracking, Biophys. J. 82 (2002)
274–284.
[53] Y. Tseng, D. Wirtz, Mechanics and multiple-particle tracking
microheterogeneity of alpha-actinin-cross-linked actin fila-
ment networks, Biophys. J. 81 (2001) 1643–1656.
[54] T.G. Mason, K. Ganesan, J.H. van Zanten, D. Wirtz, S.C. Kuo,
Particle tracking microrheology of complex fluids, Phys. Rev.
Lett. 79 (1997) 3282–3285.
[55] M. Oheim, W. Stuhmer, Tracking chromaffin granules on their
way through the actin cortex, Eur. Biophys. J. 29 (2000) 67–89.
[56] R.N. Ghosh, W.W. Webb, Automated detection and tracking of
individual and clustered cell surface low density lipoprotein
receptor molecules, Biophys. J. 66 (1994) 1301–1318.
[57] J.C. Crocker, D.G.U. Grier, Methods of digital video micro-
scopy for colloidal studies, J. Colloid Interface Sci. 179 (1996)
298–310.