REACTIONS OF CAPTIVE HARBOR PORPOISES (PHOCOENA PHOCOENA) TO PINGER-LIKE SOUNDS
21
MARINE MAMMAL SCIENCE, 22(2): 240–260 (April 2006) C 2006 by the Society for Marine Mammalogy DOI: 10.1111/j.1748-7692.2006.00031.x REACTIONS OF CAPTIVE HARBOR PORPOISES (PHOCOENA PHOCOENA) TO PINGER-LIKE SOUNDS JONAS TEILMANN JAKOB TOUGAARD Institute of Biology, University of Southern Denmark, Campusvej 55, DK-5230 Odense M, Denmark and National Environmental Research Institute, Department of Arctic Environment, Frederiksborgvej 399, DK-4000 Roskilde, Denmark E-mail: [email protected] LEE A. MILLER Institute of Biology, University of Southern Denmark, Campusvej 55, DK-5230 Odense M, Denmark TIM KIRKETERP Institute of Biology, University of Southern Denmark, Campusvej 55, DK-5230 Odense M, Denmark and University of Southern Denmark, IT-Department, Winsløwparken 17.1, DK-5000 Odense C, Denmark KIRSTIN HANSEN 1 SABRINA BRANDO 2 Fjord & Bælt, Margrethes Plads 1, DK-5300 Kerteminde, Denmark ABSTRACT Pingers on gill nets can reduce bycatch of harbor porpoises. If harbor porpoises habituate to pingers, the effect may be reduced or lost. Two captive harbor porpoises were exposed to three sound types. All sounds were in the frequency band from 100 kHz to 140 kHz, 200 ms long, and presented once per 4 s. The source level was 153 dB re 1 Pa RMS at 1 m. Each session consisted of a 10-min presound, a 5-min sound, and a 10-min postsound period. Behavior was recorded on video and on dataloggers placed on the dorsal fin of one animal. The loggers recorded heart rate, swimming speed, dive duration, and depth. The animals responded most strongly 1 Current address: Odense Zoo, Sdr. Boulevard 306, DK 5000 Odense C, Denmark. 2 Current address: Sea Mammal Research Unit, Gatty Marine Laboratory, St. Andrews, Fife KY16 8LB, Scotland. 240
-
Upload
independent -
Category
Documents
-
view
3 -
download
0
Transcript of REACTIONS OF CAPTIVE HARBOR PORPOISES (PHOCOENA PHOCOENA) TO PINGER-LIKE SOUNDS

MARINE MAMMAL SCIENCE, 22(2): 240–260 (April 2006)C© 2006 by the Society for Marine MammalogyDOI: 10.1111/j.1748-7692.2006.00031.x
REACTIONS OF CAPTIVE HARBOR PORPOISES(PHOCOENA PHOCOENA) TO PINGER-LIKE
SOUNDSJONAS TEILMANN
JAKOB TOUGAARD
Institute of Biology, University of Southern Denmark,Campusvej 55, DK-5230 Odense M, Denmark
andNational Environmental Research Institute,
Department of Arctic Environment,Frederiksborgvej 399, DK-4000 Roskilde, Denmark
E-mail: [email protected]
LEE A. MILLER
Institute of Biology, University of Southern Denmark,Campusvej 55, DK-5230 Odense M, Denmark
TIM KIRKETERP
Institute of Biology, University of Southern Denmark,Campusvej 55, DK-5230 Odense M, Denmark
andUniversity of Southern Denmark, IT-Department,
Winsløwparken 17.1, DK-5000 Odense C, Denmark
KIRSTIN HANSEN1
SABRINA BRANDO2
Fjord & Bælt,Margrethes Plads 1, DK-5300 Kerteminde, Denmark
ABSTRACT
Pingers on gill nets can reduce bycatch of harbor porpoises. If harbor porpoiseshabituate to pingers, the effect may be reduced or lost. Two captive harbor porpoiseswere exposed to three sound types. All sounds were in the frequency band from 100kHz to 140 kHz, 200 ms long, and presented once per 4 s. The source level was153 dB re 1 �Pa RMS at 1 m. Each session consisted of a 10-min presound, a 5-minsound, and a 10-min postsound period. Behavior was recorded on video and ondataloggers placed on the dorsal fin of one animal. The loggers recorded heart rate,swimming speed, dive duration, and depth. The animals responded most strongly
1 Current address: Odense Zoo, Sdr. Boulevard 306, DK 5000 Odense C, Denmark.2 Current address: Sea Mammal Research Unit, Gatty Marine Laboratory, St. Andrews, Fife KY16
8LB, Scotland.
240

TEILMANN ET AL.: HARBOR PORPOISE BEHAVIOR 241
to the initial presentations of a sound. Surface time decreased, the heart rate droppedbelow the normal bradycardia, and echolocation activity decreased. The reactionsof both animals diminished rapidly in the following sessions. Should the waning ofresponsiveness apply to wild animals, porpoises may adapt to the sounds but stillavoid nets, or the bycatch may increase after some time. The success of long-termuse of pingers may then depend on the variety of sounds and rates of exposure.
Key words: harbor porpoise, Phocoena phocoena, behavior, habituation, pinger, heartrate, echolocation, swimming, acoustic alarm, bycatch, TDR, datalogger.
Bycatch of harbor porpoises (Phocoena phocoena) in bottom set gill nets has attractedmuch attention (e.g., Perrin et al. 1994). The highest bycatch in Europe was docu-mented by Vinther (1999) and Vinther and Larsen (2004), who estimated that almost7,000 harbor porpoises died in the Danish gill net fishery in the North Sea in 1994.This figure was reduced, because of a decrease in fishing effort and pinger use toabout 4,000 in 2001 (Vinther and Larsen 2004). Trials in commercial fisheries withpingers (acoustic alarms) on gill nets have, in some cases, reduced the bycatch ofharbor porpoises significantly (Kraus et al. 1997, Gearin et al. 1999). However, thelong-term effect on bycatch and the influence of pingers on the behavior of harborporpoises are not well known.
Experiments on the reaction of harbor porpoises to pingers have been carried outin captivity (Kastelein et al. 1995, 1997, 2000; Lockyer et al. 2001), and in the fieldin Canada (Koschinski and Culik 1997, Culik et al. 2001), in the United States (Coxet al. 2001), and on Hector’s dolphins in New Zealand (Stone et al. 1997). The studiesindicate that these small cetaceans are repelled by pingers. However, the specificreactions to the pingers seem to depend on the signal frequency, signal structure, andsource level. Kastelein et al. (1997) tested the displacement in surface locations of acaptive harbor porpoise to 25 different acoustic signals. These preliminary tests wereinconclusive and indicated complex reactions to deterrent sounds. Kastelein et al.(2000) exposed two other harbor porpoises to three pinger or pinger-like signals.They found that all sounds caused an increase in respiration rates, and displaced theharbor porpoises to the far end of the pen. No weakening of the aversive responsewas observed even after months of experimentation. Lockyer et al. (2001) exposedtwo harbor porpoises to three pinger-like signals at three durations (256, 128, and64 ms) and to different click trains. The pinger-like sounds caused a displacementof the porpoises at all durations, and the aversive effect was maintained for the 5 wkof the experiment. The click trains did not have a significant effect. No significantchange in respiration rate was observed for any of the sounds or durations. Cox et al.(2001) studied the habituation of wild harbor porpoises to pingers and found thatdisplacement diminished by 50% within 4 d.
Pingers may have some undesirable side effects during long-term deployment, suchas high bycatch when pingers are malfunctioning, habitat exclusion, high cost andpractical problems for the fishermen, acoustic pollution, and pollution from pingerslost or damaged during use. Added to this is a potential habituation to the sounds bythe animals that may cause the bycatch to increase again after some time. However,habituation may also be an advantage for the animals if the pinger make porpoisesaware of the gill nets but without excluding them from their habitat.
The aim of our study was to observe the basic behavioral and physiological responsesof harbor porpoises to pinger-like sounds, and to determine if repeated exposures to the

242 MARINE MAMMAL SCIENCE, VOL. 22, NO. 2, 2006
Figure 1. Drawing of the enclosure with the four sectors. The position of the soundprojector, observation balcony, and hydrophones are shown. When the porpoises were notseen they were put into a fictive Sector 0, or a no observation sector (NoObs).
same sound resulted in a waning of responses (habituation) after successive stimuluspresentations.
METHODS
Study Site
The study was carried out between 19 and 23 April 1999 at Fjord & Bælt,Kerteminde, Denmark, where an adult female (148 cm, 51 kg) and an adult male(139 cm, 41 kg) harbor porpoise have been kept since April 1997. The experimentalanimals were captured incidentally by commercial fishermen in a fixed pound netwhere fish and porpoises are trapped alive in a small mesh net bag (20 m diame-ter) located about 20 km from the enclosure. The dimensions of the enclosure wereapproximately 36 m long by 15 m wide by 3.5 m deep (depending on the waterlevel). The enclosure was located in a harbor channel between the Great Belt andKerteminde fjord. Strong tidal and wind driven current provided a constant supplyof water through the 10-cm mesh nets that bordered the enclosure. Observationswere carried out from a balcony overlooking the enclosure.
Behavioral and Physiological Measurements
Position of the animals in the enclosure—The acoustic laboratory and observationbalcony were situated about 5 m directly above the water level of the enclosure (Fig. 1).From this platform, both animals were filmed continuously using two Hi8 video

TEILMANN ET AL.: HARBOR PORPOISE BEHAVIOR 243
cameras with two or three audio channels, one on each camera for voice commentsconcerning the placement and behavior of each animal. Because of the height of theobservation platform and the high water clarity during the experiment, the animalscould be followed below the surface for most of the time in most sessions. However,areas under the pontoons along the poolside and under a small holding pen were notvisible to the observers. Polaroid sunglasses were used to reduce the reflections fromthe water surface.
Click activity—Six hydrophones were distributed in the pool (Fig. 1). Signals wentthrough porpoise click detectors (envelope detectors, transforming the ultrasonicclicks into audible signals). Signals from a calibrated Bruel & Kjaer 8103 hydrophoneplaced 1 m from the sound projector were recorded on one channel of the videorecorder, and signals from the remaining five hydrophones (four Sonar ProductsHS150 and one Reson TC4032) were mixed on the other channel of the same videorecorder.
Acceleration and surface time—A pack, consisting of a saddle with a data logger forrecording swimming speed and dive depth on one side and a heart rate monitor onthe other side, was attached to the female. Several materials and designs were testedfor the dorsal fin saddle, but only a 2-mm fiber reinforced rubber, lined with 3-mmneoprene, met our three criteria: (1) gentle to the skin, (2) good glue adherence, and(3) flexible enough to adjust to fin shape and body movements. Suction cups (4.5 cmin diameter for bathtub hooks) were fastened to the saddle making it easy to attachto the dorsal fin with one hand, while stationing the animal with the other hand. Thesaddle was shaped to cover the front and sides of the dorsal fin (front mount design,Fig. 2). A time-depth recorder (TDR, Model Mk6, Wildlife Computers, Seattle,WA) was glued to the saddle with cyanoacrylate (Loctite 414, Loctite Denmark A/S).The dorsal pack had a mass of 250 g in air and was slightly negatively buoyantin seawater. Every 2 s, the tag recorded swimming speed with a turning propeller(resolution 0.05 m/s, with speed dependent accuracy) and depth with a pressure sensor(resolution 1 m; accuracy ± 1 m). Recorded data were downloaded to a computerusing a wire interface (Wildlife Computers). The depth recorder data were used todetermine surface time (depth = 0), which was considered a more reliable behavioralparameter than depth levels in a shallow pool.
Heart rate—A modified human heart rate monitor, Polar Vantage NV (Polar In-struments, Finland) was used to measure heart rate (beats per minute = bpm). Theelectrodes on the chest belt (standard from manufacturer) were cut off and two wireswere soldered to the print board of the transmitter while still in the waterproof plasticcasing. A circular 10 mm × 0.5 mm silver plate (electrode) was soldered to the endof each of the two isolated wires (10 cm and 1 m long) and placed inside suction cups.The backside of the electrodes was painted with nail polish to prevent electrical inter-ference and corrosion. Contact between the skin and the electrodes was maintainedby electrode gel (H&C Medical Devices SpA, Italy). The transmitter was then sealedand glued to the saddle with polyurethane (Sikaflex 291, Sika Danmark A/S). Theheart rate receiver was able to record every heart beat (R-R) or average values every 5,15, or 60 s. After tests we decided to use the average values every five seconds for thisexperiment. The data were transmitted by an electromagnetic field and received andstored by a Polar Vantage NV receiver, which was attached next to the transmitter onthe saddle of the animal with double-sided Velcro strips. During testing, we foundthat heart rate data were corrupted when the transmitter and receiver were mountednext to each other. This problem was related to the light switch in the watch and wassolved by removing the light switch (done by manufacturer). After each session the

244 MARINE MAMMAL SCIENCE, VOL. 22, NO. 2, 2006
Figure 2. Dataloggers attached to the dorsal fin of the female harbor porpoise. The wirefrom the heart rate measurer can be seen on the side of the animal. The two electrodes wereattached under the dorsal pack and with a suction cup close to the heart.
watch was removed from the saddle and data were transferred to a computer using awireless interface (Advantage Interface, Polar Instruments, Finland). The heart raterecorder did not work in four sessions (Sessions 2, 4, 10, 11) because of poor electrodecontact.
Training Requirements
Only the female porpoise could be trained to accept the dorsal fin saddle pack. Shewas trained regularly for about 6 mo to become accustomed to wearing the saddlepack on the dorsal fin under another project (Lockyer et al. 2001). The pack wasattached with four suction cups on the dorsal fin, and the suction cup from the heartrate monitor was placed between the pectoral fins on the ventral side near the heart.The female voluntarily accepted the attachment of the pack at poolside.
Procedure
The experiments were performed during the day from 0900 to 1630. Four to sixsessions per day were conducted, each lasting 25 min. A session consisted of a 10-minpresound period, a 5-min sound period, and a 10-min postsound period.
Ten to 15 min before each session the dorsal pack was placed on the female. Itwas removed again after the session was completed or remained on the animal untilafter the subsequent session. We ran 25 sessions, and our procedure was 12 sessions
TEILMANN ET AL.: HARBOR PORPOISE BEHAVIOR 245
of sound 1 (see below), 6 sessions of sound 2, 4 sessions of sound 1, 3 sessions ofsound 2, and 1 session of sound 3. We devoted the first four sessions to finding asound intensity that produced a clear reaction from the animals. Sessions 1 and 2 hadsource levels of 128 dB re 1 �Pa RMS at 1 m, and Sessions 3 and 4 had source levelsat 132 dB re 1 �Pa RMS at 1 m. The source level for the remaining sessions was153 dB re 1 �Pa RMS at 1 m.
Generation of Sound Stimuli
Three different types of sounds were broadcast to the animals:
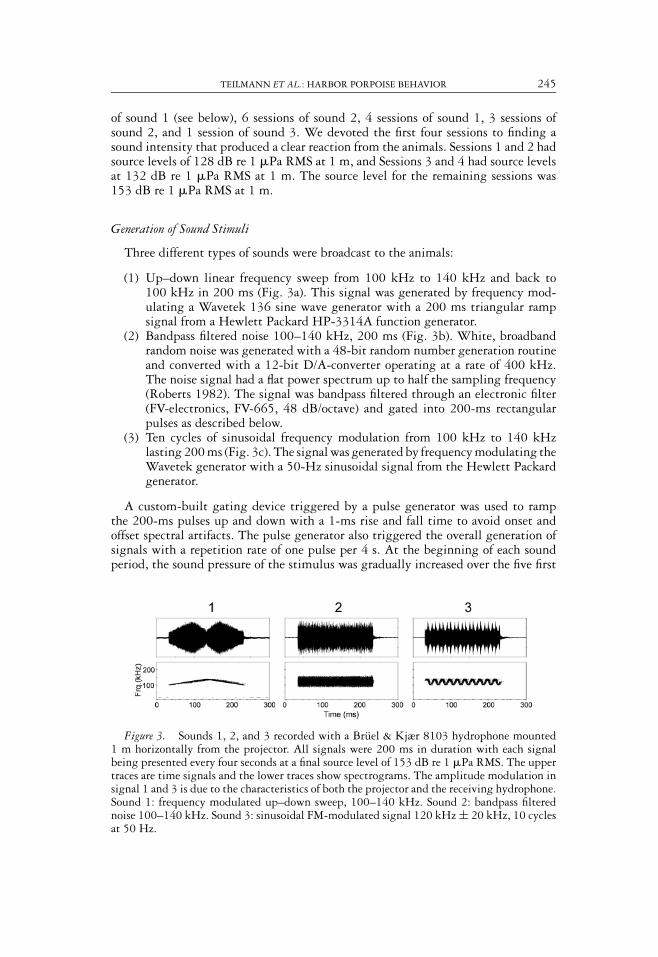
(1) Up–down linear frequency sweep from 100 kHz to 140 kHz and back to100 kHz in 200 ms (Fig. 3a). This signal was generated by frequency mod-ulating a Wavetek 136 sine wave generator with a 200 ms triangular rampsignal from a Hewlett Packard HP-3314A function generator.
(2) Bandpass filtered noise 100–140 kHz, 200 ms (Fig. 3b). White, broadbandrandom noise was generated with a 48-bit random number generation routineand converted with a 12-bit D/A-converter operating at a rate of 400 kHz.The noise signal had a flat power spectrum up to half the sampling frequency(Roberts 1982). The signal was bandpass filtered through an electronic filter(FV-electronics, FV-665, 48 dB/octave) and gated into 200-ms rectangularpulses as described below.
(3) Ten cycles of sinusoidal frequency modulation from 100 kHz to 140 kHzlasting 200 ms (Fig. 3c). The signal was generated by frequency modulating theWavetek generator with a 50-Hz sinusoidal signal from the Hewlett Packardgenerator.
A custom-built gating device triggered by a pulse generator was used to rampthe 200-ms pulses up and down with a 1-ms rise and fall time to avoid onset andoffset spectral artifacts. The pulse generator also triggered the overall generation ofsignals with a repetition rate of one pulse per 4 s. At the beginning of each soundperiod, the sound pressure of the stimulus was gradually increased over the five first
Figure 3. Sounds 1, 2, and 3 recorded with a Bruel & Kjær 8103 hydrophone mounted1 m horizontally from the projector. All signals were 200 ms in duration with each signalbeing presented every four seconds at a final source level of 153 dB re 1 �Pa RMS. The uppertraces are time signals and the lower traces show spectrograms. The amplitude modulation insignal 1 and 3 is due to the characteristics of both the projector and the receiving hydrophone.Sound 1: frequency modulated up–down sweep, 100–140 kHz. Sound 2: bandpass filterednoise 100–140 kHz. Sound 3: sinusoidal FM-modulated signal 120 kHz ± 20 kHz, 10 cyclesat 50 Hz.

246 MARINE MAMMAL SCIENCE, VOL. 22, NO. 2, 2006
stimulus presentations in 10 dB-steps for the frequency-modulated signals (sounds 1and 3), 113–153 dB re 1 �Pa RMS at 1 m. The noise signal (sound 2) was increasedin 20-dB steps to the final amplitude, two signals at 113 dB, two at 133 dB, the restat 153 dB re 1 �Pa RMS at 1 m.
Signals were projected into the pool through a Sonar Products HS150 sphericalhydrophone, driven by a Yamaha AX-380 power amplifier. The amplifier was placedclose to the transmitting hydrophone to avoid driving the crystal through long cables.Transmitting characteristics of the entire system (amplifier and hydrophone) were flat(±3 dB) in the range 100–140 kHz. The projector was mounted at a depth of 1 mat a position where the depth of the enclosure was 3–4 m (depending on the waterlevel).
The quality and source level of the transmitted signals were continuously moni-tored with a B&K 8103 hydrophone (Bruel & Kjær, Copenhagen, Denmark) mounted1 m horizontally from the projector. The hydrophone signal was amplified by a pream-plifier (ETEC, Copenhagen, Denmark), low-pass filtered (160 kHz) and recorded ona computer with a 12-bit A/D converter operating at a sampling rate of 500 kHzfor subsequent analysis. The source level of transmitted signals was calculated bycomparison with a reference signal from a B&K 4223 pistonphone.
Data Analysis
Spatial distribution—The pool was divided into four sectors of roughly the same size(Fig. 1), and the time each animal spent in each sector was subsequently calculatedfor each session and for each of the three observation periods (presound, sound, andpostsound). The first 30 s of the sound period were ignored for two reasons: (1) thesound pressure of the stimulus was increased in steps over the first five pulses, reachingthe final level after 16 s; and (2) when the sound was turned on, the animals oftenshowed a strong aversive response to the sound and swam toward the far end of thepool immediately. If they happened to be in Sector 4, in which the sound source waslocated, their presence in this sector was thus a result of where they were immediatelyprior to the sound being turned on and not a result of the sound presentation.
In most of the sessions, it was not possible to follow the animals all the timebecause a few small areas of the pool were outside our view (e.g., below the pontoonsand below a floating temporary holding pool located in Sector 1) or because waterclarity or sun reflections impaired visibility through the water. These periods withno observations, termed NoObs, are treated in the same way as the observations fromSector 1 though 4 and can be considered to represent assignment of the animal to a“fifth sector” of the pool. This “fifth sector” is not as clearly defined as the four others,but still roughly represents a noncontinuous area of the pool where the animals wereout of sight. The water visibility and glare from the sun, which changed somewhatfrom session to session but not within sessions, influence the extent of this “fifthsector.”
Chi-squared comparisons between observation periods—To compare the spatial–temporaldistribution across sectors in the three observation periods, a chi-squared (� 2) com-parison was performed. Each observation period was divided into 1-s intervals, andthe total number of seconds spent in each sector of the pool was compared pairwiseacross the observation periods. A correlation analysis showed that there was no sig-nificant correlation between the time spent in one sector during the presound periodand the time spent in the same sector during the subsequent stimulus period. Onlyfor the NoObs class was a significant correlation found for both animals. The general

TEILMANN ET AL.: HARBOR PORPOISE BEHAVIOR 247
lack of correlation between the presound and stimulus periods for each individualjustified pooling all presound observations for each animal into a mean spatiotempo-ral distribution. For each of the 25 sessions, � 2 values were calculated by comparingthe distribution from the stimulus period to the mean presound distribution of theparticular animal. � 2 is in this case given as:
� 2 =∑
i
(Si − Si )2
Si
,
where i is the sector in question (Sector1 though 4 and NoObs), Si is the number ofseconds spent in Sector i, and Si is the expected number of seconds spent in Sectori, given that there is no difference between the spatiotemporal distribution in thepresound and sound period. Si is given as:
Si = Pi
n
ds
db,
where Pi is the summed time spent in Sector i during all presound periods, n is thenumber of sessions (25), db is the duration of presound period (600 s), and d s is theduration of the stimulus period (270 s).
The normal use of the � 2 statistic is in testing for significant differences betweendistributions. We cannot use it this way in the current experiment, because an im-portant prerequisite for the test is violated. Each of the individual observations (thesector in which the animal was in a given second) was, without doubt, stronglyinfluenced by where the animal was in the previous second. Thus, the observationswere not independent. This, however, does not prohibit the use of the � 2 statisticas a relative measure of difference between the mean presound period and individualsound periods.
Click activity—For all sessions, the number of seconds containing click bursts weretallied for each minute of the last 5 min of the presound period and for each minduring the 5-min sound presentation in recordings from the monitoring hydrophonein Sector 4 (Fig. 1, 9). For Sessions 13 and 18, click activity in Sector 4 was talliedsecond by second during the presound, sound, and postsound periods (Fig. 4, 5).
Surface time—Dive depth of the female was measured and recorded every two sec-onds by the dorsal pack. The depth sensor must acclimate to the water temperaturefor accurate readings. On some sessions, the depth sensor was not completely accli-mated at the start of the presound period. Therefore the presound recordings werelimited to 5 min instead of 10 min for surface time.
Acceleration—Swimming speed of the female was sampled every 2 s by the dorsalpack. Since swimming speed was thought to be limited by the size of the enclosure,the change in speed (positive or negative acceleration) from one sample to the nextwas decided to be a better measure of change in behavior, like turning, diving, andsurfacing, than absolute speed readings.
RESULTS
Response to Sounds
The following is a description of the responses to the first playback of a novelstimulus (noise, sound 2) and to the sixth playback of the same stimulus illustrating
248 MARINE MAMMAL SCIENCE, VOL. 22, NO. 2, 2006
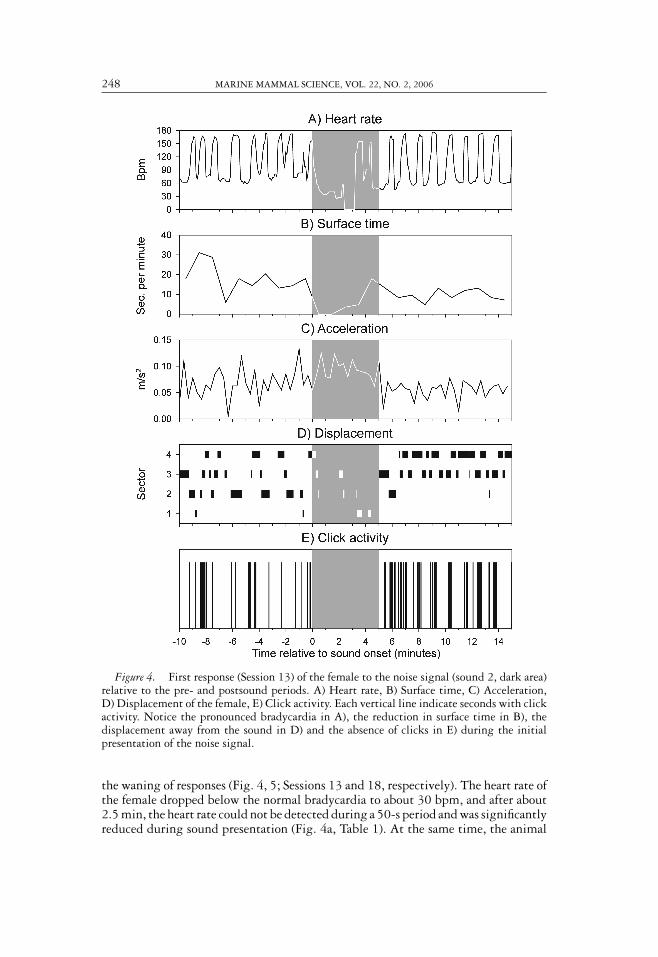
Figure 4. First response (Session 13) of the female to the noise signal (sound 2, dark area)relative to the pre- and postsound periods. A) Heart rate, B) Surface time, C) Acceleration,D) Displacement of the female, E) Click activity. Each vertical line indicate seconds with clickactivity. Notice the pronounced bradycardia in A), the reduction in surface time in B), thedisplacement away from the sound in D) and the absence of clicks in E) during the initialpresentation of the noise signal.
the waning of responses (Fig. 4, 5; Sessions 13 and 18, respectively). The heart rate ofthe female dropped below the normal bradycardia to about 30 bpm, and after about2.5 min, the heart rate could not be detected during a 50-s period and was significantlyreduced during sound presentation (Fig. 4a, Table 1). At the same time, the animal
TEILMANN ET AL.: HARBOR PORPOISE BEHAVIOR 249
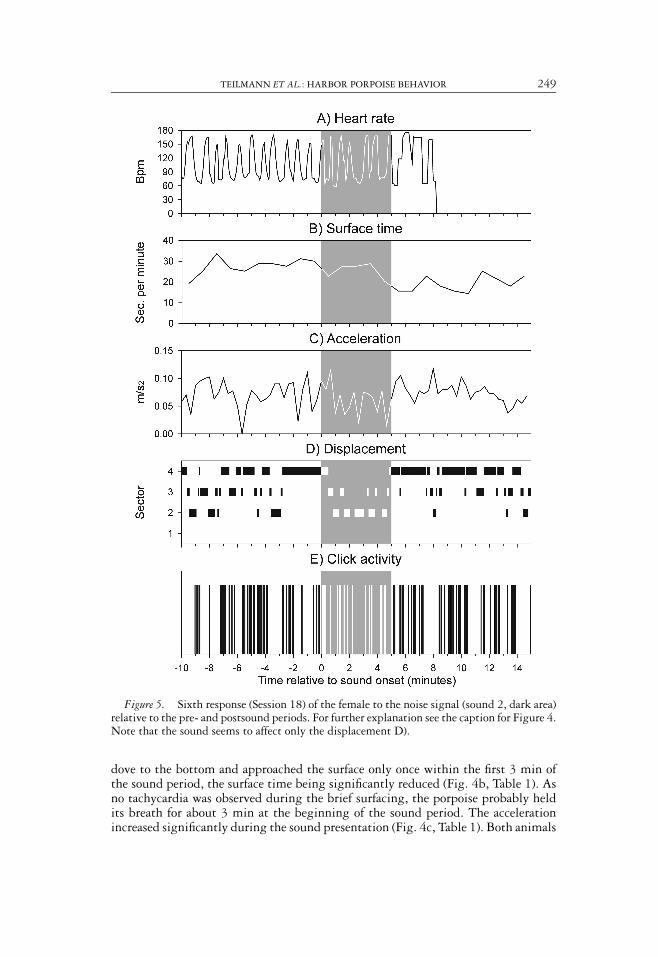
Figure 5. Sixth response (Session 18) of the female to the noise signal (sound 2, dark area)relative to the pre- and postsound periods. For further explanation see the caption for Figure 4.Note that the sound seems to affect only the displacement D).
dove to the bottom and approached the surface only once within the first 3 min ofthe sound period, the surface time being significantly reduced (Fig. 4b, Table 1). Asno tachycardia was observed during the brief surfacing, the porpoise probably heldits breath for about 3 min at the beginning of the sound period. The accelerationincreased significantly during the sound presentation (Fig. 4c, Table 1). Both animals
250 MARINE MAMMAL SCIENCE, VOL. 22, NO. 2, 2006
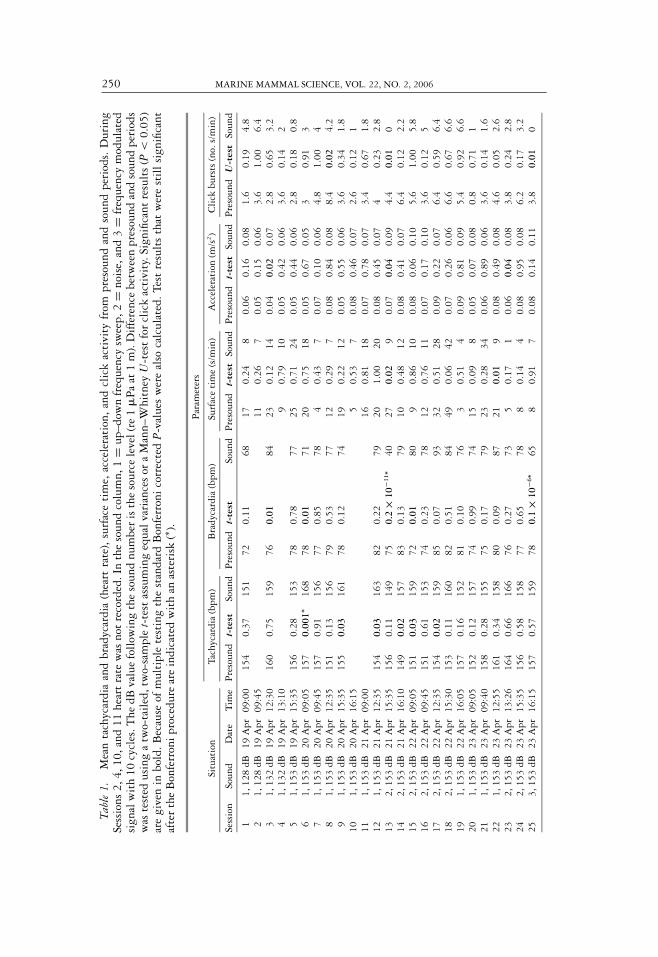
Tabl
e1.
Mea
nta
chyc
ardi
aan
dbr
adyc
ardi
a(h
eart
rate
),su
rfac
eti
me,
acce
lera
tion
,an
dcl
ick
acti
vity
from
pres
ound
and
soun
dpe
riod
s.D
urin
gSe
ssio
ns2,
4,10
,and
11he
art
rate
was
not
reco
rded
.In
the
soun
dco
lum
n,1
=up
–dow
nfr
eque
ncy
swee
p,2
=no
ise,
and
3=
freq
uenc
ym
odul
ated
sign
alw
ith
10cy
cles
.The
dBva
lue
foll
owin
gth
eso
und
num
ber
isth
eso
urce
leve
l(re
1�
Pa
at1
m).
Dif
fere
nce
betw
een
pres
ound
and
soun
dpe
riod
sw
aste
sted
usin
ga
two-
tail
ed,t
wo-
sam
ple
t-te
stas
sum
ing
equa
lvar
ianc
esor
aM
ann–
Whi
tney
U-t
est
for
clic
kac
tivi
ty.S
igni
fican
tre
sult
s(P
<0.
05)
are
give
nin
bold
.Bec
ause
ofm
ulti
ple
test
ing
the
stan
dard
Bon
ferr
oni
corr
ecte
dP
-val
ues
wer
eal
soca
lcul
ated
.Tes
tre
sult
sth
atw
ere
stil
lsi
gnifi
cant
afte
rth
eB
onfe
rron
ipro
cedu
rear
ein
dica
ted
wit
han
aste
risk
(∗ ).
Par
amet
ers
Situ
atio
nTa
chyc
ardi
a(b
pm)
Bra
dyca
rdia
(bpm
)Su
rfac
eti
me
(s/m
in)
Acc
eler
atio
n(m
/s2)
Cli
ckbu
rsts
(no.
s/m
in)
Sess
ion
Soun
dD
ate
Tim
eP
reso
und
t-te
stSo
und
Pre
soun
dt-
test
Soun
dP
reso
und
t-te
stSo
und
Pre
soun
dt-
test
Soun
dP
reso
und
U-t
est
Soun
d
11,
128
dB19
Apr
09:0
015
40.
3715
172
0.11
6817
0.24
80.
060.
160.
081.
60.
194.
82
1,12
8dB
19A
pr09
:45
110.
267
0.05
0.15
0.06
3.6
1.00
6.4
31,
132
dB19
Apr
12:3
016
00.
7515
976
0.01
8423
0.12
140.
040.
020.
072.
80.
653.
24
1,13
2dB
19A
pr13
:10
90.
7910
0.05
0.42
0.06
3.6
0.14
25
1,15
3dB
19A
pr15
:35
156
0.28
153
780.
7877
250.
7124
0.05
0.44
0.06
2.8
0.18
0.8
61,
153
dB20
Apr
09:0
515
70.
001∗
168
780.
0171
200.
7518
0.05
0.67
0.05
30.
913
71,
153
dB20
Apr
09:4
515
70.
9115
677
0.85
784
0.43
70.
070.
100.
064.
81.
004
81,
153
dB20
Apr
12:3
515
10.
1315
679
0.53
7712
0.29
70.
080.
840.
088.
40.
024.
29
1,15
3dB
20A
pr15
:35
155
0.03
161
780.
1274
190.
2212
0.05
0.55
0.06
3.6
0.34
1.8
101,
153
dB20
Apr
16:1
55
0.53
70.
080.
460.
072.
60.
121
111,
153
dB21
Apr
09:0
016
0.81
180.
070.
780.
073.
40.
671.
812
1,15
3dB
21A
pr12
:35
154
0.03
163
820.
2279
201.
0020
0.08
0.45
0.07
40.
232.
813
2,15
3dB
21A
pr15
:35
156
0.11
149
750.
2×
10−
11∗
4027
0.02
90.
070.
040.
094.
40.
010
142,
153
dB21
Apr
16:1
014
90.
0215
783
0.13
7910
0.48
120.
080.
410.
076.
40.
122.
215
2,15
3dB
22A
pr09
:05
151
0.03
159
720.
0180
90.
8610
0.08
0.06
0.10
5.6
1.00
5.8
162,
153
dB22
Apr
09:4
515
10.
6115
374
0.23
7812
0.76
110.
070.
170.
103.
60.
125
172,
153
dB22
Apr
12:3
515
40.
0215
985
0.07
9332
0.51
280.
090.
220.
076.
40.
596.
418
2,15
3dB
22A
pr15
:30
153
0.11
160
820.
5184
490.
0642
0.07
0.26
0.06
6.6
0.67
6.6
191,
153
dB22
Apr
16:0
515
70.
1615
281
0.10
763
0.51
40.
090.
810.
095.
40.
926.
620
1,15
3dB
23A
pr09
:05
152
0.12
157
740.
9974
150.
098
0.05
0.07
0.08
0.8
0.71
121
1,15
3dB
23A
pr09
:40
158
0.28
155
750.
1779
230.
2834
0.06
0.89
0.06
3.6
0.14
1.6
221,
153
dB23
Apr
12:5
516
10.
3415
880
0.09
8721
0.01
90.
080.
490.
084.
60.
052.
623
2,15
3dB
23A
pr13
:26
164
0.66
166
760.
2773
50.
171
0.06
0.04
0.08
3.8
0.24
2.8
242,
153
dB23
Apr
15:3
515
60.
5815
877
0.65
788
0.14
40.
080.
950.
086.
20.
173.
225
3,15
3dB
23A
pr16
:15
157
0.57
159
780.
1×
10−
6∗65
80.
917
0.08
0.14
0.11
3.8
0.01
0

TEILMANN ET AL.: HARBOR PORPOISE BEHAVIOR 251
Figure 6. Utilization of the pool by the two harbor porpoises (male on top, female below)before, during, and after sound presentations. (The animal’s position was not tallied duringthe first 30 s of sound.) The bars show the percentage of time each animal spent in eachobservation sector of the pool during each session. NoObs is the percentage of time the animalwas out of sight. Session number and sound type is indicated. The sound source is located inSector 4. The general trend is that both animals spend less time in Sector 4 and more time inSector 1 when the sound is on.
swam away from the sound and completely avoided Sector 4, where the sound sourcewas located (Fig. 4d, 6). No clicks were recorded on the hydrophone next to the soundprojector during sound presentation (Fig. 4e). After the sound was turned off, thebehavior of the porpoises immediately returned to what was considered normal, theonly exceptions being a very high echolocation activity recorded on the hydrophonenext to the sound projector (Fig. 4e) and the female spending more time in Sector 4(Fig. 6) compared with that in the presound period.
In Session 18, sound 2 (noise) was projected for the sixth consecutive time. No clearresponse was seen on the heart rate (Fig. 5a), in surface time (Fig. 5b), in acceleration(Fig. 5c), or in click activity (Fig. 5e), and there was no significant difference between
252 MARINE MAMMAL SCIENCE, VOL. 22, NO. 2, 2006
the presound and sound periods for these parameters (Table 1). The animals movedaway from the sound, but were also spending some time in Sector 4, where the soundwas emitted (Fig. 5d, 6). After the sound was turned off, the behavior of the femalewas similar to the presound period.
Displacement
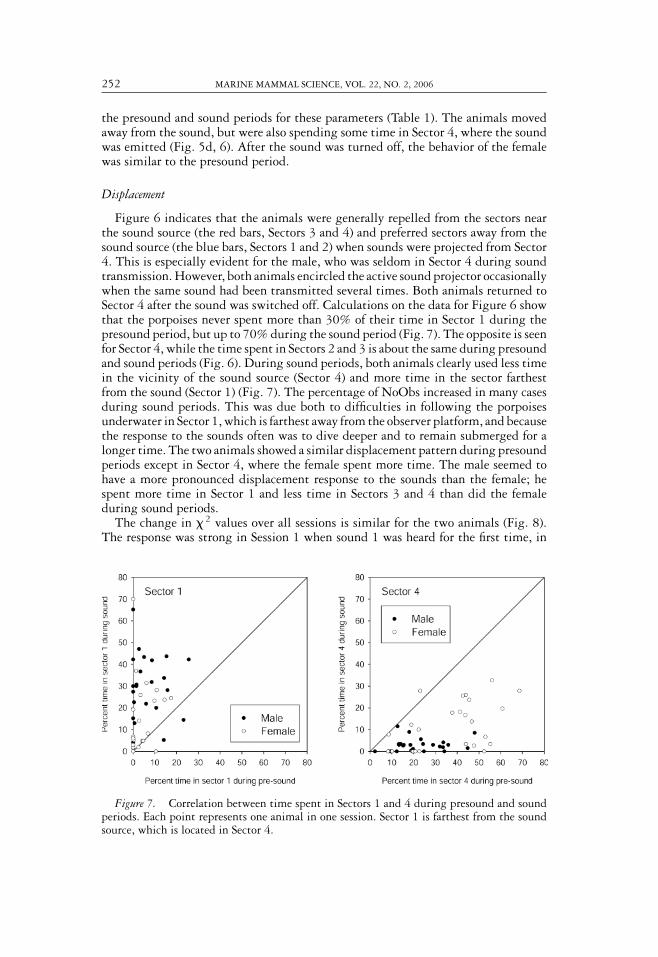
Figure 6 indicates that the animals were generally repelled from the sectors nearthe sound source (the red bars, Sectors 3 and 4) and preferred sectors away from thesound source (the blue bars, Sectors 1 and 2) when sounds were projected from Sector4. This is especially evident for the male, who was seldom in Sector 4 during soundtransmission. However, both animals encircled the active sound projector occasionallywhen the same sound had been transmitted several times. Both animals returned toSector 4 after the sound was switched off. Calculations on the data for Figure 6 showthat the porpoises never spent more than 30% of their time in Sector 1 during thepresound period, but up to 70% during the sound period (Fig. 7). The opposite is seenfor Sector 4, while the time spent in Sectors 2 and 3 is about the same during presoundand sound periods (Fig. 6). During sound periods, both animals clearly used less timein the vicinity of the sound source (Sector 4) and more time in the sector farthestfrom the sound (Sector 1) (Fig. 7). The percentage of NoObs increased in many casesduring sound periods. This was due both to difficulties in following the porpoisesunderwater in Sector 1, which is farthest away from the observer platform, and becausethe response to the sounds often was to dive deeper and to remain submerged for alonger time. The two animals showed a similar displacement pattern during presoundperiods except in Sector 4, where the female spent more time. The male seemed tohave a more pronounced displacement response to the sounds than the female; hespent more time in Sector 1 and less time in Sectors 3 and 4 than did the femaleduring sound periods.
The change in � 2 values over all sessions is similar for the two animals (Fig. 8).The response was strong in Session 1 when sound 1 was heard for the first time, in
Figure 7. Correlation between time spent in Sectors 1 and 4 during presound and soundperiods. Each point represents one animal in one session. Sector 1 is farthest from the soundsource, which is located in Sector 4.

TEILMANN ET AL.: HARBOR PORPOISE BEHAVIOR 253
Figure 8. Chi-squared values based on the observed and expected placement of the twoharbor porpoises in the enclosure during sound exposure. Higher values show greater dis-placement. (See text for details). Arrows indicate the second series of stimuli of each sound.
Session 13 when sound 2 was heard for the first time, and in Session 25 when sound3 was heard for the first (and only) time (Fig. 8). Waning of strong displacementresponses is seen after one or two sessions for both animals.
Heart Rate
During normal swimming, we found that the heart rate of the female changeddramatically (about 100 bpm) within a few seconds from distinct tachycardia atsurface to bradycardia when diving. To be able to test the effect of the sounds on bothtachycardia and bradycardia, we divided the bimodal distribution of the heart rateinto two groups. This was done by plotting all heart rate readings in 10-unit intervalsand taking the minimum value between the two peaks of the frequency distribution.This value was 120 bpm. Two-tailed t-tests (assuming equal variances) were appliedto test whether the mean tachycardia and mean bradycardia of the animal was affectedby the sound. For each session, all tachycardia readings in the presound period (n =45–83) and the sound period (n = 10–36) were tested against each other as wereall bradycardia readings during the presound (n = 42–97) and sound period (n =25–50).
The heart rate during tachycardia was significantly affected in 6 out of 21 sessions(6, 9, 12, 14, 15, 17 in Table 1 and Fig. 9). In all six sessions, the mean tachycardiaincreased (5–11 bpm, average 8 bpm). In the remaining sessions, the mean tachycardiabetween presound and sound changed by 7 bpm or less (Table 1). Significant resultswere found only during the first series of presentation of sounds 1 and 2.
The change in bradycardia was significantly affected in 5 out of 21 sessions (Sessions3, 6, 13, 15, 25 in Table 1 and Fig. 9). In three sessions the mean bradycardia decreased(Sessions 6, 13, and 25 by 7–35 bpm, average 18 bpm) and increased in two sessions(Sessions 3 and 15 by 8 and 12 bpm, average 10). Significant results were found forbradycardia in Sessions 3, 6, and 15 while the first presentation of sounds 2 and 3 inSessions 13 and 25 gave highly significant results.

254 MARINE MAMMAL SCIENCE, VOL. 22, NO. 2, 2006
Figure 9. Ratio of average click activity, heart rate, surface time, and acceleration duringsound presentation relative to the presound period for each type of sound. The asterisks showsignificant differences (see Table 1). Note that there are significant differences in four of thefive parameters in Session 13, the first presentation of sound 2 (a noise pulse). Note also thatthe ratio returns rapidly to near 1 in Sessions 15–18 for click activity, bradycardia, and surfacetime, suggesting rapid adaptation.
Surface Time, Acceleration, and Click Activity
Surface time was significantly affected in only 2 of the 25 sessions (Sessions 13 and22; t-test Table 1 and Fig. 9), one of these being when sound 2 was presented for the
TEILMANN ET AL.: HARBOR PORPOISE BEHAVIOR 255
first time. In both cases, the surface time decreased during sound presentation. Thechange in acceleration was significantly affected in 3 of 25 sessions (Sessions 3, 13,and 23; Table 1, Fig. 9), again one of these being when sound 2 was presented forthe first time. Click activity significantly decreased during sound presentation in 3of the 25 sessions. When sounds 2 and 3 were presented for the first time in Sessions13 and 25, no echolocation activity was recorded (Table 1, Fig. 9).
Summary of Test Results
In summary, four of the five measured parameters changed significantly in Session13, the first presentation of sound 2, giving decreases in bradycardia, surface time,and click activity, and an increase in acceleration (Fig. 9, Table 1). There was asignificant decrease in bradycardia and click activity during Session 25 when sound3 was presented for the first time.
DISCUSSION
Three overall effects were observed in our experiments. First, the animals reactedto all the sounds in all sessions by moving away from Sector 4 containing the soundsource (Fig. 6, 7). They did this regardless of the order in which we played the sounds.This avoidance response is especially interesting since the animals are by no meansnaive. They were introduced to the facility in April 1997 and since then have hadsufficient time to adapt to boat sounds and other noises in the harbor. Unrelated butsimilar, studies in October–November 1998 and in February–March 1999 (Lockyeret al. 2001) used pinger-like sounds, some of which resembled sound 1 (up–downsweep) we used in the present study.
Second, reactions were strongest for the first presentation of each sound. This canbe seen in displacement reactions (Fig. 8, we believe that the strong displacement ofthe male in Session 21 was due to a fishing boat turning right outside the enclosure).The reduced magnitude of the first reaction to sound 1 was perhaps influenced by thelow source level (128 dB, Table 1) at the start of our study, which was required byFjord & Bælt. The female showed significant responses to four of the five measuredparameters when sound 2 was presented for the first time (Fig. 4, 9, Table 1). Allthree sounds were identical in duration, bandwidth, and energy, but the reactionsindicate that the animals did not generalize from one sound to the next. On the otherhand, there was no general tendency for the animals to react when the same sound (1and 2) was first presented in a second series (Fig. 8, 9). This result suggests that theanimals could remember specific sounds, at least during the course of this 5-d study.
Third, and perhaps most important, the responses waned rapidly after the initialpresentation of a sound (Fig. 5, 8, 9; especially after Session 13). This rapid waningmay reflect an adaptation of harbor porpoises to unknown sounds that they oftenexperience in their coastal habitat with high human activity. However, the fact thatthe captive animals had extensive experiences with many different types of harborsounds, and previous sound exposure experiments may have influenced the speed ofthe waning.
Waning of the Startle Response
We define the startle response as a significant change in the heart rate, bradycardia,or tachycardia, between the presound and sound periods. Significant changes of either

256 MARINE MAMMAL SCIENCE, VOL. 22, NO. 2, 2006
tachycardia or bradycardia were found in nine sessions. However, only Sessions 13and 25 (Fig. 4, 9, Table 1) show pronounced changes in heart rate, with averagebradycardia lowered 35 and 13 bpm, respectively, during the sound period. Thesetwo sessions also show the highest level of significance (Table 1). The female showedrapid waning of the startle response, perhaps even after one session (Fig. 9), butcertainly after six sessions (Fig. 5). The significant but weaker changes in tachycardiadid not correlate with the sequence of sound exposures, and is therefore not regardedas a good indicator of animal response to sounds. The re-introduction of sound 1 inSession 19 and sound 2 in Session 23 did not cause significant change in heart rate(Fig. 9, Table 1). This suggests that a startle response was not provoked again afterexposure to a different sound for some time.
Waning of Avoidance Behaviors
The avoidance behavior was determined from displacement and echolocation ac-tivity. The displacements of the animals illustrated in Figure 8 are greatest for theinitial presentation of the three sounds. A rapid waning of the response to sound 1occurs already in Session 2, but a more gradual waning over three to four sessionsof the response is seen for sound 2. When sound 1 had full intensity in Session 5,neither animal was seen in Sector 4. In the following sessions, they gradually spendmore time closer to the sound projector in Sector 4 (Fig. 6). When sound 2 was pre-sented, the porpoises were absent from Sector 4 in the next session. They approachedthe sound source again during the following sessions, although not as much as withsound 1. When sounds 1 and 2 were presented for the first time in a second series ofsessions, no clear pattern was seen (Fig. 6, 8). During all sessions, the male seemedto be displaced farther away from the sound than the female. The male, however,also spent less time in Sector 4 during the pre- and postsound periods. The resultsof displacement suggest that the porpoises adapted to the sounds by a waning in theavoidance response to the sounds. In a few cases, the porpoises even approached orwere swimming around the projector presumably investigating the sound source.
In many sessions, higher or equally high echolocation activity was recorded on thehydrophone next to the projector during sound or postsound periods compared withthat in presound periods (Fig. 4, 5, Table 1) This suggests that the porpoises generallyinvestigated the sound source with their sonar during or after sound presentations. Incontrast no echolocation signals were recorded from this hydrophone during the initialpresentation of sounds 2 and 3. However, from the third to the sixth presentationof sound 2 (Sessions 15–18), the animals ensonified the hydrophone as actively ormore actively during sound presentation compared with that in the presound period(Fig. 9, Table 1). This behavior suggests that the animals rapidly adapted to thesound and thereafter were actively interested in the sound source.
Factors Influencing the Results
Instruments placed on the dorsal fin measured dive depth, speed, and heart rate.In a previous experiment (Lockyer et al. 2001), it was found that the dorsal pack hadan effect on the behavior of the female. Swimming speed appeared to be reduced, andmost dives were initiated by sinking backwards instead of the normal forward roll.Since the female carried the dorsal pack in all sessions and both before, during, andafter sound presentations, the effect of the dorsal pack can be assumed to be constant
TEILMANN ET AL.: HARBOR PORPOISE BEHAVIOR 257
and ignored as long as the swimming behavior of the female is not generalized withother animals. The correspondence in general behavior of the male and the femalenevertheless indicates a similar response in displacement.
Heart rate is an effective indicator of stress and habituation in animals, e.g., labo-ratory rats (Glaser and Griffin 1962), and mice (Stiedl and Spiess 1997). The startleresponse in this study was defined as a significant change in average heart rate duringbradycardia or tachycardia between the presound and the sound period. The vari-ation in the number of surface (tachycardia) and dive (bradycardia) periods withinsessions and the fact that heart rate also changes with exercise may result in problemsdetermining a true startle reaction. The bimodal nature of marine mammal heartrate (tachycardia/brachycardia) also makes it difficult to estimate average values. Al-though significant changes of heart rate were found in nine sessions, we were able todetermine a clear lowering of heart rate in only two sessions from visual inspectionof the heart rate profiles (13 and 25, also significant after the Bonferroni procedure,Table 1). In the remaining seven sessions, either brief changes or no obvious changescould be seen. It may be that the startle response in marine mammals, based on heartrate, could be defined differently than in this study, or perhaps supported by doubleblind visual inspection of heart rate recordings.
The location of the animals in the enclosure was clearly affected by the sounds.Although this seems to be a good measure of an avoidance response, the possibility forthe animals to escape the sound was highly limited by the size of the enclosure. Otherstudies (e.g., Kastelein et al., 2000, Lockyer et al. 2001) have used measures of averagedistance to the sound source to quantify avoidance reactions, which probably is amore accurate measure of displacement than the � 2 statistic used in the present study.Calculating average distances to the source, however, requires an accurate trackingof the animals, and often the only practical solution is to reduce measurements tosurfacings only. This can potentially skew the results if the animals have preferredbreathing locations, especially if combined with underwater excursions toward thesound source as was observed in the present experiment on numerous occasions.The � 2 statistic thus seems a viable compromise between the wish for an accuratedistance measure and the far from ideal observation conditions of a natural seawaterenclosure.
Echolocation activity was recorded in the enclosure during all sessions. However,because of the narrow-beam nature of the harbor porpoise sonar (Au et al. 1999), a com-plete record of echolocation activity can never be recorded by poolside hydrophones.A detailed description of echolocation activity would require that a hydrophone beplaced on each animal. Nevertheless, the acoustic monitoring provided clear indica-tions of nonnormal behavior in the sessions where the strongest startle reactions wereseen. Click activity thus seems a valid parameter in the complete description of thechanges in behavior.
The two captive harbor porpoises were used in earlier studies to evaluate the effectsof aversive pinger-like sounds (Lockyer et al. 2001), which may have influenced themagnitude of responses we report here. In addition to the limitations of pool sizeand depth mentioned above, external noise from harbor traffic—mostly small, diesel-driven fishing vessels and small boats with outboard motors—potentially influencedthe results. The animals are accustomed to harbor noise and disturbance from visitors;however, such factors could have caused the unexplainable increased displacementin Sessions 20 and 21 for the female and male, respectively (Fig. 8). Thus, cautionis required when extrapolating our results to a natural situation or to experimentsperformed in other facilities (Kastelein et al. 2000).

258 MARINE MAMMAL SCIENCE, VOL. 22, NO. 2, 2006
Applications to Pinger Use in Commercial Fishery
The use of pingers is now mandatory in several fisheries in, e.g., Washington Stateand the Gulf of Maine, and from 2005 in a large part of the bottom-set gill net fisheriesin European Union waters. The potential harmful effects of pinger sounds on targetand nontarget species are little studied. Cox et al. (2001) studied the surfacings ofwild harbor porpoises around a mooring equipped with a pinger (10 kHz, Dukane,now produced by Airmar, Milford, NH). They looked at the displacement of harborporpoises around pingers by use of a theodolite from a cliff. They found that harborporpoises were initially displaced about 208 m from the pinger, but this displacementdiminished by 50% within 4 d, presumably because of habituation. Koschinski andCulik (1997) also found a diminishing trend of the displacement of harbor porpoisesaround a pinger (3 kHz, Lien et al. 1995). Over the 11-d experimental period, thedisplacement went from about 150 m in the first few days, to about 100 m in thelast few days; this trend was not significant, however.
Kastelein et al. (1995) tested the reaction of harbor porpoises to two differentsounds with peak frequencies around 2.5 kHz, one with harmonics and the otherwithout harmonics. They found a more aversive response to the sound with harmon-ics, which could simply be an effect of the decreasing hearing sensitivity at lowerfrequencies (Andersen 1970, Kastelein et al. 2002). Apart from this evidence, thereare no observations indicating that the general response varies in response to differentaversive sounds (Kastelein et al. 1997, 2000; Lockyer et al. 2001).
The present experiment describes the detailed response of two harbor porpoises toaversive sounds. The peak frequencies and source levels were higher for the soundsused in the present experiment than for the commercial pingers (e.g., Airmar andAquatech). The fact that the source level was higher than previously used and thatthe frequency bands overlap the frequencies used by harbor porpoises for echoloca-tion (presumably the most sensitive frequency band for harbor porpoises), may havestrengthened the response and made habituation less likely than for pingers used inthe wild. Nevertheless, we observed a waning response from the porpoises to a soundwithin a few exposures. It is important to note that the response did not seem towane to sounds in general, even if they had the same frequency bandwidth and inten-sity. This is also described by Marler and Hamilton (1967) where turkeys habituatedto one sound, but remained responsive to closely related sounds. Habituation is awell-known and very important behavior for the survival of any animal. Marler andHamilton (1967) wrote that the “elimination of existing patterns of responsivenesswhich fail to perform a useful function is as important as the acquisition of newpatterns of responsiveness during the course of development.” This may explain theability of harbor porpoises to adjust to the extreme changes in coastal developmentand boat traffic and the resulting general rise in noise level over the past century.
Conclusion
This study suggests that the general aversive response of harbor porpoises to acous-tic stimuli is to swim away from the sound source, spend less time at the surface,increase acceleration, deepen the bradycardia below normal, and reduce echolocationin the vicinity of the sound source. It was also shown that when studying animalsunder semi-controlled conditions, it is important to measure several behavioral andphysiological parameters in order to reliably evaluate the response to novel stimuli.Each individual parameter may not be affected strongly enough for a clear pattern

TEILMANN ET AL.: HARBOR PORPOISE BEHAVIOR 259
to emerge, but the general picture is revealed in the combined data set. We suggestthat wild harbor porpoises might habituate to the same sound presented repetitivelyand that alternating even closely related stimuli may delay habituation.
The conditions under which this experiment was conducted were far from thenatural situation, where a porpoise may only seldom be exposed to a pinger and maybe able to avoid areas where pingers are active. If a harbor porpoise only seldom hearsa pinger, the pinger may continue to be an effective method to exclude porpoisesfrom the threat of gill nets. However, after the planned introduction of pingers inmost gill net fisheries, porpoises will probably not be able to avoid the pinger soundswithout being excluded from important parts of their habitat or they will habituateto the sounds. If porpoises habituate to the pingers but realize the threat and stillkeep a safe distance from the gill nets, habituation may be an advantage as habitatexclusion is reduced. However, if the animals do not perceive the gill nets as a threatafter habituating to the pingers, the risk of bycatch will increase over time. Thepossible diminished fitness of the animals due to stress from the sounds must also beconsidered when implementing pingers on a large scale.
ACKNOWLEDGMENTS
We thank Gert Christoffersen, Mats Amundin, Genevieve Desportes, Dave Goodson, PaulNachtigall, Ron Schustermann, and Ursula Siebert for valuable suggestions on the researchproposal and manuscript, and Keld Bennick and Frank Riget for statistical assistance. BradHanson, Scott Schaffer, Ursula Siebert, and Patrick Moore provided good advice on the suctioncup attachment. Polar Instrument is acknowledged greatly for sponsoring some of the equip-ment. Wildlife Computers and Polar Instruments are thanked for good advice and support.This study was kindly supported by the Danish National Research Foundation, Center forSound Communication. The training of the female porpoise was funded by the EPIC project(Lockyer et al. 2001). The animals are maintained by Fjord & Bælt, Kerteminde, Denmark,under permit no. J.nr. SN 343/FY-0014 and 1996-3446-0021 from the Danish Forest andNature Agency, Danish Ministry of Environment. We thank two anonymous referees for thehelpful comments and suggestions for improving the manuscript.
LITERATURE CITED
ANDERSEN, S. 1970. Auditory sensitivity of the harbor porpoise Phocoena phocoena. Pages 255–259 in G. Pilleri, ed. Investigations on Cetacea. Volume 2. Institute of Brain Anatomy,University of Berne, Berne, Switzerland.
AU, W. W., R. A. KASTELEIN, T. RIPPE AND N. M. SCHOONEMAN. 1999. Transmissionbeam pattern and echolocation signals of a harbor porpoise (Phocoena phocoena). Journalof Acoustic Society of America 106:3699–3705.
COX, T. M., A. J. READ, A. SOLOW AND N. TREGENZA. 2001. Will harbour porpoises(Phocoena phocoena) habituate to pingers? Journal of Cetacean Research and Management3:81–86.
CULIK, B. M., S. KOSHINSKI, N. TREGENZA AND M. E. GRAEME. 2001. Reactions of harborporpoises (Phocoena phocoena) and herring (Clupea harengus) to acoustic alarms. MarineEcology Progress Series 211:255–260.
GEARIN, P. J., M. E. GOSHO, J. LAAKE, L. COOKE, R. L. DELONG AND K. M. HUGES.1999. Experimental testing of acoustic alarms (pingers) to reduce bycatch of harborporpoises, Phocoena phocoena, in the state of Wastington. Journal of Cetacean Researchand Management 2:1–9.
GLASER, E. M., AND J. P. GRIFFIN. 1962. Influence of the cerebral cortex on habituation.Journal of Physiology 136:98–111.

260 MARINE MAMMAL SCIENCE, VOL. 22, NO. 2, 2006
KASTELEIN, R. A., A. D. GOODSON, J. LIEN AND D. DE HANN. 1995. The effects of acousticalarms on harbor porpoise (Phocoena phocoena) behavior. Pages 157–167 in P. E. Nachtigall,J. Lien, W. W. Au and A. J. Read, eds. Harbor porpoises— laboratory studies to reducebycatch. De Spil Publishers, Woerden, The Netherlands.
KASTELEIN, R. A., D. DE HAAN, A. D. GOODSON, C. STAAL AND A. D. VAUGHAN. 1997. Theeffect of various sounds on a harbor porpoise (Phocoena phocoena). Pages 367–383 in A.J. Read, P. R. Wiepkema and P. E. Nachtigall, eds. The biology of the harbor porpoise.De Spil Publishers, Woerden, The Netherlands.
KASTELEIN, R. A., A. D. VAUGHAN, N. M. SCHOONEMAN, W. C. VERBOOM AND D. DEHAAN. 2000. The effect of acoustic alarms on the behavior of harbor porpoises (Phocoenaphocoena) in a floating pen. Marine Mammal Science 16:46–64.
KASTELEIN, R. A., P. BRUNSKOEK, M. HAGEDOORN, W. W. L. AU AND D. DE HAAN.2002. Audiogram of a harbor porpoise (Phocoena phocoena) measured with narrow-bandfrequency-modulated sounds. Journal of the Acoustic Society of America 12:334–344.
KOSHINSKI, S., AND B. CULIK. 1997. Deterring harbor porpoises (Phocoena phocoena) fromgillnets: Observed reactions to passive reflectors and pingers. Report of the InternationalWhaling Commission 47:659–668.
KRAUS, S. D., A. J. READ, A. SOLOW, K. BALDWIN, T. SPRADLIN, E. ANDERSON AND J.WILLIAMSON. 1997. Acoustic alarms reduce porpoise mortality. Nature 388:525.
LIEN, J., C. HOOD, D. PITTMAN, P. RUEL, D. BORGGAARD, C. CHISHOLM, L. WIESNER, T.MAHON AND D. MITCHELL. 1995. Field tests of acoustic devices on groundfish gillnets:Assessment of effectiveness in reducing harbor-porpoise by-catch. Pages 1–22 in R. A.Kastelein, J. A. Thomas and P. E. Nachtigall, eds. Sensory systems of aqautic mammals.De Spil Publisher, Woerden, The Netherlands.
LOCKYER, C., M. AMUNDIN, G. DESPORTES, D. GOODSON AND F. LARSEN. 2001. The tail ofEPIC—Elimination of harbour porpoise incidental catches. Final report under EuropeanCommission. Project DG XIV 97/0006. Fjord & Bælt, Margrethes Plads 1, DK-5300Kerteminde, Denmark. (Available from [email protected]). 249 pp.
MARLER, P., AND W. J. HAMILTON III. 1967. Mechamisms of animal behavior. John Wiley& Sons, Inc., New York, NY.
PERRIN, W., G. DONOVAN AND J. BARLOW, eds. 1994. Gillnets and cetaceans. Report of theInternational Whaling Commission (Special Issue 15):1–629.
ROBERTS, C. S. 1982. Implementing and testing new versions of a good, 48-bit pseudo-randomnumber generator. The Bell System Technical Journal 61:2053–2063.
STIEDL, O., AND J. SPIESS. 1997. Effect of tone-dependent fear conditioning on heart rate andbehaviour of C57BL/6N mice. Behavioural Neuroscience 111:703–711.
STONE, G., S. KRAUS, A. HUTT, S. MARTIN, A. YOSHINAGA AND L. JOY. 1997. Reduc-ing by-catch: Can acoustic pingers keep Hector’s dolphins out of fishing nets? MarineTechnology Society Journal 31(2):3–7.
VINTHER, M. 1999. Bycatches of harbor porpoises (Phocoena phocoena L.) in Danish set-netfisheries. Journal of Cetacean Research and Management 1:123–135.
VINTHER, M., AND F. LARSEN. 2004. Updated estimates of harbour porpoise (Phocoena phocoena)bycatch in the Danish North Sea bottom-set gillnet fishery. Journal of Cetacean Researchand Management 6:19–24.
Received: 14 May 2002Accepted: 30 June 2005