Ray 19998
89
Amazon Try Prime Your Amazon.com Today's Deals Gift Cards Sell Help Shop byDepartment Hello. Sign inYour Account TryPrime WishList Cart0 Search Books Go Books Advanced Search New Releases Best Sellers The New York Times® Best Sellers Children's Books Textbooks Textbook Rentals Sell Us Your Books Best Books of the Month Deals in Books Books › Business & Money › Economics › Development & Growth Share Facebook Twitter Pinterest Buy New $92.80 Qty: List Price: $115.00 Save: $22.20 (19%) FREE Shipping . In Stock. Ships from and sold by Amazon.com. Gift-wrap available. Yes, I want FREE Two-Day Shipping with Amazon Prime Add to Cart
Transcript of Ray 19998

Amazon Try Prime
Your Amazon.com Today's Deals Gift Cards Sell Help Shop byDepartment Hello. Sign inYour Account TryPrime WishList Cart0 Search Books Go
Books Advanced Search New Releases Best Sellers The New York Times® Best Sellers Children's Books Textbooks Textbook Rentals Sell Us Your Books Best Books of the Month Deals in Books
Books › Business & Money › Economics › Development & Growth
Share Facebook Twitter Pinterest
Buy New
$92.80
Qty:
List Price: $115.00 Save: $22.20 (19%)
FREE Shipping. In Stock. Ships from and sold by Amazon.com. Gift-wrap available.
Yes, I want FREE Two-DayShipping with Amazon Prime Add to Cart

Sign in to turn on 1-click ordering
Want it Tuesday, March 31? Order within 19 hrs 24 mins and chooseTwo-Day Shipping at checkout. Details
Shipping Address Select a shipping address:
Buy Used
$79.95
Add to Wish List Sell yours for a Gift Card We'll buy it for $8.82 Learn More Trade in now
Other Sellers on Amazon
98 used & new from $20.00 Have one to sell? Sell on Amazon
See this image
Development Economics Hardcover – January 12, 1998 by Debraj Ray (Author) 15 customer reviews ISBN-13: 978-0691017068 ISBN-10: 0691017069
Buy New Price: $92.80

51 New from $45.87 47 Used from $20.00 Amazon Price
New from
Used from
Kindle$67.99 — —
Hardcover
$92.80
$45.87
$20.00
Paperback — $32.95 $64.28
Read more
Save up to 90% on TextbooksRent textbooks, buy textbooks, or get up to 80% back whenyou sell us your books. Shop Now
Kindle BookPrint BookFeedback | Help | Expanded View | Close
Development Economics (Kindle Edition)by Debraj Ray
(15)Kindle Edition $67.99
Deliver ToSend this sample to your Kindle

Book sectionsCoverBeginningJust so you know...
This view is of the Kindle edition (1998) from Princeton University Press. A preview of the print book (Hardcover edition) is currently not available.
Development Economics
Development EconomicsDebraj Ray

Copyright © 1998 by Princeton University PressPublished by Princeton University Press, 41 William Street, Princeton,New Jersey 08540In the United Kingdom: Princeton University Press, Chichester, West SussexAll rights reservedLibrary of Congress Cataloging-in-Publication DataRay, Debraj.Development economics / Debraj Ray.p. cm.Includes bibliographical references and index.ISBN 0-691-01706-9 (cl : alk. paper)1. Development economics. I. Title.HD75.R39 1998338.9--dc21 97-33459This book has been composed in PalatinoPrinceton University Press books are printed on acid-free paper and meet the guidelines for permanence and durability of the Committee on Production Guidelines for Book Longevity of the Council on Library Resourceshttp://pup.princeton.eduPrinted in the United States of America10 9 8 7ISBN-13: 978-0-691-01706-8 (cloth)For my parents, Radha and Kalyan
ContentsPrefaceChapter 1: IntroductionChapter 2: Economic Development: Overview2.1. Introduction2.2. Income and growth 2.2.1. Measurement issues
2.2.2. Historical experience2.3. Income distribution in developing countries2.4. The many faces of underdevelopment 2.4.1. Human development 2.4.2. An index of human development 2.4.3. Per capita income and human development2.5. Some structural features 2.5.1. Demographic characteristics 2.5.2. Occupational and production structure 2.5.3. Rapid rural–urban migration 2.5.4. International trade2.6. SummaryExercises
Chapter 3: Economic Growth3.1. Introduction3.2. Modern economic growth: Basic features3.3. Theories of economic growth 3.3.1. The Harrod–Domar model 3.3.2. Beyond Harrod–Domar: Other considerations 3.3.3. The Solow model3.4. Technical progress3.5. Convergence? 3.5.1. Introduction 3.5.2. Unconditional convergence 3.5.3. Unconditional convergence: Evidence or lack thereof 3.5.4. Unconditional convergence: A summary 3.5.5. Conditional convergence

3.5.6. Reexamining the data3.6. SummaryAppendix 3.A.1. The Harrod–Domar equations 3.A.2. Production functions and per capita magnitudesExercises
Chapter 4: The New Growth Theories4.1. Introduction4.2. Human capital and growth4.3. Another look at conditional convergence4.4. Technical progress again 4.4.1. Introduction 4.4.2. Technological progress and human decisions 4.4.3. A model of deliberate technical progress 4.4.4. Externalities, technical progress, and growth 4.4.5. Total factor productivity4.5. Total factor productivity and the East Asian miracle4.6. SummaryAppendix: Human capital and growthExercises
Chapter 5: History, Expectations, and Development5.1. Introduction5.2. Complementarities 5.2.1. Introduction: QWERTY 5.2.2. Coordination failure 5.2.3. Linkages and policy 5.2.4. History versus expectations5.3. Increasing returns 5.3.1. Introduction

5.3.2. Increasing returns and entry into markets 5.3.3. Increasing returns and market size: Interaction5.4. Competition, multiplicity, and international trade5.5. Other roles for history 5.5.1. Social norms 5.5.2. The status quo5.6. SummaryExercises
Chapter 6: Economic Inequality6.1. Introduction6.2. What is economic inequality? 6.2.1. The context 6.2.2. Economic inequality: Preliminary observations6.3. Measuring economic inequality 6.3.1. Introduction 6.3.2. Four criteria for inequality measurement 6.3.3. The Lorenz curve 6.3.4. Complete measures of inequality6.4. SummaryExercises
Chapter 7: Inequality and Development: Interconnections7.1.
Introduction
7.2.
Inequality, income, and growth
7.2.1. The inverted-U hypothesis 7.2.2. Testing the inverted-U hypothesis 7.2.3. Income and inequality: Uneven and compensatory
changes
7.2.4. Inequality, savings, income, and growth 7.2.5. Inequality, political redistribution, and growth 7.2.6. Inequality and growth: Evidence 7.2.7. Inequality and demand composition 7.2.8. Inequality, capital markets, and development 7.2.9. Inequality and development: Human capital7.3.
Summary
Appendix: Multiple steady states with imperfect capital marketsExercises
Chapter 8: Poverty and Undernutrition8.1. Introduction8.2. Poverty: First principles 8.2.1. Conceptual issues 8.2.2. Poverty measures8.3. Poverty: Empirical observations 8.3.1. Demographic features 8.3.2. Rural and urban poverty 8.3.3. Assets 8.3.4. Nutrition8.4. The functional impact of poverty 8.4.1. Poverty, credit, and insurance 8.4.2. Poverty, nutrition, and labor markets 8.4.3. Poverty and the household8.5. SummaryAppendix: More on poverty measuresExercises
Chapter 9: Population Growth and Economic Development9.1.Introduction
9.2.Population: Some basic concepts 9.2.1. Birth and death rates 9.2.2. Age distributions9.3.From economic development to population growth 9.3.1. The demographic transition 9.3.2. Historical trends in developed and developing
countries 9.3.3. The adjustment of birth rates 9.3.4. Is fertility too high?9.4.From population growth to economic development 9.4.1. Some negative effects 9.4.2. Some positive effects9.5.SummaryExercises
Chapter 10: Rural and Urban10.1.
Overview
10.1.1. The structural viewpoint 10.1.2. Formal and informal urban sectors 10.1.3. Agriculture 10.1.4. The ICRISAT villages10.2.
Rural–urban interaction
10.2.1. Two fundamental resource flows 10.2.2. The Lewis model10.3.
Rural–urban migration
10.3.1. Introduction 10.3.2. The basic model

10.3.3. Floors on formal wages and the Harris–Todaro equilibrium
10.3.4. Government policy 10.3.5. Comments and extensions10.4.
Summary
ExercisesChapter 11: Markets in Agriculture: An Introduction11.1. Introduction11.2. Some examples11.3. Land, labor, capital, and credit 11.3.1. Land and labor 11.3.2. Capital and credit
Chapter 12: Land12.1. Introduction12.2. Ownership and tenancy12.3. Land rental contracts 12.3.1. Contractual forms 12.3.2. Contracts and incentives 12.3.3. Risk, tenancy, and sharecropping 12.3.4. Forms of tenancy: Other considerations 12.3.5. Land contracts, eviction, and use rights12.4. Land ownership 12.4.1. A brief history of land inequality 12.4.2. Land size and productivity: Concepts 12.4.3. Land size and productivity: Empirical evidence 12.4.4. Land sales 12.4.5. Land reform12.5. Summary
Appendix 1: Principal–agent theory and applications 12.A.1. Risk, moral hazard, and the agency problem 12.A.2. Tenancy contracts revisitedAppendix 2: Screening and sharecroppingExercises
Chapter 13: Labor13.1. Introduction13.2. Labor categories13.3. A familiar model13.4. Poverty nutrition, and labor markets 13.4.1. The basic model 13.4.2. Nutrition, time, and casual labor markets 13.4.3. A model of nutritional status13.5. Permanent labor markets 13.5.1. Types of permanent labor 13.5.2. Why study permanent labor? 13.5.3. Permanent labor: Nonmonitored tasks 13.5.4. Permanent labor: Casual tasks13.6. SummaryExercises
Chapter 14: Credit14.1. Introduction 14.1.1. The limits to credit and insurance 14.1.2. Sources of demand for credit14.2. Rural credit markets 14.2.1. Who provides rural credit? 14.2.2. Some characteristics of rural credit markets14.3. Theories of informal credit markets 14.3.1. Lender’s monopoly

14.3.2. The lender’s risk hypothesis 14.3.3. Default and fixed-capital loans 14.3.4. Default and collateral 14.3.5. Default and credit rationing 14.3.6. Informational asymmetries and credit rationing 14.3.7. Default and enforcement14.4. Interlinked transactions 14.4.1. Hidden interest 14.4.2. Interlinkages and information 14.4.3. Interlinkages and enforcement 14.4.4. Interlinkages and creation of efficient surplus14.5. Alternative credit policies 14.5.1. Vertical formal–informal links 14.5.2. Microfinance14.6. SummaryExercises
Chapter 15: Insurance15.1. Basic concepts15.2. The perfect insurance model 15.2.1. Theory 15.2.2. Testing the theory15.3. Limits to insurance: Information 15.3.1. Limited information about the final outcome 15.3.2. Limited information about what led to the outcome15.4. Limits to insurance: Enforcement 15.4.1. Enforcement-based limits to perfect insurance 15.4.2. Enforcement and imperfect insurance15.5. Summary

ExercisesChapter 16: International Trade16.1. World trading patterns16.2. Comparative advantage16.3. Sources of comparative advantage 16.3.1. Technology 16.3.2. Factor endowments 16.3.3. Preferences 16.3.4. Economies of scale16.4. SummaryExercises
Chapter 17: Trade Policy17.1. Gains from trade? 17.1.1. Overall gains and distributive effects 17.1.2. Overall losses from trade?17.2. Trade policy: Import substitution 17.2.1. Basic concepts 17.2.2. More detail17.3. Export promotion 17.3.1. Basic concepts 17.3.2. Effect on the exchange rate 17.3.3. The instruments of export promotion: More detail17.4. The move away from import substitution 17.4.1. Introduction 17.4.2. The eighties crisis 17.4.3. Structural adjustment17.5. SummaryAppendix: The International Monetary Fund and the World BankExercises

Chapter 18: Multilateral Approaches to Trade Policy18.1. Introduction18.2. Restricted trade 18.2.1. Second-best arguments for protection 18.2.2. Protectionist tendencies 18.2.3. Explaining protectionist tendencies18.3. Issues in trade liberalization 18.3.1. Introduction 18.3.2. Regional agreements: Basic theory 18.3.3. Regional agreements among dissimilar countries 18.3.4. Regional agreements among similar countries 18.3.5. Multilateralism and regionalism18.4. SummaryExercises
Appendix 1: Elementary Game TheoryA1.1. IntroductionA1.2. Basic conceptsA1.3. Nash equilibriumA1.4. Games over time
Appendix 2: Elementary Statistical MethodsA2.1. IntroductionA2.2. Summary statisticsA2.3. Regression
ReferencesAuthor IndexSubject Index
Preface
This book provides an introduction to development economics, a subject that studies the economic transformation of developing countries. My objective is to make a large literature accessible, in a unified way, to a student or interested individual who has some training in basic economic theory. It is only fair to say that I am not fully satisfied with the final product: in attempting to provide a well-structured treatment of the subject, I have had to sacrifice comprehensiveness. Nevertheless, I do believe that the book goes quite far in attaining the original objective, within the limitations created by an enormous and unwieldy literature and the constraints imposed by my own knowledge and understanding.The primary target for this book is the senior undergraduate or
masters level student with training in introductory or intermediate economic theory. I also recommend this book as background or supplementary reading for a doctoral course in development economics, along with the original articles on the subject.Mathematical requirements are kept to a minimum, although some degree
of mathematical maturity will assist understanding of the material. Inparticular, I have eschewed the use of calculus altogether and have attempted to present theoretical material through verbal argument, diagrams, and occasionally elementary algebra. Because the book makes some use of game-theoretic and statistical concepts, I have included two introductory appendixes on these subjects. With these appendixes in place, the book is self-contained except for occasional demands on the reader’s knowledge of introductory economic theory.I begin with an overview of developing countries (Chapter 2). I
discuss major trends in per capita income, inequality, poverty, and population, and take a first look at the important structural characteristics of development. Chapters 3–5 take up the study of economic growth from several aspects.Chapters 6–8 shift the focus to an analysis of unevenness in
develepment: the possibility that the benefits of growth may not accrue equally to all. In turn, these inequalities may influence aggregate trends. This interaction is studied from many angles. Chapter 9 extends this discussion to population growth, where the relationship between demography and economics is explored in some detail.Chapter 10 studies unevenness from the viewpoint of structural
transformation: the fact that development typically involves the ongoing transfer of resources from one sector (typically agriculture) to another (typically industry and services). This chapter motivates acareful study of the agricultural sector, where a significant fraction
of the citizens of developing countries, particularly the poor, live and work.Chapters 11–15 study informal markets in detail, with particular
emphasis on the rural sector. We analyze the land, labor, credit and insurance markets.Chapter 16 introduces the study of trade and development. Chapter 17
motivates and studies the instruments of trade policy from the point of view of a single country. Finally, Chapter 18 studies multilateral and regional policies in trade.For programs that offer a single semester course in economic
development, two options are available: (1) if international economic issues can be relegated to a separate course, cover all the material up to the end of Chapter 15 (this will require some skimming of chapters, such as Chapters 4–6 and 11–15); (2) if it is desirable to cover international issues in the same course, omit much or most of the material in Chapters 11–15. A year-long course should be able to adequately cover the book, but some supplementary material may be required for international economics, as well as financial issues in development, such as inflation and monetary policy.This book could not have been written without my students and the
many classes I have taught in development economics over the years: I thank students at Boston University, at the Indian Statistical Institute, at the People’s University of China in Beijing, at Stanford, and at Harvard. I would also like to thank the many people who have read and commented on earlier drafts of this book and have used them in courses they have taught, among them Jean-Marie Baland, Abhijit Banerjee, V. Bhaskar, Gautam Bose, Ira Gang, James Foster, Patrick Francois, Gabriel Fuentes, Bishnupriya Gupta, Ashok Kotwal, Dilip Mookherjee, Jonathan Morduch, James Robinson, Ann Velenchik, Bruce Wydick, and Frederic Zimmerman.Several people have made contributions to this text. Chief among them
is Parikshit Ghosh, my intrepid and thoroughly uncontrollable researchassistant, whose contributions to this book are too numerous to mention. I would also like to thank Eli Berman, Gary Fields, Hsueh-Ling Huynh, Chiente Hsu, Luis-Felipe López-Calva, Anandi Mani, GhazalaMansuri, Jonathan Morduch, and Hiranya Mukhopadhyay for input at various stages.Much of this book was written while I was Director of the Institute
for Economic Development at Boston University. I thank Margaret Chapman, Administrative Assistant to the Institute, for covering for my many administrative lapses during this period. I thank the Instituto de Análisis Económico (CSIC) in Barcelona, where this book was completed, and the Ministerio de Educación, Government of Spain

for financial support during my stay. I am very grateful to Peter Dougherty, my publisher at Princeton University Press, for his help and encouragement.I would like to record my deep appreciation to a (smaller) set of
people who have shaped the way I think about economics: Kenneth Arrow,Doug Bernheim, Bhaskar Dutta, Joan Esteban, Mukul Majumdar, Tapan Mitra, Dilip Mookherjee, Kunal Sengupta, Amartya Sen, and Rajiv Vohra.I thank Monica Das Gupta for innumerable discussions, and words of
advice and encouragement.Finally, I owe gratitude to Angela Bhaya Soares who always wanted me
to write a magnum opus but will have to be content with what she gets,to Bissera Antikarova and Farahanaaz Dastur for seeing me safely through bad times, to Nilita Vachani for creating unforeseen but happydelays, and to Jackie Bhaya for getting me started on it all.Debraj RayBoston UniversitySeptember 1997Development Economics
Chapter 1
IntroductionI invite you to study what is surely the most important and perhaps the most complex of all economic issues: the economic transformation of those countries known as the developing world. A definition of “developing countries” is problematic and, after a point, irrelevant.1 The World Development Report (World Bank [1996]) employs a threshold of $9,000 per capita to distinguish between what it calls high-income countries and low- and middle-income countries: according to this classification, well over 4.5 billion of the 5.6 billion people in theworld today live in the developing world of “low- and middle-income countries.” They earn, on average, around $1,000 per capita, a figure that is worth contrasting with the yearly earnings of the average North American or Japanese resident, which are well above $25,000. Despite the many caveats and qualifications that we later add to thesenumbers, the ubiquitous fact of these astonishing disparities remains.There is economic inequality throughout the world, but much of that
is, we hope, changing. This book puts together a way of thinking aboutboth the disparities and the changes.

There are two strands of thought that run through this text. First, Imove away from (although do not entirely abandon) a long-held view that the problems of all developing countries can be understood best with reference to the international environment of which they are a part.2 According to this view, the problems of underdevelopment must first and foremost be seen in a global context. There is much that is valid in this viewpoint, but I wish to emphasize equally fundamental issues that are internal to the structure of developing countries. Although a sizeable section of this book addresses international aspects of development, the teacher or reader who wishes to concentrate exclusively on these aspects will not find a comprehensive treatment here.The second strand is methodological: as far as possible, I take a
unified approach to the problems of development and emphasize a recentand growing literature that takes a level-headed approach to market failure and the potential for government intervention. It is not that markets are intrinsically bad or intrinsically good: the point is to understand the conditions under which they fail or function at an inefficient level and to determine if appropriate policies grounded inan understanding of these conditions can fix such inefficiencies. These conditions, I argue, can be understood best by a serious appreciation of subjects that are at the forefront of economic theory but need to permeate more thoroughly into introductory textbooks: theories of incomplete information, of incentives, and of strategic behavior. Few people would disagree that these considerations lie at the heart of many observed phenomena. However, my goal is to promote astudent’s understanding of such issues as a commonplace model, not as a set of exceptions to the usual textbook paradigm of perfect competition and full information.Because I take these two strands to heart, my book differs from other
textbooks on development in a number of respects. Most of these differences stem from my approach to exposition and choice of subject matter. Although I do not neglect the historical development of a lineof research or inquiry, I bring to bear a completely modern analyticalperspective on the subject. Here are some instances of what I mean.(1) The story of economic underdevelopment is, in many ways, a story
of how informal, imaginative institutions replace the formal constructs we are accustomed to in industrialized economies. The landlord lends to his tenant farmer, accepting labor as collateral, but a formal credit market is missing. Villagers insure each other against idiosyncratic shocks using their greater information and theirability to impose social sanctions, but a formal insurance market is missing. Institutions as diverse as tied labor, credit cooperatives,
and extended families can be seen as responses to market failure of some sort, precipitated in most cases by missing information or by theinability of the legal system to swiftly and efficiently enforce contracts. This common thread in our understanding is emphasized and reemphasized throughout the book.(2) The absence or underfunctioning of markets gives rise to two
other features. One is the creation of widespread externalities. Proper classification of these externalities provides much insight into a variety of economic phenomena, which appear unconnected at first, but which (in this sense) are just the common expression of a small variety of external effects. So it is that simple concepts from game theory, such as the Prisoners’ Dilemma or the coordination game, yield insights into a diverse class of development-related problems. Again, the common features of the various problems yield a mental classification system—a way of seeing that different phenomena stem from a unified source.(3) A fundamental implication of missing markets is that inequality in
the distribution of income or wealth plays a central role in many development problems. It isn’t that inequality has not received attention in treatises on development; it certainly has. However, whathas recently begun to receive systematic analytical treatment is the functional role of inequality: the possibility that inequality, quite apart from being of interest in its own right, has implications for other yardsticks of economic performance such as the level of per capita income and its rate of growth. The emphasis on the functional role of inequality runs through the book.(4) It is necessary to try to integrate, in an intuitive and not very
abstract way, recent theoretical and empirical literature with the more standard material. This isn’t done to be fashionable. I do this because I believe that much of this new work has new things to teach us. Some important models of economic growth, of income distribution and development, of coordination failures, or of incomplete information are theories that have been developed over the last decade. Work on these models continues apace. Although some of the techniques are inaccessible to a student with little formal training, I do believe that all the ideas in this literature that are worth teaching (and there are many) can be taught in an elementary way. In this sense this book coincides with existing texts on the subject: theuse of mathematics is kept to a minimum (there is no calculus except in an occasional footnote).Partly because other development texts have been around for a good
while, and perhaps in part because of a different approach, this text departs significantly from existing development texts in the points

cited in the preceding text and indeed in its overall methodological approach.Combining the complementary notions of incomplete information, a weak
legal structure (so far as implementation goes), and the resulting strategic and economic considerations that emerge, we begin to have some idea of what it is that makes developing countries somehow “different.” Economic theorists never tire of needling their friends with questions in this regard. Why is the study of developing countries a separate subject? Why can’t we just break it up into separate special cases of labor economics, international trade, money,and finance, and so on? Certainly, they have a point, but that’s only one way to cut the cake. Another way to do so is to recognize that developing countries, in their different spheres of activity, display again and again these common failures of information and legal structures, and therefore generate common incentive and strategic issues that might benefit from separate, concentrated scrutiny.This approach also serves, I feel, as an answer to a different kind
of objection: that developing countries are all unique and very different, and generalizations of any kind are misleading or, at best,dangerous. Although this sort of viewpoint can be applied recursively as well within countries, regions, districts and villages until it becomes absurd, there is some truth to it. At the same time, while differences may be of great interest to the specialized researcher, emphasizing what’s common may be the best way to get the material across to a student. Therefore I choose to highlight what’s common, while trying not to lose sight of idiosyncrasies, of which there are many.A final bias is that, in some basic sense, the book is on the theory
of economic development. However, there is no theory without data, andthe book is full of empirical studies. At the same time, I am uninterested in filling up page after page with tables of numbers unless these tables speak to the student in some informative way. So it is with case studies, of which there will be a number in the text.3 I try to choose empirical illustrations and case studies throughout toillustrate a viewpoint on the development process, and not necessarilyfor their own sake.I started off writing a textbook for undergraduates, for the course
that I have loved the most in my fourteen years of teaching. I see that what emerged is a textbook, no doubt, but in the process something of myself seems to have entered into it. I see now that the true originality of this book is not so much the construction of new theory or a contribution to our empirical knowledge, but a way of thinking about development and a way of communicating those thoughts
to those who are young, intelligent, caring, and impressionable. If a more hard-bitten scholar learns something as a by-product, that would be very welcome indeed.My commitment as the author is the following: armed with some minimal
background in economic theory and statistics, and a healthy dose of curiosity, sympathy, and interest, if you study this book carefully, you will come away with a provocative and interesting introduction to development economics as it is practiced today Put another way, although this book offers (as all honest books in the social sciences do) few unambiguous answers, it will teach you how to ask the right questions.
1 The Third World, a group of low-income countries united by common economic characteristics and often a common history of colonialism, isjust as much a political as an economic concept. Narrower economic classifications are employed by several international organizations such as the World Bank. A composite index that goes beyond per capita income is described in Human Development Report (United Nations Development Programme [1995]). There is substantial agreement across all these classifications.
2 This view includes not only the notion that developing countries are somehow hindered by their exposure to the developed world, epitomized in the teachings of dependencia theorists, but also more mainstream concerns regarding the central role of international organizations and foreign assistance.
3 Case studies, which are referred to as boxes, will be set off from the text by horizontal rules.
Chapter 2
Economic Development: OverviewBy the problem of economic development I mean simply the problem of accounting for the observed pattern, across countries and across time,in levels and rates of growth of per capita income. This may seem too narrow a definition, and perhaps it is, but thinking about income patterns will necessarily involve us in thinking about many other aspects of societies too, so I would suggest that we withhold judgement on the scope of this definition until we have a clearer ideaof where it leads us.
—R. E. Lucas [1988]
[W]e should never lose sight of the ultimate purpose of the exercise, to treat men and women as ends, to improve the human condition, to enlarge people’s choices. . . . [A] unity of interests would exist if there were rigid links between economic production (as measured by income per head) and human development (reflected by human indicators such as life expectancy or literacy, or achievements such as self-respect, not easily measured). But these two sets of indicators are not very closely related.
—P. P. Streeten [1994]
2.1. Introduction
Economic development is the primary objective of the majority of the world’s nations. This truth is accepted almost without controversy To raise the income, well-being, and economic capabilities of peoples everywhere is easily the most crucial social task facing us today. Every year, aid is disbursed, investments are undertaken, policies areframed, and elaborate plans are hatched so as to achieve this goal, orat least to step closer to it. How do we identify and keep track of the results of these efforts? What characteristics do we use to evaluate the degree of “development” a country has undergone or how “developed” or “underdeveloped” a country is at any point in time? In short, how do we measure development?The issue is not easy to resolve. We all have intuitive notions of
“development.” When we speak of a developed society, we picture in ourminds a society in which people are well fed and well clothed, possessaccess to a variety of commodities, have the luxury of some leisure and entertainment, and live in a healthy environment. We think of a society free of violent discrimination, with tolerable levels of equality, where the sick receive proper medical care and people do nothave to sleep on the sidewalks. In short, most of us would insist thata minimal requirement for a “developed” nation is that the physical quality of life be high, and be so uniformly, rather than being restricted to an incongruously affluent minority.Of course, the notion of a good society goes further. We might stress
political rights and freedoms, intellectual and cultural development, stability of the family, a low crime rate, and so on. However, a high and equally accessible level of material well-being is probably a prerequisite for most other kinds of advancement, quite apart from being a worthy goal in itself.1 Economists and policy makers therefore do well (and have enough to do!) by concentrating on this aspect alone.

It is, of course, tempting to suggest that the state of material well-being of a nation is captured quite accurately in its per capita gross national product (GNP): the per-head value of final goods and services produced by the people of a country over a given year. Indeed, since economic development at the national level was adopted as a conscious goal,2 there have been long phases during which development performance was judged exclusively by the yardstick of percapita gross domestic product (GDP) growth. In the last few decades, this practice increasingly has come under fire from various quarters. The debate goes on, as the quotations at the beginning of this chaptersuggest.We must be careful here. No one in their right mind would ever
suggest that economic development be identified, in a definitional sense, with the level or growth of per capita income. It is perhaps universally accepted that development is not just about income, although income (economic wealth, more generally) has a great deal to do with it. For instance, we noted previously that economic advancement should not be restricted to a small minority. This means, in particular, that development is also the removal of poverty and undernutrition: it is an increase in life expectancy; it is access to sanitation, clean drinking water, and health services; it is the reduction of infant mortality; it is increased access to knowledge andschooling, and literacy in particular. There is an entire multitude ofyardsticks. Paul Streeten’s thoughts, summarized in the quotation at the beginning of this chapter, capture this “multidimensionality” verywell.Far more intriguing is the sharp focus of Robert Lucas’ words (see
quotation). At first they appear narrow, perhaps even missing the point, whereas the more holistic scenario sketched in the foregoing paragraphs seems pretty much the way to go. In thinking this we would be wrong. Neither Lucas nor any intelligent person believes that per capita income is development. What’s hidden in these words is actually an approach, not a definition. It is really a belief about the world, which is that the universal features of economic development—health, life expectancy, literacy, and so on—follow in some natural way from the growth of per capita GNP, perhapswith the passage of time. Implicit here is a belief in the power of aggregate economic forces to positively affect every other socioeconomic outcome that we want to associate with “development.” This outlook may be contrasted with the view that a correlation between GNP and other desired features is not automatic, and that in many cases such connections may not be present at all. According to this view, per capita GNP fails as an adequate overall measure and must be supplemented by other indicators directly.

The debate implicit in the two quotations is not about what development means, on which there is possibly widespread agreement. Itis really about a view of the world—about the possibility of finding asmaller set of variables that correlates well with the multifaceted process of development. Note well that, in a way, saying too much is saying too little. It may be that per capita income does not capture all aspects of development, but a weighty assertion that no small set of variables ever captures the complex nature of the development process and that there are always other considerations is not very helpful. In this sense, the view that economic development is ultimately fueled by per capita income may be taking things too far, but at least it has the virtue of attempting to reduce a larger set ofissues to a smaller set, through the use of economic theory.This book implicitly contains a reduction as well, although not all
the way to per capita income alone. In part, sheer considerations of space demand such a reduction. Moreover, we have to begin somewhere, sowe concentrate implicitly on understanding two sets of connections throughout this book. One is how average levels of economic attainment influence development. To be sure, this must include an analysis of the forces that, in turn, cause average levels (such as per capita GNP) to grow. The other connection is how the distribution of economic attainment, across the citizens of a nation or a region and across thenations of the world, influences development. The task of understanding these two broad interrelationships takes us on a long journey. In some chapters the relationships may be hidden in the details, but they are always there: levels and distribution as twin beacons to guide our inquiry.3
This is not to say that the basic features of development will be ignored. Studying them is our primary goal, but our approach to them lies through the two routes described in the previous paragraph.We begin, then, with a summary of the historical experience of
developing countries over the past few decades. We pay attention to per capita income, then to income distribution, and then consider other indicators of development. We then try to understand how these manifold characteristics of development correlate with the smaller setof features: income levels and distribution. This chapter ends with anoverview of the structural characteristics of developing countries. Wedescribe the occupational distribution of the population, the share ofdifferent sectors (such as agriculture and services) in national income, the composition of imports and exports, and so on.
2.2. Income and growth
2.2.1. Measurement issues
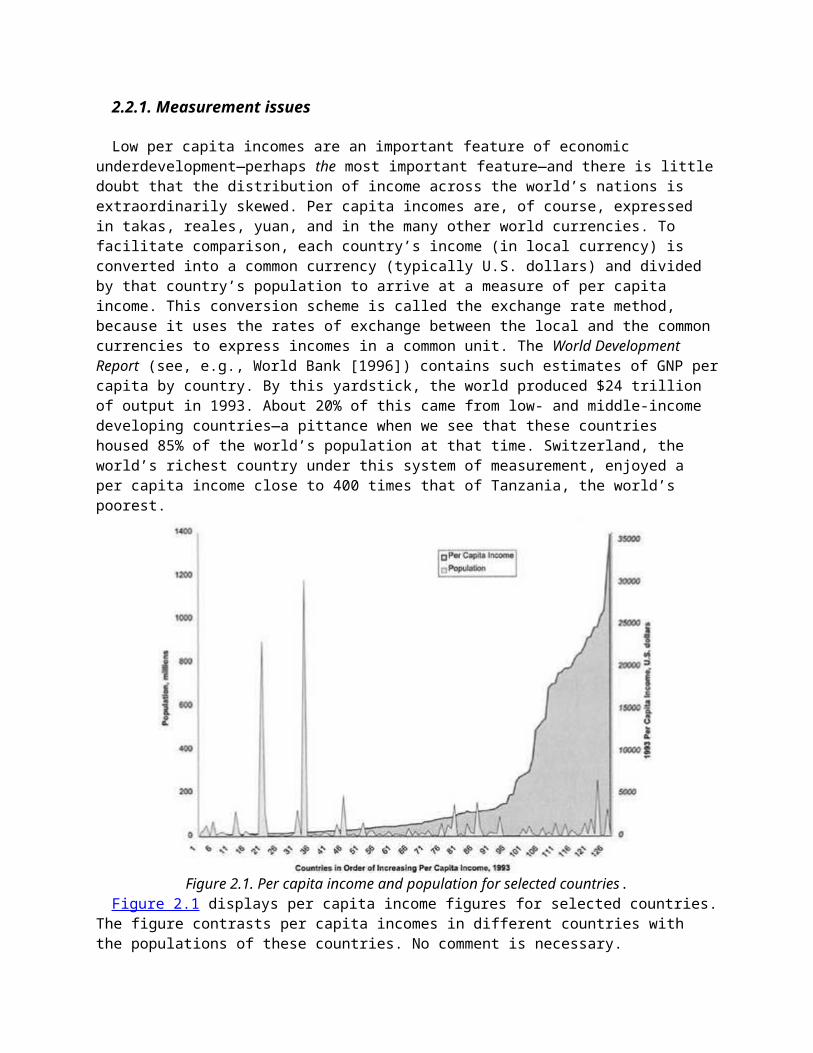
Low per capita incomes are an important feature of economic underdevelopment—perhaps the most important feature—and there is littledoubt that the distribution of income across the world’s nations is extraordinarily skewed. Per capita incomes are, of course, expressed in takas, reales, yuan, and in the many other world currencies. To facilitate comparison, each country’s income (in local currency) is converted into a common currency (typically U.S. dollars) and divided by that country’s population to arrive at a measure of per capita income. This conversion scheme is called the exchange rate method, because it uses the rates of exchange between the local and the commoncurrencies to express incomes in a common unit. The World Development Report (see, e.g., World Bank [1996]) contains such estimates of GNP percapita by country. By this yardstick, the world produced $24 trillion of output in 1993. About 20% of this came from low- and middle-income developing countries—a pittance when we see that these countries housed 85% of the world’s population at that time. Switzerland, the world’s richest country under this system of measurement, enjoyed a per capita income close to 400 times that of Tanzania, the world’s poorest.
Figure 2.1. Per capita income and population for selected countries.Figure 2.1 displays per capita income figures for selected countries.
The figure contrasts per capita incomes in different countries with the populations of these countries. No comment is necessary.

The disparities are enormous, and no amount of fine-tuning in measurement methods can get rid of the stark inequalities that we livewith. Nevertheless, both for a better understanding of the degree of international variation that we are talking about and for the sake of more reliable analysis of these figures, it is best to recognize at the outset that these measures provide biased estimates of what is actually out there.(1) For one thing, underreporting of income is not uncommon in
developing countries. Because tax collection systems are not as efficient as those prevailing in the industrialized market economies, there is a greater incentive to underreport income or output for tax purposes. The national accounts may not be comprehensive as well.4
In addition, the proportion of income that is actually generated for self-consumption is relatively high in developing countries. As we shall soon see, the proportion of the population living in the rural sector in developing countries is large. Many of these individuals aresubsistence farmers who grow crops that they themselves consume. Such outputs may not be reported adequately.Although we can make educated guesses about the degree of
underestimation involved, there is really very little that we can do about correcting for this problem.(2) A far more serious issue comes from the fact that prices for many
goods in all countries are not appropriately reflected in exchange rates. This is only natural for goods and services that are not internationally traded. Exchange rates are just prices, and the levelsof these prices depends only on commodities (including capital) that cross international borders. The prices of nontraded goods, such as infrastructure and many services, do not affect exchange rates. What is interesting is that there is a systematic way in which these nontraded prices are related to the level of development. Because poorcountries are poor, you would expect them to have relatively low prices for nontraded goods: their lower real incomes do not suffice topull these prices up to international levels. However, this same logicsuggests that a conversion of all incomes to U.S. dollars using exchange rates underestimates the real incomes of poorer countries. This can be corrected to some extent, and indeed in some data sets it has been. The most widely used of these is the Heston-Summers data set (see box). Recently, the World Bank started to publish income data in this revised format.Purchasing Power Parity Measurement of Income:The International Comparison Program
According to GDP estimates calculated on an exchange-rate basis, Asia’s weight in world output fell from 7.9% in 1985 to 7.2% in 1990—and yet Asia was by far the fastest growing region during this period5.This same period also witnessed a sharp decline in some Asian countries’ exchange rates against the dollar. Now does that tell us something about the shortcomings of GDP exchange-rate estimates? In anattempt to correct for such anomalies, two economists at the University of Pennsylvania, Alan Heston and Robert Summers, created a new data set called the Penn World Tables (PWT; also called the Heston-Summers data set). It consists of a set of national accounts for a very large set of countries dating from 1950 and its unique feature is that its entries are denominated in a set of “international” prices in a common currency. Hence, international comparisons of GDP can be made both between countries and over time.Actually, the trouble with market exchange rates for GDP calculations
is not so much that they fluctuate, but that they do not fluctuate around the “right” average price, if “right” is to be measured by purchasing power. Even if exchange rates equalize the prices of internationally traded goods over time, substantial differences remainin the prices of nontraded goods and services such as housing and domestic transportation. These prices need to be corrected for as well. The most ambitious effort, to date, toward estimating the “correct” international prices is the United Nations International Comparison Program (ICP), which carried out detailed price comparisonsfor a set of benchmark countries every fifth year between 1970 and 1985. Apart from domestic price data, the procedure also involves the use of national accounts expenditure data. The PWT were constructed using the ICP data.As a first step, the ICP gathers detailed data on prices of 400–700
items in each of a set of benchmark countries. The price of each item is then divided by its corresponding price in the United States, thus yielding a relative price. These items are then classified into one of 150 expenditure categories (110 consumption, 35 investment, and 5 government expenditure categories). By an averaging procedure, the average relative price for each category is obtained, which makes 150 relative prices (or “price parities”) available for each country.Next, national currency expenditure pijqij (i.e., price times quantity
for each item i in each benchmark country j) on each of the 150 categories is obtained from each country. This is used to estimate thequantities involved in national output. How is this done? Dividing theexpenditure for each category by its relative price, that is, (Pijqij)/(Pij/PUs) yields an estimate of the quantity in the category,

valued at its corresponding U.S. price, qijpUs. Note that it is possible to make international comparisons of output by simply using these quantities valued at U.S. prices. However, U.S. prices alone do not reflect the tastes of all countries, so we still have to construct international prices to evaluate these quantities.For this, recall that we have 150 categorywise relative prices for
each country. For each category, the international relative price is obtained by aggregating the relative price for this category over all benchmark countries, based on a method suggested by statistician R. C.Geary. The method is such that the international relative price obtained for any item is a specialized weighted average of the relative price of that item in all the countries in the set. Thus the international price for any item may differ from a country’s domestic price. For instance, because food is cheaper in a rich country than ina poor country, the international price of food tends to be higher than its domestic price in a rich country. At the same time, the international price of investment is lower than in a rich country. Thequantities obtained earlier from expenditure data are now valued at the international prices, which yields the value of national output atthese prices. The purchasing power parity (PPP) for any country is the ratio of its domestic currency expenditures to the international pricevalue of its output.From the set of benchmark countries, PPPs for other countries are
extrapolated using capital city price surveys conducted by other agencies. Once a complete set of PPPs is available, extrapolations aremade for the value of GDP of the entire set of countries for other years between 1950 and 1988. For instance, RGDP (i.e., real GDP for other years, using 1985 international prices as the base year prices) is extrapolated on the basis of growth rates of different economies, and CGDP (calculated nominal GDP for other years at international prices in those years) is calculated using price indexes and current price national accounts data for those years.Apart from GDP data, the PWT also offers data on selected countries’
capital stocks and demographic statistics. In the revised GDP calculations based on PPP, Asia’s share in world output in 1990 jumpedfrom 7 to 18%. China emerges as the world’s third largest economy and India comes in at fifth place. The United States remains the world’s largest economy.
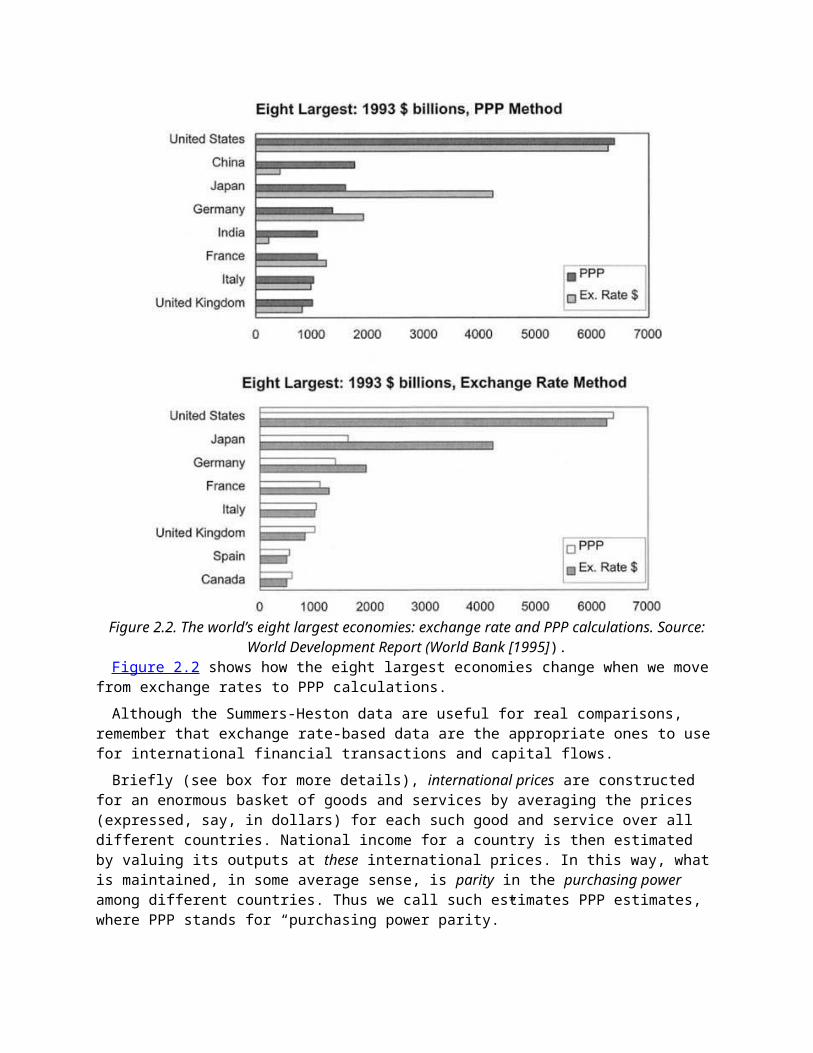
Figure 2.2. The world’s eight largest economies: exchange rate and PPP calculations. Source:World Development Report (World Bank [1995]).
Figure 2.2 shows how the eight largest economies change when we move from exchange rates to PPP calculations.Although the Summers-Heston data are useful for real comparisons,
remember that exchange rate-based data are the appropriate ones to usefor international financial transactions and capital flows.Briefly (see box for more details), international prices are constructed
for an enormous basket of goods and services by averaging the prices (expressed, say, in dollars) for each such good and service over all different countries. National income for a country is then estimated by valuing its outputs at these international prices. In this way, what is maintained, in some average sense, is parity in the purchasing power among different countries. Thus we call such estimates PPP estimates, where PPP stands for “purchasing power parity.”
PPP estimates of per capita income go some way toward reducing the astonishing disparities in the world distribution of income, but certainly not all the way. For an account of how the PPP estimates alter the distribution of world income, consult Figure 2.3.The direction of change is quite clear and, from the foregoing
discussion, only to be expected. Measured in PPP dollars, developing countries do better relative to U.S. per capita GNP, although the fractions are still small, to be sure. This situation reflects the fact that domestic prices are not captured adequately by using exchange-rate conversions, which apply correctly only to a limited setof traded goods.(3) There are other subtle problems of measurement. GNP measurement,
even when it accounts for the exchange-rate problem, uses market prices to compare apples and oranges; that is, to convert highly disparate goods into a common currency. The theoretical justification for this is that market prices reflect people’s preferences as well asrelative scarcities. Therefore such prices represent the appropriate conversion scale to use. There may be several objections to this argument. Not all markets are perfectly competitive; neither are all prices fully flexible. We have monopolies, oligopolistic competition, and public sector companies6 that sell at dictated prices. There is expenditure by the government on bureaucracy, on the military, or on space research, whose monetary value may not reflect the true value ofthese services to the citizens. Moreover, conventional measures of GNPignore costs that arise from externalities—the cost of associated pollution, environmental damage, resource depletion, human suffering due to displacement caused by “development projects” such as dams and railways, and so forth. In all of these cases, prevalent prices do notcapture the true marginal social value or cost of a good or a service.
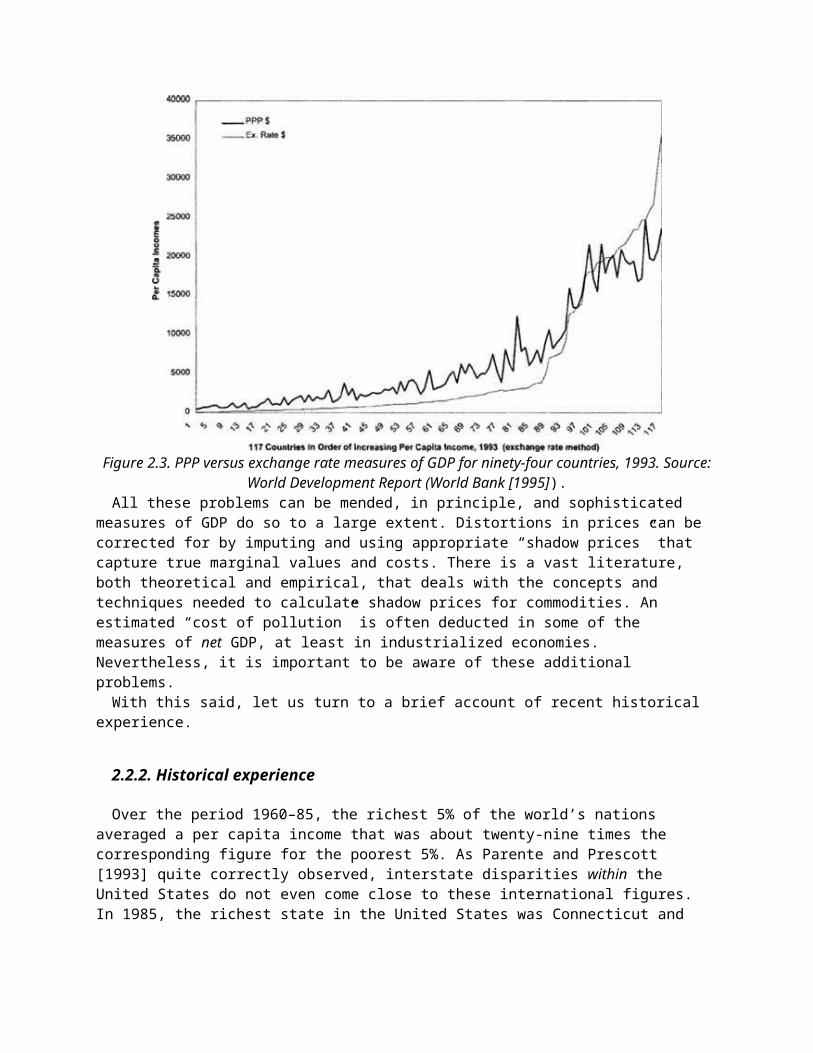
Figure 2.3. PPP versus exchange rate measures of GDP for ninety-four countries, 1993. Source:World Development Report (World Bank [1995]).
All these problems can be mended, in principle, and sophisticated measures of GDP do so to a large extent. Distortions in prices can be corrected for by imputing and using appropriate “shadow prices” that capture true marginal values and costs. There is a vast literature, both theoretical and empirical, that deals with the concepts and techniques needed to calculate shadow prices for commodities. An estimated “cost of pollution” is often deducted in some of the measures of net GDP, at least in industrialized economies. Nevertheless, it is important to be aware of these additional problems.With this said, let us turn to a brief account of recent historical
experience.
2.2.2. Historical experience
Over the period 1960–85, the richest 5% of the world’s nations averaged a per capita income that was about twenty-nine times the corresponding figure for the poorest 5%. As Parente and Prescott [1993] quite correctly observed, interstate disparities within the United States do not even come close to these international figures. In 1985, the richest state in the United States was Connecticut and
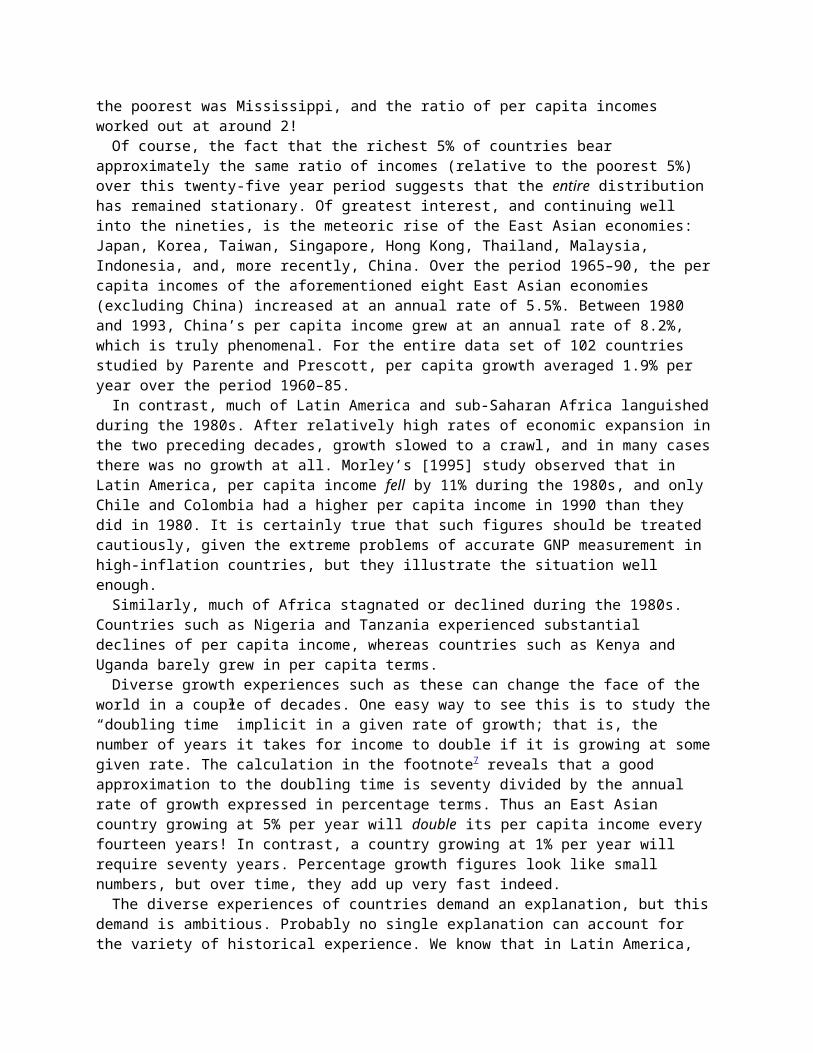
the poorest was Mississippi, and the ratio of per capita incomes worked out at around 2!Of course, the fact that the richest 5% of countries bear
approximately the same ratio of incomes (relative to the poorest 5%) over this twenty-five year period suggests that the entire distribution has remained stationary. Of greatest interest, and continuing well into the nineties, is the meteoric rise of the East Asian economies: Japan, Korea, Taiwan, Singapore, Hong Kong, Thailand, Malaysia, Indonesia, and, more recently, China. Over the period 1965–90, the percapita incomes of the aforementioned eight East Asian economies (excluding China) increased at an annual rate of 5.5%. Between 1980 and 1993, China’s per capita income grew at an annual rate of 8.2%, which is truly phenomenal. For the entire data set of 102 countries studied by Parente and Prescott, per capita growth averaged 1.9% per year over the period 1960–85.In contrast, much of Latin America and sub-Saharan Africa languished
during the 1980s. After relatively high rates of economic expansion inthe two preceding decades, growth slowed to a crawl, and in many casesthere was no growth at all. Morley’s [1995] study observed that in Latin America, per capita income fell by 11% during the 1980s, and only Chile and Colombia had a higher per capita income in 1990 than they did in 1980. It is certainly true that such figures should be treated cautiously, given the extreme problems of accurate GNP measurement in high-inflation countries, but they illustrate the situation well enough.Similarly, much of Africa stagnated or declined during the 1980s.
Countries such as Nigeria and Tanzania experienced substantial declines of per capita income, whereas countries such as Kenya and Uganda barely grew in per capita terms.Diverse growth experiences such as these can change the face of the
world in a couple of decades. One easy way to see this is to study the“doubling time” implicit in a given rate of growth; that is, the number of years it takes for income to double if it is growing at somegiven rate. The calculation in the footnote7 reveals that a good approximation to the doubling time is seventy divided by the annual rate of growth expressed in percentage terms. Thus an East Asian country growing at 5% per year will double its per capita income every fourteen years! In contrast, a country growing at 1% per year will require seventy years. Percentage growth figures look like small numbers, but over time, they add up very fast indeed.The diverse experiences of countries demand an explanation, but this
demand is ambitious. Probably no single explanation can account for the variety of historical experience. We know that in Latin America,
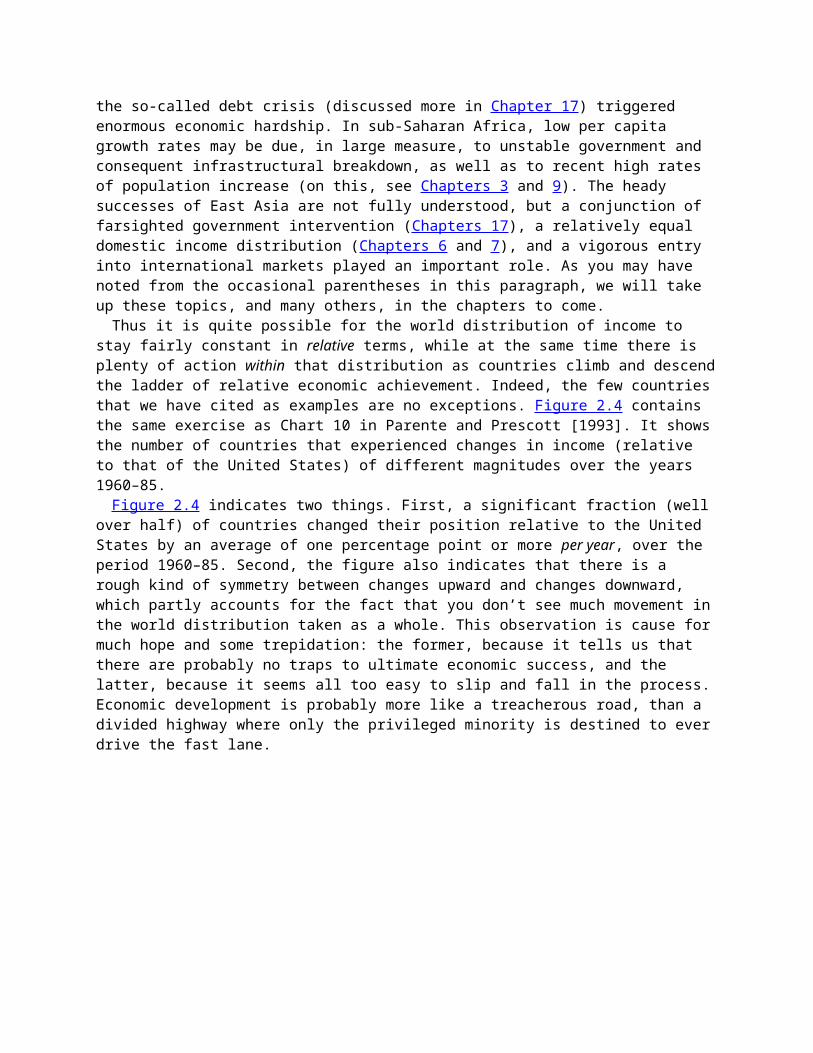
the so-called debt crisis (discussed more in Chapter 17) triggered enormous economic hardship. In sub-Saharan Africa, low per capita growth rates may be due, in large measure, to unstable government and consequent infrastructural breakdown, as well as to recent high rates of population increase (on this, see Chapters 3 and 9). The heady successes of East Asia are not fully understood, but a conjunction of farsighted government intervention (Chapters 17), a relatively equal domestic income distribution (Chapters 6 and 7), and a vigorous entry into international markets played an important role. As you may have noted from the occasional parentheses in this paragraph, we will take up these topics, and many others, in the chapters to come.Thus it is quite possible for the world distribution of income to
stay fairly constant in relative terms, while at the same time there is plenty of action within that distribution as countries climb and descendthe ladder of relative economic achievement. Indeed, the few countriesthat we have cited as examples are no exceptions. Figure 2.4 contains the same exercise as Chart 10 in Parente and Prescott [1993]. It showsthe number of countries that experienced changes in income (relative to that of the United States) of different magnitudes over the years 1960–85.Figure 2.4 indicates two things. First, a significant fraction (well
over half) of countries changed their position relative to the United States by an average of one percentage point or more per year, over the period 1960–85. Second, the figure also indicates that there is a rough kind of symmetry between changes upward and changes downward, which partly accounts for the fact that you don’t see much movement inthe world distribution taken as a whole. This observation is cause formuch hope and some trepidation: the former, because it tells us that there are probably no traps to ultimate economic success, and the latter, because it seems all too easy to slip and fall in the process.Economic development is probably more like a treacherous road, than a divided highway where only the privileged minority is destined to everdrive the fast lane.

Figure 2.4. Annual percentage change in PPP income of different countries relative to U.S. levels,1960–85. Source: Penn World Tables.
This last statement must be taken with some caution. Although there appears to be no evidence that very poor countries are doomed to eternal poverty, there is some indication that low incomes are very sticky. Even though we will have much more to say about the hypothesisof ultimate convergence of all countries to a common standard of living (see Chapters 3–5), an illustration may be useful at this stage. Quah [1993] used per capita income data to construct “mobility matrices” for countries. To understand how these matrices work, let’s start by converting all per capita incomes to fractions of the world’s per capita income. Thus, if country X has a per capita income of $1,000and the world average is $2,000, we give country X an index of 1/2. Nowlet’s create categories that we will put each country into. Quah used the following categories (you can certainly use others if you like): 1/4, 1/2, 1, 2, and ∞. For instance, a category with the label 2 contains all countries with indexes between 1 and 2; the category 1/4 contains all countries with indexes less than 1/4; the category oo contains all countries with indexes exceeding 2, and so on.Now imagine doing this exercise for two points in time, with a view
to finding out if a country transited from one category to another during this period. You will generate what we might call a mobility matrix. The diagram in Figure 2.5 illustrates this matrix for the twenty-three year period 1962–84, using the Summers–Heston data set. The rows and columns of the matrix are exactly the categories that we

just described. Thus a cell of this matrix defines a pair of categories. What you see is a number in each of these cells. Look, forinstance, at the entry 26 in the cell defined by the categories 1 (row) and 2 (column). This entry tells us the percentage of countries that made the transition from one category to the other over the twenty-three year period. In this example, therefore, 26% of the countries who were between half the world average and the world average in 1962 transited to being between the world average and twice the world average. A matrix constructed in this way gives you a fairlygood sense of how much mobility there is in relative per capita GNP across nations. A matrix with very high numbers on the main diagonal, consisting of those special cells with the same row and column categories, indicates low mobility. According to such a matrix, countries that start off in a particular category have a high probability of staying right there. Conversely, a matrix that has the same numbers in every entry (which must be 20 in our 5 × 5 case, given that the numbers must sum to 100 along each row) shows an extraordinarily high rate of mobility. Regardless of the starting point in 1962, such a matrix will give you equal odds of being in any of the categories in 1984.
Figure 2.5. The income mobility of countries, 1962–84. Source: Quah [1993].With these observations in mind, continue to stare at Figure 2.5.
Notice that middle-income countries have far greater mobility than either the poorest or the richest countries. For instance, countries in category 1 (between half the world average and the world average)

in 1962 moved away to “right” and “left”: less than half of them remained where they were in 1962. In stark contrast to this, over three-quarters of the poorest countries (category 1/4) in 1962 remained where they were, and none of them went above the world average by 1984. Likewise, fully 95% of the richest countries in 1962 stayed right where they were in 1984.8 This is interesting because it suggests that although everything is possible (in principle), a history of underdevelopment or extreme poverty puts countries at a tremendous disadvantage.This finding may seem trite. Poverty should feed on itself and so
should wealth, but on reflection you will see that this is really not so. There are certainly many reasons to think that historically low levels of income may be advantageous to rapid growth. New technologies are available from the more developed countries. The capital stock is low relative to labor in poor countries, so the marginal product of capital could well be high. One has, to some extent, the benefit of hindsight: it is possible to study the success stories and avoid policies that led to failures in the past. This account is not meant to suggest that the preceding empirical finding is inexplicable: it’s just to say that an a priori guess does not yield straightforward answers. We will have much more to say on this topic throughout the book.There is actually a bit more to Figure 2.5 than lack of mobility at
the extremes. Look at the next-to-poorest category (those with incomesbetween one-quarter and one-half of the world average in 1962). Note that 7% of these countries transited to incomes above the world average by 1984. However, over half of them dropped to an even lower category. Thus it is not only the lowest-income countries that might be caught in a very difficult situation. In general, at low levels of income, the overall tendency seems to be movement in the downward direction.To summarize, then, we have the following observations.(1) Over the period 1960–1985, the relative distribution of world
income appears to have been quite stable. The richest 5% of the world’s nations averaged a level of per capita income that was about 29 times the corresponding figure for the poorest 5%. By any standards, this disparity is staggering, and especially so when we remember that we are talking about incomes that have been corrected for purchasing power parity.(2) The fact that the overall distribution has remained stationary
does not mean that there has been little movement of countries within the world distribution. Of particular interest in the 1980s is the rise of the East Asian economies and the languishing of other

economies, particularly those of sub-Saharan Africa and Latin America.Diverse growth experiences such as these can change the economic composition of the world in the space of a few decades. Nonetheless, asingle explanation for this diversity remains elusive.(3) The observation that several countries have changed relative
positions suggests that there are no ultimate traps to development. Atthe same time, a history of wealth or poverty does seem to partly foretell future developments. The mobility of countries appears to be highest somewhere in the middle of the wealth distribution, whereas a history of underdevelopment or extreme poverty appears to put countries at a disadvantage.(4) That history matters in this way is an observation that requires
a careful explanation. Poor countries do seem to have some advantages.They can use, relatively free of charge, technologies that are developed by their richer counterparts. Scarce capital in these countries should display a higher rate of profit, because of the law of diminishing returns. They can learn from mistakes that their predecessors have made. In this way differences across countries should iron themselves out over the longer run. Thus the observation that history matters in maintaining persistent differences needs more of a justification than might be obvious at first glance.
2.3. Income distribution in developing countries
The international disparity of national income is only one indication that something is fundamentally askew with global development. Add to this the astonishing inequalities observable within each of the vast majority of developing countries. It is commonplace to see enormous wealth coexisting with great poverty, and nowhere is this more evidentthan on the streets of Bombay, Rio de Janeiro, Manila, Mexico City, and the other great urban conglomerates of the developing world. It isn’t that such inequalities do not exist in the developed world—they certainly do—but coupled with the low average income of developing countries, these disparities result in an outcome of visible poverty and destitution.We will have much more to say on the topic of income distribution
later in this book (see especially Chapters 6 and 7). As an overview, however, it is useful to get a feel for the magnitude of the problem by looking at some data.9 Figure 2.6 summarizes recent information on inequality for selected countries, spanning the range between poorest and richest.10 The figure records the income share of the poorest 40% of the population as well as the income share of the richest 20% of
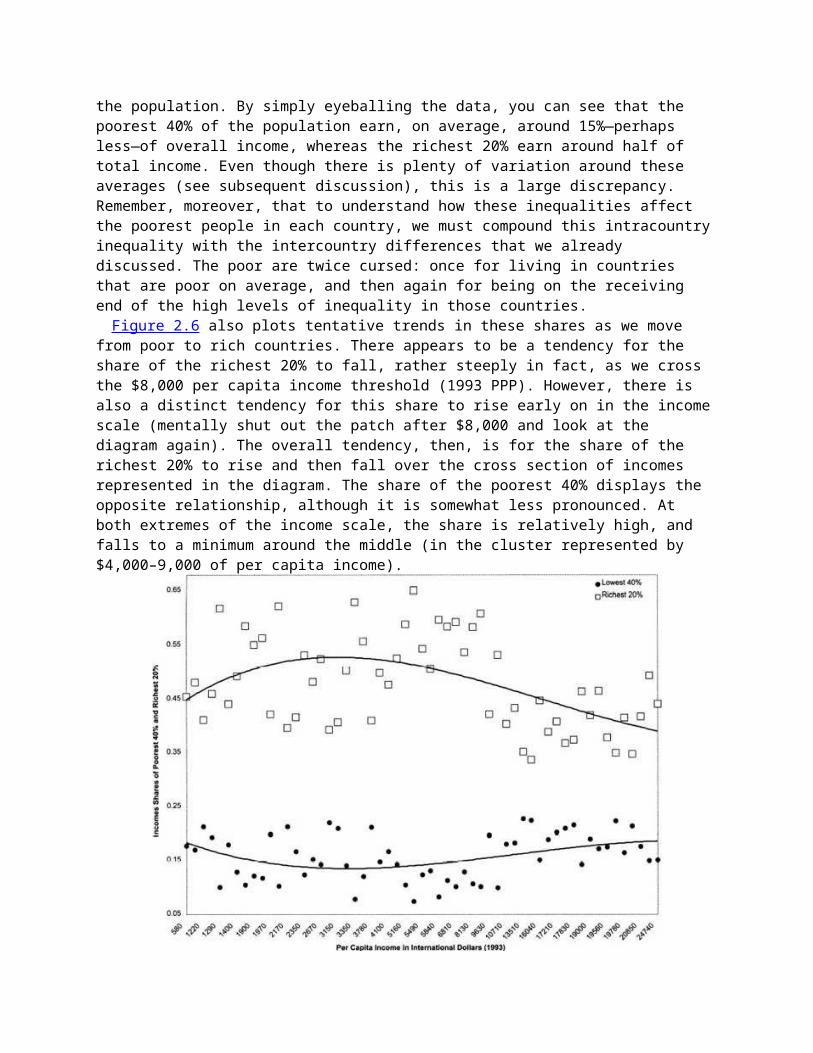
the population. By simply eyeballing the data, you can see that the poorest 40% of the population earn, on average, around 15%—perhaps less—of overall income, whereas the richest 20% earn around half of total income. Even though there is plenty of variation around these averages (see subsequent discussion), this is a large discrepancy. Remember, moreover, that to understand how these inequalities affect the poorest people in each country, we must compound this intracountryinequality with the intercountry differences that we already discussed. The poor are twice cursed: once for living in countries that are poor on average, and then again for being on the receiving end of the high levels of inequality in those countries.Figure 2.6 also plots tentative trends in these shares as we move
from poor to rich countries. There appears to be a tendency for the share of the richest 20% to fall, rather steeply in fact, as we cross the $8,000 per capita income threshold (1993 PPP). However, there is also a distinct tendency for this share to rise early on in the incomescale (mentally shut out the patch after $8,000 and look at the diagram again). The overall tendency, then, is for the share of the richest 20% to rise and then fall over the cross section of incomes represented in the diagram. The share of the poorest 40% displays the opposite relationship, although it is somewhat less pronounced. At both extremes of the income scale, the share is relatively high, and falls to a minimum around the middle (in the cluster represented by $4,000–9,000 of per capita income).

Figure 2.6. Income shares of poorest 40% and richest 20% for fifty-seven countries arranged inorder of increasing per capita income (PPP). Source: World Development Report (World Bank
[1995]) and Deininger and Squire [1996a].The two trends together suggest, very tentatively indeed, that
inequality might rise and then fall as we move from lower to higher incomes. This is the essence of a famous hypothesis owing to Kuznets [1955] that is known as the inverted U (referring to the shape traced by rising and then falling inequality). We will take a closer look at this relationship in Chapter 7. For now, nothing is really being said about how inequality in a single country changes over time: what we have here is a snapshot running over different countries.South Asian countries, such as India, Bangladesh, and Sri Lanka, many
African countries, such as Tanzania, Uganda, Kenya, Senegal, Nigeria, and Ghana, and a few of the poorer Latin American countries, such as El Salvador, Nicaragua, and Bolivia, populate the first stretch in this diagram. Then come the middle-income countries, with a large concentration of Latin American nations—Guatemala, Peru, Brazil, Colombia, Costa Rica, Mexico, Chile, Panama—as well as fast-growing Asian countries such as Thailand and Malaysia. At the $9,000 mark we hit countries such as Korea, Puerto Rico, Portugal, and Mauritius, andthis is the approximate region in which we see a drop in the income share of the richest 20%. We then move into the rich countries, mainlyEuropean and North American, with a sprinkling of East Asian nations—Singapore, Japan, and Hong Kong—among them. Specific data on income and inequality are provided for a subsample of countries in Table 2.1.The data presented here suggest that economic development is an
inherently uneven process. At very low levels of income, average levels of living are very low, and so it is very difficult to squeeze the income share of the poorest 40% below a certain minimum. For such countries the income share of the rich, although high, is nowhere close to the extraordinarily high ratios observed in middle-income countries. This indicates the possibility that as economic growth proceeds, it initially benefits the richest groups in society more than proportionately. This situation is reflected in a rise in the income share of the upper quintile of the population. The share of thepoorest groups tends to fall at the same time, although this does not mean that their income goes down in absolute terms. At higher levels of per capita income, economic gains tend to be distributed more equally—the poorest quintiles now gain in income share.Table 2.1. Shares of poorest 40% and richest 20% for selected countries.

Source: World Development Report (World Bank [1995]) and Deininger and Squire [1996a].It is worth noting (and we will say this again in Chapter 7) that
there is no inevitability about this process. Countries that pursue policies of broad-based access to infrastructure and resources, such as health services and education, will in all likelihood find that economic growth is distributed relatively equally among the various groups in society. Countries that neglect these features will show a greater tendency toward inequality. Indeed, matters are actually more complicated than this. These policies may in turn affect the overall rate of growth that a country can sustain. Although many of us might want to believe that equity and growth go hand in hand, this may well

turn out to be not true, at least in some situations. The need to discuss this crucial interaction cannot be overemphasized.The combination of low per capita incomes and the unequal
distribution of them means that in large parts of the developing world, people might lack access to many basic services: health, sanitation, education, and so on. The collection of basic indicators that makes up the nebulous concept of progress has been termed human development, and this is what we turn to next.
2.4. The many faces of underdevelopment
2.4.1. Human development
Income is distributed unequally within all countries, and especially so in developing countries. We also noticed a fair degree of variationin inequality across countries: middle-income countries have significantly higher inequality. This variation suggests that excessive reliance on GNP per capita as a reliable indicator of overall development might well be dangerous. A relatively prosperous country may fare poorly on some of the commonsense indicators of development, such as literacy, access to drinking water, low rates of infant mortality, life expectancy, and so on. In part, this is becauseincome is distributed unequally, but other features may be at work as well. The social and economic empowerment of women may serve to significantly reduce infant mortality and (more generally) raise the health and nutritional status of children, yet neither income nor its equal distribution across households fully guarantees the empowerment ofwomen. Likewise, a country that promotes popular science and health education programs might be a welcome outlier in the health category, even though income may be low or poorly distributed. Later in this section, we will emphasize the overall correlation of “human development” with per capita income, but it is worthwhile to be sensitive to the outliers, because they tell a different story.Consider the countries of Guatemala and Sri Lanka. The income and
income distribution data for these two countries have been extracted from Table 2.1 and reproduced in Table 2.2.Table 2.2 informs us that in 1993, Guatemala had per capita income
that exceeded that of Sri Lanka, but the distribution of this income speaks for itself. In Guatemala, the poorest 40% of the population hadaccess to a bit less than 8% of national income. The corresponding share for Sri Lanka is almost three times as large.

Now look at some of the “human development” indicators for these two countries, compiled in Table 2.3. Except for access to safe water, these indicators are very different indeed. Life expectancy is a good seven years higher in Sri Lanka. Much of this difference stems from the huge difference in the infant mortality rate, defined as the number of children (per thousand live births) who die before the age of 1. In Sri Lanka this figure is eighteen per thousand; in Guatemala it is more than two and a half times higher. Sri Lanka has an adult literacy rate of close to 90%; that of Guatemala is only 54%.Looking at these two tables, it is hard to escape the conclusion that
the highly unequal distribution of income in Guatemala is responsible,at least in part, for these differences in some natural yardsticks of development.However, that isn’t the whole story. Even a relatively equal
distribution of income may not be enough. Of course, one reason for this is that per capita income is not high. For instance, however stunning the efforts of Sri Lanka are, countries such as Hong Kong do better simply because there are more resources to play with. However, what about a country such as Pakistan? The 1995 World Development Report lists Pakistan with a 1993 per capita GDP of $2,170. The poorest 40% of the population earn 21% of the total income. These overall figures are similar to those of Sri Lanka, but Pakistan has a life expectancy of only 62 and an infant mortality rate of ninety-one per thousand, fivetimes that of Sri Lanka. The literacy rate for Pakistan was only 36% in 1992—significantly less than half that of Sri Lanka. Clearly, government policies, such as those concerning education and health, and the public demand for such policies, play significant roles.Table 2.2. Shares of poorest 40% and richest 20% for Sri Lanka and Guatemala.
Source: World Development Report (World Bank [1995]) and Deininger and Squire [1996].Table 2.3. Indicators of “human development” for Sri Lanka and Guatemala.

Source: Human Development Report (United Nations Development Programme [1995]).Note: All data are for 1992, except for access to safe water, which isthe 1988–93 average.
2.4.2. An index of human development
Many of the direct physical symptoms of underdevelopment are easily observable and independently measurable. Undernutrition, disease, illiteracy—these are among the stark and fundamental ills that a nation would like to remove through its development efforts. For quitesome time now, international agencies (like the World Bank and the United Nations) and national statistical surveys have been collecting data on the incidence of malnutrition, life expectancy at birth, infant mortality rates, literacy rates among men and women, and various other direct indicators of the health, educational, and nutritional status of different populations.As we have seen, a country’s performance in terms of income per
capita might be significantly different from the story told by these basic indicators. Some countries, comfortably placed in the “middle-income” bracket, nevertheless display literacy rates that barely exceed 50%, infant mortality rates close to or exceeding one hundred deaths per thousand, and undernourishment among a significant proportion of the population. On the other hand, there are instances of countries with low and modestly growing incomes, that have shown dramatic improvements in these basic indicators. In some categories, levels comparable to those in the industrialized nations have been reached.The United Nations Development Programme (UNDP) has published the
Human Development Report since 1990. One objective of this Report is to coalesce some of the indicators that we have been discussing into a single index, which is known as the human development index (HDI). This isnot the first index that has tried to put various socioeconomic indicators together. A forerunner is Morris’ “physical quality of lifeindex” (Morris [1979]), which created a composite index from three

indicators of development: infant mortality, literacy, and life expectancy conditional on reaching the age of 1.The HDI has three components as well. The first is life expectancy at
birth (this will indirectly reflect infant and child mortality).11 The second is a measure of educational attainment of the society. This measure is itself a composite: it takes a weighted average of adult literacy (with weight 2/3) and a combination of enrollment rates in primary, secondary and tertiary education (with weight 1/3). The last component is per capita income, which is adjusted somewhat after a threshold (around $5,000 in PPP dollars, 1992) is crossed. Less weightis given to higher incomes after this point, on the grounds that thereis diminishing marginal utility to higher incomes. The HDI is calculated by defining some notion of a country’s achievements in eachof these three components, and then taking a simple average of the three indicators.The creation of composites from such fundamentally different
indicators as life expectancy and literacy is a bit like adding applesand oranges. It is arguable that rather than create composites, the reader should view the different indicators (as we will do presently) and then judge the overall situation for herself. The advantage of a composite index is its simplicity and, of course, its political power:in this era of sound bites, it is far easier and appears to be more “scientific” to say that country X has an “index” of 8 out of 10, rather than laboriously to detail that country’s achievements (or lackof them) in five different spheres of development.12 The HDI might look scientific and the formulae used to create the final average might lookcomplex, but that is no reason to accept the implicit weighting schemethat it uses, because it is just as ad hoc as any other. It cannot be otherwise. Nevertheless, the HDI is one way to combine important development indicators, and for this reason it merits our attention.The HDI creates, for each country, a final number that takes a value
somewhere between 0 and 1. The number is to be (tentatively) interpreted as the “fraction of ultimate development” that has been achieved by the country in question. Because these notions of “ultimate bliss” are embodied in the HDI, it is not surprising that the indicator is relatively varied among the poorer countries, but then flattens out sharply as we move into richer countries.13 Thus statements made in the Report, such as “the HDI of industrial countries (0.916) is only 1.6 times higher than that of developing countries (0.570), even though their real GDP per capita (PPP$) is 6 times higher,” are meaningless.14
Although such comparisons of ratios simply do not make sense, the rankings generated by the HDI are of some interest because they
illustrate how it is possible for a relatively high-income country to fare so badly in meeting basic socioeconomic goals that its HDI index falls behind that of a relatively poor country. One way to show how this happens is to present the HDI ranking for different countries as well as the rankings induced by per capita GDP. It is then possible tostudy the difference in the two rankings induced by these two measures. A positive difference means that the country has done betterin “human development” relative to its position in the GDP rankings; anegative ranking means the opposite. What about the examples of our previous section: Sri Lanka, Guatemala, and Pakistan? The ranking approach justifies what we already saw on the basis of specific indicators. Sri Lanka has a positive rank differential of +5. Guatemala and Pakistan have negative rank differentials of -20 and -28, respectively.
2.4.3. Per capita income and human development
There is little doubt, then, that per capita income, or even the equality of its distribution, does not serve as a unilateral guaranteeof success in “human development.” This sentiment is captured very well in one of the views of development with which we started this chapter.At the same time, the apparently narrow perspective of mainstream
economists, with its hard-nosed focus on per capita income as a summary statistic of development, may not be too out of line. It is arguable that although taking a wider and multidimensional view of development is conceptually correct, per capita GDP still acts as a fairly good proxy for most aspects of development.15 For instance, it can be argued that rising income levels ultimately and inevitably translate into better health, nutritional, and educational standards in a population. It is, therefore, a useful exercise to see from cross-country data, how much “explanatory power” per capita GDP has over other basic indicators.One way to go about this exercise is to collect data on per capita
income as well as on some other facet of development that we might be interested in, and then connect the two by means of a scatter diagram (seeAppendix 2). In brief, a scatter diagram allows us to eyeball possiblerelationships between a dependent variable whose variation we are seeking to explain (such as infant mortality or life expectancy) and one or more independent variables whose variation presumably “explains” the changes of the dependent variable. In the present situation, our independent variable is per capita income.

In this section, we chose three indicators of development that are ofinterest: life expectancy at birth, the infant mortality rate, and theadult literacy rate. To be sure, these indicators are not entirely independent of each other. For instance, life expectancy includes the possibility of dying before the age of 1, which is infant mortality. Nevertheless, these are common indicators that enter into indexes of development, such as the HDI or the physical quality of life index.Figures 2.7–2.9 simply plot the relationship between these variables
and per capita income, by looking at a cross section of countries. It is only to be expected that as we move into the range of countries with very high per capita income, these indicators will be at high levels as well, and they are. So as not to dwarf the entire exercise by these extremes, we leave out all countries with per capita income exceeding $9,000 PPP (1993). In principle, this makes the case against per capita income stronger. Variation in income here is somewhat smaller, and there is therefore much room for other policies or characteristics to affect the outcome.Each of these diagrams has a cross-bar that is drawn at the average
values of the data in that sample. For instance, the cross-bar in Figure 2.8 is located at an average per capita income of $3,500 and a literacy rate of around 72% (which are the averages for the sample). The scattered dots are the observations, of course. The idea of the diagram is to check the correlation between the two variables concerned (see Appendix 2). If the correlation is expected to be positive, for instance, we would expect most of the dots to lie in the northeast andsouthwest quadrants of the cross-bar. This is our expectation for literacy and life expectancy. For infant mortality, we expect the relationship to be negative, so the observations should lie in the northwest and southeast quadrants of the cross-bar.By and large, the relationship between per capita income alone and
each of these variables is strikingly strong. In each of the three cases, the great majority of the observations lie within the expected quadrants. The figures speak for themselves to express the idea that per capita income is a powerful correlate of development, no matter how broadly we conceive of it. Thus we must begin, and we do so, with astudy of how per capita incomes evolve in countries. This is the subject of the theory of economic growth—a topic that we take up in detail in the chapters to come.
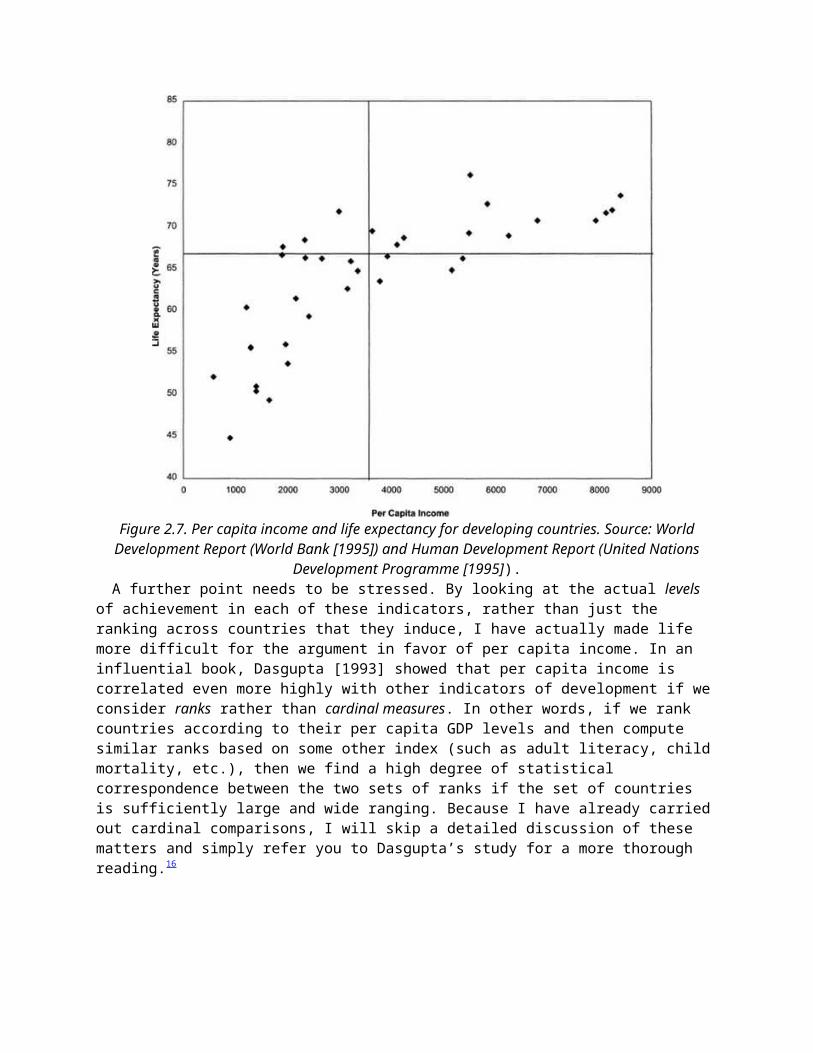
Figure 2.7. Per capita income and life expectancy for developing countries. Source: WorldDevelopment Report (World Bank [1995]) and Human Development Report (United Nations
Development Programme [1995]).A further point needs to be stressed. By looking at the actual levels
of achievement in each of these indicators, rather than just the ranking across countries that they induce, I have actually made life more difficult for the argument in favor of per capita income. In an influential book, Dasgupta [1993] showed that per capita income is correlated even more highly with other indicators of development if weconsider ranks rather than cardinal measures. In other words, if we rank countries according to their per capita GDP levels and then compute similar ranks based on some other index (such as adult literacy, childmortality, etc.), then we find a high degree of statistical correspondence between the two sets of ranks if the set of countries is sufficiently large and wide ranging. Because I have already carriedout cardinal comparisons, I will skip a detailed discussion of these matters and simply refer you to Dasgupta’s study for a more thorough reading.16
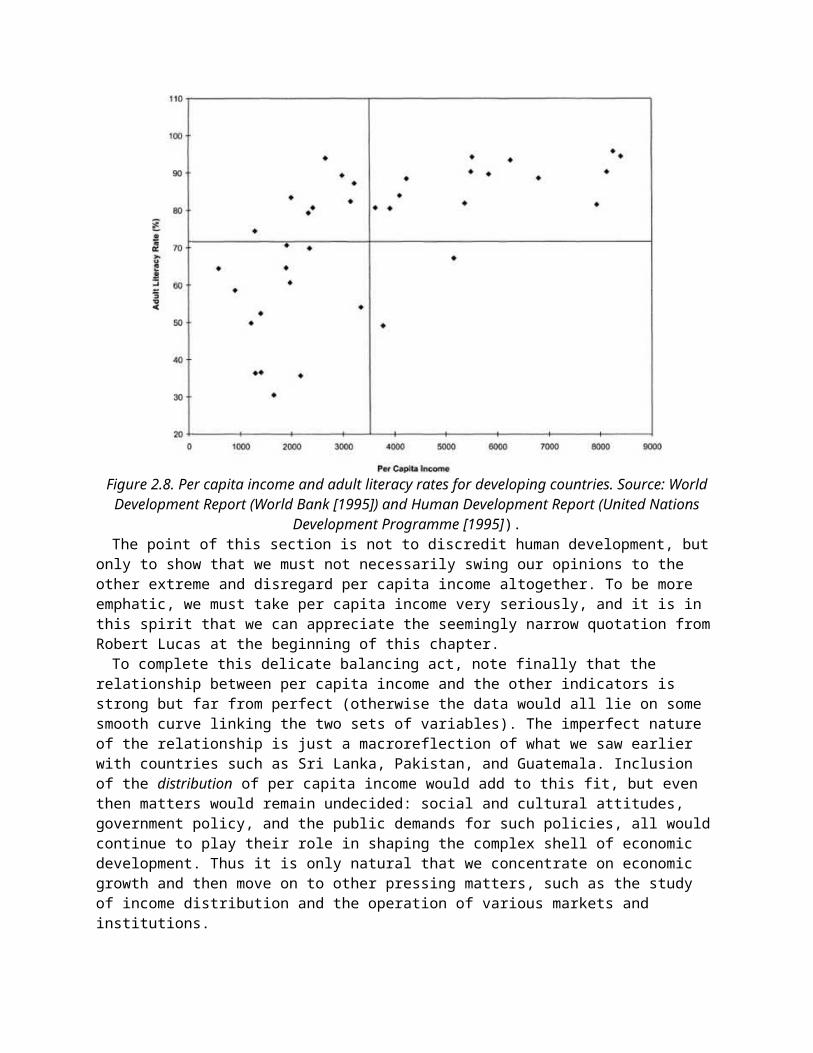
Figure 2.8. Per capita income and adult literacy rates for developing countries. Source: WorldDevelopment Report (World Bank [1995]) and Human Development Report (United Nations
Development Programme [1995]).The point of this section is not to discredit human development, but
only to show that we must not necessarily swing our opinions to the other extreme and disregard per capita income altogether. To be more emphatic, we must take per capita income very seriously, and it is in this spirit that we can appreciate the seemingly narrow quotation fromRobert Lucas at the beginning of this chapter.To complete this delicate balancing act, note finally that the
relationship between per capita income and the other indicators is strong but far from perfect (otherwise the data would all lie on some smooth curve linking the two sets of variables). The imperfect nature of the relationship is just a macroreflection of what we saw earlier with countries such as Sri Lanka, Pakistan, and Guatemala. Inclusion of the distribution of per capita income would add to this fit, but even then matters would remain undecided: social and cultural attitudes, government policy, and the public demands for such policies, all wouldcontinue to play their role in shaping the complex shell of economic development. Thus it is only natural that we concentrate on economic growth and then move on to other pressing matters, such as the study of income distribution and the operation of various markets and institutions.

Figure 2.9. Per capita income and infant mortality rates for developing countries. Source: WorldDevelopment Report (World Bank [1995]) and Human Development Report (United Nations
Development Programme [1995]).
2.5. Some structural features
Our final objective in this chapter is to provide a quick idea of the structural characteristics of developing countries. We will examine these characteristics in detail later in the book.
2.5.1. Demographic characteristics
Very poor countries are characterized by both high birth rates and high death rates. As development proceeds, death rates plummet downward. Often, birth rates remain high, before they finally follow the death rates on their downward course. In the process, a gap opens up (albeit temporarily) between the birth and death rates. This leads to high population growth in developing countries. Chapter 9 discussesthese issues in detail.High population growth has two effects. It means that overall income
must grow faster to keep per capita growth at reasonable levels. To besure, the fact that population is growing helps income to grow,
because there is a greater supply of productive labor. However, it is not clear who wins this seesaw contest: the larger amount of production or the larger population that makes it necessary to divide that production among more people. The negative population effect may well end up dominant, especially if the economy in question is not endowed with large quantities of capital (physical or human).A second effect of high population growth (or high birth rates, to be
precise) is that the overall population is quite young. It is easy to get an intuition for this: high birth rates mean that a proportionately larger number of children are always entering the population at any given point of time. This means that the population is heavily weighted in favor of children. This may be quite delightful, as any of us who has grown up with several brothers, sisters, and cousins knows, but it does not change the grim reality ofutter economic dependence, especially for those in poverty. There are many untoward consequences of an abnormally young population, and these include poverty, child labor, and low education.Figure 2.10 shows us how population growth rates vary with per capita
income. The thin line plots annual growth rates of population for 1970–80; the thick line does the same for 1980–93. In both cases the horizontal axis records 1993 percapita income (PPP). The variation is substantial (remember: per capita income isn’t everything!), but thereis a clear downward trend in the growth rate, both with per capita income and over time (for the same country).
2.5.2. Occupational and production structure
Agriculture accounts for a significant fraction of production in developing countries. Indeed, given that substantial agricultural output is produced for self-consumption and so may not be picked up inthe data, the proportion is probably higher than that revealed by the published numbers. For the poorest forty-five countries for which the World Bank publishes data, called the low-income countries, the average proportion of output from agriculture is close to 30%. Remember that the poorest forty-five countries include India and China and thereforea large fraction of the world’s population. Data for the so-called middle-income countries, which are the next poorest sixty-three countries and include most Latin American economies, is somewhat sketchier, but the percentage probably averages around 20%. This stands in sharp contrast to the corresponding income shares accruing to agriculture in the economically developed countries: around 1–7%.

Figure 2.10. Population growth rates and per capita income. Source: World Development Report(World Bank [1995, 1996]).
Even more striking are the shares of the labor force living in rural sectors. For the aforementioned low-income category, the share averaged 72% in 1993 and was as high as 60% for many middle-income countries. The contrast with developed countries is again apparent, where close to 80% of the labor force is urbanized. Even then, a largefraction of this nonurban population is so classified because of the “commuter effect”: they are really engaged in nonagricultural activityalthough they live in areas classified as rural. Although a similar effect is not absent for developing countries, the percentage is probably significantly lower.Figure 2.11 displays the share of the labor force in agriculture as
we move over different countries indexed by per capita income. The downward trend is unmistakable, but so are the huge shares in agriculture for both low- and middle-income countries.

Figure 2.11. Fractions of the labor force in agriculture. Source: World Development Report(World Bank [1996]).
Clearly, agricultural activity forms a significant part of the lives of people living in developing countries. We therefore devote a good part of this book to agricultural arrangements: the hiring of labor, the leasing of land, and the operation of credit markets. The overall numbers for production and occupational structure suggest that agriculture often has lower productivity than other economic activities. This is not surprising. In many developing countries, capital intensity in agriculture is at a bare minimum, and there is often intense pressure on the land. Add to this the fact that agriculture, especially when not protected by assured irrigation and ready availability of fertilizer and pesticides, can be a singularly risky venture. Many farmers bear enormous risks. These risks may not look very high if you count them in U.S. dollars, but they often make the difference between bare-bones subsistence (or worse) and some modicum of comfort.
2.5.3. Rapid rural–urban migration
With the above-mentioned features, it is hardly surprising that an enormous amount of labor moves from rural to urban areas. Such enormous migrations deserve careful study. They are an outcome of boththe “push” from agriculture, because of extreme poverty and growing landlessness, and the perceived “pull” of the urban sector. The pulls are reinforced by a variety of factors, ranging from the comparativelyhigh wages and worker protections offered in the organized urban

sectors to the effect of the media in promoting the urban lifestyle asa desirable end in itself. The media is often misleading and so are the benefits of the organized sector, which are often accessible only to a lucky minority of workers.Consider the rates of growth of the urban sector in developing
countries. For the forty-five low-income countries covered by the World Bank, the average rate of urban population growth over the period 1980–93 was 3.9% per year. Compare this with an average rate ofpopulation growth of 2% per year for the same countries over the same period of time. Urban growth was simply double that of overall population growth for these countries. Imagine, then, the pressure on the cities of these countries. For the sixty-three countries classified as middle-income by the Bank, the urban growth rate was 2.8% per annum over the period 1980–93, to be compared with a population growth rate of 1.7% per year. Once again, we see evidence of a pressure on the urban sector that is just not captured by the overall population growth figures. On the other hand, the high-income developed countries exhibit near balance: urban populations grew at 0.8% per year, while overall population grew at 0.6% per year.This is not to say that such migrations are somehow undesirable.
Indeed, how did developed countries get to the point that they are nowat? The fact of the matter, however, is that all these processes are accelerated in modern-day developing countries, and the speed-up imposes enormous strains.One piece of evidence that reveals these strains is the fact that an
unusually large fraction of the population in developing countries is classified as being in the tertiary or “services” sector. Before we take a look at the data, it is useful to conceptualize matters a bit. Think of what we consume as our income increases. Our first needs are for food and clothing. As we have more income to spare we switch to industrial products: radio, television, bicycles, automobiles, and thelike. At a still higher level of income we begin to register a high demand for services: banking, tourism, restaurants, and travel. It is not surprising, then, that the developed countries allocate a large fraction of their nonagricultural labor force to the services sector. Countries such as Australia, the United States, the United Kingdom, Norway, and Sweden have about 70% of the total labor force in the services sector; the corresponding figures for some other developed countries such as Japan are somewhat lower. That isn’t odd at all. What is odd is that many developing countries exhibit large fractions of the labor force in “services” as well!Figure 2.12 illustrates the general point and Table 2.4 provides data
for particular countries. Expressed as a fraction of the
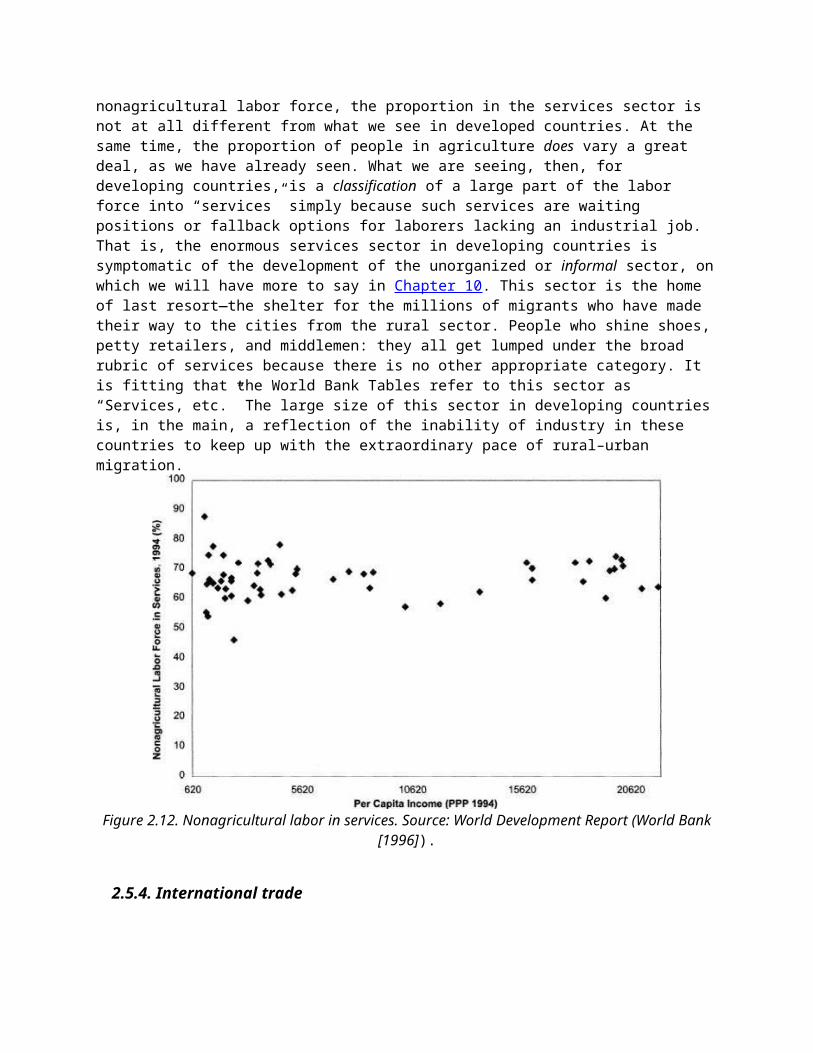
nonagricultural labor force, the proportion in the services sector is not at all different from what we see in developed countries. At the same time, the proportion of people in agriculture does vary a great deal, as we have already seen. What we are seeing, then, for developing countries, is a classification of a large part of the labor force into “services” simply because such services are waiting positions or fallback options for laborers lacking an industrial job. That is, the enormous services sector in developing countries is symptomatic of the development of the unorganized or informal sector, onwhich we will have more to say in Chapter 10. This sector is the home of last resort—the shelter for the millions of migrants who have made their way to the cities from the rural sector. People who shine shoes,petty retailers, and middlemen: they all get lumped under the broad rubric of services because there is no other appropriate category. It is fitting that the World Bank Tables refer to this sector as “Services, etc.” The large size of this sector in developing countriesis, in the main, a reflection of the inability of industry in these countries to keep up with the extraordinary pace of rural–urban migration.
Figure 2.12. Nonagricultural labor in services. Source: World Development Report (World Bank[1996]).
2.5.4. International trade

By and large, all countries, rich and poor, are significantly involved in international trade. A quick plot of the ratio of exports and imports to GNP against per capita income, does not reveal a significant trend. There are large countries, such as India, the United States, and Mexico for which these ratios are not very high—perhaps around 10% on average. Then again, there are countries such asSingapore and Hong Kong for which these ratios attain astronomical heights—well over 100%. The modal ratios of exports and imports to GNPare probably around 20%. Trade is an important component of the world economy.Table 2.4. Percentage of the non-agricultural labor force in services for selected countries.
Source: World Development Report (World Bank [1996]).The differences between developing and developed countries are more
pronounced when we look at the composition of trade. Developing countries are often exporters of primary products. Raw materials, cashcrops, and sometimes food are major export items. Textiles and light manufactured items also figure on the list. In contrast, the bulk of exports from developed countries is in the category of manufactured goods, ranging from capital goods to consumer durables. Of course, there are many exceptions to these broad generalizations, but the overall picture is broadly accurate, as Figure 2.13 shows. This figure

plots the share of exports that comprise primary products against per capita income. We have followed the now-familar method of using cross-bars at the mean levels of per capita income and primary share (unweighted by population) to eyeball the degree of correlation. It isclear that, on the whole, developing countries do rely on primary product exports, whereas the opposite is true for the developed countries.
Figure 2.13. Share of primary exports in total exports. Source: World Development Report(World Bank [1995]).
Notice that there are some developing countries that have a low ratioof primary exports. Countries such as China, India, the Philippines, and Sri Lanka are among them. These countries and many of their compatriots are attempting to diversify their exports away from primary products, for reasons that we indicate subsequently and discuss at greater length later in the book. At the same time, there are developed countries that export primaries to a great degree. Australia, New Zealand, and Norway are among them.The traditional explanation for the structure of international trade
comes from the theory of comparative advantage, which states that countries specialize in the export of commodities in which they have arelative cost advantage in production. These cost advantages might stem from differences in technology, domestic consumption profiles, orthe endowment of inputs that are particularly conducive to the production of certain commodities. We review this theory in Chapter 16. Because developing countries have a relative abundance of labor and a relative abundance of unskilled labor within the labor category,the theory indeed predicts that such countries will export commodities
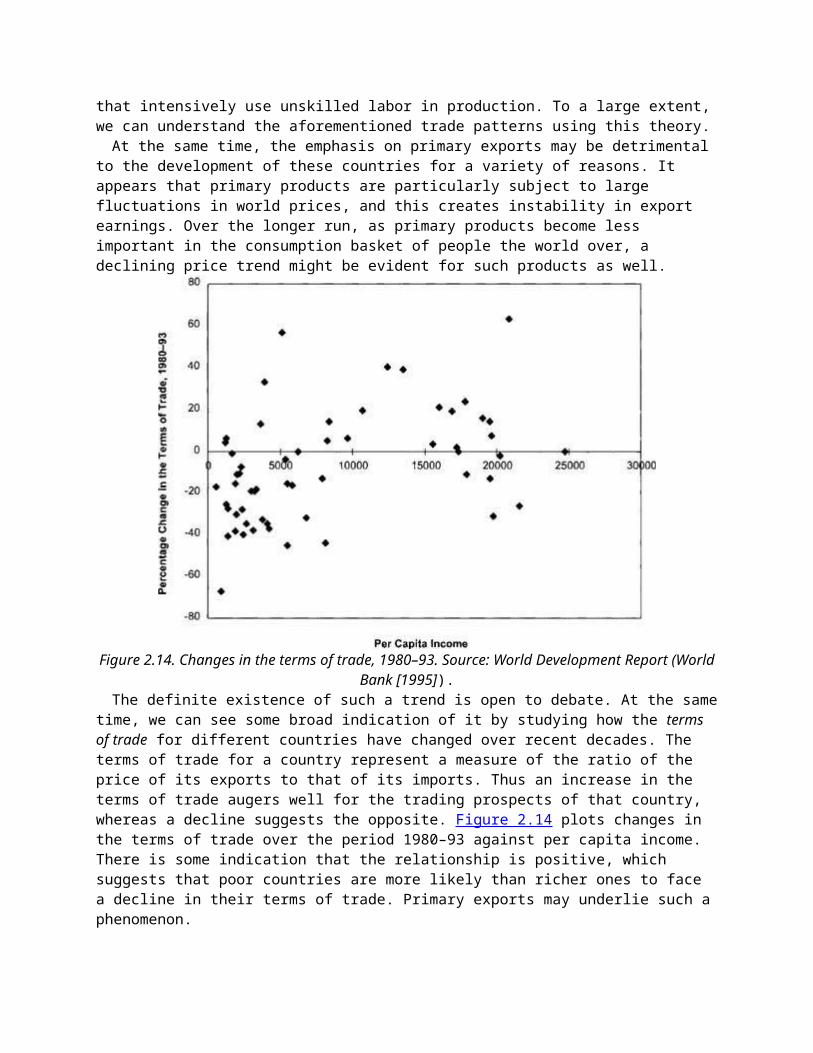
that intensively use unskilled labor in production. To a large extent,we can understand the aforementioned trade patterns using this theory.At the same time, the emphasis on primary exports may be detrimental
to the development of these countries for a variety of reasons. It appears that primary products are particularly subject to large fluctuations in world prices, and this creates instability in export earnings. Over the longer run, as primary products become less important in the consumption basket of people the world over, a declining price trend might be evident for such products as well.
Figure 2.14. Changes in the terms of trade, 1980–93. Source: World Development Report (WorldBank [1995]).
The definite existence of such a trend is open to debate. At the sametime, we can see some broad indication of it by studying how the terms of trade for different countries have changed over recent decades. The terms of trade for a country represent a measure of the ratio of the price of its exports to that of its imports. Thus an increase in the terms of trade augers well for the trading prospects of that country, whereas a decline suggests the opposite. Figure 2.14 plots changes in the terms of trade over the period 1980–93 against per capita income. There is some indication that the relationship is positive, which suggests that poor countries are more likely than richer ones to face a decline in their terms of trade. Primary exports may underlie such aphenomenon.
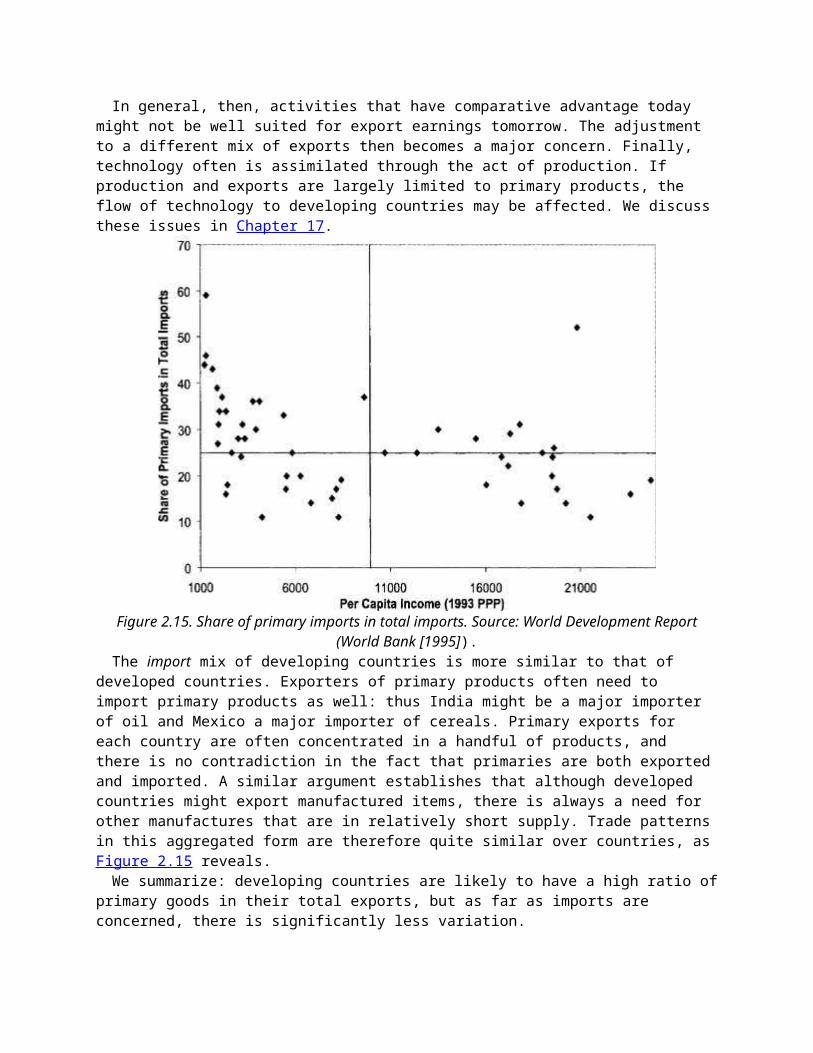
In general, then, activities that have comparative advantage today might not be well suited for export earnings tomorrow. The adjustment to a different mix of exports then becomes a major concern. Finally, technology often is assimilated through the act of production. If production and exports are largely limited to primary products, the flow of technology to developing countries may be affected. We discussthese issues in Chapter 17.
Figure 2.15. Share of primary imports in total imports. Source: World Development Report(World Bank [1995]).
The import mix of developing countries is more similar to that of developed countries. Exporters of primary products often need to import primary products as well: thus India might be a major importer of oil and Mexico a major importer of cereals. Primary exports for each country are often concentrated in a handful of products, and there is no contradiction in the fact that primaries are both exportedand imported. A similar argument establishes that although developed countries might export manufactured items, there is always a need for other manufactures that are in relatively short supply. Trade patternsin this aggregated form are therefore quite similar over countries, asFigure 2.15 reveals.We summarize: developing countries are likely to have a high ratio of
primary goods in their total exports, but as far as imports are concerned, there is significantly less variation.
2.6. Summary
We began with a discussion of what the term economic development might mean. It is a multifaceted concept, embodying not just income and its growth, but also achievements on other fronts: reductions in infant mortality, higher life expectancy, advances in literacy rates, widespread access to medical and health services, and so on. Per capita income is sometimes used as an (incomplete) indicator for overall economic development, but should not be identified conceptually with development in the broader sense.We turned next to per capita income data for countries. Using
exchange rates to convert local currencies into dollars, we obtained per capita income evaluated according to the exchange rate method. The disparities across countries is enormous. Some of this disparity is due to underreporting of income, but a far more serious problem arisesfrom the fact that price levels are systematically different across countries: dollar prices for nontraded goods and services tend to be lower in developing countries. The purchasing power parity method attempts to correct for this by constructing international prices that are usedto estimate national incomes. Cross-country disparities in per capita income are then smaller, but still large: the richest 5% of the world’s nations averaged a per capita income that was about twenty-nine times the corresponding figure for the poorest 5%, over the period 1960–85.There have been substantial changes in incomes for many countries.
The meteoric rise of East Asia is a case to be noted. This case is contrasted with the fact that much of Latin America and sub-Saharan Africa languished during the 1980s. Thus, although the world distribution of income remained fairly unchanged in relative terms, there was plenty of movement within that distribution. However, there is evidence that a history of underdevelopment or extreme poverty feeds on itself. Using mobility matrices, we noted that middle-income countries have significantly higher mobility than either the poorest or the richest countries.Next, we studied income distribution within countries. By and large,
income is more unequally distributed in developing countries than in their developed counterparts, which suggests that the poor in developing countries are twice hit: once at the level of distribution across countries and then at the level of distribution within countries. Income distribution is particularly bad for middle-income countries, and most of this extreme inequality appears to be located in Latin America.

With income and income distribution out of the way, we then returned to the broader notion of development. The Human Development Index is the name given to a set of indicators developed by the United Nations Development Programme. It combines three indicators—life expectancy atbirth, educational attainment, and per capita income—with weights to arrive at a combined index. We noted that just because an overall index is provided does not mean it should be necessarily taken seriously: the weights are, of course, quite arbitrary. Nevertheless, the overall idea of human development is a laudable attempt to conceptually go beyond per capita income as an operational measure of development.Nevertheless, per capita income isn’t a bad predictor of human
development. We showed that the correlations between per capita incomeand other variables that describe “human development” are high, even if attention is restricted only to the subsample of developing countries.Finally, we described some structural characteristics of developing
countries. We looked at demographic characteristics and showed that there isa general tendency for population growth rates to decline with increased per capita income. We discussed very briefly some of the effects of population growth on per capita income. We then studied occupational and production structure: agricultural activity accounts for a significant fraction of occupations in developing countries. At the same time, the rates of rural–urban migration are very high indeed. In part, this is reflected in the observation that a large fraction of the nonrural labor force is engaged in a nebulous activity called “services.” This category includes all sorts of informal activities with low setup costs, and in developing countries is a good indicator of urban overcrowding. At the end, we discussed patterns of international trade. Developing countries are largely exporters of primary products, although this pattern shows change for middle-income countries. Primary product exports can be explained using the theory of comparative advantage, although we note that primary product exports have intrinsic problems, such as a strong tendency for their international prices to fluctuate, which creates instability in export revenues. The import mix of developing countries is, however, more similar to that of developed countries.
Exercises
(1) Per capita income is a measure of purchasing power. People who live and work in developing countries often find that their incomes

are meager when buying an international airline ticket, making an international phone call, sending an airmail letter to a friend who lives abroad, buying a book published by an international publisher, or importing consumer goods. They don’t feel that poor when they buy vegetables at the local store, get a haircut, travel domestically by train, bus, or even by taxi, or buy a local textbook. Use these intuitive comments to understand what a traded good is and what a nontraded good is. Note that a potentially tradable good may become effectively nontraded because of import or export restrictions. Why are nontraded goods generally cheaper in poor countries? In addition, if they are cheaper, would their incomes look better (relative to the United States, say) when measured by the exchange-rate method or by the PPP method?(2) McDonald’s operates in various countries. It has been found that the relative price of a Big Mac is a better guide to the overall cost of living than estimates using the exchange rate. Why do you think this might be the case?(3) Why do you think that European or Japanese television transmits atresolutions that are superior to those in the United States? After looking into this question, formulate a hypothesis that suggests why countries that have poor infrastructure might be more likely to leapfrog over countries with better infrastructure insofar as the installation of new infrastructure is concerned. Use telephone networks as an example.(4) Make sure you understand the power of exponential growth (and of rapid exponential inflation) by doing the following exercises:(a) How quickly will a country growing at 10% a year double its income? Quadruple its income? What about a country growing at 5% per year?(b) Suppose a country’s per capita income is currently growing at 5% per year. Then it shaves an additional percentage point off its population growth rate for the next twenty years, but overall income continues to grow at the same rate. How much richer would the country be at the end of twenty years (per capita)?(c) Suppose that Brazil experiences inflation at 30% per month. How much is this per year? Do your calculations first without compounding (the answer then is obviously 360%). Now do it properly by compoundingthe inflation rate.(5) Construct an imaginary mobility matrix from a sample of countries that shows no mobility at all. What would it look like? What would a mobility matrix with “perfect mobility” look like? What would a mobility matrix look like if poor countries grow, on average, faster than rich countries?
(6) Use Table 2.1 to construct what is known as a Kuznets ratio (named after the economist and historian Simon Kuznets): the ratio of incomesearned by the richest 20% of the population to the those earned by thepoorest 40% of the population. If incomes were distributed almost equally, what value would you expect this ratio to assume? What valuesdo you see? In the sample represented by Table 2.1, do you see a trendas we move from poor to rich countries?(7) Think of various indicators of development that you would like to see in your concept of “economic development.” Think about why per capita income, as measured, may or may not be a good proxy for these indicators. Find a copy of the Human Development Report and look at it tosee how different indicators are combined to get the HDI. Do you thinkthat the method of combination is reasonable? Can you suggest a bettercombination? What do you think of the idea of presenting data on each of the indicators separately, instead of combining them? Think of the advantages and disadvantages of such an approach.(8) A cogent example in which per capita magnitudes may be misleading if we do not have a good idea of distribution comes from the study of modern famine. Why do famines simply not make sense if we look at themfrom the viewpoint of worldwide per capita availability of food grain?Do they make better sense if we look at just food-grain availability per capita in that country? After mulling this over for a while, read the insightful book by Sen [1981].(9) (a) Why do you think population growth rates fall with development? If people consume more goods, in general, as they get richer and children are just another consumption good (a source of pleasure to their parents), then why don’t people in richer countries “consume” more children?(b) Why are countries with higher population growth rates likely to have a greater proportion of individuals below the age of 15?(c) Are poorer countries more likely to be rural or is it that rural countries are more likely to be poor? Which way does the causality run, or does it run both ways?(d) Why do you think the international price of sugar might fluctuate more than, say, that of automobiles?
1 This is not to suggest at all that it is sufficient for every kind of social advancement.
2 For most poor countries, this starting point was the period immediately following World War II, when many such countries, previously under colonial rule, gained independence and formed national governments.
3 Even the double emphasis on levels and distribution might not be enough. For instance, the Human Development Report (United Nations

Development Programme [1995]) informs us that “the purpose of development is to enlarge all human choices, not just income. The concept of human development is much broader than the conventional theories of economic development.” More specifically, Sen [1983] writes: “Supplementing data on GNP per capita by income distributionalinformation is quite inadequate to meet the challenge of development analysis.” There is much truth in these warnings, which are to be put side by side with Streeten and certainly contrasted with Lucas, but I hope to convince you that an understanding of our “narrower” issues will take us quite far.
4 For instance, in the case of India, Acharya et al. [1985] estimatedthat 18–21% of total income in 1980–81 went unrecorded in the nationalaccounts (see also Gupta and Mehta [1981]). For related work on the “black” or “parallel” economy, see Chopra [1982] and Gupta and Gupta [1982].
5 See The Economist, May 15, 1993.6 In many countries all over the Third World, sectors that are
important or require bulk investment, such as iron and steel, cement, railways, and petroleum, are often in the hands of public sector enterprises.
7 A dollar invested at r% per year will grow to two dollars in T years, where T solves the equation [l + (r/100)]T = 2. This means that Tlne[l + (r/100)] = Ine 2. However, Ine 2 is approximately 0.7, whereas for small values of x, lne(l + x) is approximately x. Using this in the equation gets you the result.
8 Of course, our categories are quite coarse and this is not meant tosuggest that there were no relative changes at all among these countries. The immobility being described is of a very broad kind, to be sure.
9 One can imagine that the statistical problems here are even more severe than those involved in measuring per capita income. The goal isto measure the incomes earned by different groups in the same country and compare them, so all the measurement difficulties are compounded (except for the problem of international price comparability), becauseno system of overall, national accounts can be used to estimate the incomes of any one subgroup of the population.
10 In particular, we omit data on Eastern Europe and the former Soviet Union, where levels of economic inequality are traditionally lower, which complicates the overall pattern.
11 The goal for life expectancy is taken to be 85 years, and achievement with respect to this component is measured by the narrowing of the discrepancy from this goal.

12 Note that the use of per capita income is not immune from this criticism. After all, per capita income is also a composite index of human “welfare” and is not to be equated with it.
13 The goal for life expectancy is taken to be 85 years, and achievement with respect to this component is measured by the narrowing of the discrepancy from this goal. Thus the life expectancy index is given by L ≡ (l − 25)/(85 − 25), where l is the life expectancyin years of the country in question. The educational attainment index is E ≡ e/100, where e is the combined educational enrollment rate, expressed as a percentage. The adult literacy index is A ≡ a/100, wherea is the adult literacy rate, expressed as a percentage. Finally, the income index is Y ≡ (y − 100)/(5,448 − 100), where y is “adjusted income” and 5,448 is the maximum level to which adjusted income is permitted to climb [see the Human Development Report (United Nations Development Programme [1995, p. 134])]. Countries with per capita incomes of $40,000 (1992 PPP) would be given an adjusted income of this maximum.
14 The emphasis in the quoted sentence (from p. 19 of the Report) is mine. An earthquake of 8 on the Richter scale is not “only” 14% more powerful than one that measures 7 on the Richter scale.
15 For additional information on this debate and related matters, seethe contributions of Anand and Harris [1994], Aturupane, Glewwe and Isenman [1994], Desai [1991], Naqvi [1995], Srinivasan [1994], and Streeten [1994].
16 There are several authors who have argued that higher per-capita income is correlated with indicators of the quality of life; see, for example, Mauro [1993], Pritchett and Summers [1995], Boone [1996] and Barro [1996]. However, with country fixed effects properly accounted for in panel data, the evidence is somewhat mixed: see Easterly [1997]. Indeed, we do not claim that simple cross-country studies can settle the issue conclusively, and we certainly do not propose that income is a complete determinant for all other facets of development.
Chapter 3
Economic Growth
3.1. Introduction
Of all the issues facing development economists, none is quite so compelling as the question of economic growth. In Chapter 2, we

examined the historical growth of nations and found a variety of annual growth rates. It is true that all of these numbers, with very few exceptions, were in the single digits, but we also took pains to appreciate the power of exponential growth. A percentage point added to the growth rate can make the difference between stagnation and prosperity over the period of a generation. Small wonder, then, that the search for key variables in the growth process can be tempting. Indeed, until recently, and for precisely this reason, no economic analysis has fired the ambitions and hopes of more policy makers in developing countries than the theory and empirics of economic growth.Robert Lucas, in his Marshall Lectures at the University of
Cambridge, stated:Rates of growth of real per-capita income are . . . diverse, even oversustained periods . . . . Indian incomes will double every 50 years; Korean every 10. An Indian will, on average, be twice as well off as his grandfather; a Korean 32 times. . . .I do not see how one can look at figures like these without seeing them as representing possibilities. Is there some action a government of India could take that would lead the Indian economy to grow like Indonesia’s or Egypt’s? If so, what, exactly? If not, what is it about the “nature of India” that makes it so? The consequences for human welfare involved in questions like these are simply staggering: Once one starts to think about them, it is hard to think about anything else.I quote Lucas at length, because he captures, more keenly than any
other writer, the passion that drives the study of economic growth. Wesense here the big payoff, the possibility of change with extraordinarily beneficial consequences, if one only knew the exact combination of circumstances that drives economic growth.If only one knew . . . , but to expect that from a single theory (or
even a set of theories) about an incredibly complicated economic universe would be unwise. As it turns out, though, theories of economic growth take us quite far in understanding the development process, at least at some aggregate level. This is especially so if wesupplement the theories with what we know empirically. At the very least, it teaches us to ask the right questions in the more detailed investigations later in this book.
3.2. Modern economic growth: Basic features

Economic growth, as the title of Kuznets’ [1966] pioneering book on the subject suggests, is a relatively “modern” phenomenon. Today, we greet 2% annual rates of per capita growth with approval but no great surprise. Remember, however, that throughout most of human history, appreciable growth in per capita gross domestic product (GDP) was the exception rather than the rule. In fact it is not far from the truth to say that modern economic growth was born after the Industrial Revolution in Britain.Consider the growth rates of the world’s leaders over the past four
centuries. During the period 1580–1820 the Netherlands was the leadingindustrial nation; it experienced an average annual growth in real GDPper worker hour1 of roughly 0.2%. The United Kingdom, leader during theapproximate period 1820–90, experienced an annual growth of 1.2%. Since 1890, the United States is considered to have usurped the leader’s seat, and its average growth rate during the period 1890–1989was a (relatively) dramatic 2.2% a year. Thus GDP per worker has grownat an accelerated pace, especially since 1820. Clearly, by today’s standards, even the fastest growing economy two centuries ago would beconsidered practically stagnant.Note once again that although an annual growth rate of 2% in per
capita GDP does not appear very impressive, a moment’s reflection (andcalculation) reveals the enormous potential that such growth carries if it is sustained. Simple calculation shows that at the 2% rate, a nation’s per capita GDP doubles in 35 years—a length of time comfortably shorter than the lifespan of an individual. This means that modern economic growth enables people to enjoy vastly improved living standards compared to not only their fathers but also perhaps their older cousins!A glance at Table 3.1 shows how economic growth has transformed the
now-developed world within the space of a century. This table displaysper capita real GDP (valued in 1970 U.S. dollars) for selected OECD2 countries in the years 1870, 1913, and 1978. The 1913 and 1978 columnsinclude, in parentheses, the ratio of per capita GDP in those years tothe corresponding baseline (1870) figure. The numbers are stunning. Onaverage (see the last row of the table), GDP per capita in 1913 was 1.8 times the figure for 1870; by 1978, this ratio climbed to 6.7! A nearly sevenfold increase in real per capita GDP in the space of a century cannot but transform societies completely. The developing world, which is currently going through its own transformation, will be no exception.Table 3.1. Per capita GDP in selected OECD countries, 1870–1978.
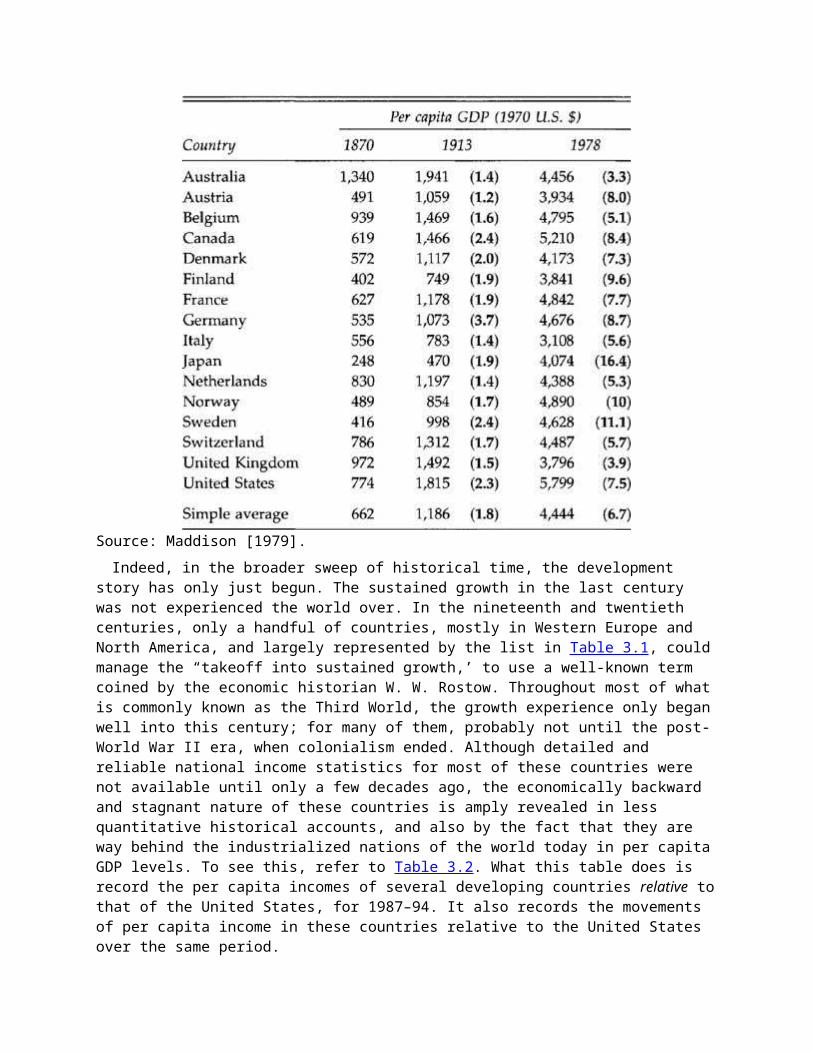
Source: Maddison [1979].Indeed, in the broader sweep of historical time, the development
story has only just begun. The sustained growth in the last century was not experienced the world over. In the nineteenth and twentieth centuries, only a handful of countries, mostly in Western Europe and North America, and largely represented by the list in Table 3.1, couldmanage the “takeoff into sustained growth,’ to use a well-known term coined by the economic historian W. W. Rostow. Throughout most of whatis commonly known as the Third World, the growth experience only beganwell into this century; for many of them, probably not until the post-World War II era, when colonialism ended. Although detailed and reliable national income statistics for most of these countries were not available until only a few decades ago, the economically backward and stagnant nature of these countries is amply revealed in less quantitative historical accounts, and also by the fact that they are way behind the industrialized nations of the world today in per capitaGDP levels. To see this, refer to Table 3.2. What this table does is record the per capita incomes of several developing countries relative tothat of the United States, for 1987–94. It also records the movements of per capita income in these countries relative to the United States over the same period.
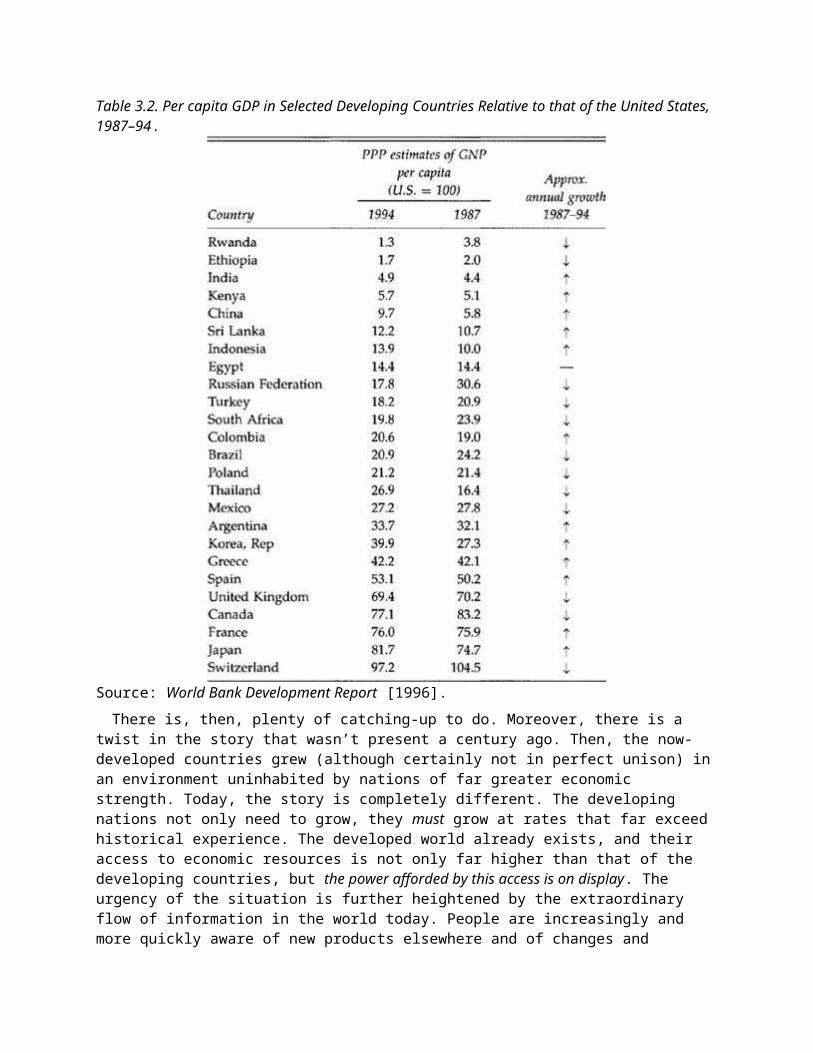
Table 3.2. Per capita GDP in Selected Developing Countries Relative to that of the United States, 1987–94.
Source: World Bank Development Report [1996].There is, then, plenty of catching-up to do. Moreover, there is a
twist in the story that wasn’t present a century ago. Then, the now-developed countries grew (although certainly not in perfect unison) inan environment uninhabited by nations of far greater economic strength. Today, the story is completely different. The developing nations not only need to grow, they must grow at rates that far exceed historical experience. The developed world already exists, and their access to economic resources is not only far higher than that of the developing countries, but the power afforded by this access is on display. The urgency of the situation is further heightened by the extraordinary flow of information in the world today. People are increasingly and more quickly aware of new products elsewhere and of changes and
disparities in standards of living the world over. Exponential growth at rates of 2% may well have significant long-run effects, but they cannot match the parallel growth of human aspirations, and the increased perception of global inequalities. Perhaps no one country, or group of countries, can be blamed for the emergence of these inequalities, but they do exist, and the need for sustained growth is all the more urgent as a result.
3.3. Theories of economic growth
3.3.1. The Harrod–Domar model
In its simplest terms, economic growth is the result of abstention from current consumption. An economy produces a variety of commodities. The act of production generates income. The very same income is used to buy these commodities. Exactly which commodities are produced depends on individual preferences and the distribution of income, but as a broad first pass, the following statement is true: commodity production creates income, which creates the demand for those very same commodities.Let’s go a step further and broadly classify commodities into two
groups. We may think of the first group as consumption goods, which are produced for the express purpose of satisfying human wants and preferences. The mangos you buy at the market, or a fountain pen, or apair of trousers all come under this category. The second group of commodities consists of what we might call capital goods, which we may think of as commodities that are produced for the purpose of producingother commodities. A blast furnace, a conveyor belt, or a screwdriver might come under the second category.3
Looking around us, it is obvious that the income generated from the production of all goods is spent on both consumer goods and capital goods. Typically, households buy consumer goods, whereas firms buy capital goods to expand their production or to replace worn-out machinery. This generalization immediately raises a question: if all income is paid out to households, and if households spend their incomeon consumption goods, where does the market for capital goods come from? How does it all add up?The answer to this question is simple, although in many senses that
we ignore for now, deceptively so: households save. No doubt some borrow too, to finance current consumption, but on the whole, nationalsavings is generally positive. All income is not spent on current consumption. By abstaining from consumption, households make available
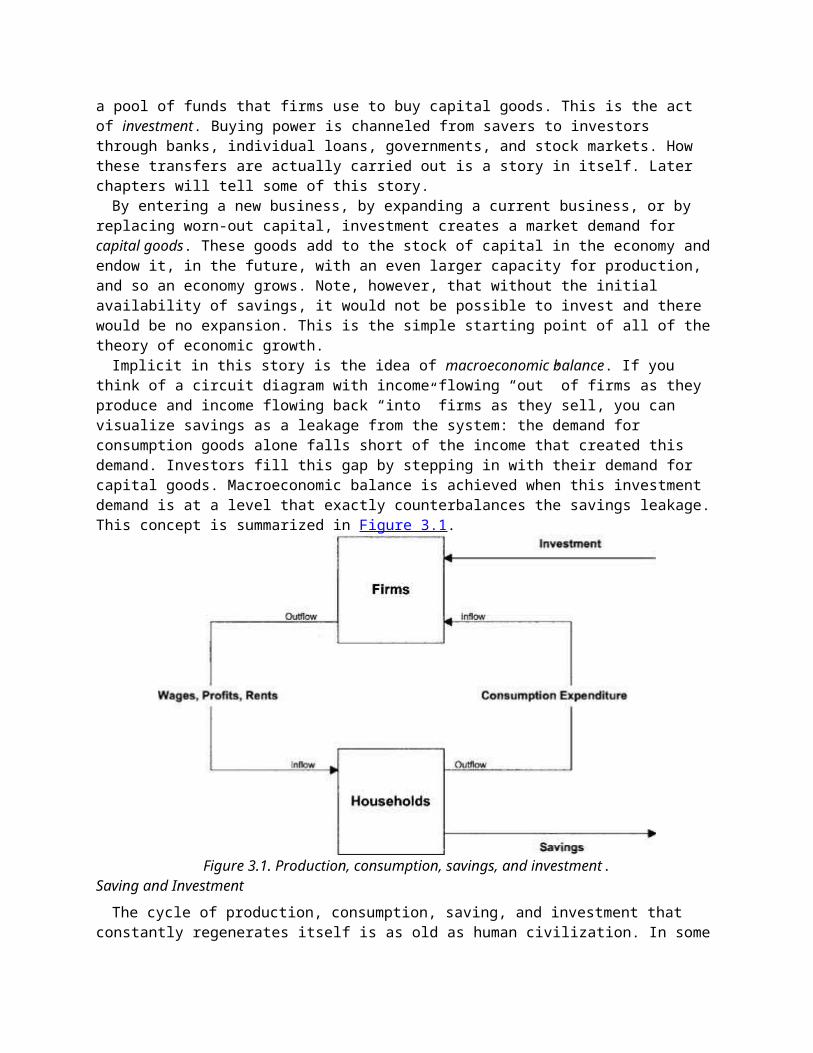
a pool of funds that firms use to buy capital goods. This is the act of investment. Buying power is channeled from savers to investors through banks, individual loans, governments, and stock markets. How these transfers are actually carried out is a story in itself. Later chapters will tell some of this story.By entering a new business, by expanding a current business, or by
replacing worn-out capital, investment creates a market demand for capital goods. These goods add to the stock of capital in the economy andendow it, in the future, with an even larger capacity for production, and so an economy grows. Note, however, that without the initial availability of savings, it would not be possible to invest and there would be no expansion. This is the simple starting point of all of thetheory of economic growth.Implicit in this story is the idea of macroeconomic balance. If you
think of a circuit diagram with income flowing “out” of firms as they produce and income flowing back “into” firms as they sell, you can visualize savings as a leakage from the system: the demand for consumption goods alone falls short of the income that created this demand. Investors fill this gap by stepping in with their demand for capital goods. Macroeconomic balance is achieved when this investment demand is at a level that exactly counterbalances the savings leakage.This concept is summarized in Figure 3.1.
Figure 3.1. Production, consumption, savings, and investment.Saving and InvestmentThe cycle of production, consumption, saving, and investment that
constantly regenerates itself is as old as human civilization. In some
cases, savers and investors are exactly the same individuals, using their own funds; in other cases, they are not.Primitive man was both a saver and an investor. Time being his only
resource, he “saved” time from activities related to current consumption, such as hunting, and “invested” it in making stone implements. These tools served as capital that enhanced his future production potential in hunting.In traditional agricultural economies, the farmer is, to some extent,
both a saver and an investor. For instance, she might save some grain from current output and invest it as seed for the future grain production. Alternatively, she might channel part of the proceeds fromthe sale of a crop into the purchase of a tractor or a pair of bullocks. In these cases, the act of saving and the act of investment are intimately connected.In centrally planned economies, such as the former Soviet Union, and
in mixed economies as well (which includes countries such as the United States, Japan, India, and South Korea), a significant part of investment is carried out by the government. Typically, the governmentearns revenue through taxation. Taxes are then spent by the governmenton various activities, which include both current consumption (such asmaintaining a bureaucracy) and investment (such as building new highways).However, in modern capitalist societies, the bulk of saving and
investment generally is carried out by two distinct groups—households save and firms invest. Households save by spending less on current consumption than their current income permits. Firms invest by acquiring new technology, plants, and equipment that increase their future production capacity. Observe that the fact that households holdtheir savings in the form of a bank balance, shares, or bonds does notautomatically increase the level of investment in the economy. By curtailing current consumption (i.e., saving) in this manner, they only make resources available for investment, which is the act of actually applying these current resources to the purchase of fresh capital.Recent literature in economics has emphasized the fact that
investment in education and training that raises the skills embodied in labor is no less an investment. Skills may not be tangible objects like machinery, but they contribute to increased production just as any piece of machinery does. The act of training and education may be aptly termed investment in human capital. It is important to note, however, that despite its enormous significance as a factor in

production, investment in human capital is not normally included in the data for savings and investment. Separate estimates of such investments must be made, and in this chapter and elsewhere we will see why this is necessary.If you understand the basic concept of macroeconomic balance, you
understand the foundations of all models of economic growth. Economic growth is positive when investment exceeds the amount necessary to replace depreciated capital, thereby allowing the next period’s cycle to recur on a larger scale. The economy expands in this case; otherwise it is stagnant or even shrinks. This is why the volume of savings and investment is an important determinant of the growth rate of an economy.It is easy to see that our simplified concepts hide important
elements of reality. For instance, we have neglected, for now, the deeper question of which factors govern the amount of savings and investment. Nevertheless, the story so far does illuminate some aspects of reality in a stark way, and therein lies its value. For now, let us see where it takes us, and then we will expand the analysis once we feel comfortable with the basics.A little algebra at this stage will make our lives simpler. It will
also enable us to include some more features with a minimum of fuss. Divide time into periods t = 0, 1, 2, 3, . . . . We will keep track of dates by tagging the appropriate variable with the date. Here is standard economic notation: Y denotes total output, C denotes total consumption, and S denotes total savings. Remember that these variablesare aggregates over the population. In particular, S nets out those who are borrowing for current consumption. Then the following equation mustbe true as a matter of accounting4:
for all dates t. In words, national income is divided between consumption and savings. The other side of the coin is that the value of produced output (also equal to Y, please note) must be matched to goods produced for consumption plus those needed by investors; that is,
where I denotes investment. Equations (3.1) and (3.2) are one step awayfrom the famous macroeconomic balance equation
or “savings equals investment,” which you must have seen in an introductory macroeconomics course. We can use this equation to complete our basic argument. Investment augments the national capital

stock K and replaces that part of it which is wearing out. Suppose that a fraction δ of the capital stock depreciates. Then, of course,
End of this sample Kindle book.Enjoyed the preview?Buy with 1-ClickorSee details for this book in the Kindle Store
Your Browsing HistoryCustomers Also Bought
Frequently Bought Together
+ +
Price for all three: $140.43 Add all three to Cart Add all three to Wish List
Show availability and shipping details
Buy the selected items together
This item: Development Economics by Debraj Ray Hardcover $92.80
Understanding Poverty by Abhijit Vinayak Banerjee Paperback $37.49

Poor Economics: A Radical Rethinking of the Way to Fight Global Poverty by Abhijit Banerjee Paperback $10.14
Customers Who Bought This Item Also Bought1.
Understanding Poverty
Abhijit Vinayak…
7
Paperback
$37.49 Prime
2.
Poor Economics: A Radical Rethinking of…
Abhijit Banerjee
164
Paperback
$10.14 Prime

3.
Why Nations Fail: The Origins of Power,…
Daron Acemoglu
540
Paperback
$10.91 Prime
4.
Global Economic History: A Very Short…
Robert C. Allen
20
Paperback
$10.42 Prime
5.

Portfolios of the Poor: How the World's Poor…
Daryl Collins
19
Paperback
$19.42 Prime
6.
Development as Freedom
Amartya Sen
79
Paperback
$13.69 Prime
Customers viewing this page may be interested in these sponsored links (What's this?)
MSc Development Economics
-
MSc in Development Economics at the University of Birmingham
www.birmingham.ac.uk/schools/business

Development & Poverty
-
Respected Peer Reviewed Journal:Research ArticlesFree Online
jpaid.yonsei.ac.kr/
Techmotion MX -
Diseño, Desarrollo, Automatización Herramentales, Maquinados CNC
www.techmotionmx.com/
See a problem with these advertisements? Let us know
Best Books of the MonthWant to know our Editors' picks for the best books of themonth? Browse Best Books of the Month, featuring our
favorite new books in more than a dozen categories.
Product Details Hardcover: 872 pages Publisher: Princeton University Press (January 12, 1998) Language: English ISBN-10: 0691017069 ISBN-13: 978-0691017068 Product Dimensions: 1.5 x 7.5 x 10.2 inches Shipping Weight: 3.8 pounds (View shipping rates and
policies) Average Customer Review: 4.6 out of 5 stars See all
reviews (15 customer reviews) Amazon Best Sellers Rank: #23,720 in Books (See Top 100 in
Books) o #6 in Books > Textbooks > Business & Finance > Business
Development o #16 in Books > Business & Money > Economics >
Development & Growth o #87 in Books > Textbooks > Business & Finance >
Economics
Would you like to update product info, give feedback on

images, or tell us about a lower price? FeedbackIf you have a question or problem, visit our Help pages. If you are a seller for this product and want to change product data, click here (you may have to sign in with your seller id).
Customer Reviews(15) 4.6 out of 5 stars 5 star 4 star 3 star 2 star 1 star See all 15 customer reviews Share your thoughts with other customers Write a customer review
Most Helpful Customer Reviews
22 of 23 people found the following review helpfulsolid textbook in scientific modeBy los desaparecidos on May 2, 2003Format: Hardcover
This textbook was written for senior undergraduates or master's students with a minimum introduction to economics, which assumes that the student has assimilated the general features of the approach defining economics as a social science. Consequently, any student or reader who is well grounded in the social science paradigm will readily assimilate this excellent introduction to development economics, which is distinguished by the solid, I would even say, jam-packed expertise of Debraj Ray.The author gives an excellent overview in the four-page preface, where he acknowledges the limitations of his work and prepares the reader well by conveying a transparent framework for absorbing the rather dense exposition that follows.There is in the second chapter a concise discussion of the meaning of economic development, which defines it as a multifaceted concept for which per capita income is a robust but significantly incomplete operational measure.Throughout the book, the basic pattern of discussion is consistent. The author discusses theory and data in dynamic--the order of the two is interchangeable--identifying and discriminating what is substantiated, imperfect, or defective in theory, as well as what is informative, unexplained, or wanting in data, and then whenever possible drawing implications or conclusions for economic policy. The ultimate goal of author's analysis is to limn the "structural characteristics" of economic development, building upon the fundamental assumption that the key determinants of economic performance are a cohort of salient variables that affect the efficient functioning of markets.Read more › Comment Was this review helpful to you? Yes No 15 of 15 people found the following review helpfulBest of the best.By Gerardo Villoslado on January 13, 2001Format: Hardcover Ray wrote this book with the objective of being one of the classical text books for Development Economics. And he did it. This book is used in LSE, Ivy League, and Oxford. It requires a strong microeconomic background, as well as econometric skills. There aren't a lot of formulas but theory. Easy reading and broadcontents.

Comment Was this review helpful to you? Yes No 13 of 13 people found the following review helpfulThe best UNDERGRADUATE textbook on Development EconomicsBy K. O. Rahman on January 10, 2005Format: Hardcover This is what I had to wait a long time for back in my days as an academic -- an UNDERGRADUATE textbook on Development Economics that is aimed squarely at economists. Most other textbooks on thesubject are aimed at students with a general interest in development. While this makes them more accessible, they suffer from not seeing how useful a tool mainstream economic theory is when it comes to examining development issues. Importantly, Ray uses the analytical tools of economics without being too mathematical. This is the textbook I had my undergraduate students buy.
For graduate students it's an excellent 'background' text, but not sufficiently advanced enough to serve as a core text to supplement journal articles. Comment Was this review helpful to you? Yes No 10 of 14 people found the following review helpfulAn excellent text bookBy [email protected] or SUNIL MANI on January 25, 1999Format: Hardcover For quite some time, I have been looking for a good text book in Development Economics. My serach more or less ends with Ray's excellently produced, "Development Economics". The best parts of the book are Chapters 2, 3, 4 and the two appendices. However there are some notable omissions in the book. It does not have chapters on "Industrialisation" and on "Financial Flows". But I am sure this can be "rectified" in the next edition. The book is eminently accessible to a graduate student in Economics in a typical developing country. Comment Was this review helpful to you? Yes No 3 of 4 people found the following review helpfulThe basics of Development economics.By Haggenmueller Oliver on September 18, 2006Format: Hardcover

With Debraj Ray's book, the study of Development Economics finally becomes more accessible to all those interested. It is written for the undergraduate level and is accessible to non-economists as well. The book is a formalisation of the theories on growth and development that have been published until now and gives a very good overview of the subject.
Two things, however are to criticise. First of all, it is a magnum opus that would be a lot more comfortable to read as a paperback. Second, the information presented in this book is huge, yet doesn't go into sufficient and into equal detail for all factors of growth that are presented in this book. In other words, the presentation of the different factors is at a rather general level, however some factors seem to stand out more than others, which is somewhat a little annoying, since growth dependson many factors, some of which are too narrowly described.
The style however is straight-forward and is not limited to economists alone. At the same time, a good understanding of both macro- and microeconomics (in particular) will be useful. The book should also ideally be read together with some further readings so that the reader fully understands the contents and the points that the author is stressing. Yet, it is a fabulous book that can serve as an ideal starting-step for further study in the area. Four points are therefore awarded for this book. Comment Was this review helpful to you? Yes No Good comprehensive textBy Run Run Run on January 8, 2015Format: Paperback Verified Purchase This was the text for my graduate-level development economics course. It's very thorough. It presents technical concepts and equations with good clarity. The only major shortcomings are thatit lacks diversity in its examples, which are mostly from India; and seems lacking in its coverage of agricultural smallholders. Comment Was this review helpful to you? Yes No See all 15 customer reviews (newest first) Write a customer review Ad feedback

Customer Images
See all customer images
Most Recent Customer Reviews
Five Stars
Great textbook!
Published 10 days ago by Pedro Silverio Alvarez Four Stars
It was a good copy thanks
Published 20 days ago by Christina Jean-Louis Five Stars
Great!
Published 2 months ago by Gezime Ismaili classical textbook on development economics.
a professor's suggestion, it is great.
It is a little expensive for a Chinese student. Nevertheless, it is much cheaper comprised to Amazon.cn : )
Published 6 months ago by Amazon Customer International Econ
I needed this book for a senior level international economics class in college. It was very interesting, although I would like more realistic and current examples
Published 13 months ago by lmorgan satisfied

I received this book quickly. This book is clean. There are some highlights. So I like this more. I am satisfied.
Published on October 15, 2011 by HoCheol SHIN Interesting Reading
A well written book and offer great insight into the world of developmental economics. At times some concepts are difficult to understand, but ultimately, after review, the... Read more
Published on February 8, 2011 by Gaylord Mitchell Brown III Full five stars! This is what I call "A BOOK"!
In view that there are extended critics that already say what I feel about this book, I just qualify it: Outstanding, superb! I strongly recommend it!
Published on April 3, 2006 by Ricardo A. Hellmers Good deal for books
The book is in excillent condition as it was described and the price is good. However it's better to go directly with their website.
Published on October 1, 2005 by D. Thai Search Customer Reviews Search
Search these reviews only
Set up an Amazon GiveawayAmazon Giveaway allows you to run promotional giveaways in order to create buzz, reward your audience, and attract new followers and customers. Learn more

This item: Development EconomicsPrice: $115.00 $92.80Ships from and sold by Amazon.comSet up a giveaway
What Other Items Do Customers Buy After Viewing This Item?
Poor Economics: A Radical Rethinking of the Way to Fight Global Poverty by Abhijit Banerjee Paperback 4.4 out of 5 stars (164)
$10.14
Understanding Poverty by Abhijit Vinayak Banerjee Paperback 4.3 out of 5 stars (7)
$37.49
Why Nations Fail: The Origins of Power, Prosperity, and Poverty by Daron Acemoglu Paperback 4.1 out of 5 stars (540)
$10.91

Development Economics (The Pearson Series in Economics) by Gérard Roland Hardcover 4.2 out of 5 stars (4)
$214.32
› Explore similar items
Your Recently Viewed Items and Featured Recommendations
Get to Know Us
Careers Investor
Relations Press
Releases Amazon
and Our Planet
Amazon in the Community
Amazon Devices
Make Money withUs
Sell on Amazon
Sell Your Services on Amazon
Sell Your Apps on Amazon
Become an Affiliate
Advertise Your Products
Self- Publish with Us
›See all
Amazon Payment Products
Amazon.com Rewards Visa Card
Amazon.com Store Card
Amazon.com Corporate Credit Line
Shop with Points
Credit Card Marketplace
Amazon Currency Converter
Let Us Help You
Your Account
Shipping Rates & Policies
Amazon Prime
Returns & Replacements
Manage Your Content and Devices
Help

Australia Brazil Canada China France Germany India Italy Japan Mexico Netherlands Spain United Kingdom
6pmScore dealson fashion brands
AbeBooksRare Books& Textbooks
ACX Audiobook PublishingMade Easy
AfterSchool.comKids’ Sports, Outdoor& Dance Gear
AlexaActionable Analyticsfor the Web
AmazonFreshGroceries & MoreRight To Your Door
Amazon LocalGreat Local Dealsin Your City
AmazonSupplyBusiness,Industrial& Scientific Supplies
Amazon Web ServicesScalable CloudComputing Services
AudibleDownloadAudio Books
BeautyBar.comPrestige BeautyDelivered
Book DepositoryBooks With FreeDelivery Worldwide
Casa.comKitchen, Storage& EverythingHome
ComiXologyThousandsofDigital Comics
CreateSpaceIndie
Diapers.comEveryth
DPReviewDigital
East DaneDesigner Men's
FabricSewing,
GoodreadsBook reviews
IMDbMovies, TV

Print PublishingMade Easy
ingBut TheBaby
Photography Fashion
Quilting& Knitting
& recommendations
& Celebrities
Junglee.comShop Onlinein India
Kindle Direct PublishingIndie DigitalPublishingMade Easy
Look.comKids' Clothing& Shoes
MYHABITPrivate FashionDesigner Sales
ShopbopDesignerFashion Brands
Soap.comHealth, Beauty &Home Essentials
TenMarks.comMath Activitiesfor Kids & Schools
Vine.comEverythingto Live Life Green
Wag.comEverythingFor Your Pet
Warehouse DealsOpen-BoxDiscounts
Woot!Discounts and Shenanigans
Yoyo.comA Happy PlaceTo Shop For Toys
ZapposShoes &Clothing
Conditions of Use Privacy Notice Interest-Based Ads © 1996-2015, Amazon.com, Inc. or its affiliates