Rates, processes and morphology of freshwater calving at Miage Glacier (Italian Alps
12
HYDROLOGICAL PROCESSES Hydrol. Process. 20, 2233–2244 (2006) Published online in Wiley InterScience (www.interscience.wiley.com). DOI: 10.1002/hyp.6198 Rates, processes and morphology of freshwater calving at Miage Glacier (Italian Alps) G. Diolaiuti, 1 * M. Citterio, 1 T. Carnielli, 1 C. D’Agata, 1 M. Kirkbride 2 and C. Smiraglia 1 1 “Ardito Desio” Earth Department Sciences, University of Milan, via Mangiagalli 34, 20133, Milan, Italy 2 Department of Geography; University of Dundee, Dundee DD14HN, Scotland, UK Abstract: The rates and processes of freshwater calving at Miage Glacier (Mont Blanc Massif, Italy) are described. Calving at Miage Glacier has occurred for two centuries on its right-lateral side, into a small ice-marginal lake (Miage Lake). Field surveys identified the main processes leading to iceberg production and quantified the calving losses over a summer season. Calving losses were compared (1) with the surface ablation of the debris-covered tongue, evaluated through a simple model based on measured ablation rates at different altitudes and debris cover thicknesses, and (2) with other inputs to the lake (stream inflow discharge) and with the lake volume. Results show that thermal undercutting by warmer surface water plays an important role in driving ice-cliff evolution. Thermal notches grow at ¾30–35m year 1 and cause a similar amount of cliff retreat. Calving contributes ¾2% of the estimated summer runoff from the debris-covered part of the ablation zone, but this is equivalent to ¾38% of the lake volume, and is of the same magnitude as the mean discharge from the inflow streams. These data indicate that calving of the ice cliff is one of the main water sources for maintaining the lake at the maximum summer volume, with the surface at the level of the subaerial outlet stream. A survey of Italian calving glaciers shows that calving is becoming more widespread, and that debris covers are present at all calving ice margins. The lake–ice interactions described in this study can, therefore, be considered to have wider representativeness. Copyright 2006 John Wiley & Sons, Ltd. KEY WORDS Italian Alps; Miage Lake; freshwater calving; ice cliff; DEM; debris-covered glacier; ablation rate; runoff BACKGROUND AND AIMS Freshwater calving is becoming an increasingly widespread phenomenon in the European Alps during the current phase of glacier shrinkage. The retreat of glacier termini in recent decades (Haeberli et al., 1999; Hoelzle et al., 2003) has produced favourable settings for the ponding of small ice-contact lakes behind moraine ridges, particularly those formed by the most recent glacier advance of the late 20th century. According to the World Glacier Inventory database (compiled in the late 1980s by the World Glacier Monitoring Service), only four Italian glaciers showed evidence of calving; more recent sources and field surveys show an increase to at least 20, as the number of ice-contact lakes has grown. The lifespan of active calving at alpine glaciers is, however, generally limited. Either most of the newly formed lakes disappear after a few years, or the accelerating retreat of the glacier snouts implies a rapid evolution from ice-contact to distal proglacial lakes. The persistence in time and space of calving phenomena seems to be longer where the glacier surface in the ice-contact zone is covered by debris that reduces ablation (i.e. a debris thickness ½0Ð02 m, according to Østrem (1959), Fujii and Higuchi (1977), Mattson et al. (1993) and Rana et al. (1997)) because of the greater stability of the ice margin. These characteristics of calving in the Alps mean that the impact of calving on glacier mass balance and volume reduction is much less important than losses due to surface ablation. Nonetheless, in some cases the calving rate has increased to the * Correspondence to: G. Diolaiuti, “Ardito Desio” Earth Department Sciences, University of Milan, Milan, Italy. E-mail: [email protected] Received 12 May 2005 Copyright 2006 John Wiley & Sons, Ltd. Accepted 20 October 2005
Transcript of Rates, processes and morphology of freshwater calving at Miage Glacier (Italian Alps

HYDROLOGICAL PROCESSESHydrol. Process. 20, 2233–2244 (2006)Published online in Wiley InterScience (www.interscience.wiley.com). DOI: 10.1002/hyp.6198
Rates, processes and morphology of freshwater calving atMiage Glacier (Italian Alps)
G. Diolaiuti,1* M. Citterio,1 T. Carnielli,1 C. D’Agata,1 M. Kirkbride2 and C. Smiraglia1
1 “Ardito Desio” Earth Department Sciences, University of Milan, via Mangiagalli 34, 20133, Milan, Italy2 Department of Geography; University of Dundee, Dundee DD14HN, Scotland, UK
Abstract:
The rates and processes of freshwater calving at Miage Glacier (Mont Blanc Massif, Italy) are described. Calving atMiage Glacier has occurred for two centuries on its right-lateral side, into a small ice-marginal lake (Miage Lake).Field surveys identified the main processes leading to iceberg production and quantified the calving losses over asummer season. Calving losses were compared (1) with the surface ablation of the debris-covered tongue, evaluatedthrough a simple model based on measured ablation rates at different altitudes and debris cover thicknesses, and(2) with other inputs to the lake (stream inflow discharge) and with the lake volume. Results show that thermalundercutting by warmer surface water plays an important role in driving ice-cliff evolution. Thermal notches growat ¾30–35m year�1 and cause a similar amount of cliff retreat. Calving contributes ¾2% of the estimated summerrunoff from the debris-covered part of the ablation zone, but this is equivalent to ¾38% of the lake volume, and is ofthe same magnitude as the mean discharge from the inflow streams. These data indicate that calving of the ice cliff isone of the main water sources for maintaining the lake at the maximum summer volume, with the surface at the levelof the subaerial outlet stream. A survey of Italian calving glaciers shows that calving is becoming more widespread,and that debris covers are present at all calving ice margins. The lake–ice interactions described in this study can,therefore, be considered to have wider representativeness. Copyright 2006 John Wiley & Sons, Ltd.
KEY WORDS Italian Alps; Miage Lake; freshwater calving; ice cliff; DEM; debris-covered glacier; ablation rate; runoff
BACKGROUND AND AIMS
Freshwater calving is becoming an increasingly widespread phenomenon in the European Alps during thecurrent phase of glacier shrinkage. The retreat of glacier termini in recent decades (Haeberli et al., 1999;Hoelzle et al., 2003) has produced favourable settings for the ponding of small ice-contact lakes behindmoraine ridges, particularly those formed by the most recent glacier advance of the late 20th century.According to the World Glacier Inventory database (compiled in the late 1980s by the World GlacierMonitoring Service), only four Italian glaciers showed evidence of calving; more recent sources and fieldsurveys show an increase to at least 20, as the number of ice-contact lakes has grown.
The lifespan of active calving at alpine glaciers is, however, generally limited. Either most of the newlyformed lakes disappear after a few years, or the accelerating retreat of the glacier snouts implies a rapidevolution from ice-contact to distal proglacial lakes. The persistence in time and space of calving phenomenaseems to be longer where the glacier surface in the ice-contact zone is covered by debris that reduces ablation(i.e. a debris thickness ½0Ð02 m, according to Østrem (1959), Fujii and Higuchi (1977), Mattson et al. (1993)and Rana et al. (1997)) because of the greater stability of the ice margin. These characteristics of calvingin the Alps mean that the impact of calving on glacier mass balance and volume reduction is much lessimportant than losses due to surface ablation. Nonetheless, in some cases the calving rate has increased to the
* Correspondence to: G. Diolaiuti, “Ardito Desio” Earth Department Sciences, University of Milan, Milan, Italy.E-mail: [email protected]
Received 12 May 2005Copyright 2006 John Wiley & Sons, Ltd. Accepted 20 October 2005

2234 G. DIOLAIUTI ET AL.
extent that an accelerated deglaciation or even a catastrophic retreat has been triggered (e.g. the Trift Glacier,Switzerland; Funk et al., unpublished data).
The question arises as to the extent to which calving may contribute to, or influence, water availability inglacierized areas. Thus, we need to consider the role of calving in the changing quantities of water dischargedby alpine glaciers, and its effect on the temporal and spatial distribution of runoff. From a general point ofview, the quantity of water produced by iceberg melting in the Alps is negligible compared with that madeavailable by calving at higher latitudes; nevertheless, the main hydrological role of calving on small glaciers(such as alpine glaciers) is to increase their runoff. This is because it uncovers ice to high ablation rates onthe cliff, and it increases the surface area of ablating ice by creating icebergs. The data from Tasman Glacier,New Zealand (Kirkbride, 1993, 1995) showed that the ablation rate of the glacier surface decreased earlierin the autumn than the melting of thermal notches in the lake (presumably because lake water has a highspecific heat capacity and cools down more slowly than the air over the glacier, maintaining the back-wastingof the ice shores for longer). Moreover, the existence of ice contact lakes allows water to be stored at higherelevations, giving rise to local ecosystems where yeasts and bacteria adapted to extreme environments areable to survive (Buzzini et al., 2005).
A frequent feature of Italian calving lakes (e.g. Sforzellina and Forni, Ortles–Cevedale Group and Lys,Mount Rosa Group) is the lack of a surface outflow river controlling the lake level (Diolaiuti et al., unpublisheddata). In these cases the presence of an ice-contact lake and the calving activity influence the hydrologicalsystem through the varying infiltration rates linked to the varying lake surface elevation.
This paper aims to quantify the calving losses from the calving ice cliff at Miage Glacier (Mont BlancMassif, Italy) over a 1 year period in order to evaluate the relative importance of calving in comparison withother processes of glacier ablation.
STUDY SITE
Miage Lake (Figure 1) is the oldest known Italian calving ice margin, with over two centuries of historicalobservations, iconography and field surveys, dating from the time of De Saussure (1786). This rich recordallows lake evolution to be reconstructed and calving processes to be investigated.
Figure 1. Location of Miage Glacier and Miage Lake (Mont Blanc Massif, Italian western Alps)
Copyright 2006 John Wiley & Sons, Ltd. Hydrol. Process. 20, 2233–2244 (2006)

FRESHWATER CALVING AT MIAGE GLACIER 2235
Miage Lake is an ice-contact lake on the right-lateral side of the debris-covered Miage Glacier (MontBlanc Massif); at 11 km2 it is the third largest Italian glacier by area. The calving margin is 200 m long andaverages 30 m high, a vertical surface of ¾6000 m2. During the 2002 -2004 surveys the summer lake surfacearea was ¾36 000 m2 (Diolaiuti et al., 2005). The lake is famous for its periodic emptying episodes, whichoccurred several times in the 20th century. A list of the historical emptying episodes is reported in Diolaiutiet al. (2006). The lake shore is popular with tourists because access is easy close to the ice cliff; hence, peopleare exposed to the hazard of waves produced by calving, which has led to accidents in the past.
METHODS
Measurement of thermal undercutting
Surveys were performed at Miage Lake during the summers of 2002, 2003, and 2004, and in January 2004.The calving process is related to thermal undercutting at the waterline of the ice cliff. The rate of waterlinethermo-erosion by this process was measured using a sonic ranger mounted on a small remote-controlledboat. This method allows a large number of measurements without risk to the surveyors from rockfall andcalving from the ice cliff. Drainage of the lake in September 2004 prevented a repeat survey at the end of the2004 ablation season. The drainage event offered a unique occasion to observe the lake floor (Deline et al.,2004), but made a second survey with this technique impossible. Instead, direct surveys from fixed positionson the dry lake floor were carried out by laser distance meter, from which several vertical sections of the icecliff and its thermal notch were constructed to an accuracy of 2–3 cm. Comparisons with the previous surveyprovided a calculation of the rate of thermal undercutting at the waterline.
Glacier surface velocity
Glacier surface velocity was measured using differential global positioning system (DGPS) on a network ofmetal pegs in supraglacial boulders installed in 2002. In the years 2002 and 2003 the network comprised 12markers, five close to the lake and seven scattered on the central part of the glacier tongue at 2000–2400 maltitude. In 2004, six more pegs were added along the glacier surface above the lake margin. These pointswere used to obtain surface velocities from the measured displacements of each marker peg, using the nationalWGS84 coordinate grid.
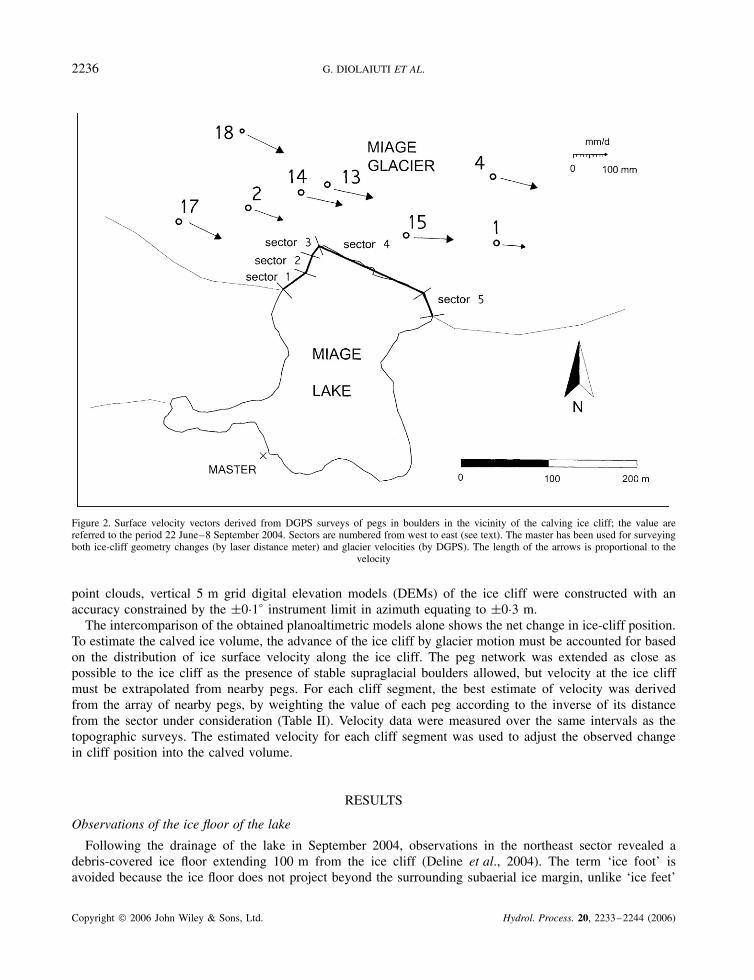
The normal components of the measured velocities were computed by approximating the complex shape ofthe lake margin to a segmented line (Figure 2). Each of the five segments was manually defined according tothe local aspect, height, and vertical profile of the ice cliff. The only change to the five segments through thesurvey period has been due to the advance and retreat of the ice cliff. The gross form of the calving marginhas remained constant.
By using the azimuths of each segment and the measured surface displacements, that component of velocityacting normal to the relevant segment of the ice cliff was obtained as follows. The modulus v and the azimuth� of the velocity vector were computed from the velocities observed in the vicinity of the ice cliff. The angleε D � � represents the difference between the velocity vector and the local orientation of the contactline. The modulus v was projected perpendicularly to the contact line. The cliff-normal components of pegdisplacements (Tables I and II) are accurate to �0Ð1 m.
Quantification of calving losses
Computation of the volume of ice lost to calving requires precise information on both the change in ice-cliffposition between two surveys and on the glacier flux towards the ice cliff. Changes in the ice-cliff positionand morphology were measured by laser distance meter surveys from a fixed reference point establishedoutside the glacier-lake area (Figure 2). The three-dimensional geometry of the ice cliff was obtained bytopographic survey mainly during summer when calving is active. From the surveyed laser distance meter
Copyright 2006 John Wiley & Sons, Ltd. Hydrol. Process. 20, 2233–2244 (2006)
2236 G. DIOLAIUTI ET AL.
Figure 2. Surface velocity vectors derived from DGPS surveys of pegs in boulders in the vicinity of the calving ice cliff; the value arereferred to the period 22 June–8 September 2004. Sectors are numbered from west to east (see text). The master has been used for surveyingboth ice-cliff geometry changes (by laser distance meter) and glacier velocities (by DGPS). The length of the arrows is proportional to the
velocity
point clouds, vertical 5 m grid digital elevation models (DEMs) of the ice cliff were constructed with anaccuracy constrained by the š0Ð1° instrument limit in azimuth equating to š0Ð3 m.
The intercomparison of the obtained planoaltimetric models alone shows the net change in ice-cliff position.To estimate the calved ice volume, the advance of the ice cliff by glacier motion must be accounted for basedon the distribution of ice surface velocity along the ice cliff. The peg network was extended as close aspossible to the ice cliff as the presence of stable supraglacial boulders allowed, but velocity at the ice cliffmust be extrapolated from nearby pegs. For each cliff segment, the best estimate of velocity was derivedfrom the array of nearby pegs, by weighting the value of each peg according to the inverse of its distancefrom the sector under consideration (Table II). Velocity data were measured over the same intervals as thetopographic surveys. The estimated velocity for each cliff segment was used to adjust the observed changein cliff position into the calved volume.
RESULTS
Observations of the ice floor of the lake
Following the drainage of the lake in September 2004, observations in the northeast sector revealed adebris-covered ice floor extending 100 m from the ice cliff (Deline et al., 2004). The term ‘ice foot’ isavoided because the ice floor does not project beyond the surrounding subaerial ice margin, unlike ‘ice feet’
Copyright 2006 John Wiley & Sons, Ltd. Hydrol. Process. 20, 2233–2244 (2006)
FRESHWATER CALVING AT MIAGE GLACIER 2237
Table I. Peg displacements and velocity calculation
Topographicmark
Survey period,2004
Days Displacement(m)
Velocity(m day�1)
Velocity azimuth� (°)
Peg 17 22 June–6 August 45 4Ð1 0Ð09 107Ð16 August–8 September 33 4Ð6 0Ð14 107Ð78 September–12 October 34 2Ð9 0Ð09 110Ð5
Peg 18 23 June–6 August 44 5Ð9 0Ð13 101Ð86 August–8 September 33 8Ð8 0Ð27 130Ð48 September–12 October 34 2Ð5 0Ð07 112Ð4
Peg 2 23 June–6 August 44 4Ð0 0Ð09 120Ð7Peg 14 23 June–6 August 44 5Ð8 0Ð13 97Ð4
6 August–8 September 33 3Ð4 0Ð10 96Ð18 September–12 October 34 3Ð1 0Ð09 119Ð1
Peg 13 23 June–6 August 44 7Ð1 0Ð16 108Ð46 August–8 September 33 3Ð9 0Ð12 124Ð58 September–12 October 34 2Ð7 0Ð08 113Ð7
Peg 15 23 June–6 August 44 3Ð9 0Ð09 94Ð06 August–10 September 33 3Ð0 0Ð09 90Ð0
Peg 4 23 June–6 August 44 3Ð8 0Ð09 103Ð76 August–10 September 33 3Ð3 0Ð10 95Ð2
Peg 16 23 June–6 August 44 3Ð9 0Ð09 94Ð06 August–10 September 33 2Ð3 0Ð07 90Ð1
Table II. Estimated component of glacier surface velocity normal to each of the five sectors of the ice cliff for themeasurement periods in the summer of 2004. Period 1: 22 June to 6 August; period 2: 6 August to 8 September
2004. Az means cliff azimuth
Cliffsegment
Period Az cliff(°)
Basis forestimation
Normal component(mm day�1)
S1 1 32 Peg 17 912 32 Mean of pegs 14, 17 118
S2 1 59 Weighted mean of pegs 2, 14, 17 662 59 Mean of pegs 14, 17 77
S3 1 36 Weighted mean of pegs 2, 15, 17 792 36 Mean of pegs 15, 17 105
S4 1 109 Weighted mean of pegs 13, 14, 15 �212 109 Weighted mean of pegs 13, 14, 15 �13
S5 1 158 Mean of pegs 4, 16 �762 158 Mean of pegs 4, 16 �40
in terminal ice-contact lakes. Instead, the ice-contact sector of the lake takes the form of an ice-flooredembayment. The ice floor was crevassed and contiguous with the main glacier (Figure 3).
The debris-cover on the ice floor was similar in texture and thickness to that on the glacier surface,dominated by boulder gravel. Sand and finer sizes of material were scarce. Crevasses were partially debrisfilled and water was not visible at any depth in them. The ice floor terminated at two moraine ridges orientedwest-northwest–east-southeast; these ridges separate the lake into two main zones: the ice-floored zone andthe outer lake area (from the moraines’ ridges to the bounding ‘Little Ice Age’ moraine complex).
Formation of the ice-floored embayment depends on the calving of the glacier ice located above thesummer water level, caused mainly by thermal undercutting. This process causes a retreat of the ice cliff anda corresponding increase in the width of the ice floor; the concurrent action of glacier flow acts to advance the
Copyright 2006 John Wiley & Sons, Ltd. Hydrol. Process. 20, 2233–2244 (2006)

2238 G. DIOLAIUTI ET AL.
3343503343005071550
5071600
5071650
5071700
5071750
5071800
5071850
5071900
334400 334450 334500 334550 334650334600
EAST
2110
2105
2100
2095
2090
2085
2080
2075
2065
2070
2060
2055
2050
m
NO
RT
H
Figure 3. DEM of Miage Lake floor calculated using both GPS and bathymetric data. Four residual basins are present (the west residualbasin is not appreciable because of its small size). The DEM altitude values refer to the WGS84 ellipsoid, which locally yields altitudes50 m higher than the geodetic one: (1) ice contact zone; (2) ice floor; (3) two moraines dividing the ice floor from the outer lake area; (4),
(5) and (6) residual water ponds
position of the ice cliff continuously to compress the ice floor. Photographs taken between January and May(Deline, personal communication) show winter uplift above the summer lake level. The thickness of the icefloor was measured by ground-penetrating radar in September 2004 after lake drainage. Ice thickness reaches90 m close to the foot of the ice cliff. A local glacier thickness of 120–130 m was measured above the icecliff (Deline et al., 2004).
Subaqueous melting under high summer lake levels may explain changes to emergent debris within thelake. These, before the last emptying occurred in summer 2004, were interpreted as former ice-cored moraines(Diolaiuti et al., 2005). In a picture taken in 1953 (Lesca, 1956), with the lake surface at 2020 m a.s.l., thedebris was only partially submerged. In a photograph taken by the authors in summer 2003 (Diolaiuti et al.,2005), with the waterline again at 2020 m a.s.l., this debris was no longer visible. After the emptying, it wasclear that this debris was part of the uplifted ice floor and not a moraine ridge.
The ice-floor lowering can be explained by subaqueous melting (see Eijpen et al., 2003). From surveys ofsummer water temperatures (Diolaiuti et al., 2005), the surface water over the ice floor varies between 2 and4 °C, and in winter remains at 0 °C for several months.
Calving mechanism
Calving was observed to occur during the ablation season only, so that the ice cliff exhibits an annualcycle of summer retreat and winter advance. At diurnal time-scales, the frequency of small calving eventsappears to peak in the early afternoon, coincident with the daily melt maximum. At the higher, western sector,many calving events are triggered by the opening of crevasses at the cliff top, which progressively widen and
Copyright 2006 John Wiley & Sons, Ltd. Hydrol. Process. 20, 2233–2244 (2006)
FRESHWATER CALVING AT MIAGE GLACIER 2239
propagate downward until toppling failure occurs. This seems to reflect transport of lateral shear crevassesinto this sector from the northwest.
Above the ice cliff, debris cover of 0Ð1–1Ð0 m thickness influences both albedo and ablation rate; differentialablation leads to a more irregular ice-cliff geometry. Not only is the ice-cliff top an irregular boundary, butalso the cliff face has a thin and irregular cover of fine debris (<0Ð02 m) that reduces albedo and increasesmelt rates.
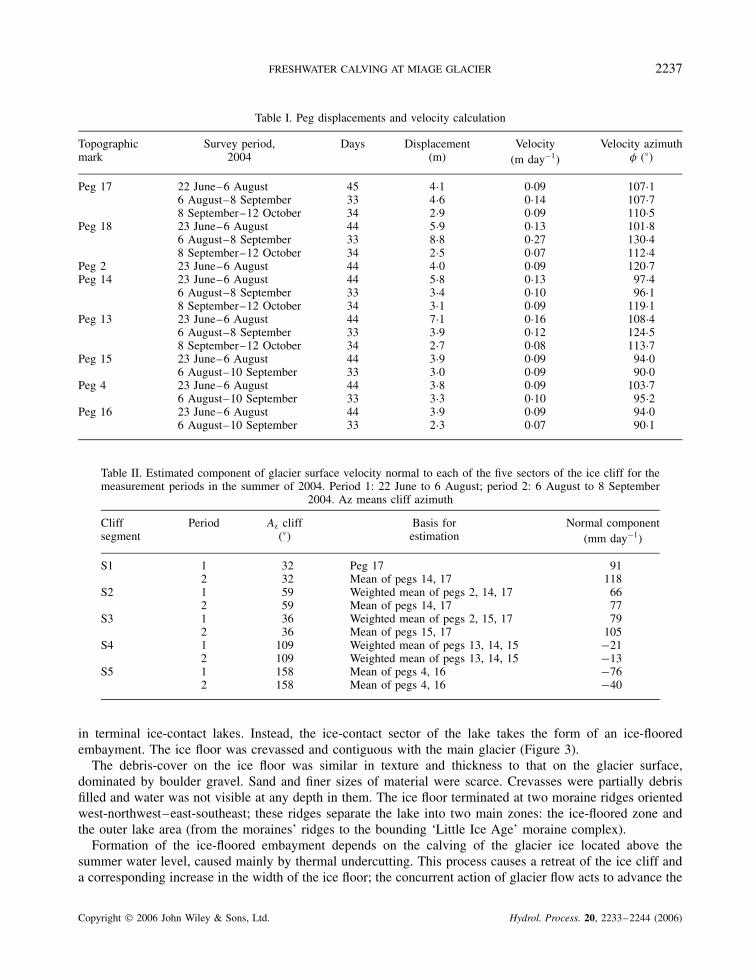
At the eastern lower part of the ice contact zone, calving is controlled by the development of deep meltnotches at the waterline (Figure 4). These progressively undercut the ice cliff, eventually leading to failureof the notch roof in the manner described by Kirkbride and Warren (1997). This process is important indriving iceberg production when the water level is at its relatively constant high summer level. Averaging allthe measurements along the eastern sector of the ice cliff gives a rate of thermal undercutting of 30–35 mper summer season, corresponding to a notch formation rate of ¾0Ð2 m day�1 over the 6 months (May toOctober) when the lake surface is unfrozen. This is comparable in rate to the undercutting and back-wastingof ice slopes around the terminal lake of Tasman Glacier (Kirkbride, 1993; Rohl, unpublished data).
Ice velocity
Ice surface vectors based on topographic pegs (Table I) show a downstream swing in azimuths towardsthe east, parallel to the curve of the main lateral moraine. In the vicinity of the lake, the surface velocitydecreases both downstream and towards the glacier margin (Figure 2).
Significantly, there appears to be no vector towards the focus of ablation in the lake basin: the regionalice flow vector is maintained past the lake embayment. Ice flows towards the ice cliff at the west end of the
Figure 4. Thermal notch at the base of the Miage Lake ice margin (eastern sector). The picture was taken by the authors during the lastemptying episode. The surveyor to the right of the picture was positioned on the lake floor (debris-covered ice floor). The white line follows
the vertical profile of the thermal notch
Copyright 2006 John Wiley & Sons, Ltd. Hydrol. Process. 20, 2233–2244 (2006)
2240 G. DIOLAIUTI ET AL.
calving margin and broadly parallel to it in the central sector. At the easternmost segment of the ice cliff,flow and calving act in the same direction, potentially to enhance downstream migration of the eastern lakeshore. Reasons why the lakeshore has actually maintained a fairly stable position are discussed later.
Because most pegs were located nearer to the glacier centre than the cliff (in faster-moving ice), it has beennecessary to estimate velocity vectors to simulate likely ice surface velocities at the lake margin accordingto the downstream and lateral velocity gradients (Table II). The component of velocity normal to the trendof each segment of the ice cliff has been calculated by trigonometry from the estimated vectors (Table II).Negative cliff-normal velocities for two segments of the ice cliff in Table II show ice moving away fromthe eastern lake edge, consistent with glacier flow directed away from the calving front. Calving rate here isderived by adding ice velocity to cliff retreat according to Equation (1).
The vertical component of velocity is not available from the method used, because the vertical motion ofthe peg markers is the difference between glacier thinning and emergence velocity at each point. It can beexpected that a significant emergence velocity will affect this lateral location in an ablation zone, especiallygiven its position on the outside of the main bend in the glacier.
Calculation of calving rate
The volume variations obtained have been used to calculate the calving rate according to the definitionin Paterson (1994), i.e. volume variation per unit of vertical area and per unit of time. Calving rate wascalculated according the definition used by Pelto and Warren (1991) and van der Veen (1996):
uc D ui � ur �1�
where uc is the calving rate, ui is the glacier surface velocity, and ur is the change in ice cliff position.The ice-cliff DEM at time t1 has been termed DEM1. For each cliff segment, DEM1 was advanced by the
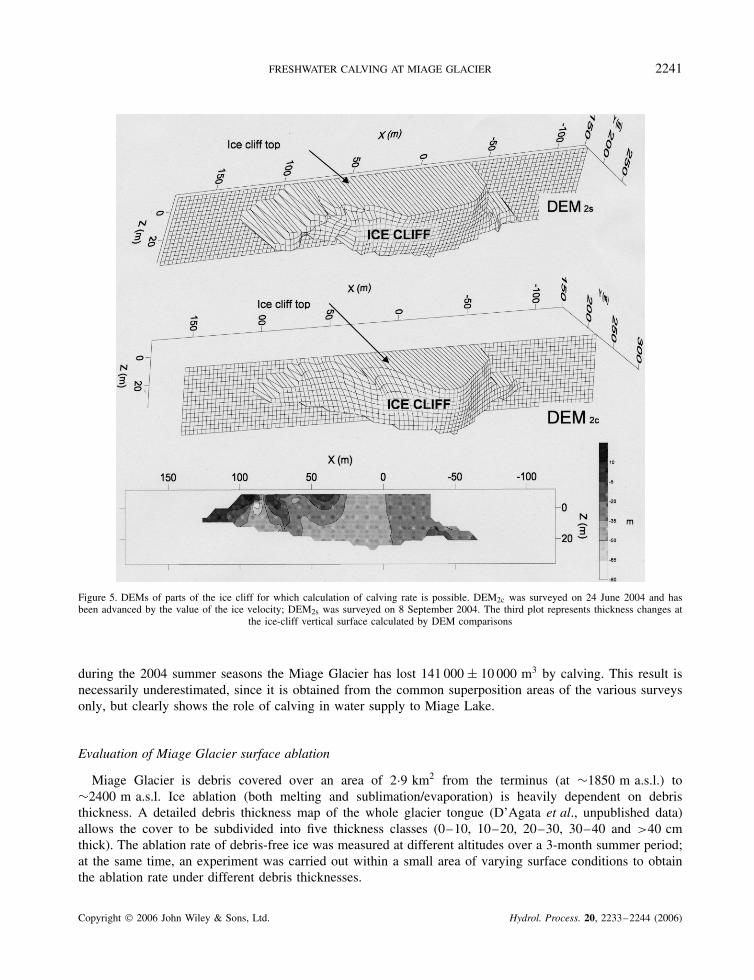
value of the ice velocity to create the DEM2c grid, which is the notional ice cliff at time t2 (i.e. the next surveydate) assuming no calving has occurred. DEM2s represents the actual ice cliff surveyed at time t2; calving isresponsible for the differences between the DEM2c and DEM2s grids. Making the reasonable assumption ofa constant cliff height h, the subaerial ice volume lost to calving is calculated as the difference between theDEM2c and DEM2s surfaces (Figure 5).
The calving rate in a T time interval is thus equal to
DEM2c � DEM2s
AT�2�
The vertical surface A used in the analysis was the minimum common area of all the surveys as obtainedfrom the superposition of all the point clouds.
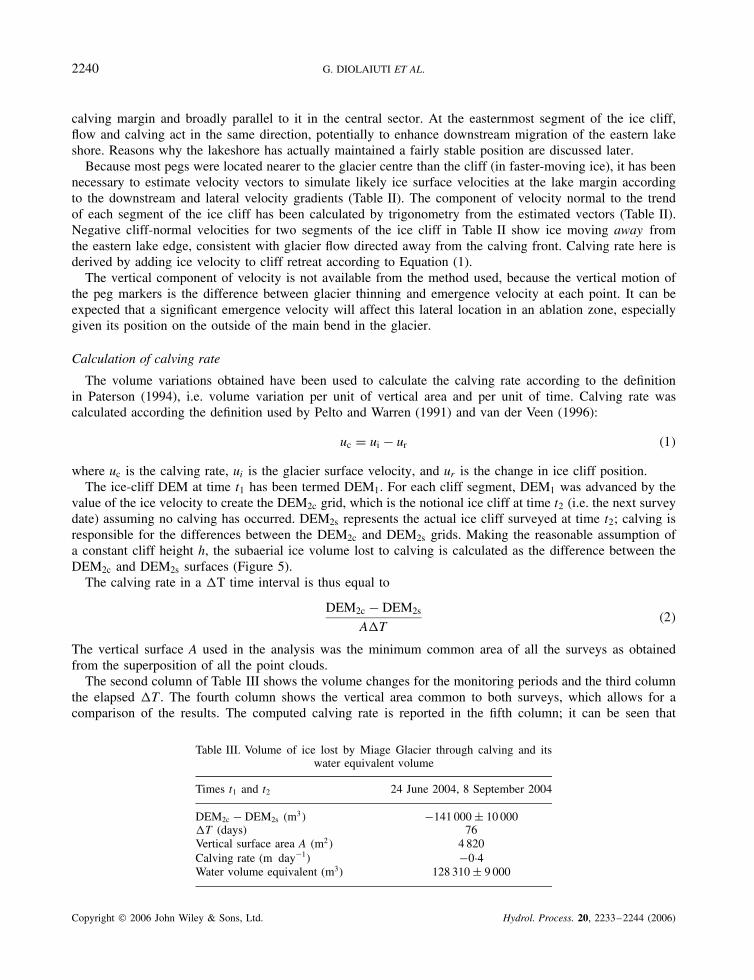
The second column of Table III shows the volume changes for the monitoring periods and the third columnthe elapsed T. The fourth column shows the vertical area common to both surveys, which allows for acomparison of the results. The computed calving rate is reported in the fifth column; it can be seen that
Table III. Volume of ice lost by Miage Glacier through calving and itswater equivalent volume
Times t1 and t2 24 June 2004, 8 September 2004
DEM2c � DEM2s �m3� �141 000 š 10 000T (days) 76Vertical surface area A �m2� 4 820Calving rate (m day�1) �0Ð4Water volume equivalent (m3) 128 310 š 9 000
Copyright 2006 John Wiley & Sons, Ltd. Hydrol. Process. 20, 2233–2244 (2006)
FRESHWATER CALVING AT MIAGE GLACIER 2241
Figure 5. DEMs of parts of the ice cliff for which calculation of calving rate is possible. DEM2c was surveyed on 24 June 2004 and hasbeen advanced by the value of the ice velocity; DEM2s was surveyed on 8 September 2004. The third plot represents thickness changes at
the ice-cliff vertical surface calculated by DEM comparisons
during the 2004 summer seasons the Miage Glacier has lost 141 000 š 10 000 m3 by calving. This result isnecessarily underestimated, since it is obtained from the common superposition areas of the various surveysonly, but clearly shows the role of calving in water supply to Miage Lake.
Evaluation of Miage Glacier surface ablation
Miage Glacier is debris covered over an area of 2Ð9 km2 from the terminus (at ¾1850 m a.s.l.) to¾2400 m a.s.l. Ice ablation (both melting and sublimation/evaporation) is heavily dependent on debristhickness. A detailed debris thickness map of the whole glacier tongue (D’Agata et al., unpublished data)allows the cover to be subdivided into five thickness classes (0–10, 10–20, 20–30, 30–40 and >40 cmthick). The ablation rate of debris-free ice was measured at different altitudes over a 3-month summer period;at the same time, an experiment was carried out within a small area of varying surface conditions to obtainthe ablation rate under different debris thicknesses.
Copyright 2006 John Wiley & Sons, Ltd. Hydrol. Process. 20, 2233–2244 (2006)

2242 G. DIOLAIUTI ET AL.
The measured debris-free ablation rate correlates strongly with altitude (r2 D 0Ð86). Ablation rate at anyaltitude and debris thickness can then be calculated using the formula
Afx D Abx,y
Acy�3�
where Afx is the ablation factor for the debris thickness class x, Abx,y is the ablation on buried ice at debristhickness x at altitude y, and Acy is the ablation on debris free ice at altitude y. For each altitudinal range of theglacier tongue, the surface area covered by each debris thickness class has been calculated using a geographicalinformation system and each area multiplied by the ablation rate (specific for that altitudinal range) and bythe ablation factor (specific for that debris thickness class) to obtain the total daily ablation. The sum of theseablation totals gives a total daily ablation on the debris-covered tongue of �94Ð8 ð 103 m3. This amount wasmultiplied by the 76 days of the calving measurement period to give total ablation from the debris-coveredice of �7Ð2 ð 106 m3 of ice (�6Ð6 ð 106 m3 water equivalent (w.e.)). This value was considered equal to themelt-water runoff, as neither water storage nor a reduction due to sublimation/evaporation has been consideredin this approach. The main discharge of melt water from the glacier is via the terminus of the north lobe atpresent.
DISCUSSION
Relative importance of calving as an ablation process
The ablation losses from the surface of Miage Glacier were evaluated according to the methods reportedabove. The resulting ablation from the debris-covered ice was about �6Ð6 ð 106 m3 w.e. In addition, meltingof the ice cliff must also be considered. It was not possible to perform detailed surveys for quantifying meltrates here, but field tests carried out on a steep ice face on the glacier surface (at the same aspect and altitudeof the calving cliff) gave an ablation rate of 14Ð5 cm day�1 over 2 weeks during July. Given that this willcorrespond to the summer maximum rate, a rough estimate of ice loss due to melting of the cliff of 35 000to 45 000 m3 is obtained.
The calving losses were measured over 76 days of survey in the summer of 2004, (24 June–8 September),so the actual calving contribution is probably underestimated for the whole ablation season. Nevertheless, theestimated volume of ¾128 ð 103 m3 of water represents ¾2% of the estimated volume loss through surfaceablation over the same measurement interval.
Effect of calving on Miage Lake
Following drainage of the lake, topographic and geophysical surveys were undertaken to map lake-floorgeometry and to describe its morphology. The topographic survey was performed by DGPS with respectto a base station located close the lake (Figure 2). The survey took place on the 8–9 September 2004.Some residual ponds were present so their bathymetry was surveyed using a sonar-equipped inflatable boatgeoreferenced by a global positioning system (GPS). The data acquired allowed calculation of two DEMs(with and without water in the residual ponds) to quantify both the lake volume and the water outflow duringthe first days of emptying. The lake-floor DEM (without water in the residual ponds) is shown in Figure 3.The total volume of water contained in the lake during summer conditions (when the waterline is at 2020 ma.s.l.) is ¾340 ð 103 m3.
These results allow some comment on the significance of calving for water supply to the lake. The lake isfed by melt water (not quantified in this study) and by calved icebergs during the summer; the latter has beenquantified for the period 2003–2004. There is also water supply from crevasses, from summer rainstorms,and from a small inflow river whose discharge alone is not sufficient for maintaining the lake level againstleakage through the lake bed (Lesca, 1956; Diolaiuti et al., 2005).
Copyright 2006 John Wiley & Sons, Ltd. Hydrol. Process. 20, 2233–2244 (2006)
FRESHWATER CALVING AT MIAGE GLACIER 2243
The results show that the contribution of calving to the lake was ¾38% in the 2004 summer season. Meltingof the cliff was only ¾25% of the calving contribution, showing the importance of the latter. The 2003 and2004 summers were the warmest since several years, so the calving estimate may be above average dueto increased flow and crevassing of the ice margin. However, calving losses have only been calculated for4820 m2 of the ¾6000 m2 of the ice cliff, so our estimates represent minimum amounts.
In the absence of recent inflow data, it is difficult to assess the significance of calving in relation to othersources of lake water. The only available data are from the summer of 1953 (Lesca, 1956; see also Diolaiutiet al. (2005)). Lesca (1956) described three small outflow and two inflow streams in the summer of 1953.An August mean midday discharge of the two inflows was 0Ð02 m3 s�1, about 25% less than the combineddischarge of the three outflow rivers over the same period. Thus, the lake volume at that time was not beingmaintained without the calving contribution against losses through bed leakage, evaporation and outflow. Asa rough approximation, a discharge of 0Ð02 m3 s�1 is equal to a daily input of water to the lake of ¾1700 m3.In summer 2004, the mean daily water contribution from calving was ¾1680 m3. Even allowing that the twoestimates are not contemporaneous, it seems likely that water supply by calving is of the same order as supplyby inflow.
CONCLUSIONS
The research performed on Miage Glacier indicates that calving contributes ¾2% of the seasonal runoff fromthe debris-covered part of the ablation zone. This quantity of water corresponds to ¾38% of the lake volume,and appears to be similar in magnitude to inflow discharge to the lake. Iceberg calving is, therefore, a majorwater source for maintaining the maximum possible lake volume at the level of the subaerial outlet stream.
During the growth phase of ice-marginal lakes, the hydrological role played by calving is to increase runofffrom the glacier. This is currently the case at several debris-covered glacier termini in the Italian Alps. Thegreater ablation of calving glacier margins is due to removal of protective debris cover, to the creation ofdirty ice surfaces of low albedo, and to the increase in the surface area of ice available for melting whenbergs enter the lake.
Miage Lake appears not to have grown in recent decades, so that the mere presence of a lake does notnecessarily mean an increase in runoff, though this would have been the case when the lake formed. Becausecalving losses will be sensitive to glacier velocity and to lake water temperature, there may exist the potentialfor future instability of the lake and renewed increases in runoff as climate changes.
The processes of lake–ice interactions described in this study can be considered representative of a largersample of Italian calving glaciers. In fact, all the glaciers with evidence of calving surveyed by the authors(Smiraglia et al., 2006) present debris covers in their calving sectors. At Miage Glacier, calving has beenactive at least since the end of the 18th century. Debris covers at other glaciers could, therefore, prolong thepersistence of glacier termini in positions where calving is favoured.
ACKNOWLEDGEMENTS
This research was supported by the Italian Ministry of University and Research within the framework ofthe 2003 and 2004 MIUR project and within the 2005 CRUI–British project, thanks to the collaboration ofall the workers in the ‘AIGEO–Debris Covered Glaciers Working Group’. We wish to thank the ‘RegioneValle d’Aosta’, the Municipality of Courmayeur and ‘Fondazione Montagna Sicura’–CRGV in Courmayeurfor the logistic assistance. MPK was funded by a Royal Society of Edinburgh Caledon Research Foundationscholarship.
We wish to thank the editor R. Hock and the anonymous referees for their help in improving the first draftof this paper.
Copyright 2006 John Wiley & Sons, Ltd. Hydrol. Process. 20, 2233–2244 (2006)
2244 G. DIOLAIUTI ET AL.
REFERENCES
Buzzini P, Turchetti B, Diolaiuti G, D’Agata C, Martini A, Smiraglia C. 2005. Yeast biodiversity in melting ice from glaciers in the ItalianAlps. Annals of Glaciology 40: 119–122.
Deline P, Diolaiuti G, Kirkbride MP, Mortara G, Pavan M, Smiraglia C, Tamburini A. 2004. Drainage of ice-contact Miage Lake (MontBlanc Massif, Italy) in September 2004. Geografia Fisica e Dinamica Quaternaria 27: 113–119.
De Saussure HB. 1786. Voyages dans les Alpes, precedes d’un essai sur l’histoire naturelle des environs de Geneve”. Neuchatel, S. Fauche,vol. 2.
Diolaiuti G, Kirkbride MP, Smiraglia C, Benn DI, D’Agata C, Nicholson L. 2005. Calving processes and lake evolution at Miage Glacier(Mont Blanc, Italian Alps). Annals of Glaciology 40: 207–214.
Diolaiuti G, Citterio M, Carnielli T, D’Agata C, Rosazza S, Smiraglia C. 2006. Fresh-water calving in the Italian Alps: processes and hazardsof a spreading phenomenon. Some results from a study site (Miage Lake, Mont Blanc Massif, Italy). In II clima e i rischi geomorfologiciin relazione allo sviluppo turistico, Piccazzo M (ed.). Patron, Bologna, Italy.
Eijpen KJ, Warren CR, Benn D. 2003. Subaqueous melt rates at calving termini: a laboratory approach. Annals of Glaciology 36: 179–183.Fujii Y, Higuchi K. 1977. Statistical analysis of the forms of the glaciers in Khumbu Himal. Journal of the Japan Society of Snow and Ice
(Seppyo) 39: 7–14.Haeberli W, Frauenfelder R, Hoelzle M, Maisch M. 1999. On rates and acceleration trends of global glacier mass balances. Geografiska
Annaler 81: 585–591.Hoelzle M, Haeberli W, Dischl M, Peschke W. 2003. Secular glacier mass balances derived from cumulative length changes. Global and
Planetary Change 36: 295–306.Kirkbride MP. 1993. The temporal significance of transitions from melting to calving termini at glaciers in the central Southern Alps of
New Zealand. Holocene 3(3): 232–240.Kirkbride MP. 1995. Relationships between temperature and ablation on the Tasman Glacier, Mount Cook National Park, New Zealand.
New Zealand Journal of Geology and Geophysics 38(1): 17–27.Kirkbride MP, Warren CR. 1997. Calving processes at a grounded ice cliff. Annals of Glaciology 24: 116–121.Lesca C. 1956. Osservazioni sui laghi del Ghiacciaio del Miage. Bollettino del Comitato Glaciologico Italiano, II Serie 7: 29–55.Mattson LE, Gardner JS, Young GJ. 1993. Ablation on debris covered glaciers: an example from the Rakhiot Glacier, Punjab, Himalaya. In
Snow and Glacier Hydrology , Young GJ (ed.). IAHS Publication No. 218. IAHS Press: Wallingford; 289–296.Paterson WSB. 1994. The Physics of Glaciers . 3rd edition. Pergamon: Oxford.Pelto MS, Warren CR. 1991. Relationship between tidewater glacier calving velocity and water depth at the calving front. Annals of
Glaciology 15: 115–118.Østrem G. 1959. Ice melting under a thin layer of moraine and the existence of ice in moraine ridges. Geografiska Annaler 41: 228–230.Rana B, Nakawo M, Fukushima Y, Ageta Y. 1997. Application of a conceptual precipitation–run off model in the debris-covered glacierized
basin of Langtang Valley, Nepal Himalaya. Annals of Glaciology 25: 226–231.Smiraglia C, Diolaiuti G, Pelfini M, Citterio M, Carnielli T, D’Agata C. 2006. Changing glaciers, their impacts on mountain tourism: two
cases from the Italian Alps. In Global Change on Mountain Areas: Glaciers and Society , Orlove B (ed.). University of California Press.Van der Veen CJ. 1996. Tidewater calving. Journal of Glaciology 42(141): 375–385.
Copyright 2006 John Wiley & Sons, Ltd. Hydrol. Process. 20, 2233–2244 (2006)