Synthesis and characterization of magnetic mesoporous particles

Journal of Industrial and Engineering Chemistry 20 (2014) 1126–1132
Raspberry derived mesoporous carbon-tubules and fixed-bedadsorption of pharmaceutical drugs
Shashi Prabha Dubey a,c,*, Amarendra Dhar Dwivedi b, Changha Lee a,**,Young-Nam Kwon a,**, Mika Sillanpaa c, Lena Q. Ma b,d
a School of Urban and Environmental Engineering, Ulsan National Institute of Science and Technology (UNIST), 100 Banyeon-ri, Eonyang-eup, Ulju-gun, Ulsan
698-805, Republic of Koreab State Key Laboratory of Pollution Control and Resource Reuse, School of the Environment, Nanjing University, Nanjing 210023, Chinac Laboratory of Green Chemistry, Lappeenranta University of Technology, Sammonkatu 12 (Innovation Centre for Safety and Material Technology, TUMA),
50130 Mikkeli, Finlandd Soil and Water Science Department, University of Florida, Gainesville, FL 32611-0290, USA
A R T I C L E I N F O
Article history:
Received 29 January 2013
Accepted 28 June 2013
Available online 22 July 2013
Keywords:
Carbon-tubules
Fixed-bed
Mesoporous
Octanol–water partition coefficient
Pharmaceutical drugs
A B S T R A C T
Novel mesoporous carbon-tubules were prepared from wild plant leaves of Rubus idaeus (Raspberry) and
their physicochemical characteristics were analyzed by spectroscopic and potentiometric titration
methods. The developed carbon-tubules were applied for the aqueous phase decontamination of three
pharmaceutical drugs. Ibuprofen, naproxen and clofibric acid were selected for the study. Batch and
fixed-bed studies were performed to investigate the adsorption of selected pharmaceutical drugs.
Mathematical modelings were applied to the experimental data in order to estimate the maximum
adsorption capacity and evaluate the characteristics of the fixed-bed. Based on finding, the adsorption
mechanism was investigated by adsorbate and adsorbent physicochemical characteristics.
� 2013 The Korean Society of Industrial and Engineering Chemistry. Published by Elsevier B.V. All rights
reserved.
Contents lists available at ScienceDirect
Journal of Industrial and Engineering Chemistry
jou r n al h o mep ag e: w ww .e lsev ier . co m / loc ate / j iec
1. Introduction
Pharmaceutical drugs (PD) and their residues in aquaticenvironment have attracted concern due to potential endocrineimpacts on exposed aquatic organisms [1,2]. They can be persistentand exhibit deleterious effects on organisms [3]. The occurrence ofPD in environmental samples and water cycles at trace levels (inrange of nanograms to low micrograms per liter) across manycountries has been widely discussed in literature in the past decade[4,5]. The occurrence of PD in river water has been investigated inmany Asian countries such as Japan, China and South Korea [6–8].The concentration of ibuprofen (IB) in wastewater effluents inEuropean countries has been reported to vary from 60 to 3400 ng/L[9–14].
Recent investigations for PD removal indicate that sand filtration,flocculation and sedimentation achieve minimal removal efficiency
* Corresponding author at: School of Urban and Environmental Engineering,
Ulsan National Institute of Science and Technology (UNIST), 100 Banyeon-ri,
Eonyang-eup, Ulju-gun, Ulsan 698-805, Republic of Korea. Tel.: +82 52 217 2879.
** Corresponding authors. Tel.: +82 52 217 2879.
E-mail addresses: [email protected],
[email protected] (S.P. Dubey), [email protected] (C. Lee),
[email protected] (Y.-N. Kwon).
1226-086X/$ – see front matter � 2013 The Korean Society of Industrial and Engineer
http://dx.doi.org/10.1016/j.jiec.2013.06.051
[15,16]. On the other hand, removal or transformations of PD byadvanced oxidation technology and adsorption have promisingresults. Among various water purification and recycling technolo-gies, adsorption is fast, inexpensive and universal [17,18].
Porous activated carbon materials are of great interest inenvironmental remediation due to their physicochemical proper-ties and activated carbon has thus become a model adsorbent forwater contaminants [19]. Despite several advances in carbonsynthesis, researchers are continuously exploring the improve-ment of existing fabrication methods for the development of a newnovel carbon. Carbon materials synthesized by conventionalmethods normally have broad pore size distribution in bothmicro- and meso-pore ranges [20]. In spite of their extensiveapplications, microporous carbon suffer a few drawbacks such asslow mass transport of molecules enforced by small pore sizes, lowconductivity, and collapse of porous structures at high tempera-ture. To overcome these limitations, efforts have been made tosynthesize mesoporous carbon (MC) materials.
In recent years, researchers have synthesized MC for betteradsorption of many emerging water contaminants. Sui et al. havestudied the rapid removal of bisphenol A on ordered MC [21].Mesoporous activated carbon was synthesized from solid wastesby Nakagawa et al. [22] for the adsorption of dye. MC was alsofound effective for pharmaceuticals adsorption and the pore
ing Chemistry. Published by Elsevier B.V. All rights reserved.

S.P. Dubey et al. / Journal of Industrial and Engineering Chemistry 20 (2014) 1126–1132 1127
structure present in carbonaceous material played an importantrole in pharmaceuticals adsorption [23]. MC was synthesized andused for the adsorption of IB from aqueous solution [24].
In this study, novel MC tubules were prepared using plant Rubus
idaeus to remove PD with unusual physicochemical characteristics.R. idaeus (Raspberry) is native to Europe and northern Asia andcommonly cultivated in other temperate regions [25]. Three-component batch and column investigations were performed onderived MC tubules in order to evaluate the influence of thesimultaneous presence, which may occur in natural environment.IB, naproxen (NP) and clofibric acid (CA) were considered due totheir common occurrence worldwide in river water and wastewa-ter treatment plants (WWTPs) and their consequent highconsumption [6,26,27]. In order to understand the adsorptiondynamics and solid-liquid phase characteristics of differentbreakthrough curves, we applied Thomas and Yoon–Nelsonmodels. Mechanistic details were substantially investigated bydata of PD adsorption onto MC tubules.
2. Materials and methods
The three pharmaceutical drugs IB, NP, and CA, along withmethanol and N,O-bis (trimethylsilyl) trifluoroacetamide (BSTFA),were purchased from Sigma–Aldrich. Ultrapure water was used toprepare the standard solutions. PD solutions at a concentration of250 mg/L were prepared in methanol and diluted to 10 mg/L withthe addition of ultrapure water. The final percentage of methanoldid not exceed 0.1% (v/v) in order to prevent any significantinfluence on the experiment [28]. The different properties of the PDare listed in Table 1.
2.1. Development of RMC
The MC tubules were produced by chemical and physicalactivation. Raspberry leaves were procured locally during July–August from Mikkelli, Finland. They were washed thoroughly withdistilled water to remove traces of particles and to reduce anymineral matter. The leaves were dried and crushed to the 2–4 mmsize. Thirty grams of the processed leaves were chemically treatedwith 50 ml of 80% (v/v) sulphuric acid solution for 8 h. The acid-treated sample was thoroughly washed with ultrapure water untilthe pH of the solution was within the range of 6.2–6.9, and thendried at 120 8C for 6 h.
The dried carbonized product underwent physical activation for30 min in a muffle furnace (Carbolite ELF 11/6B, UK) with nitrogenline-up gas flow at a rate 3 8C/min up to 450 8C for gas activationand devolatilization. The material was cooled in a nitrogen gasatmosphere, washed with ultrapure water and finally kept at
Table 1Properties of the selected pharmaceutical drug compounds.
Parameters Ibuprofen Naproxen
Chemical formula &
IUPAC Name
C13H18O2 (RS)-2-
(4-(2-methylpropyl)
phenyl) propanoic acid
C14H14O3
(+)-(S)-2-(6
propanoic
Structure
CAS No. 15687-27-1 22204-53-
Molecular weight
(g/mol)
206.29 230.27
Aqueous solubility (mg/L) 21.0 15.9
Log Kow 3.97 3.18
pKa 4.91 4.15
Use Antiphlogistic Antiphlogi
120 8C for 6 h for active site homogeneity and stored in a storagebottle at room temperature for adsorption studies. Developedmaterial was named Raspberry mesoporous carbon-tubules (RMC)and characterized for its physicochemical characteristics.
2.2. Physicochemical characterizations of RMC
The surface area, pore volume and pore size of RMC wereinvestigated by N2 adsorption/desorption-Quantachrome Auto-sorb automated gas adsorption system. The sample was degassedat 350 8C for 3 h prior to adsorption. The pore volume of the MCtubules was calculated from the adsorbed nitrogen after completepore condensation (P/P0 = 0.995) using the ratio of the densities ofliquid and gaseous nitrogen.
The ash content, moisture content and apparent density of thedeveloped RMC were determined by American society for testingand materials (ASTM) guidelines [29]. The surface morphology ofRMC was characterized by field emission scanning electronmicroscopy (FE-SEM, Hitachi, Cold). Energy dispersive X-ray(EDX) and Fourier transform infrared spectroscopy (FTIR 8201Shimadzu spectrometers) were used to determine the chemicalcompositions and surface functionalities of RMC. The FTIR spectrawere collected within 500–4000 cm–1. Potentiometric titration atdifferent pH levels was conducted to determine the charge andpHzpc of the RMC surfaces by Malvern Zetasizer. The solution pHwas set using 0.1 N HCl and 0.1 N NaOH electrolytes.
2.3. PD quantification and adsorption studies
The remaining concentration of PD in aqueous solution wasextracted by solid phase extraction method. The extracted samplewas derivatized using BSTFA and quantified by Agilent GC-FID.More details can be found in the supplementary data.
Batch adsorption of IB, NA and CA on RMC was conducted atvarious contact times, pH levels and PD concentrations to evaluatethe adsorption parameters. The solution pH was varied from 3 to 9using 0.1 N HCl and 0.1 N NaOH solution. First, 35 mg of RMC wasadded in 20 ml of 10 mg/L of solutions in 50 ml stoppered conicalflask in an incubator shaker for 5 h at 150 rpm and at 30 � 1 8C.Then, the samples were filtered using a syringe with 0.45 mmpolypropylene filters. The remaining concentration of adsorbateretained in the adsorbent phase was calculated by Eq. (1):
qe ¼ðC0 � CeÞ
MRMC(1)
where qe (mg/g) is the equilibrium adsorption capacity, C0 and Ce
are initial and equilibrium adsorbate concentration (mg/L) andMRMC is amount of RMC added in solution (g/L).
Clofibric acid
-methoxynaphthalen-2-yl)
acid
C10H11ClO3
2-(4-Chlorophenoxy)-2-methylpropanoic
acid
1 882-09-7
214.6
583.0
2.57
3.0
stic Lipid regulator
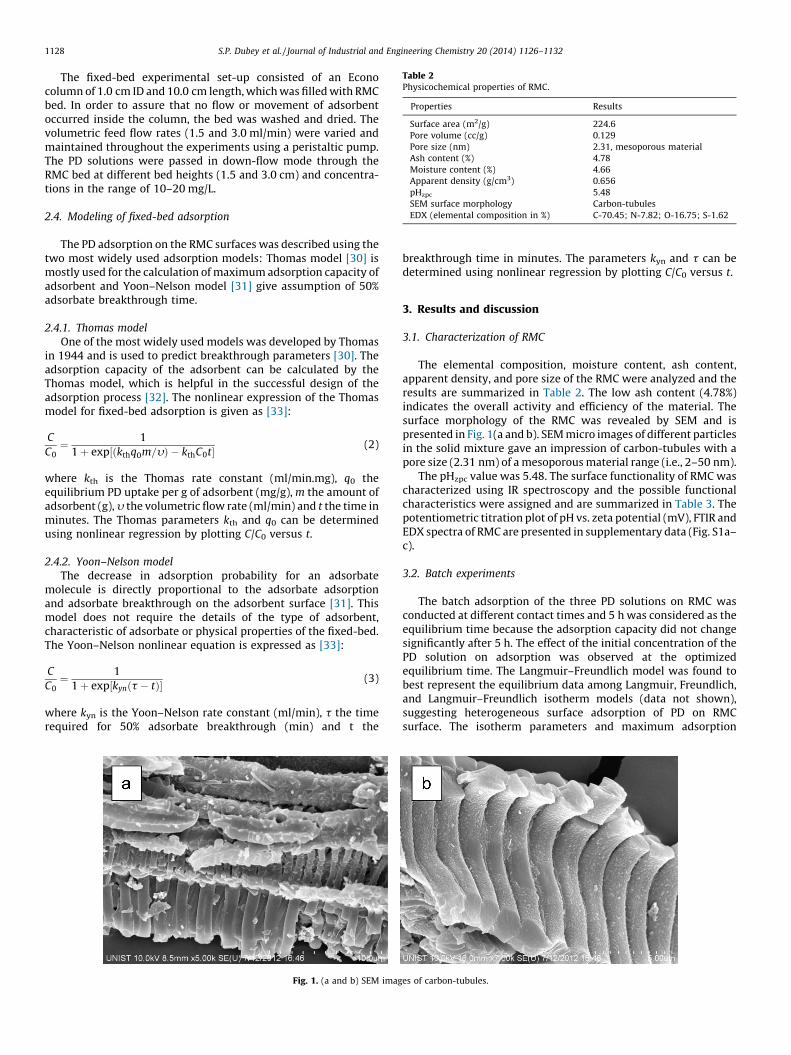
Table 2Physicochemical properties of RMC.
Properties Results
Surface area (m2/g) 224.6
Pore volume (cc/g) 0.129
Pore size (nm) 2.31, mesoporous material
Ash content (%) 4.78
Moisture content (%) 4.66
Apparent density (g/cm3) 0.656
pHzpc 5.48
SEM surface morphology Carbon-tubules
EDX (elemental composition in %) C-70.45; N-7.82; O-16.75; S-1.62
S.P. Dubey et al. / Journal of Industrial and Engineering Chemistry 20 (2014) 1126–11321128
The fixed-bed experimental set-up consisted of an Econocolumn of 1.0 cm ID and 10.0 cm length, which was filled with RMCbed. In order to assure that no flow or movement of adsorbentoccurred inside the column, the bed was washed and dried. Thevolumetric feed flow rates (1.5 and 3.0 ml/min) were varied andmaintained throughout the experiments using a peristaltic pump.The PD solutions were passed in down-flow mode through theRMC bed at different bed heights (1.5 and 3.0 cm) and concentra-tions in the range of 10–20 mg/L.
2.4. Modeling of fixed-bed adsorption
The PD adsorption on the RMC surfaces was described using thetwo most widely used adsorption models: Thomas model [30] ismostly used for the calculation of maximum adsorption capacity ofadsorbent and Yoon–Nelson model [31] give assumption of 50%adsorbate breakthrough time.
2.4.1. Thomas model
One of the most widely used models was developed by Thomasin 1944 and is used to predict breakthrough parameters [30]. Theadsorption capacity of the adsorbent can be calculated by theThomas model, which is helpful in the successful design of theadsorption process [32]. The nonlinear expression of the Thomasmodel for fixed-bed adsorption is given as [33]:
C
C0¼ 1
1 þ exp ðkthq0m=yÞ � kthC0t½ � (2)
where kth is the Thomas rate constant (ml/min.mg), q0 theequilibrium PD uptake per g of adsorbent (mg/g), m the amount ofadsorbent (g), y the volumetric flow rate (ml/min) and t the time inminutes. The Thomas parameters kth and q0 can be determinedusing nonlinear regression by plotting C/C0 versus t.
2.4.2. Yoon–Nelson model
The decrease in adsorption probability for an adsorbatemolecule is directly proportional to the adsorbate adsorptionand adsorbate breakthrough on the adsorbent surface [31]. Thismodel does not require the details of the type of adsorbent,characteristic of adsorbate or physical properties of the fixed-bed.The Yoon–Nelson nonlinear equation is expressed as [33]:
C
C0¼ 1
1 þ exp½kynðt � tÞ� (3)
where kyn is the Yoon–Nelson rate constant (ml/min), t the timerequired for 50% adsorbate breakthrough (min) and t the
Fig. 1. (a and b) SEM imag
breakthrough time in minutes. The parameters kyn and t can bedetermined using nonlinear regression by plotting C/C0 versus t.
3. Results and discussion
3.1. Characterization of RMC
The elemental composition, moisture content, ash content,apparent density, and pore size of the RMC were analyzed and theresults are summarized in Table 2. The low ash content (4.78%)indicates the overall activity and efficiency of the material. Thesurface morphology of the RMC was revealed by SEM and ispresented in Fig. 1(a and b). SEM micro images of different particlesin the solid mixture gave an impression of carbon-tubules with apore size (2.31 nm) of a mesoporous material range (i.e., 2–50 nm).
The pHzpc value was 5.48. The surface functionality of RMC wascharacterized using IR spectroscopy and the possible functionalcharacteristics were assigned and are summarized in Table 3. Thepotentiometric titration plot of pH vs. zeta potential (mV), FTIR andEDX spectra of RMC are presented in supplementary data (Fig. S1a–c).
3.2. Batch experiments
The batch adsorption of the three PD solutions on RMC wasconducted at different contact times and 5 h was considered as theequilibrium time because the adsorption capacity did not changesignificantly after 5 h. The effect of the initial concentration of thePD solution on adsorption was observed at the optimizedequilibrium time. The Langmuir–Freundlich model was found tobest represent the equilibrium data among Langmuir, Freundlich,and Langmuir–Freundlich isotherm models (data not shown),suggesting heterogeneous surface adsorption of PD on RMCsurface. The isotherm parameters and maximum adsorption
es of carbon-tubules.

Table 3Surface IR frequency characteristics of RMC.
Observed peak(s) (/cm) Bond-type Surface functional group(s) type
3386(s,br)str BBOH Phenolics
2918(s,m)str BBC–H Aliphatic hydrocarbons
2849str
2160(w; small but exposed)str BBC55C–C= Conjugated diene
1977(w)str BBC–H Phenyl substitution overtones
1608(s,m)str
757(w)bend BBC–H Phenyl ring substitution band
1441(v)str BBC55C Aromatic rings
1700(w)str C55O Ketones
1179(m)str BBC–O Aldehyde
1035(m)str BBC–O
1329(m)str BBC–N Amines
s: Sharp; br: broad; w: weak; m: medium; v: variable; str: stretching.
Table 4Langmuir–Freundlich isotherm parameters.
Isotherm Parameters IB NP CA
Langmuir–Freundlich qm 22.672 17.712 9.744
k 0.078 0.066 0.060
n 1.833 1.167 1.543
R2 0.998 0.979 0.981
x2 0.134 0.533 0.254
S.P. Dubey et al. / Journal of Industrial and Engineering Chemistry 20 (2014) 1126–1132 1129
capacity of RMC at varying initial PD concentrations was obtainedfrom Langmuir–Freundlich isotherm curve (Fig. 2). The estimatedisotherm model parameters and correlation coefficients arepresented in Table 4.
3.3. Fixed-bed PD adsorption
The adsorption dynamic properties such as the effect of flowrate, bed height and initial pharmaceutical concentration on thebreakthrough curve were evaluated. The total adsorption in thecolumn for a specific feed concentration was equal to the areaunder the breakthrough curve.
The effects of initial concentration on PD adsorption wereobserved. The breakthrough curves were obtained at differentinitial PD concentrations from 10 to 20 mg/L at 1.5 ml/min flowrate on 1.5 cm RMC bed. Fig. 3 shows the breakthrough curves atdifferent initial PD concentrations for IB, NP, and CA, respectively.In all the cases, the breakthrough time decreased with increasinginitial concentration due to the rapid saturation of the activebinding sites available on the RMC surfaces at higher initial feedconcentrations. Breakthrough occurred after 840 and 180 min atinitial IB concentration of 10 and 20 mg/L, after 540 and 120 min atinitial NA concentration of 10 and 20 mg/L and after 420 and120 min at initial CA concentration of 10 and 20 mg/L, respectively.
The flow rate for PD adsorption was varied from 1.5 to 3 ml/min,while the initial PD concentration and bed height were keptconstant at 10 mg/L and 1.5 cm, respectively. The breakthroughcurves at different flow rates for IB, NP, and CA adsorption are
0 4 8 12 16 20 24 28 32 36
0
5
10
15
20 IB
NP
CA
L-F
qe
(mg
/g)
Ce (mg/L)
Fig. 2. Langmuir–Freundlich isotherm curve for PD adsorption.
provided in supplementary figure S2. The breakthrough timedecreased with increasing flow rate because of the sufficient timefor the adsorption process at lower flow rate, but not at the higherflow rate, and the ease with which the column bed becamesaturated. In case of IB adsorption, breakthrough occurred after300 min at 3 ml/min flow rate. At the same flow rate, thebreakthrough time was 180 and 120 min for NP and CA adsorption,respectively, which is lower than the breakthrough point found atthe lower flow, which was discussed in the previous paragraph forthe same condition.
The performances of breakthrough point for PD adsorptionwere observed at different RMC bed depths of 1.5 and 3.0 cm,keeping the flow rate and initial feed concentration constant at1.5 ml/min and 10 mg/L (supplementary figure S3). For all threePD adsorptions, the breakthrough time was increased for higherbed length due to the increase in residence time. Thebreakthrough curve of the longer bed length took a longer timeto get saturated, which increased the breakthrough time as well.For IB, breakthrough was observed after 1740 min at 3.0 cm bedlength, which is higher than appeared at 1.5 cm bed length(840 min). In case of NP and CA adsorption, breakthroughappeared after 1680 and 1620 min for 3.0 cm RMC bed,respectively.
3.4. Estimation of adsorption parameters
The fixed-bed operational conditions strongly influenced thePD adsorption on the RMC bed. The important parameters of theprocess are adsorption capacity at breakthrough time (qb),adsorption capacity at saturation time (q), length of mass transferzone (MTZ) and fractional bed utilization (FBU). The amounts of PDretained in the RMC bed to the point of breakthrough (qb) untilsaturation (q) were obtained by mass balance using the columndata. The area under the curve (1 � C/C0) to the point ofbreakthrough is proportional to qb and the saturation of the bedis proportional to q. Adsorption capacities at breakthrough andsaturation time were calculated by Eqs. (4) and (5), respectively[34].
qb ¼C0Q
1000m
� �Z tb
01 � C
C0
� �dt (4)
q ¼ C0Q
1000m
� �Z t
01 � C
C0
� �dt (5)
where Q is the volumetric flow rate (ml/min), m the adsorbentquantity (g), tb the breakthrough time (min), t the bed saturationtime (min), and C and C0 are the final and initial PD concentrations.The values of adsorption capacities for IB, NP and CA adsorption onthe RMC fixed-bed at breakthrough and saturation time werecalculated and are presented in Table 5.
The ratio of qb/q can be used to calculate MTZ according toEq. (6).
MTZ ¼ 1 � qb
q
� �D (6)

Fig. 3. (a–c) Breakthrough curve of (a) IB; (b) NP; and (c) CA adsorption at different
initial PD concentrations.
Table 5Adsorption capacities (qb, q), MTZ and FBU values for PD adsorption.
PDs Parameters 10 mg/L 20 mg/L 3 ml/min 3 cm
IB qb (mg/g) 14.551 4.537 9.337 30.300
q (mg/g) 25.988 15.527 17.222 46.139
MTZ (cm) 0.660 1.062 0.687 1.029
FBU 0.559 0.292 0.542 0.657
NP qb (mg/g) 8.507 4.121 4.121 30.625
q (mg/g) 19.355 15.452 15.505 46.295
MTZ (cm) 0.841 1.099 1.101 1.015
FBU 0.439 0.267 0.266 0.662
CA qb (mg/g) 6.669 2.132 2.030 29.629
q (mg/g) 19.177 13.13 11.954 45.752
MTZ (cm) 0.979 1.257 1.245 1.057
FBU 0.348 0.162 0.169 0.648
S.P. Dubey et al. / Journal of Industrial and Engineering Chemistry 20 (2014) 1126–11321130
The value of MTZ calculated from this equation is the maximumvalue that corresponds to the bed depth (D). As the mass transferefficiency increases, the value decreases, eventually reaching theideal condition where MTZ is zero and the breakthrough curve is astep function [34]. The values of MTZ for IB, NP and CA adsorptionare presented in Table 5. The MTZ values are affected by thecolumn parameter.
3.5. Fixed-bed modeling of PD on RMC surface
Breakthrough curves were plotted by Eqs. (2) and (3) for theThomas and Yoon–Nelson models at different initial feedconcentrations, flow rates and bed depths for IB, NP and CAadsorption and their parameters. The Thomas rate constant (kth),adsorption capacity (q0), Yoon–Nelson rate constant (kyn), and 50%breakthrough (t) and correlation coefficients were determinedfrom the curve and are presented in Table 6.
The adsorption capacity was decreased with increasing initial IBconcentration from 10 to 20 mg/L. A similar effect was observed forthe other PD. The higher concentration of solute occupied theavailable binding sites more rapidly and the remaining adsorbateinept to bind onto adsorbent surfaces. Thus, the amount ofadsorbate adsorbed was decreased at increasing initial feedconcentration. This was due to the fast breakthrough that occurredat higher initial feed concentration with lower treated volumesince the higher initial feed concentration gradient caused a fasttransport due to the increased mass transfer coefficient [33]. Theslower transport gave the PD molecules sufficient time to bind tothe adsorption active sites, thus increasing the adsorption capacityat lower initial feed concentration.
The adsorption capacity for PD adsorption on the RMC surfaceanalyzed from the Thomas model (Table 6) showed a decrease asthe volumetric flow rate was increased from 1.5 to 3.0 ml/min. Theadsorbent surface was saturated easily with increasing volumetricflow rate, which decreased the velocity of the adsorbate passingthrough the adsorbent bed, thereby decreasing the adsorptionzone. A sharp decrease in t calculated from the Yoon–Nelsonmodel has also been reported for PD adsorption with an increase involumetric flow rate (Table 6).
Increasing bed depth of the column affects the breakthroughtime for adsorption in a fixed-bed column. The adsorption capacityincreased at higher bed depth, as the amount of adsorbent waskept constant. Columns of different diameter were used to vary thebed depth with the same amount of adsorbent. The increase in beddepth provides more active binding sites for the PD to get attachedon the RMC surface. In addition, an increase in bed depth providesthe more residence time to PD molecules to remain in contact withthe adsorbent surface, thereby increasing the exhaustion of theadsorbent bed and hence increasing the adsorption capacity athigher bed height. The maximum adsorption capacity for IBadsorption was 48.576 mg/g, as calculated from the Thomas modelat a bed depth of 3.0 cm, initial concentration 10 mg/L and flowrate 1.5 ml/min (Table 6).
3.6. Effect of pH on PD adsorption
Solution pH played a significant role in the adsorption process.Experiments were performed in the pH range of 3–9 (Fig. 4). The

Table 6Thomas and Yoon–Nelson parameters and model deviations at different operating conditions.
PDs Model Parameters 10 mg/L 20 mg/L 3 ml/min 3 cm
IB Thomas kth (ml/mg min) 0.289 0.299 0.805 0.179
q (mg/g) 28.149 17.084 19.364 48.576
x2 0.003 0.004 0.004 0.001
R2 0.969 0.963 0.969 0.991
Yoon–Nelson kyn (/min) � 10�2 0.289 0.597 0.805 0.179
t (min) 1407.458 427.092 484.079 2428.794
x2 0.003 0.004 0.005 0.001
R2 0.969 0.962 0.967 0.990
NP Thomas kth (ml/mg min) 0.305 0.243 0.592 0.216
q (mg/g) 20.806 17.219 18.115 47.668
x2 7.72E�4 0.003 0.004 6.388E�4
R2 0.993 0.968 0.965 0.995
Yoon–Nelson kyn (/min) � 10�2 0.304 0.485 0.592 0.216
t (min) 1040.286 430.494 452.891 2383.411
x2 7.70E�4 0.002 0.003 6.388E�4
R2 0.991 0.970 0.964 0.996
CA Thomas kth (ml/mg min) 0.286 0.247 0.625 0.233
q (mg/g) 20.507 14.336 13.399 46.532
x2 0.003 0.005 6.083E-4 0.001
R2 0.973 0.943 0.993 0.992
Yoon–Nelson kyn (/min) � 10�2 0.286 0.493 0.625 0.230
t (min) 1025.357 358.388 334.985 2326.612
x2 0.002 0.004 6.083E�4 0.001
R2 0.970 0.934 0.992 0.993
S.P. Dubey et al. / Journal of Industrial and Engineering Chemistry 20 (2014) 1126–1132 1131
surface of the adsorbent was highly influenced by the solution pH.Meanwhile, potentiometric titration of RMC revealed a pHzpc of5.48, which indicated that the surface charge of RMC changed frompositive to negative from pH 3 to 9, with the neutral crossover atpH 5.48. The PD removal was maximum in the pH range of 3–5. Theprobable mechanism for PD adsorption on the RMC bed ispresented below.
3.7. Mechanistic interpretation
3.7.1. Adsorbate characteristics
Adsorbate characteristics such as octanol-water coefficient andaqueous phase solubility play an important role in multi-component adsorption system and more hydrophobic PD adsorbsto a greater extent than less hydrophobic one.
3.7.1.1. Octanol–water partition coefficient of PD. The effectiveadsorption of PD on RMC surfaces may be understood in termsof the octanol–water partition coefficient (Kow) [35]. Reportedly, iflog Kow is <2.5, the compound has a low adsorption potential (i.e.,
3 4 5 6 7 8 9
0
1
2
3
4
qe
(mg/g
)
pH
IB
NP
CA
Fig. 4. Effect of pH on PD adsorption.
it does not adsorb and is not very lipophilic), if log Kow is between2.5 and 4.0, the compound has a medium adsorption potential andif log Kow is >4.0, the compound has a high adsorption potentialand is very lipophilic. The order of log Kow reported for different PDis summarized in Table 1. IB has highest log Kow with comparablylower solubility than CA. Hence, the adsorption of IB is higher onthe RMC surface. The tendency of PD molecules to adsorb is afunction of their affinity for water as compared to their affinity forthe adsorbent. The adsorption generally increases as the adsor-bate’s solubility decreases [36]. The adsorption of IB, NP and CAwere in good accord with their log Kow (IB) > (NP) > (CA).
3.7.1.2. Weak-acidic character of PD. The three selected PD consistof a combination of non-polar/non-ionizable and polar/ionizablefunctional moieties. IB, NP and CA are weak carboxylic acid PD withionizable groups. PD get stabilized by charge separation and chargedelocalized resonating structures and have bipolarity due tocarboxylic functional groups. The pKa establishes the fraction ofprotonated and deprotonated form. The weak acidity of the PD isdue to the hydrogen in the carboxylic group. PD molecules becomedissociated into their corresponding carboxylate conjugate baseand protons as the pH is increased above pKa values. The pKa of amonoprotic acid is the pH at which equal amounts of protonatedand deprotonated compounds are present. At one pH unit lowerthan the pKa, the functional groups exist predominately (>90%) inthe neutralized form, while at one pH unit higher than the pKa thefunctional groups exist predominately in the ionized form [37,38].pHzpc of the RMC was 5.48, showing that the RMC surfacesremained positive at pH lower than 5.48. The pKa values of IB, NPand CA are presented in Table 1. At pH lower than the pHzpc of RMC,all three weakly acidic PD had some deprotonated form (�10%) andwere bonded with the RMC surfaces due to the electrostaticattractions, while the remainders (�90%) in unionized form wereadsorbed due to the hydrophobic interactions.
3.8. Adsorbent characteristics
The surface morphology and shape of the developed materialwas carbon-tubules rather than a typical activated carbon

S.P. Dubey et al. / Journal of Industrial and Engineering Chemistry 20 (2014) 1126–11321132
structure. Additionally, a mesoporous material is regarded as goodfor adsorption [39,40]. We believe that being a mesoporousmaterial, RMC not only allows adsorption at the surfaces but alsoinside the large pores and increases the adsorption capacity.Surface area (224.6 m2/g) and pHzpc (5.48) played an affirmativerole in the adsorption of the PD onto the RMC surface. In addition tothat the difference in adsorption capacities was found betweenbatch (IB; 22.672 mg/g) and column (IB; 28.149 mg/g) study underthe same initial PD concentration (10 mg/L). One of the reasons forobserved discrepancies between the batch and column systemscan be due to presence of pores on the surface of RMC thatenhanced solid state diffusion relative to the batch study [41].
The analysis of FTIR spectra showed characteristic IR bands ofphenol-like compounds (3386/cm), aromatic rings weak band(757/cm) and overtone frequencies (1977 and 1608/cm), aliphatichydrocarbons stretching vibrations (2918 and 2849/cm) andketonic groups (1700/cm). An aldehydic group was confirmedwith C–H absorption at 2849/cm and C55O absorption at 1700/cm.The weak, small but exposed absorption band at 2160/cm wasattributed to conjugate diene moieties (–C55C–C55C–) obtainedfrom vitamin-skeleton and/or unsaturated double bond structures(Table 3). Due to the diverse functional groups, the RMC surfaceshowed ‘variable charge active sites’ (as a function of pH) andformed weak electrostatic forces for PD uptake on the RMC surface.
4. Conclusion
In this study, a simple but efficient strategy was developed toproduce novel RMC with a mesoporous tubular structure usingchemical and physical activation. Surface characteristics such aspHzpc, mesoporosity, high surface area and surface-derivedfunctional groups of RMC potentially make this material suitablefor adsorption. The adsorption of three emerging PD (IB, NP and CA)was studied. Thomas and Yoon–Nelson mathematical models wereapplied to interpret the breakthrough properties. The adsorptioncapacities calculated from the Thomas model showed the highestadsorption for IB on the RMC packed fixed-bed column, which wasattributed to high log Kow and low aqueous solubility of IB. Theweak-acidic character of PD and surface property of adsorbent alsoaccelerated the adsorption of PD on the RMC surface.
Acknowledgements
This work was supported by a grant from the Future ChallengeProject funded by Ulsan National Institute of Science andTechnology (No. 1.120018.01) and partial support from MarieCurie Grant MKTD-CT-2006-042637 and the School of theEnvironment, Nanjing University, PR China is also acknowledged.
Appendix A. Supplementary data
Supplementary data associated with this article can be found, in
the online version, at doi:10.1016/j.jiec.2013.06.051.
References
[1] G. Mertxell, P. Mira, B. Damia, Analytical Chemistry 81 (2009) 898.[2] O.P. Togunde, K.D. Oakes, M.R. Servos, J. Pawliszyn, Environmental Science &
Technology 46 (2012) 5302.[3] S.K. Ritter, Chemical Engineering News 84 (2006) 37.[4] WHO, Pharmaceuticals in Drinking-water, WHO/HSE/WSH/11.05, 2011.[5] E. Vulliet, C. Cren-Olive, M.-F. Grenier-Loustalot, Environmental Chemistry Letters
9 (2011) 103.[6] X.S. Miao, B.G. Koenig, C.D. Metcalfe, Journal of Chromatography A 952 (2002) 139.[7] L. Wang, G.G. Ying, J.L. Zhao, X.B. Yang, F. Chen, R. Tao, S. Liu, L.J. Zhou, Science of
Total Environment 408 (2010) 3139.[8] J.W. Kim, H.S. Jang, J.G. Kim, H. Ishibashi, M. Hirano, K. Nasu, N. Ochikawa, Y.
Takao, R. Shinohara, K. Arizono, Journal of Health Science 55 (2009) 249.[9] C. Nebot, S.W. Gibb, K.G. Boyd, Analytica Chimica Acta 598 (2007) 87.
[10] T.A. Ternes, Water Research 32 (1998) 3245.[11] M.L. Farre, I. Ferrer, A. Ginebreda, M. Figueras, L. Olivella, L. Tirapu, M. Vilanova, D.
Barcelo, Journal of Chromatography A 938 (2001) 187.[12] S.Ollers,H.P.Singer,P.Fassler,S.R.Muller,JournalofChromatographyA911(2001)225.[13] R. Andreozzi, M. Raffaele, P. Nicklas, Chemosphere 50 (2003) 1319.[14] F. Stuer-Lauridsen, M. Birkved, L.P. Hansen, H.-C. Holten Lutzhoft, B. Halling-
Sorensen, Chemosphere 40 (2000) 783.[15] T.A. Ternes, M. Meisenheimer, D. Mcdowell, F. Sacher, H.-J. Brauch, B. Haist-Gulde, G.
Preuss,U.Wilme,N.Zulei-Seibert,EnvironmentalScience&Technology36(2002)3855.[16] M. Petrovic, E. Eljarrat, M.J.L. De Alda, D. Barcelo, Trends in Analytical Chemistry
20 (2001) 637.[17] I. Ali, V.K. Gupta, Nature Protocols 1 (2007) 2661.[18] A.D. Dwivedi, K. Gopal, R. Jain, Chemical Engineering Journal 168 (2011) 1279.[19] J.C. Crittenden, S. Sanongraj, J.L. Bulloch, D.W. Hand, T.N. Rogers, T.F. Speth, M.
Ulmer, Environmental Science & Technology 33 (1999) 2926.[20] C. Liang, Z. Li, S. Dai, Angewandte Chemie International Edition 47 (2008) 3696.[21] Q. Sui, J. Huang, Y. Liu, X. Chang, G. Ji, S. Deng, T. Xie, G. Yu, Journal of
Environmental Science 23 (2011) 177.[22] K. Nakagawa, A. Namba, S.R. Mukai, H. Tamon, P. Ariyadejwanich, W. Tanthapa-
nichakoon, Water Research 38 (2004) 1791.[23] J. Liangliang, L. Fengling, X. Zhaoyi, Z. Shourong, Z. Dongqiang, Environmental
Science Technology 44 (2010) 3116.[24] S.P. Dubey, A.D. Dwivedi, K. Gopal, M. Sillanpaa, Chemical Engineering Journal 165
(2010) 537.[25] USDA, ARS, National Genetic Resources Program. Germplasm Resources Informa-
tion Network – (GRIN), National Germplasm Resources Laboratory, Beltsville,Maryland, 2006 (last updated on 14/01/2006).
[26] N. Nakada, K. Komori, Y. Suzuki, Environmental Sciences 12 (2005) 359.[27] A.C. Alder, A. Bruchet, M. Carballa, M. Clara, A. Joss, D. Loffler, C.S. McArdell, K.
Miksch, F. Omil, T. Tuhkanen, T.A. Ternes, in: T.A. Ternes, A. Joss (Eds.), Con-sumption and Occurrence, 15, IWA Publishing, London, 2006.
[28] T.X. Bui, H. Choi, Journal of Hazardous Materials 168 (2009) 602.[29] ASTM, Refractories; Carbon and Graphite Products; Activated Carbon, Annual
Book of ASTM Standards, 1995 5.01..[30] H.C. Thomas, Journal of the American Chemical Society 66 (1944) 1664.[31] Y. Yoon, J. Nelson, American Industrial Hygiene Association Journal 45 (1984) 509.[32] C.B. Lopes, E. Pereira, Z. Lin, P. Pato, M. Otero, C.M. Silva, A.C. Duarte, J. Rocha,
Microporous and Mesoporous Materials 145 (2011) 32.[33] Z. Aksu, G.F. Ferda, Process Biochemistry 39 (2004) 599.[34] C.J. Geankoplis, Transport Process and Unit Operations, 3rd ed., PTR Prentice Hall,
USA, 1993.[35] D.C. Luehrs, T.N. Rogers, Correlation of the limiting partition coefficient of organic
solutes between water and activated carbon with the octanol/water partitioncoefficient, in: Great Lakes Regional American Chemical Society Meeting, Normal,IL, May 20, 1996.
[36] Weber W.J.Jr., Physicochemical Processes, Wiley-Interscience, New York, 1972.[37] D.G. Watson, Pharmaceutical Analysis: A Textbook for Pharmacy Students and
Pharmaceutical Chemists, 2nd ed., Churchill Livingstone, Edinburgh, 1999.[38] O. Lorphensri, J. Intravijit, D.A. Sabatini, T.C.G. Kibbey, K. Osathaphan, C. Saiwan,
Water Research 40 (2006) 1481.[39] V. Fierro, V. Torne-Fernandez, A. Celzard, Microporous and Mesoporous Materials
92 (2006) 243.[40] M. Stacy, F. Pasquale, J. Mietek, Journal of the American Chemical Society 130
(2008) 15210.[41] E.Lopez,B.Soto,M.Arias,A.Nunez,D.Rubinos,M.T.Barral,WaterResearch32(1998)1314.
Copyright © 2022 FDOKUMEN