Raman spectroscopic study of the phosphate mineral churchite-(Y) YPO4·2H2O
26
This is the author version published as: QUT Digital Repository: http://eprints.qut.edu.au/ Frost, Ray L. and Sejkora, Jirí and Keeffe, Eloise C. and Plasil, Jakub and Cejka, Jirí and Bahfenne, Silmarilly (2010) Raman spectroscopic study of the phosphate mineral Churchite-(Y) YPO4.2H2O. Journal of Raman Spectroscopy, 41(2). pp. 202-206. © Copyright 2010 John Wiley & Sons
-
Upload
independent -
Category
Documents
-
view
7 -
download
0
Transcript of Raman spectroscopic study of the phosphate mineral churchite-(Y) YPO4·2H2O
This is the author version published as:
QUT Digital Repository: http://eprints.qut.edu.au/
Frost, Ray L. and Sejkora, Jirí and Keeffe, Eloise C. and Plasil, Jakub and Cejka, Jirí and Bahfenne, Silmarilly (2010) Raman spectroscopic study of the phosphate mineral Churchite-(Y) YPO4.2H2O. Journal of Raman Spectroscopy, 41(2). pp. 202-206.
© Copyright 2010 John Wiley & Sons
1
Raman spectroscopic study of the phosphate mineral Churchite-(Y) YPO4.2H2O
Ray L. Frost, 1 Jiří Sejkora, 2 Jakub Plášil, 2 Jiří Čejka, 1,2 Eloise C. Keeffe 1
1 Inorganic Materials Research Program, School of Physical and Chemical Sciences,
Queensland University of Technology, GPO Box 2434, Brisbane Queensland 4001,
Australia.
2 National Museum, Václavské náměstí 68, CZ-115 79 Praha 1, Czech Republic.
ABSTRACT
Raman spectroscopy has been used to study the rare earth mineral
churchite-(Y) of formula (Y,REE)(PO4) ·2H2O. The mineral contains
yttrium and depending on the locality, a range of rare earth metals. The
Raman spectra of two churchite-(Y) mineral samples from Jáchymov and
Medvědín in the Czech Republic were compared with the Raman spectra of
churchite-(Y) downloaded from the RRUFF data base. The Raman spectra
of churchite-(Y) are characterized by an intense sharp band at 975 cm-1
assigned to the ν1 (PO4)3- symmetric stretching mode. A lower intensity
band observed at around 1065 cm-1 is attributed to the ν3 (PO43-)
antisymmetric stretching mode. The (PO43-) bending modes are observed
at 497 cm-1 (ν2) and 563 cm-1(ν4). Some small differences in the band
positions between the four churchite-(Y) samples from four different
localities were found. These differences are possible to explain as different
compositions of the churchite-(Y) minerals.
KEYWORDS: churchite-(Y), phosphate, arsenate, yttrium, molecular water, hydrogen
bond lengths, Raman spectroscopy
INTRODUCTION
Author to whom correspondence should be addressed ([email protected])
2
The mineral churchite-(Y) is a rare earth hydrated phosphate of ideal formula
YPO4.2H2O which may contain neodymium, erbium and other rare earth metals 1-4.
Churchite-(Y) was originally described by A. H. Church in 1865 and named by C. G.
Williams in the same year. The specimens were collected from a now unknown occurrence in
Cornwall (Great Britain). In 1922, Laubmann described a phosphate of Y from Nitzelbuch
mine, Auerbach, Bavaria, under the name weinschenkite 5.The identity of churchite-(Y) and
weinschenkite were described by Claringbull and Hey 6. Churchite-(Y) is now known from
more than 40 localities worldwide. It occurs as secondary mineral with yttrium and REE
weathered or biochemically leached from trace amounts in surrounding rocks, e.g. at
pegmatites, carbonates, guano-related deposits, hydrothermal mineral deposits etc 7,8. The
mineral churchite-(Y) (Y,REE)(PO4) ·2H2O is a hydrated phosphate of Y and RE elements
and has monoclinic symmetry with space group I2/a . Its crystal structure was solved by
Kohlmann et al. 9. Infrared spectra of churchite-(Y) were published by Sejkora et al. 5, Onac
et al. 8 and Plášil et al. 15.
Churchite-(Y) was originally described by A. H. Church in 1865 and named by C. G.
Williams in the same year. The specimens were collected from a now unknown occurrence in
Cornwall (Great Britain). In 1922, Laubmann described a phosphate of Y from Nitzelbuch
mine, Auerbach, Bavaria, under the name weinschenkite 5. The identity of churchite-(Y) and
weinschenkite were described by Claringbull and Hey 6. Churchite-(Y) is now known from
more than 40 localities worldwide. It forms as secondary mineral with yttrium and REE
weathered or biochemically leached from trace amounts in surrounding rocks, e.g. at
pegmatites, carbonates, guano-related deposits, hydrothermal mineral deposits etc. The
mineral churchite-(Y) (Y,REE)(PO4) . 2H2O is a hydrated phosphate of Y and RE elements
and has monoclinic symmetry with space group I2/a. Its crystal structure was solved by
Kohlmann et al. 3 Infrared spectra of churchite-(Y) were published by Sejkora et al. 5 and
Onac et al. 8 repeated paragraph
Raman spectroscopy has been used to a certain extent in the characterisation of
mineral species 11,12. In aqueous systems, Raman spectra of phosphate oxyanions show a
symmetric stretching mode (ν1) at 938 cm-1, the antisymmetric stretching mode (ν3) at 1017
cm-1, the bending mode (ν2) at 420 cm-1 and the bending mode (ν4) mode at 567 cm-1 12-14.

3
The vibrational spectra of some phosphate minerals such as pseudomalachite and
reichenbachite show shifts in these values from the positions in aqueous media. The ν1
symmetric stretching mode can be observed at 953 cm-1, ν2 at 422 and 450 cm-1, ν3 at 1025
and 1096 cm-1, while the ν4 mode can be observed at 482, 530, 555 and 615 cm-1. Libethenite
vibrational modes occur at 960 (ν1), 445 (ν2), 1050 (ν3) and 480, 522, 555, 618 and 637cm-1
(ν4). Cornetite vibrational modes occur at 960 (ν1), 415 and 464 (ν2), 1000, 1015 and 1070
(ν3) and 510, 527, 558, 582, 623 and 647 cm-1 (ν4). RAY - ADD RELATED
CORRESPONDING REFERENCES TO PSEUDOMALACHITE, REICHENBACHITE,
LIBETHENITE AND CORNETITE SPECTRA!!! - e.g. SOME YOUR
SELFCITATIONS MAY BE PROBABLY CONNECTED WITH THIS INFORMATION
AND THEREFORE INCLUDED HERE. THIS WOULD BE BETTER THAN GIVE
THEM (ALL) ON P. 4.
The aim of this paper is to report the Raman spectra of churchite-(Y) and compare
with published infrared spectrum together with inferring some relations to the crystal
chemistry of phosphate type minerals. The paper follows the systematic research on Raman
and infrared spectroscopy of secondary minerals containing oxy-anions formed in the
oxidation zone.
EXPERIMENTAL
Minerals
The studied samples of the mineral churchite-(Y) were found at the Medvědín
deposit15, the Krkonoše Mountains, northern Bohemia, Czech Republic (labelled M), and at
the vein Geister, Rovnost deposit, the Jáchymov ore district, the Krušné hory Mountains,
northern Bohemia, Czech Republic (labelled J). These samples are deposited in the
mineralogical collections of the National Museum, Prague. The samples were analysed for
phase purity by X-ray powder diffraction and no minor significant impurities were found.
Their refined unit-cell parameters for monoclinic space group I2/a are a=5.610(4),
b=15.082(6), c=6.186(5) Å, β= 115.39(4)o, V= 472.8(7) Å3 (M), and a=5.589(4),
b=15.042(4), c=6.299(5) Å, β= 117.75(4)o, V= 468.7(5) Å3 (J), are comparable with the data
published for this mineral phase7.

4
The minerals were analysed by electron microprobe (Cameca SX100, WD mode) for
chemical composition. The results (M - mean of 11 point analysis) are CaO 1.47, PbO 1.35,
Y2O3 28.30, La2O3 0.34, Ce2O3 2.64, Pr2O3 0.56, Nd2O3 3.88, Sm2O3 2.61, Eu2O3 2.00,
Gd2O3 4.85, Tb2O3 0.77, Dy2O3 3.71, Ho2O3 0.57, Er2O3 1.63, Tm2O3 0.19, Yb2O3 0.90,
Lu2O3 0.07, P2O5 28.43, As2O5 0.58, SO3 0.16, H2Ocalc. 14.69 sum 99.70 wt. %. resulting to
empirical formula: (Y0.61Gd0.07Nd0.06Ca0.06Dy0.05Sm0.04Ce0.04Eu0.03 Er0.02Yb0.01Ho0.01
Pb0.01Tb0.01Pr0.01La0.01)Σ1.04 [(PO4)0.98(AsO4)0.01]Σ0.99·2.00H2O; (J - mean of 3 point analysis
recalculated to total 100 wt. %) are CaO 1.26, PbO 0.33, Y2O3 34.19, La2O3 0.15, Ce2O3
0.66, Pr2O3 0.39, Nd2O3 2.34, Sm2O3 1.25, Eu2O3 1.10, Gd2O3 3.15, Tb2O3 0.61, Dy2O3 3.65,
Ho2O3 0.90, Er2O3 2.03, Tm2O3 0.42, Yb2O3 1.31, Lu2O3 0.41, Al2O3 0.25, SiO2 0.55, P2O5
29.68, H2Ocalc. 15.39, sum 100.00 wt. % and empirical formula
(Y0.71Ca0.05Dy0.05Gd0.04Nd0.03Sm0.02Yb0.02Er0.02Ce0.01
Eu0.01Ho0.01Tb0.01Pr0.01Al0.01Tm0.01)Σ1.01[(PO4)0.98(SiO4)0.02]Σ1.00·2.00H2O. The basis of
recalculating is (P+As+S+Si) = 1.00 apfu; water contents were calculated on the basis of
theoretical content H2O = 2 pfu.
The Raman spectra of two churchite-(Y) minerals from Vesuvius, Virginia, USA (V)
and Indian Mountain, Cherokee County, Alabama, USA (IM) were also downloaded from the
RRUFF data base (http://rruff.info/churchite-(Y)/display=default/). The spectra were used as
is and were not modified in any way.
Raman spectroscopy
The crystals of churchite-(Y) were placed and oriented on the stage of an Olympus
BHSM microscope, equipped with 10x and 50x objectives and part of a Renishaw 1000
Raman microscope system, which also includes a monochromator, a filter system and a
Charge Coupled Device (CCD). Further details have been published 17-21. – MANY
SELFREFERENCES??? ARE ALL NECESSARY?
RESULTS AND DISCUSSION
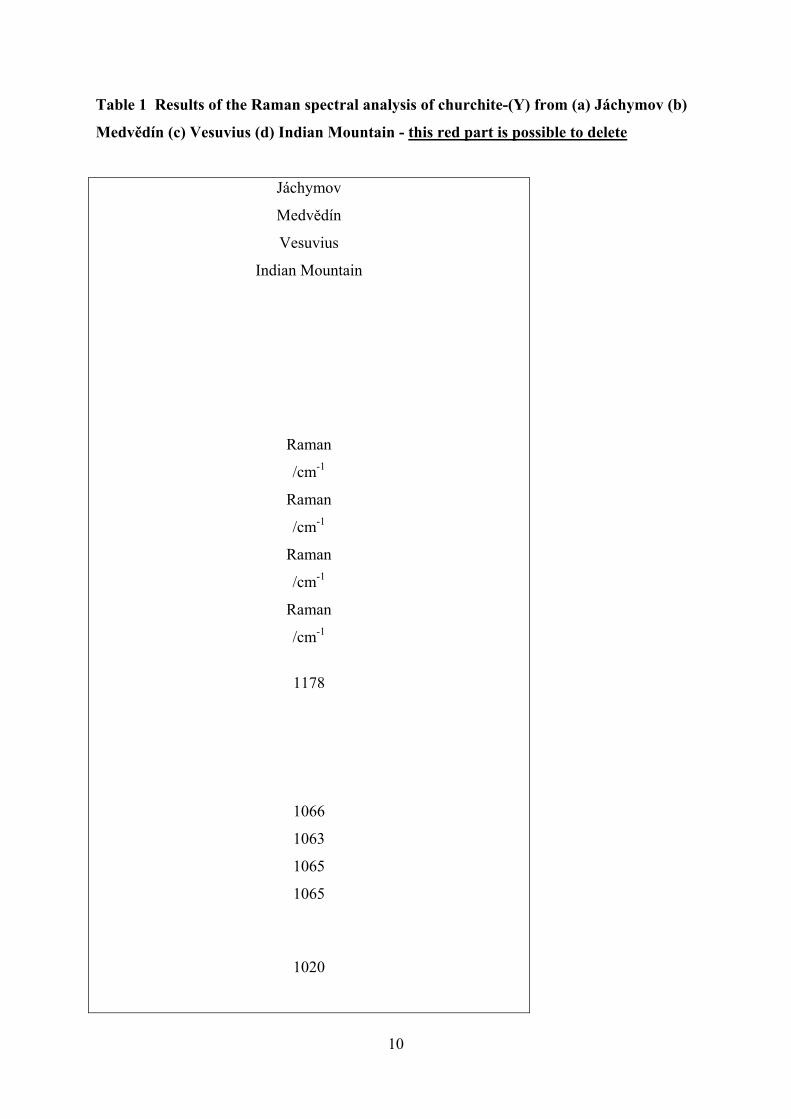
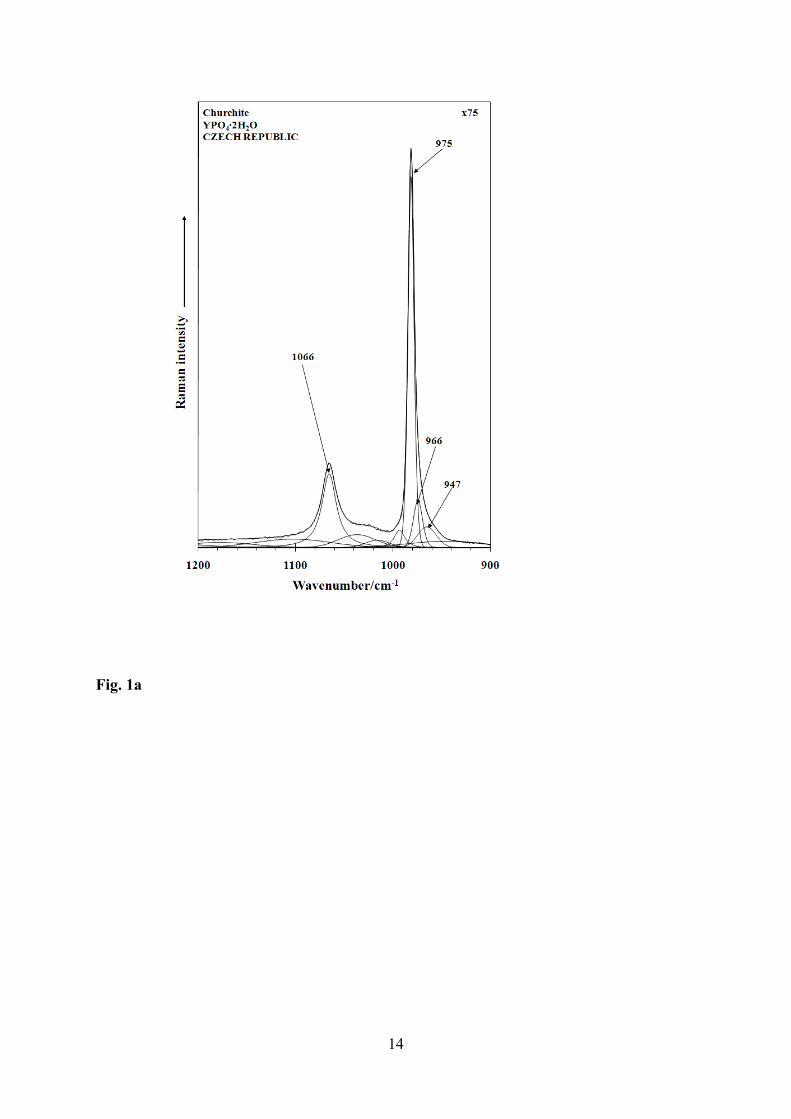
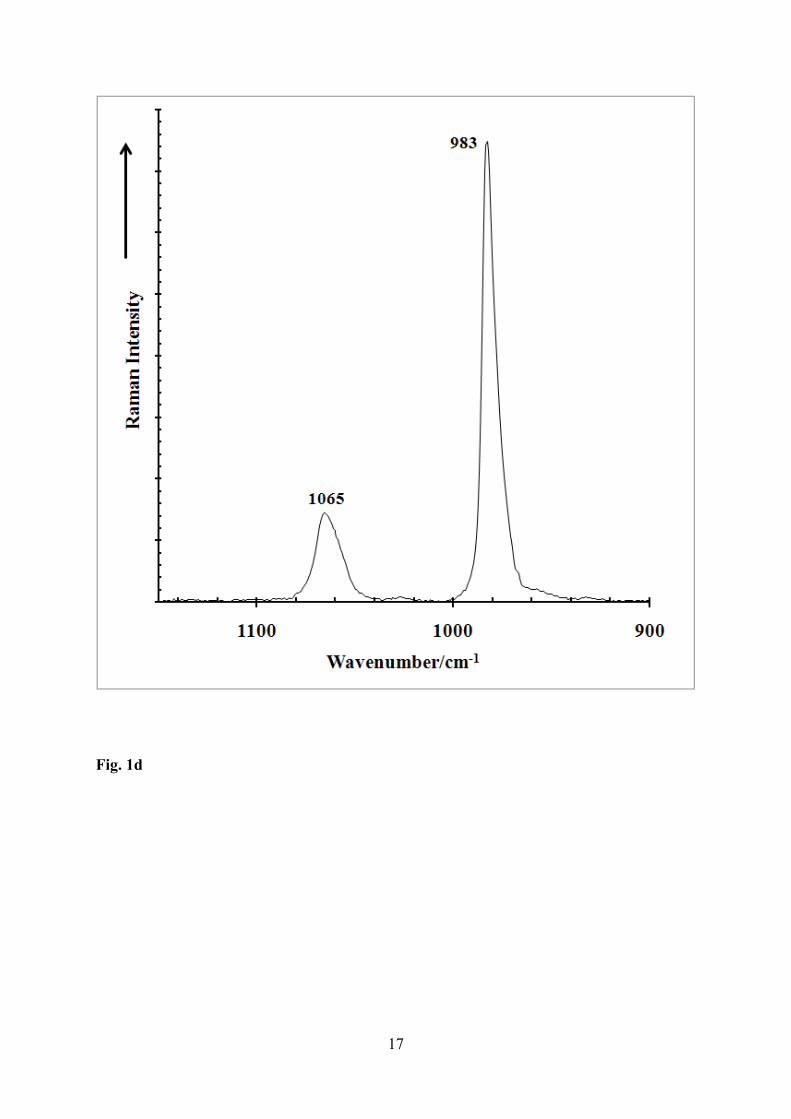
The Raman spectra of the four churchite-(Y) mineral samples from (a) Jáchymov (J)
(b) Medvědín (M) (c) Vesuvius (V) (d) Indian Mountain (IM) in the 900 to 1200 cm-1 region
are shown in Fig. 1. The results of the Raman spectroscopic analysis are reported in Table 1.

5
The spectra are characterised by very intense bands at 975 cm-1 (J), 975 cm-1 (M), 983 cm-1
(V) and 983 cm-1 (IM). The difference in the spectra from the Czech samples and the data
from the Rruff data base may be due to a calibration difference. This band at 975 cm-1 is
attributed to the ν1 (PO43-) symmetric stretching mode. In the Raman spectra of the Vesuvius
and Indian Mountain churchite-(Y) samples, a band at 1065 cm-1 is observed and this is
attributed to the ν3 (PO43-) antisymmetric stretching mode. The same band is observed at
1066 cm-1 (J) and 1063 cm-1 (M).
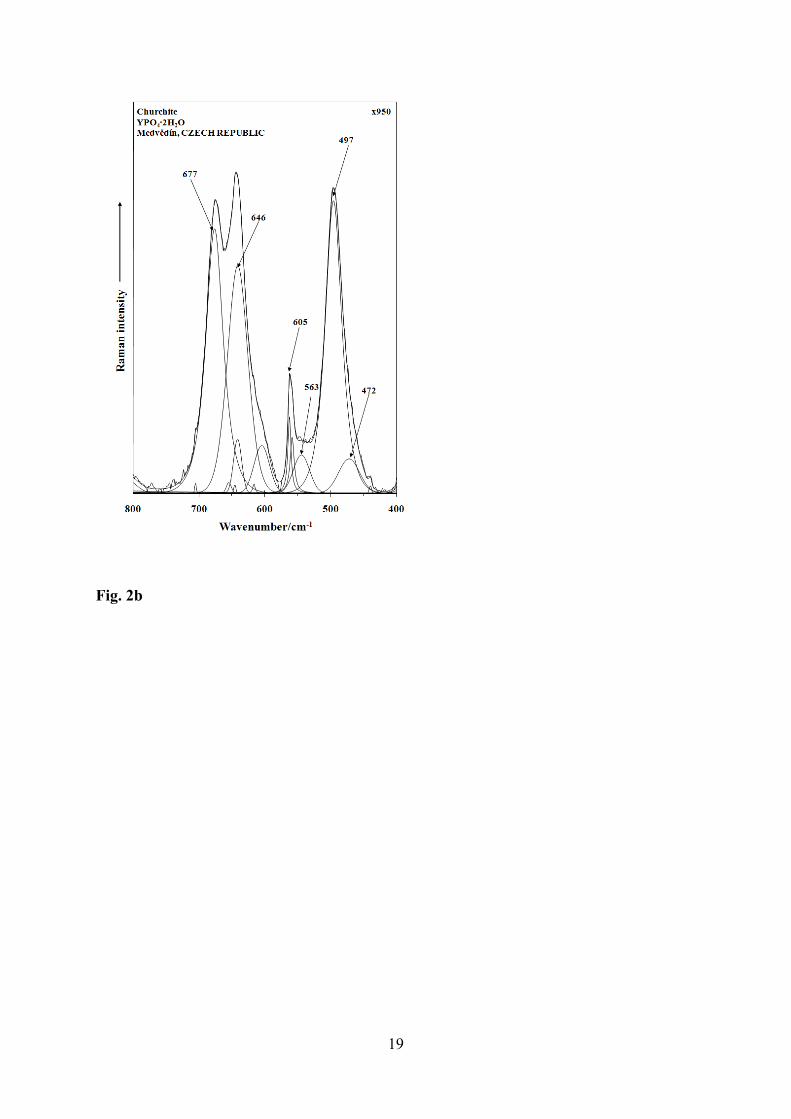
The Raman spectra of churchite-(Y) (J,M) in the 400 to 800 cm-1 region are shown in
Fig. 2a and b. The Raman spectra of the churchite-(Y) (V,IM) in the 100 to 800 cm-1 region
are reported in Figs. 2c and 2d. Besides the symmetric stretching vibration, the other most
intense bands belong to the OPO bending mode (ν2). The intense band at 497 cm-1 (J), 497
cm-1 (M), 496 cm-1 (V), 495 cm-1 (IM) is assigned to this ν2 vibration. A sharp Raman band
observed at 563 cm-1 (J) 605 cm-1 (M), 563 cm-1 (V), 564 cm-1 (IM) is attributed to the ν4
(PO43-) bending mode. Intense Raman bands are also observed at 645 and 680 cm-1 (J) and at
646 and 677 cm-1 (M). Bands in these positions are of very low intensity for the Vesuvius and
Indian Mountain churchite-(Y) minerals. A possibility for the assignment of these bands is to
water librational modes, although the band position for the librational modes might be
expected at higher wavenumbers.
A comparison may be based on that with other phosphate containing minerals. For
pseudomalachite Raman bands are observed at 482 and 452 cm-1 of about equal intensity.
The two ν2 bands for pseudomalachite were reported by Ross 22 were reported at 450 and 422
cm-1. Cornetite Raman spectra shows an intense band at 433 cm-1 with minor components at
463 and 411 cm-1. Ross 22 reported two bands at 464 and 411 cm-1 for cornetite. The
variation between the spectral results may be attributed to orientation effects and the intensity
of different bands will depend on which crystal face is scattering the Raman signal. The
Raman spectrum of libethenite showed a single band for ν2 at 450 cm-1. A number of bands in
the region 480 to 680 cm-1 selected mineral phases containing phosphates were reported by
Ross 21 for selected phosphates. He attributed these bands to the ν4 modes. We observe
similar number of bands for the churchite-(Y) minerals (J,M). The Raman spectrum of
pseudomalachite exhibits bands at 481, 517, 537 and 609 cm-1. The ν4 modes for cornetite
were observed at 487, 518, 541 and 570 cm-1. Bands were observed for libethenite at 556,

6
582, 626 and 645 cm-1. These band positions are in good agreement with the values reported
by Ross 22.
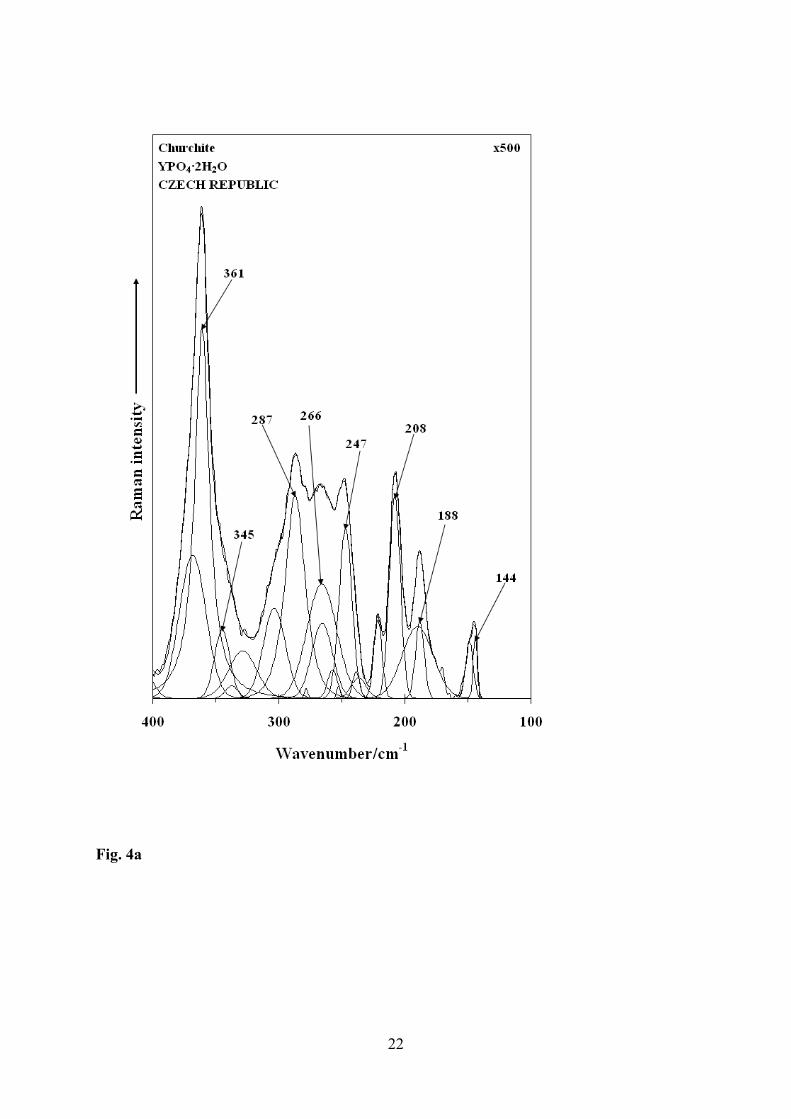
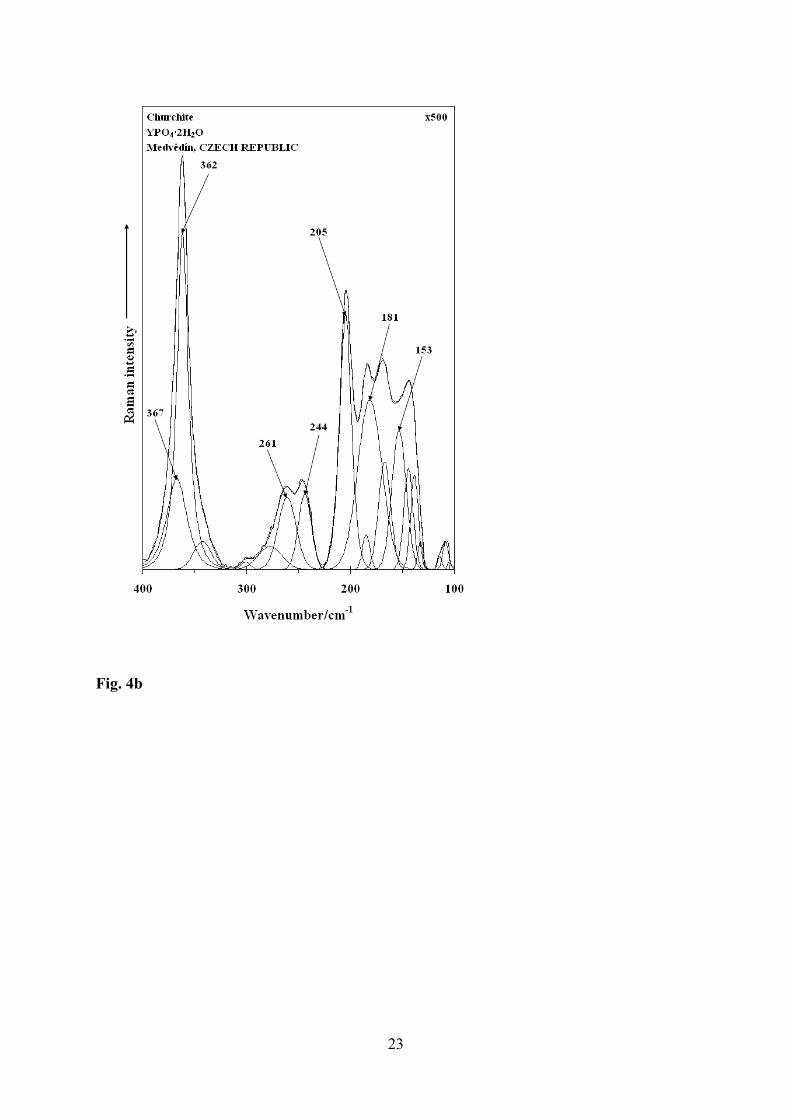
Raman spectra of churchite-(Y) (J,M) in the 100 to 400 cm-1 region are shown in Fig.
4a and 4b. Intense Raman bands are observed at ~361 cm-1. The band is attributed to Y-O
stretching vibrations. Other Raman bands are observed at 144, 188, 208, 247, 266 and 287
cm-1 (J). These bands are described simply as lattice vibrations. For sample (M), Raman
bands are observed at 153, 181, 205, 244 and 261 cm-1.
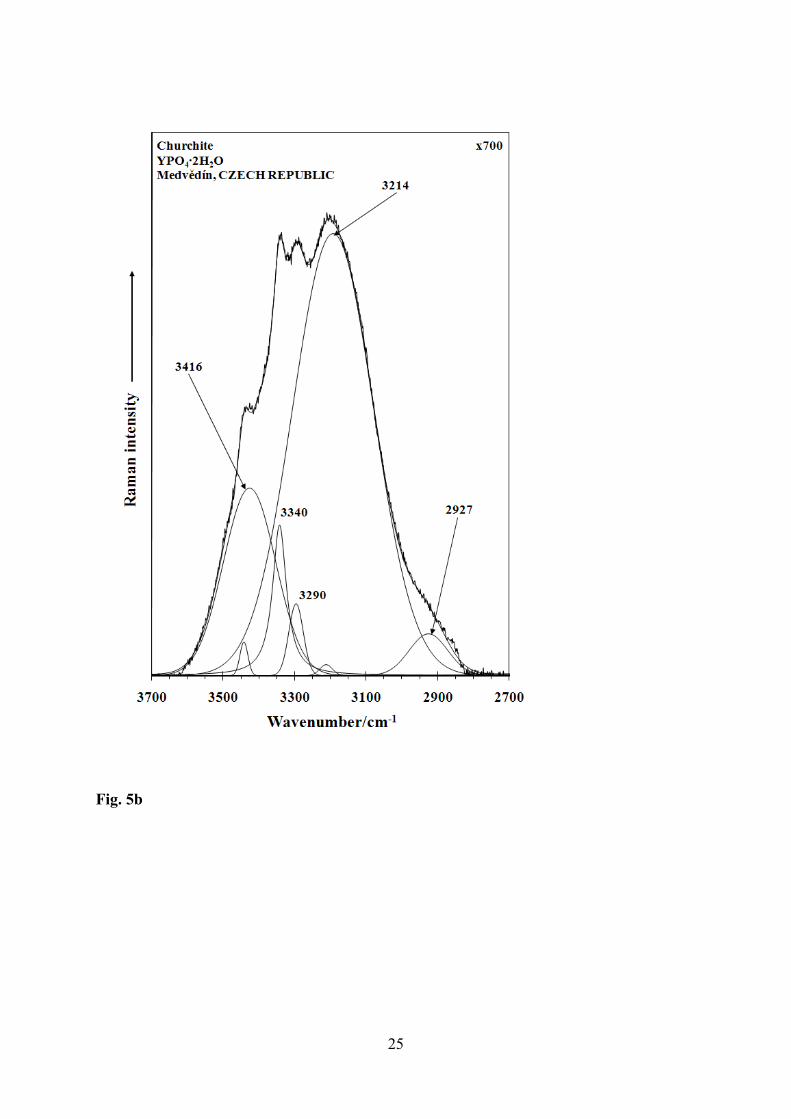
The Raman spectra of churchite-(Y) in the 2700 to 3700 cm-1 is displayed in Fig. 5a
(J) and 5b (M). The Raman spectrum of shows bands at 2929, 3135, 3312 and 3454 cm-1.
These bands are assigned to the stretching vibrations of the water units in the churchite-(Y)
structure. Greater complexity is displayed in the Raman spectrum of churchite-(Y) (M).
Raman bands are observed at 2927, 3214, 3290, 3340 and 3416 cm-1. It is noted that the
Raman spectra from the RRUFF data base does not show the full spectrum. No OH stretching
vibrations are reported. It is not known why there is increased complexity in the Raman
spectrum of the Medvědín churchite-(Y) mineral sample. Suffice to state that water plays a
key role in the structure of the mineral. This is characterized by a hydrogen bonding network
with O-H…O hydrogen bond lengths (Å/cm-1): 2.64/2929, 2.67/3135, 2.76/3312 and
2.85/3454 (J), and 2.64/2927, 2.71/3214, 2.75/3290, 2.77/3340 and 2.81/3416 (M) 23.
CONCLUSIONS
Two churchite-(Y) mineral samples from Jáchymov and Medvědín (Czech Republic)
were analysed by electron microprobe (WD mode). The minerals gave the empirical formulae
(Y0.71Ca0.05Dy0.05Gd0.04Nd0.03Sm0.02Yb0.02Er0.02Ce0.01 Eu0.01Ho0.01Tb0.01Pr0.01Al0.01Tm0.01)
Σ1.01[(PO4)0.98(SiO4)0.02]Σ1.00·2.00H2O, and (Y0.61Gd0.07 Nd0.06
Ca0.06Dy0.05Sm0.04Ce0.04Eu0.03Er0.02Yb0.01Ho0.01 Pb0.01Tb0.01Pr0.01La0.01)Σ1.04
[(PO4)0.98(AsO4)0.01]Σ0.99·2.00H2O for the Jáchymov and Medvědín churchite-(Y) mineral
samples, respectively.
The Raman spectra of these two mineral samples were compared with the Raman
spectra of two churchite-(Y) mineral samples from Vesuvius and Indian Mountain USA. The
Raman spectra of churchite-(Y) are characterized by an intense sharp band at 975 cm-1,

7
assigned to the ν1 (PO43-) symmetric stretching mode. A lower intensity band observed at
around 1065 cm-1 is attributed to the ν3 (PO43-) antisymmetric stretching mode. The (PO4
3-)
bending modes are observed at 497 cm-1 (ν2) and 563 cm-1(ν4). Small differences are
observed in the spectra of the churchite-(Y) minerals. Both samples are characterized by a set
of hydrogen bonds. O-H…O hydrogen bond lengths were inferred from the spectra.
Acknowledgements
The financial and infra-structure support of the Queensland University of Technology
Inorganic Materials Research Program of the School of Physical and Chemical Sciences is
gratefully acknowledged. The Australian Research Council (ARC) is thanked for funding the
instrumentation. This work was financially supported by Ministry of Culture of the Czech
Republic (MK00002327201) to Jiří Sejkora and Jakub Plášil.

8
References
1. Ganzeeva LV Redkie Elementy 1972, 7, 112-24.
2. Ganzeeva LV, Ganzeev AA Geokhim. 1975, 74-80.
3. Kohlmann M, Sowa H, Reithmayer K, Schulz H Acta Crystal. 1994, C50, 1651-2.
4. Lottermoser BG Min. Mag. 1987, 51, 468-9.
5. Sejkora J, Veselovský F, Šrein V Acta Musei Nationalis Pragae, 1994, B50, 55-91.
6. Claringbull GF, Hey MH Min. Mag. 1953, 223, 211-217.
7. Anthony JW, Bideaux RA, Bladh KW, Nichols MC Handbook of mineralogy, 2000;
Vol. IV
8. Onac BP, Ettinger K, Kearns J, Balasz II Min. Pet. 2005, 85, 291-302.
9. Kohlmann M, Sowa H, Reithmayer K, Schulz H, Kruger RR, Abriel N Act. Crystal.
1994, C50, 1651-1652.
10. Satoh N Hyomen Gijutsu 1989, 40, 933-7.
11. Castagnola MJ, Dutta PK Micropor. Mesopor. Mat. 2001, 42, 235-243.
12. Frost RL, Martens W, Williams PA, Kloprogge JT Min. Mag. 2002, 66, 1063-1073.
13. Frost RL, Martens WN, Kloprogge T, Williams PA Neues Jahr. Min.2002, 481-496.
14. Frost RL, Williams PA, Martens W, Kloprogge JT, Leverett P J. Raman Spectrosc.
2002, 33, 260-263.
15. Plášil J, Sejkora J, Čejka J, Škoda R, Goliáš V Journal of Geosciences 2009, 54, 15-
56.
16. Frost RL, Cejka J, Ayoko G J. Raman Spectrosc. 2008, 39, 495-502.
17. Frost RL, Cejka J, Ayoko GA, Dickfos MJ J. Raman Spectrosc. 2008, 39, 374-379.
18. Frost RL, Cejka J, Dickfos MJ J. Raman Spectrosc. 2008, 39, 779-785.
19. Frost RL, Cejka J, Keeffe EC, Dickfos MJ J. Raman Spectrosc. 2008, 39, 1413-1418.
20. Frost RL, Dickfos MJ, Cejka J J. Raman Spectrosc. 2008, 39, 582-586.
21. Farmer VC Mineralogical Society Monograph 4: The Infrared Spectra of Minerals,
1974.
22. Ross SD, In Mineralogical Society Monograph 4: The Infrared Spectra of Minerals,
(Farmer VC, Ed.), p. 383-422, Mineralogical Society, London 1974.
23. Libowitzky E, Monatshefte fuer Chemie 1999, 130, 1047-1059.

9
10
Table 1 Results of the Raman spectral analysis of churchite-(Y) from (a) Jáchymov (b)
Medvědín (c) Vesuvius (d) Indian Mountain - this red part is possible to delete
Jáchymov
Medvědín
Vesuvius
Indian Mountain
Raman
/cm-1
Raman
/cm-1
Raman
/cm-1
Raman
/cm-1
1178
1066
1063
1065
1065
1020

11
975
979
983
983
947
680
677
702
700
645
646
640
645
563
605
563
564
497
497
496
495
361
362
363
360

12
287
260
266
261
247
244
249
246
208
205
210
206
188
181
187
144
144
144
142

13
List of Figs
Fig. 1 Raman spectrum of churchite-(Y) in the 900 to 1200 cm-1 region.
Fig. 2 Raman spectrum of churchite-(Y) from Jáchymov and Medvědín in the 400 to 800 cm-
1 region.
Fig. 3 Raman spectrum of churchite-(Y) from Vesuvius and Indian Mountain in the 100 to
800 cm-1 region.
Fig. 4 Raman spectrum of churchite-(Y) from Jáchymov and Medvědín in the 100 to 300 cm-
1 region.
Fig. 5 Raman spectrum of churchite-(Y) from Jáchymov and Medvědín in the 3000 to 3600
cm-1 region.
14
Fig. 1a

15
Fig. 1b

16
Fig. 1 c
17
Fig. 1d

18
Fig. 2a
19
Fig. 2b

20
Fig. 3a

21
Fig. 3b
22
Fig. 4a
23
Fig. 4b

24
Fig. 5a
25
Fig. 5b


![The surface enhanced Raman spectroscopic study of the adsorption of C[sub 70] on the gold nanoparticles](https://static.fdokumen.com/doc/165x107/634538e9f474639c9b04beac/the-surface-enhanced-raman-spectroscopic-study-of-the-adsorption-of-csub-70-on.jpg)