RAJARAM BAL - National Chemical Laboratory
235
1 ALKYLATION REACTIONS OF AROMATIC COMPOUNDS OVER ALKALINE MOLECULAR SIEVES AND ALKALINE SILICA A THESIS submitted to the UNIVERSITY OF PUNE for the degree of DOCTOR OF PHILOSOPHY in CHEMISTRY By RAJARAM BAL CATALYSIS DIVISION NATIONAL CHEMICAL LABORATORY PUNE - 411 008, INDIA MAY 2001
-
Upload
khangminh22 -
Category
Documents
-
view
0 -
download
0
Transcript of RAJARAM BAL - National Chemical Laboratory

1
ALKYLATION REACTIONS OF AROMATIC
COMPOUNDS OVER ALKALINE MOLECULAR
SIEVES AND ALKALINE SILICA
A THESIS
submitted to the
UNIVERSITY OF PUNE
for the degree of
DOCTOR OF PHILOSOPHY
in
CHEMISTRY
By
RAJARAM BAL
CATALYSIS DIVISION
NATIONAL CHEMICAL LABORATORY
PUNE - 411 008, INDIA
MAY 2001

2
DEDICATED TO MY
PARENTS

3
CERTIFICATE
This is to certify that the work incorporated in the thesis,
"Alkylation Reactions of Aromatic Compounds over Alkaline
Molecular Sieves and Alkaline Silica" submitted by Mr. Rajaram
Bal, for the Degree of Doctor of Philosophy, was carried out by the
candidate under my supervision in the Catalysis Division, National
Chemical Laboratory, Pune, INDIA. Such material as has been
obtained from other sources has been duly acknowledged in the thesis.
Dr. S. Sivasanker
Research Guide

4
ACKNOWLEDGMENTS
I am most grateful to my research supervisor, Dr. S. Sivasanker, for his help support and advice through out the course of this investigation. I am expressing my reverence towards him and my sincere regards for him forever.
I am grateful to Dr. A.V. Ramaswamy, Head, Catalysis Division for his encouragement and discussions.
I am also deeply indebted to Dr. D. Srinivas and Dr. S.G. Hegde for their stimulating discussions and constant personal help they rendered throughout the course of investigation.
I wish to express my thanks to Dr. (Mrs.) A.J. Chandwadkar, Dr. B.S. Rao, Dr. C. Gopinath, Ms. M.S. Agashe, Ms. N.E. Jacob, Dr. (Mrs.) A. A. Belhekar, Dr. H.S. Soni, Dr. S.P. Mirajkar, Dr. C.V.V. Satyanarayana, Dr. Rajmohanan, Dr. (Mrs.) V. Ramaswamy, Dr. R. Vetrivel, Dr. (Mrs.) S.V. Awate, Dr. K.J. Waghamare and all other scientific and nonscientific staff in the Catalysis Division, NCL, for their help and cooperation given to me in completing my research work successfully.
I would like to thank my friends Karuna, Tapanda, Mantri, Babu, Subho, Bikash, Pradip, Madhab, Anil, Bivas, Tarasankar, Tapasda, Sumanda, Amiya, Annyt, Chitto, Bennur, Balu, Suresh, Sindhu, Anilda, Priyada, Laha, Dinu, Aditya, Koushik, Mannada and boudi, Manasda, Subarnada, Lahada, Majida, Hazra, Tarun, Sumit, Sarada, Vasu, Abhimunya, Venkat, Suhas, Anand, Shiju, Thomas, Pai, Biju, Sridevi, Sabde, Gore sir and my innumerous friends for their wholehearted help and discussion.
It gives me great pleasure to thank my parents, uncle and aunty, sisters, Madhuri, Manasi, Tapasi, Atasi, my brother in law, Santanuda, my brother Rahul for their love, unfailing support, tremendous patience, trust and encouragement that they have shown to me. I take this opportunity also to extend my heartfelt thanks to my beloved Arpita. This work would never have received the present shape had it not been backed by her constant encouragement and patience.
Finally, my thanks are due to the Council of Scientific & Industrial Research, New Delhi, for my fellowship award and to Dr. P. Ratnasamy, Director, National Chemical Laboratory, for permitting me to carry out my research work at NCL.
RAJARAM BAL

5
CONTENTS
1. INTRODUCTION
1.1 INTRODUCTION 1
1.2 BASIC ZEOLITES 3
1.2.1 Bronsted sites 4
1.2.2 Structural basicity 4
1.2.3 Clusters of oxides or hydroxides 5
1.2.4 Ionic and metal alkali clusters 6
1.3 SUPPORTED ALKALI METAL IONS ON SILICA 7
1.4 CHARACTERIZATION OF BASIC SURFACES 8
1.4.1 Indicator method 8
1.4.2 Temperature programmed desorption (TPD) of carbon dioxide
9
1.4.3 UV-absorption and luminescence spectroscopies 9
1.4.4 Temperature programmed desorption (TPD) of hydrogen
10
1.4.5 X-ray photoelectron spectroscopy (XPS) 10
1.4.6 IR of adsorbed carbon dioxide 11
1.4.7 IR of pyrrrole 12
1.5 ALKYLATION REACTION 14

6
1.6 SIDE CHAIN ALKYLATION 16
1.7 ALKYLATION OF PHENOL 19
1.8 ALKYLATION OF ANILINE 25
1.9 OBJECTIVES OF THE THESIS 30
1.10 REFERENCES 32
2. EXPERIMENTAL AND CHARACTERIZATION
2.1 INTRODUCTION 44
2.2 PREPARATION OF CATALYST 44
2.2.1 Synthesis of molecular sieves 44
2.2.1.1 Synthesis of zeolite-X 44
2.2.1.2 Synthesis of zeolite-L 45
2.2.1.3 Synthesis of Si-MCM-41 45
2.2.1.4 Synthesis of silicalite-1 46
2.2.1.5 Synthesis of ferrierite 47
2.2.2 Modification of supports 47
2.2.2.1 Ion exchange 47
2.2.2.2 Impregnation 48
2.2.2.2.1 Preparation of Cs-MCM-41 48
2.2.2.2.2 Preparation of alkaline silica 48
2.2.2.2.3 Preparation of Cs-silicalite
and Cs-ferrierite
48
2.3 CHARACTERIZATION 50

7
2.3.1 X-ray diffraction (XRD) 50
2.3.2 Surface area 50
2.3.3 Intermediate electronegativity (Sint) 54
2.3.4 Temperature programmed desorption of carbon dioxide
55
2.3.5 Infrared spectra of adsorbed carbon dioxide 59
2.3.5.1 Silica supported samples 60
2.3.5.2 Zeolite and molecular sieve samples 67
2.3.6 Nuclear magnetic resonance spectra (NMR) 76
2.3.6.1 133 Cs MAS NMR spectra 76
2.3.6.2 29 Si MAS NMR spectra 78
2.3.7 ESCA 80
2.4 CONCLUSIONS 81
2.5 REFERENCES 81
3. SIDE CHAIN C-ALKYLATION
3.1 INTRODUCTION 83
3.2 EXPERIMENTAL 86
3.2.1 Materials and Catalysts 86
3.2.2 Reaction Procedure 86
3.3 RESULTS AND DISCUSSION 86
3.3.1 Alkylation of EB with DMC 86
3.3.1.1 Influence of process time 87
3.3.1.2 Influence of basicity of the catalyst 89

8
3.3.1.3 Influence of temperature 92
3.3.1.4 Influence of contact time 94
3.3.1.5 Influence of molar ratios of reactants 94
3.3.1.6 Influence of carrier gas (N2) 96
3.3.1.7 Reaction mechanism 96
3.3.2 Alkylation of toluene with DMC 99
3.3.2.1 Influence of process time 99
3.3.2.2 Influence of basicity of the catalyst 100
3.3.2.3 Influence of temperature 103
3.3.2.4 Influence of contact time 103
3.3.2.5 Influence of molar ratios of reactants 106
3.3.2.6 Reaction mechanism 106
3.4 CONCLUSIONS 109
3.5 REFERENCES 109
4. O-ALKYLATION
4.1 INTRODUCTION 112
4.2 EXPERIMENTAL 114
Materials and catalysts 114
4.2.1
4.2.2 Reaction procedure 116
4.3 RESULTS AND DISCUSSION 118
4.3.1 O-alkylation of phenol 118
4.3.1.1 Activities of the catalysts 118

9
4.3.1.2 Reactivities of the alcohols 119
4.3.1.3 Influence of time on stream 122
4.3.1.4 Effect of temperature 123
4.3.1.5 Effect of contact time 126
4.3.1.6 Effect of methanol / phenol mole ratio (methylation of phenol)
126
4.3.1.7 Studies of catalyst deactivation 128
4.3.2 O-methylation of cresols 133
4.3.2.1 Activities of the catalysts 133
4.3.2.2 Influence of time on stream (TOS) 133
4.3.2.3 Reactivities of cresols 135
4.3.2.4 Effect of temperature 138
4.3.2.5 Effect of contact time 138
4.3.3 O-methylation of dihydroxy benzenes 138
4.3.3.1 Activities of the catalysts 138
4.3.3.2 Reactivities of the dihydroxy benzenes 148
4.3.3.3 Effect of temperature 149
4.3.3.4 Effect of contact time 151
4.3.4 O-methylation of p-methoxy phenol 154
4.3.4.1 Reactivity of p-methoxy phenol 154
4.3.4.2 Influence of time on stream 158
4.3.4.3 Influence of process prameters 158

10
4.3.5 O-methylation of 2-naphthol 162
4.3.5.1 Comparison of catalysts 162
4.3.5.2 Influence of time on stream 163
4.3.5.3 Influence of temperature 167
4.3.5.4 Influence of contact time 167
4.4 CONCLUSIONS 172
4.5 REFERENCES 174
5. N-ALKYLATION
5.1 INTRODUCTION 177
5.2 EXPERIMENTAL 179
5.2.1 Materials and catalysts 179
5.2.2 Reaction procedure 179
5.3 RESULTS AND DISCUSSION 180
5.3.1 N-alkylation with methanol 180
5.3.1.1 Activities of the Catalysts 180
5.3.1.2 Effect of time on stream 181
5.3.1.3 Effect of temperature 182
5.3.1.4 Effect of contact time 183
5.3.1.5 Effect of methanol / aniline mole ratios 183
5.3.1.6 Reaction pathway 186
5.3.2 N-alkylation with dimethyl carbonate 188

11
5.3.2.1 Activities of the catalysts 188
5.3.2.2 Effect of time on stream 193
5.3.2.3 Effect of temperature 197
5.3.2.4 Effect of contact time 197
5.3.2.5 Effect of DMC / aniline mole ratios 197
5.3.2.6 Reaction pathway 199
5.4 CONCLUSIONS 201
5.5 REFERENCES 203
6. SUMMARY AND CONCLUSIONS 206

12
CHAPTER CHAPTER -- I I
INTRODUCTIONINTRODUCTION

13
1.1 INTRODUCTION
Both acid-catalyzed and base-catalyzed reactions are initiated by acid-base
interactions followed by catalytic cycles. In acid catalyzed reactions, reactants act
as bases toward catalysts which act as acids. In base-catalyzed reactions, on the
contrary, reactants act as acids toward catalysts which act as bases.
Heterogeneous acid catalysis has attracted much attention primarily because
of the large volume applications in petroleum refinery operations such as catalytic
cracking. Studies of heterogeneous cracking catalysts undertaken in the 1950s
revealed that the essential feature of cracking catalysts is acidity, and generation of
acidic sites on solids was extensively investigated. Clays and amorphous silica-
alumina were used as cracking catalysts in the beginning followed by crystalline
aluminoslicates (zeolites).
In contrast to the extensive studies carried out on heterogeneous acidic
catalysts, studies on heterogeneous basic catalysts have been far too limited. Pines
et al. [1] first reported that sodium metal dispersed on alumina acted as an effective
catalyst for double bond migration of alkenes. During the 1970s, Kokes et al. [2,3]
reported that hydrogen molecule is adsorbed on zinc oxide by acid-base interactions
to form proton (H+) and hydride (H-) on the surface. In the same period, Hattori et
al. [4] reported that calcium oxide and magnesium oxide were very active in 1-
butene isomerization and they recognized this as a base catalyzed reaction. The

14
catalytic activities of basic zeolites were also reported in early 1970s by Yashima et
al. [5].
In addition to the above-mentioned catalysts, a number of materials have
been reported to act as heterogeneous basic catalysts. Different types of
heterogeneous basic catalysts [6] are listed in Table 1.
Table 1. Types of heterogeneous basic catalysts
Heterogeneous basic catalyst Examples
1. Single component metal oxides Alkaline earth oxides,
Alkali metal oxides,
Rare earth oxides
ThO2, ZrO2, ZnO, TiO2
2. Zeolites Alkali ion-exchanged zeolites,
Alkali ion-added zeolites
3. Supported alkali metal ions Alkali metal ions on alumina,
Alkali metal ions on silica
Alkali metal on alkaline earth oxides
Alkali metals and alkali metal hydroxides on
alumina
4. Clay minerals Hydrotalcite,
Chrysolite,
Sepiolite
5. Non-oxide KF supported on alumina,

15
Lanthanide imide and nitride on zeolites
1.2 BASIC ZEOLITES
Zeolites are hydrated, crystalline, microporous aluminosilicates whose
structures are made up of TO4 tetrahedra (T = tetrahedral atom, e.g. Si, Al), each
apical oxygen is shared with an adjacent tetrahedron. The crystallographic unit cell
of a zeolite may be represented by the general formula [7]:
Mx/n [ (AlO2)x (SiO2)y ] zH2O.
The net negative charge of the framework is the same as the number of
aluminium atoms and is balanced by exchangeable charge compensating cations M
of valence n; z is the number of water molecules and x + y represents the total
number of tetrahedra present in a unit cell of zeolite. All zeolites have large internal
surface areas available for adsorption due to channels or pores, which uniformly
penetrate the entire volume of the solid. The external surface of the adsorbant
particles contributes to only a small amount of the total available suface area.
Due to the presence of Al in the framework structure, a negative charge is
generated. Again, in principle, if the framework Si were to be replaced by a higher
valent ion like V5+ or P5+, a positive charge should be generated in the framework.
The presence of the positive or negative charge determines the acidobasic character
of the zeolite. In fact, two main features characterize the acidobasic properties: a
purely structural feature resulting from specific connection of TO4 tetrahedra and a
physicochemical feature arising from the chemical composition. It will be seen that

16
both features may govern the acidobasic characteristics of zeolites. The first feature
is linked to the geometry (bond angels, bond lengths, spatial distribution of charges)
and the second one to physicochemical properties such as electronegativity,
polarizing power of ions, ionicity etc.
Basic properties of zeolites have been investigated mainly in the case of the
Si-Al system [8]. The oxygen atom in the Si-O-Al species bears a negative charge,
which may generate a basic character. Basicity may also originate from other sites
through hydrolysis of metal ions, exchanged oxide clusters, supported metals, or
reducing centers. It may also be associated with acidity in acid-base pairs.
The basicity of zeolites may arise from
1. Bronsted sites associated with hydrolysis of metal ions
2. Structural basicity
3. Clusters of oxides and hydroxides
4. Ionic and metal alkali clusters
1.2.1 Bronsted sites
The negatively charged lattice of Si-Al zeolites does not reveal the existance of
basic OH- groups. The OH- groups reported are linked to extraframework species.
For instance, Mg2+ or Ce3+ in faujasite cages have been shown to generate basicity
through hydrolysis [9,10]. They give -OH infrared bands at 3685 cm-1 (MgY) and
3675 cm-1 (CeY), originating [11] from the reaction:
M2+ (H2O) → M2+ OH- + H+.
1.2.2 Structural basicity

17
The framework oxygen bearing the negative charge of the lattice is the structural
basic site. In most structures all the oxygen atoms are accessible to adsorbates
(faujasite). In less open structures, some oxygen atoms belong to cages, which are
too small to be accessed (LTL, mordenite). It follows that only a part of all the
existing basic oxygens will interact with adsorbates or be active in these zeolites.
Another characteristic of the oxygen sites is that they are fixed between two T
atoms. In other words, unlike the protons in acidic zeolites, the oxygen sites are not
mobile. While the H+ ions can move to the reactants, the molecules have to
approach the lattice oxygen in a configuration that is favourable for the formation of
a reaction intermediate.
The chemical composition of the zeolite and its structure type affect the oxygen
basicity. In Si-Al zeolites, the most highly negatively charged oxygen belongs to
the AlO4 tetrahedron [12]. This selects which oxygen sites, among all the existing
oxygens of the lattice (i.e. Si-O-Si) are basic. The charge on oxygen, expressing the
basic strength, can be calculated theoretically [13,14]. Another factor influencing
the oxygen charge is the TOT bond angle. The electronic charge on oxygen (basic
strength) increases as the TOT angles are smaller and the TO distances are longer
[15,16].
1.2.3 Clusters of oxides or hydroxides
Small oxide particles can be encapsulated in zeolite cages [9,10, 16-21]. Some
oxide materials are known as basic catalysts (MgO, CaO, ZnO) [22]. Dispersed in
zeolite cages they may form small oxide clusters with basic properties.

18
Clusters of MgO and M2O (M = Na, K, Rb and Cs) are prepared in Y and X zeolites
by soaking them in solutions of magnesium dimethoxide (alcoholic solutions) or
alkali acetates (aqueous solutions) [21]. Strong basic sites are obtained in the Mg
case only if the ensamble (Mg and O) forms a MgO lattice, while isolated M2O
species produce strong basicity in the case of the alkali metal oxides [21]. Two
general trends are observed in the properties of these materials. Firstly, exchanged
zeolites are less basic than those contain additional clusters of oxides. Secondly,
carbonates are formed very easily from these oxides with atmospheric CO2.
1.2.4 Ionic and metal alkali clusters
Interaction of alkali metal vapours with zeolites generates colored products,
which often possess basic properties. It was first reported that Na65+ and Na4
3+
paramagnetic centers were formed in alkali X and Y zeolites [23]. In the field of
zeolites, the dependence of selectivity in the alkylation of toluene with methanol
upon the acidic and non-acidic character of the solid was first mentioned by
Sidirenko et al. [24]. This was further studied in detail, and the formation of
ethylbenzene and styrene was linked to basic sites in X and Y exchanged with K,
Rb and Cs cations. The production of xylenes was related to the acidic character of
Li- and Na-zeolites [25]. Hathaway and Davis [26-29] prepared catalysts by
impregnation of Na-Cs-X and Cs-Na-Y with cesium acetate followed by thermal
decomposition of the acetate into oxide and showed that they act as base catalysts.
Alkaline molecular sieves may be formed by hydroxides or oxides, not only in
basic or neutral Si-Al zeolites [7,9,10,16-21, 30-40], but also in mesoporous
molecular sieves. While Na-MCM-41 and Cs-MCM-41 (prepared by ion exchange)

19
are active in the base catalyzed Knovenagel condensation, cesium acetate
impregnated MCM-41 is active in Michael addition and appears to be a promising
super base catalyst [41]. More generally, one may expect that the chemistry of
highly dispersed basic oxides in various porous supports (neutral and basic) will
open an expanding field for the generation of tailor made basic catalysts. Both the
support and the dispersed oxide may gain new properties. For instance, the
impregnation with Cs acetate of previously exchanged Cs-Na-X and Cs-Na-Y
generates occluded species, which are more strongly basic when located in Cs-Na-Y
[42]. Simultaneously, modified Cs-Na-X zeolites are more thermally stable than
modified Cs-Na-Y. Binary, cesium-lanthanum oxide supported MCM-41 is also a
very stable heterogeneous catalyst [43]. Tsuji et al. [44] followed the synthesis
procedure of Hathaway and Davis and carried out the isomerization of 1-butene
over a series of MX (M+ exchanged X zeolite; M = alkali metal) and M+
impregnated MX. At 273K, all the ion exchanged zeolites (MX) showed
practically no activity, while M+ loaded MX showed considerable activity. A Cs
loaded Cs-X sample showed the highest activity (1.4 x 10⁻⁴ mole / g /min). The
authors claimed that these materials are solid super bases. The various evidences
including 133Cs NMR and temperature programmed desorption (TPD) of carbon
dioxide indicate that the active species is nanophase cesium oxide occluded in the
supercage of the zeolites [45,46].
1.3 SUPPORTED ALKALI METAL IONS ON SILICA

20
The oxides of the first group metals (Li, Na, K, Rb and CS) are bases. The
oxides of rubidium and cesium have been reported to be super bases, possessing
base strengths with a Hammett basicity function (H_) exceeding +26 [47].
Therefore, it is believed that supported oxides of these alkalies also exhibit strong
basicity [48]. Sodium was one of the first solid base catalysts studied and was used
for the isomerization of olefins [1]. More recently, an aluminium supported sodium
catalyst was prepared by treatment of γ- alumina with NaOH and Na metal to give a
superbasic solid with H_ > 37 [49]. Other super basic catalysts have been
synthesized by supporting one or more alkali elements on basic supports like MgO
and CaO [50,51]. Unlike solid superacids, very little work has been done to
investigate solid superbases, despite their potential use in many industrial
applications as heterogeneous base catalysts [6].
1.4 CHARACTERIZATION OF BASIC SURFACES
The surface properties of heterogeneous basic catalysts have been studied by
various methods by which the existence of basic sites has been realized. Different
characterization methods give different information about the surface properties.
All the properties of the basic sites cannot be measured by any single method.
Integration of the results obtained by different characterization methods leads us to
understand the structures, reactivities, strengths and amount of the basic sites on the
surfaces. These methods are briefly described below:
1.4.1 Indicator method

21
The strength of the surface sites are expressed by an acidity function (H_)
proposed by Paul and Long [52]. The H_ function is defined by the following
equation [52, 53]
H_ = pKBH + log [B-] / [BH]
Where [BH] and [B-] are, respectively, the concentration of the indicator BH and its
conjugate base, and pKBH is the logarithm of the dissociation constant of BH. The
reaction of the indicator BH with the basic site (B) is
BH + B = B- + BH+
The amount of basic sites of different strengths can be measured by titration
with benzoic acid. A sample is suspended in a nonpolar solvent and an indicator is
adsorbed on the sample in its conjugated base form. The benzoic acid titer is a
measure of the amount of basic sites having a base strength corresponding to the
pKBH value of the indicator used.
1.4.2 Temperature programmed desorption (TPD) of carbon dioxide
This method is frequently used to measure the number and strength of basic
sites. The strength and amount of basic sites are reflected in the desorption
temperature and the peak area, respectively, in a TPD plot. However it is difficult
to express the strength in a definite scale and to count the number of sites
quantitatively. Relative strengths and relative numbers of basic sites on the
different catalysts can be estimated by carrying out the TPD experiments under the
same conditions [54].
1.4.3 UV-absorption and luminescence spectroscopies

22
UV absorption and luminescence spectroscopies give information about the
coordination states of the surface sites [55,56]. Luminescence corresponds to the
reverse process of UV absorption, and the shape of the luminescence spectrum
varies with the excitation light frequency and with the adsorption of the molecules.
Emission sites and excitation sites are not necessarily the same. Excitons move on
the surface and emit at the ion pair of low coordination numbers where emission
efficiency is high. This method is very useful mainly for oxides.
1.4.4. Temperatured programme desorption (TPD) of hydrogen
This method gives information about the co-ordination state of the surface
ion pairs when combined with other methods such as UV absorption and
luminescence spectroscopies. The number of each ion pair could be counted if TPD
is accurately measured with proper calibration. This method has been applied to the
MgO surface [57,58].
1.4.5. X-ray photoelectron spectroscopy (XPS)
The XPS binding energy (BE) of oxygen reflects the basic strength of the
oxygen. As the O1S BE decreases, electron pair donation becomes stronger.
Okamoto et al. [59] studied the effects of zeolite composition and the type of cation
on the BE of the constituent elements for X- and Y-zeolites ion-exchanged with a
series of alkali cations as well as H-forms of A, X, Y, and mordenite. The O1S BE
of a zeolite is directly delineated to the electron density of the framework oxygen.
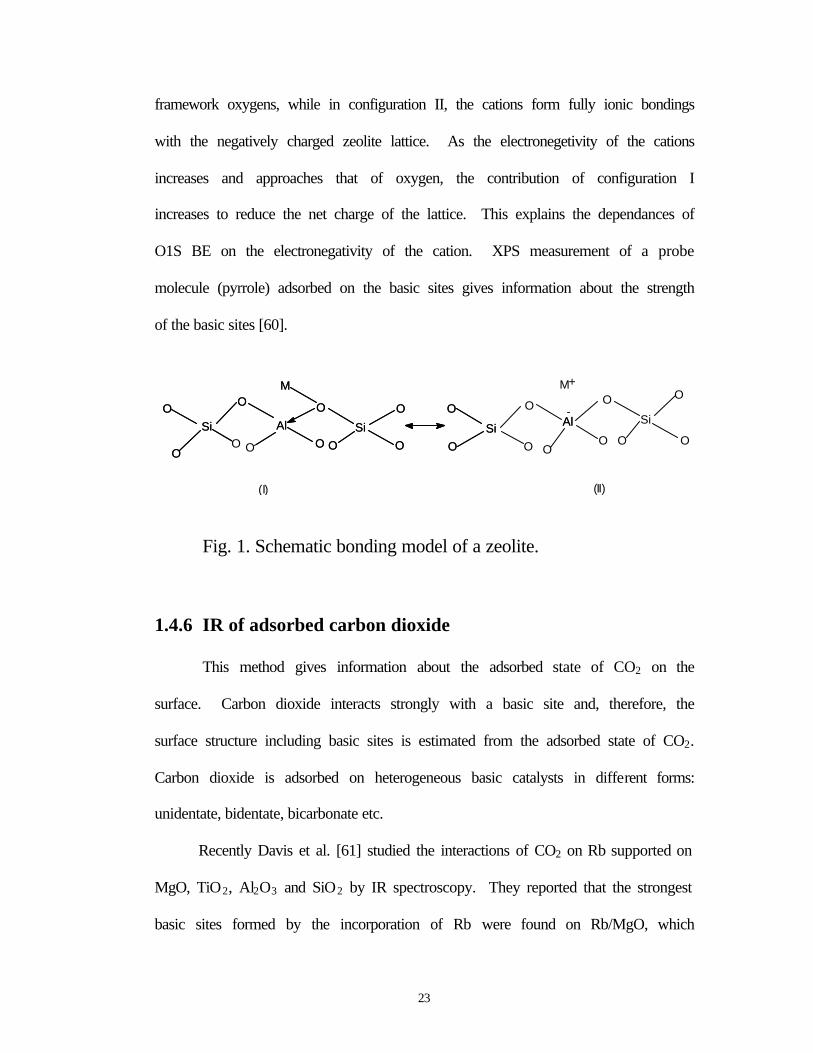
On the basis of XPS features of zeolites, Okamoto et al. [59] also proposed a
bonding model of a zeolite as shown in Fig. 1. Configurations I and II are in
resonance. In configuration I, extra framework cations form covalent bonds with
23
framework oxygens, while in configuration II, the cations form fully ionic bondings
with the negatively charged zeolite lattice. As the electronegetivity of the cations
increases and approaches that of oxygen, the contribution of configuration I
increases to reduce the net charge of the lattice. This explains the dependances of
O1S BE on the electronegativity of the cation. XPS measurement of a probe
molecule (pyrrole) adsorbed on the basic sites gives information about the strength
of the basic sites [60].
Fig. 1. Schematic bonding model of a zeolite.
1.4.6 IR of adsorbed carbon dioxide
This method gives information about the adsorbed state of CO2 on the
surface. Carbon dioxide interacts strongly with a basic site and, therefore, the
surface structure including basic sites is estimated from the adsorbed state of CO2.
Carbon dioxide is adsorbed on heterogeneous basic catalysts in different forms:
unidentate, bidentate, bicarbonate etc.
Recently Davis et al. [61] studied the interactions of CO2 on Rb supported on
MgO, TiO2, Al2O3 and SiO2 by IR spectroscopy. They reported that the strongest
basic sites formed by the incorporation of Rb were found on Rb/MgO, which
SiO
SiAl
OO
O O O
O
O
O
M
SiO
SiAlO
O
O O O
O
O
O
M
AlSi
M+
O
O
Al SiSi
O
O
O
O O
O
O O
O
O
-
(I) (II)

24
contain significant carbonate species even after heating to 773K. Carbonates were
not present on the other heat-treated Rb catalysts. The least basic support, silica, is
thought to react with Rb to form a highly disordered, weakly basic surface silicate.
Auroux et al. [62] have studied the acidobasic properties of various oxides.
According to them CO2 molecules can be adsorbed on positive and negative
surfaces. The adsorbed CO2 (carbonates) may then block the surface sites. The
different ways CO2 adsorption occurs on the surface of oxides can be summarized:
a) adsorption on the hydroxyl group with formation of a superficial
hydroxycarbonyl ion (Fig. 2(I));
b) adsorption on the metal cation and dissociation of the resulting species (Fig.
2(II));
c) adsorption on the metal ion and the neighbouring oxygen ion and formation of a
bidentate carbonate group (Fig. 2(III));
d) adsorption on the oxygen vacancy and formation of a superficial carbonyl
group (Fig. 2(IV));
e) adsorption on the metal ions with participation of oxygen in excess and
formation of a carbonate (Fig. 2(V) or 2(VI) or 2(VII)).
According to Knozinger et al. [63] the structures of monodentate and
bidentate species on metal and oxide surfaces may be Fig. 2(VIII) and Fig. 2(IX),
respectively.
1.4.7 IR of pyrrole
Pyrrole has been used as a probe molecule for measurement of strength of
basic sites [64]. The IR band ascribed to the N-H stretching vibration shifts to a

25
lower wave number on interaction of the H atom in pyrrole with a basic site.
Barthomeuf measured the shifts of N-H vibration of pyrrole adsorbed on alkali ion
exchanged zeolites [65, 66]. The results are given in Table 2. The shift increases
when the negative charge on the oxide ion increases.

26
O M O
O
COO
O M OM M
C
O
O
O M O
O
C
O O
M O M
COO
H
(I) (II)
(V) (VI)
M O M
CO O
O
(VII)
M
CO O
M
C O
O
(VIII) (IX)
M O M
COO
(III) (IV)
O
C
MOM
Fig. 2. Adsorbed CO2 specie on metal oxides and metals

27
The negative charge is associated closely with the strength of the basic site. The
basic strengths of alkali ion exchanged zeolites are in the order: CsX > NaX > KY >
NaY, KL, Na-mordenite, Na-beta.
Table 2. Shifts of N-H vibration of pyrrole adsorbed on zeolites
Zeolite ∆νNHa
CsX 240
NaY 180
KY 70
NaY 30 – 40
KL 30
Na-mordenire 30
Na-beta 30
Cs-ZSM-5 0
Na-ZSM-5 0
a Shift of N-H from the liquid.
1.5 ALKYLATION REACTION
Alkylation is a major and industrially important process used widely in the
synthesis of low and high volume chemicals. Petrochemical industry is a major
beneficiary of this class of reactions where a number of alkyl hydrocarbons are
synthesized by alkylation reactions. The conventional catalysts used in these
reactions are AlCl3, HF, H2SO4 and BF3 though solid acids like zeolites have also

28
found some recent applications. Many are batch processes using AlCl3 as a soluble
acid catalyst. AlCl3 is inexpensive, very reactive and is one of the powerful Lewis
acids. AlCl3 and similar metal halides are difficult to handle and get readily
hydrolyzed. Very often such catalysts are required in stoichiometric quantities. A
large inventory of these materials poses health, safety and storage problems.
Furthermore, the traditional route of liquid phase alkylation using mineral acids and
AlCl3 suffer from the disadvantages of high capital cost, reactor corrosion,
formation of byproducts and difficulty in catalyst regeneration. In recent times,
scientists worldwide have been devoting their attention to the development of
environmentally friendly catalysts for the production of industrially important
chemicals and chemical intermediates.
The use of safe solid catalysts (acidic and basic) in place of traditional acid
and base catalysts is becoming very important. Several alkylation reactions of
aromatic hydrocarbons have been tried out over oxides, mixed oxides, supported
oxides and zeolites. Alkylation is a substitution reaction, where a hydrogen atom is
replaced by an alkyl (methyl, ethyl, propyl etc) group. Friedel-Craft alkylation takes
place over acidic catalysts. This is an electrophilic substitution reaction; the
electrophile is the carbonium ion formed from the alkylating agent, viz.,olefins,
alcohols, or alkyl halide with the help of acid sites on the catalyst surface. Solid
acids, which possess Lewis or Bronsted acid sites function successfully as
alkylation catalysts.

29
1.6 SIDE CHAIN C-ALKYLATION
In general, alkylation of aromatics occurs at a ring position over an acidic
catalyst, while side chain aklylation takes place over a basic catalyst. Chemical
industry, because of economic considerations, presently favours toluene over
benzene as the starting material for many processess [67]. Side chain alkylation is
now regarded as one of the synthetic methods for the conversion of methyl groups
into vinyl and /or ethyl groups. Side chain alkylation of toluene with methanol
results in styrene and/or ethylbenzene. In the production of styrene, this process
offers the advantage of lower raw material cost compared to the traditional Friedel-
Craft alkylation of benzene and further dehydrogenation.
Side chain alkylation of toluene proceeds on catalysts with basic properties
such as basic oxides [68] as well as X and Y zeolites exchanged with alkali cations
[24,25]. Alkylation of toluene with methanol over zeolite catalysts [69] can
produce ethylbenzene, styrene, and/or xylenes depending upon the acidity of the
catalyst and the pore size of the molecular sieves. Medium pore acidic zeolites, e.g.
H-ZSM-5, favour ring alkylation [70-72], while large pore basic zeolites e.g. KX
favour side chain alkylation [24,25,73]. Over zeolites exchanged with alkali
cations, the selectivity for side chain alkylation against benzene ring alkylation
increases with the size of the alkali cation (Li < Na < K < Rb < Cs) [24,25,74,75].
Sidorenko et al. [74] suggested that during the side chain alkylation of toluene with
methanol, styrene is formed by the reaction of toluene and formaldehyde produced
by the dehydrogenation of methanol. Also, some styrene is hydrogenated to ethyl
benzene with H2 produced in methanol dehydrogenation.

30
Anderson et al. [76] investigated the side chain alkylation of toluene with
methanol by solid state 13C NMR aver zeolite-X and concluded that methyl
carbocation can be found during the formation of the surface formates. They also
reported that CsX plays a crucial role gettering these highly reactive carbocation by
binding them as surface bound methyl group. Selectivity for styrene formation can
be improved directly by increasing the desired dehydrogenation of methanol.
According to Sefick [75] and Unland [77] this can be achieved by post exchange
treatment of Cs-X zeolite with borates. This treatment leads to a higher
styrene/ethylbenzene ratio by reducing the number or the strength of the excess
basic sites of the catalysts. According to Itoh et al. [78] both basic and weak acid
sites on the zeolite are required for side chain alkylation. They also reported that
slightly stronger acid sites in Rb-X were produced by [78,79] introducing a small
amount of Li+ ions. This hindered the undesired decomposition of formaldehyde
formed from methanol. An opposite effect, an increase in ethylbenzene/styrene
ratio, was obtained on CsX, CsY, and β-X zeolite catalysts by having Cu and Ag
promoters [80]. On the promoted catalysts, the yield of the side chain alkylates
increased on using hydrogen as a carrier gas.
On the basis of Laser Raman [81] and diffuse reflectance [82]
measurements, Unland and Freeman concluded that reaction selectivity was
influenced by the electrostatic field experienced by the aromatic nucleus. This
interaction, primarily through perturbation of the π-electrons, increased with
loading level in a particular zeolite with increasing cationic size. Infrared studies
[83] of the decomposition of methanol and formaldehyde on Na, K, Rb and Cs

31
forms of X type zeolites have shown that methoxide, carbonate and formate species
are formed in varying amounts and types on the different samples. Quantum
mechanical calculations [79] have shown that the presence of basic sites is
important to the mechanism of side chain alkylation.
The currently accepted reaction scheme [24,79,84] for side chain alkylation is
as follows:
1. dehydrogenation of methanol to formaldehyde,
2. attack of formaldehyde at the methyl group of toluene to form styrene and
3. hydrogenation of styrene to ethylbenzene by H2 produced during the methanol
dehydrogenation.
CH3OH → HCHO + H2
C6H5CH3 + HCHO → C6H5CH=CH2 + H2O
C6H5CH=CH2 + H2 → C6H5CH2CH3
___________________________________________________
Over all reaction: C6H5CH3 + CH3OH → C6H5CH2CH3 + H2O
In situ infrared study of toluene methylation with methanol on alkali exchanged
zeolites [85] reveals the actual structures of the surface species and their function in
the alkylation process. Side chain alkylation of toluene with isopropanol and
methanol over alkali (Li, Na, K and Cs) exchanged zeolites (X, β and ZSM-5) was
reported by Vasanthy et al. [86]. Over Li exchange zeolites, isopropylation takes
place exclusively at the nucleus, producing cymenes while methylation gives
xylenes and ethylbenzene, the former being the major product. According to them

32
the side chain alkylation of toluene is a cooperative action of both acidic and basic
sites.
Huang et al. [87] reported the side chain alkylation of ethylbenzene with
methanol over alkali exchanged X type zeolites to yield isopropylbenzene as the
major product. They reported that with KX (at 773K) alkylation and dealkylation
proceeded respectively via carbanion and carbonium ion mechanisms, whereas
dehydrogenation and demethylation occurred via free radical mechanisms.
1.7 ALKYLATION OF PHENOL
Alkylation of phenol is another important industrial reaction that has been
studied in detail. O-alkylated products (aryl alkyl ethers) of which anisole is the
simplest member, are important industrial chemicals and are extensively used as
starting materials for the production of dyes and agrochemicals, as antioxidants for
oils and grease and as stabilizers for plastics. The O-alkylation of phenol yielding
anisole is a reaction of potential interest in the upgrading of phenolic compounds
derived from lignin. It has been shown that methyl aryl ethers (MAE) are good
organic octane improves. Long range tests have shown that MAE blended at 5
volume percent with commercial gasoline is a superior fuel not only in terms of
octane quality but also in terms of fuel economy, performance and engine durability
[88].
Conventionally, these can be obtained by Williamson ether synthesis, which
requires a methyl halide and a stoichiometric amount of sodium hydroxide. They
can also be synthesized with phenol and methyl halide in the presence of sodium

33
hydride in tetrahydrofuran at room temperature [89, 90]. In these methods, the toxic
and corrosive properties of the halides or the sulphates cause problems. Therefore,
special care is necessary in handling them. Besides, expensive materials may be
needed for the reactors and tedious procedures are required for the disposal of the
waste material.
The O-alkyation of phenol over zeolites was first reported by Balsama et
al. [89] over various X, Y and ZSM-5 zeolites. After that, many research groups
have carried out the alkylation over ZSM-5 [91-94], AlPO4 and SAPO [95]
molecular sieves. SAPO catalyzes only the formation of anisole, whereas on other
molecular sieves, cresols and anisoles are simultaneously produced. Over SAPO
and AlPO4 molecular sieves, cracking products are also observed. The selectivities
are generally determined by the Bronsted acidity of the molecular sieves and factors
such as pore size and geometry. Various oxides and supported oxides [96] yield
mainly 2,6-xylenol as the major product. Catalysts like γ-Al2O3, Nafion-H, silica-
alumina and phosphoric acid have also been tested for this reaction [97]. While γ-
Al2O3 contains strong Lewis acid sites, Nafion -H contains strong Bronsted acid
sites and silica-alumina contains both Bronsted and Lewis acid sites of medium and
weak strengths. On the basis of this, different mechanisms have been proposed for
the formation of the product. For example, over Nafion-H, the two types of
mechanisms proposed are: a) A dual site mechanism in which an acid site is
strongly bound to the oxygen of methanol (or of alkylating agents) to form a
alkylcarbocation, while another acid site directly interacts with the aromatic ring

34
b) A Rideal mechanism according to which the reaction occurs between the
molecules of the adsorbed alkylating agent and the aromatic nucleus from the
vapour phase. This mechanism does not exclude the possibility of horizontal
adsorption of aromatic nucleus on the acid sites which is responsible for coke
formation.
Mn3O4 is a good catalyst for phenol alkylation [98] in the vapour phase in
a fixed bed reactor. Oxide catalysts are more selective for the synthesis of 2,6-
xylenol than zeolites, because of absence of pore constraints. It is also suggested
that the presence of basic sites on the oxide surface enables phenol alkylation to
proceed on a pair of acid and base sites. Ono et al. [99] reported the selective O-
methylation of phenol with dimethylcarbonate (DMC) over X-zeolites. A 76%
yield of anisole was obtained with 93% selectivity over Na-X at 553 K. The
mechanism proposed by them for anisole formation (base catalyzed scheme) may
be expressed as follows:
PhOH + BZ ⇒ PhO- + H+BZ-
PhO- + DMC ⇒ PhOCH3 + CO2 + CH3O-
CH3O- + H+BZ- ⇒ CH3OH + BZ
Here, BZ denotes a basic site on the zeolite surface. The basic site interacts with
phenol molecules to form PhO- ions, which in turn react with DMC molecules to
generate CH3O- ions. The CH3O- ions react with protons to produce methanol
and to regenerate the basic sites.
Samolada et al. [100] reported the selective O-methylation of phenol over
sulphates supported on γ-Al2O3. Potassium (3wt%) in the form of K2SO4

35
supported on γ-Al2O3 was found to be the most promising catalyst. The reaction
temperature and the potassium content of the catalyst were found to be the most
important factors affecting the selectivity towards the O-alkylation of phenol.
An empirical equation expressing the reactor output as a function of the reaction
temperature and the potassium content of the catalyst, within the range of the
parameters considered, has been proposed. A catalyst prepared with γ-Al2O3,
K2SO4 and KAl(SO4)2 (with a potassium content of 3 wt%) and characterized by
a low acidity (22 x 10-4 mmole/ m2) was found to be suitable for the successful
production of methyl aryl ethers. Its optimum performance, marked by MAE
selectivity of 98% and phenol conversion of 65 wt%, remained constant over a
wide temperature range (563 K - 603 K). The impregnation of γ-Al2O3 with
potassium sulphate results in the appearance of acid sites of medium strength (+
1.5 < H0 ≤ 4.8), the presence of which is essential for the O-alkylation of phenol.
Xu et al. studied [101] the O-alkylation of phenol with methanol on H-beta
zeolite.
Bentel et al. [102] reported the spectroscopic and kinetic study of the
alkylation of phenol with dimethyl carbonate over NaX zeolite. They concluded
that at room temperature, phenol is preferentially adsorbed by hydrogen bonding
to basic oxygen atoms of NaX. Moreover phenol is partially deprotonated over
the basic site to form zeolitic hydroxyl groups and phenolate ions ligated to Na+
ions (NaOPh). The zeolitic hydroxyl group formed is likely to interact with the
π- electron system of phenolate ions and are able to form surface ether, OzPh,
with phenol. DMC forms two types of surface complexes with Na+ ions at room

36
temperature; a chelating complex via the two carbonyl oxygen atoms and a
monodentate complex via a single carbonyl oxygen atom. The chelating
complex reacts with Na----Oz acid-base sites to form dimethyl ether and CO2.
The decomposition of DMC proceeds stepwise via formation of monomethyl
carbonate, Na bonded methoxy groups, NaOCH3, and lattice oxygen bonded
methyl groups, OxCH3.
Phenol inhibits the formation of chelating DMC, thus retarding the
decomposition of DMC. The formation of anisole proceeds presumably via
nucleophilic attack at the methyl carbon of DMC by the oxygen of phenol. This
reaction supposedly takes place on a Na----Oz acid base site, where DMC is
activated on a Lewis acid site by its carbonyl oxygen and phenol on an adjacent
Lewis base site by H-bonding. This reaction sets in at ca. 423 K and yields
anisole, H-bonded methanol and CO2. Bautista et al. [103] reported the
alkylation of phenol with DMC over AlPO4, Al2O3 and AlPO4-Al2O3 catalysts.
According to them, at low reaction temperatures anisole was formed and as the
reaction temperature was increased, cresols and methyl and dimethyl anisoles
were increasingly produced. Moreover, Al2O3 showed low activity while basic
oxides (MgO and ZnO) showed negligible activity because these oxides are
easily poisoned by carbon dioxide. They suggest the participation of combined
acidic and basic sites for the alkylation of phenol with DMC over AlPO4-Al2O3
catalysts.
Lee et al. [104] reported the O-alkylation of phenol derivatives over basic
zeolites. The substrates selected were phenol, 4-nitrophenol, 4-aminophenol and

37
4-chlorophenol. The activity of the catalyst increased with basicity of the loaded
metal and there was no difference in catalytic activity between ion exchanged
Cs+ and Cs oxide particles. The high selectivity to anisole over basic Cs-ion
exchanged zeolite was no more a function of conversion.
Ono et al. [105-107] reported the selective O-alkylation of catechol over
alumina, alkali hydroxide loaded alumina and potassium nitrate loaded alumina.
Over alumina, DMC is a much more efficient methylating agent than methanol in
the methylation of catechol. The main product was guaiacol, the selectivity for it
being ca. 70%. Addition of water to the feed considerably increased the catalytic
activity and the yield of guaiacol. Over alumina loaded with alkali hydroxide,
catechol was converted only to guaiacol. LiOH/Al2O3 was found to be a
selective catalyst for the O-methylation of catechol with DMC to yield guaiacol.
A guaiacol yield of 84% was obtained at a catechol conversion of 100% at 583
K. Over alumina loaded with potassium nitrate, catechol gave selectively
veratrole with dimethylcarbonate. KNO3/Al2O3 showed a very high catalytic
activity and selectivity for the O-methylation of catechol to give veratrole [99].
A veratrole yield of 97% was obtained at a catechol conversion of 99% at 583 K
with DMC/catechol ratio of 4. Catechol yielded guaiacol and catechol carbonate.
The further reaction of these primary products with DMC resulted in the
formation of veratrole.

38
1.8 ALKYLATION OF ANILINE
Aniline alkylation is an industrially important reaction due to the fact that
many valuable bulk intermediates and fine chemicals can be prepared from
alkylanilines. Alkylanilines form the basic raw materials for the synthesis of
organic chemicals and chemical intermediates (or additives) in dyes, synthetic
rubbers, explosives, herbicides, and pharmaceuticals [108]. However, when
common alkylating agents (alkyl halides) are used, the reaction is less useful for
synthetic purposes due to poor selectivity for any single alkylated product. The
high nucleophilicity of the amine nitrogen results in the formation of mixtures of
secondary and tertiary amines along with the corresponding ammonium salt
[109]. Dialkyl amines may be prepared directly from corresponding amines by
heating the latter with trialkyl phosphates. But this procedure has many
disadvantages like environmental problems, waste and need for much precaution
during the reaction.
Due to these problems, vapour phase aniline alkylation over environmentally
safe solid catalysts is an answer to the conventional method of producing
alkylamines using mineral acids and Friedel-Craft type catalysts [110]. The
traditional route also presents the disadvantages of high capital cost, reactor
corrosion, and formation of byproducts that cannot be recycled. Several types of
catalysts based on oxides and supported oxides [111-119], zeolites [120-132] and
microporous aluminophosphates [132-134] have been tested for aniline
methylation. The main factors influencing activity and selectivity (N- and/or C-
alkylation) are acid-base properties (number and strength) and shape selectivity

39
in the solid acid catalyst as well as reaction conditions (temperature, composition
and feed rate). Rao et al. [133] reported the mechanism of aniline alkylation
with methanol over AlPO4-5 molecular sieve. They observed that in aniline
methylation, N-methylaniline appears to be favoured at low temperatures (less
than 598K). This is subsequently converted to N,N-dimethylaniline (NNDMA),
which itself isomerises to N-methyl toluidine. As the temperature is increased
above 598K, isomerisation occurs in large measure by the carbocation
mechanism, as demonstrated by studying the reaction of NNDMA. Ono et al.
[135,136] reported the alkylation of aniline with methanol and dimethyl
carbonate (DMC) over faujasite X and Y. They showed that faujasite (X and Y)
was a better catalyst than ZSM-5, KL and Na-mordenite with regard to activity
and selectivity. In particular, at the experimental conditions used (453 K), KY
was a very good catalyst giving up to 99.6% conversion with 93.5% N-
methylaniline (NMA) selectivity, the other product being mainly N,N-dimethyl
aniline (NNDMA). DMC was a better methylating agent than methanol.
Barthomeuf et al. [137,138] studied the selectivity to mono or dialkylation in
the reaction of aniline with dimethylcarbonate on alkaline faujasite, EMT and
beta zeolites. They concluded that K-EMT was as selective as KY for the
formation of NMA from aniline and DMC. EMT zeolite exchanged with K or
other cations was also a good catalyst for alkylation of other compounds.
Alkaline X-zeolites were the best catalysts for the production of NNDMA. The
experimental conditions (space velocity, reactant ratio) could be optimized to
improve the performance in the formation of NMA or NNDMA. Park et al.

40
[128] reported the selective alkylation of aniline with methanol over
metallosilicates. According to their observation the selectivity for NNDMA is
higher when metallosilicates possess larger amount of medium acid sites (567 -
673 K). Barthomeuf et al. [129,130] also reported the alkylation of aniline with
methanol. They investigated changes in selectivity with acidobasicity of
faujasite catalysts and also compared the acid base properties of faujasite, and
MOR (Na form) in benzene adsorption and alkylation of aniline with methanol.
They concluded that the alkylation of aniline by methanol involved the
participation of acid (cations) and basic (anions) sites of the faujasites.
NNDMA was produced mainly over X-zeolites. The more basic zeolites (X and
Y exchanged with K, Rb and Cs) favoured the production of N-alkylated
anilines. The zeolites with the more acidic cations, Li and Na, gave rise to C-
alkylation. C-alkylation which requires acid sites could be limited by more basic
ions, like in KY or RbY. The considerable aging observed in the more basic
zeolites might result from an anionic polymerization which poisons the active
sites. They also concluded that the most active zeolites are NaX, NaY and
NaEMT. This probably was due to both a strong oxygen basicity (NaX, NaY)
responsible for formation of N-alkylates and a higher number of accessible Na+
ions leading to C-alkylation. The most selective zeolites were Na-L and Na-
MOR which very likely did not have enough accessible cations i.e. acid sites, for
C-alkylation to prevail. The deactivation, suggested to arise from an anionic
polymerization involving aniline with methanol, was favoured on zeolites with

41
acessible basic sites. In addition to the participation of acid (cations) and basic
(oxygen) sites, the reaction involved parameters specific to each structure.
Selva et al. [139] reported the monomethylation of primary amines by DMC
over X and Y type zeolites. According to them the unusual mono N-alkyl
selectivity observed was likely to be due to synergistic effects between the
double reactivity of DMC (acting both as a methylating and as a reversible
methoxy carboxylating agent) and the dual acid base properties of zeolites along
with the steric demand by their cavities. Besides, the high selectivity which
allows high purity mono NMA to be prepared, the reaction also has remarkable
environmentally benign features: it uses the non toxic DMC, no inorganic wastes
are produced and no solvent is required.
Campelo et al. [140-145] reported the N-alkylation of aniline with methanol
over CrPO4 and CrPO4-AlPO4 (15-50 wt% AlPO4) catalysts. According to them,
N-alkylated products result in selectivity of over 90 mole% throughout the 573-
673 K temperature range. Varying the feed rates indicated that low contact time
and low temperature promote the N-mono methylation reaction. Moreover, N,N-
dimethyltoluidines (p- > o-) are only present in very small quantities at the
highest temperatures and/or contact times. On the other hand, the addition of
AlPO4 to CrPO4 did not cause any significant change in the selectivity pattern
exhibited by the CrPO4 catalyst. This behaviour could indicate that similar
adsorbed active species are formed on CrPO4 and CrPO4-AlPO4 catalyst.
Furthermore, there is no simple relationship between aniline alkylation activity
and surface acidity measured by pyridine and 2,6-dimethylpyridine adsorption at

42
573 - 673K. They also examined AlPO4, metal oxide (Al2O3, TiO2 and ZrO2),
SAPO-5 and a commercial silica alumina catayst [142]. They found CrPO4, and
CrPO4-AlPO4 catalyst to be less active, but more selective for the N-
monomethylation process yielding N-methylaniline at similar conversion levels.
Murugesan et al. [143] reported aniline methylation over AFI and AEL type
molecular sieves. According to them due to the presence of strong acidic sites,
CoAPO-5 and ZAPO-5 gave a considerable amount of N-methyltoluidine (NMT)
apart from NMA and NNDMA. Although CoAPO-11 and ZnAPO-11 possessed
strong acid sites, these two catalysts did not produce NMT. The reason for the
absence of NMT over these two catalysts (CoAPO-11, ZnAPO-11) was
attributed to the smaller pore size, which may not be sufficient for the formation
of NMT. They concluded that weak acid and moderate acid sites are sufficient
for N-alkylation, whereas strong acid sites are mandatory for C-alkylation and
the increase of NMT with the simultaneous decrease of NMA over CoAPO-5
and ZnAPO-5 with increase in contact time was due to further C-alkylation of
NMA.
Bautista et al. [141] also reported that N-alkylated products (NMA and
NNDMA) are formed by the stepwise first order reaction processes. Moreover,
strong acid sites were not required for N-methylation of aniline whereas weak to
moderate acid sites seem to be responsible for the reaction. Furthermore, there
was no catalyst deactivation by coke deposition, whereas the addition of pyridine
or dimethyl pyridine deactivated the catalyst. Narayanan et al. [144,145]
reported aniline alkylation with ethanol over zeolites and vanadium modified

43
zeolites prepared by solid state exchange method. According to them, in
addition to the acid base properties, geometric effects characteristic of each
zeolite govern aniline alkylation. Three dimensional and mildly acidic zeolites
(HZSM-5, HY and HY) were more active than widepore unidimensional and
strongly acidic H-mordenite. Vanadium addition improved the activity by i)
blocking the strong acid sites and ii) by creating V4+ species due to vanadium-
zeolite interaction, which acted as active sites for alkylation. V4+ species may
also act as carbonium ioncreating sites, thereby helping aniline alkylation and
only weak /moderate acid sites may be required to trigger the reaction. They also
reported that template free zeolites (SiO2 / Al2O3 = 28, synthesis duration = 168
h) gave more aniline conversion compared to HZSM-5 synthesized with
template. Recently Rao et al. [146,147] studied N-alkylation over Zn1-xNixFe2O4
(x = 0, 0.2, 0.5, 0.8, 1) types of catalysts and over Zn-Co-Fe ternary spinel
system. According to them Zn1-xNixFe2O4 (x = 0, 0.2, 0.5, 0.8 and 1) can
efficiently alkylate aniline to give N-methylaniline selectively (∼99%). Even at
low concentration of methanol in the feed, these catalysts exhibited high activity.
They suggested that DMC produced both NMA and NNDMA and MeOH was a
better alkylating agent than DMC over these catalysts.
1.9 OBJECTIVES OF THE THESIS
A survey of the literature reported above reveals that solid bases such as
alkali exchanged zeolites and alkali loaded oxides are interesting catalysts in
that they catalyze alkylation at C-, O- and N-. Though much research has been

44
carried out on many catalysts, alkali dopped SiO2 has not been sufficiently
investigated. Besides, C-alkylation reactions over alkali exchanged zeolite X
has not been investigated to any significant extent using dimethyl carbonate, a
very safe and active alkylating agent. It was therefore decided to carry out
detailed investigations on C-, O- and N-alkylation properties of alkali
exchanged zeolites, MCM-41 and alkali loaded silica. Again, correlations
between measured basicities and catalytic activities have not been clearly
established in many of the published catalyst-reaction systems. It was also,
therefore proposed to measure the basicities of the catalysts and relate them to
their catalytic activities. The specifics of the research undertaken are presented
below.
1) Synthesis of zeolite-X, KL, ferrierite, silicalite-1 and mesoporous MCM-41.
Introducing allkali metal ions (K and Cs) by ion exchanging or impregnation
methods.
2) Preparation of alkali (Li, Na, K, Cs) loaded silica.
3) Characterization of the zeolites and alkali loaded silica by physicochemical
and spectroscopic methods such as XRD, N2 sorption, TPD of CO2 , IR of
adsorbed CO2 and MAS-NMR.
4) Evaluation of the catalytic activity of alkali exchanged X in the side chain
C-alkylation of toluene and ethylbenzene with dimethylcarbonate in the vapour
phase.
5) Study the catalytic activity of alkali loaded silica and Cs loaded MCM-41 in
the O-alkylation of hydroxyaromatic compounds such as phenol, cresols (ortho,

45
meta and para), catechol, resorcinol, hydroquinone and 2-naphthol with
methanol in the vapour phase.
6) Examination of the catalytic activity of Cs loaded X, L, ferrierite, silicalite-1
and MCM-41 in the N-alkylation of aniline with methanol and
dimethylcarbonate in the vapour phase.
1.10 REFERENCES
1. H. Pines, J.A. Vaseley and V.N. Ipatieff, J. Am. Chem. Soc. 77, 6314
(1955).
2. R.J. Kokes, A.L. Dent, Advan. Catal. 22, 1 (1972).
3. R.J. Kokes, Proceedings of the 5th International Congress on Catalysis,
Miami Beach, FL, 1972; p.1.
4. H. Hattori, N. Yoshii and K. Tanabe, Proceedings of the 5th
International Congress on Catalysis, Miami Beach, FL, 1972, p. 233.
5. T. Yashima, K. Sato; T. Hayasaka and N. Hara, J. Catal. 26, 303
(1972).
6. H. Hattori, Chem. Rev. 95, 537, (1995).
7. D. W. Breck, in “Zeolite Molecular Sieves”, Willey, New York, p.460,
1974.
8. D. Barthomeuf, Cat. Rev. Sci .& Eng. 38(4), 521 (1996).
9. C. Mirodatos, P. Pichat and D. Barthomeuf, J. Phys. Chem. 80, 1335
(1976).
10. C. Mirodatos, A. Abou Kais, J. C. Vedrine, P. Pichat and D.
Barthomeuf, J. Phys. Chem. 80, 2366 (1976).

46
Barthomeuf, J. Phys. Chem. 80, 2366 (1976).
11. C.J. Planck, 3rd Proc. Int. Congress on Catalysis, Amsterdam, 1964,
Vol.1, p. 727.
12. R.A. Van Santen, B.W.H.Van Beest and A.J.M. de Man, in
“Guidelines for Mastering the Properties of Molecular Sieves” (D.
Barthomeuf, E.G. Derouane, and W. Holdrich, eds.) NATO ASI series,
Plenum Press, New York, 1990, Ser. B: Physics, Vol. 221, p. 201.
13. R.T. Sanderson, “Chemical Bonds and Bond Energy”, Academic
Press, New York, 1976.
14. R.T. Sanderson, J. Am. Chem. Soc. 105, 2259 (1983).
15. G.V. Gibbs, E.P. Meagher, J.V. Smith and J. J. Pluth, ACS Symp. Ser.
40, 19 (1977).
16. A. Abou-Kais, C. Mirodatos, J. Massardier, D. Barthomeuf and J. C.
Vedrine, J. Phys. Chem. 81, 397 (1977).
17. P. E. Hathway and M. E. Davis, J. Catal. 116, 263 (1989).
18. P.E. Hathway and M. E. Davis, J. Catal. 116, 279 (1989).
19. T. Turk, F. Sabin, and A. Vogler, Mater. Res. Bull. 27, 1003 (1992).
20. M. Lasperas, H. Cambon, D. Brunel, I. Rodriguez, and P. Geneste,
Microp. Mater. 1, 343 (1993).
21. H. Tsuji, F. Yagi, H. Hattori and K. Kita, Proc. 10th Inter. Cong. Catal.
Budapest (L. Guczi,, F. Solymosi, and P. Tetenyi, eds.) Akademiai
Kiado, Budapest, B, 1171 (1993).
22. K Tanabe, “Solid Acids and Bases”, Kodansha, Tokyo, 1970.

47
23. J. A. Rabo, C. L. Angell, P. H. Kasai, and V. Schomarker, J. Faraday.
Soc. 4, 328 (1966).
24. Y. N. Sidorenko, P. N. Galich and V. S. Gutyrya, V. G. II’ in and I. E.
Neimak, Dokl. Akad. Nauk, SSSR 173, 132 (1967).
25. T. Yashima, K. Sato, H.T. Hayasaka and N. Hara, J. Catal. 26, 303
(1972).
26. P.E. Hathaway and M.E. Davis, J. Catal. 116, 263 (1988).
27. P.E. Hathaway and M.E. Davis, J. Catal. 119, 497 (1988).
28. P.E. Hathaway and M.E. Davis, J. Catal. 116, 279 (1988).
29. J.C. Kim, H.-X. Li, C.-Y. Chen and M. Davis, Micropor. Mater. 2, 413
(1994).
30. J. Ward, in “Zeolite Chemistry and Catalysis” (J. Rabo. Eds.), ACS
Monograph 171, 233 (1976).
31. J. Engelhardt, J. Szanyi and B. Jover, Acta Symp Ibero-Amer, Catal, 9th
2, 1435 (1984).
32. C. Lacroix, A. Deluzarche, A. Kiennemann, and A. Boyer, J. Chem.
Phys. 81, 473, 481, 486 (1984).
33. D. Barthomeuf and V. Barbarin, French Patent, 2,623,423 (1989).
34. D. Archier, G. Coudurier and C. Naccache, Proc. 9th Int. Zeol. Conf.,
Montreal (R. Van Ballmoos, J.B. Higgins and M.M.J. Treacy, eds.),
Butterworth-Heinemann, Boston, II, 525 (1993).
35. S. Kawi, J.R. Chang and B.C. Gates, J. Catal. 142, 585 (1993).
36. J. M. Graces, G.E. Vrieland, S.I. Bates and F.M. Scheidt, Stud. Surf.
Sci. Catal. 20, 67 (1985).
48
Sci. Catal. 20, 67 (1985).
37. J.C. Kim, H.X. Li and M.E. Davis, Sym. New. Catal. Chim., Div.
Petrol. Chem. 206th National Meeting, Am. Chem. Soc., Chicago 38,
776 (1993), J.C. Kim, H.X. Li, C.Y.Chen, and M.E.Davis, Microp.
Mater. 2, 413 (1994).
38. I. Rodriguez, H. Cambon, D. Drunel, M. Lasperas and P. Geneste,
Stud. Surf. Sci. Catal. 78, 623 (1993).
39. Rodriguez, H. Cambon, D. Brunel, M. Lasperas and P. Geneste,
Europacat, Montpellier, 1993, Book of Abstracts, I, p. 164.
40. R. M. Dessau, Zeolites, 10, 205 (1990).
41. K.R. Kloestra and H. Van Bekkum, J. Chem. Soc., Chem. Commun.
1005, (1995).
42. M. Lasperas, I. Rodriguez, D. Brunel, H. Cambon and P. Geneste,
Stud. Surf. Sci. Catal. 97, 319 (1995).
43. K.R. Kloetstra, M. Van Laven and H. Van. Bekkum, J. Chem. Soc.,
Faraday Trans. 93(6), 1211 (1997).
44. H. Tsuji, F. Yagi. and H. Hattori, Chem. Lett. 1881 (1991).
45. M. Lasperas, H. Combon, D. Brunel, I. Rodriguez and P. Geneste,
Microp. Mater. 1(5), 343 (1993).
46. M. Lasperas, H. Combon, D. Brunel, I. Rodriguez and P. Geneste,
Microp. Mater. 7, 61 (1996).
47. S. Tsuchiya, S. Takase and H. Imamura, Chem. Lett. 661 (1984).
48. K. Tanabe, M. Misono, Y. Ono and H. Hattori, “New Solid Acids and
Bases”, Kodansha, Tokyo, 1989.

49
Bases”, Kodansha, Tokyo, 1989.
49. G. Suzukamo, M. Fukao and M. Minobe, Chem. Lett. 585 (1987).
50. E. Ruckenstein and A.Z. Khan, J. Catal. 141, 628 (1993).
51. E. Ruckenstein and A.Z. Khan, J. Chem. Soc., Chem. Commun. 1290
(1993).
52. M. A. Paul and F.A. Long, Chem. Rev. 57, 1 (1957).
53. L. P. Hammett, “Physical Organic Chemistry”; McGraw-Hill: New
York, 1940; Chapter IX.
54. J. Take, N. Kikuchi and Y. Yoneda, J. Catal. 21, 164 (1971).
55. R.L. Nelson and J.W. Hale, Disc. Faraday Soc. 52, 77 (1958).
56. A.J. Tench and G.T. Pott, Chem. Phys. Lett. 26, 590 (1974).
57. T. Ito, M. Kuramoto, M. Yoshida and T. Tokuda, J. Phys. Chem. 87,
4411 (1983).
58. T. Ito, T. Murakami and T. Tokuda, J. Chem. Soc. Trans. Faraday I
79, 913 (1983).
59. Y. Okamoto, M. Ogawa, A. Maezawa and T. Imanaka, J. Catal. 112,
427 (1988).
60. M. Huang, A. Adnot and S. Kaliaguine, J. Catal. 137, 322 (1992).
61. E.J. Doscocil, S.V. Bordawekar and R.J. Davis, J. Catal. 169, 327
(1997).
62. A. Auroux and A. Gervasini, J. Phys. Chem. 94, 6371 (1990).
63. F. Solymosi and H. Knozinger, J. Catal. 122, 166 (1990).
64. H. Tsuji, F. Yagi and H. Hattori, Chem. Lett. 1881 (1991).

50
65. D. Barthomeuf, J. Phys. Chem. 55, 138 (1978).
66. D. Barthomeuf, Stud. Surf. Sci. Catal. 65, 157 (1991).
67. A. M. Brownstein, in “Catalysis of Organic Reactions” (W.R. Moser,
Ed.), p. 3 Dekker, New York, 1981.
68. K. Tanabe, O. Takahashi and H. Hattori, Reac. Kinet. Catal. Lett. 7,
347 (1977).
69. W. Holderich, M. Hesse and F. Navmann, Angew. Chem. Int. Ed. Engl.
27, 226 (1998).
70. W.W. Kaeding, C. Chu, L.B. Young, B. Weinstein and S.A. Butter, J.
Catal. 67, 159 (1981).
71. J. Datka, Z. Piwowarska, J. Rakoczy and B. Sulikowski, Zeolites 8,
199 (1988).
72. Y.S. Bhat, A.B. Halgeri, T.S.R. Prasada Rao, Ind. Eng. Chem. Res. 28,
890 (1989).
73. J. Engelhardt, J. Szanyi and J.Valyon, J. Catal. 107, 296 (1987).
74. Y. N. Sidorenko and P.N. Galich, Dokl. Acad. Nauk. SSSR 174, 1234
(1968).
75. M.D. Sefcik, J. Am. Chem. Soc. 101, 2164 (1979).
76. A. Philippou and M.W. Anderson, J. Am. Chem. Soc. 116, 5774
(1994).
77. M. L. Unland, and G. E. Barkar, in ”Catalysis of Organic Reactions”,
(W.R. Moser, Ed.) p. 51, Dekker, New York, 1981.
78. H. Itoh, T. Hattori, K. Suzuki and Y. Murakami, J. Catal. 79, 21
(1983).

51
(1983).
79. H. Itoh. A. Miyamoto and Y. Murakami, J. Catal. 64, 284 (1980).
80. C. Lacroix, A. Deluzarche, A. Kienneman and A. Bayer, Zeolites 4,
109 (1984).
81. J. J. Freeman and M. L. Unland, J. Catal. 54, 183 (1978).
82. M.L. Unland and J. J. Freeman, J. Phys. Chem. 82, 1036 (1978).
83. M. L. Unland, J. Phys. Chem. 82, 580 (1978).
84. Y.N. Sidorenko and P.N. Gallich, Ukr. Khim. Zh. 36, 1234 (1970).
85. S.T. King and J. M. Graces, J. Catal. 104, 59 (1987).
86. B. K. Vasanthy, M. Palanichamy and V. Krishnaswamy, Appl. Catal.
A: Gen. 148, 51 (1996).
87. C.S. Haung and A. -N. Ko, Catalysis Lett. 19, 319 (1993).
88. G. M. Singerman, “Methyl Aryl Ethers from Coal Liquids as Gasoline
Extenders and Octane Improvers” Dept. of energy, CE 5022-1,
Washington, 1980.
89. A. Matsukuma, I. Takagishi and K. Yoshido, Patent. Japan, Kokai
7357935.
90. A.S. Barbara and N. Leo Benoiton, Tetrahedron Lett. 1, 21 (1973).
91. S. Balsama, P. Beltrame, P.L. Beltrame, P. Carniti, L. Forni and G.
Zuretti, Appl. Catal. 13, 161 (1984).
92. P.D. Chantal, S. Kaliaguine and J.L. Grandmaison, Appl. Catal. 10,
317 (1984).
93. P. D. Chantal, S. Kaliaguine and J.L. Grandmaison, Appl. Catal. 18,
133 (1985).

52
133 (1985).
94. M. Renaud, P.D. Chantal and S. Kaliaguine, Can. J. Chem. Eng. 64,
787 (1986).
95. V. Durgakumari, S. Narayanan and L. Guczi, Catal. Lett. 5, 377
(1990).
96. V. Venkata Rao, K.V.R. Chary, V.Durgakumari and S. Narayanan,
Appl. Catal. 61, 89 (1990).
97. E. Santacesaria, D. Grasso, D. Gelosa and S. Carra, Appl. Catal. 64, 83
(1990).
98. C. Bezouhanova and M.A. Al-Zihari, Appl. Catal. A: Gen. 83, 45
(1992).
99. Zi - Hua Fu and Y. Ono, Catal. Lett. 21, 43 (1993).
100. M.C. Samolada, E. Grigoriadou, Z. Kiparissides and I.A. Vasalos, J.
Catal. 152, 52 (1995).
101. J. Xu, A.Z. Yan and Q. H. Xu, Reac. Kinet. Catal. Lett. 62(1), 71
(1997).
102. T. Beutel, J. Chem. Soc., Faraday Trans. 94(7), 985 (1998).
103. F. M. Bautista, J. M. Campelo, A. Garcia, D. Luna, J.M. Marinas and
A.A. Romeo, Reac. Kine. Catal. Lett. 63(2), 261 (1998).
104. S.C. Lee, S.W. Lee, K.S. Kim, T.J. Lee, D.H. Kim, J.C. Kim, Catal.
Today 44, 253 (1998).
105. Y. Fu, T. Baba and Y. Ono, Appl. Catal. A: Gen. 166, 419 (1998).
106. Y. Fu, T. Baba and Y. Ono, Appl. Catal. A: Gen. 166, 425 (1998).

53
107. Y. Fu, T. Baba and Y. Ono, Appl. Catal. A: Gen. 176, 201 (1999).
108. Kirk-Othmer, in “Encyclopodia of Chemical Technology”, Wiley,
New York, 3rd edn., 2, 309 (1978).
109. J. March, in “Advanced Organic Chemistry”, Wiley, New York, 4th
edn. 1991.
110. A. K. Bhattacharya and D.K. Nandi, Ind. Eng. Chem. Prod. Res. Dev.
14, 162 (1975).
111. A.G. Hill, J.H. Shipp and A.J. Hill, Ind. Eng. Chem. 43, 1579 (1951).
112. T. H. Evans and A.N.Bourns, Can. J. Tech. 29, 1 (1951).
113. J.M. Parera, A. Gonzalez and A. Barral, Ind. Eng. Chem. Prod. Res.
Dev. 7, 259 (1968).
114. C. M. Naccache and Y.B. Taarit, J. Catal. 22, 171 (1971).
115. N. Takamiya, Y. Koinuma, K. Ando and S. Murai, Nippon Kagaku
Kaishi, 1452 (1979).
116. N. Kakamiya, H. Yamabe, K. Ando and S. Murai, Nippon Kagaku
Kaishi, 1316 (1980).
117. L.K. Doraiswamy, G.R.V. Krishnan and S.P. Mukherjee, Chem. Eng.
88, 78 (1981).
118. H. Matsuhashi and K. Arata, Bull. Chem. Soc. Jp. 64, 2605 (1991).
119. A. N. Ko, C. L. Yang, W. Zhu and H. Lin, Appl. Catal. A: Gen. 134,
53 (1996).
120. M. Onaka, K. Ishikawa and Y. Izumi, Chem. Lett. 1783 (1982).
121. O. Mokoto, I. Koji and I. Yusuke, J. Inclusion Phenom. 2, 359 (1984).

54
122. G.O. Chivadze and L.Z. Chkheidze, Iz. Akad. Nauk. Gruz. SSR, Ser.
Khim. 10, 232 (1984).
123. P.Y. Chen, M.C. Chen, H.Y. Chu, N.S. Chang and T.K. Chuang, in
“New Developments in Zeolite Science and Technology” (Y.
Murakami, A. Iijima and J.W. Ward, Eds.), p. 739, Elsevier,
Amsterdam.
124. K.G. Ione and O.V. Kikhtyanin, in “Zeolites: Facts, Figure, Fiture”
(P.A. Jacobs and R.A. van Santen, Eds.), p. 1073, Elsevier,
Amsterdam, 1989.
125. S.I. Woo, J.K. Lee, S.B. Hong, Y.K. Park and Y.S. Hu, in “Zeolites:
Facts, Figure, Fiture” (P.A. Jacobs and R.A. van Santen, Eds.), p.
1095, Elsevier, Amsterdam, 1989.
126. P.Y. Chem, S.J. Chu, N.S. Chuang and T.K. Chuang, in “Zeolites:
Facts, Figure, Fiture” (P.A. Jacobs and R.A. van Santen, Eds.), p.
1105, Elsevier, Amsterdam, 1989.
127. O.V. Kikhtyanin, K.G. Ione, L.V. Malysheva and A.V. Toktarev, in “
Chemistry of Microcrystals” (T. Inui, S. Namba and T. Tatsumi, Eds.),
p. 319, Elsvier, Amsterdam, 1991.
128. Y.K. Park, K.Y. Park and S. I. Woo. Catal. Lett. 26, 169 (1994).
129. B.L.Su and D. Barthomeuf, Appl. Catal. A: Gen. 124, 73 (1995).
130. B.L.Su and D. Barthomeuf, Appl. Catal. A: Gen. 124, 81 (1995).
131. P.R.H.P. Rao, P. Massiani and D. Barthomeuf, in “Zeolite Science
1994: Recent Progress and Discussions (H.G. Karge and J. Weitkamp,
Eds.), p. 287, Elsvier, Amsterdam, 1985.

55
Eds.), p. 287, Elsvier, Amsterdam, 1985.
132. P.S. Sing, R. Bandyopadhyay an1d B.S. Rao, Appl. Catal. A 136,
177(1996).
133. S. Prasad and B.S. Rao, J. Mol. Catal. 62, L17 (1990).
134. S.M. Yang and T.W. Pan, J. Chin. Chem. Soc. 42, 935 (1995).
135. Z.H. Fu and Y. Ono, Catal. Lett. 18, 59 (1993).
136. Z.H. Fu and Y. Ono, Catal. Lett. 22, 277 (1993).
137. P. R. Hariprasad Rao, P. Massiani and D. Barthomeuf, Stud. Surf. Sci.
Catal. 84, 1449 (1994).
138. P. R. Hariprasad Rao, P. Massiani and D. Barthomeuf, Catal. Lett. 31,
115 (1995).
139. M. Selva, A. Bomben and P. Tuldo, J. Chem. Soc., Perkin. Trans. 1,
1041 (1999).
140. F. M. Bautista, J. M. Campelo, A. Garcia, D. Luna, J. M. Marina, A.A.
Romero and M.R. Urbano, J. Catal. 172, 103 (1997).
141. F. M. Bautista, J. M. Campelo, A. Garcia, D. Luna, J. M. Marina and
A.A. Romero, Appl. Catal. A: Gen. 166, 39 (1998).
142. F. M. Bautista, J. M. Campelo, A. Garcia, D. Luna, J.M. Marinas and
A.A. Romero, Stud. Surf. Sci. Catal. 108,123 (1997).
143. S.P. Elangoven, C. Kannan, B. Arabindo and V. Murugesan, Appl.
Catal. A: Gen. 174, 213 (1998).
144. S. Narayanan and A. Sultana, Appl. Catal. A: Gen. 167, 103 (1998).
145. S. Narayanan and K Deshpande, Appl. Catal. A: Gen., 199, 1 (2000).

56
146. K. Sreekumar, T. Raja, B.P. Kiran, S. Sugunan and B.S. Rao, Appl.
Catal.A: Gen. 182, 327 (1999).
147. K. Sreekumar, T. Mathew, S.P. Mirajkar, S. Sugunan and B.S. Rao,
Appl. Catal. A: Gen. 201, L1 (2000).

57
CHAPTER CHAPTER -- II II
EXPERIMENTAL AND
CHARACTERIZATION

58
2.1 INTRODUCTION
Zeolites possess cations in extra framework positions, which can be
exchanged with H+ (protons) to generate Bronsted acid sites. Pure Si analogues of
zeolites (silicalites) are almost neutral. It is reported that as synthesized X and L are
slightly basic. Basic zeolites can be prepared by exchanging the extra framework
cations by cations of alkali metals like K, Rb, Cs etc. or by impregnating with alkali
metal salts (acetate / hydroxide) followed by calcination. Basic sites can be
generated in neutral oxides like SiO2 by loading alkali metal oxides. Just as the
acidity of solids can be characterized by adsorption and temperature programmed
desorption (TPD) of basic compounds like NH3 and amines, basic materials can be
characterized by adsorption / desorption of weakly acidic gases like CO2 or
compounds like pyrrole. In this chapter, the procedures adopted for the preparation
of the various basic zeolite and oxide catalysts are described. The various methods
used in the characterization of the catalysts and the physicochemical characteristics
of the catalysts are presented. Detailed characterization of the basicity of the
catalysts has been carried out by TPD and FTIR spectra of adsorbed CO2.
2.2 PREPARATION OF CATALYSTS
2.2.1 Synthesis of molecular sieves
2.2.1.1 Synthesis of zeolite -X
Zeolite-X was synthesized using the gel composition in terms of oxides:
4.54 Na2O : 3.44 SiO2 : Al2O3 : 180H2O.

59
Sodium silicate (28.6 % SiO2, 8.88 % Na2O and 62.6% H2O) was used as
the silica (SiO2) source and NaAlO2 was used as the alumina (Al2O3) source. In a
typical synthesis [1], 18.6 g sodium silicate was taken in a beaker and a mixture of
5.9 g sodium aluminate, 3.9 g sodium hydroxide and 70 g water was added to it.
The mixture was stirred for 2 h, transferred into an autoclave, aged for 24 h at room
temperature and then heated for six hour at 373K. The product was filtered, washed
with distilled water and dried at ambient temperature.
2.2.1.2 Synthesis of zeolite-L
Zeolite-L was synthesized using the gel composition in terms of oxides:
2.62 K2O : 10 SiO2 : Al2O3 : 158H2O.
Fumed silica was used as the silica source and pseudoboehmite (Catapal-B)
was used as the alumina source. In a typical synthesis [2], 9 g KOH and 1.55 g
pseudoboehmite (Catapal-B) were dissolved in 45 g water and fumed silica was
added to it. The mixture was stirred for 2 h and transferred into an autoclave. The
gel was heated at 415K for 108h. The product was filtered, washed with distilled
water and dried at ambient temperature.
2.2.1.3 Synthesis of Si-MCM-41
Si-MCM-41 samples were prepared hydrothermally using a gel with the
following molar composition in terms of oxides [3]:
SiO2 : 0.27 (CTMA)2O : 0.13 (TMA)2O : 60 H2O.
Sodium silicate (28.48% SiO2, 9.03% Na2O, 62.5% H2O),
cetyltrimethylammonium bromide (99%, Aldrich), tetramethylammonium

60
hydroxide (TMAOH, 25% aqueous solution, Aldrich), and fumed silica (Cab-O-Sil,
99%, Fluka) were used in the synthesis.
In a typical synthesis, 18.9 g TMAOH was added to 16.9 g sodium silicate
diluted with 100 g water. In another beaker, 19.7 g CTMABr was dissolved in 50 g
water and 30 g ethanol and 1.9 g aqueous ammonia solution was added to it
(solution A). Solution A was added to the above mixture of sodium silicate and
TMAOH and then 7.1 g fumed silica was added to it. The combined mixture was
stirred for 1h. The gel formed (pH = 11.5-12) was then transferred to an autoclave
and heated at 373K for 5 days. The product was filtered, washed with distilled water
and dried at ambient temperature. The sample was calcined at 813K in nitrogen
flow for 1h and then in air for 6h.
2.2.1.4 Synthesis of silicalite -1
The silicalite-1 sample was prepared hydrothermally using a gel with the
following molar composition [4]:
0.99TPABr : 0.026 Na2O : SiO2 : 24.8 H2O.
Tetramethyl ammoniumsilicate was the silica source. Tetrapropyl
ammonium bromide was used as the template. In a typical synthesis, 26.6 g TPABr
was dissolved in 25 g H2O and then 0.21 g NaOH dissolved in 20 g H2O was added
to it. The mixture was stirred for 1h and then 10.6 g tetramethyl ammoniumsilicate
was added to it. The mixture was stirred further for 1h. The gel formed (pH = 11.5-
12) was then transferred to an autoclave and heated at 445K for 72 h. The product
was filtered, washed with distilled water and dried at ambient temperature. The
sample was calcined at 813K in nitrogen flow for 1h and then in air for 6h.

61
2.2.1.5 Synthesis of ferrierite
The ferrierite sample was prepared hydrothermally using a gel with the
following composition in term of oxides:
27.2 Na2O : 32 Py : 50 SiO2 : 5 H2SO4 : 1798 H2O.
Sodium silicate (28.48% SiO2, 9.03% Na2O, 62.5% H2O), pyrrolidine and
H2SO4 were used in the synthesis. In a typical synthesis [5], 52.5 g sodium silicate
was dissolved in 70 g H2O and 1.8 g H2SO4 (98%, S.D. Fine-chem Ltd., India) in 10
g H2O was added to it. After stirring for 1h, 10 g pyrrolidine was added to it. The
mixture was transferred into an autoclave and heated at 433K for 40 h. The product
was filtered, washed with distilled water and dried at ambient temperature. The
sample was calcined at 813K in nitrogen flow for 1h and then in air for 6h.
2.2.2 Modification of supports
2.2.2.1 Ion exchange
Ion exchange of zeolite-X was carried out using both hydroxide and chloride
solutions (1M) of K and Cs. Ion exchange was carried out at 353K using 50 ml of
solution per g of sample (6h duration). The exchange procedure was repeated six
times. The ion exchanged zeolites were washed with deionised water and dried at
383K for 12h. The degree of ion exchange was estimated by flame photometry and
atomic adsorption spectroscopy.
Ion exchange of zeolite L was carried out using 1M cesium hydroxide
solution. 50 ml / g of the sample was used for each exchange. Six exchanges were
carried out at 353K. The ion exchanged zeolites were washed with deionised water
and dried at 383K for 12h.

62
2.2.2.2 Impregnation
2.2.2.2.1 Preparation of Cs-MCM-41
Samples of Cs loaded MCM-41 were prepared by stirring 5 g of MCM-41 in
a solution containing the appropriate amount of cesium acetate in 30 g methanol for
3 h at 333K. The solvent was removed quickly under vacuum in a rotary evaporator
and the materials were subsequently dried at 383K for 6 h and then calcined at
813K for 8 h in air. The amounts of cesium acetate used per g of Si-MCM-41 to
prepare the different catalysts are given in Table 1.1.
2.2.2.2.2 Preparation of alkaline silica
Fumed silica (Cab-osil, Surface area = 166 m2 / g) was used as a support for
alkali (Li, Na, K and Cs) oxides. The different alkali loaded catalysts were prepared
by an impregnation procedure using minimum amount of metal hydroxide / acetate.
In this method, the required amount of M-OAc (M = Li, Na, K and Cs) was
dissolved in 50 ml water, then 10 g fumed silica was added to it with constant
stirring at 353K. The mixture was evaporated to dryness at 333K and further dried
at 383K for 6 h. It was then calcined at 813K in air. The amount of metal salts used
per g of silica to prepare the different catalysts are presented in Table 2.2.
2.2.2.2.3 Preparation of Cs-silicalite and Cs-ferrierite
Samples of Cs-loaded silicalite-1 and ferrierite were prepared by taking 10 g
of silicalite-1 / ferrierite in a solution containing an appropriate amount (3 wt% Cs)
of cesium acetate in 50 g methanol. The solution was stirred for 3h at 333K. The
solvent was removed quickly under vacuum in a rotary evaporator and the materials
were subsequently dried at 383K for 6 h and then calcined at 813K for 8 h in air.

63
Table 2.1 Amount of Cs acetate used to prepare the different catalysts
Sample name a Cesium aetate (g)b
Cs(0.075) MCM-41 0.014
Cs(0.15) MCM-41 0.028
Cs(0.225) MCM-41 0.043
a The number in brackets denotes the mmole of alkali metal loaded per g of
Si-MCM-41; b Amount used per g of MCM-41.
Table 2.2 Amount of metal salts taken as acetate / hydroxide for preparing the
different catalysts
Samplea M-acetateb (g) M-hydroxideb (g)
Li (1.5)SiO2 0.099 0.036
Li (2.25)SiO2 0.148 0.054
Na (1.5)SiO 2 0.123 0.06
Na(2.25)SiO 2 0.184 0.09
K(1.5)SiO 2 0.147 0.084
K (2.25)SiO 2 0.22 0.13
Cs(0.075)SiO 2 0.014 0.011
Cs(0.375)SiO 2 0.072 0.056
Cs(0.75)SiO 2 0.145 0.112
Cs(1.5)SiO 2 0.29 0.225
Cs(2.25)SiO 2 0.43 0.337
a The number within brackets denotes the mmole of alkali metal loaded per g of
SiO2; b M = Li, Na K and Cs; amount used per g of silica

64
2.3 CHARACTERIZATION
2.3.1 X-ray diffraction (XRD)
X-ray diffraction measurements were carried out using Ni-filtered CuKα
radiation (Rigaku, D/MAX-VC). X, L, ferrierite, silicalite-1 and MCM-41 were all
highly crystalline materials. For X and L, a decrease in peak intensities of the
samples with increasing size of the exchanging cations was noticed. For zeolite X,
the peaks were slightly less intense when exchanged with hydroxide solutions, than
when exchanged with chloride solutions. Similar results were earlier reported by
Englehardt et al. [6].
For Cs-loaded ferrierite, silicalite-1 and MCM- 41 samples, the peak
intensities were almost the same as those of the parent samples. The XRD figures
of some of the samples are given in Fig. 2.1.
XRD revealed all the alkali (Li, Na, K and Cs) loaded silica samples to be
amorphous.
2.3.2 Surface area
The surface areas of the samples were calculated from N2 sorption isotherms
using the BET procedure. The surface areas of the various samples are presented in
Table 2.3. The surface areas decrease on exchange with heavier metal atoms. For
silicalite and ferrierite samples, surface area decreases with Cs-loading. The results
are presented in Table 2.4. For MCM-41, surface area also decreases with Cs-
loading. The average pore diameter also decreases with metal loading. The results
are given in Table 2.5. The decrease in pore diameter is probably due to the large
diameter of the Cs ions (3.34Å; ionic) narrowing the dimensions of the pores.

65
Fig. 2.1 XRD patterns of the samples: (a) Cs-Silicalite-1; (b) Cs-Ferrierite;
(c) CsL; (d) CsX(OH) and (e) Cs(0.225)MCM-41.

66
Table 2.3 Composition and surface area of ion exchanged X and L zeolites
Catalyst Si / Al % Na % K % Cs BET surface
area (m2/ g)
NaX 1.34 100 - - 712
KX(Cl) 1.34 18 82 - 624
KX(OH) 1.34 12 88 - 600
CsX(Cl) 1.34 49 - 51 572
CsX(OH) 1.34 48 - 52 550
KL 3.5 - 100 - 416
CsL 3.5 - 36 64 352
Table 2.4 Surface areas of silicalite and ferrierite samples
Sample Si / Al Surface area (m2 / g)
Silicalite-1 α 432
Cs(0.225)-silicalite-1 α 379
Ferrierite α 381
Cs(0.225)-ferrierite α 331

67
Table 2.5 Surface areas and average pore diameters of MCM-41 samples
Sample Surface area (m2 / g) Pore diameter (Å)
Si-MCM-41 1049 28
Cs(0.075) MCM-41 837 22
Cs(0.15) MCM-41 771 20
Cs(0.225) MCM-41 625 17.5
For alkali loaded silica samples the surface area decreases with metal
loading. The surface area also decreases with increase in basicity of the metal atom.
As part of the observed decrease in area is due to the large amount of deposited
alkali oxides, surface areas were calculated on alkali free basis also. These values
are given in Table 2.6. These values are also lower than that of pure SiO2. The
decrease in surface area is attributed to the dissolution of the surface by the alkali
during impregnation, fusion of SiO2 particles and pore filling by the alkali oxides.
However, except in the case of samples containing large amounts of Cs (≥ 0.75
mmole/g) and K (2.25 mmole/g), the decrease in area is small (< 10%) suggesting
that the deposited oxide covers the SiO2 surface reasonably uniformly without
causing much pore blockage.

68
Table 2.6 Surface areas of alkali loaded silica samples.
Catalysta Metal loading as oxide (wt%)
S. Areab
(m2/g)
S. Areac
(m2/g).
SiO2 - 166 166
Li(1.5)SiO2 2.25 104 161
Li(2.25)SiO2 3.37 98 160
Na(1.5)SiO 2 4.65 99 158
Na(2.25)SiO 2 6.97 89 154
K(1.5)SiO 2 7.05 91 156
K(2.25)SiO 2 10.57 82 148
Cs(0.075)SiO 2 1.06 149 164
Cs(0.375)SiO 2 5.28 121 157
Cs(0.75)SiO 2 10.5 102 149
Cs(1.5)SiO 2 21.1 70 133
Cs(2.25)SiO2 31.7 56 113
a The number in brackets denotes the mmole of alkali metal loaded per g of SiO2;
b Measured by N2 adsorption (BET method); c normalized to 100% silica.
2.3.3 Intermediate electronegativity (Sint)
The intermediate electronegativity (Sint) of zeolite X was calculated on the basis of
Sanderson's intermediate electronegativity principle [7]. These values are given in
Table 2.7 along with those for alkali loaded silica samples. With increase in
basicity of the exchanged (or deposited) ion, the Sint value decreases.

69
Table 2.7 Intermediate electronegativity (Sint) values
Sample Intermediate
electronegativity (Sint)
Average charge on
the O atom
NaX 3.28 -0.41
KX(Cl) 3.10 -0.44
KX(OH) 3.09 -0.45
CsX(Cl) 3.08 -0.45
CsX(OH) 3.07 -0.45
SiO2 4.25 -0.20
Li(1.5)SiO2 3.98 -0.26
Na(1.5)SiO 2 3.96 -0.26
K(1.5)SiO 2 3.92 -0.27
Cs(0.075)SiO 2 4.22 -0.21
Cs(0.375)SiO 2 4.18 -0.22
Cs(0.75)SiO 2 4.09 -0.23
Cs(1.5)SiO 2 3.91 -0.27
Cs(2.25)SiO 2 3.69 -0.32
2.3.4 Temperature programmed desorption (TPD) of carbon dioxide
Temperature programmed desorption (TPD) of CO2 was carried out with
0.25 g of dried sample in each experiment. The sample was activated at 673 K in
a flow of He at the rate of 30 ml/min and cooled to room temperature. Ultra high
purity CO2 was passed for 1h at room temperature at a flow rate of 25 ml/min,

70
then flushed with He for 90 min (30 ml/min) and the temperature raised to 723K at
the rate of 5K / min in He flow (30 ml/min). The evolved CO2 was estimated
using a TCD (Zeton Altamira AM1-200) to obtain the TPD curves.
The results of temperature programmed desorption (TPD) of adsorbed CO2
of alkali loaded silica and MCM-41 samples are presented in Tables 2.8 and 2.9.
The TPD plots of various alkali metal (Li, Na, K and Cs) loaded silica samples are
shown in Fig. 2.2. The plots for Cs loaded silica and MCM-41 samples are shown
in Fig. 2.3 and Fig. 2.4, respectively. It was found that most of the CO2 desorbed
from the samples below 500K with desorption peak maxima in the range 375 –
425K. Though CO2 adsorbs weakly and desorbs easily from the catalysts, the TPD
data do reveal some information concerning the basicity of the samples. At
constant metal loading (1.5 mmole / g of catalyst), the amount of adsorbed
(actually desorbed) CO2 increases with increasing basicity of the metal (Li to Cs).
An increase in CO2 adsorption is noticed also with an increase in Cs2O loading
both for Cs loaded silica and MCM-41 samples (Tables 2.8 and 2.9). However,
the number of moles of CO2 adsorbed per mole of alkali metal decreases with
increase in Cs2O loading. This is due to lower dispersion and cluster formation in
samples containing higher amount of Cs2O. The basicity trend obtained from TPD
of CO2 matches the trend of intermediate electronegativity (Sint.) values calculated
[7] on the basis of Sanderson’s intermediate electronegativity principle (Table
2.7).

71
Fig. 2.2 TPD plots of CO2 adsorbed on different alkali metal loaded samples:
(a) Li(1.5)SiO2; (b) Na(1.5)SiO 2; (c) K(1.5)SiO 2 and (d)
Cs(1.5)SiO 2.
Fig. 2.3 TPD plots of CO2 adsorbed on different Cs loaded samples: a, b, c, d
and e refer to samples with Cs loading of 0.075, 0.375, 0.75, 1.5 and
2.25 mmolee/g silica, respectively.

72
Fig. 2.4 TPD of CO2 adsorbed on different Cs loaded MCM-41 samples: (a),
(b) and (c) refer to samples with Cs loading of 0.075, 0.15 and 0.225
mmole/g of Si-MCM-41, respectively.
Table 2.8 Amount of CO2 desorbed during TPD measurements over different
SiO2 catalysts
TPD of CO2 Samplea
mmole/gb mole /mole metalc
Li(1.5)SiO2 0.062 0.041
Na(1.5)SiO 2 0.071 0.047
K(1.5)SiO 2 0.078 0.052
Cs(0.075)SiO 2 0.031 0.41
Cs(0.375)SiO 2 0.049 0.13
Cs(0.75)SiO 2 0.061 0.081
Cs(1.5)SiO 2 0.079 0.053
Cs(2.25)SiO 2 0.082 0.036
a The number in brackets denotes the mmole of alkali metal loaded per g of
SiO2 ;
b mmole CO2 desorbed / g of catalyst and
c moles of CO2 desorbed / mole of alkali metal in the catalyst.

73
Table 2.9 Amount of CO2 desorbed during TPD measurements over different
MCM-41 catalysts
Samplea TPD of CO2
mmole/gb mole /mole Csc
Cs(0.075) MCM-41 0.032 0.42
Cs(0.15) MCM-41 0.044 0.29
Cs(0.225) MCM-41 0.068 0.30
a The number in brackets denotes the mmole of alkali metal loaded per g of SiO2 ; b mmole CO2 desorbed / g of catalyst and c moles of CO2 desorbed / mole of alkali
metal in the catalyst.
2.3.5 Infrared spectra of adsorbed carbon dioxide
FT-IR spectra of the samples in the region of structural vibrations were
recorded using KBr pellets. For spectra of adsorbed CO2, self-supported wafers
were used. The sample was pressed into thin wafers (5-6 mg/cm2), evacuated (10-5
torr) at 673 K and cooled to 298K to record the spectrum of the pure sample. Ultra
pure CO2 (99.999 %, Linde Air) was then adsorbed on the sample at 5 mm
equilibrium pressure for 1h and another spectrum was recorded. Then part of the
CO2 gas was pumped out to maintain an equilibrium pressure of 0.4 mm and the
spectrum was recorded again. All the spectra were recorded using a Nicolet 60
SXB spectrometer with 2 cm-1 resolution, averaging over 500 scans.

74
2.3.5.1 Silica supported samples
FT-IR spectrum of pure silica shows strong bands due to tetrahedral
framework vibrations of Si-O-Si linkages at 1106 and 807 cm-1. As the Cs2O
loading increases these characteristic bands shift systematically to lower wave
numbers as can be noticed in Fig. 2.5. The bands at 1106 cm –1 and 807 cm-1 in
pure SiO2 shift (respectively) to 1097 and 794 cm-1 in Cs(2.25)SiO2 (31.7 % Cs2O)
sample. In the case of cesium silicate, they appear, respectively, at 1041 and 787
cm-1. The shift indicates that Si-O-Si bonds are perturbed by the formation of Si-O-
Cs linkages in the framework indicating the formation of cesium silicate type of
species at the surface. Doscosil et al. [8] have identified such alkali silicate phase in
the case of Rb2O/SiO2 system from X-ray absorption studies.
CO2 being amphoteric in nature can be used to monitor both Lewis acid
centers and Lewis base centers on metal oxides and zeolite surfaces. It is a linear
molecule having Dαv symmetry and three fundamental vibrations, one stretching
vibration ν1, which is Raman active appearing as a doublet at 1285 and 1388 cm-1
and two other IR active vibrations, doubly degenerate deformation ν2 at 667 cm-1
and the antisymmetric stretch ν3 at 2349 cm-1 [9]. The IR spectrum of adsorbed
CO2 varies distinctly from the gas phase spectrum and three types of adsorption
have been distinguished.
a) On unreactive surfaces, the infrared spectrum of adsorbed CO2 shows mostly
the ν3 vibration near 2349 cm-1. b) The adsorption of CO2 on reactive surfaces
may give rise to several adsorbed species, such as carbonate, bicarbonate and
formate which exhibit characteristics adsorption bands [10-12].

75
Fig. 2.5 FTIR spectra (298K) of Cs2O-SiO2 samples in the framework region:
a) Cesium silicate and b, c, d, e, f refer to samples with Cs loading of
2.25, 1.5, 0.75, 0.375, 0.075 mmolee/g of silica, respectively and g)
SiO2.

76
c) O2 can also function as a ligand in different complexes of transition metals as
highly perturbed structures. These CO2 species have a characteristic pair of
absorption bands in the region 1200 – 1700 cm-1. This type of bond is formed
when electrons are donated to CO2 molecule and CO2- anion is formed. But such
an anion is stable only at low temperatures.
Adsorption of CO2 on pure SiO2 shows a band only due to molecularly
adsorbed CO2 (ν3, type 1) at 2349 cm-1 associated with changes in the band shapes
of the hydroxyl groups on SiO2. The hydroxyl groups on pure silica exhibit a
sharp band at 3745 cm-1 and a broad band centered around 3550 cm-1 which are
perturbed by the adsorption of CO2 (not shown). These hydroxyl groups are
centers of CO2 adsorption. No bands are observed in the carbonate region, 1200 –
2000 cm-1. Similar reports have earlier been made by many workers [8,13 –15].
CO2 was completely desorbed on evacuating the sample.
IR spectra of adsorbed CO2 on alkali metal modified silica are shown in
Figs. 2.6, 2.7 and 2.8. In the Fig. 2.6, bands due to antisymmetric stretching ν3
vibrations of physisorbed CO2 on Li2O, Na2O, K2O and Cs2O modified SiO2 are
seen; they appear, respectively, at 2348, 2346, 2342 and 2340 cm-1. As the ionic
radius of the alkali metal cation and the metal – oxygen bond length increases, the
electron donating ability (to adsorbed CO2) increases and hence the ν3 frequency
shifts to lower wave number, in accordance with the basicity of the alkali metal. In
Fig. 2.7, the corresponding FTIR spectra in the region of carbonate vibrations
(1275 – 1975 cm-1) are presented. Adsorption of CO2 produced two sets of bands.

77
Fig. 2.6 FTIR spectra (298K) of adsorbed CO2 (5 mm equilibrium pressure of
CO2) in the region of anti-symmetric stretching on alkali metal (1.5
mmolee/g) loaded silica: (a) Li2O-SiO2; (b) Na2O-SiO2; (c) K2O-
SiO2 and (d) Cs2O-SiO2.
Each set consists of bands due to one anti-symmetric and one symmetric
stretching vibration. The frequencies of these bands for Li2O, Na2O, K2O and
Cs2O loaded SiO2 (1.5 mmole/g loading) are presented in Table 2.10. The
intensity of these bands decreases with decrease (Table 2.11) in equilibrium
pressure but persists even after evacuation. It is clear that the supported alkali
metal changes the adsorptive property of SiO2. The frequencies of these bands
of adsorbed carbonate species decrease as the basicity of the alkali metal
increases. The difference between the high and the low frequency bands varies

78
Fig. 2.7 FTIR spectra (298K) of adsorbed CO2 on alkali metal (1.5 mmole/g)
loaded silica: a,b) Li-SiO2; c,d) Na-SiO2; e,f) K-SiO2; g,h) Cs-SiO2.
(a, c, e, g, I at 0.4 mm and b, d, f, h, j at 5 mm equilibrium pressure
of CO2, respectively.

79
Fig. 2.8 FTIR spectra (298K) of adsorbed CO2 in the CO3 vibration region on
Cs2O-SiO2 samples with Cs loading of 0.075, 0.375, 0.75, 1.5 and
2.25 mmolee/g: a, c, e, g, i at 0.4 mm and b, d, f, h, j at 5mm
equilibrium pressure of CO2, respectively.

80
from 258 to 319 cm-1 for anti-symmetric stretch and 154 to 234 cm-1 for
symmetric stretch vibrations for different metal oxide loaded samples. For
samples containing different amounts of Cs2O, the frequency variations are
much less (Table 2.10). The assignment of these absorption bands is based on
characteristic vibrations reported previously for CO2 adsorption on metal oxides
and some alkali metal modified metal oxides [11, 12].
Carbon dioxide is believed to adsorb on metals and basic oxides in many
forms, the symmetrical, monodentate, bidentate and bridged forms [12] The
interaction of CO2 is believed to be through transfer of electronic charge to CO2
molecule from alkali metal oxide which increases with the size of the metal ion.
Besides, the simultaneous interaction of alkali cation and O2- anion on adsorbed
CO2 may also be taking place. The increasing shift in the high and low
frequency bands and increasing frequency difference between the bands on
going from Li+ to Cs+ cation modified SiO2 samples indicate increasing
interaction with CO2. Solymosi and Knozinger [12] have proposed ∆ν values of
0, 100, 300 and >400 for symmetrical, monodentate, bidentate and bridged
confirmation for adsorbed CO2 species, respectively, on interacting surfaces.
Going by this concept, the ∆ν values observed for CO2 on Li+, Na+, K+ and Cs+
modified SiO2 surface indicate the presence of mainly monodentate and
bidentate types of adsorbed species (described in chapter I). The concentration
of bidentate species increases with the basicity of the alkali metal.

81
2.3.5.2 Zeolite and molecular sieve samples
In Cs-MCM-41, Cs-silicalite and Cs-ferrierite, basicity is induced by
encapsulating Cs2O in the intrinsic pores of different sizes. Considering the
possible cation distribution on different crystallographic sites in X and L type
zeolites under our ion exchange conditions most of Cs cations should be located
in the supercages of zeolite-X samples whereas in the case of silicalites and
MCM-41, which do not have cation sites, Cs2O is occluded in the pores. CO2
has a kinetic diameter of 3.3 Å, it can not enter the sodalite cages in X type and
cancrinite cages in L type zeolites; so, it can only interact with cations in
supercages. In the case of porous silicalites, CO2 can interact with basic sites
present in the 10 MR pore system. It forms the complex M…O=C=O giving
rise to absorption bands due to antisymmetric stretching vibrations, v3 mode.
In Fig. 2.9 (curves a - c) FTIR spectra in this region of CO2 adsorbed on
zeolites NaX, CsX(OH), and Cs-L are presented.
Similar spectra for Cs-MCM-41, Cs-silicalite and Cs-ferririte samples
are presented in Fig. 2.10. In Table 2.12 the corresponding band positions are
given of which the most intense and dominating band positions are underlined.
From the data presented above and to be presented later, it appears that
adsorption of CO2 on the zeolite samples studied involves both physical and
chemical interactions because all modes of vibrations are observed in the
spectra. For convenience, the adsorption of CO2 on cation modified X and L
type zeolite (Table2.12) is considered separately from others, because they have
anionic framework oxygens due to isomorphous substitution of Al3+ by Si4+ in

82
Fig. 2.9 FTIR spectra (298K) of adsorbed CO2 in the CO3 vibration region
on: (a) CsL; (b) CsX (OH) and (c) NaX at 5 mm equilibrium
pressure of CO2.
the SiO2 polymorph. MCM-41, silicalite and ferrierite are pure silica
polymorphs of different micro and mesoporous morphology, whose
frameworks are electrically neutral. Due to the large size of the Cs ions and the
partial exchange (∼ 50%), most of the Cs cations are expected to be located
only in the supercages. Also, the large CO2 molecules (3.3 Å size) cannot enter
into the small (6MR) cages, in the two zeolites and hence mainly Cs cations are
available for adsorption. As a result, the prominent v3 mode vibrational band at
2353 cm-1 is shifted to 2342 cm-1 for NaX. The very weak side bands at 2341
and 2340 cm-1 can be seen for NaX. They become invisible on Cs cation
exchange, instead, weak side bands at higher frequency at 2350 and 2349 cm-1
are observed (Fig. 2.11). In the literature, different values between 2351 and

83
Fig. 2.10 FTIR spectra (298K) of adsorbed CO2 in the CO3 vibration region on
(a) Cs(0.225)MCM-41; (b) Cs-Silicalite-1 and (c) Cs-Ferrierite at 5 mm
equilibrium pressure of CO2.
2355 cm-1 have been reported [16] for v3 mode of adsorbed CO2 on NaX; a
value of 2342 cm-1 has been reported in the case of CsX(OH). The experimental
values are consistent with these reported values and are attributed to the
adsorption of CO2 on Na and Cs cations, respectively that are available in the
supercages. The minor side bands at 2341 and 2351 cm-1 are due to the
presence of less accessible Na and residual Na cations respectively.
The other set of samples, silicalite, ferrierite and MCM-41, are all pure silica
polymorphs and do not possess cation exchange capacity and have different
pore dimensions. Silicalite, ferrierite and MCM-41 have 5.6, 7.2 and 28Å pore
openings. These samples possess mostly Cs though Na may be ppm level
present as impurity (analysis not done). The prominent v3 mode bands are

84
observed for these samples at 2343, 2342 and 2341 cm-1 respectively, for Cs-
silicalite, Cs-ferrierite and Cs-MCM-41 (Fig. 2.12). These bands are due to
interaction of CO2 with Cs cations. The regular variation from 2343 to 2341
cm-1 may be attributed to the systematic increase in the pore sizes and the
diminishing influence of the nearby framework. The side bands at higher
frequency at around 2360 cm-1 may be due to the impurity Na cations present.
The side band at lower frequency may be due to some inaccessible Cs cations.
In summary, the data of Table 2.12 indicate that micro and mesoporous
zeolites possess active sites for CO2 adsorption on the surface of the framework
and in the bulk of the intrapore volume. The topology of the surface and the
intrapore volume determine the energetics of CO2 adsorption and the v3 mode
band positions.
Of all the arguments developed for explaining the FTIR spectra of
adsorbed CO2 on alkali modified zeolite surfaces, those of Bonelli et al. [17]
are very important. From FTIR, adsorption microcalorimetry and quantum
chemical calculations they concluded that cation-CO2 interaction alone can not
account for the nature of the spectra of CO2 adsorbed on alkali metal cation
incorporated zeolite samples and the presence of nearby framework anionic O2-
should also be considered. Their calculations show that in the series from Li+ to
Cs+, the cation becomes progressively weaker Lewis acid for CO2 adsorption;
simultaneously the adjacent anionic framework surface becomes progressively
stronger base causing internal compensation. This observation shows that
different adsorption sites can not be treated as distinctly independent, but they

85
Fig. 2.11 FTIR spectra (298K) of adsorbed CO2 (5 mm equilibrium pressure of
CO2) in the region of antisymmetric stretching on: (a) CsL; (b)
CsX(OH) and (c) NaX.
Fig. 2.12 FTIR spectra (298K) of adsorbed CO2 (5 mm equilibrium pressure of
CO2) in the region of antisymmetric stretching on: (a) Cs-ferrierite;
(b) Cssilicalite-1 and (c) Cs(0.225)MCM-41.

86
are influenced by each other. Hence the concept of surface and bulk adsorption sites
gains relevance. So, on the basic metal sites nearest to the porous surface metal cation
can coordinate one CO2 molecule as [Na(CO2)]+, where as on the metal clusters in the
bulk two CO2 molecules can coordinate as [Na(CO2 )2]+. On the reactive surfaces of
metal oxides, CO2 can form many types of carbonate species like monodentate, bidentate
and bridging bidentate carbonates, carboxylate, bicarbonate and formate. In the
spectrum, the carbonate specie is characterized by a pair of bands for both symmetric
and asymmetric stretching vibrations of C-O bond. These bands are located between
1850 and 1250 cm-1. The splitting in these pair of bands are reported to be around 300
cm-1 for bidendate, 100 cm-1 for monodentate and less than 100 cm-1 for symmetric
carbonate species and entirely depends on the basicity of the adsorbate.
In Table 2.13, the band positions for all the samples in this region are presented.
CO2 adsorption on cation exchanged X type zeolites develops bands at 1711,1680(sh),
1480, 1425, 1378 and 1363 cm-1 for Na+ form and at 1653,1639,1386 and 1343 cm-1 for
Cs+ form respectively (Fig. 2. 9). These are consistent with the reported values [17]. The
differences between the two high frequency bands around 1700 cm-1 and two low
frequency bands around 1380 cm-1 in both of them indicate the presence of bidentate
type species. Corresponding bands for CsL are observed at 1675,1647,1389 and 1343
cm-1 (Fig. 2.9). These bands are also consistent with the reported results and can be
ascribed to bidentate type of species

87
.
Table 2.10 ∆ν for different forms of carbonate specie adsorbed on alkaline-silica catalysts
Type-I Type-II Samplea
cm-1 cm-1 ∆ν cm-1 cm-1 ∆ν3
Li(1.5) SiO2 1679 1421 258 1652 1498 154
Na(1.5) SiO2 1683 1365 318 1643 1462 181
K(1.5) SiO 2 1663 1347 316 1633 1407 226
Cs(0.375) SiO 2 1652 1336 316 1617 1390 227
Cs(0.75) SiO 2 1651 1333 318 1619 1387 232
Cs(1.5) SiO 2 1648 1329 319 1618 1384 234
Cs(2.25) SiO 2 1645 1331 314 1617 1383 234
a The number in brackets denotes the mmolee alkali metal loaded per g of SiO2.

88


90
Table 2.11 Relative basicity of alkaline samples from FTIR studies
Intensity of IR spectra of CO2 Samplea
FTIR (0.4)b FTIR (5)c
Li(1.5)SiO2 92 102
Na(1.5)SiO 2 132 140
K(1.5)SiO 2 153 180
Cs(0.075)SiO 2 19 24
Cs(0.375)SiO 2 88 96
Cs(0.75)SiO 2 120 168
Cs(1.5)SiO 2 216 229
Cs(2.25)SiO 2 262 281
NaX 139 179
CsX(OH) 182 218
CsL 130 166
Cs-MCM-41 83 122
Cs-silicalite 64 80
Cs-ferrierite 49 55
a The number in brackets denotes the mmolee of alkali metal loaded per g of SiO2. b, & c
Relative band intensity of adsorbed CO2 in FTIR spectra (1200 - 1750 cm-1 ) at 0.4 and
5 mm equilibrium pressure, respectively.

91
Table 2.12 FTIR spectral bands (ν3 vibration mode) of physisorbed CO2 on alkaline
molecular sieves
Sample
NaX 2353 2341
CsX(OH) 2350 2342
CsL 2359 2343 2332
Cs-MCM-41 2359 2341 2322
Cs-silicalite 2360 2343 2331
Cs-ferrierite 2359 2342 2331
Table 2.13 FTIR spectral bands of adsorbed CO2 in carbonate region in alkaline molecular
sieves
Sample
NaX 1711 1680 1480 1425 1378 1363
CsX(OH) 1653 1639 1620 1386 1343
CsL 1675 1647 1389 1343
Cs-ferrierite 1648 1326
Cs-silicalite 1674 1632 1388 1366
Cs-MCM-41 1648 1630 1383 1340

92
2.3.6 Nuclear Magnetic Resonance Spectra (NMR)
2.3.6.1 133Cs NMR spectra
Solid state 133Cs NMR spectra were obtained on a Bruker MSL 400 spectrometer
operating at a 133Cs frequency of 52.481 MHz. Samples for NMR measurements were
prepared by packing the materials in 7 mm zirconia rotors with boron nitride caps.
Experiments were carried out at room temperature. The spectra were obtained by single π /
12 pulses (2.5µsec) with a recycle delay of 1 sec. The spectral width was 125 kHz and the
spinning rate was 2 to 5 kHz. The FID was processed by Bruker WIN NMR software by
applying 100 Hz line broadening. An aqueous solution of Cs2SO4 was used as a reference (δ
= 0).
The 133Cs spectra of Cs-SiO2 and Cs-MCM-41 samples are presented in Fig. 2.13 and
2.14. The relevent spectral data are presented in Table 2.14. 133Cs is a quadrupolar nucleus
and hence the line broadening arises from chemical shift anisotropy (CSA) and quadrupolar
interaction. The CSA is small for Cs loaded MCM-41 samples (weak side bands), whereas,
it is mostly absent over the Cs loaded pure silica samples. It is clearly observed from the
table that the chemical shift changes from high field to low field with increasing Cs loading
for both MCM-41 and pure silica samples. This suggests that the Cs nuclei become more and
more mobile and isotropic with Cs loading. This is probably due to weaker interaction
between the support and Cs2O specie at higher loading. The increasing mobility (isotropic
nature) of the Cs species over Cs-MCM-41 at higher loading is probably also responsible for
the narrowing of the lines with Cs loading. The broadening observed (Table 2.14) in the case
of Cs loaded pure silica samples is
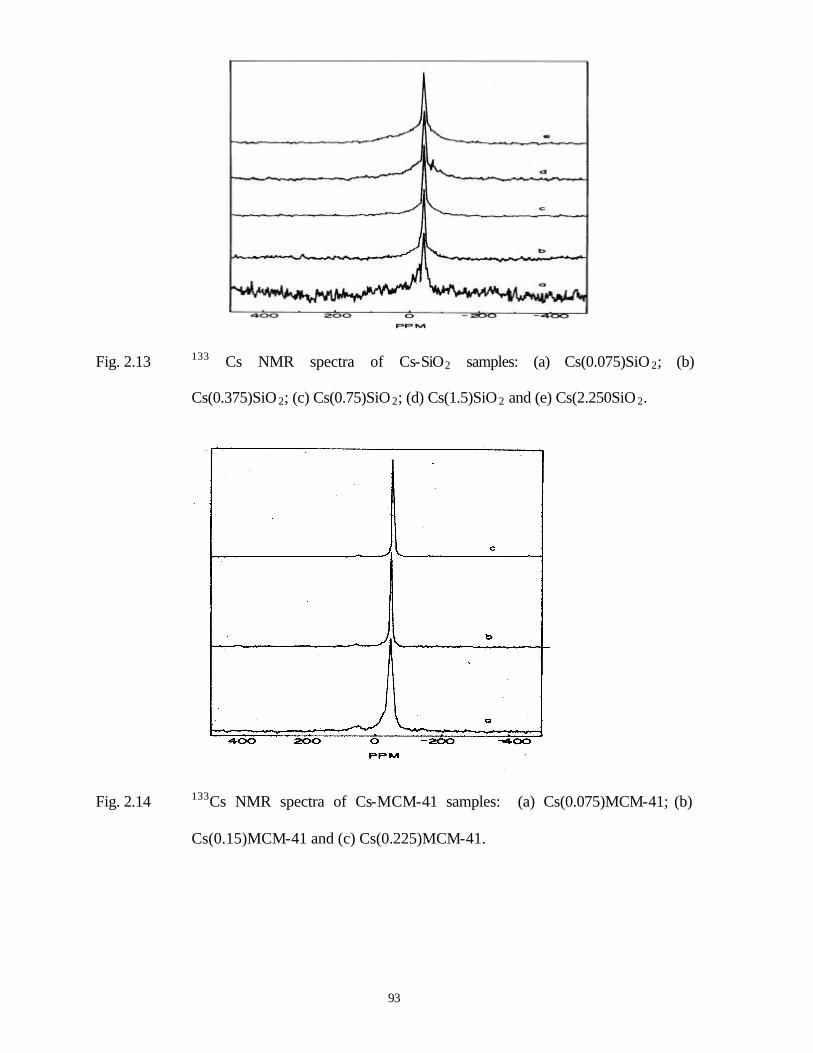
93
Fig. 2.13 133 Cs NMR spectra of Cs-SiO2 samples: (a) Cs(0.075)SiO 2; (b)
Cs(0.375)SiO 2; (c) Cs(0.75)SiO 2; (d) Cs(1.5)SiO 2 and (e) Cs(2.250SiO 2.
Fig. 2.14 133Cs NMR spectra of Cs-MCM-41 samples: (a) Cs(0.075)MCM-41; (b)
Cs(0.15)MCM-41 and (c) Cs(0.225)MCM-41.

94
Table 2.14 133Cs NMR spectral data of Cs-MCM-41 and Cs-SiO2 samples
Sample Spinning speed (kHz)
Chemical shift of isotropic line (ppm)
Line width at half height of the central
line (Hz)
Cs(0.075) MCM-41 5 -46.38 694
Cs(0.15) MCM-41 5 -39.4 305
Cs(0.225) MCM-41 5 -37.07 244
Cs(0.075)SiO 2 2.5 -47.54 366
Cs(0.375)SiO 2 5 -44.05 366
Cs(0.75)SiO 2 5 -32.42 366
Cs(1.5)SiO 2 5 -19.04 397
Cs(2.25)SiO 2 5 -19.04 488
probably due to quadrupolar interaction. It may also be due to the overlap of many closely
spaced Cs lines from different Cs2O specie present on the surface at higher loadings.
2.3.6.2 29Si MAS NMR
The 29Si MAS NMR spectra were recorded on a Bruker MSL 300 spectrometer. For
magic-angle spinning (MAS) NMR studies, the finely powdered samples were loaded in 7.0-
mm-o.d. zirconia rotors and spun at 2.5-3.3 kHz. Experiments were carried out at room
temperature (298K).
The 29Si MAS NMR spectra of Cs-MCM-41 are presented in Fig. 2.15. The different
environments and large range of T-O-T angles in the amorphous silica samples results in 29Si
NMR spectra with broad peaks for the Cs-SiO2 samples. For Cs loaded MCM-41 with higher

95
Cs loading, the Q3 / Q4 (Q3 from -98 to -103 ppm and Q4 from -105 to -114 ppm) ratio
becomes small suggesting the loss of silanol (-SiOH) groups through formation of Si-O-Cs
specie.
Fig. 2.15 29Si MAS NMR spectra of CS-MCM-41 samples: (a) Cs(0.075)SiO2; (b)
Cs(0.15)MCM-41 and (c) Cs(0.225)MCM-41.

96
2.3.7 Electron Spectroscopy for Chemical Analysis (ESCA)
Photoemission spectra were recorded on a VG Microtech Multilab ESCA 3000
spectrometer equipped with a twin anode of Al and Mg. All measurements were made at
room temperature using non-monochromatized Mg Kα x-ray source (hν = 1253.6 eV) on
powder samples. Base pressure in the analysis chamber was maintained at 3-6 x 10⁻¹⁰ Torr
range. The energy resolution of the spectrometer was measured from the full width at half
maximum of metallic gold surface and the value obtained is better than 0.8 eV with MgKα
radiation at pass energy of 20 eV. Binding energy calibration was performed with Au 4f7/2
core level (83.9 eV). Binding energy of adventitious carbon (284.9 eV) was utilized for
charge correction with all the samples.
The X-ray photoelectron spectra of different Cs loaded SiO2 samples did not reveal
any significant change in the Cs or O binding energies with Cs loading. The relative Cs / Si
contents at the surface of different Cs loaded samples were calculated from electron counts of
the respective peaks for the elements (Si2p and Cs3d5/2) and photoionisation cross sections.
The Cs/Si (relative) ratios obtained for different Cs-SiO2 catalysts are presented in Fig. 2.16.
It is found that the ratio increases rapidly with Cs loading upto 1.5 mmole / g beyond which
the increase is very small. This may be attributed to the presence of substantially large Cs2O
particles at higher Cs loading and saturation of Cs at the surface.

97
Fig. 2.16 Influence of Cs loading on surface Cs / Si ratio.
2.4 CONCLUSIONS
Alkali metal (Na, K and Cs) exchanged zeolite-X, Cs-exchanged zeolite L, Cs-
impregnated fumed silica, Si-MCM-41, silicalite-1 and ferrierite samples are moderately
basic. Their surface areas decrease on loading with alkali ions. The basicity of the catalysts
can be estimated by temperature-programmed desorption of carbon dioxide and IR spectra of
adsorbed carbon dioxide. The basicity of the catalysts increases in the order: Li < Na < K <
Cs.
2.5 REFERENCES
1. F. Polak, Int. Chem. Eng. 11, 449 (1971).
2. S. Sharma, Ph. D. Thesis, NCL, Pune, India (1997).
3. K. Chaudhari, T.K. Das, A.J. Chandwadkar and S. Sivasanker, J. Catal. 186,
81(1999).
4. R.W. Grose and E.M. Flanigen, U.S. Patent, 4,061,721 (1977).
0.0 0.5 1.0 1.5 2.0 2.50.00
0.02
0.04
0.06
0.08
Cs
/ Si (
rela
tive
)
Cs loading (mmole/g)

98
5. S. Shevade, Ph. D. Thesis, NCL, Pune, India (2000).
6. J. Engelhardt, J. Szanyi and J. Valyon, J. Catal. 107, 296 (1987).
7. W.J. Mortier, J. Catal. 55, 138 (1978).
8. E.J. Doskocil, S.V. Bordawekar and R.J. Davis, J. Catal. 169, 327 (1997).
9. G. Hertzberg, " Infrared and Raman Spectra of Polyatomic Molecules", p 178,
Van Nostrand, New York, 1945.
10. K. Nakamoto, "Infrared and Raman Spectra of Inorganic and Co-ordination
Compounds", 3rd Edn., p243, Wiley, New York, 1978.
11. G. Busca and V. Lorenzeli, Mater. Chem. 7, 89 (1982).
12. F. Solymosi and H. Knozinger, J. Catal. 122, 166 (1990).
13. A. Ueno and C.O. Bennett, J. Catal. 54, 31 (1978).
14. J.L. Falconer and A.E. Zagli, J. Catal. 62, 280 (1980).
15. R.P. Eischens and W.A. Plisken, Adv. Catal. 9, 662 (1952).
16. P.A. Jacobs, F.H. Cavwelaert and E.F. Vansant, J. Chem. Soc., Faraday Trans.1
69, 2130 (1973).
17. B. Bonelli, B. Civalleri, B. Fubini, P. Ugliengo, C. Otero Arean and E. Garrone,
J. Phys. Chem. B 104, 10978 (2000).

99
CHAPTER CHAPTER -- III III
SIDE CHAIN C-ALKYLATION

100
SIDE CHAIN ALKYLATION OF ETHYLBENZENE AND
TOLUENE WITH DIMETHYL CARBONATE
3. 1 INTRODUCTION
Side chain methylation of toluene by methanol is an important reaction, considering the
usefulness of the products, particularly ethyl benzene and styrene. Alkali ion exchanged
zeolites have been used as basic catalysts, the most common choice being Na-X zeolite
exchanged with cesium, rubidium or potassium [1-6]. Often such basic catalysts have been
modified by addition of B or P [7]; B and Cu or Ag [8]; B, P, Cu or other metals [9]; KOH or
CsOH [10] or CsOAc [11]. Wang et al. [12] reported a comparison of X and ZSM-5,
exchanged with K and modified with B and alkali metal hydroxides. It was found that ZSM-
5, even if exchanged with strongly basic metals like Cs, catalyzed only the ring methylation
of toluene [13], while the basic X-zeolite catalyzed side chain alkylation [14]. Beltrame et al.
[15] studied the kinetics of side chain alkylation of toluene by methanol over basic zeolites
and concluded that CsX was a good catalyst for side chain alkylation.
Side chain alkylation of toluene with isopropanol and methanol over alkali (Li, Na, K
and Cs) exchanged zeolites (X, β and ZSM-5) was reported by Vasanthy et al. [16].
Isopropylation takes place exclusively at the nucleus (over Li exchange zeolites) resulting in
cymenes while methylation gives xylenes and ethylbenzene, the former being the major
products. According to them, side chain alkylation of toluene takes place by a cooperative
action of both acidic and basic sites. Sefcik [17] investigated the zeolite catalyzed alkylation
of toluene using 13C NMR and suggested that the alkali cations in the X-type zeolites affect
the alkylation of toluene by chemically controlling the formation of reactive intermediates
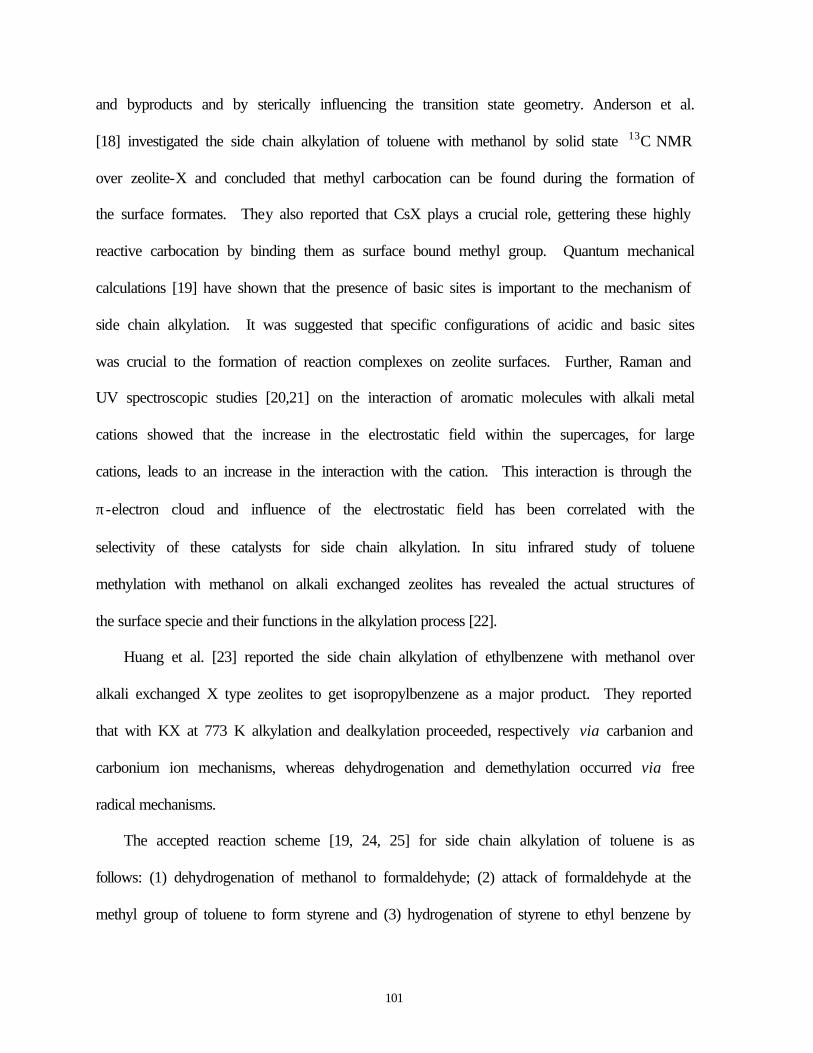
101
and byproducts and by sterically influencing the transition state geometry. Anderson et al.
[18] investigated the side chain alkylation of toluene with methanol by solid state 13C NMR
over zeolite-X and concluded that methyl carbocation can be found during the formation of
the surface formates. They also reported that CsX plays a crucial role, gettering these highly
reactive carbocation by binding them as surface bound methyl group. Quantum mechanical
calculations [19] have shown that the presence of basic sites is important to the mechanism of
side chain alkylation. It was suggested that specific configurations of acidic and basic sites
was crucial to the formation of reaction complexes on zeolite surfaces. Further, Raman and
UV spectroscopic studies [20,21] on the interaction of aromatic molecules with alkali metal
cations showed that the increase in the electrostatic field within the supercages, for large
cations, leads to an increase in the interaction with the cation. This interaction is through the
π-electron cloud and influence of the electrostatic field has been correlated with the
selectivity of these catalysts for side chain alkylation. In situ infrared study of toluene
methylation with methanol on alkali exchanged zeolites has revealed the actual structures of
the surface specie and their functions in the alkylation process [22].
Huang et al. [23] reported the side chain alkylation of ethylbenzene with methanol over
alkali exchanged X type zeolites to get isopropylbenzene as a major product. They reported
that with KX at 773 K alkylation and dealkylation proceeded, respectively via carbanion and
carbonium ion mechanisms, whereas dehydrogenation and demethylation occurred via free
radical mechanisms.
The accepted reaction scheme [19, 24, 25] for side chain alkylation of toluene is as
follows: (1) dehydrogenation of methanol to formaldehyde; (2) attack of formaldehyde at the
methyl group of toluene to form styrene and (3) hydrogenation of styrene to ethyl benzene by

102
H2 produced during methanol dehydrogenation. The side chain alkylation reactions
investigated in this work are shown in Scheme 1.
(CH3)2CO3
M-X (M= Na, K and Cs)
CH(CH3)2
+
CH2CH2CH3CH2CH3
CH3
M-X (M= Na, K and Cs)
(CH3)2CO3
+
CH2CH3 CH(CH3)2
Scheme 1. Side chain C-alkylation reactions investigated in this work.

103
3. 2 EXPERIMENTAL
3. 2.1 Materials and catalysts
Ethylbenzene (EB; > 99% purity), toluene (> 99% purity) and dimethyl carbonate (DMC;
> 99% purity) were obtained from Aldrich, USA. Ion exchanged forms of zeolite X, namely
NaX, KX(Cl), KX(OH), CsX(Cl), CsX(OH) were used in the reaction. Their preparation has
been reported in Chapter II.
3.2. 2 Reaction procedure
The reactions were carried out in a fixed bed down flow glass reactor (i.d. = 15 mm)
at atmospheric pressure using a 2 g charge of catalyst. The zeolite powders were pelleted
without any binder, crushed and sized (8-14 mesh) and were activated at 773K for 12h in air
and 3h in N2 before reaction. The mixture of EB or toluene and DMC was then feed into the
reactor using a syringe pump. The liquid products were cooled in an ice trap and were
collected periodically for analysis. Analysis of the gas and liquid products was carried out by
gas chromatography (HP5880A) using a methyl-silicone gum capillary column (0.2 mm x
50m) with FID. The gaseous products were analyzed separately in a gas analyzer
(HP5880A) with multiple packed columns. CO2 in the outlet gas was also estimated by
absorption in NaOH.
3.3 RESULTS AND DISCUSSION
3.3.1 Alkylation of EB with DMC
The reaction of DMC with ethylbenzene can be written as:
a) 2C6H5CH2CH3 + (CH3 )2CO3 ⇒ C6H5CH2CH2CH3 + C6H5CH(CH3)2 + CO2 + H2O
b) C6H5CH2CH3 + (CH3 )2CO3 ⇒ C6H5CH2CH2CH3 + CH3OH + CO2.

104
In the temperature range (673 - 773K) used in these studies, all the DMC in the feed was
found to have decomposed. Besides, the methanol content in the product was small (1.5 to
4% between 733- 773K), which further decreased at higher temperatures (∼ 1.5% at 773K).
Very little C-alkylation products (ethyl toluenes) were noticed (< 1.0 % at 733K). Carbon
oxides were also found in the products and these were estimated in some experiments to
calculate mass balances. The data reported in the following sections are the major
hydrocarbon components estimated by gas chromatography. Detailed carbon balances
carried out for some of the representative experiments were in the range 94 – 98%.
Experiments were carried out in the temperature range 673 - 773K at different feed rates and
feed compositions over all the catalysts listed in Table 3.1. The influence of the various
reaction parameters on conversion of EB and product distribution are presented in the
following sections.
3.3.1.1 Influence of process time
The activity of the catalysts increased slightly upto about 2h and then decreased
continuously with process time (studied upto 6 h; Fig. 3.1 (a)). The reason for the initial
increase in activities of the catalysts is not clear. The changes in yields of the different
products are also similar (Fig. 3.1(b)) suggesting that the phenomenon (activation /
deactivation) is related to changes occurring in the

105
Table 3. 1. Activity and product distribution over the catalysts
Product yield (wt%) Deactivation Catalyst Conv. of
EB
(wt%) Bz Tol Xy Styrene i-PrBz n-PrBz Methane (C1 - C6)a Rateb
NaX 12 0.37 0.49 2.18 0.92 2.63 2.8 2.61 3.7 0.15
KX(Cl) 17 0.45 0.53 3.09 1.69 3.78 4.03 3.43 4.4 0.06
KX(OH) 19.4 0.56 0.68 3.48 1.78 4.1 4.7 4.09 6.1 0.07
CsX(Cl) 22.6 0.68 0.79 4.19 2.08 4.8 5.1 4.96 6.2 0.06
CsX(OH) 24.5 0.75 0.96 4.4 2.16 5.43 5.57 5.45 6.9 0.06
Conditions: Temperature = 733K, EB/DMC (mole ratio) = 5, W/F = 60 g.h.mole-1, N2/F (mole) = 5, Time on steam = 2h.
Bz = Benzene; Tol = Toluene; Xy = Xylene; i-PrBz = iso-propylbenzene; n-PrBz = n-propylbenzene.
a: (C1 - C6) = % Conversion at 1st hour - % Conversion at 6th hour. b: Rate = 2(C1 -C6)/ 5(C1 + C6); conversion loss per hour per unit conversion.

144
catalyst. Earlier workers have also reported this behaviour during the side chain
alkylation of toluene and attributed it to coke deposition and occurrence of side
reactions [1]. Examining the overall activity loss over a 5h period (1h to 6h), it
appears that the more basic catalysts deactivate more rapidly (Table 1; C1 - C6).
However, when we examine the deactivation rate normalized to unit conversion
(Table 1; rate, [h-1.conv.-1]), all the catalysts except NaX deactivate at nearly the
same rate
3.3.1.2 Influence of basicity of the catalyst
The activities of the different catalysts at various temperatures in the
alkylation of EB with DMC are presented in Fig. 3.2 (a). The product break up
(at 733K) is given in Fig. 3.2 (b). The activities of the catalysts (based on EB
conversion) increase with increase in basicity (decrease in intermediate
electronegetivity, Sint ) as found by earlier workers in the alkylation of toluene
[10]. The yields of the side chain alkylation products (n- and i-propyl benzenes)
also increase with increasing basicity. The increase in conversion and side chain
alkylation activity appears to be disproportionate to the decrease in Sint values
(comparing KX and CsX). This could be because the Sint values were calculated
based on the overall cation contents (Na, K or Cs) eventhough the reaction may
be catalyzed preferentially by the more basic Cs sites. This probably also
suggests the requirement of a threshold basicity for the reaction. Styrene, which
is formed by the dehydrogenation of EB over basic sites also, increases in the
same manner. o-Xylene is found in much larger quantities (o-xylene, 86%, m-
xylene, 7%, p-xylene, 7%) than the other xylenes suggesting that it a primary
product and is probably

144
Fig. 3.1 Influence of time on stream on: (a) EB conversion over different
catalysts; (b) product yields over CsX(OH). (Conditions: Temp. =
733K, EB/DMC (mole) = 5, W/F (g.h.mole-1) = 60, N2/F (mole)
= 5).
1 2 3 4 5 6
5
10
15
20
25
Con
v. (w
t%)
Time on stream (h)
NaX, KX(Cl) KX(OH), CsX(Cl) CsX(OH)
1 2 3 4 5 60
1
2
3
4
5
6
(b)
(a)
Yie
ld (w
t%)
Time on stream (h)
Bz, To l Xy, Styrene, i-PrBz, n-PrBz, Methane

144
Fig. 3.2 Influence of basicity of the catalysts on: (a) EB conversion at
different temperatures; (b) product yields over CsX(OH) at 733K
(Conditions: EB/DMC (mole) = 5, W/F (g.h.mole -1) = 60, N2/F
(mole) = 5, Process time = 2h).
0
1
2
3
4
5
6 (b)
3.06
Yie
ld (w
t%)
C s ( O H ) K ( O H )
Cs(Cl) K(Cl)N a X
Si n t
3.283.13
C s ( O H )
Cs(Cl)
Bz, Tol Xy, Styrene i-PrBz, n-PrBz Methane
10
15
20
25 (a)
Con
v. (
wt%
)
3.283.13
K ( O H ) N a X
3.06
673K 698K 723K 733K
748K 773K
K(Cl)
Sint

144
formed from EB directly. The absence of strong acidity prevents the
equilibration of the xylenes through carbocations and this explains the low
yields of m- and p-xylenes. Small amounts of toluene and benzene are also
produced presumably through dealkylation and intermolecular reactions. Higher
yields of the side chain alkylation products (propylbenzenes) are obtained as
reported by the earlier workers [10] on catalysts ion-exchanged with hydroxide
solutions than chloride solutions. This may be due to the presence of small
clusters of Cs2O trapped inside the zeolite cages in catalysts exchanged with
CsOH. Such catalysts have been reported to be highly basic by earlier workers
[11,26-28]. Both conversion and activity for side chain alkylation increase in
the order: NaX < KX (Cl) < KX (OH) < CsX (Cl) < CsX (OH).
3.3.1.3 Influence of temperature
Conversion is found to go through a maximum (~ 733K) with
temperature over all the catalysts (Fig. 3.3 (a)). Many factors such as
equilibrium constraints, changes in the nature of the catalyst with temperature,
changes in adsorption coefficients of the reactants and rapid decomposition of
the alkylating agent at higher temperatures could be responsible for the observed
behaviour. Earlier workers have also reported a similar behaviour in the
alkylation of toluene (with methanol) over similar catalysts and have attributed it
to decomposition of the alkylating agent [1] and passivation of the active center
[29]. We believe that the rapid decomposition of the alkylating agent (DMC)
and lower adsorption coefficient of the active alkylating species at higher
temperatures are probably responsible for the observed lower conversions at
higher temperatures. The yields of the different

144
Fig. 3.3 Influence of temperature on: (a) EB conversion over different
catalysts; (b) product yields over CsX (OH) (Conditions:
EB/DMC (mole) = 5, W/F (g.h.mole -1) = 60, N2/F (mole) = 5,
Process time = 2h).
660 680 700 720 740 760 780
10
15
20
25
Temp. (K)
Con
v. (w
t%)
NaX, KX(Cl) KX(OH), CsX(Cl) CSX(OH)
660 680 700 720 740 760 780
1
2
3
4
5
6
7
Temp. (K)
(b)
(a)
Yie
ld (w
t%)
Bz, Tol, Xy Styrene, i-PrBz n-PrBz, Methane

144
products also go through a similar maxima at 733K (Fig. 3.3 (b)). It appears that
the trend is not due to equilibrium constraints as even benzene goes through a
maximum at a similar temperature range; one would expect benzene yields to
increase continuously with temperature. Besides the xylenes are not present in
equilibrium amounts.
3 3.1.4 Influence of contact time
The influence of contact time (W/F; g.h.mole -1; W = catalyst wt., g; F =
feed rate, mole h-1) on the reaction is presented in Fig. 3.4 (a). An increase in
contact time increases conversion and product yield over all the catalysts. The
product distributions obtained at different W/F values are presented in Fig. 3.4
(b) for CsX(OH). The influence of contact time on the activity of CsX(OH) at
different temperatures is presented in Fig. 3.4 (c). The results show that the
activities of the catalysts increase with contact time at all the temperatures
investigated and go through a maximum (at 733K) at all the contact times
investigated. Plots of product yields over CsX(OH) as a function of conversion
are presented in Fig. 3.4 (d). It is noticed that the yields of the propylbenzenes,
xylenes and methane can be extrapolated to origin suggesting these to be the
primary products.
3.3.1.5 Influence of molar ratios of reactants
Increasing the EB/DMC molar ratio increases EB conversion over all the
catalysts (Fig. 3.5 (a)). This increase suggests a positive order for the reaction
with respect to EB. The effect is less beyond EB/DMC = 1 due to the
diminished availability of the alkylating agent at the surface. The yields of the
primary products (propyl benzenes and methane) increase more rapidly with
increase in the EB / DMC ratio than the other products (Fig. 3.5 (b)).

144
Fig. 3.4 Influence of contact time on: (a) EB conversion over different
catalysts at 733K; (b) product yields over CsX(OH); (c) EB
conversion at different temperatures over CsX(OH); (d) product
yields at different conversions over CsX(OH) at 733K
(Conditions: EB/DMC (mole) = 5, N2/F (mole) = 5, process time
= 2h).
20 30 40 50 60 70 80
5
10
15
20
25
Con
v. (
wt%
)
W / F ( g . h . m o l e-1)
(b)(a)
NaX KX(Cl) KX(OH) CsX(Cl) CsX(OH)
0 5 10 15 20 25 300
1
2
3
4
5
6
Conv. (wt%)
Yie
ld (
wt%
)
Bz Tol Xy Styrene i-PrBz n-PrBz Methane
20 30 40 50 60 70 80
10
15
20
25
Con
v (w
t%)
W/F (g.h.mole -1)
673K 698K 723K 733K 748K 773K
20 30 40 50 60 70 800
1
2
3
4
5
6
7
8
(c) ( d )
W / F ( g . h . m o l e-1)
Yie
ld (
wt%
)
Bz Tol Xylene Styrene i- PrBz n- PrBz Methane

144
3.3.1.6 Influence of carrier gas (N 2)
The carrier gas (N2) has a substantial effect on the conversion of EB.
The effect of carrier gas on conversion and product yields is presented in Fig.
3.6(a) and (b), respectively. The reason for the increase in conversion observed
with increase in N2 flow rate (N2/F) is not clear. It is probably due to desorption
of strongly adsorbed CO2 (formed from DMC decomposition) from the surface
of the catalyst.
3.3.1.7 Reaction mechanism
The side chain alkylation of toluene by methanol has been suggested to
occur over basic sites in alkali exchanged zeolites [1, 3, 15]. Some workers
have also proposed a cooperative action of acidic and basic sites in side chain
alkylation, the basic site activating the side chain and the acidic site adsorbing
the benzene ring [9]. While alkylation using methanol has been suggested to
take place through the intermediate HCHO, DMC has been reported to alkylate
through CH3+ [17]. Based on the suggestions of the earlier workers and the
results of the present studies, the formation of the major products during the
alkylation of EB with DMC can be rationalized as shown below
1. Activation of EB on a basic site:
C6H5CH2CH3 + B- ð C6H5CH2CH2- + BH (B- = Basic site)
C6H5CH2CH2- ⇔ C6H5CH-
CH3
2. Formation of propylbenzenes:
C6H5CH2CH2- + (CH3)2CO3 + BH ð C6H5CH2 CH2 CH3 + CH3OH + CO2 + B-
C6H5CH- CH3 + (CH3)2CO3 + BH ð C6H5CH2 (CH2)2 + CH3OH + CO2 + B-

144
Fig. 3.5 Influence of EB/DMC mole ratio on: (a) EB conversion over the
different catalysts; (b) product yields over CsX(OH) (Conditions:
Temperature = 733K, W/F (g.h.mole -1) = 60, N2/F (mole) = 5,
Process time = 2h).
0 1 2 3 4 50
5
10
15
20
25
EB/DMC (mole)
Con
v. (w
t%)
NaX KX(Cl) KX(OH) CsX(Cl) CsX(OH)
0 1 2 3 4 50
1
2
3
4
5
6
Yie
ld (w
t%)
EB/DMC (mole)
Bz, To l Xy, Styrene i-PrBz, n-PrBz Methane
(b)
(a)

144
Fig. 3.6 Influence of carrier gas on: (a) EB conversion over different
catalysts; (b) product yields over CsX(OH) (Conditions:
Temperature = 733K, time on stream = 2h, contact time
(g.h.mole-1) = 60, EB / DMC (mole) = 5).
2 3 4 5 6 70
1
2
3
4
5
6(b)
N2 / F (mole)
Yie
ld (w
t%) BZ, Tol, Xy,
Styrene, i-PrBz, n-PrBz Methane
2 3 4 5 6 7
10
15
20
25 (a)
N2 / F (mole)
Con
v. (w
t%)
NaX, KX(Cl) KX(OH), CsX(Cl) CsX(OH)

144
n-propylbenzene is a little more likely to be produced (as observed) as the
primary carbanion is more stable due to resonance with the phenyl group.
3. Formation of o-xylene and styrene:
(CH3)2CO3 ð CH3+ + CO2 + CH3OH
C6H5CH2CH3 + CH3+ ð CH4 + C6H5CH+CH3
C6H5CH+CH3 ⇔ CH3C6H4CH2+
CH3C6H4CH2+ + C6H5CH2CH3ð CH3C6H4CH3 (o-Xylene) + C6H5CH+CH3
C6H5CH+CH3 + C6H5CH2CH2- ð C6H5CH=CH2 + C6H5CH2CH3
3.3.2 Side chain alkylation of toluene with dimethyl carbonate
The reaction of DMC with toluene can be written as:
a) C6H5CH3 + (CH3 )2CO3 ⇒ C6H5CH2CH3 + CH5OH + CO2
b) C6H5CH2CH3 + CH3 OH ⇒ C6H5CH(CH3)2 + H2O.
In the temperature range (673 - 773K) used in the studies, not only all the
DMC was found to have decomposed, the methanol content in the product was
also small (1.0 to 3% between 698 - 773K). Very little C-alkylation products
(xylenes) were noticed. Experiments were carried out in the temperature range
673 - 773K at different feed rates and feed compositions over all the catalysts
listed in Table 3. 2. The influence of various process parameters on conversion
of EB and product distribution are presented in the following sections.
3.3.2.1 Influence of process time
The activity of the catalysts increased slightly upto about 2h and then
decreased continuously with process time (studied upto 6 h; Fig. 3.7 (a)). The
reason for the initial increase in activities of the catalysts is not clear. The
changes in yields of the different products are also similar suggesting that the

144
phenomenon (activation / deactivation) is probably related to changes in the
catalyst. Earlier workers have also reported this behaviour during the side chain
alkylation of toluene with methanol and attributed it to deactivation of catalyst
and occurrence of side reaction [1]. The average deactivation rate per unit
conversion calculated over a six hour period for all the catalysts are reported in
Table 3.2. The results reveal, as observed in the case of EB alkylation, that the
less basic catalysts deactivate more rapidly.
3.3.2.2 Influence of basicity of the catalyst
The activities of the different catalysts at various temperatures in the
alkylation of toluene with DMC are presented in Fig. 3.8 (a). The product break
up (at 698K) is given in Fig. 3.8 (b). The activities of the catalysts (based on
toluene conversion) increase with increase in basicity (decrease in intermediate
electronegetivity, Sint ) as found by earlier workers [10]. The yields of the side
chain alkylation products (ethylbenzene and i-propyl benzene) also increase with
increasing basicity. A small amount of benzene was also produced presumably
through dealkylation and intermolecular reactions. Higher yields of the side
chain alkylation products (ethylbenzene and i-propyl benzene) are obtained on
catalysts ion-exchanged with hydroxide solutions [3] than chloride solutions.
Both conversion and activity for side chain alkylation increase in the order: NaX
< KX (Cl) < KX (OH) < CsX (Cl) < CsX (OH).

144
Fiig. 3.7 Influence of process time on: (a) toluene conversion over
different catalysts; (b) product yields over CsX(OH) (Conditions:
Temp. = 698K, toluene / DMC (mole) = 5, W/F (g.h.mole -1) = 30,
N2/F (mole) = 5).
1 2 3 4 5 60
5
10
15
20(a)
NaX, KX(Cl) KX(OH), CsX(Cl) CsX(OH)
Con
v. (w
t%)
Time on stream (h)
1 2 3 4 5 60
3
6
9
12
(b)
Yie
ld (w
t%)
Time on stream (h)
Benzene Xylenes EB i-PrBZ

144
Table 3. 2 Activity and product distribution over the catalysts
Yield (wt%) Deactivation Catalyst Conv.
(wt %) Benzene Xylenes EB i-PrBz (C1 - C6)a Rateb
NaX
8.31
0.41
0.19
5.92
1.79
1.8
0.05
KX(Cl) 12.57 0.47 0.28 9.17 2.65 1.7 0.03
KX(OH) 13.17 0.53 0.31 9.51 2.82 1.2 0.02
CsX(Cl) 16.72 0.59 0.36 12.38 3.39 1.6 0.02
CsX(OH) 17.94 0.68 0.41 13.18 3.67 1.6 0.02
Conditions: Temperature = 698K, Toluene / DMC (mole) = 5, W/F (g.h.mole -1) = 30, N2/F (mole) = 5, Time on steam = 2h.
a: (C1 - C6) = % Conversion at 1st hour - % Conversion at 6t h hour. b: Rate = 2(C1 -C6)/ 5(C1 + C6); conversion loss per hour
per unit conversion.

144
3.3.2.3 Influence of temperature
Conversion goes through a maximum (~ 698K) with temperature over all the
catalysts (Fig. 3.9 (a)). Many factors such as equilibrium constraints, changes in
the nature of the catalyst with temperature, changes in adsorption coefficients of
the reactants and rapid decomposition of the alkylating agent at higher
temperatures could be responsible for the observed behaviour. We believe that
the rapid decomposition of the alkylating agent and lower adsorption coefficient
of the active alkylating species at higher temperatures are probably responsible
for the observed deactivation behaviour which has also been reported by earlier
workers in the alkylation of toluene with methanol [1]. The yields of the
different products also go through similar maxima at 698K (Fig. 3.9 (b)).
3.3.2.4 Influence of contact time
The influence of contact time (W/F; g.h.mole -1; W = catalyst wt., g ; F =
feed rate, mole h-1) on the reaction is presented in Fig. 3.10 (a). An increase in
contact time increases conversion and product yields over all the catalysts. The
product distribution at different W/F values is presented in Fig. 3.10 (b) for
CsX(OH). Plots of product yields over CsX(OH) as a function of conversion are
presented in 3.10 (c). It is noticed that the yields of EB and isopropylbenzene
are extrapolatable to origin suggesting these to be the primary products. It
appears that both EB and i-propylbenzene are formed from the same adsorbed
intermediate as shown below:
Toluene [Toluene]ads [EB]ads EB
[i-prBz]ads i-prBz

144
Fig. 3.8 Influence of basicity of the catalysts on: (a) toluene conversion at
different temperatures; (b) product yields over CsX(OH) at 698K
(Conditions: Toluene / DMC (mole) = 5, W/F (g.h.mole-1) = 30,
N2/F (mole) = 5, Process time = 2h).
6
9
12
15
18 (a)
3 .06
CsX(Cl)
KX(Cl )K X ( O H )C s ( O H )
673K
698K 723K
748K 773K
Con
v. (
%)
0
3
6
9
12
(b)
Sint
Sint
N a X3.283.13
KX(Cl )CsX(Cl)
K X ( O H )C s X ( O H )3.06
3.13N a X3.28
Yie
ld (
%)
Benzene
Xylenes EB
i-PrBZ

144
Fig. 3.9 Influence of temperature on: (a) toluene conversion over different
catalysts; (b) product yields over CsX (OH) (Conditions:
Toluene / DMC (mole) = 5, W/F (g.h.mole-1) = 30, N2/F (mole)
= 5, Process time = 2h).
660 680 700 720 740 760 780
6
9
12
15
18 (a) NaX, KX(Cl) KX(OH), CsX(Cl) CsX(OH)
Con
v. (w
t%)
Temperature (K)
660 680 700 720 740 760 7800
3
6
9
12(b)
Temperature (K)
Yie
ld (w
t%)
Benzene Xylenes EB i-PrBZ

144
3.3.2.5 Influence of molar ratios of reactants
Increasing the toluene/DMC molar ratio increases toluene conversion
over all the catalysts (Fig. 3.11 (a)). This increase suggests a positive order for
the reaction with respect to toluene. The effect is less beyond toluene/DMC = 1
due to the diminished availability of the alkylating agent at the surface. The
yields of the primary products (ethyl and propylbenzenes) increase more rapidly
with increase in the toluene / DMC ratio than the other products (Fig. 3.11 (b)).
3.3.2.6 Reaction mechanism
The side chain alkylation of toluene by methanol has been suggested to
occur over basic sites in alkali exchanged zeolites [1, 3, 14]. Some workers
have also proposed a cooperative action of acidic and basic sites in side chain
alkylation, the basic site activating the side chain and the acidic site adsorbing
the benzene ring [9]. While alkylation using methanol has been suggested to
take place through the intermediate HCHO, DMC has been reported to alkylate
through CH3+ [15].
The alkylation of toluene to EB with DMC is shown below
C6H5CH3 + (CH3)2CO3 → C6H5C2H5 + CH3OH + CO2.
The formation of i-propylbenzene probably occurs by the reaction of EB with
methanol as shown below [24]
CH3OH → HCHO + H2
C6H5C2H5 + HCHO → C6H5C(CH3)=CH2 + H2O
C6H5C(CH3)=CH2 + H2 → C6H5CH(CH3)2

144
Fig. 3.10 Influence of contact time on: (a) toluene conversion over
different catalysts at 698K; (b) product distribution over
CsX(OH); (c) product yields at different conversions over
CsX(OH) (Conditions: Temperature = 698K, toluene / DMC
(mole) = 5, N2/F (mole) = 5, process time = 2h).
10 20 30 40 50
6
9
12
15
18
(a)
Yie
ld (w
t%)
Con
v. (w
t%)
W / F ( g . h . m o l e -1)
NaX, KX(Cl)
KX(OH), CsX(Cl) CsX(OH)
Con
v. (w
t%)
W / F (g.h.mole -1)
10 20 30 40 500
3
6
9
12
15(b)
Benzene
Xy lenes
EB i-PrBZ
0.0 3.5 7.0 10.5 14.0 17.5 21.00
5
10
15(c)
C o n v . ( w t % )
Benzene
Xy lenes EB
i-PrBZ

144
Fig. 3.11 Influence of toluene / DMC mole ratio on: (a) toluene conversion
over the different catalysts; (b) product yields over CsX(OH)
(Conditions: Temperature = 698K, W/F (g.h.mole -1) = 30, N2/F
(mole) = 5, Process time = 2h).
1 2 3 4 5
8
12
16
(a)
Yie
ld (w
t%)
NaX, KX(Cl) KX(OH),
CsX(Cl), C s X ( O H )
Con
v. (w
t%)
Toluene / DMC (mole)
1 2 3 4 50
3
6
9
12
(b)
Toluene / DMC (mole)
Benzene Xylenes
EB i-PrBZ

144
3. 4 CONCLUSIONS
Alkylation of ethylbenzene (EB) and toluene with dimethylcarbonate
(DMC) is promoted by alkali exchanged zeolite-X. Propylbenzenes (n- and i-)
are the major products besides styrene and o-xylene in the alkylation of ethyl
benzene. In the case of toluene alkylation, ethylbenzene is the major product
besides i-propylbenzene, which is the doubly methylated product. Side chain
alkylation activity increases with increasing basicity of the exchanging cation.
The catalysts prepared by exchanging with alkali hydroxides were more active
than those prepared from chlorides. Conversion of EB (or toluene) and the yield
of the products are maximum at a process time of 2 h. Maximum EB conversion
and side chain alkylation product formation are observed at ~733K at an
EB/DMC mole ratio of 5 and a W/F (g.h.mole-1) of 60. Maximum toluene
conversion and side chain alkylation product formation are observed at ~698K at
toluene/DMC mole ratio of 5 and a W/F (g.h.mole -1) of 30.
3. 5 REFERENCES
1. T. Yashima, K. Sato, T. Hayasaka and N. Hara, J. Catal. 26, 303 (1972).
2. H. Itoh., T. Hattori, K. Suzuki and Y. Murakami, J. Catal. 79, 21 (1983).
3. C.H. Liu (Exxon), U. S. Pat. 1984, 4,463,204.
4. J.M. Garces, G.E. Vrieland, S.I. Bates, F.M. Scheidt and F.M. Basico, Stud. Surf.
Sci. Catal. 20, 67 (1985).
5. N. Giordano, L. Pino, S. Cavallaro, P. Vitarelly and B. S. Rao. Zeolites 7, 131
(1987).
6. S. Zheng, J. Cai, D. Liu, Proceedings of the Ninth International Congress on
Catalysis; Chemical Institute of Canada: Ottawa 1, 476 (1988).

144
Catalysis; Chemical Institute of Canada: Ottawa 1, 476 (1988).
7. M. L. Unland and G. E. Barker, (Monsanto) Zeolite Catalyst. U.S. Pat.
4,115,424 (1978).
8. C. Lacroix, A. Deluzarche, A. Keinnemann and A. Boyer, J. Chim. Phys. b, 81,
473, 481, 487 (1984).
9. H.C. Liu and R.J. Spohn, U.S. Patent. 4,483,936, 1984.
10. J. Engelhardt, J. Szanyi and J. Valyon., J. Catal. 107, 296 (1987).
11. P. E. Hathaway and M. E. Davis, J. Catal 116, 263 (1989).
12. X. Wang, G. Wang, D. Shen, C. Fu and M. Wei, Zeolites 11, 254 (1991).
13. C. Yang and Z. Meng, Appl. Catal. 71, 45 (1991).
14. H. Vinek, M. Derewinski, G. Mirth and J. A. Lercher, Appl. Catal. 68, 277
(1991).
15. P. Beltrame, P. Fumagalli and G. Zeretti, Ind. Eng. Chem. Res. 32, 26 (1993).
16. B.K. Vasanthy, M. Palanichamy and V. Krishnaswamy, Appl. Catal.A: Gen.
148, 51 (1996).
17. M. D. Sefcik, J. Am. Chem. Soc. 101, 2164 (1979).
18. A. Philippou and M.W. Anderson, J. Am. Chem. Soc. 116, 5774 (1994).
19. H. Itoh, A. Miyamoto and Y. Murakami, J. Catal. 64, 284 (1980).
20. J. J. Freeman and M. L. Unland, J. Catal. 54, 183 (1978).
21. M. L. Unland and J. J. Freeman , J. Phys. Chem. 82, 1036 (1978).
22. S.T. King and J.M. Graces, J. Catal. 104, 59 (1987).
23. C.S. Huang and A.-N. Ko, Catal. Lett. 19, 319 (1993).
24. Y. N. Sidorenko, P. N. Galich and V.S. Gutyrya, II' in V.G., Neimark, I.E. Dokl.
Akad. Nauk SSSR 173, 132 (1967).
25. Y.N. Sidorenko and P. N. Gallich, Ukr. Khim. Zr. 36, 1234 (1970).

144
26. P.E. Hathaway and M.E. Davis, J. Catal. 116, 279 (1988).
27. P.E. Hathaway and M.E. Davis, J. Catal. 119, 497 (1988).
28. J.C. Kim, H.-X. Li, C.-Y. Chen and M. Davis, Microporous Mater. 2, 413
(1994).
29. A.N. Vasiliev and A.A. Galinsky, React. Kinet. Catal. Lett. 51, 253 (1993).

144
CHAPTER CHAPTER -- IV IV
00--ALKYLATIONALKYLATION

144
ALKYLATION REACTIONS OF HYDROXY
AROMATIC COMPOUNDS OVER ALKALI
LOADED SILICA
4. 1 INTRODUCTION
The large E-factors (kg waste / kg product) [1] of most processes used at
present in the fine chemicals industry make the development of environmentally
clean and economical processes based on solid catalysts highly relevant. Though
liquid acids have been replaced by solids such as zeolites in numerous reactions,
the application of solid bases in fine chemical production is not yet common.
Many inorganic solid bases like alkali modified zeolites, either through ion
exchange or by decomposition of alkali salts in the zeolite cages have recently
been found useful in the production of fine chemicals [2-13].
O-alkylated products of phenol, the aryl alkyl ethers, of which anisole is
the simplest member, are important industrial chemicals that are extensively
used as starting materials in the production of dyes and agrochemicals, as
antioxidants for oils and grease and as stabilizers for plastics. Conventionally,
alkyl aryl ethers can be prepared by Williamson ether synthesis, which requires
an alkyl halide and a stoichiometric amount of sodium hydroxide. Conventional
processes are atom inefficient and generate waste. For example, if one were to
alkylate cresol stoichiometrically with dimethyl sulfate and neutralize the H2SO4
with sodium carbonate, the atom efficiency (AE) would be just 0.58 [1]. On the
other hand, the direct methylation with methanol will have an AE of 0.87, the
only byproduct being water. Besides methanol is far cheaper and easier to
handle than methyl sulfate.

144
The vapour phase methylation of phenol with methanol using metal
oxide, sulphate, phosphate and zeolite catalysts has been extensively studied
[14-23]. The products are usually mixtures of anisole (product of O-
methylation) and cresols and xylenols (products of ring methylation), the
selectivity being strongly dependent on the catalyst. The O-alkyation of phenol
over zeolites was reported by Balsama et al. [24] over X, Y and ZSM-5. O-
alkylations have also been carried out over ZSM-5 [25-27], AlPO4 and SAPO
[28] molecular sieves. SAPO produced only anisole and both cresols and
anisoles were produced over the other molecular sieves. The selectivities,
generally determined by the Bronsted acidity of the molecular sieves, are also
affected by factors such as pore size and pore geometry. Ono et al. [29] reported
the selective O-methylation of phenol with dimethylcarbonate (DMC) over X-
zeolites. Samolada et al. [30] reported the selective O-methylation of phenol
over sulphates supported on γ-Al2O3. Xu et al. studied [31] the O-alkylation of
phenol with methanol on H-beta zeolite. Beutel et al. [32] reported
spectroscopic and kinetic studies of the alkylation of phenol with dimethyl
carbonate over NaX. Bautista et al. [33] reported the alkylation of phenol with
DMC over AlPO4, Al2O3 and AlPO4-Al2O3 catalysts. Lee et al. [34] reported the
O-alkylation of phenol derivatives over basic zeolites. The substrates
investigated by them were phenol, 4-nitrophenol, 4-aminophenol and 4-
chlorophenol; the activity of the catalyst increased with basicity of the loaded
metal and there was no difference in catalytic activity between Cs cation
exchanged and Cs oxide loaded zeolites.
O-methylated hydroxy benzenes are important synthetic intermediates in
the production of fine chemicals and pharmaceuticals [35]. Guaiacol (O-

144
methoxy phenol) is an important intermediate for the production of flavorings,
fragrances and pharmaceuticals. Ono et al. [36-38] reported the selective O-
alkylation of catechol over alumina, alkali hydroxide loaded alumina and
potassium nitrate loaded alumina. DMC was a much more efficient methylating
agent than methanol in the methylation of catechol over alumina. The main
product was guaiacol, the selectivity for it being ca. 70%. Addition of water to
the feed considerably increased the catalytic activity and the yield of guaiacol.
Similarly, over alumina loaded with alkali hydroxides, catechol was methylated
mainly into guaiacol [37]. A guaiacol yield of 84% was obtained at a catechol
conversion of 100% at 583 K over LiOH/Al2O3 with DMC as the alkylating
agent. Over alumina loaded with potassium nitrate, catechol produced
selectively veratrole with dimethylcarbonate [38]. A veratrole yield of 97% was
obtained at a catechol conversion of 99% at 583 K and a DMC/catechol ratio of
4.
The various O-alkylation reactions investigated and described in this
chapter are shown in Scheme 1.
4. 2 EXPERIMENTAL
4.2.1 Materials and catalysts
The chemicals used in the O-alkylation reactions, their purity and source
are presented in Table 4.1. The catalysts used in the studies are presented in
Table 4.2. The details of the preparation of all the catalysts have been presented
in Chapter II. Their physicochemical characteristics are also presented in
Chapter II.

144
OH
R-OH (R= Me, Et, n-Pr, n-Bu)
M-SiO2 (M= Li, Na, K and Cs)
OR
OH
M-SiO2 (M= Li, Na, K and Cs) CH3
CH3OH
CH3
OCH3
OH
OH
CH3OH
M-SiO2 (M= Li, Na, K and Cs)
OCH3
OCH3
OCH3
OH
+
OH
OCH3
M-SiO2 (M= Li, Na, K and Cs)
CH3OH
OCH3
OCH3
HOCH3OH
M-SiO2 (M= Li, Na, K and Cs) Cs-MCM-41
OCH3
Scheme 1. The O-alkylation reactions investigated in this work.

144
Table 4.1 Chemicals used in this study
Name Purity Source
Phenol > 99% S.D. Fine-chem Ltd., INDIA
o-Cresol 99% Aldrich, USA
m-Cresol 99% Aldrich, USA
p-Cresol 99% Aldrich, USA
Catechol 99% S.D. Fine-chem Ltd., INDIA
Resorcinol 99% Loba Chemie Pvt. Ltd., INDIA
Hydroquinone 99% Loba Chemie Pvt. Ltd., INDIA
p-Methoxy phenol 99% Loba Chemie Pvt. Ltd., INDIA
2-Naphthol 99% S.D. Fine-chem Ltd., INDIA
Methanol > 99.5% S.D. Fine-chem Ltd., INDIA
Ethanol > 99.5% S.D. Fine-chem Ltd., INDIA
n-Propanol > 99.5% S.D. Fine-chem Ltd., INDIA
n-Butanol > 99.5% S.D. Fine-chem Ltd., INDIA
4.2.2 Reaction procedure
The catalytic experiments were carried out in a vertical down-flow glass
reactor (15mm i.d.). The catalyst (2g) was used in the form of granules (10-22
mesh) prepared by pelleting of the powders and crushing into the desire size.

144
Table 4.2 Catalysts used in the different reactions
Catalysts Reactions
SiO2; Li(1.5)SiO2; Na(1.5)SiO2;
K(1.5)SiO2; Cs(0.075)SiO2;
Cs(0.375)SiO 2; Cs(0.75)SiO 2;
Cs(1.5)SiO 2; Cs(2.25)SiO 2
O-alkylation of phenol
SiO2; Li(1.5)SiO2; Na(1.5)SiO2;
K(1.5)SiO2; Cs(0.075)SiO2;
Cs(0.375)SiO 2; Cs(0.75)SiO 2;
Cs(1.5)SiO 2; Cs(2.25)SiO 2
O-methylation of cresols
SiO2; Li(1.5)SiO2; Na(1.5)SiO2;
K(1.5)SiO2; Cs(0.075)SiO2;
Cs(0.375)SiO 2; Cs(0.75)SiO 2;
Cs(1.5)SiO 2; Cs(2.25)SiO 2
O-methylation of dihydroxy
benzenes
SiO2; Li(1.5)SiO2; Na(1.5)SiO2;
K(1.5)SiO2; Cs(1.5)SiO2;
O-methylation p-methoxy phenol
SiO2; Li(1.5)SiO2; Na(1.5)SiO2;
K(1.5)SiO2; Cs(0.075)SiO2;
Cs(0.375)SiO 2; Cs(0.75)SiO 2;
Cs(1.5)SiO 2; Cs(2.25)SiO 2; MCM-41;
Cs(0.075) MCM-41; Cs(0.15) MCM-
41; Cs(0.225) MCM-41
O-methylation of 2-naphthol

144
The reactor was placed inside a temperature controlled furnace
(Geomecanique, France) with a thermocouple placed at the center of the catalyst
bed for measuring the reaction temperature. The catalyst was activated in
flowing air (20 ml. min-1) at 773K for 3h prior to flushing in N2 and adjustment
of temperature for start of the experiment. The feed (mixture of the desired
phenol and alcohol) was passed using a syringe pump (Braun, Germany) along
with N2 gas (18ml / min). The product was cooled in a water-cooled (ice-cold)
condenser, collected in a receiver and analyzed in a gas chromatograph
(HP5880A; capillary column HP1, 50m X 0.2mm; FID detector). Product
identification was done by GC-MS and GC-IR.
4.3 RESULTS AND DISCUSSION
4.3.1 O-alkylation of phenol
4.3.1.1 Activities of the catalysts
Catalytic activities of different alkali loaded silica samples are presented
in Table 4.3. Pure SiO2 has little O-alkylation activity, but alkali loaded silica is
catalytically active. For a given molar loading (1.5 mmole/g) of the alkali ions,
activity of the catalysts (in the case of all the alkylations) is in the order
Cs(1.5)SiO 2 > K(1.5)SiO 2 > Na(1.5)SiO2 > Li(1.5)SiO 2. Table 4.3. also reveals
that the activity of the catalysts increases with increasing Cs content (basicity).
Detailed carbon balances carried out for many of the experiments were in the
range 94-98%. Assuming the absence of boundary, inter- and intraparticle
diffusion effects, phenol conversion (Xp) can be fitted into the first order rate
equation,

144
ln [1/ (1- Xp)] = k (W/F) …….. (1),
where W = weight of the catalyst and F = feed rate in mole/sec.
Runs were performed at four feed rates in the range 1.5 – 6.5 x 10⁻⁵ mole sec-1
and at reaction temperatures in the range 573 K – 673 K. The ln [1/ (1- Xp)]
versus W/F plots according to Eq. [1] are almost linear (at low conversions)
passing through the origin indicating a reasonable fit of the data to Eq. (1). The
slope of the straight line yields the value of the reaction rate constant (k) in mole
g-1sec-1. The values obtained at various temperatures for different catalysts, at a
time on stream of 1h are presented in Table 4.4. The basicities of the catalysts
calculated from Sanderson’s electronegativity (Sint ) and FTIR intensities of
adsorbed CO2 are also presented in the table. Though there is a relationship
between basicity (FTIR intensity) and rate constants, no linear correlation is
found. Similarly, though the activity increased with decreasing Sint , the
relationship is not linear. The data do confirm that though the activity of the
catalyst is related to its basicity, simple linear relationships may not be present.
4.3.1.2 Reactivities of the alcohols
The relative activities of the alcohols are in the order: n-butanol < n-
propanol < ethanol < methanol. The reason for this reactivity trend may be the
difference in their adsorption coefficients over the catalytic surfaces. The
acidity order of the alcohols is: n-butanol < n-propanol < ethanol < methanol. It
is probable that the higher acidity of methanol causes it to adsorb in sufficient
amount (in competition with the more acidic phenol) on the basic surface. The
mechanism of the reaction probably involves the formation of a phenolate

144
Table 4.3 Activities of the catalysts in phenol alkylation
Methylation Ethylation n-Propylation n-Butylation Catalysta
Conv.b Sel.c Conv.b Sel.c Conv.b Sel.c Convb Sel.c
SiO2 3.4 6.9 2.2 3.3 1.7 2.2 -
Li(1.5)SiO2 1.2 100 - - -
Na(1.5)SiO2 12.3 100 9.9 100 2.6 100 2.0 100
K(1.5)SiO2 30.1 100 13.3 100 8.7 100 4.5 100
Cs(0.075)SiO 2 33.2 100 20.2 100 15.1 100 14.7 100
Cs(0.375)SiO 2 59.8 100 41.6 100 38.3 100 30.5 100
Cs(0.75)SiO2 69.7 100 51.2 100 42.8 100 37.7 100
Cs(1.5)SiO 2 91.4 100 61.5 100 44.9 100 39.2 100
Cs(2.25)SiO2 92.8 100 63.0 100 49.1 100 41.4 100
a The number in brackets denotes the mmole of alkali metal loaded per g of SiO 2; b: Conv. = conversion (wt%) of phenol; c =
selectivity for O-alkylated product (moles of O-alkylated product X 100 / moles of all the products) (Conditions: Temperature =
673 K, contact time (1/WHSV) = 0.38h, time on stream = 1h, alcohol / phenol (mole) = 5, N2 = 18 ml/min).

144
Table 4.4. Rate constants (k x 10-3 mole g-1sec-1) for different alkali loaded catalysts in phenol methylation and bsicity data
Basicity Catalyst
Sint FTIR
573 K 608 K 640 K 673 K
Li(1.5)SiO2 3.98 92 - - 0.01 0.01
Na(1.5)SiO2 3.96 132 0.01 0.08 0.07 0.09
K(1.5)SiO2 3.92 153 0.05 0.11 0.19 0.26
Cs(0.075)SiO 2 4.22 19 0.01 0.05 0.08 0.19
Cs(0.375)SiO 2 4.18 88 0.02 0.17 0.31 0.65
Cs(0.75)SiO2 4.09 120 0.13 0.27 0.45 0.86
Cs(1.5)SiO 2 3.91 216 0.22 0.44 0.75 1.77
Cs(2.25)SiO2 3.69 262 0.28 0.49 0.79 1.86
a The number in brackets denotes the mmole of alkali metal loaded per g of SiO2. (Conditions: contact time (1/WHSV) =
0.38h, time on stream = 1h, alcohol / phenol (mole) = 5, N2 = 18 ml/min). Sint: Calculated from Sanderson’s electronegativity
principle; FTIR: relative band intensity of adsorbed CO2 in FTIR spectra in 1200 cm-1 to 1750 cm-1 region at 0.4 mm
equilibrium pressure.

144
species on the basic O2- site on the surface of alkali loaded silica as shown
below:
4.3.1.3 Influence of time on stream
The influence of duration of run on the conversion of phenol with alcohols is
presented in Fig. 4.1(a). The catalyst investigated was Cs(1.5)SiO 2. The
influence of time on stream on the conversion of phenol with methanol over
different alkali (Li, Na, K and Cs) loaded catalysts is presented in Fig. 4.1(b). It
is observed that the catalyst deactivates with time on stream in the case of all the
alcohols. Deactivation probably arises from coke deposition on the catalysts. At
higher temperatures, the deactivation of the catalysts is more due to rapid coke
formation. Studies on other alkali loaded catalysts reveal (data not reported) that
the catalysts deactivate to different extent depending on the alkali metal and
alkylating agents. A parameter called the average deactivation rate is used to
compare the different catalysts and alcohols. The average deactivation rate is
defined as the average activity loss per hour during the experimental period
divided by the average conversion during this period. The parameter defines the
activity loss per unit conversion in unit time and is therefore useful for
comparing different catalysts with different intrinsic activities. The deactivation
O - - -HO - - -R
HCsCs OO
δδ
δ δ++
--
(R = CH3, C2H5, n-C3H7 and n-C4H9)

144
rate for different alkali (Li, Na, K and Cs) loaded catalysts are plotted in Fig. 4.2
(a). The deactivation rate for different Cs-loaded catalysts are plotted in Fig.
4.2(b). Methanol deactivates the catalyst much more than the other alkylating
agents and deactivation decreases with increasing basicity of the catalysts. The
greater deactivation of the catalyst by methanol may be due to its stronger
adsorption compared to other alcohols. The decrease in deactivation rate with
basicity may be related to the mode of adsorption of the phenol. Over the more
acidic catalysts, phenol molecule may adsorb by interaction of its π electron
cloud, while on a more basic catalyst, it may adsorb by the -OH group. One
would expect greater deactivation when the molecule is adsorbed flat on the
surface as ring condensation reactions that lead to coke are more likely in this
adsorption mode.
4.3.1.4 Effect of temperature
Conversions obtained with different alkylating agents at different
temperatures (573 - 673 K) are presented in Fig. 4.3 (a). The catalyst
investigated was Cs(1.5)SiO 2. Conversion is found to increase with temperature
in all the cases. The influence of temperature on methylation over different
alkali loaded silica samples is presented in Fig. 4.3 (b). Though the activity (as
expected) increases from Li to Cs, the activity of the Cs catalyst is much larger
than the other catalysts (Fig. 4.3 (b)). The decrease in activity of the catalyst
with time on stream at different temperatures in the methylation of phenol over
Cs(1.5)SiO 2 is presented in Fig. 4.4. It is seen from the data of Fig. 4.4 that the
catalyst deactivates faster at higher temperatures. The activity loss per hour
calculated from the above data are 1%, 0.9%, 0.8% and 0.8%, respectively at
613K, 598K, 583K and 573K.

144
Fig. 4.1 Influence of duration of run on conversion: (a) over Cs(1.5)SiO2;
(b) methylation over different catalysts (Conditions: Temperature
= 673K, contact time (h) = 0.38, alcohol / phenol (mole) = 5, N2
= 18 ml/min).
1 2 3 4 5 6
0
20
40
60
80
(a)
Methylation, Ethylation
n-Propylation, n-Butylation
Con
v. (
wt%
)
Time on stream (h)
1 2 3 4 5 60
20
40
60
80
100(b)
Time on stream (h)
Con
v. (
wt%
)
Li(1.5)SiO2 Na(1.5)SiO2 K(1.5)SiO2 Cs(1.5)SiO2

144
Fig. 4.2 Influence of substrate on catalyst deactivation rate: (a) over
different alkali loaded catalysts; (b) over various Cs loaded
catalysts (deactivation rate / h = 2(C1 – C6) / 5(C1 + C6), where C1
and C6 are conversions at 1h and 6h respectively) (Conditions:
Temperature = 673K, contact time (h) = 0.38, alcohol / phenol
(mole) = 5, N2 = 18 ml/min).
0.02
0.04
0.06
0.08
0.10
0.12
0.14
0.16 (a)
CsKNaLi
Methylation Ethylation n-Propylation n-Butylation
Dea
ctiv
atio
n ra
te /
h / c
onv
0.0 0.5 1.0 1.5 2.0 2.5
0 . 0 3 0
0 . 0 3 5
0 . 0 4 0
0 . 0 4 5
0 . 0 5 0
(b)
Cs loading (mmole/g SiO2)
Dea
ctiv
atio
n ra
te /
h / c
onv
Methylation Ethylation n-Propylation n-Butylation

144
4.3.1.5 Effect of contact time
Conversion increases with increase in contact time (studied from 0.19 h to
0.75 h at 673 K) for all the alcohols (Fig. 4.5(a)) over Cs(1.5)SiO2. At all
contact times, conversion is higher for methylation followed by ethylation, n-
propylation and n-butylation. For all the alkylations, conversion increases
rapidly with contact time initially (< 0.36h) and then levels off. The influence of
contact time on methylation over different catalysts is presented in Fig. 4.5(b).
For methylation, the conversion increases with contact time for all the catalysts
but the Cs loaded catalyst is more reactive than other alkali loaded catalysts (Fig.
4.5(b)). The influence of time on stream on activity of Cs(1.5)SiO 2 at different
contact times is presented in Fig. 4.6. Going by the slopes of the conversion vs.
time on stream plots (Fig. 4.6), the deactivation rates appear to be nearly similar
at the different contact times.
4.3.1.6 Effect of methanol / phenol mole ratio (methylation of phenol)
The conversion of phenol decreases as the methanol to phenol mole ratio
decreases. The conversion decreases to almost one third as the methanol to
phenol mole ratio decreases from 5 to 1. The influence of MeOH partial
pressure in the feed (including N2) on conversion is presented in Fig. 4.7(a).
The corresponding MeOH / phenol (mole) ratios are also presented in the figure.
At higher methanol to phenol mole ratio, the catalyst deactivation is more
compared to deactivation at lower mole ratios (Fig. 4.7(b)). The deactivation
per hour is 3.6%, 2.3% and 1.9%, respectively at mole ratios of 5, 2.5 and 1.

144
Fig. 4.3 Effect of temperature on conversion: (a) Over Cs(1.5)SiO2; (b)
methylation over different catalysts (Conditions: Time on stream
= 1h, contact time (h) = 0.38, alcohol / phenol (mole) = 5, N2 =
18 ml/min).
560 580 600 620 640 660 6800
20
40
60
80
100(a)
Methylation Ethylation n-Propylation
n-Butylation
Con
v. (w
t%)
Temperature (K)
560 580 600 620 640 660 6800
20
40
60
80
100(b)
Temperature (K)
Con
v. (w
t%)
Li(1.5)SiO2 Na(1.5)SiO2
K(1.5)SiO2 Cs(1.5)SiO2

144
Fig. 4.4 Influence of time on stream on conversion at different
temperatures (Conditions: Contact time (h) = 0.38, methanol /
phenol (mole) = 5, N2 = 18 ml/min).
4.3.1.7 Studies on catalyst deactivation
The results of the studies indicate that though high O-alkylation selectivity is
achieved over alkali loaded SiO2 catalysts, deactivation of catalysts is rather
substantial. For a given conversion, the most basic catalyst (Cs-SiO2)
deactivates the least. Again, deactivation rate is lower at lower temperature and
lower methanol / phenol mole ratios at which the conversions are also lower. It
was therefore decided to look at other ways of decreasing catalyst deactivation.
These experiments (A to D) are described below. The deactivation rates
(normalized for conversions) are presented in Fig. 4.8.
1 2 3 4 5 6
20
25
30
35 573K, 583K 598K, 613K
Con
v. (
wt%
)
Time on stream (h)

144
Fig. 4.5 Effect of contact time on conversion: (a) over Cs(1.5)SiO2; (b)
methylation over different catalysts (Conditions: Time on stream
= 1h, temperature = 673K, alcohol / phenol mole) = 5, N2 = 18
ml/min).
0.2 0.3 0.4 0.5 0.6 0.7 0.820
40
60
80
(a)
Methylation
Ethylation n-Propylation n-Butylation
Con
v. (w
t%)
Contact time (h)
0.2 0.4 0.6 0.80
20
40
60
80
100
(b)
Contact time (h)
Con
v. (w
t%) Li(1.5)SiO2
Na(1.5)SiO2
K(1.5)SiO2 Cs(1.5)SiO2

144
Fig. 4.6 Effect of time on stream on conversion at different contact times
(1/WHSV) over Cs(1.5)SiO2 (Conditions: Temperature = 598K,
methanol / phenol (mole) = 5, N2 = 18 ml/min).
Expt. A:
This is a normal experiment over Cs(1.5)SiO2 at 598K, contact time (h) =
0.38 and MeOH / phenol (mole) = 2.5. N2 is used as diluent gas. The
conversion is 30.9% and the deactivation rate (% loss h-1conv-1) is 0.03.
Expt. B:
The conditions of the experiment were the same as in Expt. A. However, H2
was used instead of N2. There is a small decrease in conversion (28.5% in H2
and 30.9% in N2), and a larger decrease in deactivation rate (0.024 in H2 and
0.03 in N2). This suggests that H2 probably hydrogenates and desorbs the coke
precursors causing deactivation.
Expt. C:
In this experiment a Cs (1.5)SiO 2 catalyst loaded with 0.01wt% Pt was used
as the catalyst. The experimental conditions (including N2 gas) were the same as
in Expt. A. A sharp decrease in deactivation rate (0.03 to 0.016) is seen. A
small conversion decrease is also noticed (26.3 in the presence of Pt).
1 2 3 4 5
34
36
38
40
42
44
46
0.18h, 0.25h
0.38h, 0.76h
Con
v. (
wt%
)
Time on stream (h)

144
Fig. 4.7 (a) Effect of feed mole ratios on conversion over Cs(1.5)SiO2
(Temperature = 673K, time on stream = 1h, contact time (h) =
0.38, N2 = 18ml/min); (b) Effect of time on stream on conversion
for different mole ratios over Cs(1.5)SiO2 (Temperature = 673K,
contact time (h) = 0.38, N2 = 18ml/min).
0.0 0.1 0.2 0.3 0.4 0.50
20
40
60
80
100
(a)
Methanol / phenol (mole)
Con
v. (w
t%)
Partial pressure of methanol (atm)
0.5 1.0 1.5 2.0 2.5 3.0 3.530
40
50
60
70
80
90 (b)
Time on stream (h)
Con
v. (w
t%) Methanol / Phenol (mole) = 5
Methylation / Phenol (mole) = 2.5 Methanol / Phenol (mole) = 1
0 1 2 3 4 5 6

144
The experiment suggests that Pt even when present in small amount is able to
hydrogenate the coke precursors and suppress the deactivation. The H2 for the
hydrogenation of the coke precursors probably comes from MeOH
dehydrogenation, which is known to occur on basic catalysts.
Expt. D:
This experiment was similar to C, but H2 was used instead of N2. The
deactivation rate is decreased further to 0.012. Again a small loss in conversion
is observed (23.8%).
The experiments suggest that one way of decreasing catalyst deactivation is
by hydrogenating the coke precursors. However, during the process, a small
conversion loss also occurs. The reason for the loss of alkylation activity in H2
is not clear.
Fig. 4.8 Catalyst deactivation studies: Expt. A = Cs(1.5)SiO2, N2 =
18ml/min; Expt. B = Cs(1.5)SiO2, H2 = 18ml/min; Expt. C =
Cs(1.5)SiO 2 + 0.01 wt% Pt, N2 = 18ml/min; Expt. D =
Cs(1.5)SiO 2 + 0.01 wt% Pt, H2 = 18ml/min (Conditions:
Temperature = 598K, contact time (h) = 0.38, methanol / phenol
(mole) = 2.5).
0.010
0.015
0.020
0.025
0.030
Expt. DExpt. CExpt. BExpt. A
Dea
ctiv
atio
n ra
te /
h / c
onv.

144
4.3.2 O-Methylation of cresols
4.3.2.1 Activities of the catalysts
The catalytic activities of different alkali loaded silica samples are presented
in Table 4.5. Pure SiO2 has little O-methylation activity; alkali (Li, Na, K and
Cs) loaded silica is catalytically active. For a given molar loading (1.5 mmol/g)
of the alkali ions, activity of the catalysts (in the case of all the three substrates)
is in the order, Cs(1.5)SiO2 > K(1.5)SiO2 > Na(1.5)SiO2 > Li(1.5)SiO 2. Table
4.5. reveals that the activity of the catalysts also increases with increasing Cs
content (basicity).
4.3.2.2 Influence of time on stream (TOS)
The influence of duration of run on the conversion of cresols with
methanol is presented in Fig. 4.9. The catalyst investigated was Cs(1.5)SiO2.
The influence of TOS on the conversion of cresols with methanol over different
alkali (Li, Na, K and Cs) loaded catalysts is presented in Fig. 4.10(a), Fig.
4.10(b) and Fig. 4.10(c), respectively for o-cresol, m-cresol and p-cresol. It is
observed that the catalyst deactivates with time on stream in the case of all the
substrates (o-cresol, m-cresol and p-cresol). Deactivation arises probably due to
coke formation over the catalyst. Studies on the various alkali metal (Li, Na, K
and Cs) loaded catalysts reveal that the catalysts deactivate to different extents
depending on the alkali metals and the feed cresol. The average deactivation
rate (defined as the average hourly loss in conversion during the first to sixth
hour divided by the average conversion during that period) decreases with
increasing basicity of the catalysts (Fig. 4.11).

144
Table 4. 5 Activities of different catalysts in the methylation of cresols
Catalysta o-Cresol m-Cresol p-Cresol
Conv.b
(wt %)
Sel.c
(wt %)
Conv.b
(wt %)
Sel.c
(wt %)
Conv.b
(wt %)
Sel.c
(wt %)
SiO2 1.3 7.9 1.4 8.2 1.4 8.5
Li(1.5)SiO2 6.6 >99 7.4 >99 9.1 >99
Na(1.5)SiO2 7.4 >99 8.1 >99 9.8 >99
K(1.5)SiO2 32.5 >99 36.6 >99 38.6 >99
Cs(0.075)SiO 2 22.9 >99 31.8 >99 13.9 >99
Cs(0.375)SiO 2 52.3 >99 68.8 >99 58.2 >99
Cs(0.75)SiO2 64.5 >99 72.5 >99 77.2 >99
Cs(1.5)SiO 2 79.0 >99 81.9 >99 88.5 >99
Cs(2.25)SiO2 84.5 >99 88.0 >99 94.0 >99
a: The number in brackets denotes the wt% of Cs loaded on SiO2; b: Conversion
of the cresol; c: Selectivity = (moles of the O-methylated product / moles of all
products) x 100 (Conditions: temperature = 673K; time on stream = 1h; contact
time (h) = 0.376h; N2 flow = 18 ml/min).

144
Fig. 4.9 Effect of time on stream on conversion over Cs(1.5)SiO2
(Conditions: Temperature = 673K, contact time (h) = 0.38,
methanol / substrate (mole) = 5, N2 = 18 ml/min).
The deactivation rate is more for o-cresol and least for p-cresol. As already
described in the case of phenol, the relative occurrence of different modes of
adsorption (by the –OH group or aromatic ring) for the different substrate -
catalyst combinations may be determining the deactivation rate (Fig. 4.11).
4.3.2.3 Reactivities of cresols
The relative reactivities of the three cresols are in the order: o-cresol <
m-cresol ≤ p-cresol (Fig. 4.12 (a) to (d)). The relative acidities of the cresols are
in the order: m-cresol > p-cresol ∼ o-cresol. As the catalyst is basic, one would
expect the strengths of adsorption by the –OH group to be in the same order as
above for the three cresols. The reason for the lower reactivity of o-cresol is
1 2 3 4 5 67 0
7 5
8 0
8 5
9 0 o-Cresol m-Cresol
p-Cresol
Con
v. (w
t%)
Time on stream (h)

144
Fig. 4.10 Effect of time on stream on conversion over different alkali
loaded catalysts: (a) o-cresol; (b) m-cresol; (c) p-cresol
(Conditions: Temperature = 673K, contact time (h) = 0.38,
methanol / substrate (mole) = 5, N2 = 18ml/min).
1 2 3 4 5 6
20
40
60
80 (a)
Li (1.5)Si Na(1.5)Si K(1.5)Si Cs(1.5)Si
Con
v. (w
t%)
Time on stream (h)
20
40
60
80(b)
Li(1.5)Si Na(1.5)Si K(1.5)Si Cs(1.5)Si
20
40
60
80(c)
Li(1.5)Si Na(1.5)Si K(1.5)Si Cs(1.5)Si

144
Fig. 4.11 Influence of substrate on deactivation rate (deactivation rate =
2(C1 – C6) / 5(C1 + C6), where C1 and C6 are conversions at 1h
and 6h respectively) (Conditions: Temperature = 673K, contact
time (h) = 0.38, methanol / substrate (mole) = 5, N2 = 18 ml/min).
probably steric hindrance from the –Me group at the o-position (to adsorption by
the –OH group; see section 4.3.1.2). It is noticed that though o-cresol is less
reactive over all the catalysts (with different basicities), m- and p-cresols possess
nearly similar reactivities over Na and K catalysts, while p-cresol is more
reactive over the most basic Cs(1.5)SiO2 (at higher temperatures) and least basic
Li(1.5)SiO2. The observations cannot be explained on the basis of adsorption
strengths, catalyst basicity or substrate acidity. Though the exact reasons for the
observed trends in reactivities of m- and p-cresols are nor clear, it is presumed
that the relative reactivities arise from an interplay of steric, electronic and
acidity-basicity effects.
0.03
0.06
0.09
0.12
0.15
0.18
Cs(1.5)SiO2
K(1.5)SiO2Na(1.5)SiO
2Li(1.5)SiO
2
o-Cresol m-Cresol p-Cresol
Dea
ctiv
atio
n ra
te /
h / c
onv.

144
4.3.2.4 Effect of temperature
The reactivities of the three cresols at different temperatures (573K –
673K) over the different catalysts are presented in Fig. 4.13 (a) to (d).
Conversion increases with temperature for all the three cresols over all the
catalysts. Activity increases (as expected) from Li to Cs for all the substrates at
all the temperatures investigated.
4.3.2.5 Effect of contact time
Conversion increases with increase in contact time (studied from 0.188 h
to 0.752 h) for all the three substrates and catalysts. The results obtained over
Cs(1.5)SiO 2 are presented in Fig. 4.14. Again, it is noticed that the reactivity of
p-cresol is more than those of o- and m-cresols at all the contact times
investigated, the reactivity differences being smaller at lowerer contact times.
The influence of contact time in the methylation of cresols over different alkali
metal (Li, Na, K and Cs) loaded catalysts is presented in Fig. 4.15(a), 4.15(b)
and 4.15(c), respectively for o-cresol, m-cresol and p-cresol.
4.3.3 O-Methylation of dihydroxy benzenes
4.3.3.1 Activities of the catalysts
The catalytic activities of different alkali loaded silica samples are presented
in Table 4.6 and Fig. 4.16 (a). Pure SiO 2 has little O-methylation activity; alkali
(Li, Na, K and Cs) loaded silica is catalytically active. For a given molar
loading (1.5 mmol/g) of the alkali ions, activity of the catalysts (in the case of all
the three substrates) is in the order, Cs(1.5)SiO2 > K(1.5)SiO 2 > Na(1.5)SiO2 >
Li(1.5)SiO2. Fig. 4.16 (a) reveals that the activity of the catalysts also increases
with increasing Cs content (basicity).

144
Fig. 4.12 Effect of temperture on conversion over different alkali loaded
catalysts: (a) Li(1.5)SiO2; (b) Na(1.5)SiO2; (c) K(1.5)SiO 2; (d)
Cs(1.5)SiO 2 (Conditions: Time on stream = 1h, contact time (h)
= 0.38, methanol / substrate (mole) = 5, N2 = 18 ml/min).
2.5
5.0
7.5
10.0(a)
Temperature (K)
o-cresol m-cresol p-cresol
Con
v. (w
t%)
2
4
6
8
10
12(b)
o-cresol m-cresol
p-cresol
575 600 625 650 675
20
30
40
(c)
o-cresol m-cresol p-cresol
575 600 625 650 675
20
40
60
80
(d)
o-cresol m-cresol
p-cresol
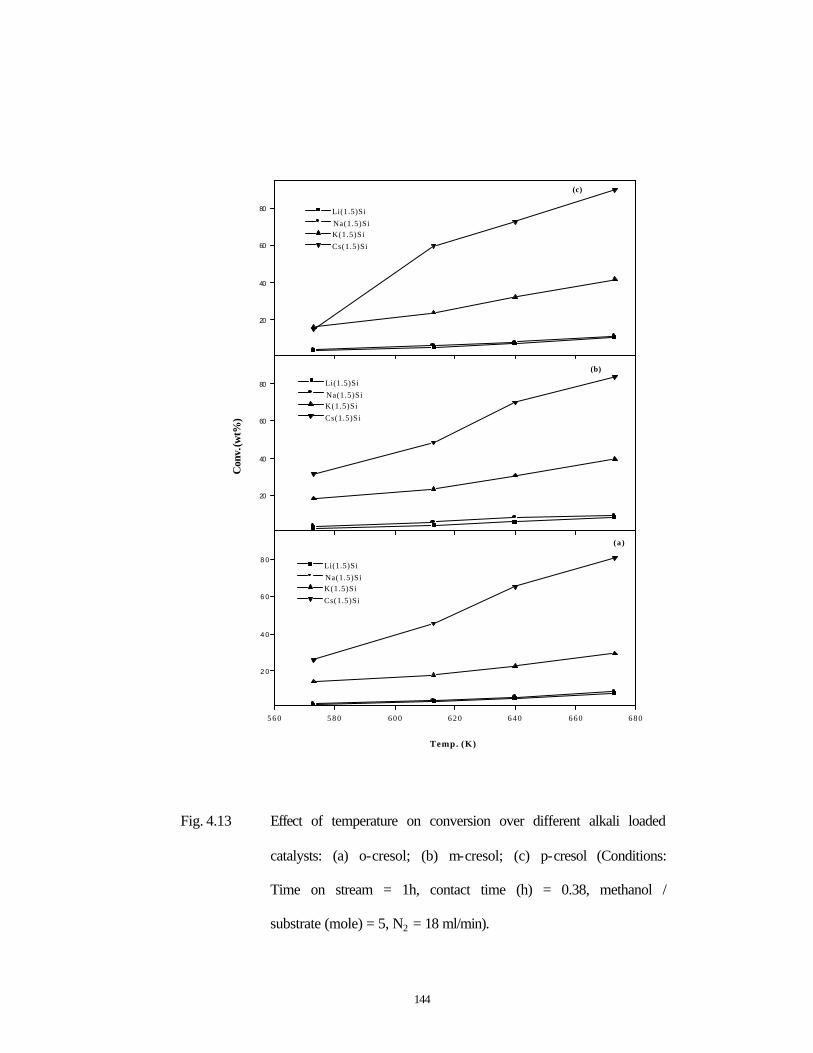
144
Fig. 4.13 Effect of temperature on conversion over different alkali loaded
catalysts: (a) o-cresol; (b) m-cresol; (c) p-cresol (Conditions:
Time on stream = 1h, contact time (h) = 0.38, methanol /
substrate (mole) = 5, N2 = 18 ml/min).
560 580 600 620 640 660 680
2 0
4 0
6 0
8 0
(a)
Li(1.5)Si
Na(1.5)Si K(1.5)Si
Cs(1.5)Si
Con
v. (w
t%)
Temp. (K)
20
40
60
80
(b)
Li(1.5)Si
Na(1.5)Si K(1.5)Si
Cs(1.5)Si
20
40
60
80
(c)
Li(1.5)Si
Na(1.5)Si K(1.5)Si
Cs(1.5)Si

144
Fig. 4.14 Effect of contact time on conversion of cresols over Cs(1.5)SiO2
(Conditions: Temperature = 673K, time on stream = 1h, methanol
/ substrate (mole) = 5, N2 = 18 ml/min).
The relationship between basicity of the catalysts as estimated by TPD of CO2
and FTIR spectroscopy of CO2 and Cs loading are presented in Fig. 4.17 (b) and
(c). The conversions of different substrates over the catalysts are presented in
Fig. 4.17 (d). A similarity of conversion trends is seen with basicity of the
catalysts. There is in general a rapid increase in activity (or basicity) with
increasing Cs content, which then slows down after a Cs loading of about 1.5
mmol / g of catalyst. This trend is also similar to the Cs / Si ratio obtained by
ESCA (electron spectroscopy for chemical analysis) (Fig. 4.17 (a)). This
suggests that coverage of SiO2 surface increases rapidly to saturation (about 1.5
mmole / g) beyond which further coverage is not possible. The trends of
observed basicities and conversions may be explained to be due to attainment of
0.2 0.3 0.4 0.5 0.6 0.7 0.87 0
7 5
8 0
8 5
9 0
9 5
100
o-Cresol m-Cresol p-Cresol
Con
v. (
wt%
)
Contact time (h)

144
Fig. 4.15 Effect of contact time on conversion over different alkali loaded
catalysts: (a) o-cresol; (b) m-cresol; (c) p-cresol (Conditions:
Temperature = 673K, time on stream = 1h, methanol / substrate
(mole) = 5, N2 = 18 ml/min).
0.1 0.2 0.3 0.4 0.5 0.6 0.7 0.8
20
40
60
80(c )
Li(1.5)Si Na(1.5)Si K(1.5)Si Cs(1.5)Si
Con
v. (w
t%)
Contact time (h)
20
40
60
80(b)
Li(1.5)Si Na(1.5)Si K(1.5)Si Cs(1.5)Si
0
20
40
60
80 (a)
Li(1.5)Si Na(1.5)Si K(1.5)Si Cs(1.5)Si

144
saturation surface coverage (which implies a saturation inavailability of Cs sites
for reaction) beyond 1.5 mmol / g.
The influence of duration of run on the conversion of dihydroxy
benzenes and distribution of products is presented in Fig. 4.18. The catalyst
investigated was Cs(1.5)SiO 2. It is observed that the catalyst deactivates with
duration of run in the case of all the substrates. Interestingly, it is noticed that
monomethoxy product formation decreases more with time than the dimethoxy
isomer.
Studies on other alkali loaded catalysts reveal (data not reported) that the
catalysts deactivate to different extents depending on the alkali metal and the
substrate. The results on deactivation observed over the different catalysts and
substrates are summarized in Fig. 4.19 in which the average deactivation rates
(per hour per unit conversion) calculated over a three hour period for different
alkali loaded catalysts for the three dihydroxy benzenes are presented. Catechol
deactivates all the catalysts except Li(1.5)SiO2 more than the other two
compounds and deactivation decreases with increasing basicity of the catalyst
from Li to Cs (Fig. 4.19(a)). The greater deactivation observed for catechol may
be due to its stronger adsorption on the catalyst through the two adjacent -OH
groups. Decrease in deactivation with basicity may also be related to the mode
of adsorption of the compound. Over a more acidic catalyst, the molecule may
adsorb by interaction of its π -electron system, while on a more basic catalyst, it
may adsorb by the -OH group as shown in scheme 1. Increasing the basicity of
the catalyst by increasing Cs loading causes a decrease in deactivation rate for
catechol and resorcinol (Fig. 4.19(b)).


144
Table 4.6 Activities of different catalysts in the methylation of dihydroxy benzenes.
Catalysta Catechol Resorcinol Hydroquinone
Conv. (wt%)
Sel.b (wt%)
Sel.c (wt%)
Conv. (wt%)
Sel.d (wt%)
Sel.e (wt%)
Conv. (wt%)
Sel.f (wt%)
Sel.g (wt%)
SiO2 3.5 - - 4.2 - - 4.8 - -
Li(1.5)SiO2 5.2 75.1 15.7 30.9 36.9 44.3 27.1 59.1 14.0
Na(1.5)SiO 2 10.3 71.3 22.5 45.3 33.8 52.1 44.2 47.7 31.0
K(1.5)SiO2 17.3 63.3 31.5 65.7 22.6 64.7 49.1 45.8 41.0
Cs(0.075) SiO2 21.8 60.0 40.0 68.5 24.3 75.7 54.1 45.0 55.0
Cs(0.375) SiO2 30.2 55.5 44.1 77.2 20.2 79.8 67.6 38.4 61.6
Cs(0.75) SiO2 43.3 51.0 49.0 82.1 16.9 83.1 71.2 32.8 67.2
Cs(1.5) SiO2 57.2 47.0 53.0 87.4 10.7 89.3 87.9 24.8 75.2
Cs(2.25) SiO2 67.6 44.3 55.7 95.5 7.2 92.8 96.7 22.3 77.7
a The number in brackets denotes the mmole/g of alkali metal loaded on SiO2. b 2-methoxy phenol, c 1,2-dimethoxy
benzene, d 3-methoxy phenol, e 1,3-dimethoxy benzene, f 4-methoxy phenol, g 1,4-dimethoxy benzene. Conditions:
Temperature = 673K, time on stream = 1h, Contact time (h) = 0.376, N2 = 18 ml/min.

144
Fig. 4.16 (a) Influence of Cs content of catalyst on conversions of
dihydroxy benzenes; (b) Influence of Cs content on dimethoxy /
monomethoxy ratios and (c) Relationship between conversion
and Di/Mono ratios (Conditions: Temperature = 673K; time on
stream (TOS) = 1h; contact time (h) = 0.376; N2 = 18 ml/min;
methanol / substrate (mole) = 5).
0.0 0.5 1.0 1.5 2.0 2.50
20
40
60
80
100
Di /
Mon
o
Cs loading (mmole/g of SiO2)
(a)
Catechol
Resorcinol Hydroquinone
Con
v. (
%)
Cs loading (mmole/g of SiO2)
0.0 0.5 1.0 1.5 2.0 2.50
5
10
( b )
Catechol Resorcinol Hydroquinone
20 40 60 80 1000
2
4
6
8
10
12
14
(c)
Di /
Mon
o
Conv. (wt%)
Catechol
Resorcinol Hydroquinone

144
Fig. 4.17 Inter relationship between Cs at the surface, basicity, catalytic
activity and Cs loading: (a) results from ESCA; (b) basicity from
TPD of CO2; (c) basicity from FTIR; (d) conversions of various
substrates (Conditions: Temperature = 673K, contact time (h) =
0.38, time on stream = 1h, methanol / substrate (mole) = 5).
0.0 0.5 1.0 1.5 2.0 2.50.00
0.02
0.04
0.06
0.08
(a)
Cs loading (mmole / g)Cs loading (mmole / g)
Cs
/ Si (
rela
tive
)
Cs loading (mmole / g )
0.0 0.5 1.0 1.5 2.0 2.5
0.03
0.04
0.05
0.06
0.07
0.08
0.09(b)
0.0 0.5 1.0 1.5 2.0 2.50
50
100
150
200
250
300(c)
0.0 0.5 1.0 1.5 2.0 2.5
20
40
60
80
100(d)
Rel
ativ
e in
tens
ity
of F
TIR
spe
ctra
Bas
icity
(m
mol
e /
g)
Con
v. (w
t%)
Cs loading (mmole / g)
Phenol o-Cresol m-Cresol p-Cresol Catechol Resorcinol Hydroquinone

144
Fig. 4.18 Effect of time on stream on conversions of dihydroxy benzenes
and product distribution over Cs(1.5)SiO2: (a) catechol; (b)
resorcinol; (c) hydroquinone ( Conditions: Contact time (h) =
0.376; temperature = 673K; methanol / substrate (mole) = 5; N2
= 18 ml / min).
0.0 0.5 1.0 1.5 2.0 2.50
20
40
60
80
100
Di /
Mon
o
Cs loading (mmole/g of SiO2)
(a)
Catechol Resorcinol Hydroquinone
Con
v. (
%)
Cs loading (mmole/g of SiO2)
0.0 0.5 1.0 1.5 2.0 2.50
5
10
(b)
Catechol Resorcinol Hydroquinone
20 40 60 80 1000
2
4
6
8
10
12
14
(c)
Di /
Mon
o
Conv. (wt%)
Catechol Resorcinol Hydroquinone

144
However, the deactivation rate goes through a maximum in the case of
hydroquinone. The reasons for this behaviour of hydroquinone are not clear.
4.3.3.2 Reactivities of the dihydroxy benzenes
If we examine the relative activities of the three dihydroxy compounds,
catechol, resorcinol and hydroquinone, we find that their reactivity increases in
the order catechol < hydroquinone < resorcinol. The reason for this reactivity
trend is probably the difference in the acidities of the three compounds and
ease of formation of the likely surface intermediate (shown below) on the
catalyst.
The reactivity trend exactly matches the acidity of the three dihydroxy
compounds (catechol < hydroquinone < resorcinol) and electron density trends
at the o-, m- and p- positions of phenol. The +M effect of the -OH group
trends to cause a lower electron density at the m-position in the case of
resorcinol and favours the formation of [HO-C6H4-Oδ-] adsorbed species
(Scheme above). On the other hand, in the case of catechol and hydroquinone,
the higher electron densities at the o- and p- positions will destabilize the above
transition state. Besides, steric effects may also be responsible for the lower
reactivity of catechol.
OH
O
HH OCH3
Cs O Cs
+
-+-δ
δ
δδ

144
Selectivity for O-methylation (sum of mono and di methoxy products) also
increases in the same order: catechol < hydroquinone < resorcinol. A decrease
in monomethoxy products is noticed with increasing basicity in the case of all
the three substrates due to increase in dimethoxy product formation (Table
4.6). This is due to faster conversion of the mono methoxy phenols compared
to the dihydroxy compounds with increasing catalyst basicity.
Examining the dimethoxy / monomethoxy product (Di / Mono) ratios of
the three substrates over different Cs-SiO2 catalysts (Fig 4.16(b)), one finds
that the increase with basicity is small for catechol and HQ while it is large for
resorcinol. When Di/Mono ratios are plotted vs. conversion (Fig. 4.16(c)), it is
noticed that in the case of HQ and catechol, the increase is slow (both falling
on a nearly common curve) while it is very rapid for resorcinol. This suggests
a much greater reactivity of m-methoxy phenol than the o- and p-methoxy
isomers. The greater reactivity of the monomethoxy phenols than the
dihydroxy compounds is probably due to differences in the electronic effects of
the -OCH3 and -OH groups.
4.3.3.3 Effect of temperature
The reactivities of the three substrates over Cs(1.5)SiO2 at different
temperatures (573K - 673K) are presented in Fig. 4.20(a). Conversion
increases with temperature for all the substrates. Both mono and di O-
methylated products increase with temperature. For catechol, the increase is
less compared to resorcinol and hydroquinone. The influence of temperature
in the methylation of HQ over different alkali loaded catalysts is presented in
Fig. 4.21(a) and 4.21(b). Though activity (as expected) increases from Li to Cs,
the activity of the Cs catalyst is much larger than those of the other catalysts.

144
Fig. 4.19 Influence of substrate on catalyst deactivation rate: (a) over
different alkali loaded catalysts; (b) Various Cs-loaded catalysts
(Conditions: Temperature = 673K, contact time (h) = 0.38,
methanol / substrate (mole) = 5, N2 = 18 ml/min; deactivation
rate = 2(C1 – C3) / 2(C1 + C3), where C1 and C3 are conversions at
1h and 3h respectively).
0.0 0.5 1.0 1.5 2.0 2.5
0.10
0.15
0.20
0.25
0.30(b)
Catechol Resorcinol Hydroquinone
Dea
ctiv
atio
n ra
te /
h /c
onv
Cs loading (mmole / g of SiO2)
0.10
0.15
0.20
0.25
0.30
0.35(a)
Dea
ctiv
atio
n ra
te /
h /c
onv
CsKNaLi
Catechol Resorcinol Hydroquinone

144
Small amount of the dehydroxylated products, phenol and anisole were also
formed over Li(1.5)SiO2, Na(1.5)SiO 2 and K(1.5)SiO2 at higher temperatures.
The Di/Mono ratios observed at different temperatures for the three substrates
and the different catalysts are presented in Fig. 4.20 (b) and 4.21 (b). It is
noticed that the Di/Mono ratios also increase with temperature suggesting more
rapid conversions of the monomethoxy product at higher temperatures. The
Di/Mono ratios are much larger for resorcinol than for the other two substrates
(Fig. 4.20 (b)). Similarly, the ratios are much larger over the Cs catalyst than
over the other three catalysts (Fig. 4.21 (b)).
4.3.3.4 Effect of contact time
Conversion increases with increase in contact time (studied from 0.188 h to
0.752 h at 673K) for all the substrates (Fig. 4.22(a)). Though the reactivities
of resorcinol and HQ are similar, the reactivity of catechol is much lower.
Conversions of all the three compounds increase with increase in contact time.
Examining the influence of contact time on Di/Mono ratio (Fig. 4.22(b)), it is
seen that the ratio is larger and increases more rapidly with contact time for
resorcinol than for the other two. The influence of contact time on conversion
of HQ and Di/Mono ratios over the different alkali loaded catalysts is
presented in Fig. 4.23 (a) and Fig. 4.23 (b), respectively. As already reported,
the Cs catalyst is much more active than the other three catalysts at all the
contact times investigated. Similarly, the Di/Mono ratio also increases more
rapidly over the Cs catalysts than over the others. Though both Fig. 4.22 and
Fig. 4.23 reveal an increase in conversion with contact time, the increase is
more rapid in the lower contact time region (< 0.36 h) than at higher contact
times.

171
Fig. 4.20 Effect of temperature on conversion of dihydroxy benzenes and
dimethoxy benzene / monomethoxy phenol ratios: (a) Conversion;
(b) Dimethoxy / monomethoxy (Di / Mono) ratios (Conditions: TOS
= 1h; contact time (h) = 0.376; N2 = 18 ml/min; methanol / substrate
(mole) = 5).
560 580 600 620 640 660 68020
40
60
80
100
Con
v. (w
t%)
(a)
Catechol Resorcinol Hydroquinone
Temperature (K)
560 580 600 620 640 660 6800
2
4
6
8(b)
Temperature (K)
Di /
Mon
o Catechol Resorcinol Hydroquinone

172
Fig. 4.21 Effect of temperature on conversion of hydroquinone over different
alkali silica catalysts and dimethoxy benzene / monomethoxy phenol
ratios: (a) Conversion; (b) Dimethoxy / monomethoxy (Di / Mono)
ratios (Conditions: TOS = 1h; contact time (h) = 0.376; methanol /
hydroquinone (mole) = 5; N2 = 18 ml / min).
560 580 600 620 640 660 6800
20
40
60
80
100
(a)
Li(1.5)SiO2 Na(1.5)SiO2 K(1.5)SiO2 Cs(1.5)SiO2
Con
vers
ion
(wt%
)
Temperature (K)
560 580 600 620 640 660 6800.0
0.5
1.0
1.5
2.0
2.5
3.0 (b)
Di /
Mon
o
Temperature (K)
Li(1.5)SiO2 Na(1.5)SiO2 K(1.5)SiO2 Cs(1.5)SiO2

173
The influence of contact time on the distribution of mono and dialkylated
products for the three substrates over Cs(1.5)SiO2 is presented in Fig. 4.24. At the
conditions of the study, the yield of the dialkylated product is more than the
monoalkylated product due to high conversions in the case of resorcinol and HQ.
A crossover of the curves for the di and mono substituted
products is seen for catechol. However, in all the cases, concentration maxima for
the intermediate monoalkylated product (expected for consecutive reactions) is not
observed. This is mainly due to the second methylation step being faster than the
first one (k2 > k1 in the sequence of reactions shown below) and the maximum
being reached at lower contact times (lower conversions) than those used in this
study.
4.3.4 O-Methylation of p-methoxy phenol
4.3.4.1 Reactivity of p-methoxy phenol (PMP)
The relative activities of alkali loaded SiO2 in the methylation of PMP and
hydroquinone (HQ) with methanol are presented in Table 4.7. As expected,
activity for methylation of both PMP and HQ increases with increasing basicity of
the catalyst. Similarly, O-methylation selectivity also increases with catalyst
basicity for both substrates. Byproduct (C-alkylates) formation is found to be
more in the case of HQ than PMP for Li, Na and K loaded catalysts. The
selectivity is nearly 100% for both substrates over Cs-SiO2.
Dihydroxy benzenes (k1)
Monomethyl phenols(k2)
Dimethoxy benzenes.

174
Fig. 4.22 Effect of contact time on conversion of dihydroxy benzenes and
dimethoxy benzene / monomethoxy phenol ratios over Cs(1.5)SiO 2:
(a) Conversions of dihydroxy benzenes; (b) Dimethoxy /
monomethoxy (Di / Mono) ratios (Conditions: TOS = 1h;
temperature = 673K; N2 = 18 ml/min; methanol / substrate (mole) =
5).
0.1 0.2 0.3 0.4 0.5 0.6 0.7 0.80
20
40
60
80
100
(a)
Catechol Resorcinol Hydroquinone
Con
v. (w
t%)
Contact time (h)
0.2 0.4 0.6 0.80
2
4
6
8
10
(b)
Di /
Mon
o
Contact time (h)
catechol Resorcinol Hydroquinone

175
Fig. 4.23 Effect of contact time on conversion of hydroquinone and dimethoxy
benzene / monomethoxy phenol ratios over alkali loaded silica: (a)
Conversion; (b) Dimethoxy / monomethoxy (Di / Mono) ratios
(Conditions: TOS = 1h; temperature = 673K; methanol /
hydroquinone (mole) = 5; N2 = 18 ml / min).
0.2 0.4 0.6 0.80
20
40
60
80
100(a)
Cs(1.5)SiO2, Li(1.5)SiO2 Na(1.5)SiO2, K(1.5)SiO2
Con
v. (w
t%)
Contact time (h)
0.2 0.4 0.6 0.80.0
0.5
1.0
1.5
2.0
2.5
3.0
Di /
Mon
o
Contact time (h)
(b)
Li(1.5)SiO2 Na(1.5)SiO2 K(1.5)SiO2 Cs(1.5)SiO2

176
Fig. 4.24 Effect of contact time on conversion and product distribution over
Cs(1.5)SiO 2: (a) catechol; (b) resorcinol; (c) hydroquinone (
Conditions: TOS = 1h; temperature = 673K; methanol / substrate
(mole) = 5; N2 = 18 ml / min).
0.1 0.2 0.3 0.4 0.5 0.6 0.7 0.820
30
40
50
60 (a)
Conv. Mono Di
Wt%
Contact time (h)
20
40
60
80
(b)
Conv. Mono Di
30
45
60
75
90 (c )
Conv. Mono Di

177
Comparing the reactivities of the two substrates, it is noticed that PMP is
more reactive than HQ over all the catalysts, the reactivity difference decreasing
with catalyst basicity. The relative reactivities of the catalysts for the two
substrates (Conv. of PMP / Conv. of HQ) is 1.8, 1.4, 1.5 and 1.1 for Li, Na, K and
Cs-loaded catalysts. The reason for the greater reactivity of PMP compared to HQ
may be due to differences in the electronic effects of the substituent groups in the
two molecules and also their modes of adsorption on the catalyst surface. It is
expected that -OCH3 group in the p-position will destabilize the adsorbed phenoxy
intermediate (shown in section 4.3.3.2. on methylation of dihydroxy benzenes) to
a lesser extent than an -OH group.
4.3.4.2 Influence of time on stream
The influence of time on stream on the conversion of PMP and HQ over different
alkali loaded catalysts is presented in Fig. 4. 25. It is seen that catalyst activity is
relatively more stable with PMP than with HQ as the feed. This is so inspite of the
higher conversions obtained for PMP than for HQ. The values of average
deactivation rates (per h per unit conversion) are presented in Table 4. 7 for both
HQ and PMP. It is seen that the deactivation rates are lower for PMP over all the
catalysts. Also, the differences in deactivation rates between the different
catalysts are also smaller in the case of PMP.
4.3.4.3 Influence of process parameters
The influence of temperature on conversion of PMP over different alkali
loaded SiO2 samples is presented in Fig. 4. 26. For comparison, the data obtained
using HQ are also presented. It is seen that PMP is more reactive

178
Fig. 4.25 Influence of time on stream on conversion of p-methoxy phenol over
different alkali loaded SiO2 catalysts (data of HQ also shown for
comparison) (Conditions: Temperature = 598K, contact time (h) =
0.38, methanol / p-methoxy phenol or hydroquinone (mole) = 5, N 2
= 18 ml/min).
Fig. 4.26 Influence of temperature on conversion of p-methoxy phenol over
different alkali loaded SiO2 catalysts (data of HQ also shown for
comparison) (Conditions: Time on stream = 1h, contact time (h) =
0.38, methanol / p-methoxy phenol or hydroquinone (mole) = 5, N2 =
18 ml/min).
560 580 600 620 640 660 6800
20
40
60
80
100
-------- PMP ........ HQ
Li(1.5)SiO2
Na(1.5)SiO2 K(1.5)SiO2 Cs(1.5)SiO2
Con
v. (
%)
Temperature (K)
1 2 3 4 5 6
0
1 0
2 0
3 0
4 0
-------- PMP ........ HQ
Li(1.5)SiO2, Na(1.5)SiO2 K(1.5)SiO2, Cs(1.5)SiO2
Con
v. (
%)
Time on stream (h)

179
Fig. 4.27 Influence of contact time on the conversion of p-methoxy phenol
over different alkali loaded SiO2 catalysts (data of HQ also shown
for comparison) (Conditions: Temperature = 598K, time on stream =
1h, methanol / p-methoxy phenol (mole) = 5, N2 = 18 ml/min).
than HQ over all the catalysts at all the temperatures studied. As already seen, the
more basic catalyst (Cs-SiO2) is also the most active one at all the temperatures for
the conversion of PMP (and HQ).
The influence of contact time on conversion of PMP over different alkali loaded
catalysts is presented in Fig. 4. 27. As already found in the case of the other
substrates (and as expected) conversion increases with increase in contact
time. The results obtained with HQ are also plotted in the same figure.
Interestingly, compared to HQ, the influence of contact time on conversion of
PMP is significant even at contact times > 0.4 h, whereas it is small in the case of
HQ. This trend is noticed for all the four catalysts investigated
0.1 0.2 0.3 0.4 0.5 0.6 0.7 0.8
10
20
30
40
50
-------- PMP ........ HQ
Li(1.5)SiO2, Na(1.5)SiO2
K(1.5)SiO2, Cs(1.5)SiO2Con
v. (%
)
Contact time (h)

180
Table 4.7. Activities of the catalysts in methylation of p-methoxy phenol (PMP) and hydroquinone (HQ)
Conv. (wt%)b Selectivity (O-methylation)c Deactivation rate (% conv loss h-1.conv-1) Catalysta
PMP HQ DMB PMP + DMB PMP HQ
SiO2 4.5 4.9 5.3 - - -
Li(1.5)SiO2 49.7 27.1 100 86.2 0.259 0.285
Na(1.5)SiO 2 63.8 44.1 100 91.9 0.156 0.175
K(1.5)SiO 2 75.8 49.1 100 94.9 0.102 0.135
Cs(1.5)SiO 2 96.4 87.9 100 100 .083 0.095
a: The number in brackets denotes the wt% of Cs loaded on SiO2;b: Conversion based on p-methoxy phenol or hydroquinone;
c: Selectivity difined as (mole O-methylated product / mole all the products) x 100 (Conditions: temperature = 673K; time on stream =
1h; contact time (h) = 0.376h; N2 flow = 18 ml/min). PMP = p-Methoxy phenol; HQ = Hydroquinone; DMB = p-Dimethoxy benzene.

181
4.3.5 O-Methylation of 2-naphthol
4.3.5.1 Comparison of catalysts
The catalytic activities of silica samples loaded with different alkali metals
and MCM-41 with different amount of Cs in the O-methylation of 2-naphthol at
673K are presented in Table 4. 8. The different products formed in the reaction are
presented in Scheme 2. SiO2 and MCM-41 have low activities, both of them
producing mainly the C-alkylated products. 2-Methoxynaphthalene was not
detected over these catalysts. The introduction of alkali ions increases dramatically
the activity and O-alkylation selectivity of the catalysts. Conversion and selectivity
(for O-methylation) increase with metal loading and basicity of the alkali metal
(Cs> K> Na >Li; Table 4.8). As Cs/SiO 2 was found to be the most active catalyst,
more experiments were carried out at different Cs-loadings. A general trend of
increasing activity with increasing Cs loading is noticed. The yield of the C-
methylated products, 1-methyl-2-hydroxynaphthalene (II) and 1-methyl-2-
methoxynaphthalene (III) decrease with increasing basicity of the alkali ion (Li >
Na > K > Cs; Table 4.8). Though the yield of II decreases rapidly and is not at all
present in the product from Cs/SiO2 (Table 4.8), the yield of III decreases only
marginally and is formed even over the Cs catalyst. Usually C-alkylation is believed
to be catalyzed by acidic sites. The formation of this compound (III) even over the
most basic catalyst (Cs/SiO2) is a result of the 1-
position being highly activated by the substituent in the 2-position. 1-Methyl-2-
methoxynaphthalene (III) can be formed from 1-methyl-2-hydroxynaphthalene (II)
or from 2-methoxynaphthalene (I). The absence of II in the products from Cs

182
catalysts suggests that III is probably formed mainly from I over Cs catalysts. This
is supported by contact time studies over Cs(1.5)SiO2 (Table 4.8) which reveal an
increase in III with increasing contact time, due to further reaction of compound I;
concomitantly, the yield of I decreases with contact time. In the case of the other
alkali loaded catalysts, 1-methyl-2-hydroxynaphthalene (II) is present in substantial
amount due to C-alkylation of 2-naphthol over these catalysts.
4.3.5.2 Influence of time on stream (TOS)
The influence of duration of run (time on stream, TOS) on conversion and
product distribution in the case of Cs-loaded MCM-41 is presented in Fig. 28(a). It is
seen that all the catalysts deactivate with time, a conversion loss of ~20% occurring in
about 4h (98.9% at 1h and 76.1% at 4h) for Cs(0.225)-MCM-41. The yield of 2-
methoxy naphthalene also decreases from 95.7% to 71.5% during the above period
(Fig. 4.28(b)). The yield of the C-alkylated product is slightly larger, being 3.2% at
OH
OMe
CH3
OH
CH3
OMe
2-NaphtholII; 1-Methyl-2-hydroxy naphthalene
I; 2-Methoxy naphthlene
III; 1-Methyl-2-methoxy naphthalene
Scheme 2. Products of methylation of 2-hydroxynaphthalene (2-naphthol)

183
1h and 4.6% at 4h, suggesting a preferential deactivation of the O-alkylation activity.
The results for alkali (Li, Na, K and Cs) loaded catalysts are presented in Fig. 4.29(a).
It is noticed (again) that Cs-SiO2 is much more active than the other catalysts. The
influence of Cs content on activity of Cs-SiO2 is presented in Fig. 4.29(b). Though
there is an increase
Table 4.8. Activities of alkali loaded catalysts in the methylation of 2-naphthol
Yield of products (wt%) Catalysta Conv.
(wt%) 2-methoxy-
naphthalene
(I)
1-Methyl-2-
methoxy-
naphthalene
(III)
1-methyl-2-
hydroxy-
naphthalene
(II)
Others
SiO2 9.2 - - 6.7 2.5
Li(1.5)SiO2 45.2 23.9 8.5 12.8 -
Na(1.5)SiO 2 53.0 38.6 9.2 5.2 -
K(1.5)SiO 2 57.1 41.7 9.9 5.5 -
Cs(1.5)SiO 2 100 89.1 10.9 - -
MCM-41 4.7 -- - 3.8 0.9
Cs(0.075) MCM-41
88.3 70.9 13 4.4 -
Cs(0.15) MCM-41
95.7 87.8 8.9 - -
Cs(0.225) MCM-41
98.9 95.7 3.2 - -
a The number in brackets denotes the mmole of alkali metal loaded on 1 g of SiO2
and MCM-41. Conditions: Temperature = 673K, Time on stream = 1h, methanol /
2-naphthol (mole) = 1:10, contact time (h) = 0.43, N2 = 45 ml/min.

184
Fig. 4.28 Effect of time on stream on: (a) conversion and (b) product yields
from 2-naphthol methylation over Cs(0.225)MCM-41 (Conditions:
Temperature = 673K, contact time (h) = 0.43, methanol / 2-naphthol
(mole) = 10, N2 = 45 ml/min).
1 2 3 4
70
80
90
100 (a)
Time on stream (h)
Wt%
Cs(0.075)MCM-41 Cs(0.15)MCM-41 Cs(0.225)MCM-41
Con
v. (
wt%
)
Time on stream (h)
1 2 3 40
20
40
60
80
100(b)
Conv. (%) 2-Methoxy naphthalene
1-Methyl-2-methoxy naphthalene

185
Fig. 4.29 Influence of time on stream on conversion over different catalysts:
(a) alkali loaded SiO2 and (b) Cs-SiO2 with different Cs contents
(Conditions: Temperature = 673K, contact time (h) = 0.43, methanol
/ 2-naphthol (mole) = 10, N2 = 45 ml/min).
1.0 1.5 2.0 2.5 3.0 3.5 4.0
40
60
80
100 (a)
Li(1.5)SiO2 Na(1.5)SiO2 K(1.5)Sio2 Cs(1.5)SiO2
Con
v. (w
t%)
Time on stream (h)
1.0 1.5 2.0 2.5 3.0 3.5 4.070
75
80
85
90
95
100(b)
Con
v. (w
t%)
Time on stream (h)
Cs(0.075)SiO2 Cs(0.375)SiO2 Cs(0.75)SiO2 Cs(1.5)SiO2 Cs(2.25)SiO2

186
in conversion with Cs content, the effect becomes small at higher Cs loading. A
similar trend is also seen in the case of Cs-MCM-41 samples (Fig. 4.28(a)).
4.3.5.3 Influence of temperature
The influence of temperature on conversion is presented in Fig. 4.30(a) and
Fig. 4.31(a), respectively for Cs loaded MCM-41 and alkali (Li, Na, K and Cs)
loaded silica. The influence of Cs content on activity at different temperatures is
presented in Fig. 4.31(b). Fumed silica and MCM-41 possess negligible activity
under the reaction conditions (Table 4.8). The influence of temperature on activity
and product yields is presented in Fig. 4.30(b) in the case of Cs(0.225)-MCM-41.
Along with increasing conversion, C-alkylation activity also increases slowly as
seen from the yields of compound III, (1-methyl-2-methoxy naphthalene).
4.3.5.4 Influence of contact time
Conversion increases with increase in contact time (studied from 0.22 h to
0.88 h at 673K) for all the catalysts. Again as already noted, an increase in contact
time favors C-alkylation (Fig. 4. 32 and Fig. 4. 33). Over Cs-SiO2 catalysts 1-
methyl-2-hydroxy naphthalene formation was not observed at all the contact times
investigated. But for other alkali (Li, Na and K) loaded silica catalysts and Cs-
loaded MCM-41 the formation of C-alkylated product, 1-methyl-2-hydroxy
naphthalene increases slowly with contact time. For all the catalysts, the increase in
conversion is more at lower contact times than at higher contact times. In the case
of Cs-loaded MCM-41, a small amount of 6-methyl-2-hydroxy naphthalene was
found at large contact times (data not presented).

187
Fig. 4.30 Effect of temperature on: (a) conversion; (b) product yields from 2-
naphthol methylation over Cs(0.225)MCM-41 (Conditions: Time on
stream = 1h, contact time (h) = 0.43, methanol / 2-naphthol (mole) =
10, N2 = 45 ml/min).
560 580 600 620 640 660 680
40
60
80
100 (a)
Temperature (h)
Cs(0.075)MCM-41 Cs(0.15)MCM-41 Cs(0.225)MCM-41
Con
v. (w
t%)
Temperature (K)
560 580 600 620 640 660 6800
20
40
60
80
100 (b)
Wt%
Conv. (%) 2-Methoxy naphthalene 1-Methyl-2-methoxy naphthalene

188
Fig. 4.31 Influence of temperature on conversion over different catalysts (a)
alkali loaded SiO2 and (b) Cs-SiO2 with different Cs contents
(Conditions: Time on stream = 1h, contact time (h) = 0.43, methanol
/ 2-naphthol (mole) = 10, N2 = 45 ml/min).
560 580 600 620 640 660 6800
20
40
60
80
100(a)
Li(1.5)SiO2 Na(1.5)SiO2 K(1.5)SiO2 Cs(1.5)SiO2
Temperature (K)
5 6 0 5 8 0 6 0 0 6 2 0 6 4 0 6 6 0 6 8 020
40
60
80
100(b)
Con
v. (w
t%)
Temperature (K)
Con
v. (w
t%)
Cs(0.075)SiO2 Cs(0.375)SiO2 Cs(0.75)SiO2 Cs(1.5)SiO2 Cs(2.25)SiO2

189
Fig. 4.32 Effect of contact time on (a) conversion and (b) product yields from
2-naphthol methylation over Cs(0.225)MCM-41 (Conditions: Time
on stream = 1h, temperature = 673K, methanol / 2-naphthol (mole) =
10, N2 = 45 ml/min).
0.2 0.4 0.6 0.8 1.080
85
90
95
100(a)
Contact time (h)
Wt%
Cs(0.075)MCM-41 Cs(0.15)MCM-41
Cs(0.225)MCM-41
Con
v. (w
t%)
Contact time (h)
0.2 0.4 0.6 0.8 1.0
0
20
40
60
80
100(b)
Conv. (%)
2-Metoxy naphthalene 1-Methyl-2-methoxy naphthalene 1-Methyl-2-hydroxy naphthalene

190
Fig. 4.33 Influence of contact time on conversion over different catalysts (a)
alkali loaded SiO2 and (b) Cs-SiO2 with different Cs contents
(Conditions: Temperature = 673K, time on stream = 1h, methanol /
2-naphthol (mole) = 10, N2 = 45 ml/min).
0.2 0.4 0.6 0.8 1.0
45
60
75
90
(a)
Li(1.5)SiO2 Na(1.5)Sio2 K(1.5)SiO2 Cs(1.5)SiO2
Con
v. (w
t%)
Contact time (h)
0.2 0.4 0.6 0.8 1.084
87
90
93
96
99(b)
Con
v. (w
t%)
Contact time (h)
Cs(0.075)SiO2 Cs(0.375)SiO2 Cs(0.75)SiO2 Cs(1.5)SiO2 Cs(2.25)SiO2

191
The mechanism of the reaction probably is similar to that already discussed.
It involves the formation of a transient 2-naphtholate species on the basic O2- sites
on the surface of alkali metal-loaded silica and Cs-loaded MCM-41and its reaction
with (CH3)δ+(OH)δ- species adsorbed on the adjacent alkali ions as shown below.
When the activation of the phenolic groups is relatively less (as in the case of the
less basic catalysts), C-alkylation of the ring can also occur producing 1-methyl-2-
hydroxynaphthalene.
4.4 CONCLUSIONS
The study reveals that alkali supported SiO2 samples are good catalysts for
the alkylation of phenol with methanol, ethanol, n-propanol and n-butanol in the
vapour phase. The most active catalyst is Cs-SiO2. Methanol is more active
compared to the other three alcohols in the O-alkylation of phenol. At lower
temperatures, deactivation is less and decreases with increasing basicity of the
catalyst. Deactivation is less when the methanol to phenol mole ratio is small.
Deactivation rate (calculated on the basis of unit conversion) decreases with
increase in basicity of the catalyst and with the size of the alcohol.
It is found that alkali loaded fumed silica samples are also excellent catalysts
for the o-aklylation of cresols and dihydroxybenzenes in the vapour phase. High
δ
δ-δ
δ-
+
+CH3O
CsCs O
HO
H

192
conversions and high O-alkylation selectivities are obtained over these catalysts.
The most active and selective catalyst is Cs-SiO2 with about 1.5 mmole of Cs / g of
catalyst. The order of reactivity of the cresols is p-cresol > m-cresol > o-cresol.
The catalyst deactivation rate is in the reverse order: o-cresol > m-cresol > p-cresol.
Resorcinol is more reactive than the other two dihydroxy benzenes. The
trend in reactivities of the dihydroxy benzenes can be explained if a [HO-C6H4-Oδ-]
adsorbed intermediate is postulated to be formed on the catalyst surface. Catalyst
deactivation is more for catechol than for resorcinol and hydroquinone and
decreases with increasing basicity of the catalyst. Similarities in basicity (as
measured by TPD of CO2 and FTIR) and activity trends are seen for the different
catalysts. In the case of Cs-SiO2 catalysts, basicity and activity are found to be
related to the Cs available at the surface (as estimated by ESCA).
The mono methoxy phenols appear to be more reactive than the dihydroxy
benzenes. Studies using p-methoxy phenol reveal that it causes less catalyst
deactivation than hydroquinone.
The studies also reveal that Cs supported SiO2 and MCM-41 are good
catalysts for the O-alkylation of 2-naphthol in the vapour phase. Nearly 95% yield
of 2-methoxynaphthalene is obtained. The small amount of 1-methyl-2-methoxy
naphthalene formed over Cs-catalysts is a result of the further alkylation of 2-
methoxynaphthalene.

193
4.4 REFERENCES
1. R. A. Sheldon, Chem. & Ind., 6th Jan. 1997, p13.
2. T. Yashima, K. Sato, T. Hayasaka, and N. Hara, J. Catal. 26, 303 (1972).
3. M. Onaka, K. Ishikawa and Y. Izumi, Chem. Lett. 1783 (1982).
4. A. Corma, V. Fornes, R.M. Martin-Aranda, H. Garcia and Primo, J. Appl.
Catal. 59, 237 (1990).
5. P.E. Hathaway and M.E. Davis, J. Catal. 116, 263 (1989).
6. P.E. Hathaway and M.E. Davis, J. Catal. 119, 497 (1989).
7. H. Tsuji, F. Yagi and H. Hattori, Chem. Lett. 1881 (1991).
8. J.C. Kim, H.-X. Li, C.-Y. Chen, and M.E. Davis, Microporous Mater. 2,
412 (1994).
9. D. Barthomeuf, Catal. Rev. Sci. Eng. 38, 521 (1996).
10. H. Hattori, Chem. Rev. 95, 537 (1995).
11. Y. Ono and T. Baba, Catal. Today 38, 32 (1997).
12. K.R. Kloetstra, M. Van Laven and H. Van Bakkum, J. Chem. Soc.
Faraday Trans 93, 1211 (1997).
13. E.J. Doskocil, S.V. Bordawekar and R.J. Davis, J. Catal. 169, 327 (1997).
14. R. Pierantozzi and F. Nordquist, Appl. Catal. 21, 263 (1986).
15. M. Renaud, P.D. Chantal and S. Kaliaguine, Can. Chem. Eng. 64, 787
(1986).
16. V. Durgakumari and S. Narayanan, Catal. Lett. 5, 377 (1990).
17. V.V. Rao, V. Durgakumari and S. Narayanan, Appl. Catal. 49, 165
(1989).

194
18. V.V. Rao, K.V.R. Chary, V. Durgakumari and S. Narayanan, Appl. Catal.
61, 89 (1990).
19. P. Tundo, F. Trotta, G. Molaglio and F. Ligorati, Ind. Eng. Chem. Res. 27,
1565 (1988).
20. C. Bezouhanova and M.A. Al-Zihari, Appl. Catal. 83, 45 (1992).
21. E. Santacesaria, D. Grasso, D. Gelosa, and S. Carra, Appl. Catal. 64, 83
(1990).
22. J. Xu, Ai-zhan Yan and Qin-Hua Xu, Reac. Kinet.. Catal. Lett. 62 (1), 71
(1997).
23. M.C. Samolada, E. Grigoriadou, Z. Kiparissides and I.A. Salos, J. Catal.
152, 52 (1995).
24. S. Balsama, P. Beltrame, P.L. Beltrame, P. Carniti, L. Forni and G.
Zuretti, Appl. Catal. 13, 161 (1984).
25. P.D. Chantal, S. Kaliaguine and J.L. Grandmaison, Appl. Catal. 10, 317
(1984).
26. P. D. Chantal, S. Kaliaguine and J.L. Grandmaison, Appl. Catal. 18, 133
(1985).
27. M. Renaud, P.D. Chantal and S. Kaliaguine, Can. J. Chem. Eng. 64, 787
(1986).
28. V. Durgakumari, S. Narayanan and L. Guczi, Catal. Lett. 5, 377 (1990).
29. Zi - Hua Fu and Y. Ono, Catal. Lett. 21, 43 (1993).
30. M.C. Samolada, E. Grigoriadou, Z. Kiparissides and I.A. Vasalos, J.
Catal. 152, 52 (1995).

195
31. J. Xu, A.Z. Yan and Q. H. Xu, Reac. Kinet. Catal. Lett. 62(1), 71 (1997).
32. T. Beutel, J. Chem. Soc., Faraday Trans. 94(7), 985 (1998).
33. F. M. Bautista, J. M. Campelo, A. Garcia, D. Luna, J.M. Marinas and
A.A. Romeo, Reac. Kine. Catal. Lett. 63(2), 261 (1998).
34. S.C. Lee, S.W. Lee, K.S. Kim, T.J. Lee, D.H. Kim, J.C. Kim, Catal.
Today 44, 253 (1998).
35. G. Dorothea in: E. Barbara, H. Stephen, S. Gail (Eds) Phenol Derivatives,
Ulmann's Encyclopedia of Industrial Chemistry, A19, VCH Verlagsgere
Mschaft, Weiteim, 354 (1991).
36. Y. Fu, T. Baba and Y. Ono, Appl. Catal. A: Gen. 166, 419 (1998).
37. Y. Fu, T. Baba and Y. Ono, Appl. Catal. A: Gen. 166, 425 (1998).
38. Y. Fu, T. Baba and Y. Ono, Appl. Catal. A: Gen. 176, 201 (1999).

196
CHAPTECHAPTER R -- V V
NN--ALKYLATIONALKYLATION

197
N-ALKYLATION OF ANILINE WITH METHANOL
AND DIMETHYL CARBONATE
5. 1 INTRODUCTION
N-alkylation of aniline is an industrially important reaction due to the fact
that alkylanilines form the basic raw materials for the manufacture of many
organic chemicals, dyes, explosives, herbicides, and pharmaceuticals [1].
Vapour phase aniline alkylation over environmentally safe solid catalysts is a
superior method than the conventional commercial routes to the production
alkylanilines using mineral acids and MeOH [2]. Several types of catalysts
based on oxides and supported oxides [3-11], zeolites [12-24] and microporous
aluminophosphates [24-26] have been tested for vapour phase aniline
methylation. The main factors influencing activity and selectivity (N- and/or C-
alkylation) are acid-base properties (number and strength) and shape selectivity
in the solid acid catalyst as well as reaction conditions (temperature, feed
composition and rate). Rao et al. [24] reported the alkylation of aniline with
methanol over AlPO4-5 molecular sieve. They observed that in aniline
methylation N-methylaniline appears to be favoured at low temperatures (less
than 598K). This is subsequently converted to N,N-dimethylaniline (NNDMA),
which itself isomerises to N-methyl toluidine. Campelo et al. [27-29] reported
the N-alkylation of aniline with methanol over CrPO4 and CrPO4-AlPO4. They
found > 90 mole % selectivity for N-alkylated products in 573-673 K
temperature range. Varying the feed rates indicated that low contact time and

198
low temperature promoted the N-mono methylation reaction. Moreover, N,N-
dimethyltoluidines (p- > o-) were present only in very small quantities even at
the highest temperatures and/or contact times. On the other hand, the addition of
AlPO4 to CrPO4 did not cause any significant change in the selectivity pattern
exhibited by the CrPO4 catalyst. This behaviour could indicate that similar
adsorbed active species are formed on CrPO4 and CrPO4-AlPO4 catalysts.
Furthermore, there is no simple relationship between aniline alkylation activity
and surface acidity measured by pyridine and 2,6-dimethylpyridine adsorption at
573 - 673K. Bautista et al. [28-29] also reported that N-alkylated products (NMA
and NNDMA) are formed by a stepwise first order reaction process.
Ono et al. [30,31] reported the alkylation of aniline with methanol and
dimethyl carbonate (DMC) over zeolites X and Y. They showed that faujasite
(X and Y) is a better catalyst than ZSM-5, KL and Na-mordenite with regard to
activity and selectivity. In particular, at the experimental conditions used (453
K), KY is a very good catalyst giving up to 99.6% conversion with 93.5% N-
methylaniline (NMA) selectivity, the other products being N,N-dimethyl aniline
(NNDMA). In N-methylation, DMC is a better methylating agent than
methanol.
Selva et al. [32] reported the monomethylation of primary amines by DMC
over X and Y type zeolites. According to them the unusual mono N-alkyl
selectivity observed is likely to be due to synergistic effects between the double
reactivity of DMC (acting both as a methylating and as a reversible methoxy
carboxylating agent) and the dual acid base properties of zeolites along with the

199
steric demand by their cavities. Besides, the high selectivity, which allows high
purity mono NMA to be prepared, the reaction also has remarkable
environmentally benign features: it uses non toxic DMC, no inorganic wastes are
produced (except CO2) and no solvent is required.
The N-alkylation of aniline with MeOH and DMC over different Cs loaded
molecular sieves is presented in this chapter. The reaction is shown below
5.2 EXPERIMENTAL
5.2.1 Materials and catalyst
Aniline, methanol and dimethyl carbonate (> 99% purity) were obtained
from S.D. Fine-chem Ltd., India. The catalysts used in the studies were
CsX(OH), CsL, Cs(0.225)MCM-41, Cs-silicalite and Cs-ferrierite (preparation
details given in Chapter II).
5.2.2 Reaction procedure
The catalytic experiments were carried out in a vertical downflow glass
reactor (15mm i.d.). The catalyst (2g) was used in the form of granules (10-22
mesh) prepared by pelleting of the powders and crushing into the desire size. The
reactor was placed inside a temperature controlled furnace (Geomecanique,
NH2
CH3OH (CH3)2CO3
Cs-X, Cs-L, Cs-MCM-41, Cs-Silicalite-1, Cs-Ferrierite
NHCH3 N(CH3)2
+

200
France) with a thermocouple placed at the center of the catalyst bed for
measuring the reaction temperature. The catalyst was activated in flowing air
(20 ml. min-1) at 773K for 3h prior to flushing in N2 and adjustment of
temperature for start of the experiment. The feed (mixture of the methanol or
DMC and aniline) was passed using a syringe pump (Braun, Germany) along
with N2 gas (18ml / min). The product was cooled in a water-cooled (ice-cold)
condenser, collected in a receiver and analyzed in a gas chromatograph
(HP5880A; capillary column HP1, 50m X 0.2mm; FID detector). Product
identification was done by GC-MS and GC-IR.
5.3 RESULTS AND DISCUSSION
5.3.1 N-Alkylation with methanol
5.3.1.1 Activities of the catalysts
The activities of the catalysts in the alkylation of aniline with MeOH are
presented in Table 5.1. Catalyst activity increases in the order: Cs-ferrierite <
Cs-silicalite < Cs-MCM-41 < Cs-L < Cs-X. The selectivities for N-methylation,
N-methyl aniline (NMA) and N,N-dimethyl aniline (NNDMA) also follow the
same order. The N-methylation selectivity increases with the basicity of the
catalyst. Over MCM-41, ferrierite and silicalite-1, some C-alkylated products, o-
toluidine, p-toluidine and N,N-dimethyl toluidine were also found.
The following observations can be made in connection with the above
results. 1) The Cs contents of the catalysts are different, being ∼ 30% in CsX, ∼

201
20% in CsL and only ∼ 3% in the other three catalysts. 2) The experimentally
observed basicity (by FTIR of adsorbed CO2) is found to be related to the Cs
content (Table 5.1). For catalysts with the same Cs content (Cs-MCM-41, Cs-
silicalite and Cs-ferrierite), basicity decreases with decrease in pore size (or
surface area). The basicity decrease with decreasing surface area / pore size is
probably due to the poor dispersion of the alkali metal oxides. 3) The larger
conversions, observed over the CsX and CsL are due to larger Cs content and
basicity. The lowest activity of the Cs-ferrierite sample is due to lower Cs
content and smaller pore dimensions, which may cause greater diffusion
resistance for the reactants and products. 4) The lower basicity of Cs-MCM-41,
Cs-ferrierite and Cs-silicalite (and the presence of weak acidity) is responsible
for the formation of C-alkylated products over these catalysts. A surprising
result is the absence of shape-selectivity effects over Cs-silicalite and Cs-
ferrierite, which possess narrow pores (about 5.5Å for silicalite and 4.2 x 5.4 Å
for ferrierite); the NMA / NNDMA ratios observed over these zeolites are 5.1
and 4.1 compared to 5.6 over Cs-MCM-41 and 6 over CsX. One would have
expected the ratio to be larger over Cs-silicalite and Cs-ferrierite.
5.3.1.2 Effect of time on stream
The influence of time on stream (TOS) on the conversion of aniline is
presented in Fig. 5.1(a). The product distribution over CsX is presented in Fig.
5.1(b). It is observed that all the catalysts deactivate slowly with TOS and N-
methyl aniline (NMA) formation decreases, while N,N-dimethyl aniline
(NNDMA) formation increases with TOS. The yields of the C-alkylated

202
products also decrease with time (not shown in figure). The NMA / NNDMA
ratio decreases with time on stream over all the catalysts (Fig.5.2). The decrease
in the ratios with time is not surprising as the reactivity of NMA is more than
that of aniline. The average deactivation rates calculated over a six hour period
are presented in Fig.5.3. The deactivation rate is defined as the average
deactivation per hour between the first and sixth hours divided by the average
conversion during this period. Deactivation rate increases in the order CsX <
CsL < Cs-MCM-41< Cs-silicalite-1 < Cs-ferrierite. The rate of deactivation is
very large for the medium pore zeolites, the deactivation rate being more for
ferrierite with a unidimentional 10 membered ring pore system than for silicalite
with a 2-dimentional 10 membered pore system.
5.3.1.3 Effect of temperature
The activities of the different catalysts on conversion of aniline at different
temperatures (498-573K) are presented in Fig. 5.4(a). The product distribution
over CsX at different temperatures is presented in Fig. 5.4(b). Conversion
increases and yields of N-methyl and N,N-dimethyl aniline increase with
temperature. In the case of the less basic catalysts, Cs-MCM-41, Cs-silicalite
and Cs-ferrierite, C-alkylation products also increase with temperature (not
presented). The NMA / NNDMA ratio decreases with increase in temperature
(Fig. 5.5).

203
5.1. Activities of the catalyst in aniline methylation with methanol
Yield (wt%) Catalyst Relative
basicitya (FTIR)
Conv.
(wt%) NMA NNDMA Others
NMA /
NNDMA
CsX 182 69.3 59.4 9.9 - 6
CsL 130 63.8 51.5 11.3 - 4.6
Cs-MCM-41 83 48.9 33.1 5.9 9.9 5.6
Cs-silicalite-1 64 38.0 20.3 4.0 13.7 5.1
Cs-ferrierite 49 25.0 11.7 2.8 9.3 4.1
a: The relative basicities of the catalysts are the relative intensities of the bands of
adsorbed CO2 (at 0.4 mm) in the region 1200 cm-1 to 1750 cm-1 (Chapter II).
NMA = N-methyl aniline, NNDMA = N,N-dimethyl aniline, Others = o-Toluidine
+ p-Toluidine + N,N-dimethyl-p-toluidine (Conditions: Temperature = 548K,
time on stream = 1h, contact time (h) = 0.58, methanol / aniline (mole) = 5, N2 =
18 ml/min).
5.3.1.4 Effect of contact time
Conversion increases with increase in contact time for all the catalysts (Fig.
5.6(a)). The yield of NNDMA increases and that of NMA decreases with contact
time (Fig. 5.6(b)). The NMA / NNDMA ratios decrease with increase in contact
time (Fig. 5.7).
5.3.1.5 Effect of methanol / aniline mole ratios
Conversion increases for all the catalysts with increase in methanol / aniline
mole ratio (Fig. 5.8(a)). The product distributions obtained at different MeOH /
aniline feed ratios over CsX is presented in Fig. 5.8(b). With the increase in

204
Fig. 5.1 Influence of time on stream on methylation of aniline with methanol
(a) conversion over different catalysts; (b) product yields over CsX
(Conditions: Temperature = 548K, contact time (h) = 0.58, methanol
/ aniline (mole) = 5, N2 = 18 ml/min).
1 2 3 4 5 6
20
30
40
50
60
70(a)
Wt%
Time on stream (h)
CsX, CsL C s-MCM-41 Cs-Silicalite-1
Cs-Ferrierite
Con
v. (w
t%)
Time on stream (h)
0 1 2 3 4 5 6 7
12
24
36
48
60
(b)
Conv. (wt%) N-methyl aniline N ,N-dimethyl aniline

205
Fig. 5.2 Influence of time on stream on NMA/NNDMA product ratios over
different catalysts (Conditions: Temperature = 548K, contact time
(h) = 0.58, methanol / aniline (mole) = 5, N2 = 18 ml/min).
Fig. 5.3 Deactivation rate for various catalysts in aniline methylation with
methanol (Conditions: Temperature = 548K, contact time (h) = 0.58,
methanol / aniline (mole) = 5, N2 = 18 ml/min, deactivation rate / h =
2(C1 – C6) / 5(C1 + C6), where C1 and C6 are conversions at 1h and
6h respectively.
1 2 3 4 5 6
3.0
3.5
4.0
4.5
5.0
5.5
6.0 Cs-X
Cs-L Cs-MCM-41 Cs-Silicalite-1 Cs-Ferrierite
NM
A /
NN
DM
A
Time on stream (h)
1 .5
2 .0
2 .5
3 .0
3 .5
4 .0
4 .5
Cs-ferrieriteCs-silicaliteCsMCM-41CsLCsX
Dea
ctiv
atio
n ra
te /
h / c
onv.
x 1
0-2

206
methanol content of the feed, the selectivity for NMA decreases and that for
NNDMA increases. The NMA / NNDMA ratio decreases rapidly with increase
in MeOH / aniline (mole) ratio (Fig. 5.9)).
5.3.1.6 Reaction pathway
A plot of product yields against conversions of aniline over CsX is presented
in Fig. 5.10. The plot for NMA is extrapolatable to origin suggesting that it is
the primary product. The zero slopes at the origin and the upward deviation of
the NNDMA plot with conversion suggest NNDMA to be a secondary product
formed from NMA.
From the data on feed rate, temperature and the yield vs. conversion
curves, it can be concluded that aniline methylation on various Cs-loaded
zeolites follows a sequential reaction pathway. NMA is the primary product,
which is subsequently converted to NNDMA. The driving force here is the
greater nucleophilicity of the N-atom over the C-atom. Besides, NMA reacts
faster than aniline due to its greater negative charge on the N-atom associated
with the electron donating effect the methyl group. Moreover, dimethyl
substitution on N-atoms makes ring alkylation at o- and p- position easy through
electron donation to the benzene ring. This leads to increasing amounts of C-
alkylated products with increasing NNDMA content. The formation of NNDMA
via disproportionation of NMA is less favourable than its formation via
successive alkylation [24].

207
Fig. 5.4 Influence of temperature: (a) aniline conversion; (b) product yields
over CsX (Conditions: Time on stream = 1h, contact time (h) = 0.58,
methanol / aniline (mole) = 5, N2 = 18 ml/min).
0 2 4 6 8 10
24
36
48
60
72
84(a)
Wt%
Methanol / Aniline (mole)
CsX, CsL Cs-MCM-41 Cs-Silicalite-1 Cs-Ferrierite
Con
v. (w
t%)
Methanol / Aniline (mole)
0 2 4 6 8 100
20
40
60
80(b)
Conv. (wt%) N-methyl aniline N,N-dimethyl aniline

208
F
ig. 5.5 Influence of temperature on NMA / NNDMA product ratios
(Conditions: Time on stream = 1h, contact time (h) = 0.58, methanol
/ aniline (mole) = 5, N2 = 18 ml/min).
5.3.2 N-Alkylation with dimethyl carbonate
5.3.2.1 Activities of the catalysts
The activities of the catalysts are presented in the Table 5.2. The activity
increases in the order: Cs-ferrierite < Cs-silicalite < Cs-MCM-41 < Cs-L < Cs-
X. The selectivities for N-alklation, N-methyl aniline (NMA) and N,N-dimethyl
aniline (NNDMA) follow the same order. The N-methylation selectivity
increases with the basicity of the catalyst. Over Cs-MCM-41, Cs-ferrierite and
500 520 540 560 5802
4
6
8
10 Cs-X Cs-L Cs-MCM-41 Cs-Silicalite-1 Cs-Ferrierite
NM
A /
NN
DM
A
Temperature (K)

209
Fig. 5.6 Influence of contact time: (a) aniline conversion over different
catalysts; (b) product yields over CsX (Conditions: Time on stream =
1h, temperature = 548K, methanol / aniline (mole) = 5, N2 = 18
ml/min).
0.2 0.4 0.6 0.8 1.0 1.20
20
40
60
(a)
Wt%
Contact time (h)
CsX, CsL Cs-MCM-41 Cs-Silicalite-1 Cs-Ferrierite
Con
v. (w
t%)
Contact time (h)
0.2 0.4 0.6 0.8 1.0 1.20
20
40
60
(b)
Conv. (wt%) N-methyl aniline N,N-demethyl aniline

210
Fig. 5.7 Influence of contact time on NMA / NNDMA product ratios over
different catalysts (Conditions: Temperature = 548K, time on stream
= 1h, methanol / aniline (mole) = 5, N2 = 18 ml/min).
Cs-silicalite-1 some C-alkylated products o-toluidine, p-toluidine and methyl
phenyl carbamate, N-methyl-N-phenyl carbamate are also found.
In general, the conclusions are similar to those made in the case of
methylation with MeOH (Table 5.1; section 5.3.1.1). It is to be noticed that
eventhough MeOH / aniline ratio was 5 in the earlier experiments (Table 5.1)
and the DMC / aniline ratio is 2.5 in the present experiments, the amount of
effective alkylating agent used in both sets of experiments is the same as DMC
contains two equivalents of MeOH (2 MeOH + CO2 → Me2CO3 + H2O).
Comparing the alkylations with DMC and MeOH (Table 5.1 and 5.2), it is
noticed that DMC is a more effective alkylating agent than MeOH as the
conversions are larger with DMC compared to MeOH. This is probably due to
0.2 0.4 0.6 0.8 1.0 1.2 1.4
2
4
6
8
10
12
14
Cs-X
Cs-L Cs -MCM-41
Cs-Silicalite-1
Cs-Ferrierite
NM
A /
NN
DM
A
Contact time (h)

211
Fig. 5.8 Influence of methanol / aniline molar ratios of feed: (a) aniline
conversion over different catalysts; (b) product yields over CsX
(Conditions: Time on stream = 1h, temperature = 548K, contact time
(h) = 0.58, N2 = 18 ml/min).
0 2 4 6 8 10
24
36
48
60
72
84(a)
Wt%
Methanol / Aniline (mole)
CsX, CsL
Cs-MCM-41 Cs-Silicalite-1
Cs-Ferrierite
Con
v. (w
t%)
Methanol / Aniline (mole)
0 2 4 6 8 100
20
40
60
80(b)
Conv. (wt%) N-methyl ani l ine
N,N-dimethyl ani l ine

212
Fig. 5.9 Influence of methanol / aniline mole ratios on NMA / NNDMA
product ratios (Conditions: Temperature = 548K, contact time (h) =
0.58, time on stream = 1h, N2 = 18 ml/min).
Fig. 5.10 Product yield vs. conversion curves in aniline conversion with
methanol over CsX at different temperatures (Conditions: Time on
stream = 1h, methanol / aniline (mole) = 5, N2 = 18 ml/min).
0 15 30 45 60 75 900
13
26
39
52
65 NNDMA NMA
Yie
ld (
wt%
)
Conv. (wt%)
0 2 4 6 8 102
4
6
8
10
Methanol / Aniline
Cs-X Cs-L
Cs-MCM-41 Cs-Silicalite-1
Cs-Ferrierite
NM
A /
NN
DM
A

213
the absence of H2O and the suppression of the reverse hydrolysis reaction that could
occur when MeOH is used. Besides, it is likely that CO2 (formed when DMC is
used) is less damaging to the catalyst than water (formed when MeOH is used).
Another observation is that NMA / NNDMA ratios are smaller when DMC is used
than when MeOH is used. The NMA / NNDMA values for the different catalysts
are in the range 1.5 to 2.5 when DMC is used while it is in the range 4.1 to 6 when
MeOH is used. Thus, DMC is a better methylating agent than MeOH. The larger
amounts of NNDMA formed with DMC may also be due to simultaneous
dimethylation of aniline with DMC though there is no direct proof for its
occurrence.
5.3.2.2 Effect of time on stream
The influence of time on stream (TOS) on the conversion of aniline is
presented in Fig. 5.11(a). The product distribution over CsX is presented in Fig.
5.11(b). It is observed that all the catalysts deactivate with TOS and N-methyl
aniline (NMA) formation decreases while N,N-dimethyl aniline (NNDMA)
formation increases. The NMA / NNDMA ratio decreases with time on stream over
all the catalysts and is presented in Fig. 5.12. The average deactivation rates
calculated over a six hour period are presented in Fig. 5.13. Deactivation rate
increases in the order CsX < CsL < Cs-MCM-41< Cs-silicalite-1 < Cs-ferrierite.
These observations are similar to those made in the case of MeOH (Section
5.3.1.2.). Comparing the deactivation rates in the presence of MeOH and DMC
(Fig. 5.3 and Fig. 5.13), it is noticed that the deactivation rate with DMC is nearly

214
half of that observed in the case of MeOH. The lower deactivation rate with DMC
is probably due to the absence of water which might act as poison. Besides, in the
case of MeOH, it might undergo dehydrogenation and condensation reactions on the
surface leading to carbonaceous products. The formation of these products is less
likely when DMC is used.
Table 5.2. Activities of different catalysts in aniline methylation with dimethyl
carbonate
Yield (wt%) Catalyst Conv. (wt%)
NMA NNDMA Others
NMA /
NNDMA
CsX 79.5 53.7 25.8 - 2.1
CsL 67.5 40.6 26.9 - 1.5
Cs-MCM-41 53.9 29.9 17.1 6.9 1.8
Cs-silicalite-1 47.5 20.7 12.5 14.3 2.3
Cs-ferrierite 30.1 12.2 5.9 12.0 2.5
NMA = N-methyl aniline, NNDMA = N,N-dimethyl aniline, Others = o-Toluidine
+ p-Toluidine + methyl phenylcarbamate + N-methyl-N-phenylcarbamate.
(Conditions: Temperature = 548K, time on stream = 1h, contact time (h) = 0.58,
dimethyl carbonate / aniline (mole) = 2.5, N2 = 18 ml/min)

215
Fig. 5.11 Influence of time on stream: (a) aniline conversion over different
catalysts; (b) product yields over CsX (Conditions: Temperature =
548K, contact time (h) = 0.58, DMC / aniline (mole) = 2.5, N2 = 18
ml/min).
1 2 3 4 5 6
30
40
50
60
70
80(a)
Wt %
Time on stream (h)
CsX, CsL Cs-MCM-41, Cs-Silicalite-1 Cs-Ferrierite
Con
v. (w
t%)
Time on stream (h)
1 2 3 4 5 6
30
40
50
60
70
80(b)
Conv. (wt%) N-methyl anilie N,N-dimethyl aniline

216
Fig. 5.12 Influence of time on stream on the NMA / NNDMA product ratios
(Conditions: Temperature = 548K, contact time (h) = 0.58, DMC /
aniline (mole) = 2.5, N2 = 18 ml/min).
Fig. 5.13 Deactivation rate for various catalysts in aniline methylation with
DMC (Conditions: Temperature = 548K, contact time (h) = 0.58,
DMC / aniline (mole)= 2.5, N2 = 18 ml/min).
0.8
1.0
1.2
1.4
1.6
1.8
2.0
2.2
Cs-ferrieriteCs-silicaliteCs-MCM-41CsLCsX
Dea
ctiv
atio
n ra
te /
h / c
onv.
x 1
0-2 )
1 2 3 4 5 6
1.4
1.6
1.8
2.0
Cs-X, Cs-L
Cs-MCM-41
Cs-Silicalite-1
Cs-Ferrierite
NM
A /
NN
DM
A
Time on stream (h)

217
5.3.2.3 Effect of temperature
The reactivities of aniline at different temperatures (498-573K) are
presented in Fig. 5.14(a). Conversion increases with temperature. The product
distribution over CsX at different temperatures is shown in Fig. 5.14(b). The
yields of both NMA and NNDMA increase with temperature, the increase in yield
of NNDMA being more rapid.
Due to the more rapid increase in NNDMA yield, the NMA / NNDMA ratio
decreases with increase in temperature (Fig. 5.15).
5.3.2.4 Effect of contact time
Conversion increases with increase in contact time for all the catalysts. The
conversion of aniline observed at different contact times over different catalysts is
plotted in 5.16(a). The product distribution obtained over CsX at different contact
times is shown in Fig. 5.16(b). With increase in contact time, the selectivity for
NMA decreases and that for NNDMA increases; the NMA / NNDMA ratios
decrease (Fig. 5.17).
5.3.2.5 Effect of DMC / aniline mole ratios
The conversions at different DMC / aniline mole ratios are presented in Fig.
5.18(a). The product distributions over CsX are also given in Fig. 5.18(b). With
the increase in DMC / aniline mole ratios the conversion increases for all the
catalysts. With the increase in DMC / aniline mole ratio the selectivity for NMA
decreases and the selectivity for NNDMA increases (Fig. 5.19). The NMA /
NNDMA ratio is plotted as a function of DMC / aniline (mole ratio) in Fig. 5.19.
The ratio decreases steeply with increasing DMC content.

218
Fig. 5.14 Influence of temperature: (a) aniline conversion over different
catalysts; (b) product yields over CsX (Conditions: Time on stream =
1h, DMC / aniline (mole) = 2.5, contact time (h) = 0.58, N2 = 18
ml/min).
500 520 540 560 580
20
40
60
80
(a)
Wt
%
Temperature (K)
CsX, CsL Cs-MCM-41 Cs-Silicalite-1 Cs-Ferrierite
Con
v. (w
t%)
Temperature (K)
500 520 540 560 580
2 0
4 0
6 0
8 0
(b) Conv. (wt%) N-methyl aniline N,N-dimethyl aniline

219
Fig. 5.15 Influence of temperature on NMA / NNDMA product ratios
(Conditions: Time on stream = 1h, contact time (h) = 0.58, DMC /
aniline = 2.5, N2 = 18 ml/min).
5.3.2.6 Reaction pathway
From the data on feed rate, temperature and feed composition it can be
concluded that aniline methylation with DMC on various Cs-loaded zeolites also
follows a sequential reaction pathway as already pointed out in the case of MeOH.
NMA is formed first, which is further converted to NNDMA, which then,
undergoes C-methylation to give toluidines.
500 520 540 560 580
1.5
2.0
2.5
3.0
3.5
4.0
4.5
Cs-X Cs-L Cs-MCM-41 Cs-Silicalite-1 Cs-Ferrierite
NM
A /
NN
DM
A
Temperature (K)

220
Fig. 5.16 Influence of contact time: (a) aniline conversion over different
catalysts; (b) product yields over CsX(OH) (Conditions: Time on
stream = 1h, temperature = 548K, DMC / aniline (mole) = 2.5, N2 =
18 ml/min).
0.2 0.4 0.6 0.8 1.0 1.220
30
40
50
60
70
80 (a)
Wt
%
Contact time (h)
CsX, CsL Cs-MCM-41
Cs-Silicalite-1
Cs-Ferrierite
Con
v. (w
t%)
Contact time (h)
0.2 0.4 0.6 0.8 1.0 1.2
20
40
60
80 (b)
Conv. (wt%) N-methyl aniline N,N-dimethyl aniline

221
Fig. 5.17 Influence of contact time on NMA / NNDMA product ratios
(Conditions: Temperature = 548K, time on stream = 1h, DMC /
aniline (mole) = 2.5, N2 = 18 ml/min).
5.4 CONCLUSIONS
CsX, CsL and Cs-MCM-41, Cs-silicalite, Cs-ferrierite are good catalysts for
N-methylation of aniline with methanol and dimethyl carbonate as the methylating
agents. Over CsX and CsL, only N-alkylation takes place producing N-methyl
aniline and N,N-dimethyl aniline. Over Cs-MCM-41, Cs-silicalite and Cs-ferrierite
small amounts of C-alkylated products are also formed. Dimethyl carbonate is a
better methylating agent compared to methanol. Conversions are higher and NMA /
NNDMA ratios are lower when DMC is used as the alkylating agent instead of
MeOH.
0.2 0.4 0.6 0.8 1.0 1.2 1.4
1
2
3
4
5
Cs-X Cs-L Cs-MCM-41 Cs-Silicalite-1 Cs-Ferrierite
NM
A /
NN
DM
A
Contact Time (h)

222
Fig. 5.18 Influence of DMC / aniline molar ratios of feed: (a) = aniline
conversions over different catalysts; (b) product yields over CsX
(Conditions: Time on stream = 1h, temperature = 548K, contact time
= 0.58, N2 = 18 ml/min).
0 1 2 3 4 5
24
36
48
60
72
84 (a)
Wt
%
DMC / Aniline (mole)
CsX, CsL Cs-MCM-41
Cs-Silicalite-1
Cs-Ferrierite
Con
v. (
wt%
)
DMC / Aniline (mole)
0 1 2 3 4 50
20
40
60
80(b)
Conv. (wt%) N-methyl ani l ine N,N-dimethyl anil ine

223
Fig. 5.19 Influence of DMC / aniline mole ratios on the NMA / NNDMA
product ratios (Conditions: Temperature = 548K, contact time (h) =
0.58, time on stream = 1h, N2 18 ml/min).
5.5 REFERENCES
1. Kirk-Othmer, in “Encyclopodia of Chemical Technology”, Wiley, New
York, 3rd edn. 2, 309 (1978).
2. A. K. Bhattacharya and D.K. Nandi, Ind. Eng. Chem. Prod. Res. Dev. 14,
162 (1975).
3. A.G. Hill, J.H. Shipp and A.J. Hill, Ind. Eng. Chem. 43, 1579 (1951).
4. T. H. Evans and A.N.Bourns, Can. J. Tech. 29, 1 (1951).
5. J.M. Parera, A. Gonzalez and A. Barral, Ind. Eng. Chem. Prod. Res. Dev. 7,
259 (1968).
6. C. M. Naccache and Y.B. Taarit, J. Catal. 22, 171 (1971).
0 1 2 3 4 5
1
2
3
4
5
6
Cs-X Cs-L Cs-MCM-41 Cs-Silicalite-1 Cs-Ferrierite
NM
A /
NN
DM
A
DMC / Aniline (mole)

224
7. N. Takamiya, Y. Koinuma, K. Ando and S. Murai, Nippon Kagaku Kaishi,
1452 (1979).
8. N. Kakamiya, H. Yamabe, K. Ando and S. Murai, Nippon Kagaku Kaishi,
1316 (1980).
9. L.K. Doraiswamy, G.R.V. Krishnan and S.P. Mukherjee, Chem. Eng. 88,
78 (1981).
10. H. Matsuhashi and K. Arata, Bull. Chem. Soc. Jp. 64, 2605 (1991).
11. A. N. Ko, C. L. Yang, W. Zhu and H. Lin, Appl. Catal. A: Gen. 134, 53
(1996).
12. M. Onaka, K. Ishikawa and Y. Izumi, Chem. Lett. 1783 (1982).
13. O. Mokoto, I. Koji and I. Yusuke, J. Inclusion Phenom. 2, 359 (1984).
14. G.O. Chivadze and L.Z. Chkheidze, Iz. Akad. Nauk. Gruz. SSR, Ser. Khim.
10, 232 (1984).
15. P.Y. Chen, M.C. Chen, H.Y. Chu, N.S. Chang and T.K. Chuang, in “New
Developments in Zeolite Science and Technology” (Y. Murakami, A.
Iijima and J.W. Ward, Eds.), p. 739, Elsevier, Amsterdam.
16. K.G. Ione and O.V. Kikhtyanin, in “Zeolites: Facts, Figure, Fiture” (P.A.
Jacobs and R.A. van Santen, Eds.), p. 1073, Elsevier, Amsterdam, 1989.
17. S.I. Woo, J.K. Lee, S.B. Hong, Y.K. Park and Y.S. Hu, in “Zeolites: Facts,
Figure, Fiture” (P.A. Jacobs and R.A. van Santen, Eds.), p. 1095, Elsevier,
Amsterdam, 1989.
18. P.Y. Chem, S.J. Chu, N.S. Chuang and T.K. Chuang, in “Zeolites: Facts,
Figure, Fiture” (P.A. Jacobs and R.A. van Santen, Eds.), p. 1105, Elsevier,
Amsterdam, 1989.

225
Amsterdam, 1989.
19. O.V. Kikhtyanin, K.G. Ione, L.V. Malysheva and A.V. Toktarev, in “
Chemistry of Microcrystals” (T. Inui, S. Namba and T. Tatsumi, Eds.), p.
319, Elsvier, Amsterdam, 1991.
20. Y.K. Park, K.Y. Park and S. I. Woo. Catal. Lett. 26, 169 (1994).
21. B.L.Su and D. Barthomeuf, Appl. Catal. A: Gen. 124, 73 (1995).
22. B.L.Su and D. Barthomeuf, Appl. Catal. A: Gen. 124, 81 (1995).
23. P.R.H.P. Rao, P. Massiani and D. Barthomeuf, in “Zeolite Science 1994:
Recent Progress and Discussions (H.G. Karge and J. Weitkamp, Eds.), p.
287, Elsvier, Amsterdam, 1985.
24. P.S. Sing, R. Bandyopadhyay and B.S. Rao, Appl. Catal. A 136, 177(1996).
25. S. Prasad and B.S. Rao, J. Mol. Catal. 62, L17 (1990).
26. S.M. Yang and T.W. Pan, J. Chin. Chem. Soc. 42, 935 (1995).
27. F. M. Bautista, J. M. Campelo, A. Garcia, D. Luna, J. M. Marina, A.A.
Romero and M.R. Urbano, J. Catal. 172, 103 (1997).
28. F. M. Bautista, J. M. Campelo, A. Garcia, D. Luna, J. M. Marina and A.A.
Romero, Appl. Catal. A: Gen. 166, 39 (1998).
29. F. M. Bautista, J. M. Campelo, A. Garcia, D. Luna, J.M. Marinas and A.A.
Romero, Stud. Surf. Sci. Catal. 108,123 (1997).
30. Z.H. Fu and Y. Ono, Catal. Lett. 18, 59 (1993).
31. Z.H. Fu and Y. Ono, Catal. Lett. 22, 277 (1993).
32. M. Selva, A. Bomben and P. Tuldo, J. Chem. Soc., Perkin. Trans. 1, 1041
(1999).

226
CHAPTER CHAPTER -- VI VI
SUMMARY AND SUMMARY AND CONCLUSIONSCONCLUSIONS

227
The thesis is a study of C-, O- and N- alkylation reactions over a number of
solid basic catalysts. The basic catalysts investigated are various alkali metal (Li,
Na, K and Cs) exchanged X and L zeolites, Cs2O impregnated MCM-41, silicalite-1
and ferrierite and various alkali metal (Li, Na, K and Cs) oxides deposited on fumed
SiO2. The reactions investigated are the side chain (C-) alkylation of toluene and
ethylbenzene (over alkali exchanged X), O-alkylation of phenol, cresols, dihydroxy
benzenes, p-methoxy phenol and 2-naphthol (over alkali loaded SiO2 and Cs loaded
MCM-41) and the N-alkylation of aniline (over Cs exchanged X and L, and Cs2O
deposited MCM-41, silicalite-1 and ferrierite).
The various zeolites have been prepared by hydrothermal methods, calcined
and ion-exchanged with the desired metal ions using chlorides, acetates and
hydroxides. The loading of Cs2O on SiO2, MCM-41 and the medium pore
silicalites was carried out by simple impregnation methods using salt solutions. The
zeolites and molecular sieves were characterized by XRD for structural purity and
intergrity. All the catalysts have been characterized by surface area and pore
volume measurements. Surface area loss is noticed in the case of all the catalysts
when alkali metal ions are loaded either by ion exchange or impregnation methods.
The surface area loss (especially in alkali loaded SiO2) increases with metal loading
and basicity of the alkali metal. When the areas are calculated on pure SiO2 basis
(excluding the deposited oxides), they are reasonably similar (155 ± 10 m2 / g) to
that of the parent SiO2 (166 m2 / g) for most of the samples suggesting a reasonably
good dispersion of the supported alkali metal oxides on the SiO2 surface and
absence of significant pore blockage.

228
29Si-NMR of Cs-MCM-41 reveales that the surface silanol groups (Si-OH)
are progressively replaced by Si-O-Cs groups. Progressive changes in 133Cs NMR
spectra of Cs-SiO2 and Cs-MCM-41 samples on Cs loading suggest that Cs ions are
more mobile at higher loadings and agglomeration of Cs2O species could occur at
higher metal loading. ESCA measurements also suggest saturation of the surface by
Cs ions at high loading.
The basicity of all the catalysts have been characterized by temperature
programmed desorption and FTIR spectra of adsorbed CO2. In the case of the TPD
experiments, it is found that most of the adsorbed CO2 desorbs below 623K. The
amount of desorbed CO2 increases with increasing basicity of the alkali ions (Cs >
K > Na > Li) and with increasing metal loading. The intensity of the absorption
bands of adsorbed CO2 in the region 1200 cm-1 to 1750 cm-1 has been used to
estimate the relative basicities of the various catalysts. The spectra of CO2 adsorbed
at two different equilibrium pressures (0.4 mm and 5 mm) are used for the analysis
of the data. The FTIR spectra reveal that on alkali oxide loaded SiO2, CO2δ- species
are formed giving rise to characteristic pairs of adsorption bands. At ambient
temperature, the surface complex transforms into more stable bidentate carbonate
species with increasing basicity of the alkali oxides.
Adsorption of CO2 on alkali metal incorporated zeolites reveals that the
energetics of adsorption depends on the basicity of cation, anionic charge on the
zeolite framework and pore size of the zeolite. It also shows that CO2 adsorbs on all
the zeolites except NaX as bidentate species. In the case of NaX, symmetrical

229
carbonate species are also identified. Overall, two types of adsorption sites can be
identified, one near the wall of the pore and another in the bulk of the pore (cage).
The summary and conclusions of the studies of different alkylation reactions
are given below.
1) C-alkylation
a) Side chain alkylation of ethylbenzene
Side chain C-alkylation of ethylbenzene (EB) with dimethylcarbonate
(DMC) is promoted by alkali exchanged zeolite-X. Propylbenzenes (n- and i-) are
the major products besides styrene and o-xylene. Side chain alkylation activity
increases with increasing basicity of the exchanging cation. The catalysts prepared
by exchanging with alkali hydroxides are more active than those prepared from
chlorides. Conversion of EB and the yield of the products are maximum at a
process time of 2 h. Maximum EB conversion and side chain alkylation product
formation are observed at ~733K at an EB/DMC mole ratio of 5 and a W/F
(g.h.mole-1) of 60.
b) Side chain alkylation of toluene
Side chain C-alkylation of toluene with dimethylcarbonate (DMC) over
alkali exchanged zeolite-X produces ethylbenzene as the major product besides i-
propylbenzene as the doubly methylated product. Maximum toluene conversion
and side chain alkylation product formation are observed at ~698K at toluene/DMC
mole ratio of 5 and a W/F (g.h.mole-1) of 30 at a process time of 2 h.
2) O-alkylation
a) O-alkylation of phenol

230
O-alkylation was carried out using methanol, ethanol, n-propanol and n-
butanol as the alkylating agents to get aryl alkyl ethers. The study reveals that alkali
supported SiO2 samples are good catalysts for this O-alkylation reaction in the
vapour phase. The most active catalyst is Cs-SiO2. Methanol is more active
compare to other three alcohols in the O-alkylation of phenol. At lower
temperatures deactivation is less and decreases with increasing basicity of the
catalyst. Deactivation decreases with decrease in methanol to phenol mole ratio and
increase in carbon number of the alcohols. Deactivation rate (calculated on the
basis of unit conversion) decreases with the increase in basicity of the catalyst.
b) O-methylation of cresols
O-methylation of cresols (o-cresol, m-cresol and p-cresol) was carried out
with methanol in the vapour phase over alkali loaded SiO2 catalysts to get methyl
anisoles. High conversions and high O-alkylation selectivities are obtained over
these catalysts. The reactivity of the cresols is in the order: o-cresol < p-cresol ∼ m-
cresol. Here the deactivation rate (calculated on the basis of unit conversion)
decreases with the increase in basicity of the catalyst. Activity and selectivity
increase with basicity of the catalyst, Cs-SiO2 being the most active and selective
catalyst.
c) O-methylation of dihydroxy benzenes
The study also reveals that alkali supported SiO2 samples are good catalysts
for the O-methylation of catechol, resorcinol and hydroquinone in the vapour phase.
The most active and selective catalyst is Cs-SiO2 with about 1.5 mmole of Cs / g of
catalyst. Resorcinol is more reactive than the other two dihydroxy benzenes. The

231
trend in reactivities of the dihydroxy benzenes can be explained if a [HO-C6H4-Oδ-]
adsorbed intermediate is postulated to be formed on the catalyst surface. Catalyst
deactivation is more for catechol than for resorcinol and hydroquinone and
decreases with increasing basicity of the catalyst.
d) O-methylation of p-methoxy phenol
Studies on the methylation of p-methoxy phenol with methanol over
different alkali loaded SiO2 catalysts reveal that p-methoxy phenol is more reactive
than hydroquinone. Besides it also causes less catalyst deactivation than
hydroquinone.
e) O-methylation of 2-naphthol
Cs supported SiO2 and MCM-41 are good catalysts for the O-alkylation of
2-naphthol with methanol in the vapour phase. Increase in conversion with Cs-
loading is not as pronounced as for the other substrates. Nearly 95% yield of 2-
methoxynaphthalene is obtained over Cs-SiO2 at 673K, contact time (h) = 0.58 and
a methanol / 2-naphthol (mole) = 10. The small amount of 1-methyl-2-methoxy
naphthalene formed over Cs-catalysts is a result of the further alkylation of 2-
methoxynaphthalene.
3) N-alkylation
a) N-methylation of aniline with methanol
Vapour phase N-methylation of aniline with methanol over Cs exchanged X
and L and Cs loaded MCM-41, silicalite-1 and ferrierite reveals that they are good
catalysts for N-methylation. Over CsX and CsL, only N-alkylation takes place
producing N-methyl aniline (NMA) and N,N-dimethyl aniline (NNDMA). Over Cs-

232
MCM-41, Cs-silicalite and Cs-ferrierite small amounts of C-alkylated products are
also formed along with NMA and NNDMA. This may be mainly due to the lower
Cs content (∼ 3wt%) in the catalysts compared to CsX (∼30%) and CsL (∼20%).
NMA is the primary product and NNDMA is the secondary product. Due to the
different pore size and structure, the activities of the three catalysts Cs-MCM-41,
Cs-silicalite-1 and Cs-ferrierite are different eventhough their Cs content is the same
(∼ 3%). Conversion increases with increase in methanol / aniline mole ratio for all
the catalysts.
b) N-methylation of aniline with dimethyl carbonate
N-methylation of aniline with dimethyl carbonate (DMC) reveals that DMC
is a better methylating agent than methanol. DMC produces more NNDMA
compare to methanol. Deactivation rate (calculated on the basis of unit conversion)
is less when DMC is used instead of methanol.
The studies reveal that alkali metal (especially Cs) exchanged zeolite X can
alkylate ethylbenzene and toluene with dimethyl carbonate to i- (and n-)
propylbenzene and ethylbenzene, respectively. Similarly alkali metal (especially
Cs) loaded SiO2 and MCM-41 is excellent basic catalysts for the selective O-
alkylation of hydroxy aromatic compounds with methanol. Similarly, CsX is a
good catalyst for the N-alkylation of aniline.

233
List of publication
1. Side chain methylation of toluene and ethylbenzene with dimethyl carbonate over
alkaline X-zeolite Rajaram Bal and S. Sivasanker, Stud. Surf. Sci. Catal., 130 (2000) 2645.
2. Selective O-alkylation of cresols with methanol: catalysis by Cs loaded silica, a solid base Rajaram Bal and S. Sivasanker, Green Chemistry, 2 (2000) 106.
3. Vapour phase O-methylation of 2-naphthol over the solid bases: alkali loaded silica and Cs-loaded MCM-41 Rajaram Bal, K. Choudhari and S. Sivasanker, Catalysis Letters, 70 (2000) 75.
4. Redox and catalytic chemistry of Ti in Titanosilicate molecular sieves: an EPR investigation Rajaram Bal, K. Choudhari, D. Srinivas, S. Sivasanker and P. Ratnasamy, Journal of Molecular Catalysis A: Chemical, 162 (2000) 199.
5. Electron Spin Resonance Investigations on the location and reducibility of Zirconium in mesoporous Zr-MCM-41 molecular sieves K. Choudhari, Rajaram Bal, T. K. Das, A. Chandawadkar, D. Srinivas and S. Sivasanker, J. Phys. Chem. B, 104 (2000) 11066.
6. Vapour phase O-methylation of dihydroxy benzenes with methanol over cesium loaded silica, a solid base Rajaram Bal, B.B. Tope and S. Sivasanker, Journal of Molecular Catalysis: A Chemical, (accepted).
7. Vapour phase O-alkylation of phenol over alkali loaded silica Rajaram Bal and S. Sivasanker, Journal of Catalysis, (Communicated).
8. Alkali loaded silica, a solid base: Investigation by Infrared Spectroscopy and its catalytic activity Rajaram Bal, B.B.Tope, T.K. Das, S.G.Hegde and S. Sivasanker, Journal of Catalysis, (Communicated).
9. Cs-loaded on Cs-X, Cs-L, Cs-MCM-41, Cs-Silicalite, Cs-Ferrierite: Investigation by Infrared Spectroscopy and catalytic activity Rajaram Bal, B.B. Tope, S.G. Hegde and S. Sivasanker, Journal of Catalysis, (Communicated).
10. N-alkylation of aniline with methanol and dimethyl carbonate over Cs-loaded on Cs-X, Cs-L, Cs-MCM-41, Cs-Silicalite, Cs-Ferrierite Rajaram Bal and S. Sivasanker, Microporous and Mesoporous Material (To

234
be communicated).
11. Gallosilicate, a Faujacite structure: Characterization and its catalytic activity Rajaram Bal, T.H. Bennur and S. Sivasanker, Journal of Catalysis, (To be communicated).
12. Vopour phase Beckmann rearrangement of cyclohexanone oxime over mesoporous MCM-41 and Al-MCM-41 molecular sieves K. Chaudhari, Rajaram Bal, A.J. Chandwadkar and S. Sivasanker, Journal of Molecular Catalysis A: Chemical, (accepted).
13. Redox behaviour and selective oxidation properties of mesoporous titano- and zirconosilicate MCM-41 molecular sieves K. Choudhari, Rajaram Bal, A. Chandawadkar, D. Srinivas and S. Sivasanker, Microporous and Mesoporous Material, (Communicated).
14. Palladium Containing Hydrotalcite: A New Heterogeneous Catalyst for Heck Reaction T. H. Bennur, A. Ramani, Rajaram Bal, B. M. Chanda and S. Sivasanker, Chemical Communication, (Communicated).
15. Investigation of the coke formation by ESR spectroscopy. Rajaram Bal, D. Srinivas and S. Sivasanker (To be communicated).
Symposia/Workshop participated and papers presented 1. Side chain methylation of toluene and ethylbenzene with dimethyl carbonate over
alkaline X-zeolite Rajaram Bal and S. Sivasanker, Presented in the 12th International Congress on Catalysis at Granada, Spain (July, 2000).
2. Selective O-methylation of hydroxy aromatic compound with methanol over Alkali loaded silica
Rajaram Bal and S. Sivasanker, Presented in the ZMPC symposium, Sendai, Japan (August, 2000).
3. Location, redox behaviour and catalytic activity of zirconium and titanium in MCM-41 molecular sieves K. Chaudhari, Rajaram Bal, A.J. Chandwadkar, D. Srinivas and S. Sivasanker, Presented in the ZMPC symposium, Sendai, Japan (August, 2000).
4. Side chain alkylation of ethylbenzene with dimethyl carbonate over alkaline X-zeolite Rajaram Bal and S. sivasanker, Presented in the Golden Gubilee Symposiun on Catalysis, National Chemical Laboratory, Pune, India (January, 1999).

235
5. Vapour phase O-methylation of dihydroxy benzenes with methanol over cesium
loaded silica, a solid base Rajaram Bal, B.B. Tope and S. Sivasanker, Presented in Indo-Pacific Catalysis Symposium and National Catalysis Symposium (IPCAT-2 & CATSYMP-15) at National Chemical Laboratory,Pune (January, 2001).
6. Location, redox behaviour and catalytic activity of zirconium and titanium in MCM-41 molecular sieves K. Chaudhari, Rajaram Bal, A.J. Chandwadkar, D. Srinivas and S. Sivasanker Presented in Indo-Pacific Catalysis Symposium and National Catalysis Symposium (IPCAT-2 & CATSYMP-15) at National Chemical Laboratory,Pune (January, 2001).