Rainfall distribution and change detection across climatic zones in Nigeria
6
Rainfall distribution and change detection across climatic zones in Nigeria Stephen Bunmi Ogungbenro, Tobi Eniolu Morakinyo n Department of Meteorology, Federal University of Technology, P.M.B. 704, Akure, Ondo State, Nigeria article info Article history: Received 29 April 2013 Received in revised form 12 October 2014 Accepted 14 October 2014 Keywords: Climate change Climate period Rainfall variability abstract Nigerian agriculture is mainly rain-fed and basically dependent on the vagaries of weather especially rainfall. Nigeria today has about forty-four (44) weather observation stations which provide measure- ment of rainfall amount for different locations across the country. Hence, this study investigates change detection in rainfall pattern over each climatic zone of Nigeria. Data were collected for 90 years (1910– 1999) period for all the weather observation stations in Nigeria, while a subdivision was made to three (3) non-overlapping climate period of 30 years i.e. 1910–1939, 1940–1969 and 1970–1999. Statistical methods were utilized to justify any change in the average monthly and annual rainfall trend using probability density function and non-parametric tests such as the Pettitt test, Wilcoxon signed-rank test and paired sample test. Results show common change points and transitions from dry to wet (upward shift) in all climatic zones. Statistical tests performed on the data show that rainfall variation over each climatic zone is significant (p o0.05) between pairs of climate periods. Suggestions were therefore made at the end of the study on the use of the contained information for socio-economic improvement and agricultural development of the zones. & 2014 The Authors. Published by Elsevier B.V. This is an open access article under the CC BY-NC-ND license (http://creativecommons.org/licenses/by-nc-nd/3.0/). 1. Introduction Nigeria's population and economy are linked to climate sensi- tive activities including rain-fed agriculture. An understanding of current and historical rainfall trends and variation is inevitable to her future development especially in agriculture and hydrological sectors. Previous studies have analyzed rainfall trends over entire or part of Nigeria. For example, Adefolalu (1986) examines trends in rainfall pattern using 70-year period (1911–1980) rainfall data from 28 meteorological stations. Bello (1998) extended the work and compared the seasonality of rainfall distribution in Nigeria for two climate periods, 1930–1961 and 1962–1993. Ati et al. (2009) reported significant increase in rainfall over nine stations in northern Nigeria between 1953 and 2002. The results showed a general decline of dry season's contribution to annual rainfall i.e. dry period is getting drier. More recently, Oguntunde et al. (2011) analyzed rainfall trends over Nigeria using 1901–2002 rainfall data from Global Gridded Climatology of Climate Research Unit Time series (CRU TS.2.1). They concluded that annual rainfall has been reduced significantly over 20% of the landscape and the amount of annual rainfall reduced by 50–350 mm in 64% portion of Nigeria. It is important to state that rainfall of Nigeria and West Africa in generally is influenced by the dynamics of continental air mass and maritime air mass which meet along a slanting surface called Inter-Tropical Discontinuity (ITD) (Odekunle, 2004). Varying degrees of convective activity and precipitation takes place at the south of ITD while little or no cloud development or precipita- tion occur to the northern part of ITD (Ilesanmi, 1972). This present study differs from the previous ones in the following perspective; firstly, ground observation data used by Adefolalu (1986) and Bello (1998) was extended to year 1999. Secondly, the statistical approach employed is different and more recent. The present study aims to detect change (transi- tion) point in rainfall pattern over Nigeria on a climatic zone basis using non-parametric statistical analysis. This was per- formed on the average zonal rainfall to show transitions in wet to dry and dry to wet among three (3) different non-overlapping climate periods of 30 years 1910–1939, 1940–1969 and 1970– 1999. This enables the observation of increase or decrease in rainfall received in each of the climatic zones of Nigeria to be established. 2. Study area The study area, Nigeria was subdivided latitudinally into three zones: Guinea (coast-81N), Savanna (8–111N) and Sahel (11–161N) following Omotosho and Abiodun (2007) as shown in Fig. 1. The names of Nigeria Meteorological Agency (NIMET) stations that falls within each zone are given in Table 1. Contents lists available at ScienceDirect journal homepage: www.elsevier.com/locate/wace Weather and Climate Extremes http://dx.doi.org/10.1016/j.wace.2014.10.002 2212-0947/& 2014 The Authors. Published by Elsevier B.V. This is an open access article under the CC BY-NC-ND license (http://creativecommons.org/licenses/by-nc-nd/3.0/). n Corresponding author. E-mail address: [email protected] (T.E. Morakinyo). Please cite this article as: Ogungbenro, S.B., Morakinyo, T.E., Rainfall distribution and change detection across climatic zones in Nigeria. Weather and Climate Extremes (2014), http://dx.doi.org/10.1016/j.wace.2014.10.002i Weather and Climate Extremes ∎ (∎∎∎∎) ∎∎∎–∎∎∎
Transcript of Rainfall distribution and change detection across climatic zones in Nigeria
Rainfall distribution and change detection across climatic zones in Nigeria
Stephen Bunmi Ogungbenro, Tobi Eniolu Morakinyo n
Department of Meteorology, Federal University of Technology, P.M.B. 704, Akure, Ondo State, Nigeria
a r t i c l e i n f o
Article history:Received 29 April 2013Received in revised form12 October 2014Accepted 14 October 2014
Keywords:Climate changeClimate periodRainfall variability
a b s t r a c t
Nigerian agriculture is mainly rain-fed and basically dependent on the vagaries of weather especiallyrainfall. Nigeria today has about forty-four (44) weather observation stations which provide measure-ment of rainfall amount for different locations across the country. Hence, this study investigates changedetection in rainfall pattern over each climatic zone of Nigeria. Data were collected for 90 years (1910–1999) period for all the weather observation stations in Nigeria, while a subdivision was made to three(3) non-overlapping climate period of 30 years i.e. 1910–1939, 1940–1969 and 1970–1999. Statisticalmethods were utilized to justify any change in the average monthly and annual rainfall trend usingprobability density function and non-parametric tests such as the Pettitt test, Wilcoxon signed-rank testand paired sample test. Results show common change points and transitions from dry to wet (upwardshift) in all climatic zones. Statistical tests performed on the data show that rainfall variation over eachclimatic zone is significant (po0.05) between pairs of climate periods. Suggestions were therefore madeat the end of the study on the use of the contained information for socio-economic improvement andagricultural development of the zones.& 2014 The Authors. Published by Elsevier B.V. This is an open access article under the CC BY-NC-ND
license (http://creativecommons.org/licenses/by-nc-nd/3.0/).
1. Introduction
Nigeria's population and economy are linked to climate sensi-tive activities including rain-fed agriculture. An understanding ofcurrent and historical rainfall trends and variation is inevitable toher future development especially in agriculture and hydrologicalsectors. Previous studies have analyzed rainfall trends over entireor part of Nigeria. For example, Adefolalu (1986) examines trendsin rainfall pattern using 70-year period (1911–1980) rainfall datafrom 28 meteorological stations. Bello (1998) extended the workand compared the seasonality of rainfall distribution in Nigeria fortwo climate periods, 1930–1961 and 1962–1993. Ati et al. (2009)reported significant increase in rainfall over nine stations innorthern Nigeria between 1953 and 2002. The results showed ageneral decline of dry season's contribution to annual rainfall i.e.dry period is getting drier. More recently, Oguntunde et al. (2011)analyzed rainfall trends over Nigeria using 1901–2002 rainfall datafrom Global Gridded Climatology of Climate Research Unit Timeseries (CRU TS.2.1). They concluded that annual rainfall has beenreduced significantly over 20% of the landscape and the amount ofannual rainfall reduced by 50–350 mm in 64% portion of Nigeria. Itis important to state that rainfall of Nigeria and West Africa ingenerally is influenced by the dynamics of continental air mass
and maritime air mass which meet along a slanting surface calledInter-Tropical Discontinuity (ITD) (Odekunle, 2004). Varyingdegrees of convective activity and precipitation takes place atthe south of ITD while little or no cloud development or precipita-tion occur to the northern part of ITD (Ilesanmi, 1972).
This present study differs from the previous ones in thefollowing perspective; firstly, ground observation data used byAdefolalu (1986) and Bello (1998) was extended to year 1999.Secondly, the statistical approach employed is different andmore recent. The present study aims to detect change (transi-tion) point in rainfall pattern over Nigeria on a climatic zonebasis using non-parametric statistical analysis. This was per-formed on the average zonal rainfall to show transitions in wetto dry and dry to wet among three (3) different non-overlappingclimate periods of 30 years 1910–1939, 1940–1969 and 1970–1999. This enables the observation of increase or decrease inrainfall received in each of the climatic zones of Nigeria to beestablished.
2. Study area
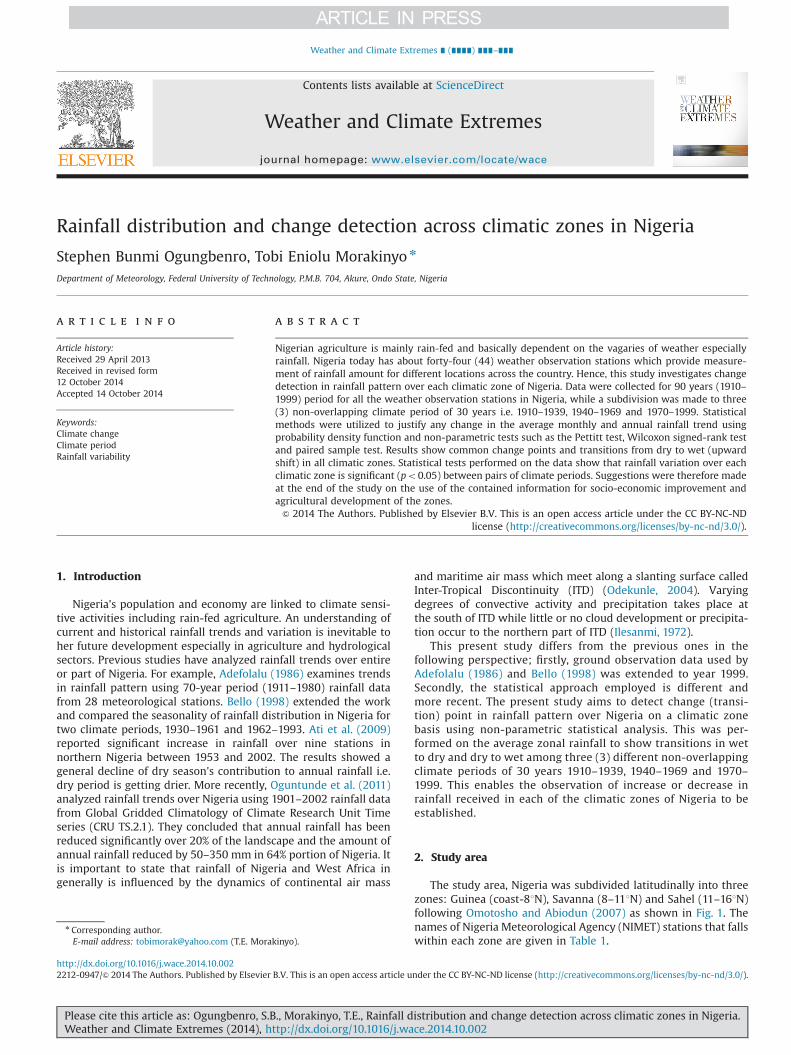
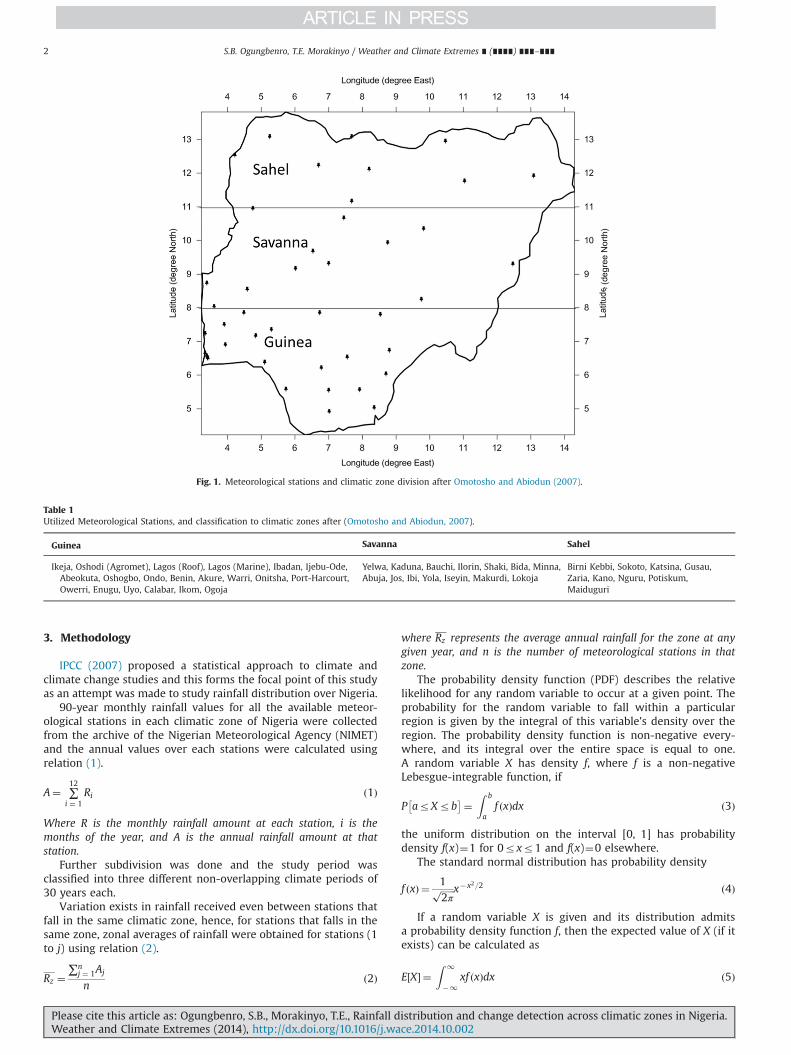
The study area, Nigeria was subdivided latitudinally into threezones: Guinea (coast-81N), Savanna (8–111N) and Sahel (11–161N)following Omotosho and Abiodun (2007) as shown in Fig. 1. Thenames of Nigeria Meteorological Agency (NIMET) stations that fallswithin each zone are given in Table 1.
Contents lists available at ScienceDirect
journal homepage: www.elsevier.com/locate/wace
Weather and Climate Extremes
http://dx.doi.org/10.1016/j.wace.2014.10.0022212-0947/& 2014 The Authors. Published by Elsevier B.V. This is an open access article under the CC BY-NC-ND license (http://creativecommons.org/licenses/by-nc-nd/3.0/).
n Corresponding author.E-mail address: [email protected] (T.E. Morakinyo).
Please cite this article as: Ogungbenro, S.B., Morakinyo, T.E., Rainfall distribution and change detection across climatic zones in Nigeria.Weather and Climate Extremes (2014), http://dx.doi.org/10.1016/j.wace.2014.10.002i
Weather and Climate Extremes ∎ (∎∎∎∎) ∎∎∎–∎∎∎
3. Methodology
IPCC (2007) proposed a statistical approach to climate andclimate change studies and this forms the focal point of this studyas an attempt was made to study rainfall distribution over Nigeria.
90-year monthly rainfall values for all the available meteor-ological stations in each climatic zone of Nigeria were collectedfrom the archive of the Nigerian Meteorological Agency (NIMET)and the annual values over each stations were calculated usingrelation (1).
A¼ ∑12
i ¼ 1Ri ð1Þ
Where R is the monthly rainfall amount at each station, i is themonths of the year, and A is the annual rainfall amount at thatstation.
Further subdivision was done and the study period wasclassified into three different non-overlapping climate periods of30 years each.
Variation exists in rainfall received even between stations thatfall in the same climatic zone, hence, for stations that falls in thesame zone, zonal averages of rainfall were obtained for stations (1to j) using relation (2).
Rz ¼∑n
j ¼ 1Aj
nð2Þ
where Rz represents the average annual rainfall for the zone at anygiven year, and n is the number of meteorological stations in thatzone.
The probability density function (PDF) describes the relativelikelihood for any random variable to occur at a given point. Theprobability for the random variable to fall within a particularregion is given by the integral of this variable's density over theregion. The probability density function is non-negative every-where, and its integral over the entire space is equal to one.A random variable X has density f, where f is a non-negativeLebesgue-integrable function, if
P arXrb� �¼
Z b
af xð Þdx ð3Þ
the uniform distribution on the interval [0, 1] has probabilitydensity f(x)¼1 for 0rxr1 and f(x)¼0 elsewhere.
The standard normal distribution has probability density
f xð Þ ¼ 1ffiffiffiffiffiffi2π
p x�x2=2 ð4Þ
If a random variable X is given and its distribution admitsa probability density function f, then the expected value of X (if itexists) can be calculated as
E X½ � ¼Z 1
�1xf xð Þdx ð5Þ
Fig. 1. Meteorological stations and climatic zone division after Omotosho and Abiodun (2007).
Table 1Utilized Meteorological Stations, and classification to climatic zones after (Omotosho and Abiodun, 2007).
Guinea Savanna Sahel
Ikeja, Oshodi (Agromet), Lagos (Roof), Lagos (Marine), Ibadan, Ijebu-Ode,Abeokuta, Oshogbo, Ondo, Benin, Akure, Warri, Onitsha, Port-Harcourt,Owerri, Enugu, Uyo, Calabar, Ikom, Ogoja
Yelwa, Kaduna, Bauchi, Ilorin, Shaki, Bida, Minna,Abuja, Jos, Ibi, Yola, Iseyin, Makurdi, Lokoja
Birni Kebbi, Sokoto, Katsina, Gusau,Zaria, Kano, Nguru, Potiskum,Maiduguri
S.B. Ogungbenro, T.E. Morakinyo / Weather and Climate Extremes ∎ (∎∎∎∎) ∎∎∎–∎∎∎2
Please cite this article as: Ogungbenro, S.B., Morakinyo, T.E., Rainfall distribution and change detection across climatic zones in Nigeria.Weather and Climate Extremes (2014), http://dx.doi.org/10.1016/j.wace.2014.10.002i
Note: Variable in the context of this study is rainfall amount.To determine if two sets of data are significantly different from
each other Wilcoxon signed-rank test which is non-parametricwas used to comparing data from paired samples (zonal averagerainfall amount of climate periods). The computation was carriedout using the SPSS17.0 software. Details of this test can be found inSPSS manual or other statistics text.
The non-parametric Pettit change point test is used to test for theoccurrence of such change point in average zonal rainfall received. ThePettit criterion hypothesized that the change point K is detected in
K ¼ max1rkrN
Uk
�� �� ð6Þ
where the description of Uk is given by the relation
Uk ¼ 2 ∑k
i ¼ 1Mi�k Nþ1ð Þ ð7Þ
The modulus of Uk shows a downward or upward shifts intrend and this indicates areas of abrupt change over the zones.Significance of such change point is tested by the relation
Kα ¼
ffiffiffiffiffiffiffiffiffiffiffiffiffiffiffiffiffiffiffiffiffiffiffiffiffiffiffiffiffiffiffiffiffiffiffiffiffiffiffiffiffiffiffiffiffi� ln α
N3þN2� �
6
8<:
9=;
vuuut ð8Þ
And change points exist where Uk shows maxima.
4. Results and discusions
4.1. Variation of mean monthly rainfall per climatic period
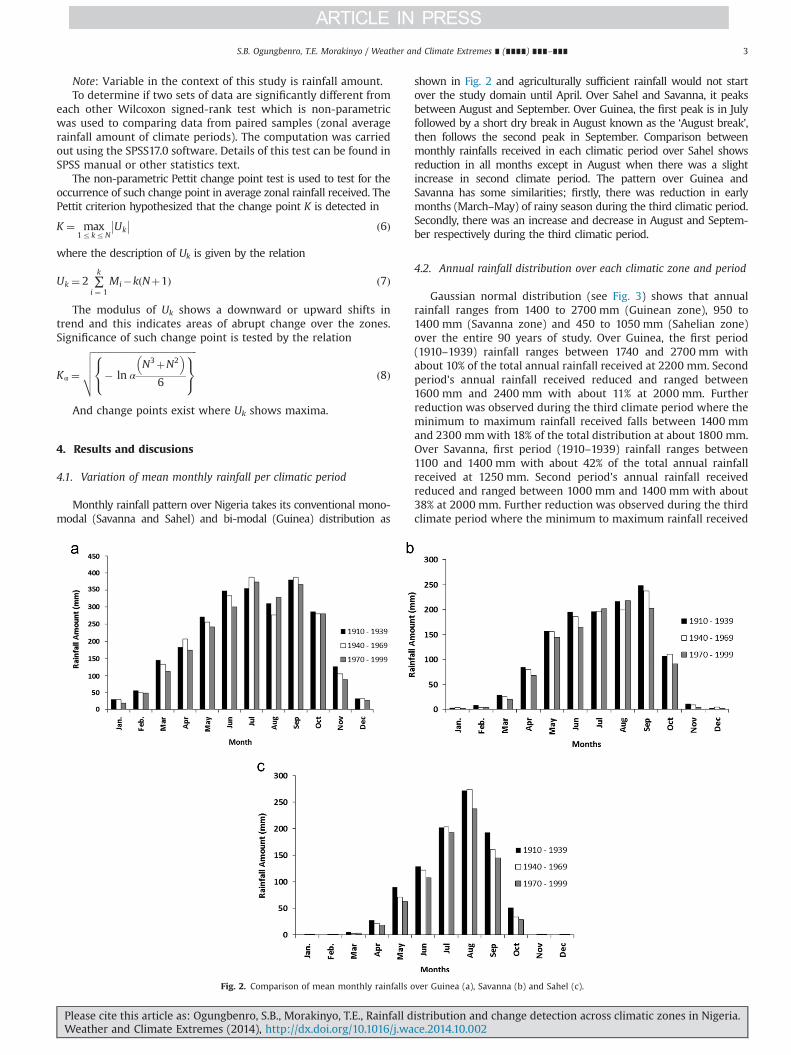
Monthly rainfall pattern over Nigeria takes its conventional mono-modal (Savanna and Sahel) and bi-modal (Guinea) distribution as
shown in Fig. 2 and agriculturally sufficient rainfall would not startover the study domain until April. Over Sahel and Savanna, it peaksbetween August and September. Over Guinea, the first peak is in Julyfollowed by a short dry break in August known as the ‘August break’,then follows the second peak in September. Comparison betweenmonthly rainfalls received in each climatic period over Sahel showsreduction in all months except in August when there was a slightincrease in second climate period. The pattern over Guinea andSavanna has some similarities; firstly, there was reduction in earlymonths (March–May) of rainy season during the third climatic period.Secondly, there was an increase and decrease in August and Septem-ber respectively during the third climatic period.
4.2. Annual rainfall distribution over each climatic zone and period
Gaussian normal distribution (see Fig. 3) shows that annualrainfall ranges from 1400 to 2700 mm (Guinean zone), 950 to1400 mm (Savanna zone) and 450 to 1050 mm (Sahelian zone)over the entire 90 years of study. Over Guinea, the first period(1910–1939) rainfall ranges between 1740 and 2700 mm withabout 10% of the total annual rainfall received at 2200 mm. Secondperiod's annual rainfall received reduced and ranged between1600 mm and 2400 mm with about 11% at 2000 mm. Furtherreduction was observed during the third climate period where theminimum to maximum rainfall received falls between 1400 mmand 2300 mmwith 18% of the total distribution at about 1800 mm.Over Savanna, first period (1910–1939) rainfall ranges between1100 and 1400 mm with about 42% of the total annual rainfallreceived at 1250 mm. Second period's annual rainfall receivedreduced and ranged between 1000 mm and 1400 mm with about38% at 2000 mm. Further reduction was observed during the thirdclimate period where the minimum to maximum rainfall received
Fig. 2. Comparison of mean monthly rainfalls over Guinea (a), Savanna (b) and Sahel (c).
S.B. Ogungbenro, T.E. Morakinyo / Weather and Climate Extremes ∎ (∎∎∎∎) ∎∎∎–∎∎∎ 3
Please cite this article as: Ogungbenro, S.B., Morakinyo, T.E., Rainfall distribution and change detection across climatic zones in Nigeria.Weather and Climate Extremes (2014), http://dx.doi.org/10.1016/j.wace.2014.10.002i
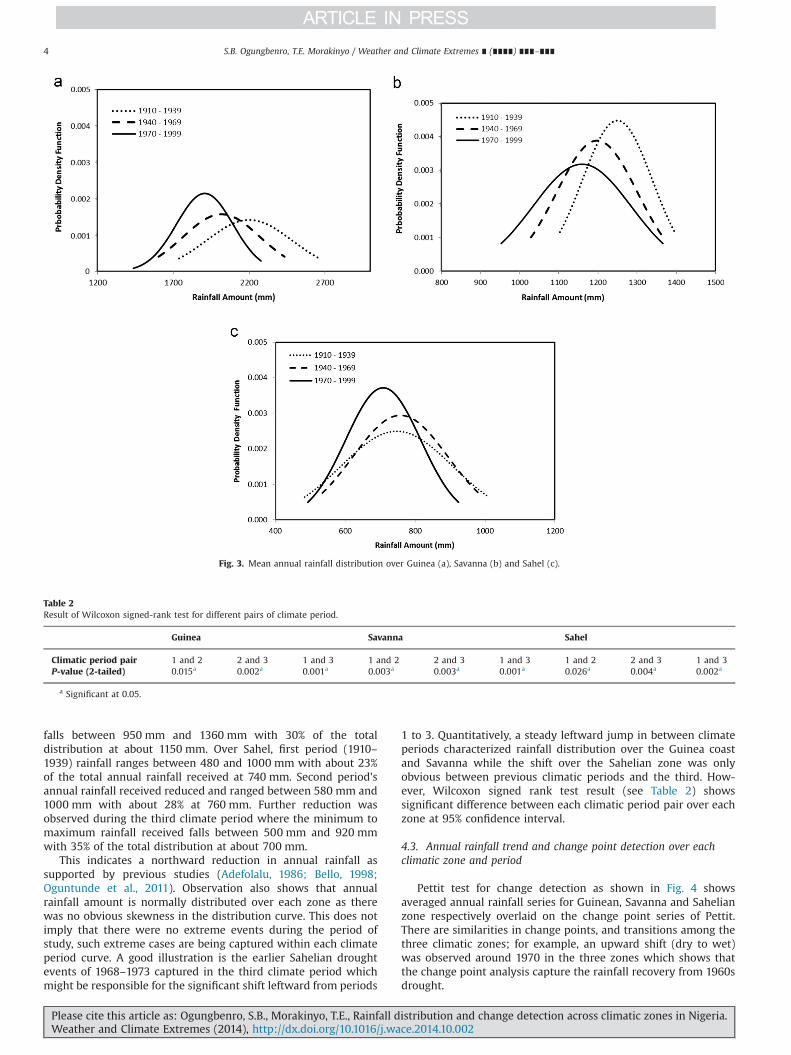
falls between 950 mm and 1360 mm with 30% of the totaldistribution at about 1150 mm. Over Sahel, first period (1910–1939) rainfall ranges between 480 and 1000 mm with about 23%of the total annual rainfall received at 740 mm. Second period'sannual rainfall received reduced and ranged between 580 mm and1000 mm with about 28% at 760 mm. Further reduction wasobserved during the third climate period where the minimum tomaximum rainfall received falls between 500 mm and 920 mmwith 35% of the total distribution at about 700 mm.
This indicates a northward reduction in annual rainfall assupported by previous studies (Adefolalu, 1986; Bello, 1998;Oguntunde et al., 2011). Observation also shows that annualrainfall amount is normally distributed over each zone as therewas no obvious skewness in the distribution curve. This does notimply that there were no extreme events during the period ofstudy, such extreme cases are being captured within each climateperiod curve. A good illustration is the earlier Sahelian droughtevents of 1968–1973 captured in the third climate period whichmight be responsible for the significant shift leftward from periods
1 to 3. Quantitatively, a steady leftward jump in between climateperiods characterized rainfall distribution over the Guinea coastand Savanna while the shift over the Sahelian zone was onlyobvious between previous climatic periods and the third. How-ever, Wilcoxon signed rank test result (see Table 2) showssignificant difference between each climatic period pair over eachzone at 95% confidence interval.
4.3. Annual rainfall trend and change point detection over eachclimatic zone and period
Pettit test for change detection as shown in Fig. 4 showsaveraged annual rainfall series for Guinean, Savanna and Sahelianzone respectively overlaid on the change point series of Pettit.There are similarities in change points, and transitions among thethree climatic zones; for example, an upward shift (dry to wet)was observed around 1970 in the three zones which shows thatthe change point analysis capture the rainfall recovery from 1960sdrought.
Fig. 3. Mean annual rainfall distribution over Guinea (a), Savanna (b) and Sahel (c).
Table 2Result of Wilcoxon signed-rank test for different pairs of climate period.
Guinea Savanna Sahel
Climatic period pair 1 and 2 2 and 3 1 and 3 1 and 2 2 and 3 1 and 3 1 and 2 2 and 3 1 and 3P-value (2-tailed) 0.015a 0.002a 0.001a 0.003a 0.003a 0.001a 0.026a 0.004a 0.002a
a Significant at 0.05.
S.B. Ogungbenro, T.E. Morakinyo / Weather and Climate Extremes ∎ (∎∎∎∎) ∎∎∎–∎∎∎4
Please cite this article as: Ogungbenro, S.B., Morakinyo, T.E., Rainfall distribution and change detection across climatic zones in Nigeria.Weather and Climate Extremes (2014), http://dx.doi.org/10.1016/j.wace.2014.10.002i
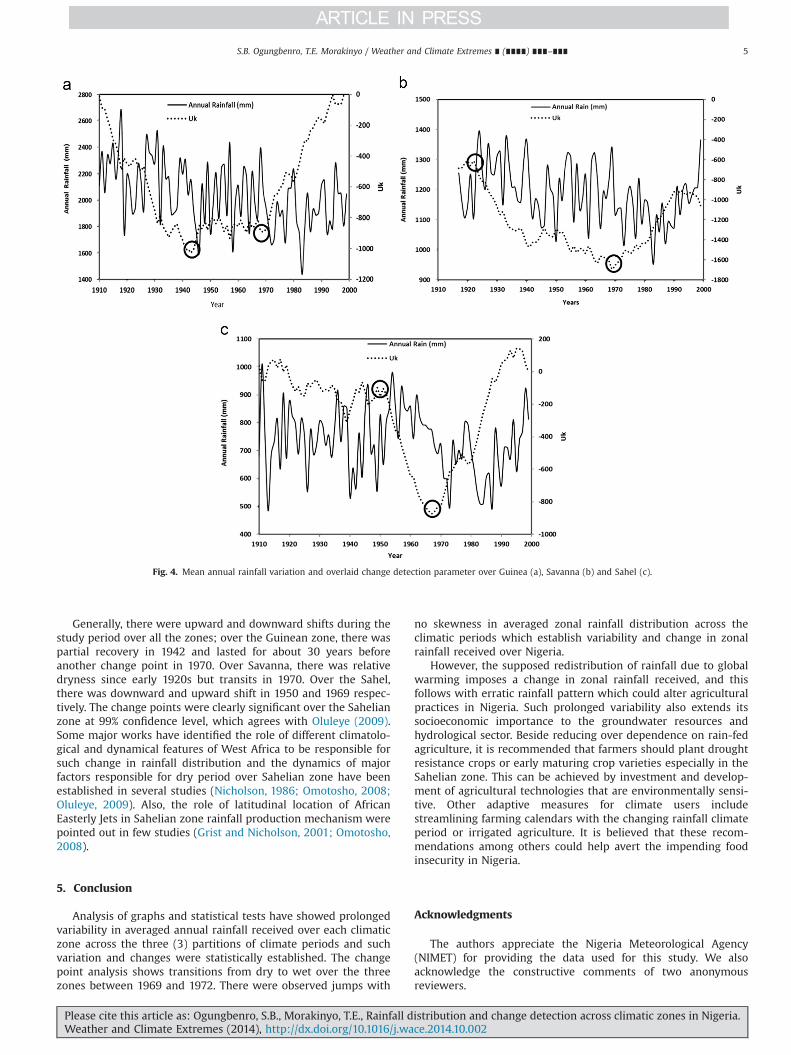
Generally, there were upward and downward shifts during thestudy period over all the zones; over the Guinean zone, there waspartial recovery in 1942 and lasted for about 30 years beforeanother change point in 1970. Over Savanna, there was relativedryness since early 1920s but transits in 1970. Over the Sahel,there was downward and upward shift in 1950 and 1969 respec-tively. The change points were clearly significant over the Sahelianzone at 99% confidence level, which agrees with Oluleye (2009).Some major works have identified the role of different climatolo-gical and dynamical features of West Africa to be responsible forsuch change in rainfall distribution and the dynamics of majorfactors responsible for dry period over Sahelian zone have beenestablished in several studies (Nicholson, 1986; Omotosho, 2008;Oluleye, 2009). Also, the role of latitudinal location of AfricanEasterly Jets in Sahelian zone rainfall production mechanism werepointed out in few studies (Grist and Nicholson, 2001; Omotosho,2008).
5. Conclusion
Analysis of graphs and statistical tests have showed prolongedvariability in averaged annual rainfall received over each climaticzone across the three (3) partitions of climate periods and suchvariation and changes were statistically established. The changepoint analysis shows transitions from dry to wet over the threezones between 1969 and 1972. There were observed jumps with
no skewness in averaged zonal rainfall distribution across theclimatic periods which establish variability and change in zonalrainfall received over Nigeria.
However, the supposed redistribution of rainfall due to globalwarming imposes a change in zonal rainfall received, and thisfollows with erratic rainfall pattern which could alter agriculturalpractices in Nigeria. Such prolonged variability also extends itssocioeconomic importance to the groundwater resources andhydrological sector. Beside reducing over dependence on rain-fedagriculture, it is recommended that farmers should plant droughtresistance crops or early maturing crop varieties especially in theSahelian zone. This can be achieved by investment and develop-ment of agricultural technologies that are environmentally sensi-tive. Other adaptive measures for climate users includestreamlining farming calendars with the changing rainfall climateperiod or irrigated agriculture. It is believed that these recom-mendations among others could help avert the impending foodinsecurity in Nigeria.
Acknowledgments
The authors appreciate the Nigeria Meteorological Agency(NIMET) for providing the data used for this study. We alsoacknowledge the constructive comments of two anonymousreviewers.
Fig. 4. Mean annual rainfall variation and overlaid change detection parameter over Guinea (a), Savanna (b) and Sahel (c).
S.B. Ogungbenro, T.E. Morakinyo / Weather and Climate Extremes ∎ (∎∎∎∎) ∎∎∎–∎∎∎ 5
Please cite this article as: Ogungbenro, S.B., Morakinyo, T.E., Rainfall distribution and change detection across climatic zones in Nigeria.Weather and Climate Extremes (2014), http://dx.doi.org/10.1016/j.wace.2014.10.002i
References
Adefolalu, D.O., 1986. Rainfall trends in Nigeria. Theor. Appl. Climatol. 37, 205–219.Ati, O.F., Stigter, C.J., Iguisi, O.E., Afolayan, J.O., 2009. Profile of rainfall change and
variability in the northern Nigeria, 1953–2002. Res. J. Environ. Earth Sci. 1 (2), 58–63.Bello, N.J., 1998. A study of evidence of climate change based on rainfall seasonality
and the reliability of rainfall climate period in Nigeria. Sustain. Afr. 4, 30–32.Grist, J.B., Nicholson, S.E., 2001. A study of dynamic factors influencing the inter-annual
variability of rainfall in the West Africa Sahelian zone. J. Clim. 14, 1337–1359.Ilesanmi, O.O., 1972. Aspects of the precipitation climatology of the July–August
rainfall minimum of Southern Nigeria. J. Trop. Geogr. 35, 51–59.Intergovernmental Panel on Climate Climate change, 2007. The Fourth Assessment
Report (AR4). Synthesis Report for Policymakers ⟨http://www.ipcc.ch/pdf/assessment-report/ar4/syr/ar4_syr_spm.pdf⟩.
Nicholson, S.E., 1986. The spatial coherence of African rainfall anomalies interhemi-spheric teleconnections. J. Clim. Appl. Meteorol. 25, 1365–1381.
Odekunle, T.O., 2004. Rainfall and the length of the growing season in Nigeria. Int. J.Climatol. 24 (4), 467–479.
Oguntunde, P.G., Abiodun, B.J., Lischeid, G., 2011. Rainfall trends in Nigeria, 1901–2000. J. Hydrol. 411 (3), 207–218.
Oluleye, A., 2009. Change detection in rainfall anomalies across climatic zones inNigeria. J. Meteorol. Clim. Sci. 7, 6–10.
Omotosho, J.B., Abiodun, B.J., 2007. A numerical study of moisture build‐up andrainfall over West Africa. Meteorol. Appl. 14 (3), 209–225.
Omotosho, J.B., 2008. Pre‐rainy season moisture build‐up and storm precipitationdelivery in the West African Sahel. Int. J. Climatol. 28 (7), 937–946.
S.B. Ogungbenro, T.E. Morakinyo / Weather and Climate Extremes ∎ (∎∎∎∎) ∎∎∎–∎∎∎6
Please cite this article as: Ogungbenro, S.B., Morakinyo, T.E., Rainfall distribution and change detection across climatic zones in Nigeria.Weather and Climate Extremes (2014), http://dx.doi.org/10.1016/j.wace.2014.10.002i