Changes in Crop-mix and Cropping Pattern in Different Agro- climatic Zones of West Bengal with...
24
International Journal of Management and Social Sciences Research (IJMSSR) ISSN: 2319-4421 Volume 2, No. 8, August 2013 i-Xplore International Research Journal Consortium www.irjcjournals.org 15 Changes in Crop-mix and Cropping Pattern in Different Agro- climatic Zones of West Bengal with Special Reference to Terai Zone Dr. B. C. Rudra, Farm Manager, Malda KVK, Uttar Banga Krishi Viswavidyalaya, Ratua, Malda, West Bengal Dr. S. Kole, Block Technology Manager, ATMA, Cooch Behar II, West Bengal. ABSTRACT As the growth and development of crops and cropping pattern in a particular region in relation to other region largely hinges upon the agro-climatic condition of the area in question the present study deals with the question of variation in cropping system and cropping pattern between different agro-climatic zones of West Bengal by taking the period 1992-93 to 2002-03 and also the variability of the pattern over the period within each zone. By considering the natural advantages and disadvantages of different crops caused by soil and climatic factors the terai zone has an edge over other zones of the State in growing wheat, potato, cabbage, cauliflower, tomato and chilli while this zone is disadvantageous for rice crop. At the zone level growing consumption demand of cereals has also played a prime role to increasing allocation of land over time under cereal crops like winter rice, summer rice and wheat as visualized in other parts of the State. Here also twin objective of meeting increasing consumption demand of cereals by bringing in more area under the aforesaid cereal crops and increasing farm income by allocation of more land under vegetables and chilli has been addressed. INTRODUCTION: The experience of HYV technology in crop production has introduced a spectacular change in the crop economy of West Bengal since late sixties. The HYV technology introduced in the country in general and in West Bengal in particular during late sixties was centered around the cereal crops particularly rice and wheat. Improvement of yield per unit area through introduction of HYV technology in case of maize and small millets is not found notable. Production technology of other crops namely jute, potato, pulses, oilseeds, vegetable and spice crops were recorded by and large unchanged till late eighties or early nineties as has been noticed in crop production front of West Bengal. From early nineties production technology of pulse, oilseed, jute, sugarcane and potato has got a remarkable change which has been reflected in the improvement of yield per unit area of these crops. The production technology of vegetable and spice crops is recorded a great leap since late eighties and more particularly early nineties due to introduction of hybrid technology in the production of vegetable crops. The period extending from late sixties to late eighties is, therefore, marked as a period of technological change in cereal production and the period extending from late eighties onward as period of technological change in oilseed and pulse and more particularly in vegetable and spice crops as has been noticed in the crop production front of West Bengal. Changes in cropping system and cropping pattern in the state of West Bengal over the period extending from 1967-68 to 2002-03 have been examined in detail by Rudra 1 (2007). It has been explained that neither the relative profitability reflected in the yield rate nor the relative price have been relevant in explaining area expansion or contraction of the principal staple crops like rice and wheat that has been brought about during the said period. And it is the family consumption demand of cereal (rice and wheat) which has played a pivotal role in the question of area reallocation between the crops meant for food consumption and that for the market with an objective of increasing farm income in a small farm dominated agricultural economy of West Bengal. At this juncture the question comes to the fore that the crops and cropping pattern in a particular region in relation to other region largely hinges upon the agro-climatic condition of the area in question in order to take the natural advantage and thereby enabling to produce at relatively low unit cost. Thus, it is imperative to analyze the observed changes in cropping system and cropping pattern by dividing the state of West Bengal into different agro-climatic zones. The present study deals with the question of variation in cropping system and cropping pattern between different agro-climatic zones of the State by taking the period 1992-93 to 2002-03 and also the variability of the pattern over the period within each zone. METHODOLOGY: The study is principally based on secondary data, both qualitative and quantitative. Data on area, production and 1 Rudra, B. C. (2007) ‘Technological Changr and Its Impact on Agrarian Production and Relations: A Study in a Northern District of West Bengal’, An Unpublished Ph. D. Thesis, Chapter 3, pp.23-27
-
Upload
independent -
Category
Documents
-
view
2 -
download
0
Transcript of Changes in Crop-mix and Cropping Pattern in Different Agro- climatic Zones of West Bengal with...

International Journal of Management and Social Sciences Research (IJMSSR) ISSN: 2319-4421 Volume 2, No. 8, August 2013
i-Xplore International Research Journal Consortium www.irjcjournals.org
15
Changes in Crop-mix and Cropping Pattern in Different Agro-
climatic Zones of West Bengal with Special Reference to Terai
Zone
Dr. B. C. Rudra, Farm Manager, Malda KVK, Uttar Banga Krishi Viswavidyalaya, Ratua, Malda, West Bengal
Dr. S. Kole, Block Technology Manager, ATMA, Cooch Behar II, West Bengal.
ABSTRACT
As the growth and development of crops and cropping
pattern in a particular region in relation to other region
largely hinges upon the agro-climatic condition of the
area in question the present study deals with the question
of variation in cropping system and cropping pattern
between different agro-climatic zones of West Bengal by
taking the period 1992-93 to 2002-03 and also the
variability of the pattern over the period within each zone.
By considering the natural advantages and disadvantages
of different crops caused by soil and climatic factors the
terai zone has an edge over other zones of the State in
growing wheat, potato, cabbage, cauliflower, tomato and
chilli while this zone is disadvantageous for rice crop. At
the zone level growing consumption demand of cereals
has also played a prime role to increasing allocation of
land over time under cereal crops like winter rice,
summer rice and wheat as visualized in other parts of the
State. Here also twin objective of meeting increasing
consumption demand of cereals by bringing in more area
under the aforesaid cereal crops and increasing farm
income by allocation of more land under vegetables and
chilli has been addressed.
INTRODUCTION:
The experience of HYV technology in crop production
has introduced a spectacular change in the crop economy
of West Bengal since late sixties. The HYV technology
introduced in the country in general and in West Bengal in
particular during late sixties was centered around the
cereal crops particularly rice and wheat. Improvement of
yield per unit area through introduction of HYV
technology in case of maize and small millets is not found
notable. Production technology of other crops namely
jute, potato, pulses, oilseeds, vegetable and spice crops
were recorded by and large unchanged till late eighties or
early nineties as has been noticed in crop production front
of West Bengal. From early nineties production
technology of pulse, oilseed, jute, sugarcane and potato
has got a remarkable change which has been reflected in
the improvement of yield per unit area of these crops. The
production technology of vegetable and spice crops is
recorded a great leap since late eighties and more
particularly early nineties due to introduction of hybrid
technology in the production of vegetable crops. The
period extending from late sixties to late eighties is,
therefore, marked as a period of technological change in
cereal production and the period extending from late
eighties onward as period of technological change in
oilseed and pulse and more particularly in vegetable and
spice crops as has been noticed in the crop production
front of West Bengal. Changes in cropping system and
cropping pattern in the state of West Bengal over the
period extending from 1967-68 to 2002-03 have been
examined in detail by Rudra1 (2007). It has been
explained that neither the relative profitability reflected in
the yield rate nor the relative price have been relevant in
explaining area expansion or contraction of the principal
staple crops like rice and wheat that has been brought
about during the said period. And it is the family
consumption demand of cereal (rice and wheat) which has
played a pivotal role in the question of area reallocation
between the crops meant for food consumption and that
for the market with an objective of increasing farm
income in a small farm dominated agricultural economy
of West Bengal. At this juncture the question comes to the
fore that the crops and cropping pattern in a particular
region in relation to other region largely hinges upon the
agro-climatic condition of the area in question in order to
take the natural advantage and thereby enabling to
produce at relatively low unit cost. Thus, it is imperative
to analyze the observed changes in cropping system and
cropping pattern by dividing the state of West Bengal into
different agro-climatic zones. The present study deals with
the question of variation in cropping system and cropping
pattern between different agro-climatic zones of the State
by taking the period 1992-93 to 2002-03 and also the
variability of the pattern over the period within each zone.
METHODOLOGY:
The study is principally based on secondary data, both
qualitative and quantitative. Data on area, production and
1 Rudra, B. C. (2007) ‘Technological Changr and Its
Impact on Agrarian Production and Relations: A Study in
a Northern District of West Bengal’, An Unpublished Ph.
D. Thesis, Chapter 3, pp.23-27

International Journal of Management and Social Sciences Research (IJMSSR) ISSN: 2319-4421 Volume 2, No. 8, August 2013
i-Xplore International Research Journal Consortium www.irjcjournals.org
16
yield rate of the principal crops in West Bengal have been
drawn upon from Socio-Economic and Evaluation
Branch, Directorate of Agriculture, Govt. of West Bengal
and Bureau of Applied Economics and Statistics, Govt. of
West Bengal. Data on weather parameters like monthly
and weekly rainfall, monthly and weekly relative
humidity, and monthly and weekly temperature have been
collected from the records available at the State
Department of Agriculture, West Bengal in 2003-04.
Simple tabular analysis has been adopted in the present
study.
1. Agro-climatic Zones: The soils of West Bengal were first classified during the
middle of 20th century by the West Bengal Department of
agriculture in collaboration with ICAR by the rapid
reconnaissance survey based on 9.6 km. grid system.
According to that classification, the soils of the state was
broadly sub-divided into seven units viz. i) Gangetic
alluvium, ii) Vindhya alluvium, iii) Terai and Teesta
alluvium, iv) Coastal, v) Laterite, vi) Red gravely, and vii)
Brown forest. And thereafter, considering the minimum
variability in rainfall, temperature, soil types, and
topography of lands the landscape of West Bengal is
broadly categorized into following six agro-climatic
zones. A. Hill zone is comprising of Darjeeling district
(excluding Siliguri sub-division) and northern fringe of
Jalpaiguri districts; B. Terai zone comprises of the plains
of Jalpaiguri and Cooch Behar districts, Siliguri sub-
division of Darjeeling district and Islampur sub-division
of North Dinajpur district; C. Old alluvial zone includes of
western part of Murshidabad and Hooghly districts,
eastern part of Birbhum and Bankura districts, central part
of Burdwan and Midnapore, and northern part of Howrah
district; D. New alluvial zone is consisting of Nadia
district and parts of Malda, West Dinajpur, Murshidabad,
Burdwan, Hooghly and northern part of North and South
24-Parganas district; E. Red and Lateritic zone is
comprising of Purulia, Birbhum, Bankura and western
part of Burdwan and Midnapore districts; and F. Coastal
saline zone covers the southern part of North and South
24-Parganas district, and the parts of Howrah and
Midnapore districts2.
A look to the above classification of geographical area in
agro-climatic zoning reveals only a gross demarcation as
the demarcation has been made on the basis of
administrative division of the geographical area which is
not in conformity with the classification of planning area.
Thus, it is very difficult to examine accurately the
variability in cropping system and cropping pattern
between the zones and invariability of the same within a
2 Zonal Research Station, BCKV, North Bengal Campus,
Pundibari, Cooch Behar, Status Report, Vol. I for
launching National Agricultural Research Project (NARP),
Chapter I, 1993.
zone itself at a particular point of time by using data
which is available for administrative demarcation of area
namely district. Moreover, the disaggregated data on area
and yield rate of the crops at administrative sub-divisional
level are not available. Considering these lacunae of data
only a broader view can be elicited in the question of
setting cropping system and cropping pattern within a
zone and its inter zonal variability by using
administratively classified district level data.
The agro-climatic zoning by using administratively
classified district and sub-divisional boundary as stated
above and non-availability of relevant data at
disaggregated sub-divisional level or for a part of a
district, keeping in view, the representatives of the three
agro-climatic zones have been taken into consideration for
the present purpose: districts of Burdwan, Hooghly,
Nadia, 24-Parganas (N) and Murshidabad have been taken
into account to represent new alluvial zone; the districts of
Cooch Behar and Jalpaiguri for Terai zone; and Bankura,
Purulia and Birbhum to represent Red and Lateritic zone.
2. Agro-climatic conditions of three selected agro-
climatic zones with special reference to Terai zone:
Soils and climate are the two important natural factors in
explaining natural advantages or disadvantages in the
production of agricultural crops in a particular area under
consideration. Soil means the landscape with its
physiochemical property and the topography. But for the
present purpose only the physical property like texture
(composition of sand, silt and clay in soil) and the broad
chemical characteristics of soil have been dealt with. The
climate includes rainfall, temperature, relative humidity,
solar radiation (sunshine hour) and a host of other
parameters. For the present purpose the important
parameters namely rainfall, temperature, and relative
humidity have been taken into consideration.
2.1 Rainfall and Growing of Summer Vegetables and
Winter Crops:
Distribution of monthly rainfall in different districts
corresponding to three selected agro-climatic zones are
shown in Table 1. It is observed that annual rainfall in
terai zone is as high as above 3000 mm while that in New
alluvial and Red lateritic zones is recorded around 1500
mm with minimum variability between themselves. It is
also recorded that average rainfall in terai zone in the
month of April is as high as around 125 mm in contrast to
40-50 mm is noted in other two zones. Thus an adequate
precipitation in pre-monsoon month April is a
characteristic of terai zone in contrast to other zones. In
the other extreme monthly rainfall as recorded in October
is found around 150 mm in terai zone while that for areas
of other two zones is noted below 100 mm. This indicates
prolongation of monsoon in terai areas in comparison with
the areas of other two zones.

International Journal of Management and Social Sciences Research (IJMSSR) ISSN: 2319-4421 Volume 2, No. 8, August 2013
i-Xplore International Research Journal Consortium www.irjcjournals.org
17
The observed adequate pre-monsoon shower in terai zone
is favourable for raising summer vegetables with
minimum cost of irrigation. But at the same time, this pre-
monsoon shower occasionally acts as a constraint to have
a good harvest of wheat. On the other hand, prolongation
of precipitation upto October and even in early part of
November and thereby maintaining high soil moisture
content even upto to the end of November is used to act as
an important barrier in raising high yield potential variety
of mustard and at the same time this favors sowing of
wheat without letting pre-sowing irrigation.
2.2. Temperature and Growing of Thermosensitive
Crops:
Mean maximum and mean minimum temperature with
respect to different month corresponding to the districts of
three selected agro-climatic zones are cited in Table 2 and
weekly mean maximum and mean minimum temperature
for the terai districts are shown by Table 3. A careful
examination of Table 2 and Table 3 reveals that maximum
temperature prevailing from the month of October to the
month of April does not exceed 31oC in terai districts.
While in other parts of the state the maximum temperature
exceeds 31oC before beginning the month of March. The
minimum temperature is used to prevail around 9-20oC
from October to April for terai zone while that in other
parts, that range of minimum temperature is recorded
from November to March. It indicates that the terai zone
offers an interval of seven months as against five months
for other zones in growing such thermosensitive winter
crops suitable to thrive well with the above range of
maximum and minimum temperature. A look to the Table
4 and comparing it with aforesaid time interval of
maximum and minimum temperature it has been
conspicuous that the crops namely wheat, potato, tomato,
brinjal, chilli, cabbage, cauliflower and radish and similar
other host of winter vegetable crops can get longer time
for growth and development in terai zone as compared to
that for other parts of the state under consideration. It is
also reported by the farmers that two consecutive cole
crops or raising of wheat after harvesting early cole
crops can be successfully grown in terai zone by taking
the above temperature advantage.
Cole crops include Cabbage, Cauliflower, Knolkhol, etc.

International Journal of Management and Social Sciences Research (IJMSSR) ISSN: 2319-4421 Volume 2, No. 8, August 2013
i-Xplore International Research Journal Consortium www.irjcjournals.org
18
.
Table 1: Rainfall by districts and months in West Bengal (Ten years’ average ending 2000)
(Milimeter)
District
Agro-
climati
c
Zone
Month
Januar
y
Februar
y
Marc
h
Apri
l May June July
Augus
t
Septembe
r
Octobe
r
Novembe
r
Decembe
r Total
(1) (2) (3) (4) (5) (6) (7) (8) (9) (10) (11) (12) (13) (14) (15)
Burdwan
New
Alluvia
l
16.7 31.5 27.2 48.1 108.
1
207.
1
306.
9 298.1 291.7 86.6 23.3 15.6
1461.
3
Hooghly 19.3 31.2 38.4 48.6 105.
0
217.
2
316.
2 274.4 260.8 99.4 30.4 4.9
1445.
8
Nadia 17.2 33.3 31.5 37.5 122.
2
230.
6
301.
3 268.2 255.1 89.1 23.9 11.2
1421.
1
Murshidabad 10.1 24.1 19.8 48.0 120.
9
233.
1
315.
2 269.8 307.2 95.7 17.0 11.0
1471.
9
24-PGS
(North+South
)
16.3 27.1 43.5 51.7 137.
2
260.
8
386.
5 346.0 323.5 130.1 50.4 5.4
1778.
5
Cooch Behar
Terai
15.4 12.1 27.6 125.
1
302.
7
581.
5
770.
5 553.5 413.0 134.6 8.5 7.1
2951.
6
Jalpaiguri 16.8 18.7 30.2 124.
6
386.
5
744.
6
966.
8 687.2 468.8 167.4 19.4 9.1
3640.
1
Bankura
Red
and
Lateriti
c
19.3 27.4 21.6 45.8 93.9 225.
7
314.
6 293.4 243.1 88.9 30.4 14.9
1419.
0
Purulia 22.8 25.3 21.4 21.4 75.0 246.
8
312.
7 276.7 283.1 72.1 24.7 15.9
1397.
9
Birbhum 12.5 22.7 18.7 42.8 87.8 213.
1
332.
1 332.5 352.4 89.5 23.3 9.8
1537.
2
Source: Agricultural Meteorologist, Directorate of Agriculture, Government of West Bengal.

International Journal of Management and Social Sciences Research (IJMSSR) ISSN: 2319-4421 Volume 2, No. 8, August 2013
i-Xplore International Research Journal Consortium www.irjcjournals.org
19
Table 2: Mean temperature (in degree Celsius) by month in West Bengal (10 years’ average ending 1994)
District
Agro-
climatic
Zone
Month
January February March April May June July August September October November December
Max Min Max Min Max Min Max Min Max Min Max Min Max Min Max Min Max Min Max Min Max Min Max Min (1) (2) (3) (4) (5) (6) (7) (8) (9) (10) (11) (12) (13) (14) (15) (16) (17) (18) (19) (20) (21) (22) (23) (24) (25) (26)
Calcutta
New
All
uvia
l
25.9 14.0 29.1 17.6 33.5 22.1 35.7 25.5 35.1 26.2 34.0 26.5 32.0 26.1 32.2 26.2 32.3 25.8 32.4 23.0 29.9 19.8 27.0 16.5
Krishna-
nagar
(Nadia)
26.3 11.0 28.9 14.8 32.7 20.3 36.1 25.1 37.0 26.3 35.5 27.1 33.3 18.2 33.1 28.0 33.4 25.5 33.0 23.7 30.4 18.6 28.0 13.2
Berham-
pur
(Murshi-
dabad)
25.6 13.1 28.4 16.5 33.9 19.4 37.1 23.2 36.4 25.0 33.9 26.1 32.0 25.9 32.7 26.3 33.1 25.7 32.1 23.2 30.7 18.7 27.8 14.7
Burdwan 24.2 8.7 29.4 13.7 33.6 19.7 36.4 22.7 37.5 24.3 33.5 25.8 31.6 26.3 32.0 27.5 32.5 27.0 31.3 22.0 28.6 17.0 26.4 12.0
Cooch
Behar
Ter
ai 23.6 9.3 25.5 11.7 29.5 15.7 31.2 19.7 31.0 21.8 31.3 24.4 31.0 24.4 32.3 25.0 31.2 24.6 30.2 20.6 28.2 16.5 25.4 10.7
Jalpaiguri 24.0 10.2 26.1 11.7 30.2 15.4 31.4 19.8 19.6 19.3 33.2 22.8 33.3 22.9 32.3 23.2 32.2 23.2 31.3 21.3 29.7 14.8 26.3 12.3
Bankura
Red
and
Lat
erit
ic
25.1 11.4 27.5 16.0 31.0 19.6 37.4 24.8 37.9 26.4 36.4 25.7 32.6 25.6 31.9 25.0 32.6 25.9 31.6 23.4 28.1 19.4 25.4 13.9
Purulia 24.8 11.0 28.4 13.1 33.2 18.3 37.3 22.6 38.0 23.6 34.6 24.8 32.2 24.0 31.6 24.8 31.3 23.2 30.8 20.2 28.5 15.5 25.7 11.7
Suri
(Birbhum) 25.1 11.6 28.4 14.9 33.6 19.1 37.1 22.9 36.1 24.8 34.2 25.7 32.4 25.7 32.4 25.9 31.9 25.3 31.5 22.2 29.0 17.5 26.1 13.1
Source: Meteorological Department, Government of India.

International Journal of Management and Social Sciences Research (IJMSSR) ISSN: 2319-4421 Volume 2, No. 8, August 2013
i-Xplore International Research Journal Consortium www.irjcjournals.org
20 20
Table 3: Weekly mean of maximum and minimum daily temperature recorded at Cooch Behar (1981-90) and
Jalpaiguri (1976-85) stations (in degree Celsius).
Week No Month Maximum Temperature (
0C) Minimum Temperature (
0C)
Cooch Behar Jalpaiguri Cooch Behar Jalpaiguri
(1) (2) (3) (4) (5) (6)
1
January
23.25 25.16 9.83 6.95
2 23.51 24.27 10.07 6.96
3 23.19 23.55 10.22 7.09
4 23.69 24.30 9.97 7.47
5
February
24.52 24.89 10.60 7.74
6 23.77 25.32 10.99 8.36
7 25.33 26.40 12.35 9.37
8 25.49 27.27 12.55 10.54
9
March
26.84 28.29 13.15 10.59
10 28.18 29.52 14.81 11.16
11 28.73 30.56 15.12 11.80
12 30.18 31.41 16.76 11.61
13 30.11 31.85 16.82 12.65
14
April
31.18 32.53 18.76 14.01
15 31.48 32.96 20.14 14.99
16 30.15 32.42 20.15 15.40
17 30.05 32.67 20.34 16.70
18
May
29.87 33.20 20.86 18.57
19 30.98 33.67 21.67 20.22
20 31.26 34.26 23.09 20.85
21 31.26 34.04 23.32 20.65
22 30.82 34.96 23.86 22.03
23
June
32.20 33.85 23.34 21.49
24 30.90 33.51 24.42 21.37
25 31.31 33.43 24.58 21.47
26 31.26 33.59 25.51 22.78
International Journal of Management and Social Sciences Research (IJMSSR) ISSN: 2319-4421 Volume 2, No. 8, August 2013
i-Xplore International Research Journal Consortium www.irjcjournals.org
21 21
Table 3 Contd.
Week
No Month
Maximum Temperature (0C) Minimum Temperature (
0C)
Cooch Behar Jalpaiguri Cooch Behar Jalpaiguri
(1) (2) (3) (4) (5) (6)
27
July
30.64 32.06 24.86 22.03
28 31.06 31.94 24.95 20.31
29 30.92 29.34 24.87 20.57
30 29.58 27.24 24.64 20.03
31
August
31.11 32.32 25.26 23.25
32 32.39 32.90 25.82 23.18
33 31.82 33.20 25.68 22.99
34 30.85 32.04 24.99 22.20
35 30.38 32.20 24.74 22.33
36
September
30.00 31.36 24.41 21.96
37 29.59 31.24 24.12 21.50
38 30.19 31.06 23.85 21.48
39 30.63 31.60 23.87 22.43
40
October
30.65 31.23 23.67 19.66
41 30.36 31.36 22.99 18.89
42 29.83 30.58 21.55 16.88
43 29.80 30.45 20.05 16.80
44
November
29.76 30.12 18.50 15.67
45 28.19 29.18 17.16 14.22
46 28.45 29.11 15.50 13.13
47 28.20 28.49 14.48 11.86
48
December
27.30 27.54 13.26 11.20
49 26.40 26.73 12.44 11.65
50 24.99 26.27 12.11 9.32
51 24.83 25.51 11.20 8.29
52 23.79 24.16 10.34 7.95
Source: State Department of Agriculture

International Journal of Management and Social Sciences Research (IJMSSR) ISSN: 2319-4421 Volume 2, No. 8, August 2013
i-Xplore International Research Journal Consortium www.irjcjournals.org
22 22
Table 4: Temperature Requirement for Better Growth and Development of Winter Crops
Crops Optimum Temperature (0C) Maximum Temperature (
0C)
(1) (2) (3)
Wheat 15-20 25
Potato 17-20 (For Tuberization)
25 (For Germination) 30
Tomato 15-20 32
Brinjal 13-21 30
Chilli 20-25 30
Cabbage and Cauliflower 15-20 25
Radish 20-25 25
Source:
1. Reddy, S.R. ‘Agronomy of Field Crops’, Kalyani Publishers, 2006.
2. Bose, T.K. and Som, M.G. ‘Vegetable Crops in India’, Naya Prokash Publishers, 1986.
3. Singh, S.S. ‘Crop Management’, Kalyani Publishers, 1998.
2.3 Soil, and Relative Humidity and Their Effects on
Growth of Crops:
The texture of most of the soils in Terai districts ranges
from sandy to sandy loam as against loamy to clayey loam
in other parts of the state. The high porosity of the soil
inter alia lower depth of sub-soil water makes it possible
to supply high evapotranspirative water in the rhizosphere
of most of the aerable crops grown during the dry season
(November to March) in terai districts. As a consequence,
the crops like wheat, mustard, pulses and all winter
vegetables can successfully be grown with minimum
irrigation and even in some cases the crops wheat, mustard
and pulses are used to be grown without letting irrigation.
As for example, wheat is grown in terai without letting any
pre-sowing irrigation while in other parts of the state pre-
sowing irrigation in wheat is must for germination of
seeds. The crops mustard and pulses are mostly grown
with one irrigation in terai by using available soil moisture
and winter rains while this practice is rarely seen in other
parts of the state. The light soil of terai zone is more
favourable for growth and development of tuber, root and
bulbous crops. In the counter part light soil having low
water holding capacity is unfavorable for growth and
development of rice crops. In case of summer rice the cost
of irrigation in terai is found very high as compared to that
of other parts of state due to high frequency of letting
irrigation because of low water retention capacity of the
soil.
Distribution of monthly mean maximum relative humidity
in selected stations falling under three different agro-
climatic zones is depicted Table 5 and weekly mean
maximum and mean minimum daily relative humidity in
Cooch Behar and Jalpaiguri stations is shown in Table 6.
It appears from Table 5 and Table 6 that the relative
humidity is exceedingly higher every time in Cooch Behar
district than in other parts of the state. But in Jalpaiguri
district comparatively higher relative humidity is observed
in winter months (November to April). High relative
humidity favours outbreak of some important crop
diseases and infestation of insect-pests. High soil moisture
also plays an important role in favouring of outbreak of
some disease and pest infestation. Some important crop
diseases and insect-pests causing economic damage to
crops due to prevalence of high relative humidity in
association with other climatic factors as observed in terai
districts are summarized in Table 7. From an account of
diseases and insect-pests causing economic damage due to
prevalence of high relative humidity in association with
other natural factors as shown in Table 7 and the
advantages and disadvantages of rainfall, temperature and
soil in growth and development of the crops grown in terai
zone discussed in earlier sections, keeping in view, one
may plausibly come to the following contention by
balancing the effect of favourable and unfavourable
natural factors prevalent in terai zone. The terai districts
have an edge over other parts of the state in respect of
natural advantages of growing wheat as a major cereal
crop and growing cabbage and cauliflower among the
important vegetable crops. Soil and other weather
parameters are found to be most disadvantageous for a
good harvest of rice crop in terai zone both in terms of
physical and economic returns. The crops like potato,
tomato and chilli in terai zone are observed to have natural
advantages in terms of prolongation of prevailing
optimum temperature but at the same time high relative
humidity in association with other natural factors causing
economic damage due to disease and pest attack are found
to have natural disadvantages. Here, one may raise
question as what would be the net effect of balancing

International Journal of Management and Social Sciences Research (IJMSSR) ISSN: 2319-4421 Volume 2, No. 8, August 2013
i-Xplore International Research Journal Consortium www.irjcjournals.org
23 23
natural advantages and disadvantages in growing these
crops in terai zone where diseases like late blight and soft
rot in potato, late blight in tomato, and phomopsis blight
and leaky fruit rot in brinjal and the insect-pests like fruit
borer and leaf miner in tomato, shoot and fruit borer in
brinjal can be controlled by taking suitable control
measure in time. It is reported by the sample farmers and
also corroborated by the agricultural experts that the
weather conditions in many years would become such that
effective control measures could not be taken by the
farmers to save potato and tomato crops effectively from
the attack of late blight. And the disease bacterial wilt is
very difficult to control. By considering reportedly inter
year fluctuation of physical and economic return of potato
and tomato in terai zone it reasonably be asserted that
expansion of these two crops can be done upto a certain
limit and other relatively assured crops like wheat,
cabbage and cauliflower are to be grown along with as a
measure of risk aversion. Similar conclusion may
reasonably be drawn in case of Chilli. Rainfall in the
month of October and even in the first part of November
and thereby high soil moisture content acts as an
important barrier in sowing mustard within November and
thereafter low soil temperature constraining germination
of seed and growth of the crop are experienced to have a
considerable impact to obtain relatively low yield of
mustard in terai zone. High moisture content of the soil
and the adequate rainfall in the pre-monsoon month
(April) are the advantages of growing summer vegetables
in terai zone.

International Journal of Management and Social Sciences Research (IJMSSR) ISSN: 2319-4421 Volume 2, No. 8, August 2013
i-Xplore International Research Journal Consortium www.irjcjournals.org
24
Table 5: Mean Maximum Relative humidity by month in West Bengal (10 years average ending 1994)
(Percent)
District
Agro-
climatic
Zone
Month
January February March April May June July August September October November December
(1) (2) (3) (4) (5) (6) (7) (8) (9) (10) (11) (12) (13) (14)
Calcutta
**New
Alluvial
76.10 69.30 67.00 70.80 73.70 79.10 84.00 83.30 81.60 76.50 70.90 74.44
Krishnanagar
(Nadia) 69.29 62.25 60.63 54.13 54.43 56.14 63.57 60.00 60.71 66.00 71.33 66.50
Berhampur
(Murshidabad) 80.30 72.20 64.60 72.40 79.00 86.60 90.60 89.10 88.70 84.90 78.20 78.70
Burdwan 78.25 58.80 51.40 58.40 74.40 83.40 86.40 86.60 86.60 85.75 78.20 80.20
Cooch Behar
*Terai
95.05 92.73 85.56 83.39 87.53 91.93 94.03 91.37 93.14 89.89 87.89 93.32
Jalpaiguri 75.66 79.34 73.64 72.50 71.94 76.75 90.20 82.92 87.29 82.03 80.17 79.76
Bankura
**Red
and
Lateritic
75.14 67.71 60.44 59.78 60.00 83.29 86.00 88.29 80.00 77.30 74.13 75.56
Purulia 71.30 63.70 53.20 47.40 61.10 74.30 84.70 86.70 84.60 79.00 70.30 73.50
Suri
(Birbhum) 76.90 65.80 57.90 59.00 74.00 81.00 87.20 87.20 86.60 82.70 77.00 77.00
Source:
* Zonal Research Station, National Agricultural Research Project (NARP), BCKV, Terai Zone, Pundibari, Status Report, Vol. I, 1993.
** Meteorological Department, Government of India.

International Journal of Management and Social Sciences Research (IJMSSR) ISSN: 2319-4421 Volume 2, No. 8, August 2013
i-Xplore International Research Journal Consortium www.irjcjournals.org
25 25
Table 6: Weekly mean of maximum and minimum daily relative humidity recorded at Cooch Behar (1981-90)
and Jalpaiguri (1976-85) stations (in per cent).
Week
No Month
Maximum Relative humidity Minimum Relative humidity
Cooch Behar Jalpaiguri Cooch Behar Jalpaiguri
(1) (2) (3) (4) (5) (6)
1
January
95.33 73.44 61.42 45.68
2 94.26 73.68 55.83 50.30
3 95.52 77.02 53.51 50.26
4 95.08 78.50 48.24 53.45
5
February
94.20 76.43 50.24 51.93
6 93.54 79.34 45.04 53.43
7 93.35 81.19 46.60 52.29
8 89.84 80.39 46.44 52.73
9
March
90.40 76.23 45.97 46.65
10 87.39 76.64 45.25 42.25
11 85.15 74.50 46.92 39.12
12 84.33 70.57 51.16 38.47
13 80.51 70.26 48.63 37.89
14
April
81.18 71.87 45.70 39.26
15 81.67 70.66 50.15 43.84
16 84.22 75.31 59.42 47.09
17 86.51 72.15 65.33 47.97
18
May
88.10 65.55 66.56 51.20
19 86.32 74.90 64.30 52.19
20 86.04 71.30 68.23 51.60
21 87.04 73.95 70.63 57.18
22 90.14 73.99 71.56 54.80
23
June
90.97 75.01 75.02 56.72
24 91.93 77.24 75.90 61.60
25 91.88 78.34 77.32 62.30
26 92.95 76.42 79.99 62.03

International Journal of Management and Social Sciences Research (IJMSSR) ISSN: 2319-4421 Volume 2, No. 8, August 2013
i-Xplore International Research Journal Consortium www.irjcjournals.org
26 26
Table 6 Contd.
Week
No Month
Maximum Relative humidity Minimum Relative humidity
Cooch Behar Jalpaiguri Cooch Behar Jalpaiguri (1) (2) (3) (4) (5) (6)
27
July
95.06 83.78 82.53 67.20
28 92.82 86.55 79.17 69.81
29 93.23 95.42 77.64 83.29
30 95.03 95.06 84.77 83.67
31
August
91.73 81.31 76.44 65.93
32 89.67 80.56 73.66 65.96
33 88.73 82.20 74.61 68.53
34 94.05 84.29 82.58 71.40
35 92.67 86.23 76.99 74.07
36
September
93.75 86.10 81.06 76.38
37 95.17 86.07 80.88 77.99
38 92.52 87.98 76.90 76.94
39 91.12 87.00 73.60 75.09
40
October
91.79 82.50 70.53 70.50
41 90.75 83.74 69.68 69.07
42 88.08 80.44 65.56 67.87
43 89.00 81.44 61.10 68.53
44
November
35.28 79.57 55.65 68.17
45 89.69 81.56 55.76 68.07
46 87.20 79.65 53.30 63.37
47 89.39 79.89 51.35 62.76
48
December
91.87 78.87 84.29 58.80
49 93.07 77.83 49.15 49.70
50 93.66 79.12 52.99 53.88
51 93.36 79.53 51.64 56.47
52 94.62 83.45 54.50 56.59
Source: State Department of Agriculture

International Journal of Management and Social Sciences Research (IJMSSR) ISSN: 2319-4421 Volume 2, No. 8, August 2013
i-Xplore International Research Journal Consortium www.irjcjournals.org
27 27
Table 7: Diseases and Insect-pests causing Economic Damage of the Cops prevalent in Terai-Zone in contrast to
Other Parts of the State.
Crop Crop disease
/ Insect-pest
High relative humidity (RH) / high soil moisture / rainfall
for out break (1) (2) (3)
Rice
Disease i) Sheath blight High relative humidity with intermittent rainfall
ii) Blast High relative humidity
Insect-
pests
i) Leaf folder High relative humidity with prolonged dry spell
ii) Case worm High relative humidity associated with high rainfall
iii) Gall midge High relative humidity with cloudy weather and drizzling
rain
Mustard Disease
i) Leaf spot & blight High relative humidity
ii) Downey mildew High relative humidity
iii) White rust High relative humidity
Pests i) Aphid High relative humidity with cool and cloudy weather
Potato Disease
i) Late blight High relative humidity associated with light rain
ii) Soft rot High Soil moisture
iii) Bacterial wilt High Soil moisture
Tomato
Disease i) Late blight High relative humidity associated with light rain
ii) Bacterial wilt High Soil moisture
Pests i) Fruit borer High relative humidity
ii) Leaf miner High relative humidity
Brinjal
Disease
i) Bacterial wilt High Soil moisture
ii) Phomopsis blight High relative humidity at the later part of winter
iii) Leaky fruit rot High relative humidity associated with high rainfall in rainy
crops
Insect i) Shoot & fruit borer High relative humidity in rainy crops
Ladies
Finger Pest i) Fruit borer High relative humidity associated with high rainfall
Chilli Disease
i) Dieback High relative humidity with intermittent rainfall
ii) Ripe fruit rot High relative humidity with intermittent rainfall
Reference:
1. Singh, R.S. (2005) ‘Plant Diseases’, Oxford 1BH Publishing Co. Pvt. Ltd.
2. Rangaswami, G. and Mahadevan, A. (2005) ‘Diseases of Crop Plants in India’, Prentice Hall of India Pvt. Ltd.
3. Alwal, A.S. and Dhaliwal, G.S. (2005) ‘Agricultural Pests of South Asia and Their Management’, Kalyani Publishers,
Ludhina, New Delhi.
4. Panwar, V.P.S. (2002) ‘Agricultural Insect-Pests of Crops and Their Control’, Kalyani Publishers.
5. Srivastava, K.P. (2003) ‘A Text book of Applied Entomology’, Kalyani Publishers.
3. Crops and Cropping Pattern in three selected Agro-
climatic zones: A Comparative
Analysis
It appears that net cropped area (NCA) over the decade
ending 2002-03 is recorded by and large invariant and
thus area of a particular crop as proportion to net cropped
area over a period represents the relative position of that
crop in crop profile. To understand the change in relative
position of the individual crop over the period of decade

International Journal of Management and Social Sciences Research (IJMSSR) ISSN: 2319-4421 Volume 2, No. 8, August 2013
i-Xplore International Research Journal Consortium www.irjcjournals.org
28 28
ending 2002-03 percentages of individual crop area to net
cropped area at two points of time i.e. triennium ending
1992-93 and triennium ending 2002-03 have been
calculated for the state level and for the selected zones
viz. New Alluvial zone, Terai zone, Red and Lateritic
zone, and presented by Table 8 through Table 11. Yield
rates at two points of time and their percentage change for
the individual crops have also been calculated for the state
and for the above three zones and shown by Table 12
through 15. Dwindling the relative position of autumn rice
and winter rice and increasing position of summer rice
and wheat and in effect, the increasing relative position of
principal cereal crops experienced at the state level is also
true for New alluvial, Red and lateritic zone while in Terai
zone relative position of principal cereal crops is noted to
be declined despite having similarity in trend of relative
position of autumn rice, winter rice, summer rice and
wheat. By comparing a relative change in yield rate of the
principal cereal crops between three agro-climatic zones
over the period the possibility of decelerating the relative
importance of cereal crops in Terai zone due to decreasing
its relative profitability (as reflected through yield rate) is
ruled out.
Table 8: Crops and Cropping Pattern in West Bengal.
Crops
West Bengal
% of net cropped area
1st Period (Mean value of
Triennium ending 1992-93)
2nd
Period (Mean value of
Triennium ending 2002-03)
(1) (2) (3)
1. Autumn rice 10.27 7.27
2. Winter rice 78.41 73.23
3. Summer rice 16.42 26.23
4. Wheat 4.82 7.78
5. Principal cereal crops 109.92 114.52
6. Rabi pulses (gram+lentil+rabi mung+rabi
maskalai) 2.59 2.56
7. Kharif and summer pulses (summer mung &
Khesari) 2.28 1.80
8. Total pulses 5.24 4.71
9. Total foodgrain crops 116.73 120.22
10. Rape & Mustard 7.22 7.90
11. Summer Til 1.79 1.95
12. Total oilseeds 9.81 10.90
13. Jute 9.56 11.70
14. Sugarcane (gur) 0.27 0.40
15. Winter potato 3.89 5.79
16. Onion - 0.263
17. Bhadoi chillies 0.24 0.33
18. Rabi chillies 0.71 0.81
19. Total chillies 0.94 1.13
20. Winter vegetable crops* NA 5.42
21. Summer & rainy vegetable crops** NA 4.16
NA: Not Available
* Winter vegetable crops include cabbage, cauliflower, tomato, brinjal and radish.
** Summer and rainy vegetable crops include brinjal, cucurbits, ladies finger and sweet potato.

International Journal of Management and Social Sciences Research (IJMSSR) ISSN: 2319-4421 Volume 2, No. 8, August 2013
i-Xplore International Research Journal Consortium www.irjcjournals.org
29
Table 9: Crops and Cropping Pattern in Selected Districts of New Alluvial zone.
Crops
Hooghly Burdwan Nadia 24-PGS (North) Murshidabad Sub-Total % of net cropped area % of net cropped area % of net cropped area % of net cropped area % of net cropped area % of net cropped area 1st Period
(Mean
value of
Triennium
ending
1992-93)
2nd Period
(Mean
value of
Triennium
ending
2002-03)
1st Period
(Mean
value of
Triennium
ending
1992-93)
2nd Period
(Mean
value of
Triennium
ending
2002-03)
1st Period
(Mean
value of
Triennium
ending
1992-93)
2nd Period
(Mean
value of
Triennium
ending
2002-03)
1st Period
(Mean
value of
Triennium
ending
1992-93)
2nd Period
(Mean
value of
Triennium
ending
2002-03)
1st Period
(Mean
value of
Triennium
ending
1992-93)
2nd Period
(Mean
value of
Triennium
ending
2002-03)
1st Period
(Mean
value of
Triennium
ending
1992-93)
2nd Period
(Mean
value of
Triennium
ending
2002-03)
1. Autumn rice 5.98 3.39 6.83 4.62 20.68 18.34 8.27 10.14 17.65 12.77 12.01 9.71
2. Winter rice 87.21 71.76 89.11 81.64 41.59 31.90 66.66 66.17 54.73 45.74 68.39 60.39
3. Summer rice 28.42 42.70 24.61 45.69 33.36 51.67 28.17 38.21 14.37 28.49 24.74 41.11
4. Wheat 0.65 0.47 0.61 1.12 13.77 19.79 3.08 5.11 21.95 34.53 8.53 12.93
5. Principal cereal
crops 122.26 118.32 121.17 133.08 109.39 121.69 106.18 119.63 108.71 121.54 113.67 124.14
6. Rabi pulses
(gram+lentil+rabi
mung+rabi
maskalai)
0.19 0.16 0.29 0.49 15.91 14.60 3.45 2.57 5.39 9.48 4.77 5.44
7. Kharif and
summer pulses
(summer mung &
Khesari)
0.06 0.13 0.13 0.34 5.94 5.70 1.20 0.75 5.26 3.35 2.56 2.06
8. Total pulses 0.29 0.38 0.43 0.89 22.92 21.28 4.78 3.80 11.51 13.88 7.76 8.02
9. Total foodgrain
crops 122.54 118.71 121.61 134.01 133.52 143.20 110.96 123.44 121.10 135.88 121.86 132.32
10. Rape & Mustard 5.28 5.27 10.84 9.89 19.56 27.93 11.67 15.05 13.88 16.12 12.49 14.78
11. Summer Til 9.61 6.23 2.26 1.06 2.68 5.16 1.81 1.45 0.52 1.11 2.82 2.59
12. Total oilseeds 15.78 13.48 13.25 11.35 24.45 36.43 13.79 17.72 14.75 17.59 15.99 18.63
13. Jute 13.29 13.97 2.92 3.28 43.84 45.64 13.17 22.81 24.22 36.28 18.36 23.26
14. Sugarcane (gur) 0.04 0.18 0.20 0.13 0.62 0.83 0.30 0.50 0.87 1.63 0.43 0.68
15. Winter potato 28.91 36.63 7.71 9.36 0.94 1.34 1.37 2.89 1.63 2.15 6.81 8.98
16. Onion NA 1.029 NA 0.141 NA 0.599 NA 0.433 NA 0.555 NA 0.490
17. Bhadoi chillies 0.08 0.13 0.09 0.15 0.39 0.74 0.29 0.41 0.38 0.67 0.25 0.42
18. Rabi chillies 0.19 0.23 0.21 0.32 0.61 0.76 0.70 0.97 0.27 0.42 0.38 0.51
19. Total chillies 0.27 0.36 0.31 0.46 1.00 1.50 0.98 1.38 0.66 1.09 0.62 0.93 20. Winter
vegetable crops* NA 5.07 NA 2.80 NA 9.68 NA 7.22 NA 8.25 NA 6.34
21. Summer &
rainy vegetable
crops**
NA 6.60 NA 3.16 NA 5.95 NA 6.62 NA 3.52 NA 4.77
NA: Not available *Winter vegetable crops include cabbage, cauliflower, tomato, brinjal and radish ** Summer and rainy vegetable crops include brinjal, cucurbits, ladies finger and sweet potato.
International Journal of Management and Social Sciences Research (IJMSSR) ISSN: 2319-4421 Volume 2, No. 8, August 2013
i-Xplore International Research Journal Consortium www.irjcjournals.org
30
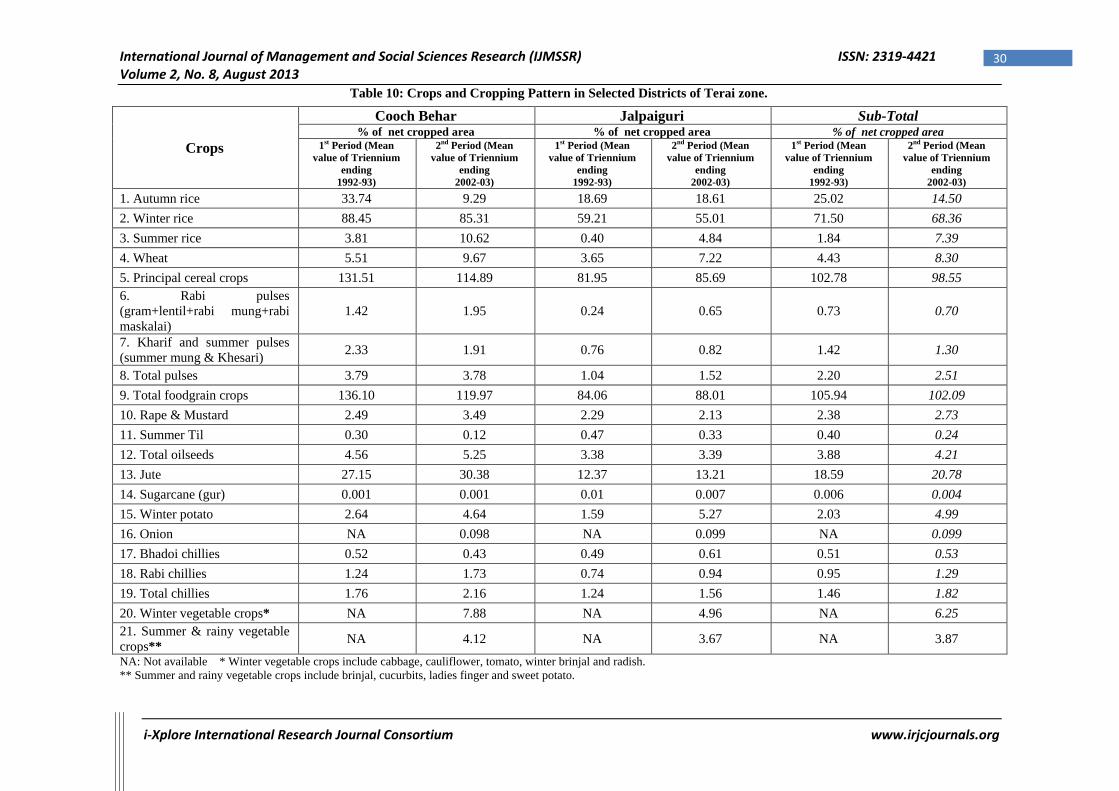
Table 10: Crops and Cropping Pattern in Selected Districts of Terai zone.
Crops
Cooch Behar Jalpaiguri Sub-Total % of net cropped area % of net cropped area % of net cropped area
1st Period (Mean
value of Triennium
ending
1992-93)
2nd Period (Mean
value of Triennium
ending
2002-03)
1st Period (Mean
value of Triennium
ending
1992-93)
2nd Period (Mean
value of Triennium
ending
2002-03)
1st Period (Mean
value of Triennium
ending
1992-93)
2nd Period (Mean
value of Triennium
ending
2002-03)
1. Autumn rice 33.74 9.29 18.69 18.61 25.02 14.50
2. Winter rice 88.45 85.31 59.21 55.01 71.50 68.36
3. Summer rice 3.81 10.62 0.40 4.84 1.84 7.39
4. Wheat 5.51 9.67 3.65 7.22 4.43 8.30
5. Principal cereal crops 131.51 114.89 81.95 85.69 102.78 98.55
6. Rabi pulses
(gram+lentil+rabi mung+rabi
maskalai)
1.42 1.95 0.24 0.65 0.73 0.70
7. Kharif and summer pulses
(summer mung & Khesari) 2.33 1.91 0.76 0.82 1.42 1.30
8. Total pulses 3.79 3.78 1.04 1.52 2.20 2.51
9. Total foodgrain crops 136.10 119.97 84.06 88.01 105.94 102.09
10. Rape & Mustard 2.49 3.49 2.29 2.13 2.38 2.73
11. Summer Til 0.30 0.12 0.47 0.33 0.40 0.24
12. Total oilseeds 4.56 5.25 3.38 3.39 3.88 4.21
13. Jute 27.15 30.38 12.37 13.21 18.59 20.78
14. Sugarcane (gur) 0.001 0.001 0.01 0.007 0.006 0.004
15. Winter potato 2.64 4.64 1.59 5.27 2.03 4.99
16. Onion NA 0.098 NA 0.099 NA 0.099
17. Bhadoi chillies 0.52 0.43 0.49 0.61 0.51 0.53
18. Rabi chillies 1.24 1.73 0.74 0.94 0.95 1.29
19. Total chillies 1.76 2.16 1.24 1.56 1.46 1.82
20. Winter vegetable crops* NA 7.88 NA 4.96 NA 6.25
21. Summer & rainy vegetable
crops** NA 4.12 NA 3.67 NA 3.87
NA: Not available * Winter vegetable crops include cabbage, cauliflower, tomato, winter brinjal and radish.
** Summer and rainy vegetable crops include brinjal, cucurbits, ladies finger and sweet potato.

International Journal of Management and Social Sciences Research (IJMSSR) ISSN: 2319-4421 Volume 2, No. 8, August 2013
i-Xplore International Research Journal Consortium www.irjcjournals.org
31
Table 11: Crops and Cropping Pattern in Selected Districts of Red and Lateritic zone.
Crops
Bankura Purulia Bhirbhum Sub-Total
% of net cropped area % of net cropped area % of net cropped area % of net cropped area
1st Period (Mean
value of
Triennium ending
1992-93)
2nd Period (Mean
value of
Triennium ending
2002-03)
1st Period (Mean
value of
Triennium ending
1992-93)
2nd Period (Mean
value of
Triennium ending
2002-03)
1st Period (Mean
value of
Triennium ending
1992-93)
2nd Period (Mean
value of
Triennium ending
2002-03)
1st Period (Mean
value of
Triennium ending
1992-93)
2nd Period (Mean
value of Triennium
ending 2002-03)
1. Autumn rice 9.73 6.95 1.32 0.75 4.13 1.76 5.29 3.24
2. Winter rice 88.19 91.69 83.65 83.11 89.31 87.44 87.12 87.55
3. Summer rice 9.72 13.01 0.65 0.32 8.25 20.79 6.40 11.67
4. Wheat 2.10 2.64 0.42 1.16 3.33 8.02 1.96 4.00
5. Principal cereal crops 109.74 114.29 86.03 85.34 105.01 118.01 100.77 106.47
6. Rabi pulses
(gram+lentil+rabi mung+rabi
maskalai)
0.19 0.07 0.56 0.14 1.51 4.22 0.73 1.42
7. Kharif and summer pulses
(summer mung & Khesari) 0.44 0.10 4.36 3.86 0.90 0.92 1.82 1.56
8. Total pulses 0.84 0.34 5.90 4.86 2.57 5.37 2.99 3.47
9. Total foodgrain crops 111.32 114.95 96.41 94.17 107.96 123.58 105.55 111.36
10. Rape & Mustard 4.95 3.63 0.42 0.15 11.60 10.59 5.66 4.91
11. Summer Til 4.14 3.45 0.05 0.04 0.56 0.39 1.71 1.34
12. Total oilseeds 9.65 7.56 2.53 1.03 12.31 11.14 8.26 6.73
13. Jute 0.10 0.05 - - 0.07 0.10 0.06 0.05
14. Sugarcane (gur) 0.05 0.005 0.23 0.28 0.50 0.27 0.25 0.18
15. Winter potato 4.38 6.14 0.39 0.35 2.17 3.64 2.42 3.47
16. Onion NA 0.226 NA 0.128 NA 0.183 NA 0.181
17. Bhadoi chillies 0.10 0.17 0.18 0.18 0.06 0.07 0.11 0.14
18. Rabi chillies 0.12 0.24 0.16 0.17 0.06 0.09 0.11 0.17
19. Total chillies 0.22 0.41 0.34 0.34 0.11 0.17 0.22 0.31
20. Winter vegetable crops* NA 6.04 NA 4.50 NA 3.84 NA 4.81
21. Summer & rainy
vegetable crops** NA 4.81 NA 3.57 NA 3.69 NA 4.04
NA: Not available * Winter vegetable crops include cabbage, cauliflower, tomato, winter brinjal and radish.
** Summer and rainy vegetable crops include brinjal, cucurbits, ladies finger and sweet potato.

International Journal of Management and Social Sciences Research (IJMSSR) ISSN: 2319-4421 Volume 2, No. 8, August 2013
i-Xplore International Research Journal Consortium www.irjcjournals.org
32 32
Table 12: Yield rate (Kg./ha) of Different Crops in West Bengal.
Crops
West Bengal
1st Period (Mean value of
Triennium ending 1992-
93)
2nd
Period
(Mean value of
Triennium ending 2002-
03)
Percentage change of
yield rate over 1st
period
Yield rate Yield rate (1 (2) (3) (4)
1. Autumn rice 1604 1966 22.57
2. Winter rice 1792 2235 24.72
3. Summer rice 3010 3086 2.52
4. Wheat 2122 2298 8.29
5. Principal cereal crops 1971 2417 22.63
6. Rabi pulses (gram+lentil+rabi
mung+rabi maskalai) 699 756 8.15
7. Kharif and summer pulses (summer
mung & Khesari) 644 708 9.94
8. Total pulses 660 735 11.36
9. Total foodgrain crops 1909 2346 22.09
10. Rape & Mustard 789 843 6.84
11. Summer Til 942 844 -10.40
12. Total oilseeds 817 869 3.36
13. Jute* 10.987 13.031 18.60
14. Sugarcane (gur) 6105.0 7349.0 20.38
15. Winter potato 22197 23702 6.78
16. Onion NA 10488 -
17. Bhadoi chillies 632 854 35.13
18. Rabi chillies 839 963 14.78
19. Total chillies 787 932 18.42
20. Winter vegetable crops** NA 21067 -
21. Summer & rainy vegetable
crops*** NA 10626 -
NA: Not Available * Yield rate in bales/ha ** Winter vegetable crops include cabbage, cauliflower, tomato, brinjal and radish ***
Summer and rainy vegetable crops include brinjal, cucurbits, ladies finger and sweet potato.

International Journal of Management and Social Sciences Research (IJMSSR) ISSN: 2319-4421 Volume 2, No. 8, August 2013
i-Xplore International Research Journal Consortium www.irjcjournals.org
33
Table 13: Yield rate (Kg./ha) of Different Crops in Selected Districts of New Alluvial zone.
Crops
Hooghly Burdwan Nadia 24-PGS (North) Murshidabad Sub-Total
1st P
erio
d (
Mea
n v
alu
e of
Tri
enn
ium
en
din
g 1
992
-93)
2n
d P
erio
d
(M
ean
valu
e of
Tri
enn
ium
end
ing 2
002
-03)
Perc
en
tage
chan
ge
of
yie
ld r
ate
over
1st p
erio
d
1st P
erio
d (
Mea
n v
alu
e of
Tri
enn
ium
en
din
g 1
992
-93)
2n
d P
erio
d
(M
ean
valu
e of
Tri
enn
ium
end
ing
2002
-03)
Perc
en
tage
chan
ge
of
yie
ld r
ate
over
1st p
erio
d
1st P
erio
d (
Mea
n v
alu
e of
Tri
enn
ium
en
din
g 1
992
-93)
2n
d P
erio
d
(M
ean
valu
e of
Tri
enn
ium
end
ing
2002
-03)
Perc
en
tage
chan
ge
of
yie
ld r
ate
over
1st p
erio
d
1st P
erio
d (
Mea
n v
alu
e of
Tri
enn
ium
en
din
g 1
992
-93)
2n
d P
erio
d
(M
ean
valu
e of
Tri
enn
ium
end
ing
2002
-03)
Perc
en
tage
chan
ge
of
yie
ld r
ate
over
1st p
erio
d
1st P
erio
d (
Mea
n v
alu
e of
Tri
enn
ium
en
din
g 1
992
-93)
2n
d P
erio
d
(M
ean
valu
e of
Tri
enn
ium
end
ing
2002
-03)
Perc
en
tage
chan
ge
of
yie
ld r
ate
over
1st p
erio
d
1st P
erio
d (
Mea
n v
alu
e of
Tri
enn
ium
en
din
g 1
992
-93)
2n
d P
erio
d
(M
ean
valu
e of
Tri
enn
ium
end
ing
2002
-03)
Perc
en
tage
chan
ge
of
yie
ld r
ate
over
1st p
erio
d
Yield
rate
Yield
rate
Yield
rate
Yield
rate
Yield
rate
Yield
rate
Yield
rate
Yield
rate
Yield
rate
Yield
rate
Yield
rate
Yield
rat
1. Autumn rice 2224 2265 1.84 2427 2507 3.30 1753 2082 18.77 2578 2057 -
20.21 1374 1733 26.13 1852 2036 9.93
2. Winter rice 2193 2570 17.19 2532 2615 3.28 2170 3744 72.53 2067 2231 7.93 2299 2445 6.35 2313 2618 13.19
3. Summer rice 2907 2715 -6.60 2987 3376 13.02 3342 3444 3.05 3158 3137 -0.66 3137 3353 6.88 3112 3257 4.66
4. Wheat 2256 2098 -7.00 1912 2355 23.17 2156 2217 2.83 2245 2247 0.09 2105 2414 14.68 2125 2346 10.40
5. Principal
cereal crops 2361 2612 10.63 2615 2870 9.75 2447 3118 27.42 2401 2506 4.37 2220 2574 15.94 2424 2756 13.70
6. Rabi pulses
(gram+lentil+rabi
mung+rabi
maskalai)
532 573 7.70 507 978 92.90 720 753 4.58 686 681 -0.73 680 730 7.35 700 742 6.00
7. Kharif and
summer pulses
(summer mung &
Khesari)
418 530 26.79 739 905 22.46 551 608 10.34 493 691 40.16 779 760 -2.44 663 685 3.32
8. Total pulses 579 620 7.08 579 924 59.58 662 711 7.40 630 689 8.36 711 743 4.50 675 729 8.00
9. Total
foodgrain crops 2344 2605 11.13 2608 2857 9.55 2126 2448 15.14 2325 2450 5.38 2068 2381 15.13 2306 2571 11.50
10. Rape &
Mustard 897 706
-
21.29 739 887 20.03 913 814
-
10.84 967 801
-
17.17 787 908 15.37 844 845 0.12
11. Summer Til 984 780 -
20.73 674 770 14.24 996 978 -1.80 1059 1002 -5.38 649 825 27.12 910 874 -3.96

International Journal of Management and Social Sciences Research (IJMSSR) ISSN: 2319-4421 Volume 2, No. 8, August 2013
i-Xplore International Research Journal Consortium www.irjcjournals.org
34
Table 13 Contd.
Crops
Hooghly Burdwan Nadia 24-PGS (North) Murshidabad Sub-Total
1st P
erio
d (
Mea
n v
alu
e of
Tri
enn
ium
en
din
g 1
992
-93)
2n
d P
erio
d
(M
ean
valu
e of
Tri
enn
ium
end
ing 2
002
-03)
Perc
en
tage
chan
ge
of
yie
ld r
ate
over
1st p
erio
d
1st P
erio
d (
Mea
n v
alu
e of
Tri
enn
ium
en
din
g 1
992
-93)
2n
d P
erio
d
(M
ean
valu
e of
Tri
enn
ium
end
ing 2
002
-03)
Perc
en
tage
chan
ge
of
yie
ld r
ate
over
1st p
erio
d
1st P
erio
d (
Mea
n v
alu
e of
Tri
enn
ium
en
din
g 1
992
-93)
2n
d P
erio
d
(M
ean
valu
e of
Tri
enn
ium
end
ing 2
002
-03)
Perc
en
tage
chan
ge
of
yie
ld r
ate
over
1st p
erio
d
1st P
erio
d (
Mea
n v
alu
e of
Tri
enn
ium
en
din
g 1
992
-93)
2n
d P
erio
d
(M
ean
valu
e of
Tri
enn
ium
end
ing 2
002
-03)
Perc
en
tage
chan
ge
of
yie
ld r
ate
over
1st p
erio
d
1st P
erio
d (
Mea
n v
alu
e of
Tri
enn
ium
en
din
g 1
992
-93)
2n
d P
erio
d
(M
ean
valu
e of
Tri
enn
ium
end
ing 2
002
-03)
Perc
en
tage
chan
ge
of
yie
ld r
ate
over
1st p
erio
d
1st P
erio
d (
Mea
n v
alu
e of
Tri
enn
ium
en
din
g 1
992
-93)
2n
d P
erio
d
(M
ean
valu
e of
Tri
enn
ium
end
ing 2
002
-03)
Perc
en
tage
chan
ge
of
yie
ld r
ate
over
1st p
erio
d
Yield
rate
Yield
rate
Yield
rate
Yield
rate
Yield
rate
Yield
rate
Yield
rate
Yield
rate
Yield
rate
Yield
rate
Yield
rate
Yield
rate
12. Total
oilseeds 981 870 -11.31 732 897 22.54 947 872 -7.92 990 849 -14.24 775 898 15.87 869 879 1.15
13. Jute* 15.181 18.664 22.94 14.686 19.522 32.93 13.351 13.844 3.70 12.394 14.829 19.65 12.590 13.812 9.71 13.22 14.62 10.59
14.
Sugarcane
(gur)
4600 9797.6 112.99 7869.4 6560.2 -16.64 5811.3 7141.3 22.89 5936.0 7087.7 19.40 6002.4 6949.0 15.77 6170.8 7089.9 14.90
15. Winter
potato 25282 21624 -14.47 24742 280.12 13.22 18063 24938 38.06 17085 21733 27.20 18852 23356 23.90 24283 23731 -2.27
16. Onion NA 12103 - NA 9406 - NA 10181 - NA 10845 - NA 5408 - NA 9491 -
17. Bhadoi
chillies 1075 605 -43.72 715 818 14.40 595 915 53.78 612 868 41.83 994 1348 35.61 782 1050 34.27
18. Rabi
chillies 652 753 15.49 1237 1232 -0.40 957 1254 31.03 772 1771 129.40 619 1468 137.16 861 1415 64.34
19. Total
chillies 775 699 -9.81 1070 1101 2.90 821 1087 32.39 726 1506 107.44 838 1394 66.35 832 1251 50.36
20. Winter
vegetable
crops**
NA 20242 - NA 20867 - NA 21511 - NA 22151 - NA 22787 - NA 21796 -
21. Summer
& rainy
vegetable
crops***
NA 10519 - NA 9612 - NA 11042 - NA 11228 - NA 10461 - NA 10607 -
Not available * Yield rate in bales/ha ** Winter vegetable crops include cabbage, cauliflower, tomato, brinjal and radish.
*** Summer and rainy vegetable crops include brinjal, cucurbits, ladies finger and sweet potato.
International Journal of Management and Social Sciences Research (IJMSSR) ISSN: 2319-4421 Volume 2, No. 8, August 2013
i-Xplore International Research Journal Consortium www.irjcjournals.org
35
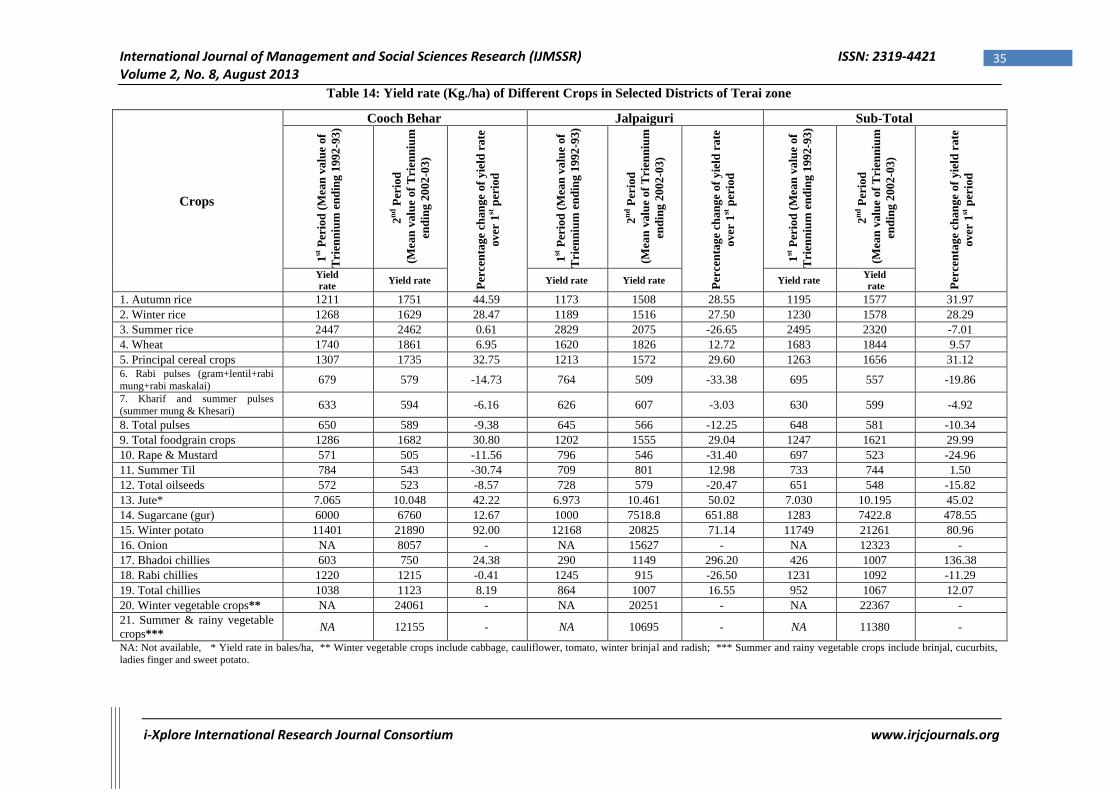
Table 14: Yield rate (Kg./ha) of Different Crops in Selected Districts of Terai zone
Crops
Cooch Behar Jalpaiguri Sub-Total
1st P
erio
d (
Mea
n v
alu
e of
Tri
enn
ium
en
din
g 1
992
-93)
2n
d P
erio
d
(M
ean
valu
e of
Tri
enn
ium
end
ing 2
002
-03)
Perc
en
tage
chan
ge
of
yie
ld r
ate
over
1st p
erio
d
1st P
erio
d (
Mea
n v
alu
e of
Tri
enn
ium
en
din
g 1
992
-93)
2n
d P
erio
d
(M
ean
valu
e of
Tri
enn
ium
end
ing 2
002
-03)
Perc
en
tage
chan
ge
of
yie
ld r
ate
over
1st p
erio
d
1st P
erio
d (
Mea
n v
alu
e of
Tri
enn
ium
en
din
g 1
992
-93)
2n
d P
erio
d
(M
ean
valu
e of
Tri
enn
ium
end
ing 2
002
-03)
Perc
en
tage
chan
ge
of
yie
ld r
ate
over
1st p
erio
d
Yield
rate Yield rate Yield rate Yield rate Yield rate
Yield
rate
1. Autumn rice 1211 1751 44.59 1173 1508 28.55 1195 1577 31.97
2. Winter rice 1268 1629 28.47 1189 1516 27.50 1230 1578 28.29
3. Summer rice 2447 2462 0.61 2829 2075 -26.65 2495 2320 -7.01
4. Wheat 1740 1861 6.95 1620 1826 12.72 1683 1844 9.57
5. Principal cereal crops 1307 1735 32.75 1213 1572 29.60 1263 1656 31.12 6. Rabi pulses (gram+lentil+rabi
mung+rabi maskalai) 679 579 -14.73 764 509 -33.38 695 557 -19.86
7. Kharif and summer pulses
(summer mung & Khesari) 633 594 -6.16 626 607 -3.03 630 599 -4.92
8. Total pulses 650 589 -9.38 645 566 -12.25 648 581 -10.34
9. Total foodgrain crops 1286 1682 30.80 1202 1555 29.04 1247 1621 29.99
10. Rape & Mustard 571 505 -11.56 796 546 -31.40 697 523 -24.96
11. Summer Til 784 543 -30.74 709 801 12.98 733 744 1.50
12. Total oilseeds 572 523 -8.57 728 579 -20.47 651 548 -15.82
13. Jute* 7.065 10.048 42.22 6.973 10.461 50.02 7.030 10.195 45.02
14. Sugarcane (gur) 6000 6760 12.67 1000 7518.8 651.88 1283 7422.8 478.55
15. Winter potato 11401 21890 92.00 12168 20825 71.14 11749 21261 80.96
16. Onion NA 8057 - NA 15627 - NA 12323 -
17. Bhadoi chillies 603 750 24.38 290 1149 296.20 426 1007 136.38
18. Rabi chillies 1220 1215 -0.41 1245 915 -26.50 1231 1092 -11.29
19. Total chillies 1038 1123 8.19 864 1007 16.55 952 1067 12.07
20. Winter vegetable crops** NA 24061 - NA 20251 - NA 22367 -
21. Summer & rainy vegetable
crops*** NA 12155 - NA 10695 - NA 11380 -
NA: Not available, * Yield rate in bales/ha, ** Winter vegetable crops include cabbage, cauliflower, tomato, winter brinjal and radish; *** Summer and rainy vegetable crops include brinjal, cucurbits,
ladies finger and sweet potato.

International Journal of Management and Social Sciences Research (IJMSSR) ISSN: 2319-4421 Volume 2, No. 8, August 2013
i-Xplore International Research Journal Consortium www.irjcjournals.org
36
Table 15: Yield rate (Kg./ha) of Different Crops in Selected Districts of Red and Lateritic zone
Crops
Bankura Purulia Bhirbhum Sub-Total
1st P
erio
d (
Mea
n
va
lue
of
Tri
enn
ium
end
ing
19
92
-93
)
2n
d P
erio
d
(M
ean
va
lue
of
Tri
enn
ium
en
din
g
20
02
-03
)
Per
cen
tag
e ch
an
ge
of
yie
ld r
ate
ov
er 1
st p
erio
d
1st P
erio
d (
Mea
n
va
lue
of
Tri
enn
ium
end
ing
19
92
-93
)
2n
d P
erio
d
(M
ean
va
lue
of
Tri
enn
ium
en
din
g
20
02
-03
)
Per
cen
tag
e ch
an
ge
of
yie
ld r
ate
ov
er 1
st p
erio
d
1st P
erio
d (
Mea
n
va
lue
of
Tri
enn
ium
end
ing
19
92
-93
)
2n
d P
erio
d
(M
ean
va
lue
of
Tri
enn
ium
en
din
g
20
02
-03
)
Per
cen
tag
e ch
an
ge
of
yie
ld r
ate
ov
er 1
st p
erio
d
1st P
erio
d (
Mea
n
va
lue
of
Tri
enn
ium
end
ing
19
92
-93
)
2n
d P
erio
d
(M
ean
va
lue
of
Tri
enn
ium
en
din
g
20
02
-03
)
Per
cen
tag
e ch
an
ge
of
yie
ld r
ate
ov
er 1
st p
erio
d
Yield rate Yield rate Yield rate Yield rate Yield
rate Yield rate Yield rate Yield rate
1. Autumn rice 2315 2500 7.99 969 1781 83.80 2514 2407 -4.29 2260 2431 7.56
2. Winter rice 1999 2728 36.47 1407 2172 54.37 2181 2737 25.49 1880 2566 36.49
3. Summer rice 2956 2860 -3.25 2294 2079 -9.37 2964 3013 1.65 2938 2946 0.27
4. Wheat 1846 2058 11.48 2069 2139 3.38 2030 2832 39.51 1961 2592 32.18
5. Principal cereal crops 2109 2714 28.69 1410 2168 53.76 2251 2787 23.81 1969 2604 32.25
6. Rabi pulses
(gram+lentil+rabi
mung+rabi maskalai)
686 748 9.04 426 514 20.66 622 871 40.03 581 858 47.68
7. Kharif and summer
pulses (summer mung
& Khesari)
545 557 2.20 643 383 -40.43 684 1005 46.93 641 512 -20.12
8. Total pulses 525 551 4.95 590 394 -33.22 630 889 41.11 594 660 11.11
9. Total foodgrain crops 2094 2703 29.08 1338 2054 53.51 2208 2702 22.37 1914 2530 32.18
10. Rape & Mustard 742 864 16.44 557 802 43.98 687 1059 54.15 701 1007 43.65
11. Summer Til 886 652 -26.41 907 811 -10.58 747 698 -6.56 872 658 -24.54
12. Total oilseeds 787 753 -4.32 624 590 -5.45 690 1040 50.72 725 906 24.96
13. Jute* 15.167 19.230 26.79 - - - 15.075 19.338 28.28 15.132 19.302 27.56
14. Sugarcane (gur) 5666.7 7420.4 30.95 6101.1 7930.6 29.99 3529.6 5522.9 56.47 4421.3 6707.3 51.70
15. Winter potato 25109 24267 -3.35 11093 15571 40.37 20805 22230 6.85 23163 23265 0.44
16. Onion NA 9262 - NA 10895 - NA 8394 - NA 9327 -
17. Bhadoi chillies 490 565 15.31 260 292 12.31 529 531 0.38 382 449 17.54
18. Rabi chillies 693 1104 59.30 393 314 -20.10 2502 2501 -0.04 848 1135 33.84
19. Total chillies 599 886 47.92 323 303 -6.20 1494 1689 13.05 616 829 34.58
20. Winter vegetable
crops** NA 22111 - NA 18357 - NA 19258 - NA 20235 -
21. Summer & rainy
vegetable crops*** NA 10318 - NA 10486 - NA 11083 - NA 10602 -
NA: Not available * Yield rate in bales/ha ** Winter vegetable crops include cabbage, cauliflower, tomato, winter brinjal and radish. *** Summer and rainy vegetable crops
include brinjal, cucurbits, ladies finger and sweet potato.

International Journal of Management and Social Sciences Research (IJMSSR) ISSN: 2319-4421 Volume 2, No. 8, August 2013
i-Xplore International Research Journal Consortium www.irjcjournals.org
37 37
Occupying a part of area of autumn rice by summer and
rainy vegetables and a part of area under winter rice by
early winter vegetables and bringing in more area under
summer rice and wheat with the objective of meeting
higher consumption demand for cereals alongside
increasing farm income have been explained in detail by
Rudra (2007) in his study on technological change and its
impact on agrarian production in Cooch Behar district of
West Bengal. Same principle of area reallocation with a
twin objective of meeting higher consumption demand
and increasing farm income is found to be operative at the
zone level also as stated above. But in terai zone the
observed decline in relative importance of principal cereal
crops carries additional information. It is further
interesting to note that the area under summer rice has
increased from 1.84 percent of net cropped area at
triennium ending 1992-93 to 7.39 percent of net cropped
area at triennium ending 2002-03 despite its negative
change in yield rate (Table 10 and Table 14). A
comparison to the figure of yield rate of rice crops with
that of other zones reveals the poorest position of terai
zone in respect of yield per unit area of rice crops. One
may be tempted to explain this relative backwardness of
terai zone in respect of yield of rice in terms of lower
application of inputs like fertilizers and other chemicals
and the relatively less coverage of area under irrigation.
But these factors are the effects not the causes.
The analysis of agro-climatic conditions of different zones
of the state and relative advantages and disadvantages of
soil and climate of the respective zones in growing
different crops elicited therefrom may aptly be brought
into fore in explaining the observed declined importance
in raising cereal crops and increasing importance of other
crops in terai zone of West Bengal. An analysis of soil and
climate in relation with natural advantages and
disadvantages of growing crops in three selected agro-
climatic zones has been discussed in detail in the
proceeding section. With the twin objective of meeting
consumption demand of cereals and increasing farm
income strategy of reallocating land from autumn and
winter rice to vegetable crops (summer & rainy and winter
vegetables) as stated earlier has been reflected in declining
of relative coverage of autumn rice and winter rice and
occupying a fairly good position of winter vegetables and
summer & rainy vegetable crops in all three selected
zones. And at the same time growing consumption
demand of cereals has been made good by increasing the
area under summer rice and wheat as evinced by
comparing their relative area coverage at two points of
time in three selected zones. Now the question comes why
the shortage of cereal due to decline in area under autumn
or winter rice has not been made by devoting more area to
summer rice in Old alluvial and Red and Lateritic zone
and to wheat in terai zone where natural advantages are
favourbale in these two crops. It is well known and
frequently come across with the information that the sub-
surface water table used to come down in most of the
areas in New alluvial and Red and Lateritic zone to the
level that lifting of sub-soil water from that level through
water lifting devices for letting irrigation in summer rice
becomes difficult. This is an important reason to set a
limit to the expansion of area under summer rice and the
shortfall thereof is compensated by enhancement of area
under wheat in New alluvial and Red and lateritic zones.
In Terai zone expansion of area to a higher extent has
been constraint by the expansion of area under winter
vegetables particularly cabbage, cauliflower and tomato. It
is interesting to note that it is the vegetable crops (winter
or summer & rainy) which has recorded to have higher
yield per unit area in terai zone as compared to that of
other zones. There is no other of the crops for which the
terai zone has an edge over other zones in respect of yield
per unit area. The crop chilli is recorded to have higher
yield in terai as compared to that of red and lateritic zone
and at state level. The natural advantage of terai zone in
growing vegetable crops as explained earlier taking into
consideration one may reasonably assert that higher yield
of vegetable crops observed in terai zone is reflecting the
higher profitability of vegetable crops in terai as compared
to that of other zones. With the same reasoning the crop
chilli is occupied an important position next to vegetable
crops in terai zone.
CONCLUSION:
The present study purports to examine the variation in
crop-mix and cropping pattern over space by classifying
the space of the State into agro-climatic zones. The
variation within the agro-climatic zone itself has also been
dealt with in this study. As the growth and development of
crops in a particular area largely hinges upon soil and
climatic factors of the area under consideration, the
aspects of natural advantage by considering soil and
climatic factors of agro-climatic zones have been
examined in explaining the variation in crop-mix and
cropping pattern between the zones. Adequate pre-
monsoon shower in terai zone in contrast to other agro-
climatic zones favors growing of summer vegetables with
minimum cost of irrigation. In the counter part
prolongation of precipitation from April to October and
thereby maintaining high soil moisture content upto end of
November have been experienced as an important barrier
at timely sowing of mustard crop but that too favors
sowing of wheat without letting any pre-sowing irrigation
in terai zone in contrast to that of other zones. By careful
examination of monthly/weekly minimum and maximum
temperature the terai zone is noted to have an interval of
seven months extending from October to April for
growing important thermosensitive crops namely wheat,
potato, tomato, brinjal, chilli, radish, cabbage and
cauliflower, while it is generally five months for other
agro-climatic zones. On the other hand, prevalence of
comparatively high relative humidity in terai zone favors
International Journal of Management and Social Sciences Research (IJMSSR) ISSN: 2319-4421 Volume 2, No. 8, August 2013
i-Xplore International Research Journal Consortium www.irjcjournals.org
38 38
outbreak of some important crop diseases and insect-pests
causing economic damage to the crops like rice, mustard,
potato, tomato, brinjal and chilli. The soils of terai zone
(sandy to sandy loam) having high porosity inter alia
lower depth of sub-soil water make it possible to supply
high evapotranspirative water in the rhizosphere of most
of the arable crops during dry months (November to
March) which favors successful growing of wheat,
mustard, pulses and all winter vegetable crops with
minimum irrigation and in some cases without letting any
irrigation. By considering the natural advantages and
disadvantages of different crops caused by soil and
climatic factors the terai zone has an edge over other
zones of the State in growing wheat, potato, cabbage,
cauliflower, tomato and chilli while this zone is
disadvantageous for rice crop. At the zone level growing
consumption demand of cereals has also played a prime
role to increasing allocation of land over time under cereal
crops like winter rice, summer rice and wheat as
visualized in other parts of the State. Here also twin
objective of meeting increasing consumption demand of
cereals by bringing in more area under the aforesaid cereal
crops and increasing farm income by allocation of more
land under vegetables and chilli has been addressed.
REFERENCES:
[1] Agricultural Meteorologist, Directorate of
Agriculture, Government of West Bengal.
[2] Alwal, A.S. and Dhaliwal, G.S. (2005)
‘Agricultural Pests of South Asia and Their
Management’, Kalyani Publishers, Ludhina, New
Delhi.
[3] Bose, T.K. and Som, M.G. ‘Vegetable Crops in
India’, Naya Prokash Publishers, 1986.
[4] Census of India 1991, District Census Handbook,
Part XII-A, Village and Town Directory, Cooch
Behar district, Directorate of Census Operations,
West Bengal. Information from 1991 Census have
been used due to non-availability of Cooch Behar
district census handbook, 2001.
[5] Government of India (1976) ‘Report of the
National Commission on Agriculture 1976’, Part
XV, Ministry of Agriculture and Irrigation, New
Delhi.
[6] Meteorological Department, Government of India.
[7] National Agricultural Research Project, Status
Report for Terai Zone, 1993, Vol. I, Zonal
Research Station, Pundibari, BCKV.
[8] Panwar, V.P.S. (2002) ‘Agricultural Insect-Pests of
Crops and Their Control’, Kalyani Publishers.
[9] Rangaswami, G. and Mahadevan, A. (2005)
‘Diseases of Crop Plants in India’, Prentice Hall of
India Pvt. Ltd.
[10] Reddy, S.R. ‘Agronomy of Field Crops’, Kalyani
Publishers, 2006.
[11] Rudra, B. C. (2007) ‘Technological Changr and Its
Impact on Agrarian Production and Relations: A
Study in a Northern District of West Bengal’, An
Unpublished Ph. D. Thesis, Chapter 3, pp.23-48.
[12] Singh, R.S. (2005) ‘Plant Diseases’, Oxford 1BH
Publishing Co. Pvt. Ltd.
[13] Singh, S.S. ‘Crop Management’, Kalyani
Publishers, 1998.
[14] Srivastava, K.P. (2003) ‘A Text book of Applied
Entomology’, Kalyani Publishers.
[15] State Department of Agriculture, Govt. of West
Bengal.
[16] Statistical Abstract (1978-’89), Bureau of Applied
Economics and Statistics, Government of West
Bengal.
[17] Statistical Abstract (1994-’95), Bureau of Applied
Economics and Statistics, Government of West
Bengal.
[18] Statistical Abstract (2001-’02), Bureau of Applied
Economics and Statistics, Government of West
Bengal.
[19] Statistical Abstract (2001-02), Bureau of Applied
Economics and Statistics, Govt. of West Bengal.
[20] Zonal Research Station, BCKV, North Bengal
Campus, Pundibari, Cooch Behar, Status Report,
Vol. I for launching National Agricultural Research
Project (NARP), Chapter I, 1993.
[21] Zonal Research Station, National Agricultural
Research Project (NARP), BCKV, Terai Zone,
Pundibari, Status Report, Vol. I, 1993.