RAILWAY SECTOR ASSESSMENT FOR GEORGIA - CAREC ...
38
RAILWAY SECTOR ASSESSMENT FOR GEORGIA MARCH 2021
-
Upload
khangminh22 -
Category
Documents
-
view
5 -
download
0
Transcript of RAILWAY SECTOR ASSESSMENT FOR GEORGIA - CAREC ...

RAILWAY SECTOR ASSESSMENT FOR GEORGIAMARCH 2021


Railway SectoR aSSeSSment foR GeoRGiaMARCH 2021

The boundaries, colors, denominations, and any other information shown on the maps do not imply, on the part of ADB, any judgment on the legal status of any territory, or any endorsement or acceptance of such boundaries, colors, denominations, or information.
Note: In this publication, “$” refers to United States dollars.
Cover design by Edith Creus.
Cover photos (left to right): Freight train, modernization of railway infrastructure, and rail container terminal (photos by TA consultants).

iii
Contents
tableS anD fiGuReS ivacKnowleDGmentS vabbReviationS vicuRRency eQuivalentS vi
1 intRoDuction anD bacKGRounD 1A. Introduction 1B. The railway network 1C. Institutional responsibilities for railways 3D. Transit routes and bottlenecks 4 1. Transit routes 4 2. Transit bottlenecks 6E. Relevant CAREC corridors 8
2 tRenDS in Railway tRaffic 11A. Introduction 11B. Analysis of traffic 11C. Traffic growth scenario 15
3 maRKet comPetitiveneSS 16A. Introduction 16B. Market feedback 16C. Problems affecting rail competitiveness 16
4 Railway oPeRatinG anD financial PeRfoRmance 19A. Introduction 19B. Commercial orientation 19C. Financial performance 19D. Operational benchmarking 21
5 PRoPoSalS foR inveStment, commeRcialization, anD RefoRm 24A. Introduction 24B. Policy setting 24C. Commercialization and reform 24D. Proposals for support from CAREC Railway Sector Development TA 24 1. Prefeasibility studies 24 2. Knowledge products and events 25E. Main opportunities for support under CAREC Railway Sector Development TA 26
aPPenDiX: caRec DeSiGnateD Rail coRRiDoRS 28 RefeRenceS 30

iv
tAbles AnD FiguRes
tableS
2.1 Georgia’s Leading Trade Partners by Value, 2018 11
2.2 Modal Share by Trade Value, 2018 12
2.3 Base Case Traffic Scenario, 2019–2022 15
3.1 Market Feedback on Rail Competitiveness for Different Traffic Types 17
4.1 Reported Georgian Railway Operating Revenue and Expenses, 2014–2018 20
5.1 More Promising Opportunities for Georgia for Possible Support 26 under CAREC Railway Sector Development TA
fiGuReS
1.1 Georgian Railway Network 2
1.2 Regional Rail Links and Ports Serving Cross-border and Transit Traffic 4
1.3 The Port of Poti on the Black Sea 7
1.4 Sections of CAREC Corridor 1 Relevant for Georgia 8
1.5 Sections of CAREC Corridor 2 Relevant for Georgia 9
1.6 Sections of CAREC Corridor 6 Relevant for Georgia 10
2.1 Railway Freight Volume, 2014–2018 12
2.2 Railway Freight by Commodity, 2014–2018 13
2.3 Analysis of Rail Freight Exports, Imports, Transit Traffic and Domestic Traffic, 2014–2018 14
2.4 Domestic and International Railway Passengers, 2013–2018 14
4.1 Revenues by Source, 2018 20
4.2 Unit Revenues, 2013–2018 20
4.3 Comparison of Railway Length and Staff Size in Georgia, 21 other CAREC Member Countries and other Leading Railway Countries
4.4 Comparison of Railway Rolling Stock Fleet in Georgia, 22 other CAREC Member Countries and other Leading Railway Countries
4.5 Comparison of Annual Railway Freight and Passenger Traffic Levels in Georgia, 22 other CAREC Member Countries and other Leading Railway Countries
4.6 Comparison of Railway Track and Staff Productivity in Georgia, 23 other CAREC Member Countries and other Leading Railway Countries
4.7 Comparison of Locomotive and Wagon Productivity in Georgia, 23 other CAREC Member Countries and other Leading Railway Countries
v
ACKnoWleDgMents
This country railway sector assessment is part of an Asian Development Bank (ADB) technical assistance (TA) project on Railway Sector Development in Central Asia Regional Economic Cooperation (CAREC) Countries.
The project has been assisting CAREC member countries to identify promising opportunities for investment in cross-border railways and develop railway commercialization and reform measures to strengthen railway performance in accordance with the CAREC Railway Strategy approved by CAREC ministers in 2017.
Preparation and supervision of the project was led by Jurgen Sluijter, Senior Transport Specialist, and overseen by Dong-Soo Pyo, Director, Transport and Communication Division, Central and West Asia Department. Administrative support was provided by Krisanta Carissa Vila, Associate Project Analyst.
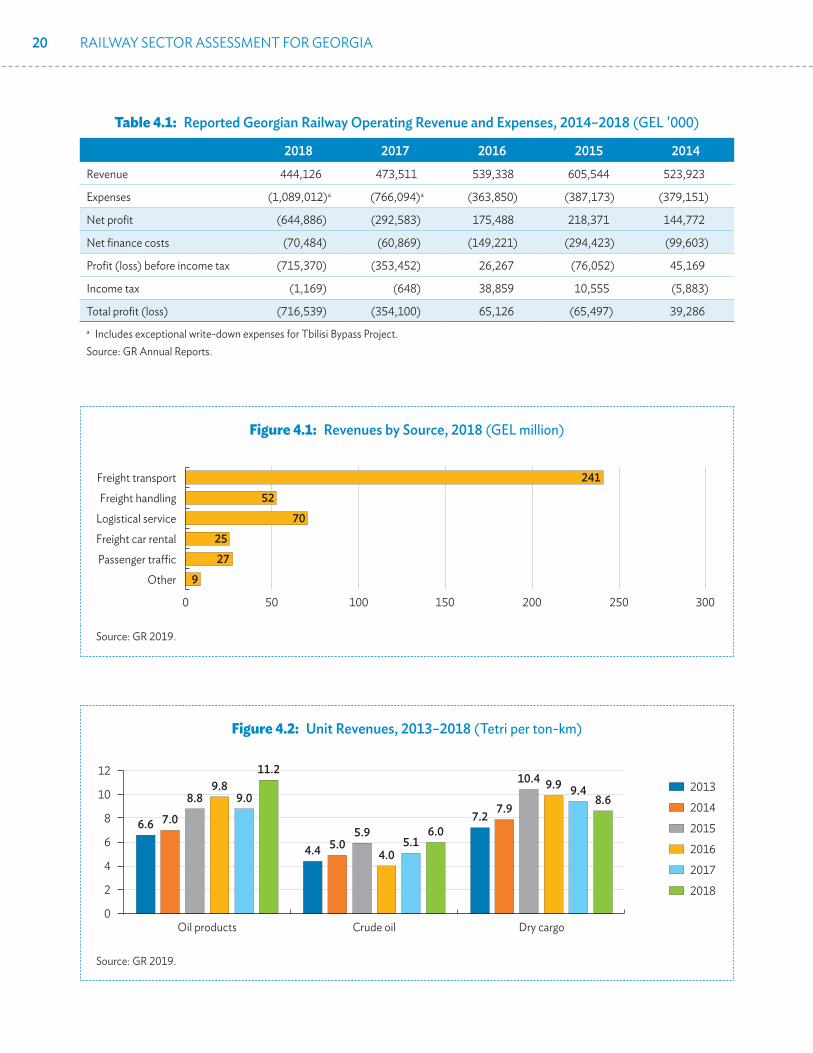
Project activities were guided by the members of the CAREC Railway Working Group, CAREC Railway Focal Points, and national TA coordinators.
The Georgia railway sector assessment was prepared by a team of TA consultants. Country-level consultations and research were carried out by Tyrrell Duncan, Team Leader/Railway Specialist; Udo Sauerbrey, Railway Reform and Restructuring Specialist; Andy Sze, Railway Market and Logistics Specialist; Len Johnstone, Transport Modeling Specialist; and Rati Devadze, Transport Specialist. Report preparation was led by Tyrrell Duncan.
Valuable insights and information were provided by Georgian Railway, the Ministry of Economy, other government departments, international development partners, and representatives of the private sector. Useful comments were provided by ADB staff.

vi
AbbReviAtions
ADB Asian Development BankADY Azerbaijan RailwaysBTK Baku–Tbilisi–KarsCAREC Central Asia Regional Economic CooperationCIS Commonwealth of Independent StatesCTC Caucasus Transit CorridorEEU Eurasian Economic UnionEU European UnionFSU former Soviet UnionGR Georgian RailwayICT information and communication technologyIFRS International Financial Reporting StandardsJSC joint stock companykm kilometerMC member countryMESD Ministry of Economy and Sustainable DevelopmentPPP public–private partnershipPRC People’s Republic of ChinaSBU strategic business unitTA technical assistanceTEU twenty-foot equivalentTITR Trans-Caspian International Transport RouteTRACECA Transport Corridor Europe Caucasus AsiaUIC International Union of Railways
CuRRenCY eQuivAlents
Currency unit – lari (GEL)GEL1.00 = $0.314$1.00 = GEL3.18
(as of 25 May 2020)

1
intRoDuCtion AnD bACKgRounD
a. introduction1. In 2017, the eleven Member Countries (MCs) of the Central Asia Regional Economic Cooperation (CAREC) program approved the CAREC Railway Strategy with a view to expanding the role of railway transport in the region.1 The strategy aims to accelerate the identification, preparation, and financing of feasible railway investment projects and, at the same time, advance the commercialization and reform of railways to improve their performance (ADB 2017).
2. In 2018, the Asian Development Bank (ADB) approved a $2 million regional technical assistance (TA) project for CAREC Railway Sector Development to assist MCs in implementation of the CAREC Railway Strategy (ADB 2018).2 The TA is intended to accelerate the sound development of the railway sector in CAREC countries by providing support for railway transport market research, project identification and preparation, knowledge sharing and preparation of practical actions for commercialization and reform in MCs.
3. During the first part of TA implementation, the TA consultants conducted assessments of the railway sector in each MC. The purpose of these assessments was to examine the setting, characteristics, performance and prospects of railways, and identify promising investment
opportunities, and commercialization and reform actions, that could be considered for support through the TA. This short report summarizes the findings of the railway sector assessment for Georgia, based on a country visit from 24 June to 1 July 2019.
b. the railway network4. Georgia is a lower-middle income country with a population of 3.7 million in 2018 (ADB 2019). It is located at the crossroads of Asia and Europe, bounded to the west by the Black Sea, to the north by the Russian Federation, to the south by Turkey and Armenia, and to the southeast by Azerbaijan. Much of its terrain is mountainous.
5. The Georgian railway network was originally developed as part of the Russian Empire’s Transcaucasus Railway, now known as the Caucasus Transit Corridor (CTC). The headquarters of the Transcaucasus Railway was in Tbilisi. Its main purpose was to transport oil from Baku (Azerbaijan) on the Caspian Sea to Poti on the Black Sea for onward shipment to Russia’s Black Sea port of Novorossik. The main line between Poti, Tbilisi, and Baku was developed between 1865 and 1883. Further branch lines and spurs were later added, including links to Turkey, Armenia, and Russia; Georgia’s other Black Sea ports of Batumi and Kulevi; and various inland centers of mining, agriculture and tourism. By 1967, the entire railway was electrified.
1 The eleven CAREC member countries are Afghanistan, Azerbaijan, the People’s Republic of China (specifically the Xinjiang Uygur Autonomous Region and the Inner Mongolia Autonomous Region), Georgia, Kazakhstan, the Kyrgyz Republic, Mongolia, Pakistan, Tajikistan, Turkmenistan, and Uzbekistan.
2 The TA is cofinanced by the People’s Republic of China (PRC) Poverty Reduction and Regional Cooperation Fund and the United Kingdom Fund for Asia Regional Trade and Connectivity (under the Regional Cooperation and Integration Financing Partnership Facility).
1

2 RAILWAY SECTOR ASSESSMENT FOR GEORGIA
6. When the former Soviet Union (FSU) collapsed in 1991, Georgia took over the railway within its territory and established Georgian Railway (GR) to manage, operate, and maintain the railway. Armenia and Azerbaijan set up their own railway organizations to be responsible for the sections of the CTC on their territory.
7. The Georgian railway network is almost entirely broad gauge (1,520 mm).3 The total network length is 1,443 kilometers (km), with 51 passenger and 100 goods stations. Due to mountainous terrain in the central part of the country and wetlands near the ports, there are 1,334 bridges and 40 tunnels.
3 An exception is the 37 km narrow gauge Borjomi–Bakuriani line that serves the Bakuriani ski resort.
The main line has 295 km of double-tracking, is fully electrified and uses automatic block signalling (GR 2018). It is well-maintained. The railway network is shown in Figure 1.1.
8. Georgia, Azerbaijan, and Turkey recently completed construction of the Baku–Tbilisi–Kars (BTK) Railway which provides a direct rail connection between Baku and southern Turkey via Georgia and avoids having to cross the Black Sea. The BTK Railway uses the existing CTC between Baku and Tbilisi, then proceeds southwest from Tbilisi to the border with Turkey and connects into the Turkish railway network at Kars.
Figure 1.1: Georgian Railway network
Caucasus Transit Corridor
B l a c k S e a Kvirila R.
Enguri R.
Kodori R.
Alazani R.
Iori R.
Mtkvari (Kura) R.
Rioni R.
Rioni R.
Lake Tabatskuri
Lake Paravani
Bzipi R.
Supsa R.
OzurgetiKobuleti
Poti
Chokhatauri
Samtredia
Senaki
TkvarcheliJvari
Zugdidi
TskaltuboTkibuli
ChiaturaKutaisi
Ochamchire
Gagra
Pitsunda
Gudauta
Tskhinvali
BakurianiBorjomi
Gori
Vale
Akhaltsikhe
Ninotsminda
Atskuri
Rustavi
Kazreti
Marneuli
Telavi
Gurjaani
Tsnori
Mtskheta
Dedoplistskaro
Khashuri
Zestaponi
Gali
LanchkhutiUreki
Akhalkalaki
to Kars
to Baku
to Yerevan
Anaklia
Sarpi
Batumi
Sokhumi
TBILISI
R U S S I A N F E D E R A T I O N
A R M E N I A
A Z E R B A I J A N
T U R K E Y
National Capital
Administrative Center
City/Town
International Road
Railway
River
International BoundaryBoundaries are not necessarily authoritative.
0 20 40 60 80
Kilometers
N
45 00'Eo
45 00'Eo
41 00'Eo
41 00'Eo
41 00'No
41 00'No
43 00'N43 00'No
43 00'N43 00'No
20-1056a 20GEO
AV
This map was produced by the cartography unit of the Asian Development Bank. The boundaries, colors, denominations, and any other information shown on this map do not imply, on the part of the Asian Development Bank, any judgment on the legal status of any territory, or any endorsement or acceptance of such boundaries, colors, denominations, or information.
Source: Georgian Railway.
INTRODUCTION AND BACKGROUND 3
9. At the end of 2018, GR’s in-service fleet of locomotives and rolling stock comprised (i) 25 electric multiple units (EMUs), (ii) 170 locomotives, of which 105 were electric and 65 were diesel;4 (iii) 5,001 freight wagons, and (iv) 41 passenger coaches (GR 2018). In addition to its own wagons, GR also uses wagons owned by other railways and private companies. Just over half of freight transport in 2018 used GR wagons (GR 2018).
10. Between 2005 and 2015 the size of GR’s rolling stock fleet decreased by 30% due to lack of investment and retirement of obsolete items. By 2015, more than half of GR’s freight wagons were aged 35–45 years, more than half of electric locomotives and passenger wagons were aged 30–40 years, and more than half of diesel locomotives were aged 25–35 years (Deloitte 2017). With a significant portion of the fleet already close to the end of its normal economic life, GR now needs to invest in fleet modernization and encourage the private sector to expand its role in rolling stock provision.
c. institutional responsibilities for railways
11. GR is a state-owned joint stock company (JSC) responsible for the management and maintenance of railway infrastructure and the operation of railway passenger and freight services. It has about 13,000 staff, making it Georgia’s largest employer. It has three strategic business units (SBUs): (i) the Freight Transportation SBU; (ii) the Passenger Transportation SBU; and (iii) the Infrastructure SBU.
These function as separate profit centers and produce separate financial statements. In 2009, GR established a subsidiary company, GR Logistics and Terminals, to provide freight forwarding, container terminal and logistics services.5 GR also has a property management subsidiary.
12. The sole shareholder of GR is the government’s JSC Partnership Fund which is overseen by the Enterprise Management Agency of the Ministry of Economy and Sustainable Development (MESD). GR has a modern governance structure that includes a general meeting of shareholders, a supervisory board (including two independent directors) and a board of directors (management board). Its accounts are maintained in accordance with International Financial Reporting Standards (IFRS) and are subject to independent audit.
13. The government expects GR to operate on a self-financing basis, without capital or operating subsides. GR’s sets its own tariffs and can grant discounts on the basis of a commercial negotiation with clients (Deloitte 2017).6 In order to hedge against foreign exchange risk, freight tariffs are set in US dollars. Regulation of tariffs is not needed since there is a high degree of competition in each of GR’s main markets—including from oil pipelines, road transport and other international transit corridors.
14. GR is one of relatively few railways in the CAREC region that have a sales and marketing department. As a result, it has an appreciation of market dynamics, cargo trends and emerging supply chain management practices. Using its enterprise resource planning software platform, GR is able to determine the cost of providing various types of service and uses this information in determining prices.
4 Diesel locomotives are used mainly for shunting.5 The main reason for establishing GR Logistics and Terminals was to improve the service quality and competitiveness of containerized
rail freight by addressing problems such as high tariff levels, slow delivery times, inefficient intermodal infrastructure, and risk of cargo damage at marshalling yards (Deloitte 2017).
6 GR maintains a written tariff policy that specifies the methods and formulas for determining the various tariffs for its services. The tariffs are published on its website which also provides an online tariff calculator for use by clients.

4 RAILWAY SECTOR ASSESSMENT FOR GEORGIA
D. transit routes and bottlenecks
1. Transit routes
15. More than 95% of GR’s revenue comes from freight operations and more than half of this is from transit traffic through the CTC. Transit traffic requires transfers between railway and shipping services when crossing the Black Sea and the Caspian Sea. The ability of GR to attract transit traffic therefore depends not only on its own performance but on the performance of other parts of the transport logistics chain including Azerbaijan Railways (ADY), the railways in Central Asia, ports and shipping services on the Black Sea and Caspian Sea, and on route logistics terminals and border crossings. This is illustrated in Figure 1.2.
Figure 1.2: Regional Rail links and Ports Serving cross-border and transit traffic
Odessa
Constanta
Varna
Tehran
BishkekPoti
Volgadon Canal
Beyneu
Arys
Chabahar
Mumbai
Delhi
Herat
KarachiGwadar
Sarahs
Lahore
Islamabad
WaghaChaman
Manzhouli
Tianjin
Beijing
Ulaanbaatar
Altanbulag
Altai
Dalian
BurgastaiBichigt Harbin
Rashaan
Moscow
Nur-SultanAktobe
Bukhara
Mary
Batumi
Kandagash
Ekaterinburg
Almaty
Peshawar
Bandar Abbas
Arabian Sea
Lianyungang
Quetta
Termez
Dostyk
Shiveekhuren
Sainshand Zamiin-Uud
Chita
Istanbul
Shalkar
Aktau
Turkmenbashy Ashgabat
Erenhot
Kandahar
Mazar-e-Sharif
Dushanbe
Kabul
Baku
Zahedan
Ulan-Ude
Bafq
Mashad
Vanimo
Vostochny
Vladivostok
Qom
TobolKokshetau
Petropavlovsk
Kostanai
Trans-Siberian RailwayTrans-Mongolian CorridorNorthern Trans-Asian CorridorTrans-Caspian International Transport RouteUzbekistan Northwestern CorridorLapis Lazuli Corridor Caucasus Transit CorridorSouthern Trans-Asian CorridorChina–Pakistan Economic CorridorNorth–South CorridorOther regional rail linksMissing regional rail links
Tashkent
Torkham
Kashgar
KhorgosUrumqi
Gashuun Suhait
Notes: (1) Within the PRC, the map covers principal railway trunk routes used for trade between the PRC and CAREC member countries and regional railway links relevant for Inner Mongolia and Xinjiang, the two PRC regions that participate in CAREC; (2) the boundaries, colors, denominations, and any other information shown on this map do not imply, on the part of ADB, any judgment on the legal status of any territory, or any endorsement or acceptance of such boundaries, colors, denominations, or information.Source: TA consultants.
16. The market for transit traffic is subject to competition among modes and corridors. Market segments relevant for Georgia are summarized below:
(i) between the PRc and northern europe. This is the largest segment of Eurasian freight. It mainly uses ocean shipping. The part that is transported by land includes goods from and to PRC centers located far from ports and time-sensitive goods requiring faster delivery. This is mainly transported by rail on the Trans-Siberian Railway between Asia and northern Europe via the Russian Federation, although some traffic also uses the Trans-Caspian International Transport Route (TITR).

INTRODUCTION AND BACKGROUND 5
Although this is the longest distance Eurasian corridor, it has the advantage that border crossing delays are minimized since most of the journey is within the Russian Federation, and connections through Kazakhstan and Belarus remain within the common customs area of the Eurasian Economic Union (EEU).7
(ii) between central asia and northern europe. This segment is comparable with item (i) above, but faces strong competition from the Trans-Siberian Railway.
(iii) between the PRc and Southern europe. Depending on origin and destination, traffic may be transported by ocean shipping, long distance rail corridors, or road transport. The TITR between the PRC and Europe via Central Asia is one of the shortest distance routes.8 It uses the CTC between the Caspian and Black Seas.9 For some traffic between the PRC and southern Turkey and the eastern Mediterranean, the newly completed BTK Railway provides an alternative within the Caucasus that avoids crossing the Black Sea. To realize the full potential of the TITR and the BTK Railway, various existing bottlenecks need to be overcome, including (a) additional costs, delays and uncertainties due to inefficient border crossing arrangements in some Central Asian countries, (b) transport bottlenecks including shortages of rolling stock and limitations in the frequency, reliability, and price competitiveness of Caspian and Black Sea shipping services, and (c) lack of coordination
and harmonization of services and tariffs among railway administrations, ports and shipping services along the corridor.
(iv) between central asia and Southern europe. The TITR is one of the shortest distance corridors for this market segment. Its advantages and bottlenecks are similar to item (iii) above. It is more likely to be used by traffic originating or terminating in nearby parts of Central Asia, for example in Kazakhstan, the Kyrgyz Republic, and northeast Uzbekistan. For origins and destinations further to the south, the Lapis Lazuli Corridor from western Afghanistan to Turkmenbashy port (Turkmenistan) could potentially offer a shorter distance alternative, as could the route through Uzbekistan via Bukhara to Beyneu (Kazakhstan). Like the TITR, both routes use the CTC between the Caspian and Black Seas. However, both routes are currently underdeveloped in terms of service coordination and marketing. Railway routes between Central Asia and Southern Europe also face strong competition from road transport, especially for shorter distance journeys.
(v) between iran and europe. When economic sanctions against Iran come to an end, this may lead to increased traffic between Iran and Europe via the Black Sea or the BTK Railway, although there will be increased competition from ocean shipping services between Iran’s Persian Gulf ports and Europe.
7 The members of the EEU are Armenia, Belarus, Kazakhstan, the Kyrgyz Republic, and the Russian Federation.8 The TITR is sometimes referred to as the Middle Corridor. The members of the TITR Association comprise Azerbaijan Caspian
Shipping, ADY, Aktau Port, Baku Port, GR, Kazakhstan Railways, Turkish Railways, and Ukraine Railways. Associate members include the Polish Broad Gauge Railway, Batumi Port, Kaskor-Transservice (Kazakhstan), Port Kuryk (Kazakhstan), Anaklia Development Consortium, Lianyungang Port Holdings Group (PRC), Grampet Group (Romania), Astyk Trans (Kazakhstan), Kazakhstan National Maritime Shipping Company, and Eastcomtrans (Kazakhstan).
9 The TITR is a multimodal route with four main parts (i) railway between East Asia and the Caspian Sea, (ii) shipping across the Caspian Sea, (iii) railway through the CTC (Azerbaijan and Georgia), and (iv) shipping across the Black Sea. Freight has to be transferred from rail onto roll-on-roll-off ferries or container vessels to cross the Caspian Sea and Black Sea. On the Caspian Sea, the route is between Baku (Azerbaijan) and Aktau (Kazakhstan). On the Black Sea, the main routes are between the Georgian ports of Poti or Batumi and the ports of Odessa (Ukraine), Constanta (Romania), Varna (Bulgaria), and Istanbul (Turkey).

6 RAILWAY SECTOR ASSESSMENT FOR GEORGIA
(vi) between the caspian and black Seas. For all segments requiring transport between the Caspian and Black Seas, the CTC also faces further competition from shipping services on the Volgadon Canal which extends from Astrakhan (Kazakhstan) on the Caspian Sea’s northwest coast through the Russian Federation to the Asov Sea that flows into the Black Sea. Due to harsh winter conditions, the canal is closed from November to April.
2. Transit bottlenecks
17. The government and GR have been active in addressing transit traffic bottlenecks within Georgia’s borders and has been participating in regional and international partnerships that can provide ways to address corridor bottlenecks in other countries.
18. On GR’s main line, the 63 km Zestafoni–Moliti–Khashuri section (“Gorges” section) is currently a bottleneck for traffic growth. Due to the mountainous terrain, speeds are limited to a maximum of 60 km per hour and annual freight throughput capacity is limited to 27 million tons. To overcome this problem, GR is implementing a Railway Modernization Project to upgrade the railway line from Zestafoni to Kharagauli and build a new line from Moliti to Khashuri.10 This will increase maximum speeds to 80 km per hour for freight and 120 km per hour for passengers, and raise annual throughput capacity to 48 million tons, with potential to reach 100 million tons if needed in future (GR 2018).
19. A second bottleneck concerns the capacity and performance of Georgia’s main Black Sea ports of Poti and Batumi. Problems include that (i) due to depth limitations, the ports can only accommodate
container feeder vessels up to 1,500 twenty foot equivalents (TEU) which has resulted in high shipping rates and limited service frequencies and port calls; (ii) there are frequent port closures due to bad weather;11 (iii) Poti is rundown due to past underinvestment, has no on-dock rail terminal, and containers have to be stored at off-dock terminals 7 km away; (iv) Batumi has little scope for further development while Poti could be expanded but this would be very costly; (v) there is limited competition between the two ports which has resulted in high port charges; and (vi) the container throughput capacity of the ports will be reached in the next few years.
20. To address these port bottlenecks, the government has encouraged the private sector to develop a new deep-water port on the Black Sea. In 2016, it launched a public–private partnership (PPP) scheme that attracted proposals from a project consortium to build a port, logistics park, and special economic zone at Anaklia about 35 km north of Poti (65 km by road).12 Although the project consortium carried out initial land reclamation works, and external financiers signed mandate letters to provide up to $400 million of debt financing, the consortium and the government were unable to resolve outstanding issues through negotiation and in early 2020 the scheme was cancelled. The government is now exploring other options for deep-water port development on the Black Sea.13
21. A further bottleneck is that Georgia’s existing inland terminals along the CTC are outdated and inefficient, and generally cannot receive whole trains, which contributes to high terminal charges. To address this issue, the government plans to develop modern multimodal logistics terminals at Kutaisi and Kumisi through PPP concessions.
10 This has included construction of an 8.3 km tunnel.11 In 2018, Poti had an average downtime of 27% and an average waiting time for cargo of three days.12 The proposed new port was expected to serve container liner vessels up to 10,000 TEU. In the $600 million first phase, annual capacity
of 600,000 TEU and 1.5 million tons of dry bulk was to be provided, with government meeting the costs of land acquisition and providing hinterland road and rail connections including an on-dock rail terminal (Anaklia Development Consortium 2019).
13 As an alternative to the Anaklia project, APM Terminals, the port operating concessionaire at Poti, has also proposed a $350 million project to develop a new container port at Poti with annual capacity of 1 million TEU.

INTRODUCTION AND BACKGROUND 7
Figure 1.3: the Port of Poti on the black Sea
Source: TA consultants.
22. It is relevant to note that over the past decade the government implemented significant reforms of its customs and border services. Corruption was drastically reduced and the customs service is now one of the most efficient and technologically advanced in the CAREC region. It now uses risk management approaches to customs control using big data, a “single window”, electronic data exchange, and checks railway wagons using advanced scanning equipment.
23. The government has been very active in regional cooperation and integration initiatives to improve transit corridor performance beyond Georgian territory. This has included (i) entering into free trade agreements with countries that have a combined population of 2.3 billion, including the European Union (EU), the European Free Trade Area,
the Commonwealth of Independent States, the US, the PRC, Japan, and Turkey (Anaklia Development Consortium 2019); (ii) becoming an EU associated country and adopting EU standards; (iii) joining broad-based regional initiatives to develop transit routes including the Transport Corridor Europe Caucasus Asia (TRACECA), the Trans European Transport Network (TEN-T)14 and CAREC; (iv) participating in regional initiatives to develop new transit routes and corridors, including being a founder member of the TITR International Association, and a member of the Person Gulf–Black Sea Corridor (Azerbaijan, Armenia, Bulgaria, Georgia, Greece, and Iran) and the Lapis Lazuli Route Agreement (Afghanistan, Azerbaijan, Georgia, Turkey, and Turkmenistan); and (v) signing bilateral railway cooperation agreements with neighboring countries, Ukraine, Moldova, Uzbekistan, Kazakhstan, Turkmenistan, and the Kyrgyz Republic.
14 The EU’s Indicative Investment Action Plan for the Eastern Partnership of TEN-T had identified 18 projects in Georgia. These include Black Sea port and port connectivity improvements, and multimodal logistics centers at Kutaisi and Kumisi. The action plan also includes upgrading of the Azerbaijan’s east–west railway connecting Georgia with Baku and Alyat (EU 2018).

8 RAILWAY SECTOR ASSESSMENT FOR GEORGIA
e. Relevant caRec corridors24. The CAREC corridors relevant for railway development in Georgia are Corridors 1, 2, and 6.
25. caRec corridor 1: europe–east asia —Subcorridors 101–103 (figure 1.4). These subcorridors encompass the parts of the TITR in the PRC and Kazakhstan, extending as far as Shalkar in western Kazakhstan. Subcorridor 102 covers the TITR’s southerly route through Kazakhstan via Almaty and Shymkent. Subcorridors 101 and 103 together cover the TITR’s northerly route through Kazakhstan via Aktogay, Mointy, and Zhezkazghan. A gauge change is required at the Kazakhstan–PRC border. Beyond Shalkar, Corridor 1 proceeds northwards toward the Russian Federation while the TITR continues westwards to Beyneu and Aktau Port (both Kazakhstan).
26. caRec corridor 2: mediterranean–east asia—Subcorridors 201–203 (figure 1.5). Corridor 2 provides four routes between the PRC and the Mediterranean via the Caucasus. Subcorridor 201 via Aktogay, Mointy, and Zhezkazghan is the same as the northerly route through Kazakhstan using Subcorridors 101 and 103 (para. 25) but west of Shalkar it continues to follow the TITR via Beyneu, Aktau port, Baku, and Tbilisi. Subcorridor 202 is similar except, that between Turpan (PRC) and Beyneu it follows a southerly alignment via Kashgar, Torugart (Kyrgyz Republic), Savai, Tashkent, Navoi, and Nukus (all Uzbekistan). The section between Kashgar and Savai is a missing link. Subcorridor 203 is similar to Subcorridor 202 except that between Navoi and Baku (Azerbaijan), it connects with Turkmenistan’s east–west corridor to Turkmenbashy port where it crosses the Caspian Sea to Baku.
Figure 1.4: Sections of caRec corridor 1 Relevant for Georgia
102103
103
102
103
101
102103
101
101102103
Yalama
Astara
Astara
AksarayskiyGanyushkino
Aktau
Troitsk
Kairak
VeseloyarskAul
Alashankou
Horg0s
Turghundy
Serhetabat
Sarahs
Sarakhs
Khodzhidavlet
Shirkhan Bandar Panji Poyon
KelesSarygash
SavaiKarasuu
Karamyk
Karamyk
GardabaniBeyuk Kesik
Hairatan
Karakalpakiya
Farap
Oasis
Aylat
Aqina
Dostyk
Bolachak
Chaman
Turkmenbashi
Merke
Rohri
ChaishorkhGhurian
Torbat-e-Heydarieh
Mashhad
Nukus
Urgench
Bukhara
Shymkent
ASHGABAT Mary
Samarkand
Kyzylorda
Pavlodar
Karaganda
NUR-SULTAN
OskemenAktobe
Petropavlovsk
Kokshetau
Kostanai
Taldykorgan
Herat
Atyrau
Mangyshlak
Kunduz
KABUL
DUSHANBE
Naryn
BISHKEK Almaty
TASHKENT
NEW DELHI
ISLAMABAD
Kandahar
Oral
BAKU
Shalkar
Semey
Aktogay
UrumqiZhetygen
Arkalyk
Shubarkol
Zhezkazghan
Saksaulskaya
Taraz
Gulistan PapAndijan
Irkeshtam
Sary-tash
Fergana Osh
KurgonteppaTermez
Sheberghan
Delaram
Gereshk
Gorgan
Bereket
Buzkhun
Uzen
Beyneu
YEREVAN
TBILISI
Kars
Bautino
Qazvin
Miyaneh
Tabriz
TEHRAN
KarachiGwadar
KATHMANDU
Chabahar
Bandar Abbas
Kashi
Torugart
Lahore
Quetta
Turkmenabat
DjizzakNavoi
Karshi
Kerki
Dashoguz
Zahedan
Peshawar
Jalalabad
Kandyagash
Nikel’tau
Tobol
Mazar-e-Sharif
Rasht
Balykchy
Zharyk
Turpan
Shu
Mointy
Hami
Kotlajam
Bostan
D.I.Khan
BasimaJacobabad
Havelian
AngrenMiskin
Uchkuduk
Khorgos
SAUDI ARABIA
OMANU.A.E.
QATAR
BAHRAIN
KUWAIT
IRAQ
TURKEY
SYRIAN ARAB REPUBLIC
UKRAINE
R U S S I A N F E D E R A T I O N
I R A N
R U S S I A N F E D E R A T I O N
GEORGIA
ARMENIA
I N D I A
NEPAL
UZBEKISTAN
AZERBAIJAN
AFGHANISTAN
P A K I S T A N
TURKMENISTAN
TAJIKISTAN
M O N G O L I A
KYRGYZREPUBLIC
PEOPLE'S REPUBLIC OF CHINA
K A Z A K H S T A N
This map was produced by the cartography unit of the Asian Development Bank. The boundaries, colors, denominations, and any other information shown on this map do not imply, on the part of the Asian Development Bank, any judgment on the legal status of any territory, or any endorsement or acceptance of such boundaries, colors, denominations, or information.
DRC Existing
Existing Railways
Railways Outside Project Area
Ferry Lines
Border Crossing Point
Main Cities and Towns
National Capitals�������� AV
Source: CAREC Secretariat
0 100 200 300 400
Kilometers
Source: CAREC Secretariat.

INTRODUCTION AND BACKGROUND 9
Figure 1.5: Sections of caRec corridor 2 Relevant for Georgia
201
202
201202
202203
201
204
203
204
204
202203204
201202203204
201202203
Yalama
AstaraAstara
AksarayskayaGanyushkino
Aktau
Troitsk
Kairak
Veseloyarsk
Aul
Alashankou
Horgos
TurghundySerhetabat
Sarahs
Sarakhs
Khodzhidavlet
Shirkhan Bandar Panji Poyon
KelesSarygash
SavaiKarasuu
KaramykKaramyk
GardabaniBeyuk Kesik
Hairatan
Karakalpakiya
Farap
Oasis
Alat
Aqina
Dostyk
Bolashak
Chaman
Turkmenbashy
Merke
Rohri
Kotlajam
Bostan
Dera Ismail Khan
BasimaJacobabad
HavelianChaishorkh
Ghurian
Torbat-e-Heydarieh
Mashhad
Nukus
Urgench
Bukhara
Shymkent
ASHGABATMary
Samarkand
Kyzylorda
Pavlodar
Karaganda
NUR-SULTAN
OskemenAktobe
Petropavlovsk
Kokshetau
Kostanai
Taldykorgan
Herat
Atyrau
Mangyshlak
Kunduz
KABUL
DUSHANBE
Naryn
BISHKEK Almaty
TASHKENT
ISLAMABAD
Kandahar
Oral
BAKU
Shalkar
Semey
Aktogay
UrumqiZhetygen
Arkalyk
Shubarkol
Zhezkazghan
Saksaulskaya
Taraz
GulistanPapAndijan
Irkeshtam
Sary-Tash
Fergana Osh
BokhtarTermez
Sheberghan
Delaram
Gereshk
Gorgan
Bereket
Hazar
Uzen
Beyneu
YEREVAN
TBILISI
Kars
Bautino
QazvinMiyaneh
Tabriz
TEHRAN
KarachiGwadar
KATHMANDU
Chabahar
Bandar Abbas
Kashgar
Torugart
Lahore
Quetta
Turkmenabat
DjizzakNavoi
Karshi
Kerki
Dashoguz
Zahedan
Peshawar
Jalalabad
Kandyagash
Nikel’tau
Tobol
Mazar-e-Sharif
Rasht
Balykchy
Zharyk
Turpan
Shu
Mointy
Hami
AngrenMiskin
Uchkuduk
Khorgos
SAUDI ARABIA
OMANU.A.E.
QATARBAHRAIN
KUWAIT
IRAQ
TURKEY
SYRIAN ARAB REPUBLIC
UKRAINE
R U S S I A N F E D E R A T I O N
I R A N
R U S S I A N F E D E R A T I O N
GEORGIA
ARMENIA
I N D I A
NEPAL
UZBEKISTAN
AZERBAIJAN
AFGHANISTAN
P A K I S T A N
TURKMENISTAN
TAJIKISTAN
M O N G O L I A
KYRGYZ REPUBLIC
PEOPLE'S REPUBLIC OF CHINA
K A Z A K H S T A N
PAKISTAN
DRC Existing
DRC Planned/Under Construction
Existing Railways
Railways Outside Project Area
Ferry Lines
Border Crossing Point
Main Cities and Towns
National CapitalsThis map was produced by the cartography unit of the Asian Development Bank. The boundaries, colors, denominations, and any other information shown on this map do not imply, on the part of the Asian Development Bank, any judgment on the legal status of any territory, or any endorsement or acceptance of such boundaries, colors, denominations, or information.
�������� AV
Source: CAREC Secretariat
0 100 200 300 400
Kilometers
Source: CAREC Secretariat.
Subcorridor 204 follows a more southerly route west of Kashgar and passes through Tehran (Iran) avoiding the need for transfer to Caspian Sea shipping. However, none of the sections of Subcorridor 204 within the Kyrgyz Republic, Tajikistan, and Afghanistan have been built, and costs of construction would be very high due to mountainous terrain.
27. Subcorridor 201 is the simplest and most predictable route. All overland transport can use rail. Between the Caspian Sea and East Asia only two countries are crossed—Kazakhstan and the PRC.
28. Subcorridors 202–204 offer advantages for traffic to and from the central and southern parts of Central Asia—including Uzbekistan, the Kyrgyz Republic, Tajikistan, Turkmenistan, and northern Afghanistan—but are currently limited by the missing links. Traffic to and from Central Asian countries
located near the Caspian Sea is less affected by the missing links and has few borders to cross—for example Turkmenistan (no crossings) and Uzbekistan (one crossing). Longer distance traffic, in particular to the PRC, requires costly transfers to road transport and multiple border crossings.
29. caRec corridor 6: europe–middle east and South asia—Subcorridors 601–604 (figure 1.6). Over the medium to longer term, when Iran economic sanctions have been lifted and existing capacity bottlenecks in Iran and Pakistan have been addressed, Subcorridors 601 and 604 could potentially provide a source of future traffic between Europe and both Iran and Pakistan via the CTC. Subcorridor 601 extends from the Iranian port of Bandar Abbas via Tehran to the southwest coast of the Caspian Sea, meets the Azerbaijan railway south of Baku, and continues to Georgia’s Black Sea ports.

10 RAILWAY SECTOR ASSESSMENT FOR GEORGIA
Figure 1.6: Sections of caRec corridor 6 Relevant for Georgia
602
601604
601602603
603605
603605
603 605
605
604604
605
601602603604
Dogharoun
Yalama
AstaraAstara
AksarayskayaGanyushkino
Aktau
Troitsk
Kairak
Veseloyarsk
Aul
Alashankou
Horgos
TurghundySerhetabat
Sarahs
Sarakhs
Khodzhidavlet
Shirkhan Bandar Panji Poyon
KelesSarygash
SavaiKarasuu
KaramykKaramyk
GardabaniBeyuk Kesik
Hairatan
Karakalpakiya
Farap
Oasis
Alat
Aqina
Dostyk
Bolashak
Chaman
Turkmenbashy
Merke
ChaishorkhGhurian
Torbat-e-Heydarieh
Mashhad
Nukus
Urgench
Bukhara
Shymkent
ASHGABATMary
Samarkand
Kyzylorda
Pavlodar
Karaghandy
ASTANA
OskemenAktobe
Petropavlovsk
Kokshetau
Kostanai
Taldykorgan
Herat
Atyrau
Mangyshlak
Kunduz
KABUL
DUSHANBE
Naryn
BISHKEK Almaty
TASHKENT
NEW DELHI
ISLAMABAD
Kandahar
Oral
BAKU
Shalkar
Semey
Aktogay
UrumqiZhetygen
Arkaly
Shubarkol
Zhezkazghan
Saksaulskaya
Taraz
Gulistan PapAndijan
Irkeshtam
Sary-Tash
Fergana Osh
BokhtarTermez
Sheberghan
Delaram
Gereshk
Gorgan
Bereket
Hazar
Uzen
Beyneu
YEREVAN
TBILISI
Kars
Bautino
Qazvin
Miyaneh
Tabriz
TEHRAN
KarachiGwadar
KATHMANDU
Chabahar
Bandar Abbas
Kashgar
Torugart
Lahore
Quetta
Turkmenabat
DjizzakNavoi
Karshi
Kerki
Dashoguz
Zahedan
Peshawar
Jalalabad
Kandagash
Nikel’tau
Tobol
Mazar-e-Sharif
Rasht
Balykchy
Zharyk
Turpan
Shu
Mointy
Kotlajam
Bostan
Dera Ismail Khan
Basima
Jacobabad
Havelian
Rohri
AngrenMiskin
PotiBatumi
Khorgos
Uchkuduk
SAUDI ARABIA
OMANU.A.E.
QATARBAHRAIN
KUWAIT
IRAQ
TURKEY
SYRIAN ARAB REPUBLIC
UKRAINE
R U S S I A N F E D E R A T I O N
I R A N
R U S S I A N F E D E R A T I O N
GEORGIA
ARMENIA
I N D I A
NEPAL
UZBEKISTAN
AZERBAIJAN
AFGHANISTAN
P A K I S T A N
TURKMENISTAN
TAJIKISTAN
M O N G O L I A
KYRGYZ REPUBLIC
PEOPLE'S REPUBLIC OF CHINA
K A Z A K H S T A N
DRC 6 Existing
DRC 6 Planned/Under Construction
Existing Railways
Railways Outside Project Area
Ferry Lines
Border Crossing Point
Main Cities and Towns
National Capitals
�������� AV
Source: CAREC Secretariat
0 100 200 300 400
Kilometers
This map was produced by the cartography unit of the Asian Development Bank. The boundaries, colors, denominations, and any other information shown on this map do not imply, on the part of the Asian Development Bank, any judgment on the legal status of any territory, or any endorsement or acceptance of such boundaries, colors, denominations, or information.
Source: CAREC Secretariat.
Subcorridor 604 connects this route eastwards to Pakistan and its ports of Karachi and Gwadar. Subcorridors 602 and 603 the North–South Corridor on the western and eastern sides of the Caspian Sea that could potentially serve traffic between the Russian Federation and Iran.
30. In the past decade, Iran and Azerbaijan completed the missing border sections of Subcorridor 601 but Iran has yet to build the 170 km missing link between Rasht and Astara.
31. GR’s existing Corridor 6 traffic is very small. This reflects the prevailing international sanctions against trade with Iran.
2

11
tRenDs in RAilWAY tRAFFiC2
a. introduction32. Historically, the rail link through Georgia and Azerbaijan was developed to transport oil from Central Asia to Russia via the CTC and the Black Sea. The highest annual cargo throughput of the Georgian railway was in 1985 when it reached 64 million tons. Since Georgia’s independence, annual railway traffic has declined. In recent years it has generally carried in the region of 10–20 million tons. The decline was partly because many of its trading partners were part of the FSU and have experienced a period of difficult economic adjustment. It also reflects heightened competition from oil pipelines, alternative regional transit corridors and road transport.
33. As efforts to expand regional economic cooperation and integration gather pace, trade flows between Asia and Europe have been increasing and countries have been addressing critical bottlenecks on
regional transit routes. This is expected to lead to new and expanded traffic opportunities for the Georgian railway, including for transport of bulk commodities and containerized traffic.
b. analysis of traffic34. In 2018, Georgia imported $9.1 billion of goods and exported around $3.4 billion. Its largest trade partners reflect its geographical and historical ties with the FSU (especially Azerbaijan, the Russian Federation, Armenia), as well growth in trade with major regional and global economies (notably the PRC, Turkey, the US). Its main exports are copper ores (15%), motor cars (12.2%), ferro-alloys (10.5%), wine (5.9%), and tobacco products (4.4%). Its main imports are petroleum and oil products (9.5%), motor cars (6.7%), copper ores (4.3%), and pharmaceuticals (3.7%). This is shown in Table 2.1.
Table 2.1: Georgia’s leading trade Partners by value, 2018
imports exports
country $’000 % of total country $’000 % of total
Turkey 1,473,024 16.1 Azerbaijan 502,042 15.0
Russian Federation 934,891 10.2 Russian Federation 436,646 13.0
People’s Republic of China 833,894 9.1 Armenia 278,689 8.3
Azerbaijan 593,014 6.5 Bulgaria 258,866 7.7
Ukraine 514,766 5.6 Turkey 233,497 7.0
Germany 431,454 4.7 People’s Republic of China 198,034 5.9
United States 359,524 3.9 Ukraine 175,044 5.2
Armenia 335,271 3.7 United States 159,971 4.8
France 262,591 2.9 Kazakhstan 90,808 2.7
Italy 231,427 2.5 Uzbekistan 80,487 2.4
Sources: Ministry of Finance; Ministry of Internal Affairs.

12 RAILWAY SECTOR ASSESSMENT FOR GEORGIA
Table 2.2: modal Share by trade value, 2018
modal Share (%)
transport mode exports imports
Road 48.9 42.1
Rail 3.6 9.4
Air 6.5 9.7
Shipping 40.4 34.8
Other 0.6 3.9
Sources: Ministry of Finance; Ministry of Internal Affairs, Georgia.
35. Road transport and shipping are the two leading transport modes for exports and imports by value of goods. Shipping is the least cost mode for many longer distance consignments. Road transport has advantages for shorter distance traffic, is more flexible, and has benefited from improvements in the road network over the past two decades that have lowered road user costs. In 2018, railway transport only attracted 3.6% of exports and 9.4% of imports (Table 2.2). The higher import share is related to the import of crude oil and oil products delivered by train from Azerbaijan, Turkmenistan, Kazakhstan, and the Russian Federation.
36. Since 2014, GR’s liquid cargo traffic, which is mainly comprised of crude oil and oil products, decreased by more than 50%, while dry cargo declined before stabilizing in 2017 and 2018 (Figure 2.1).
15 In the first half of 2019, GR transported about 11,500 TEUs.
Figure 2.1: Railway freight volume, 2014–2018
7,514 6,7485,494
4,3473,140
9,159
7,395
6,3886,325
6,865
5.4%5.2%
5.1%
6.7%
9.5%
0
1
2
3
4
5
6
7
8
9
10
0
2,000
4,000
6,000
8,000
10,000
12,000
14,000
16,000
18,000
2014 2015 2016 2017 2018
Cont
aine
rized
shar
e of r
ail f
reigh
t (%)
Frei
ght v
olum
e (to
n '0
00)
Liquid cargoes Dry cargoes Rail freight containerization
Source: GR 2019.
The rate of containerization of cargo has risen steadily, reaching 9.5% in 2018, but the total number of containers transported remains small.15
TRENDS IN RAILWAY TRAFFIC 13
37. The decline in rail freight is partly due to adverse external developments, including slower growth in the global economy. Some 81% of freight was to or from countries of the Commonwealth of Independent States (CIS), making traffic volumes vulnerable to political and economic problems in these countries. Recent geopolitical conflicts involving the Russian Federation and Ukraine, and international sanctions on the Russian Federation and Iran, have contributed to slower traffic growth in CIS countries (GR 2018).
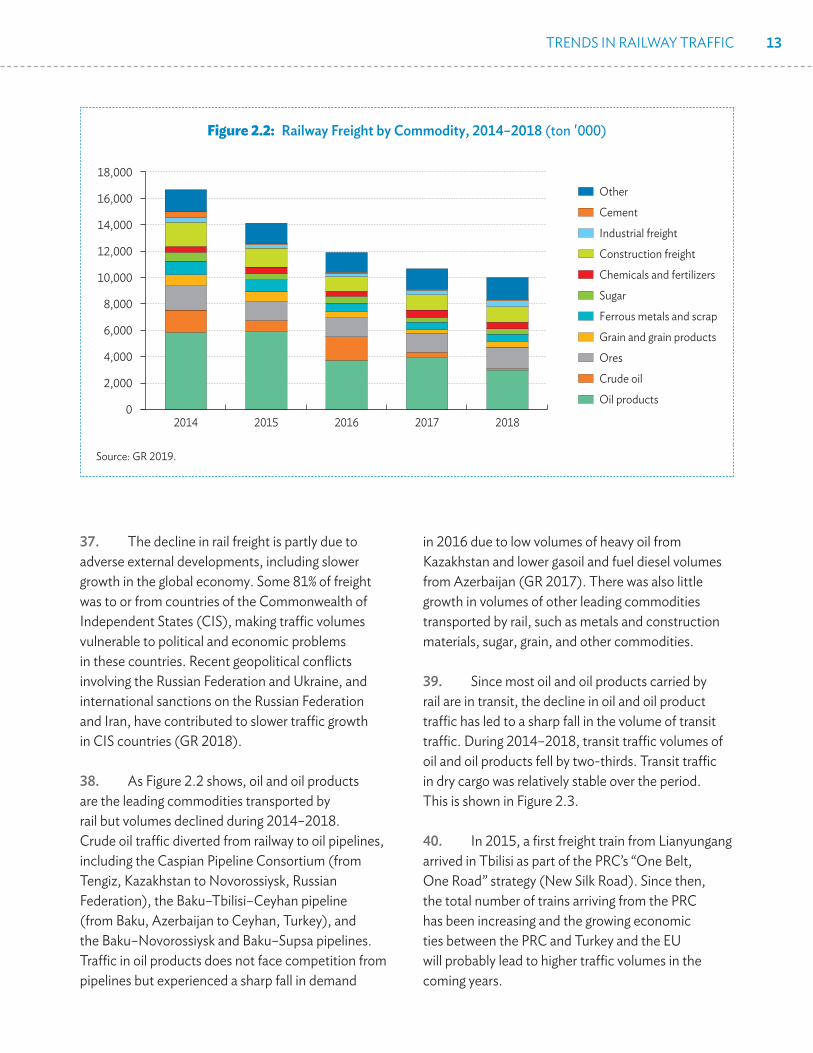
38. As Figure 2.2 shows, oil and oil products are the leading commodities transported by rail but volumes declined during 2014–2018. Crude oil traffic diverted from railway to oil pipelines, including the Caspian Pipeline Consortium (from Tengiz, Kazakhstan to Novorossiysk, Russian Federation), the Baku–Tbilisi–Ceyhan pipeline (from Baku, Azerbaijan to Ceyhan, Turkey), and the Baku–Novorossiysk and Baku–Supsa pipelines. Traffic in oil products does not face competition from pipelines but experienced a sharp fall in demand
in 2016 due to low volumes of heavy oil from Kazakhstan and lower gasoil and fuel diesel volumes from Azerbaijan (GR 2017). There was also little growth in volumes of other leading commodities transported by rail, such as metals and construction materials, sugar, grain, and other commodities.
39. Since most oil and oil products carried by rail are in transit, the decline in oil and oil product traffic has led to a sharp fall in the volume of transit traffic. During 2014–2018, transit traffic volumes of oil and oil products fell by two-thirds. Transit traffic in dry cargo was relatively stable over the period. This is shown in Figure 2.3.
40. In 2015, a first freight train from Lianyungang arrived in Tbilisi as part of the PRC’s “One Belt, One Road” strategy (New Silk Road). Since then, the total number of trains arriving from the PRC has been increasing and the growing economic ties between the PRC and Turkey and the EU will probably lead to higher traffic volumes in the coming years.
Figure 2.2: Railway freight by commodity, 2014–2018 (ton '000)
0
2,000
4,000
6,000
8,000
10,000
12,000
14,000
16,000
18,000
2015 2016 2017 2018
Other
Cement
Industrial freight
Construction freight
Chemicals and fertilizers
Sugar
Ferrous metals and scrap
Grain and grain products
Ores
Crude oil
Oil products
2014
Source: GR 2019.

14 RAILWAY SECTOR ASSESSMENT FOR GEORGIA
Figure 2.3: analysis of Rail freight exports, imports, transit traffic and Domestic traffic, 2014–2018 (million tons)
0
1
2
3
4
5
6
7
2014 2015 2016 2017 2018
Liquid cargo Dry cargo
Transit Export Import Local
0
1
2
3
4
5
6
7
2014 2015 2016 2017 2018
Source: GR 2019.
41. Changes in the demand for consumer goods will also influence rail transport, notably: (i) shipment sizes are becoming smaller due to trends toward individualization and use of eCommerce, (ii) customers are increasingly demanding door-to-door services, and (iii) containerization of freight will increase further. It is therefore important for GR to offer comprehensive logistics solutions in order to capture a larger share of consumer goods traffic.
42. In the case of railway passenger traffic, during 2013–2018 passenger numbers initially declined but then recovered to previous levels. Domestic passengers account for most of the traffic (about 2.8 million in 2018), with only small numbers of international passengers (about 100,000 in 2018). This is shown in Figure 2.4. Passenger traffic is quite seasonal, with capacity fully utilized in the summer months when holiday-makers travel to Black Sea resorts, but around 60% occupancy at other times of year.
Figure 2.4: Domestic and international Railway Passengers, 2013–2018 (million)
International
Domestic
0.1 0.1 0.1 0.1 0.1 0.1
2.9 2.6 2.3 2.4 2.6 2.8
0.00.51.01.52.02.53.03.5
2013 2014 2015 2016 2017 2018
Source: GR 2019.
TRENDS IN RAILWAY TRAFFIC 15
Table 2.3: base case traffic Scenario, 2019–2022
actual Projected
2016 2017 2018 2019 2020 2021 2022
freight volume (million tons)
Liquid cargo 5.5 4.3 3.1 2.9 3.0 3.0 3.1
Dry cargo 5.8 5.6 5.9 6.6 6.8 7.0 7.2
Containers 0.6 0.7 0.9 1.0 1.0 1.1 1.1
Baku–Tbilisi–Kars new railway line – – 0.1 0.1 0.1 0.1 0.1
Anaklia porta – – – – – – 1.0
Subtotal 11.9 10.7 10.0 10.6 10.9 11.3 12.6
freight turnover (million ton-km)
Liquid cargo 1,801.6 1,378.8 944.6 828.0 852.8 878.4 904.8
Dry cargo 1,372.5 1,297.3 1,396.8 1,513.5 1,558.9 1,605.7 1,653.9
Containers 216.8 253.7 213.4 256.8 279.4 287.8 296.4
Baku–Tbilisi–Kars new railway line – – 24.3 41.8 43.0 44.3 45.6
Anaklia porta – – – – – – 229.2
Subtotal 3,390.9 2,929.9 2,579.1 2,640.0 2,734.2 2,816.3 3,130.0
Passengers (million)
Domestic traffic 2.4 2.6 2.7 2.7 2.7 2.7 2.7
International traffic 0.1 0.1 0.1 0.1 0.1 0.1 0.1
Subtotal 2.5 2.7 2.8 2.8 2.8 2.9 2.9a The Anaklia port development project was cancelled in January 2020.Source: GR.
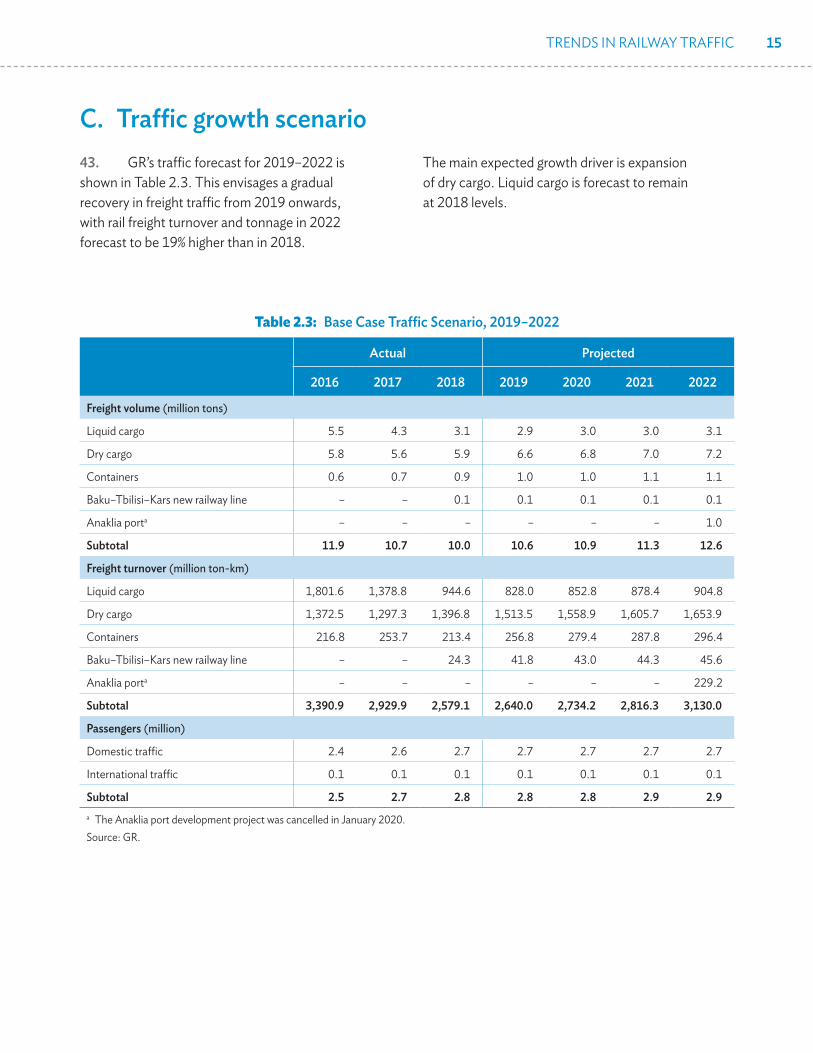
c. traffic growth scenario43. GR’s traffic forecast for 2019–2022 is shown in Table 2.3. This envisages a gradual recovery in freight traffic from 2019 onwards, with rail freight turnover and tonnage in 2022 forecast to be 19% higher than in 2018.
The main expected growth driver is expansion of dry cargo. Liquid cargo is forecast to remain at 2018 levels.

16
MARKet CoMPetitiveness3
a. introduction44. The freight transport market served by GR is highly competitive. For longer distance traffic there is competition from crude oil pipelines and alternative regional corridors. For shorter distance traffic, there is competition from road transport. Georgia has few market entry barriers for road transport operators and no regulation of tariffs, so there are many truck operators and competition from road transport is intense.
b. market feedback45. Interviews were conducted with over a dozen shippers/receivers, freight intermediaries, truck companies and trade associations to understand market perceptions and requirements for using railway. The findings are summarized in Table 3.1.
46. On this basis, railway is currently competitive for bulk cargo that is difficult to carry by truck, and for consignments that require a higher level of safety and security, including dangerous cargo. Rail can potentially be competitive for containerized traffic once upgrading of ports, shipping, rail facilities and terminals on route has been completed. However, it is not competitive for carrying crude oil if transport by pipeline is available, and road transport is generally preferred for perishables and consumer goods.
47. Georgia has a strong record of implementing reforms to strengthen economic competitiveness and attract foreign trade and investment.
In 2019, it was ranked the world’s 16th freest economy, the 6th for ease of doing business, and the 8th lowest in terms of tax burden level (Anaklia Development Consortium 2019). In 2018, it ranked 119 out of 160 countries in terms of the logistics performance index (Deloitte 2019), but the LPI ranking should improve once planned investments in railways, ports and logistics are completed.
c. Problems affecting rail competitiveness
48. Feedback was obtained on some of the main problems that currently limit the competitiveness of railway transport. These are discussed below.
49. Road transport is dynamic and highly competitive. Trucks are abundant, and transport by road is cheap, fast, and flexible. Shippers can use trucks to serve a much larger range of origins and destinations. Empty movements are less of a problem for trucks, as road carriers respond quickly to seasonal and other changes in demand, are flexible about pricing, and can triangulate to achieve loaded, profitable round-trips e.g., Bishkek to Istanbul, Istanbul to Almaty, Almaty to Bishkek.
50. wagon availability and quality are recurring problems. Much of GR’s wagon fleet is old, many wagons are defective, and the mix of wagon types does not match market needs. There are seasonal shortages of specialized wagons. One shipper stated that it has to repair GR wagons before it can use them.

MARKET COMPETITIVENESS 17
Table 3.1: market feedback on Rail competitiveness for Different traffic types
if competitive traffic type examples explanation of Rail competitiveness
Rail is competitive Project cargo, out-of-gauge cargo
Electricity generation and mining equipment
Rail has advantages for moving extra heavy, over-dimension cargo
Minerals From local and foreign mines e.g., manganese, gypsum
Rail is efficient in handling bulk cargo, which often requires specialized equipment
Crude oil and refined petroleum products
Transit from Azerbaijan and Kazakhstan to European markets
For reasons of cost, safety and security, rail is the preferred mode for oil products and for crude oil on routes not served by a pipeline
Chemicals Poisonous, flammable, corrosive cargo; fertilizers and chemicals using natural gas as feedstock
Rail has advantages for safety and security which are prime considerations
Cargo to locations where it is difficult to attract backhaul traffic
Cargo to and from Central Asia
More competitive for receivers with rail siding and facilities for loading/unloading. Much of containerized cargo is transloaded at port because ocean carriers are unwilling to provide containers to distant inland destinations with low prospects of attracting backloads. Shipper/receiver and freight forwarder do not have to manage empty containers when using rail wagons
Containerized traffic
Containers between South/Southeast Europe and Central Asia
Rail competitiveness will improve after completion of planned improvements of Black Sea and Caspian Sea port facilities, and modernization and upgrading of railway facilities in Georgia and Azerbaijan
Rail is not competitive
Crude oil Transit from Azerbaijan and Kazakhstan to European markets
Where pipelines are available they are generally less costly to use than rail
Consumer products Small to medium sized shipments requiring door-to-door service and not needing specialized handling
Road is generally less costly, faster and simpler to organize
Road is especially price competitive for shorter trips (e.g., 100–300 km) and for origins and destinations not on railway line
Perishables Chicken from the US, banana from Latin America arriving by ship
Road is faster, more reliable (including real time tracking and tracing), and better at handling problems such as mechanical failure of refrigerated units
Source: TA consultants.
51. GR does not make full use of price adjustments and service enhancements as tools for improving competitiveness. Road carriers are agile in adjusting their prices to match market conditions, which leads to diversion of traffic from rail to road. GR should study its customer base to know which customers can bear a higher rate because of the special advantages they gain from using rail, and which potential customers could be attracted to rail if offered price discounts or service enhancements.
52. the quality of ports and shipping services on the black and caspian Seas is low and charges are high. This is due to inadequate facilities, lack of customer orientation, and monopolistic practices. A new deep-water port on the Black Sea and the proposed multimodal logistics terminals at Kutaisi and Kumisi will significantly improve the quality of ports and shipping in Georgia. It is important that ongoing efforts by Azerbaijan, Kazakhstan, and Turkmenistan should similarly address the main problems with Caspian Sea ports and shipping.
18 RAILWAY SECTOR ASSESSMENT FOR GEORGIA
53. GR has only limited control over the price for long distance traffic. Since GR’s length of haul is relatively short, most of its cross-border freight travels a greater distance on other countries’ railways than on Georgian railways. Rail tariffs and port and shipping charges of other countries therefore play an important role in determining GR’s price competitiveness. By participating in regional forums such as the TITR Association, GR has been trying to promote tariff transparency and harmonization but it has only had limited success to date.16
54. Small and medium-sized customers find it difficult to arrange cross-border shipments through GR. While immediate price quotations for domestic shipments are available using GR’s website, quotations for cross-border shipments take longer. This is because GR has to coordinate with railways in other countries before providing a price quotation and confirming a wagon for loading. It also reflects the small size of GR’s sales and marketing department which generally giving priority to assisting large shippers/receivers. This contrasts with the situation of road carriers which are quick to provide price quotations and willing to negotiate discounts.
16 For example, in the CTC there have been reported instances of GR granting a rate reduction for rail transport within Georgia but ADY introducing an offsetting rate increase for the portion of the rail journey within Azerbaijan.
17 In the US, railways faced similar problems about 25 years ago. The number of freight forwarders (intermodal marketing companies) was reduced by raising qualification requirements. This enabled consolidation of freight forwarders to become strong, efficient companies with enough resources to invest in containers and intermodal equipment.
55. GR’s freight forwarder sales channel is inefficient. GR works with as many as 1,000 freight forwarders.17 This is too many for a railway of GR’s size. It leads to both cut-throat competition among freight forwarders and excessive administration for GR.
56. GR operates a capital-intensive business in a low margin environment. The intense competition among road transport operators and widespread practice of price-cutting has reduced profit margins for road transport companies to around 3%–5%. In order to compete with road carriers, GR has had to make comparable reduction in its own profit margin. This reduces the revenue that GR can generate to finance investments in infrastructure renewal and long-life assets such as locomotives and wagons.

19
RAilWAY oPeRAting AnD FinAnCiAl PeRFoRMAnCe
4
a. introduction57. This chapter briefly examines GR’s commercial orientation and its operating and financial performance.
b. commercial orientation58. GR is among the most commercially oriented railways in the CAREC region. As discussed in Chapter 1, it has the legal form of a JSC, is required by the government to operate on a self-financing basis, has established separate SBUs and subsidiaries for its main lines of business, maintains accounts in accordance with IFRS, makes realistic provision for depreciation, is subject to independent audit, has a sales and marketing function with freedom to adjust tariffs when needed, and has an enterprise resource planning software platform that enables it to estimate service provision costs and profitability. In line with good practice, GR’s annual reports regularly reassess its performance in its main markets and examine business risks and mitigation measures needed.
59. GR’s main limitation in terms of commercial orientation is that it has maintained a larger staff than would normally be justified by the size of its railway business. This is partly because it expects that recent downturns in traffic levels are temporary and that traffic levels will recover in future.
It also reflects GR’s position as the country’s largest employer, in a setting where unemployment is high and the government attaches priority to job creation and retention (World Bank 2018).
c. financial performance60. As reported in its audited financial statements (Table 4.1), during 2014–2018 GR experienced a decline in operating revenues that was mainly due to the loss of oil transit traffic to pipelines and other regional routes. This resulted in low profitability during 2014–2016, followed by significant losses in 2017 and 2018, although these were largely attributable to exceptional expenses for writing down assets of the Tbilisi Bypass project.18 GR expects traffic levels, revenues and profitability to improve in future, particularly as a result of the Railway Modernization Project, BTK Railway, and future port development.
61. Revenues from freight are GR’s main source of income. As shown in Figure 4.1, in 2018 these provided 57% of revenues, and more than 90% when associated services are considered (e.g., handling, forwarding, freight car rentals).
62. While liquid cargo traffic declined in recent years, the associated reduction in revenue was partly offset by higher revenues per traffic unit. During 2013–2018, these rose from 6.6 to 11.2 Tetri for oil products and from 4.4 to 6.0 for crude oil (Figure 4.2).
18 Construction of this major project was halted due to design shortcomings.
20 RAILWAY SECTOR ASSESSMENT FOR GEORGIA
Table 4.1: Reported Georgian Railway operating Revenue and expenses, 2014–2018 (gel '000)
2018 2017 2016 2015 2014Revenue 444,126 473,511 539,338 605,544 523,923
Expenses (1,089,012)a (766,094)a (363,850) (387,173) (379,151)
Net profit (644,886) (292,583) 175,488 218,371 144,772
Net finance costs (70,484) (60,869) (149,221) (294,423) (99,603)
Profit (loss) before income tax (715,370) (353,452) 26,267 (76,052) 45,169
Income tax (1,169) (648) 38,859 10,555 (5,883)
Total profit (loss) (716,539) (354,100) 65,126 (65,497) 39,286a Includes exceptional write-down expenses for Tbilisi Bypass Project.Source: GR Annual Reports.
Figure 4.1: Revenues by Source, 2018 (gel million)
24152
702527
9
0 50 100 150 200 250 300
Freight transport
Freight handling
Logistical service
Freight car rental
Passenger tra�c
Other
Source: GR 2019.
Figure 4.2: unit Revenues, 2013–2018 (tetri per ton-km)
6.6
4.4
7.27.0
5.0
7.98.8
5.9
10.49.8
4.0
9.99.0
5.1
9.4
11.2
6.0
8.6
0
2
4
6
8
10
12
Oil products Crude oil Dry cargo
2013
2014
2015
2016
2017
2018
Source: GR 2019.

RAILWAY OPERATING AND FINANCIAL PERFORMANCE 21
On the other hand, unit revenues for dry cargo only increased from 7.2 to 8.6 Tetri, after peaking at 10.4 Tetri in 2015.
63. GR’s revenues per passenger-km have steadily increased, reaching 4.3 Tetri in 2018. This was driven by higher passenger demand on the main intercity lines, where the introduction of new trains with higher service standards made it possible to raise prices. In the commuter and domestic passenger segments, GR does not set prices in order to maximize revenue, but to serve as an affordable means of transport, meet needs of lower income groups, and provide a viable alternative to buses and minibus taxis.
19 The UIC database consists of data self-reported by individual railway organizations. 20 The UIC database does not yet include data for Afghanistan so it is not included in the benchmarking analysis. 21 In addition to the national railways of CAREC countries, the sample includes Indian Railways (India), Deutsche Bahn AG (Germany),
Russian Railways, and the Association of American Railroads (North America) which represents the major freight railways of Canada, Mexico, and the US.
D. operational benchmarking
Figure 4.3: comparison of Railway length and Staff Size in Georgia, other caRec member countries and other leading Railway countries
149.9185.55
67.3733.49
67.2816.04
7.794.643.842.131.811.290.62
0 20 40 60 80 100 120 140 160
Length of lines worked (km '000)
1,308.3725.3
308.8147.5
1,841.5130.4
73.364.1
20.218.714.711.95.44.7
0 500 1,000 1,500 2,000
Mean annual sta� strength ('000)
North America
North America
Russian Federation Russian FederationIndia
Germany
Kazakhstan KazakhstanPakistan
Uzbekistan UzbekistanTurkmenistan
TurkmenistanAzerbaijanMongolia
Georgia GeorgiaTajikistan
Kyrgyz Republic Kyrgyz Republic
India
Germany
Pakistan
Azerbaijan
Mongolia
Tajikistan0.42
People’s Rep. of China People’s Rep. of China
CAREC = Central Asia Regional Economic Cooperation, km = kilometer.Note: CAREC Member Countries shown in blue, comparators from other regions shown in red.Source: UIC 2019.
64. Drawing upon railway operational data obtained from the International Union of Railways (UIC 2019),19 aspects of the operational performance of GR have been benchmarked in relation to other CAREC railways (except Afghanistan)20 and leading railways from other regions (Germany, India, the Russian Federation, and North America).21 In most cases the data refers to operational activities in 2017. In other cases, it refers to the most recent year for which data is available.
65. In terms of size of railway network and number of employees, GR is the one of the smaller railways in the CAREC region and small compared with leading railways in other regions. This is shown in Figure 4.3.

22 RAILWAY SECTOR ASSESSMENT FOR GEORGIA
66. The number of wagons owned by GR is greater or of a comparable magnitude to the those in other CAREC MCs expect for Kazakhstan and Uzbekistan but the average age of GR wagons is high. Its fleet of diesel locomotives is smaller than in most of the other MCs since the main line is fully electrified. This is shown in Figure 4.4.
Figure 4.4: comparison of Railway Rolling Stock fleet in Georgia, other caRec member countries and other leading Railway countries
1,660 278
83 53
754 55
23 16 14 13 13 6 2 2
0 500 1,000 1,500 2,000
Railway-owned wagons ('000)
North AmericaIndia
GermanyRussian Federation
People’s Rep. of ChinaKazakhstanUzbekistan
PakistanTurkmenistan
AzerbaijanGeorgia
MongoliaTajikistan
Kyrgyz Republic
6,255 6,023
1,632 6,018
1,217 455 186 158 116 81 53 42
0 5 10 15 20 25 30
Diesel locomotives ('000)
People’s Rep. of ChinaGermany
Russian Federation
Kazakhstan
Uzbekistan
Mongolia
Kyrgyz Republic
North America
India
Pakistan
Azerbaijan
Georgia
Tajikistan
26,547
CAREC = Central Asia Regional Economic Cooperation.Note: CAREC Member Countries shown in blue, comparators from other regions shown in red.Source: UIC 2019.
67. GR’s annual freight and passenger turnover is relatively small compared with most of the other CAREC MCs. This is shown in Figure 4.5.
68. Track density measures the intensity of track utilization in terms of traffic turnover per km of rail. GR’s track density is the third lowest among the comparator countries.
Figure 4.5: comparison of annual Railway freight and Passenger traffic levels in Georgia, other caRec member countries and other leading Railway countries
North America
Germany
Kazakhstan
Pakistan
Mongolia
Tajikistan
Revenue-earning freight (ton-km million)
2,491,876 2,445,132
620,175 70,614
2,146,466 206,258
22,940 13,493 13,327 5,031 4,633 2,963 935 165
0 1,000,000 2,000,000 3,000,000
India
Uzbekistan
Turkmenistan
Azerbaijan
Kyrgyz RepublicGeorgia
Russian Federation
People’s Rep. of China
122,920 77,500
685,213 22,476 19,241 4,294 2,340 973 597 467 43 28
0 500,000 1,000,000 1,500,000
India
Germany
PakistanKazakhstanUzbekistan
TurkmenistanMongolia
GeorgiaAzerbaijan
Tajikistan
Passenger tra�c (passenger-km million)
Kyrgyz Republic
Russian Federation
People’s Rep. of China
1,149,835
CAREC = Central Asia Regional Economic Cooperation, km = kilometer.Note: CAREC Member Countries shown in blue, comparators from other regions shown in red.Source: UIC 2019.

RAILWAY OPERATING AND FINANCIAL PERFORMANCE 23
Figure 4.6: comparison of Railway track and Staff Productivity in Georgia, other caRec member countries and other leading Railway countries
0 5 10 15 20 25 30 35 40 45Russian Federation
IndiaNorth America
People’s Rep. of ChinaGermany
Mongolia
Turkmenistan
Georgia
Kyrgyz Republic
Track density (million pass-km and freight-km per track km)
16.6 1.4
3.6 0.5
1.7 1.5
0.8 0.8
0.4 0.4 0.3 0.3 0.2
0 2 4 6 8 10 12 14 16 18North America
IndiaRussian Federation
GermanyKazakhstan
Kazakhstan People’s Rep. of ChinaTurkmenistan
MongoliaUzbekistan
Uzbekistan
PakistanPakistanAzerbaijan
Azerbaijan GeorgiaKyrgyz Republic
TajikistanTajikistan
Sta� productivity (million pass-km and ton-km per sta�)
30.6 26.3
16.3 4.4
42.1 14.1
8.0 5.9
4.1 3.5
2.8 2.4 2.3
0.3 0.0
CAREC = Central Asia Regional Economic Cooperation, km = kilometer.Note: CAREC Member Countries shown in blue, comparators from other regions shown in red.Source: UIC 2019.
Figure 4.7: comparison of locomotive and wagon Productivity in Georgia, other caRec member countries and other leading Railway countries
1.5170.3
155.0 92.1
36.0 154.5
127.7 124.7
99.8 60.5
20.2 18.5 17.7
0 20 40 60 80 100 120 140 160 180Russian Federation
IndiaNorth America
GermanyPeople’s Rep. of China
KazakhstanMongolia
UzbekistanPakistan
AzerbaijanKyrgyz Republic
GeorgiaTajikistan
Loco productivity (million pass-km and ton-km per loco)
2.2
0.93.7
2.81.9
1.00.9
0.60.3
0.20.2
0 1.0 1.5 2.0 2.5 3.0 3.5 4.00.5India
North AmericaGermany
KazakhstanPeople’s Rep. of China
MongoliaUzbekistan
TurkmenistanKyrgyz Republic
PakistanGeorgia
AzerbaijanTajikistan
Wagon productivity (million ton-km per owned wagon)
4.6 0.1
CAREC = Central Asia Regional Economic Cooperation, km = kilometer.Notes: (i) CAREC Member Countries shown in blue, comparators from other regions shown in red; (ii) productivity calculations are less accurate for countries with higher use of leased locomotives or wagons, such as Kazakhstan. Source: UIC 2019.
This provides an indication that GRs current traffic levels are too. Similarly, staff productivity can be measured as traffic turnover per staff member. GR’s staff productivity is again the third lowest among the comparator countries, and only a third and a sixth of the productivity level in the four higher productivity CAREC MCs. This provides a further indication that GR is overstaffed for its present level of operations. This is shown in Figure 4.6.
69. A further set of productivity measures concerns rolling stock asset utilization. Locomotive productivity measures annual traffic turnover per locomotive. GR’s locomotive productivity is one of the lowest among the CAREC MCs. Wagon productivity measures annual traffic turnover per owned wagon. GR’s wagon productivity is again one of the lowest among the CAREC MCs. For both locomotive and wagon productivity, the common underlying issue is the low traffic level. This is shown in Figure 4.7.

24
PRoPosAls FoR investMent, CoMMeRCiAlizAtion, AnD ReFoRM
5
a. introduction70. Drawing on the previous chapters, this final chapter discusses opportunities for railway sector development in Georgia and identifies promising proposals to be considered for prefeasibility study support, capacity development and knowledge-related assistance through the present CAREC Railway Sector Development TA.
b. Policy setting71. The government has an overall vision for Georgia to fully realize the transit potential of its strategic location at the crossroads of Europe and Asia. This will directly contribute to economic growth while enabling Georgian producers and service providers to become competitive in export markets. The strategy for realizing this vision incorporates policy directions for railways, ports and logistics to contribute to the realization of Georgia’s transit potential, including (i) development of transport infrastructure, (ii) enhancement of international cooperation, (iii) harmonization of relevant national legislation with European legislation, (iv) development of logistics centers and value-added services, and (v) improvement of safety and service levels. Much of the investment in transport infrastructure in Georgia has been completed or is underway or planned. The parts of the strategy that are most challenging are those that require cooperation among a number of countries to upgrade and streamline transit corridors beyond Georgia’s territory.
c. commercialization and reform
72. As discussed in Chapters 1 and 4, the government has already accomplished a great deal in reforming GR to operate along commercial lines. Aspects that may merit further attention include (i) further strengthening GR’s sales and marketing function; (ii) introduction of new railway technologies and best practices; (iii) addressing the problem of periodic rolling stock shortages; (iv) in collaboration with shipping lines, developing strategies to increase containerization; and (v) improving the effectiveness of regional initiatives to develop, promote and manage transit corridors.
D. Proposals for support from caRec Railway Sector Development ta
73. The following proposals were discussed with the TA consultants during the Georgia country visit.
1. Prefeasibility studies
74. contrailer prefeasibility study. GR has received commercial proposals for introduction of “contrailer” services to carry road transport trucks and trailers on railway platforms across the CTC. Containers could also be carried. The intention would be to divert traffic from road onto rail, which would also reduce road accidents and environmental pollution.

PROPOSALS FOR INVESTMENT, COMMERCIALIZATION, AND REFORM 25
According to the proposals, standard wagons could be used as the railway platforms which would avoid the need to invest in specialized platforms and improve financial feasibility. It would be necessary to also confirm whether these would be compatible with height restrictions for tunnels and bridges. GR is interested to conduct a feasibility study to examine the case for using contrailers in Georgia.
75. Study of regional railway wagon supply arrangements. In view of the problem of national and regional shortages of wagons of various types, it would be useful to conduct a study of future freight demand and associated railway wagon requirements in the TITR over the short, medium and longer term, and to identify improved mechanisms for augmenting and managing wagon fleets to improve wagon availability and utilization. This would consider both public and private sector wagon ownership options, including leasing. It would also examine the option of shared ownership, for example by setting up a wagon supply company jointly owned by members of the TITR Association (e.g., Georgia, Azerbaijan, Kazakhstan). In the US, there have been successful examples of railway companies setting up jointly owned wagon supply companies.
2. Knowledge products and events
76. Regional corridor management organization. Within its own borders, Georgia has made significant progress implementing investment projects and reforms to enhance its competitiveness for transit traffic. However, for shippers and freight forwarders the overall competitiveness of a regional transit corridor depends on the quality and efficiency of the entire corridor from origin to destination. This requires multiple countries and agencies along the corridor to coordinate their actions and harmonize service quality.
77. Lessons from other regions suggest that coordination and harmonization can be improved by establishing some form of corridor management organization (CMO) or corridor management system.
This can take responsibility for organizing more regular block trains, setting stable rates for through transportation from origin to destination, designing transport service improvements and improving transit reliability and speed, monitoring corridor performance and competitiveness, promoting the corridor to users, and identifying and resolving corridor performance issues.
78. A CMO could play an important role in helping Georgia and partner countries to realize the potential of the TITR for railway transit traffic. It might begin by covering only Georgia, Azerbaijan, and Kazakhstan, with the aim of improving the performance and competitiveness of using the CTC route (e.g., run regular block trains, establish transparent through tariffs for railways and Caspian Sea shipping, improve frequency and reliability of Caspian Sea shipping services). Once this approach has shown positive results, other countries could be attracted to join, including (i) countries on the west coast of the Black Sea, including Romania, Ukraine, Bulgaria, and Turkey, (ii) Central Asian countries, including Afghanistan, the Kyrgyz Republic, Tajikistan, Turkmenistan, and Uzbekistan, and (iii) the PRC. When economic sanctions on Iran are eventually removed, there could also be a case for Georgia, Azerbaijan, Turkey, and Iran to establish a CSO to realize the potential of the CAREC Subcorridors 601 and 604.
79. Georgia is interested in receiving expert advice on how a CMO could be introduced to support the development of the TITR, including the role and responsibilities of the CMO, its operating arrangements and financing, and the role of consignment tracking and electronic information exchange systems to increase service quality.
80. black Sea shipping study. The government wishes to commission an international consulting firm to study the competitiveness of Black Sea shipping services between Georgia and west coast ports such as Constanta, Varga, Odessa, and Istanbul,
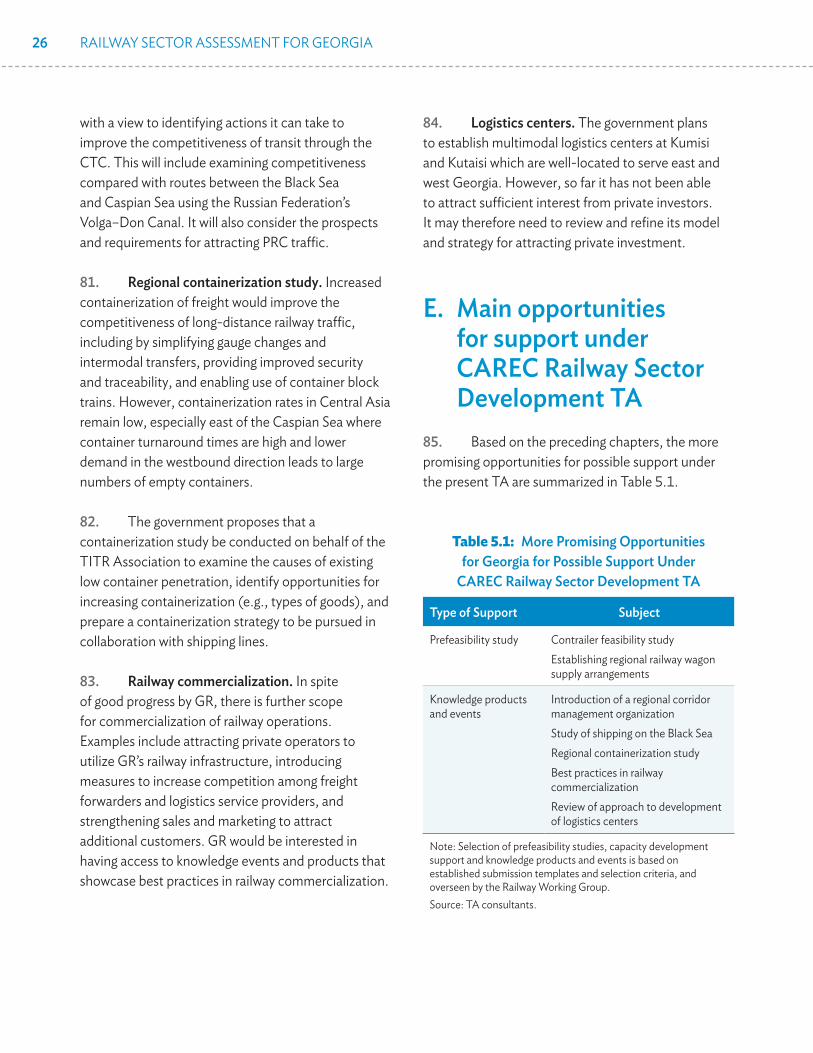
26 RAILWAY SECTOR ASSESSMENT FOR GEORGIA
with a view to identifying actions it can take to improve the competitiveness of transit through the CTC. This will include examining competitiveness compared with routes between the Black Sea and Caspian Sea using the Russian Federation’s Volga–Don Canal. It will also consider the prospects and requirements for attracting PRC traffic.
81. Regional containerization study. Increased containerization of freight would improve the competitiveness of long-distance railway traffic, including by simplifying gauge changes and intermodal transfers, providing improved security and traceability, and enabling use of container block trains. However, containerization rates in Central Asia remain low, especially east of the Caspian Sea where container turnaround times are high and lower demand in the westbound direction leads to large numbers of empty containers.
82. The government proposes that a containerization study be conducted on behalf of the TITR Association to examine the causes of existing low container penetration, identify opportunities for increasing containerization (e.g., types of goods), and prepare a containerization strategy to be pursued in collaboration with shipping lines.
83. Railway commercialization. In spite of good progress by GR, there is further scope for commercialization of railway operations. Examples include attracting private operators to utilize GR’s railway infrastructure, introducing measures to increase competition among freight forwarders and logistics service providers, and strengthening sales and marketing to attract additional customers. GR would be interested in having access to knowledge events and products that showcase best practices in railway commercialization.
84. logistics centers. The government plans to establish multimodal logistics centers at Kumisi and Kutaisi which are well-located to serve east and west Georgia. However, so far it has not been able to attract sufficient interest from private investors. It may therefore need to review and refine its model and strategy for attracting private investment.
e. main opportunities for support under caRec Railway Sector Development ta
85. Based on the preceding chapters, the more promising opportunities for possible support under the present TA are summarized in Table 5.1.
Table 5.1: more Promising opportunities for Georgia for Possible Support under
caRec Railway Sector Development ta
type of Support Subject
Prefeasibility study Contrailer feasibility studyEstablishing regional railway wagon supply arrangements
Knowledge products and events
Introduction of a regional corridor management organization Study of shipping on the Black SeaRegional containerization studyBest practices in railway commercializationReview of approach to development of logistics centers
Note: Selection of prefeasibility studies, capacity development support and knowledge products and events is based on established submission templates and selection criteria, and overseen by the Railway Working Group. Source: TA consultants.


2928
APPENDIX | CAREC DEsIgNAtED RAIl CoRRIDoRs
DRC = designated rail corridors.Source: CAREC Secretariat.
602
601604
601602603
603605
603605
603 605
605
604 604
605
601602603604
501502503
501502503
502
503
301
302
301
301302
301302
201
202
201202
202203
201
204203
204
204
202203204
201202203204
201202203
102103
103
102
103101
102103
101
101102103
ChaishorkhGhurian
Torbat-e-Heydarieh
Mashhad
Nukus
Urgench
Bukhara
Shymkent
ASHGABATMary
Samarkand
Kyzylorda
Pavlodar
Karaganda
NUR-SULTAN
OskemenAktobe
Petropavlovsk
KokshetauKostanai
Taldykorgan
Herat
Atyrau
Mangyshlak
Kunduz
KABUL
DUSHANBE
Naryn
BISHKEK
Almaty
TASHKENT
ISLAMABAD
Kandahar
Oral
BAKU
Shalkar
Semey
Aktogay
UrumqiZhetygen
Arkalyk
Shubarkol
Zhezkazghan
Saksaulskaya
Taraz
Gulistan Pap
Andijan
IrkeshtamSary-TashFergana Osh
Bokhtar
TermezSheberghan
Delaram
Gereshk
Gorgan
Bereket
Hazar
Uzen
Beyneu
YEREVAN
TBILISI
Kars
Bautino
Qazvin
Miyaneh
Tabriz
TEHRAN
KarachiGwadarChabahar
Bandar Abbas
Kashgar
Torugart
Lahore
Quetta
Turkmenabat
DjizzakNavoi
Karshi
Kerki
Dashoguz
Zahedan
Peshawar
Jalalabad
Kandyagash
Nikel’tau
Tobol
Mazar-e-Sharif
Rasht
Balykchy
Zharyk
Turpan
Shu
Mointy
Bostan
Zhob
KotlajamDera Ismail Khan
Basima
Jacobabad
Havelian
Rohri
Hami
Poti
Sokhumi
BatumiAngren
Miskin
Lugovaya
Uchkuduk
Khorgos
Yalama
AstaraAstara
AksarayskayaGanyushkino
Aktau
Troitsk
Kairak
Veseloyarsk
Aul
Alashankou
Horgos
TurghundySerhetabat
SarahsSarakhs
Khodzhidavlet
Shirkhan Bandar Panji Poyon
KelesSarygash
SavaiKara-Suu
KaramykKaramyk
GardabaniBeyuk Kesik
Hairatan
Karakalpakiya
Farap
Oasis
Alat
Aqina
Dostyk
Bolashak
Chaman
Turkmenbashy
Chaldovar
SAUDI ARABIA
OMANU.A.E.
QATARBAHRAIN
KUWAIT
IRAQ
TURKEY
SYRIAN ARAB REPUBLIC
UKRAINE
R U S S I A N F E D E R A T I O N
I R A N
R U S S I A N F E D E R A T I O N
GEORGIA
ARMENIA
UZBEKISTAN
AZERBAIJAN
AFGHANISTAN
P A K I S T A N
TURKMENISTAN
TAJIKISTAN
M O N G O L I A
KYRGYZ REPUBLIC
P EOP LE' S R EP UBLI C O F C HINA
K A Z A K H S T A N
Xinjiang UygurAutonomous
Region
Border Crossing Point
Main Cities and Towns
National Capitals
DRC 1: Europe–East Asia
DRC 2: Mediterranean–East Asia
DRC 3: Russian Federation–Middle East and South Asia
DRC 4: Russian Federation–East Asia
DRC 5: East Asia–Middle East and South Asia
DRC 6: Europe–Middle East and South Asia
Legend
DRC Existing
DRC Planned/Under
Construction
AV
0 100 200 300 400
Kilometers
Source: CAREC Secretariat
This map was produced by the cartography unit of the Asian Development Bank. The boundaries, colors, denominations, and any other information shown on this map do not imply, on the part of the Asian Development Bank, any judgment on the legal status of any territory, or any endorsement or acceptance of such boundaries, colors, denominations, or information.
402
402403
403
401402
401ULAANBAATAR
Tavan Tolgoi
Sainshand
Choibalsan
DarkhanSukhbaatar
Baruun-Urt
Erdenet
Shiveekhuren
ErenhotZamiin-Uud
Bichigt
Naushki
Ereentsav
Gashuun Sukhait
M O N G O L I A
Inner MongoliaAutonomous Region
Choir

30
ReFeRenCesAsian Development Bank (ADB). 2017. Unlocking
the Potential of Railways: A Railway Strategy for CAREC, 2017–2030. ADB: Manila.
———. 2018. Railway Sector Development in Central Asia Regional Economic Cooperation Countries. Technical Assistance Report. ADB: Manila.
———. 2019. Basic Statistics, 2019. ADB: Manila.
Anaklia Development Consortium. 2019. Project Overview. PowerPoint Presentation.
CTI Engineering. 2012. Master Plan on Road and Transport Sector Development (2010–2025). ADB Grant 0123-KGZ.
Deloitte. 2017. Competitive Analysis of the Caucasus Transit Corridor. USAID: Tbilisi.
———. 2019. Study on Transport and Logistics Value-Added and Manufacturing Services. USAID: Tbilisi.
European Union (EU). 2018. Eastern Partnership: Indicative TEN-T Investment Action Plan. EU.
Georgian Railway (GR). 2016. 2015 Annual Report. GR: Tbilisi.
———. 2017. 2016 Annual Report. GR: Tbilisi.
———. 2018. 2017 Annual Report. GR: Tbilisi.
———. 2019. 2018 Annual Report. GR: Tbilisi.
International Union Railways (UIC). 2019. UIC Statistics. https://uic.org/support-activities/statistics/.
World Bank. 2018. Georgia: From Reformer to Performer—A Systematic Country Diagnostic. World Bank: Washington, DC.

Railway Sector Assessment for Georgia
The report summarizes the findings of the railway sector assessment for Georgia, based on a country visit conducted on 24 June to 1 July 2019. The purpose of this assessment is to examine the setting, characteristics, performance and prospects of railways, and identify promising investment opportunities, commercialization and reform actions that could be considered for support through the ADB technical assistance for Railway Sector Development in CAREC countries.
About the Central Asia Regional Economic Cooperation Program
The Central Asia Regional Economic Cooperation (CAREC) Program is a partnership of 11 member countries and development partners working together to promote development through cooperation, leading to accelerated economic growth and poverty reduction. It is guided by the overarching vision of “Good Neighbors, Good Partners, and Good Prospects.” CAREC countries include: Afghanistan, Azerbaijan, the People’s Republic of China, Georgia, Kazakhstan, the Kyrgyz Republic, Mongolia, Pakistan, Tajikistan, Turkmenistan, and Uzbekistan.