Radio and Network Planning
19
Wireless Pers Commun (2010) 55:305–323 DOI 10.1007/s11277-009-9803-3 Planning and Deployment of WiMAX Networks Pedro Sebastião · Fernando José Velez · Rui Costa · Daniel Robalo · António Rodrigues Published online: 26 August 2009 © Springer Science+Business Media, LLC. 2009 Abstract Incorporation of measurement based techniques in Worldwide Interoperability for Microwave Access (WiMAX) are required to improve IEEE 802.16 engineering meth- odologies. Wireless planning methodologies are presented, supported by a planning tool which facilitates the design and implementation of WiMAX networks. Propagation mod- els available for WiMAX still need to be tuned and further validated. By comparing IEEE 802.16-2004 measurement results at 3.5 GHz with computed values using the modified Friis and the Stanford University Interim (SUI) models, for a suburban area, we found that the use of the modified Friis equation with a propagation exponent ∼3 is more appropriate than the use of the SUI model, although, for coverage distances between 275 and 475 m, the SUI-B and mainly SUI-C models may still be used. From the analysis of the carrier-to-noise-plus- interference ratio, it is clear that both noise and interference present a strong limitation to the cellular reuse performance of fixed WiMAX mainly for higher order modulation and coding P. Sebastião Instituto de Telecomunicações/Lisbon University Institute-ISCTE/Instituto Superior Técnico, Av. Rovisco Pais, 1, Torre Norte, 1049-001 Lisboa, Portugal e-mail: [email protected] F. J. Velez (B ) · R. Costa · D. Robalo Instituto de Telecomunicações-Department of Electromechanical Engineering, Universidade da Beira Interior, Calçada Fonte do Lameiro, 6201-001 Covilhã, Portugal e-mail: [email protected] R. Costa e-mail: [email protected] D. Robalo e-mail: [email protected] F. J. Velez Centre for Telecommunications Research, King’s College London, Strand, London WC2R 2LS, UK A. Rodrigues Instituto de Telecomunicações/Instituto Superior Técnico, Av. Rovisco Pais, 1, Torre Norte, 1049-001 Lisboa, Portugal e-mail: [email protected] 123
-
Upload
independent -
Category
Documents
-
view
2 -
download
0
Transcript of Radio and Network Planning

Wireless Pers Commun (2010) 55:305–323DOI 10.1007/s11277-009-9803-3
Planning and Deployment of WiMAX Networks
Pedro Sebastião · Fernando José Velez · Rui Costa ·Daniel Robalo · António Rodrigues
Published online: 26 August 2009© Springer Science+Business Media, LLC. 2009
Abstract Incorporation of measurement based techniques in Worldwide Interoperabilityfor Microwave Access (WiMAX) are required to improve IEEE 802.16 engineering meth-odologies. Wireless planning methodologies are presented, supported by a planning toolwhich facilitates the design and implementation of WiMAX networks. Propagation mod-els available for WiMAX still need to be tuned and further validated. By comparing IEEE802.16-2004 measurement results at 3.5 GHz with computed values using the modified Friisand the Stanford University Interim (SUI) models, for a suburban area, we found that the useof the modified Friis equation with a propagation exponent ∼3 is more appropriate than theuse of the SUI model, although, for coverage distances between 275 and 475 m, the SUI-Band mainly SUI-C models may still be used. From the analysis of the carrier-to-noise-plus-interference ratio, it is clear that both noise and interference present a strong limitation to thecellular reuse performance of fixed WiMAX mainly for higher order modulation and coding
P. SebastiãoInstituto de Telecomunicações/Lisbon University Institute-ISCTE/Instituto Superior Técnico,Av. Rovisco Pais, 1, Torre Norte, 1049-001 Lisboa, Portugale-mail: [email protected]
F. J. Velez (B) · R. Costa · D. RobaloInstituto de Telecomunicações-Department of Electromechanical Engineering,Universidade da Beira Interior, Calçada Fonte do Lameiro, 6201-001 Covilhã, Portugale-mail: [email protected]
R. Costae-mail: [email protected]
D. Robaloe-mail: [email protected]
F. J. VelezCentre for Telecommunications Research, King’s College London, Strand, London WC2R 2LS, UK
A. RodriguesInstituto de Telecomunicações/Instituto Superior Técnico, Av. Rovisco Pais, 1, Torre Norte,1049-001 Lisboa, Portugale-mail: [email protected]
123
306 P. Sebastião et al.
schemes. With a reuse pattern K = 7, cell throughputs near the maximum are only achievedin the uplink if sub-channelisation is used together with sectorization. The planning tool pro-vides planners with practical and useful information through quick coverage/capacity basedprocedures, and outputs the number and position of the base stations and an estimation of thetotal cost of implementation, based on data provided by different equipment manufacturers.WiMAX cellular planning exercises are presented for the zone of Covilhã, Portugal, whereGeographic Information Systems are used for representation of rural and sparse urban areas.One of the main conclusions is the strong need to use sector antennas in order to guaranteean adequate coverage, and higher system capacity whilst mitigating interference for severalterrain types and environments, including hilly terrain.
Keywords Network communications · Mobile communication systems ·Public networks · Wireless communication
1 Introduction
Presently telecommunications systems provide the opportunity to use Worldwide Interop-erability for Microwave Access (WiMAX) based technologies, since they support mobilebroadband Internet services in outdoors (and even in indoor, for the lower frequency bands)with high coverage ranges and user mobility support. They also allow the exchange of trulywide and broadband multimedia content, and support simultaneously all Internet Protocol(IP) voice, data, streaming, image and video multi-rate communications.
WiMAX is the commercial name for IEEE 802.16. In terms of standardisation, the IEEE802.16-2004 group is dedicated to Point-to-Point (PtP) and Point-to-Multipoint (PtM) net-works (without mobility support) while the IEEE 802.16e group is dedicated to PtM networksthat support mobility. WiMAX uses Orthogonal Frequency Division Multiplexing (OFDM),Orthogonal Frequency Division Multiple Access (OFDMA) and dynamic modulation scal-ing, i.e., the system is able to adapt itself to the best modulation/coding schemes, taking intoaccount carrier-to-noise-plus-interference (CNIR) versus physical throughput constraints [1].
Channels of 3.5, 7 and 10 MHz are defined in IEEE 802.16-2004. As link distances ofthe order of tens of kilometres can be guaranteed, WiMAX is a good solution for broadbandbackhauling, up to 50 km (in the PtP case) and cell coverage radius between 2 and 5 km(in the PtM case).
The goal of cellular coverage is to provide access to mobile users within a given zone,called cell while guaranteeing the quality of the received signal in both directions, uplink(UL) and downlink (DL), even for the users at cell boundary. As resources, e.g., frequencychannels, need to be reused in different geographical zones (but not in close proximity), theimpact of interference among co-channel cells needs to be evaluated also in both directions.In WiMAX, as in Universal Mobile Telecommunications System (UMTS) and High SpeedDownlink Packet Access (HSDPA), the ideal situation would be to reuse the channels inevery cell, i.e., to deploy systems with a frequency pattern, K , equal to one, which wouldbe achieved by means of Pseudo Random Mapping (PRM) of sub-carriers where OFDMAis used. However, due to heavy interference in frequency reuse deployment, users at the celledge may suffer from low connection quality since these improvements tmay not be availablein some versions of the standard, or may simply reduce but not eliminate interference.
In the context of WiMAX cellular deployment and planning, research on the variation ofthe carrier-to-noise-plus-interference ratio with different system parameters is therefore ofparamount importance, and techniques such as sub-channelisation need to be explored.
123
Planning and Deployment of WiMAX Networks 307
In the south of Europe, the introduction of WiMAX gains special interest for emergencyand security public services. For example, in Summer time, forest fires are a persistentcalamity, and authorities lack access to real-time fire information in order to coordinate firebrigades. For demonstration a network was deployed in the city of Covilhã, Portugal usingIEEE 802.16-2004 equipment with 3.5 MHz channels at 3.5 GHz [2] supporting eight differ-ent Modulation and Coding Schemes (MCSs). However, only with the use of IEEE 802.16estandard [3] true mobility will be supported. Different received power levels correspond todifferent net Physical (PHY) bit rates and to MCSs. This PtM network is the basic tool forour research in broadband mobile access, mobile IP, and always best connected WiMAX sce-narios, including the possibility of performing extensive field trials in the frequency divisionduplexing (FDD) mode.
In order to automate the cellular planning process, graphical planning tools that accountfor terrain profile need to be applied. In a previous version of the planning tool presentedin [4], the so-called Wireless Planning Tool (WPT) addressed only the IEEE 802.11 Wi-Fistandards [5]. In this paper, fixed WiMAX functionalities have been incorporated in the newplatform. For a given coverage region and expected user capacity, the WPT estimates theposition of APs leading to the lowest cost, based on data provided by manufacturers. Thereare other tools in the market for Wi-Fi and/or WiMAX planning which involve higher com-plexity and costs [6–9] but do not include both technical and economic/budget issues as inthis version of the WPT.
The remaining of this paper is organized as follows. Section 2 addresses outdoor propaga-tion models. IEEE 802.16-2004 equipment 3.5 GHz, was used to a compare measurementswith the theoretical values for the modified Friis and Stanford University Interim (SUI) prop-agation models. In Sect. 3, the trade-offs regarding carrier-to-noise-plus-interference ratio areaddressed. As the existence of obstacles, e.g., mountains, trees and buildings can affect line-of-sight propagation, Geographic Information System (GIS) based dimensioning is used forrural and sparse urban areas, in mixed hilly/flat zones. Section 4 presents the WiMAX cellu-lar planning framework and scenario, highlights the functionalities and potentialities of theWPT, and discusses the results. Finally, conclusions are presented in Sect. 5.
2 Outdoor Propagation Models
2.1 SUI Versus Modified Friis
In Non Line-of-Sight (NLoS) channel conditions, signals may undergo scattering, diffrac-tion, polarization changes and reflection impairments, which affect their level and phase atthe receiver. Usually these impairments are not important when there is Line-of-Sight (LoS)between the transmitter and the receiver.
For outdoor environments, obstacles, such as buildings materials, foliage, and clutter, alsocontribute to increase path loss [10,11]. In this context, the SUI outdoor propagation modelis especially relevant [11], and it will be considered together with the modified Friis model.
Over the years, various models have been developed to characterize Radio Frequency(RF) environments and allow for the prediction of the RF signal strengths. These empiricalmodels are used to predict large-scale coverage for radio communications systems in cellularapplications and provide estimates for Path Loss (PL) by considering the transmitter/receiverdistance, terrain factors, antenna height, and cellular frequencies. Nevertheless, according to[11] none of these models address the needs of broadband fixed wireless adequately, thus
123
308 P. Sebastião et al.
providing the rational to develop the SUI model. This model is used in the IEEE 802.16standard and is described in [12]. The wireless PL model includes, as parameters, antennaheights, carrier frequency and types of terrain [11]. Apart from the modified Friis model(where the propagation exponent γ takes an empirical value other than 2), one possible solu-tion is therefore the SUI model, which is an extension of earlier wireless propagation models[11].
The SUI model considers three basic terrain types:
Category A—Hilly/moderate-to-heavy tree density;Category B—Hilly/light tree density or flat/moderate-to-heavy tree density;Category C—Flat/light tree density.
These terrain categories provide a simple method to estimate more accurately the PL of theRF channel in an NLoS situation. Being statistical in nature, the model is able to represent therange of PLs experienced within an actual RF link. SUI propagation models were exploredfor the design, development and testing of WiMAX links in six different scenarios, SUI-1 toSUI-6 [13]. By using these propagation models, it is then possible to predict more accuratelythe coverage probability achieved within a base station site sector. Although these models donot replace detailed site planning (and site surveying) they may provide an estimate beforeactual planning of the network. Besides, it is very important to perform RF planning activitiesto adequately evaluate specific environment factors, co-channel interference, actual clutterand terrain effects.
This model allows several frequencies and subscriber station (SS) heights. The path lossis given (in dB) by [10]
P L (d) = P L (d0) + 10 · γ · log10 (d/d0) + X f + Xh + S (1)
where P L(d0) is the standard path loss for a distance d0 from the non-modified Friis model,and
γ = a − b · hb + c/hb, (2)
where d is the distance between the Base Station (BS) and a given point, in meters,d0 = 100 m, λ = c/ f is the wave length, c = 3 × 10⁸ ms−1, f is the carrier frequency,hb is the BS height above ground, in meters (10 < hb < 80 m), and a, b and c are param-eters which are chosen according to three terrain types, represented by A, B or C, Table 1.The terms X f and Xh are correction factors for frequency and SS antenna height above theground, respectively.
These correction factors are defined as
X f = 6.0 · log ( f/2000) (3)
and
Xh ={−10.8 · log(hm/2.0), for terrain types A and B
−20.0 · log(hm/2.0), for terrain type C(4)
where f is the carrier frequency, in MHz, and hm is the receiver height above the ground, inmeters. The term S is a lognormal-distributed random variable, with zero mean and standarddeviation σS , with typical values from 8.2 to 10.6 dB, depending on the type of terrain [10].This term takes shadow fading originated by trees and structures into account [10].
The average received power is given by P R(d) = P E − P L(d), where PE is the averagetransmission power, and P L(d) is the average path loss (attenuation factor).
123

Planning and Deployment of WiMAX Networks 309
Table 1 Values for theparameters in the SUI model
Model constant Terrain type
A B C
a 4.6 4.0 3.6
b 0.0075 0.0065 0.0050
c 12.6 17.1 20
In the other commercially available cellular planning tools, models with high complexitycan be used, namely, the NLoS dominant ray path loss one [10,14]. However, in order toobtain the most efficient cellular planning tools, it is important to compare these modelswith the simplest ones, e.g., the modified Friis and SUI model, and validate them againstexperimental results.
2.2 Experimental Results
Figure 1 presents some of the PtM Alvarion WiMAX equipment used in the experimentalsetup installed on the roof top of the Health Sciences Faculty (HSF) of University of BeiraInterior, Covilhã, near the Hospital.
They are a BreezeMAX 3000 OFDM micro BS and self-installable Alvarion Breeze-MAX Customer Premise Equipments (CPEs) operating at 3.5 GHz. The omnidirectional BSantenna and the Outdoor Unit (ODU) are shown in the left picture while the BS and CPEare presented in the right hand side ones. The appropriate Ethernet and RF cables werealso used, as well as a Global Positioning System (GPS) device, a 12–240 V power inverter(to feed the CPE), and a portable PC, used as a terminal and running a File Transfer Protocol
Fig. 1 IEEE 802.16-2004 PtM equipment operating at the experimental setup
123

310 P. Sebastião et al.
Fig. 2 Measurements of SNR[dB] at 3.5 GHz in the DL (NLoS regions are represented in grey)
(FTP) application, the BreezeCONFIG software, and a tool for acquiring GPS positions. Inthe HSF backhaul network, there was an FTP server, and a Dynamic Host ConfigurationProtocol (DHCP) server, for automatically assigning an IP address to the users’ CPEs. TheBS antenna gain is 10 dBi (360◦ azimuth, 8◦ elevation, vertical polarization). The SS antennais a beam switching array of six 9 dBi, 60◦ antennas, integrated into the CPE.
Field trials were performed in the suburban area of Covilhã, in a zone with approximately2.80 × 1.55 km2, and initial results for the Signal-to-Noise Ratio, SNR, and the through-put were obtained at the SSs (or CPEs) that roam around the suburban area surroundingthe HSF. The dynamic range of the CPE was found to be adequate. The BreezeMAX du-plexing frequency range is 3499.5–3553.5 MHz and 3550–3600 MHz for Downlink (DL),and 3399.5–3453.5 MHz, and 3450–3500 MHz for Uplink (UL) [8]. In these particular fieldtests, our ODU was operating at 3551.75 MHz (DL), and 3451.75 MHz (UL). ODU trans-mitter power was 28 dBm. There is a direct correspondence between the SNR values fromFig. 2, the achieved MCSs, and data rate, e.g, ∼6 Mbps for 16-QAM.
NLoS regions, obtained with ArcGIS, are represented in the background, in grey, in Fig. 2.At distances far from the base station, the experimental regions with reasonable signal qualitycoincide basically with the LoS regions. However, for distances up to ∼550 m even NLoSareas near the boundary between LoS and NLoS areas can be covered.
Another important issue is the comparison between the results for curve fitting of SNR, orcarrier-to-noise ratio (C/N ) and the curves obtained from the application of the propagationmodels (SUI model and modified Friis equation), as depicted in Fig. 3, for distances up to∼1.6 km.
Within the modified Friis model different propagation environments are modelled bydifferent propagation exponents, γ , which vary from γ = 2, corresponding to free spaceconditions, e.g., rural areas, to γ = 3, in urban areas (no shadowing), and γ = 4, in shad-owed urban areas [15,16]. For the SUI model [11], one considers hm = 2 m, hb = 13.3 mand σS = 8.8 dB. For both models, total antenna gain (transmitter plus receiver) of 19 dBi, aradio frequency bandwidth br f = 3.5 MHz, and a noise factor N f = 3 dB were used.
To understand the results, an analysis of the terrain profile around the BS location at HSFis required. While at Southeast (SE) of the BS the terrain is flat, at Northwest (NW) it iscontinuously hilly, with increasing altitudes. In Fig. 2 the crown with a radius of ∼550 mfrom the BS is part of the suburban region of Covilhã, with a moderate building density. Thesecond crown, for distances larger than 550 m, corresponds to a rural area at SE, and to adense urban area at NW. However, this urban area corresponds to zones predominantly in
123

Planning and Deployment of WiMAX Networks 311
C/N = -8.259log(d ) + 25.417
-20
-10
0
10
20
30
40
50
60
70
80
0 0.2 0.4 0.6 0.8 1 1.2 1.4 1.6
C/N
[dB
]
d [km]Friis (γ=2) Friis (γ=3) Friis (γ=4) Measured
SUI (type A) SUI (type B) SUI (type C) Trendline
Fig. 3 Trend curve for the measured SNR in the locations around HSF-UBI: comparison between the SUIand the modified Friis models
LoS with the BS as the terrain height continuously increases from the BS to this zone. AtSE, the zones up to a distance of ∼550 m are predominantly in NLoS due to the shadowingeffect of the roof. However, at NW of the BS, this crown is predominantly covered withLoS (as for longer distances), as the terrain height increases. For distances larger than 550 mmeasurements were taken mostly with LoS coverage.
A curve fitting approach was used to interpret measurement results from Fig. 3 (in dB).The coefficient −8.259 for log (d) corresponds to a very low power decay rate. If the modi-fied Friis equation is considered, the experimental results take values similar with the curvefor γ = 4 for distance in the interval [60, 150] m, similar to the ones from the curve forγ = 3 for distances in the interval [300, 500] m. Then, for larger coverage distances, valuescorrespond to modified Friis equation propagation exponents between 2 and 3. It seems thatthe results consecutively correspond to (1) shadowed urban areas, (2) urban areas (with noshadowing), and (3) approximately free space, which partially agrees with the actual terrain.Unlike the SUI model, in this case, distances shorter than 100 m are considered.
Despite the fact that use of the SUI model is recommended for WiMAX, the comparisonof experimental results with the SUI model is harder since they only coincide for distancesin the interval [275, 475] m. In order to clarify this issue, Fig. 4 presents a partial analysis ofthe results for C/N in this interval, where a different trendline is considered, and only themodified Friis equation curve for γ = 3 is considered for comparison, as it approximatelyfollows the experimental trendline for the results with a difference of circa 2.5 dB (which canbe caused by the penetration loss due to the placement of the SS antenna in the rear seat ofthe car during the measurements).
If this difference of 2.5 dB was discounted from results for modified Friis equation withγ = 3, the curves would be almost coincident. This was confirmed by the reduction of themean square error (MSE) from 4.917 to 0.113.
Without this correction factor, while the distance to the BS increases, the trendline con-secutively crosses the curves for SUI-A, SUI-B, and SUI-C, i.e., the curves for (a) hilly/moderate-to-heavy tree density, (b) hilly/light tree density or flat/moderate-to-heavy treedensity, and (c) flat/light tree density, respectively. The experimental results cross the threecurves of the SUI model but a good correspondence was only found for the SUI-B and
123

312 P. Sebastião et al.
C/N = -32.72log(d ) + 15.86
14
20
26
32
38
0.25 0.3 0.35 0.4 0.45 0.5
C/N
[dB
]
d [km]
Friis (γ=3) Measured SUI-A SUI-B SUI-C Trendline
Fig. 4 Analysis of the measured SNR for distances in the interval [275, 475] m: comparison between the SUIand the modified Friis models
SUI-C, as the MSE is 1.564 and 1.617, respectively. For the SUI-A curve the mean squareerror was 4.657. However, if we apply the correction factor of 2.5 dB (as for the modifiedFriis equation) the results for the SUI-A and SUI-B models would be much worst (MSE of19.227 and 9.247, respectively). Only the curve for the SUI-C would still offer an almostacceptable correspondence (with an MSE of 4.808).
3 Carrier-to-Noise-Plus-Interference Ratio
In order to achieve an efficient use of the radio frequency spectrum, it is important to choosea frequency reuse scheme that leads to full coverage guarantee and improved system capacitywhilst minimising the interference. In WiMAX, the achievable user physical throughput isa function of the supported MCS which, in turn, depends on the values of the achievableCNIR. It is therefore important to analyse the evolution of CNIR with the distance and withseveral system parameters.
If frequency division duplexing (FDD) is used in fixed WiMAX, an analytical approachmay be followed to solve coverage and frequency reuse problems. Worst-case situationsoccur in the DL when the BS transmits to the SS, located at the cell edge, whilst receivinginterference from the BSs of the six co-channel cells of each ring of interference at a distanceD (the reuse distance). Previous research on intercell interference in broadband wirelessaccess is addressed in [17,18]. In the UL, the worst-case situation occurs when the SS istransmitting to the BS from the cell boundary, while interfering mobiles are at the interfer-ing cells boundary (in the region closest to the central cell), at a distance D-R (where R isthe coverage distance). When sectorization is considered the number of interfering cells isdecreased, and system capacity increases.
As there would be limitations arising from an independent analysis of the carrier-to-noiseand the carrier-to-interference ratios, cellular planning has to consider simultaneously bothconstraints [19,20]. CNIR is taken into account by assuming that the weights for noise andinterference are the same.
123

Planning and Deployment of WiMAX Networks 313
The modified Friis propagation model with γ = 3, transmitter power Pt = −2 dBW, trans-mitter and receiver antenna gains, Gt = 17 dBi and Gr = 9 dBi, respectively, were assumed.Note that transmitter antenna gain is 7 dB higher than the value considered in Sect. 2. Radiofrequency bandwidth were the same as in Sect. 2.
Since sub-channelisation in the IEEE 802.16-2004 UL is an optional feature, we exploredits impact on the achieved MCS. Differently from the mobile version of WiMAX, IEEE802.16-2004 only supports sub-channelisation in the UL. It limits SS transmissions to 1/16of the bandwidth assigned to the UL communication to the BS. The standard defines 16sub-channels, and 1, 2, 4, 8 or all sets of sub-channels can be assigned to a SS. Each user ina different sub-channel may use a different MCS in a flexible way as far he/she is using adifferent sub-channel.
To better understand the changes caused by sub-channelisation (16 sub-channels) andsectorization it is worthwhile to plot charts for CNIR as a function of the co-channel reusefactor, rcc, with R as a parameter.
The power of the carrier at the receiver is obtained by computing the power received byan SS at a distance R from the BS. The computation of the interference depends on the ULand DL configurations, and on the use of sectorization as well. The required equations aregiven in [21].
In fixed WiMAX, an important comparison is between absence and presenceof sub-channelisation in the UL. Another important case is the simultaneous use ofsub-channelisation and sectorization.
From these charts, considering the C/N thresholds for each MCS, i.e, (C/N )min, it isstraightforward to obtain the achievable physical cell throughput, not considering the mix-ture of services and applications, and the corresponding “multiplexing” characteristics. Thesecharts allow exploring what the achievable CNIR and throughput for a given reuse pattern, K .As, for hexagonal-shaped cells, K = 7 corresponds to a reuse factor rcc = 4.58 we consideredthis value as a goal. Since the supported system capacity depends on rcc, it is worth to representthe dependence of CNIR on rcc. We are aware that, for the cases where sub-channelisation isconsidered in Fixed WiMAX, the approach we follow for CNIR does not cope with per sub-channel equivalent SINR (or CNIR) computations. These computations can be performedaccounting either for exponential effective SINR mapping (EESM), effective code rate map(ECRM), or mean instantaneous capacity (MIC), and may be applied in the future to improvethe relevance of the CNIR curves through the use of one of these compression techniques.
Figure 5 shows CNIR as a function of rcc with R as a parameter for the UL while Fig. 6presents the corresponding variation of the achievable throughput with rcc for each MCS.The WiMAX equipment uses eight different MCS with different CNIR thresholds, Table 2.
It is clear that for rcc = 4.58, values of CNIR are always lower than 8.9 dB, and thatfor coverage distances larger than 2 km they decrease drastically. As a consequence, forrcc = 4.58, the achievable physical throughput is very low (Rb = 2.82 Mbps maximum)compared with the maximum achievable, i.e, 12.27 Mbps, Fig. 6.
Although the results are not presented here the following conclusions were also made:(1) for the DL the results are better, and a value of the physical throughput of 4.23 Mbpsis achieved for distances up to 2 km; (2) with sub-channelisation, improvements are onlyevident for the highest coverage distances, i.e., the main improvement is on the coverage.
If sectorization is applied alone then the values for CNIR at rcc = 4.58 will be higher.However, a truly improvement for coverage distances up to 3 km (not only up to 2 km any-more) requires both sectorization and sub-channelisation for the UL, Fig. 7. For these valuesof rcc and R, the values of CNIR exceed 15 dB. This clearly confirms the need to use bothimprovement techniques simultaneously.
123

314 P. Sebastião et al.
Fig. 5 CNIR as a function of rccwith R as a parameter, for the UL,no sub-channelisation
-10
-5
0
5
10
15
20
25
0 2 4 6 8 10C
/(N
+I)
[dB
]
rcc
R=250m
R=500m
R=1000m
R=1500m
R=2000m
R=3000m
R=4500m
R=5000m
Fig. 6 Physical throughput as afunction of rcc with R as aparameter, for the UL, nosub-channelisation
0
2
4
6
8
10
12
0 2 4 6 8 10
Rb[M
bps]
rcc
R=250m
R=500m
R=1000m
R=1500m
R=2000m
R=3000m
R=4500m
R=5000m
Table 2 Correspondencebetween MCSs, minimum CNIRand the physical throughput
ID MCS CNIRmin (dB) Physical through-put (Mbps)
1 BPSK 1/2 3.3 1.41
2 BPSK 3/4 5.5 2.12
3 QPSK 1/2 6.5 2.82
4 QPSK 3/4 8.9 4.23
5 16-QAM 1/2 12.2 5.64
6 16-QAM 3/4 15.0 8.47
7 64-QAM 2/3 19.8 11.29
8 64-QAM 3/4 21.0 12.27
Improvements in the analysis may be obtained with the assessment of the achievablethroughput, Rb, as function of the distance within a cell when the coverage distance(or cell radius) takes a given value, e.g., R = 2 or 3 km. For a fixed rcc, since higher coveragedistances imply limitations on coverage but less interference, it is important to compare theachievable maximum throughput for a given value of the reuse pattern, e.g., K = 7, for eachvalue of the distance, d , from the BS to an SS, and each MCS. Different values are consideredfor the coverage distances, R.
123

Planning and Deployment of WiMAX Networks 315
0
2
4
6
8
10
12
14
0 2 4 6 8 10
Rb[M
bp
s]
rcc
R=250m
R=500m
R=1000m
R=1500m
R=2000m
R=3000m
R=4500m
R=5000m
Fig. 7 Physical throughput as a function of rcc , with R as a parameter, for the UL, with sub-channelisationand sectorization
0
2
4
6
8
10
12
14
0 500 1000 1500 2000 2500 3000
Rb
[Mb
ps]
d [m]
R=3km (presence)R=2km (presence)R=3km (absence)R=2km (absence)
Fig. 8 Maximum achievable physical throughput as a function of d for K = 7, and for R = 2 and 3 km forthe UL, in the absence and presence of sub-channelisation/sectorization
In the omnidirectional case, while the power of the received carrier is computed for a dis-tance d , the distances for the computation of interference can be maintained, i.e., rcc · (R −1)
for the UL and ∼ rcc · R for the DL. In the tri-sectorial case, the power of the receivedcarrier is also computed for a distance d , but in the computation of interference the followingformulation stands
C/I = d−γ
(rcc · R + 0.7 · d)−γ + (rcc · R − 0.22 · d)−γ. (5)
Figure 8 presents the maximum achievable throughput as a function of d for K = 7 for theUL, in the absence of sub-channelisation and sectorization, 0 ≤ d ≤ R. A similar analysiswas also performed for the DL, and better results were achieved. Although the results are notpresented here, for a fixed K , with the use of sectorization (tri-sectorial 120◦ antennas) there isa clear increase on the distances for which the highest values for the throughput are achievable.
Figure 8 also presents results for the maximum distances up to which MCS may be usedwith sub-channelisation and sectorization (tri-sectorial 120◦ antennas). Using these valuesfor the distance, and applying a simple equation to compute the areas it is possible to obtainthe size of the multiple rings where it is possible to support each MCS.
123

316 P. Sebastião et al.
Table 3 Average cell throughput for R = 2 and 3 km
Rb−av (Mbps) R = 2 km R = 3 km
No sub-channelisation
With sub-channelisation
No sub-channelisation
With sub-channelisation
DL UL UL DL UL UL
Omnidirectional 7.624 6.473 6.803 6.753 5.886 6.751
Sectorial 9.664 9.664 10.808 7.756 7.756 10.605
Table 3 presents the results for the average of maximum throughput obtained by combin-ing the results for the throughput with the ones for the size of the covered area for both linkdirections, with and without the use of sub-channelisation. For a fixed K , the use of sub-channelisation improves the coverage slightly. Only sectorization clearly increases the achiev-able throughput. Furthermore, the simultaneous use of sub-channelisation and sectorizationclearly benefits the use of the highest level MCSs for coverage distances larger than in theremaining cases.
Without sectorization, while for R = 2 km the consideration of sub-channelisation onlyleads to an increase in UL throughput of 4.8%, from 6.473 to 6.803 Mbps, for R = 3 kmthe increase reaches 15.1%, from 5.886 to 6.751 Mbps. For R = 3 km the use of sub-channelisation leads to an almost perfect balance between the DL and UL whilst for R = 2 kmthis improvement does not occur.
With sectorization, while for R = 2 km the consideration of sub-channelisation leadsto an increase in throughput in the UL of 11.84%, from 9.664 to 10.808 Mbps, for R =3 km the increase is 36.73%, from 7.756 to 10.605 Mbps. In this case, with the use of sub-channelisation, UL throughput clearly surpasses DL throughput.
Therefore, both noise and interference present strong limitations to the cellular reuseperformance of fixed WiMAX, mainly for higher order MCSs. As a consequence, with areuse pattern K = 7, cell throughputs near the maximum are only achieved in the UL ifsub-channelisation is used together with sectorization due to the simultaneous decrease ofthe noise power and the mitigation of interference through sectorization.
In the omnidirectional case, with the use of sub-channelisation, although the noise powerdecreases, the improvement only allows for a balance of the physical throughputs betweenthe UL and DL for R = 3 km. Nevertheless, these relative improvements are not achievedfor R = 2 km.
The use of sectorization reduces the interference, and an improvement on the achievablephysical throughput of ∼59% is obtained for R = 2 km relatively to the omnidirectional case(from 6.803 to 10.808 Mbps).
However, for R = 3 km, the impact of noise is higher. Without sub-channelisation,the improvement is only of ∼32% (from 5.886 to 7.756 Mbps). Only with the use of sub-channelisation a larger improvement, of ∼57%, is achieved with sectorization (from 6.751to 10.605 Mbps).
We learned from this work that there is a need to improve the results for the maximumachieved throughput in the outer coverage rings of the cells as this is the zone that suffersthe highest interference. The use of relays within fractional reuse schemes is being pointedout as a solution for this challenge, and this issue needs to be investigated.
123

Planning and Deployment of WiMAX Networks 317
Fig. 9 Toolbar on the graphic environment of ArcGIS
4 Wireless Planning Tool
4.1 Framework and Scenario
Models for the achievable physical throughput, cellular coverage, and frequency reuse arevery useful for the automation of cellular planning procedures. Cellular planning is highlydependent on the propagation environment and a careful choice of the placement, height andtilt of the BS transmitter antennas is needed in order to ensure a high percentage of LoSwithin the cells. As a consequence, the use of GIS is needed to account for the terrain profile.
In the context of the MobileMAN project [22], a cellular fixed WiMAX PtM network [1],covering the whole district of Covilhã, and in particular the city area was considered. Whilethe overall cellular structure is mainly dedicated to emergency and security public servicesurban micro-cells will support e-learning and e-health services, among others.
Although the district of Covilhã area is 550 km2, the territorial framework of the frequencyband license assigned by ANACOM, the Portuguese regulator, is broader, and includes thewhole area under study within the MobileMAN project in Beira Interior, Portugal.
4.2 Functionalities and Potentialities of the WPT
The WPT uses ArcGIS as a working environment and allows for automating the planning.Radio and network characteristics are studied, including the link budget, definition of radiopropagation models, and system capacity. The planning tool is made available as a toolbar inArcGIS allowing the user to choose several system parameters, such as the number of basestations, the number of users, and network different environments, Fig. 9.
The options included into the toolbar are accessed via buttons and include the followingWiMAX planning functionalities:
4.2.1 Definition of Urban Zones
With this button urban zones are defined for BSs not working at full power since, as the userdensity is much higher than in rural areas, the limitation is system capacity rather than radiocoverage. Limitations on transmitter power may also arise due to regulatory constraints.
4.2.2 Equipment
There are two buttons that deal with options for the WiMAX equipment. The first enables tochoose equipment, according to data provided by its manufacturer, while the second dealswith the equipment data. The available equipment can be either from a manufacturer avail-able on the market or customized by the user definitions. In the former case, it is possible todefine bandwidth, frequency, and type of antenna. In the latter, the planner may define all theparameters, e.g., bandwidth, transmission power, sensitivity, frequency, and type of antenna.
123

318 P. Sebastião et al.
Fig. 10 Map with different kind of users (cells use sectorial antennas to cover the district of Covilhã)
4.2.3 Sites with LoS and NLoS
This option allows for the verification of the existence of LoS, and helps to choose the prop-agation model to be used on each zone of the map, compute the received power, and analysethe type of application.
4.2.4 Received Power and Coverage
This functionality creates three different layers. One has a coloured map for each value com-puted for the received power at each point of the map, depicted in Fig. 10. The other shows thevalues for CNIR and, using them, it is possible to check the areas with appropriate coverageand select the capacity option to be used at each point. The remaining layer is a schemewhere the different areas covered by each BS, the interference areas, and areas that were notcovered are represented.
One of the functionalities of the GIS tool is the creation and superposition of layers (non-line-of-sight versus line-of-sight, received power, CNIR, spatial coverage and user positionswhile supporting different classes of service).
4.2.5 Users
Presents a menu to define the percentage of users in each class, e.g., percentages of userswith real time services, and the density of users per km2. Figure 10 shows that these usersare then randomly distributed on the map, where the different classes are distinguished bydifferent symbols. The three service classes, one, two and three, distinguish real-time appli-cations at 64, 384, and 2000 kbps, respectively. A given percentage of users has access totime-based applications (the ones where the time is an intrinsic component of the appli-cation, e.g., voice or video) while others are using non time-based ones. Results include
123
Planning and Deployment of WiMAX Networks 319
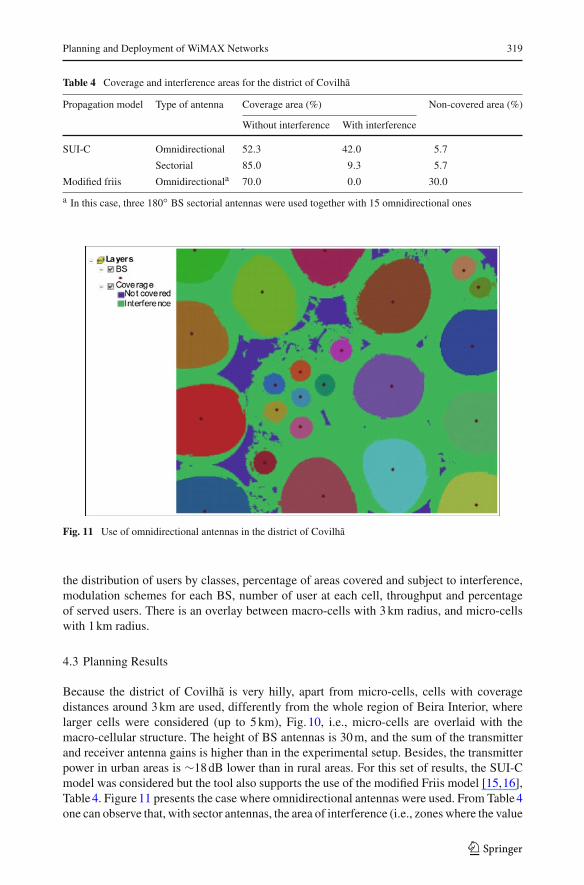
Table 4 Coverage and interference areas for the district of Covilhã
Propagation model Type of antenna Coverage area (%) Non-covered area (%)
Without interference With interference
SUI-C Omnidirectional 52.3 42.0 5.7
Sectorial 85.0 9.3 5.7
Modified friis Omnidirectionala 70.0 0.0 30.0
a In this case, three 180◦ BS sectorial antennas were used together with 15 omnidirectional ones
Fig. 11 Use of omnidirectional antennas in the district of Covilhã
the distribution of users by classes, percentage of areas covered and subject to interference,modulation schemes for each BS, number of user at each cell, throughput and percentageof served users. There is an overlay between macro-cells with 3 km radius, and micro-cellswith 1 km radius.
4.3 Planning Results
Because the district of Covilhã is very hilly, apart from micro-cells, cells with coveragedistances around 3 km are used, differently from the whole region of Beira Interior, wherelarger cells were considered (up to 5 km), Fig. 10, i.e., micro-cells are overlaid with themacro-cellular structure. The height of BS antennas is 30 m, and the sum of the transmitterand receiver antenna gains is higher than in the experimental setup. Besides, the transmitterpower in urban areas is ∼18 dB lower than in rural areas. For this set of results, the SUI-Cmodel was considered but the tool also supports the use of the modified Friis model [15,16],Table 4. Figure 11 presents the case where omnidirectional antennas were used. From Table 4one can observe that, with sector antennas, the area of interference (i.e., zones where the value
123
320 P. Sebastião et al.
of CNIR is below the lowest threshold) is reduced from 42%, in the omnidirectional case,Fig. 11, down to 9.3% in the sector case, Fig. 10, while the covered area (without interference)increases from 52.3 to 85.0%.
In another exercise, where we considered the modified Friis model, one obtained ∼70%of LoS coverage of the area.
5 Conclusions
In this paper we describea PtM demonstrator for fixed WiMAX that provided measurementsfor cellular coverage in the suburban area of Covilhã, Portugal. For this zone, and for somedistance ranges, by using a curve fitting approach, we conclude that the modified Friis modelmay be used with a propagation exponent γ = 3. From the analysis of the results, we alsoconclude that the Stanford University Interim model may be considered, mainly SUI-C butalso SUI-B, as the mean square error is reasonable.
From the analysis of CNIR, it is clear that noise and interference present a strong limitationto the performance of fixed WiMAX mainly for higher order modulation and coding schemes.With a reuse pattern K = 7, cell throughputs near the maximum are only achieved in the ULif sub-channelisation is used together with sectorization. With the use of sub-channelisationalone, although noise power decreases, the improvement only allows for balancing the phys-ical throughputs between the UL and DL for R = 3 km (but not achieved for R = 2 km).
For low coverage distances, the use of sectorization alone in the UL allows a substantialgain in the physical throughput. However, for larger coverage distances, in the absence of sub-channelisation the achieved gain is not comparable with the case where sub-channelisationis present.
In general terms, the use of sectorization in fixed WiMAX allows for reducing the reusepattern while considering sub-channelisation allows for improvements on the coverage. Thereduction of the reuse pattern corresponds to an increase in system capacity but the improve-ments in the coverage range (through sub-channelisation) can also allow for an indirectimprovement in system capacity, as adaptive MCSs are used.
Some improvements were made in the previous tool, the so-called WPT [4], which allowsfor a planning designer to dimension WMAN topologies via a practical approach. It is possibleto obtain the signal coverage and throughput maps from the plan of a given zone. Hence, thistool constitutes a simple and complete way to implement the most recent WMAN solutions.Besides, it also produces budget planning. LoS dimensionings, based in GIS, were addressed,and applications to rural and sparse urban areas were presented. One important conclusion isthe need for sectorial antennas to guarantee an adequate coverage and interference mitigationfor several terrain types and environments, including hilly terrains.
Future research directions motivated by the need to improve the results for the maximumachieved throughput in the outer cell coverage rings as this is the zone that suffers the highestinterference. The use of relays within fractional reuse schemes can be a solution to answerto this challenge.
Acknowledgments This work was partially funded by MobileMAN (Mobile IP for Broadband WirelessMetropolitan Area Network), an internal project from Instituto de Telecomunicações/ Laboratório Associado,by CROSSNET (Portuguese Foundation for Science and Technology POSC project with FEDER funding), by“Projecto de Re-equipamento Científico” REEQ/1201/EEI/ 2005 (a Portuguese Foundation for Science andTechnology project), and by the Marie Curie Intra-European Fellowship OPTIMOBILE (Cross-layer Optimi-zation for the Coexistence of Mobile and Wireless Networks Beyond 3G, FP7-PEOPLE-2007-2-1-IEF). Theauthors acknowledge the fruitful contributions on ArcGIS tools from Eng.◦ José Romão, Eng.◦ José Riscado
123

Planning and Deployment of WiMAX Networks 321
and Prof. Victor Cavaleiro from STIG-UBI, and the contribution given by the final year project students inseveral programming and measurement tasks. Authors also acknowledge the fruitful discussions within COST2100, a cooperation Action on Pervasive Mobile & Ambient Wireless Communications. Fernando J. Velezacknowledges the fruitful discussions with Prof. Hamid Aghvami. Special thanks are due to Prof. CarlosSalema who helped us in the final revision of the manuscript.
References
1. Liu, H., & Li, G. (2005). OFDM-based broadband wireless networks—design and optimization. Hobo-ken, New Jersey, USA: Wiley.
2. IEEE. (2009). IEEE standard for local and metropolitan area networks—part 16: Air interface forfixed broadband wireless access systems. New York, NY, USA: IEEE Std 802.16-2009 (Revision ofIEEE Std 802.16-2004), IEEE.
3. IEEE. (2006). IEEE standard for local and metropolitan area networks—Part 16: Air interface forfixed and mobile broadband wireless access systems—amendment 2: Physical and medium accesscontrol layers for combined fixed and mobile operation in licensed bands and corrigendum 1. NewYork, NY, USA: IEEE Std 802.16e-2005 and IEEE Std 802.16-2004/Cor 1-2005 (Amendment andCorrigendum to IEEE Std 802.16-2004), IEEE.
4. Tomé, R., Lourenço, P., Grilo, A., Cercas, F. C., Rodrigues, A. J., Velez, F. J., et al. (2005). A WLANplanning tool with a practical approach. In Proceedings of International Symposium on WirelessPersonal Multimedia Communications WPMC (Vol. 2, pp. 1286–1290). Denmark: Aalborg.
5. IEEE. (1999). Part II: Wireless LAN media access control (MAC) and physical layer (PHY) specifi-cations. New York, NY, USA: IEEE Std 802.11-1999, IEEE.
6. Fragoso, J. G., & Tejada, G. M. G. (2005). Cell planning based on the WiMax standard for homeaccess: A practical case. In Proceeding of 2nd ICEEE and XI CIE 2005 (pp. 89–92). Mexico.
7. Ibraihim, A. H., Ismail, M., Kiong, T., & Mastan, Z. (2005). Development of software planning toolsfor an-intelligent traffic light wireless communication link using 5.8 GHz WLAN. In Proceeding of2005 Asia-Pacific Conference on Applied Electromagnetics (pp. 378–382). Malaysia: Johor.
8. Ruiz, S., Samper, Y., Pèrez, J., Agusti, R., & Olmos, J. (1998). Software tool for optimisingindoor/outdoor coverage in a construction site. Electronics Letters, 34(22), 2100–2101.
9. Wertz P., Sauter M., Wölfle G., Hoppe R., & Landstorfer F. (2004). Automatic optimization algorithmsfor the planning of wireless local area networks. In Proceeding of VTC 2004-Fall, IEEE 60th VehicularTechnology Conference 2004-Fall-Wireless Technologies for Global Security (pp. 3010–3014). LosAngeles, CA, USA.
10. Anderson, H. R. (2003). Fixed broadband wireless systems design. Chichester, West Sussex, UK: Wiley.11. Erceg, V., et al. (1999). An empirically based path loss model for wireless channels in suburban
environments. IEEE Journal of Selected Areas in Communications, 17(7), 1205–1211.12. IEEE 802.16 Working Group. (2001). Channels models for fixed wireless applications. Document
802.16.3c-01/29r4.13. Hari, K. (2000). Interim channel models for G2 MMDS fixed wireless applications. Tampa, USA:
IEEE 802 plenary meeting.14. Wahl, R., Stäbler, O., & Wölfle, G. (2007). Propagation model and network simulator for stationary and
nomadic WiMAX networks. In Proceeding of IEEE VTC 2007 Fall-IEEE 66th Vehicular TechnologyConference. Baltimore, MD, USA.
15. Rappaport, T. S. (2002). Wireless communications: Principles and practice. Upper Saddle River, NJ,USA: Prentice Hall.
16. Moldkar, D. (1991). Review on radio propagation into and within buildings. In Proceeding of IEEMicrowaves, Antennas and Propagation, (Vol. 138, No.1, pp. 61–73).
17. Panagopoulos, A. D., Arapoglou, P.-D. M., Kanellopoulos, J. D., & Cottis, P. G. (2007). Intercellradio interference studies in broadband wireless access networks. IEEE Transactions on VehicularTechnology, 56(1), 3–12.
18. Sari, H. (2001). A multimode CDMA with reduced intercell interference for broadband wirelessnetworks. IEEE Journal on Selected Areas in Communications, 19(7), 1316–1323.
19. Bauer, G., Bose, R., & Jakoby, R. (2005). Three-dimensional interference investigations for LMDSnetworks using an urban database. IEEE Transactions on Antennas and Propagation, 53(8), 2464–2470.
20. Velez, F. J., Correia, L. M., & Brázio, J. M. (2001). Frequency reuse and system capacity in mobilebroadband systems: Comparison between the 40 and 60 GHz bands. Wireless Personal Communica-tions, 19(1), 1–24.
123
322 P. Sebastião et al.
21. Velez, F. J., Carvalho, V., Santos, D., Marcos, R. P., Costa, R., Sebastião, P., et al. (2005). Planningof an IEEE 802.16e network for emergency and safety services. In Proceeding of 3G 2005-6th IEEInternational Conference on 3G Mobile Communication Technologies (pp. 507–511). London, UK.
22. http://www.e-projects.ubi.pt/mobileman/.
Author Biographies
Pedro Sebastião (S’95-M’05) received the BSc degree in Electron-ics, Telecommunications and Computing from ISEL, Polytechnic Insti-tute of Lisbon, Portugal, in 1992. He received his Licenciado and MScdegrees in Electrical and Computer Engineering from IST, TechnicalUniversity of Lisbon, in 1995 and 1998, respectively. He worked forDepartment of Studies and Inovation in the Portuguese Defence Indus-tries (1992–98), Department of Business Communication in Siemens(1999–2005), and ISG, a High Education Business School, as a lecturer(1999–2005). In 2005 he joined LUI-ISCTE, where he is a lecturer.He is a research assistant at Instituto de Telecomunicações since 1995.He has been involved on several research projects and his interestsinclude planning tools for Wi-Fi and WiMAX, stochastic models andefficient simulation algorithms for physical layer. He is a memberof IEEE, Sociedade Brasileira das Telecomunicações and Ordem dosEngenheiros.
Fernando José Velez received the Licenciado, MSc and PhD degreesin Electrical and Computer Engineering from Instituto Superior Técnic-o, Technical University of Lisbon in 1993, 1996 and 2001, respectively.Since 1995 he has been with the Department of Electromechani-cal Engineering of University of Beira Interior, Covilhã, Portugal,where he is Assistant Professor. He is also researcher at Instituto deTelecomunicações, Lisbon. He made or makes part of the teams ofRACE/MBS, ACTS/SAMBA, COST 259, COST 273, COST 290, IST-SEACORN, IST-UNITE, and COST 2100 European projects, he par-ticipated in SEMENTE and SMART-CLOTHING Portuguese projects,and he was the coordinator of four Portuguese projects: SAMURAI,MULTIPLAN, CROSSNET, and MobileMAN. He has authored fivebook chapters, around seventy five papers and communications in inter-national journals and conferences, plus twenty five in national confer-ences, and is a senior member of IEEE and Ordem dos Engenheiros(EUREL), and a member of IET and IAENG. His main research areas
are cellular planning tools, traffic from mobility, simulation of wireless networks, cross-layer design, inter-working, multi-service traffic and cost/revenue performance of advanced mobile communication systems.
Rui Costa was born in Santarém, Portugal, and received the Licenciadodegree in Informatics from Instituto Matemáticas e Gestão-Universid-ade Lusofona in 1999. He is the responsible by the development andmanagement of the Computer Services and network of the Health Sci-ences Faculty of University of Beira Interior, he works on the devel-opment of wireless LAN, MAN and WAN, e-Learning, b-Learningand m-Learning applications, advanced WIA (wireless Internet appli-cations), RIA (rapid Internet applications) in University environmentsfor Web2. He is concluding is MSc on cellular planning and deploy-ment issues for fixed and portable WiMAX.
123

Planning and Deployment of WiMAX Networks 323
Daniel Robalo received the Licenciado and MSc degrees in Elec-trical Engineering from University of Beira Interior (UBI), Covilhã,Portugal, in 2005 and 2008, respectively. His MSc research was done inthe context of the MobileMAN project, an internal project on WiMAXdeployment from Instituto de Telecomunicações (IT). He is currently aresearcher at IT, and his research interest is in the field of BroadbandWireless Access, including design and implementation of WiMAX net-works. Besides conference papers, including IEEE ones, he has twojournal papers and one book chapter accepted for publication.
António Rodrigues received the B.S. and M.S. degrees in electricaland computer engineering from the Instituto Superior Técnico (IST),Technical University of Lisbon, Lisbon, Portugal, in 1985 and 1989,respectively, and the Ph.D. degree from the Catholic University of Lou-vain, Louvain-la-Neuve, Belgium, in 1997. Since 1985, he has beenwith the Department of Electrical and Computer Engineering, IST,where is currently an Assistant Professor. His research interests includemobile and satellite communications, wireless networks, spread spec-trum systems, modulation and coding.
123