Cloud Radio Access Network architecture. Towards 5G mobile ...
171
General rights Copyright and moral rights for the publications made accessible in the public portal are retained by the authors and/or other copyright owners and it is a condition of accessing publications that users recognise and abide by the legal requirements associated with these rights. Users may download and print one copy of any publication from the public portal for the purpose of private study or research. You may not further distribute the material or use it for any profit-making activity or commercial gain You may freely distribute the URL identifying the publication in the public portal If you believe that this document breaches copyright please contact us providing details, and we will remove access to the work immediately and investigate your claim. Downloaded from orbit.dtu.dk on: Jul 30, 2022 Cloud Radio Access Network architecture. Towards 5G mobile networks Checko, Aleksandra Publication date: 2016 Document Version Publisher's PDF, also known as Version of record Link back to DTU Orbit Citation (APA): Checko, A. (2016). Cloud Radio Access Network architecture. Towards 5G mobile networks. Technical University of Denmark.
-
Upload
khangminh22 -
Category
Documents
-
view
7 -
download
0
Transcript of Cloud Radio Access Network architecture. Towards 5G mobile ...

General rights Copyright and moral rights for the publications made accessible in the public portal are retained by the authors and/or other copyright owners and it is a condition of accessing publications that users recognise and abide by the legal requirements associated with these rights.
Users may download and print one copy of any publication from the public portal for the purpose of private study or research.
You may not further distribute the material or use it for any profit-making activity or commercial gain
You may freely distribute the URL identifying the publication in the public portal If you believe that this document breaches copyright please contact us providing details, and we will remove access to the work immediately and investigate your claim.
Downloaded from orbit.dtu.dk on: Jul 30, 2022
Cloud Radio Access Network architecture. Towards 5G mobile networks
Checko, Aleksandra
Publication date:2016
Document VersionPublisher's PDF, also known as Version of record
Link back to DTU Orbit
Citation (APA):Checko, A. (2016). Cloud Radio Access Network architecture. Towards 5G mobile networks. TechnicalUniversity of Denmark.

DRAFTPhD Thesis
Cloud Radio Access Network architecture
Towards 5G mobile networks
Aleksandra Checko
Technical University of DenmarkKgs. Lyngby, Denmark 2016

Cover image: Cloud RUN. Photo by Phil Holmes
Technical University of DenmarkDepartment of Photonics EnginieeringNetworks Technologies and Service PlatformsØrsteds Plads 3432800 Kgs. LyngbyDENMARKTel: (+45) 4525 6352Fax: (+45) 4593 6581Web: www.fotonik.dtu.dkE-mail: [email protected]

Contents
Abstract v
Resumé vii
Preface ix
Acknowledgements xi
List of Figures xiii
List of Tables xvii
Acronyms xxi
1 Introduction 11.1 Thesis Outline . . . . . . . . . . . . . . . . . . . . . . . . . . . . . 31.2 A Note on contributions . . . . . . . . . . . . . . . . . . . . . . . . 41.3 Publications prepared during the course of the PhD project . . . . 4
2 C-RAN overview 72.1 What is C-RAN? Base Station architecture evolution . . . . . . . . 92.2 Advantages of C-RAN . . . . . . . . . . . . . . . . . . . . . . . . . 122.3 Challenges of C-RAN . . . . . . . . . . . . . . . . . . . . . . . . . . 192.4 Transport network techniques . . . . . . . . . . . . . . . . . . . . . 232.5 RRH development . . . . . . . . . . . . . . . . . . . . . . . . . . . 312.6 Synchronized BBU Implementation . . . . . . . . . . . . . . . . . . 332.7 Virtualization . . . . . . . . . . . . . . . . . . . . . . . . . . . . . . 352.8 Likely deployment Scenarios . . . . . . . . . . . . . . . . . . . . . . 362.9 Ongoing work . . . . . . . . . . . . . . . . . . . . . . . . . . . . . . 392.10 Future directions . . . . . . . . . . . . . . . . . . . . . . . . . . . . 432.11 Summary . . . . . . . . . . . . . . . . . . . . . . . . . . . . . . . . 46
iii

iv Contents
3 Multiplexing gains in Cloud RAN 493.1 Methodology . . . . . . . . . . . . . . . . . . . . . . . . . . . . . . 503.2 Origins of multiplexing gain . . . . . . . . . . . . . . . . . . . . . . 593.3 Exploring the tidal effect . . . . . . . . . . . . . . . . . . . . . . . . 643.4 Exploring different resources measurement methods and application
mixes . . . . . . . . . . . . . . . . . . . . . . . . . . . . . . . . . . 673.5 Discussion and verification of the results . . . . . . . . . . . . . . . 753.6 Future work . . . . . . . . . . . . . . . . . . . . . . . . . . . . . . . 803.7 Summary . . . . . . . . . . . . . . . . . . . . . . . . . . . . . . . . 80
4 Towards packet-based fronthaul networks 834.1 Requirements . . . . . . . . . . . . . . . . . . . . . . . . . . . . . . 834.2 OTN-based fronthaul . . . . . . . . . . . . . . . . . . . . . . . . . . 874.3 Motivation for using Ethernet-based fronthaul . . . . . . . . . . . . 884.4 Challenges of using packet-based fronthaul . . . . . . . . . . . . . . 904.5 Technical solutions for time and frequency delivery . . . . . . . . . 904.6 Feasibility study IEEE 1588v2 for assuring synchronization . . . . . 924.7 Technical solutions for delay and jitter minimization . . . . . . . . . 984.8 Source scheduling design . . . . . . . . . . . . . . . . . . . . . . . . 1054.9 Demonstrator of an Ethernet fronthaul . . . . . . . . . . . . . . . . 1084.10 Future directions . . . . . . . . . . . . . . . . . . . . . . . . . . . . 1114.11 Summary of standardization activities . . . . . . . . . . . . . . . . 1114.12 Summary . . . . . . . . . . . . . . . . . . . . . . . . . . . . . . . . 113
5 Conclusions and outlook 1155.1 Future research . . . . . . . . . . . . . . . . . . . . . . . . . . . . . 116
Appendices 119
Appendix A OTN-based fronthaul 121A.1 OTN solution context . . . . . . . . . . . . . . . . . . . . . . . . . 121A.2 Overview . . . . . . . . . . . . . . . . . . . . . . . . . . . . . . . . 121A.3 Results . . . . . . . . . . . . . . . . . . . . . . . . . . . . . . . . . 123A.4 Conclusion . . . . . . . . . . . . . . . . . . . . . . . . . . . . . . . 123
Bibliography 127

Abstract
Cloud Radio Access Network (C-RAN) is a novel mobile network architecture whichcan address a number of challenges that mobile operators face while trying to supportever-growing end-users’ needs towards 5th generation of mobile networks (5G). The mainidea behind C-RAN is to split the base stations into radio and baseband parts, and poolthe Baseband Units (BBUs) from multiple base stations into a centralized and virtualizedBBU Pool. This gives a number of benefits in terms of cost and capacity. However, thechallenge is then to find an optimal functionality splitting point as well as to design the so-called fronthaul network, interconnecting those parts. This thesis focuses on quantifyingthose benefits and proposing a flexible and capacity-optimized fronthaul network.
It is shown that a C-RAN with a functional split resulting in a variable bit rate on thefronthaul links brings cost savings due to the multiplexing gains in the BBU pool andthe fronthaul network. The cost of a fronthaul network deployment and operation can befurther reduced by sharing infrastructure between fronthaul and other services.
The origins of multiplexing gains in terms of traffic burstiness, the tidal effect andvarious possible functional splits are analyzed and quantified. Sharing baseband resourcesbetween many cells is possible for traditional C-RANs. However, in order to furtherbenefit from multiplexing gains on fronthaul, it is recommended to implement a functionalsplit yielding variable bit rate in the fronthaul. For the analyzed data sets, in deploymentswhere diverse traffic types are mixed (bursty, e.g., web browsing and constant bit rate, e.g.,video streaming) and cells from various geographical areas (e.g., office and residential) areconnected to the BBU pool, the multiplexing gain value reaches six. Using packet-basedfronthaul has the potential to utilize fronthaul resources efficiently. However, meetingsynchronization and delay requirements is a challenge. As a possible solution, the useof IEEE Precision Time Protocol (PTP) (also known as 1588v2) has been evaluated,and for the analyzed scenario it can assure synchronization on the nanosecond level,fulfilling mobile network requirements. Furthermore, mechanisms to lower delay andjitter have been identified, namely: source scheduling and preemption. An innovativesource scheduling scheme which can minimize jitter has been proposed. The scheme isoptimized for symmetric downlink and uplink traffic, but can also be used when downlinktraffic exceeds uplink. Moreover, a demonstrator of a Software Defined Networking(SDN) controlled Ethernet fronthaul has been built.
v

vi Abstract

Resumé(Summary in Danish)
Cloud Radio Access Network (C-RAN) er en ny mobilnetarkitektur, som kan imødegånogle af de udfordringer mobiloperatørerne møder, når de skal understøtte de øgede kravfra brugerne på vej mod 5. generations mobilnet (5G). Idéen bag C-RAN er at opdelebasestationerne i radio- og basebandfunktionalitet og så samle basebandfunktionaliteten(de såkaldte Baseband Units, BBU) fra flere basestationer i en centraliseret og virtualiseretBBU-pool. Dette giver en række fordele i forhold til kapacitet og omkostninger. Udfor-dringen er imidlertid så at finde den optimale opdeling af funktionaliteten, samt at designedet såkaldte fronthaul net, som forbinder disse dele. Denne afhandling fokuserer på atkvantificere disse fordele og på samme tid foreslå et fleksibelt og kapacitetsoptimeretfronthaul-net.
Det vises at et C-RAN med en funktionel opdeling, som giver variabel bitrate påfronthaul-forbindelserne, giver omkostningsbesparelser grundet multiplexing-gain i bådeBBU-poolen og i fronthaul-nettet. Omkostningerne til udrulning og drift af fronthaul-nettet kan reduceres yderligere ved at dele en fælles infrastruktur mellem fronthaul ogandre tjenester.
Kilderne til mulitplexing gain i form af trafik-burstines, tidal effect og de forskelligemåder at opdele funktionaliteten på er blevet analyseret og kvantificeret. Deling afBBU ressourcer mellem mange celler er muligt selv i traditionelle C-RAN. Vil manimidlertid kunne nyde godt af fordelene ved mulitplexing gain i fronthaul, anbefalesdet at implementere en funktionel opdeling, som giver variabel bitrate i fronthaul-nettet.De data, der er analyseret her, viser et muligt multiplexing gain på seks for udrulningerhvor forskellige trafiktyper (bursty, f.eks. web-browsing og konstant bitrate trafik, f.eks.video streaming) og celler fra forskelligartede grografiske områder (f.eks., erhvervs- ogbeboelsesområder) forbindes til samme BBU-pool. Brug af pakkekoblet fronthaul giverpotentielt mulighed for effektiv udnyttelse af fronthaul-ressourcer. Det er imidlertiden udfordring at overholde kravene til synkronisering og forsinkelser. Som en muligløsning er brug af IEEE Precision Time Protocol (PTP, også kendt som IEEE 1588v2)blevet evalueret og for de analyserede scenarier kan den opfylde synkroniseringskravene.Endvidere er der blevet fundet frem til mekanismer der kan mindske forsinkelse og jitter:source scheduling og preemption. Der foreslås et nyskabende source scheduling-system,som kan minimere jitter. Systemet er optimeret til symmetrisk downlink- og uplinktrafik,
vii

viii Resumé
men kan også finde anvendelse når downlink overskrider uplink. Slutteligt er der opbyggeten demonstrator af et Software Defined Network (SDN) styret, Ethernet baseret fronthaul.

Preface
This dissertation presents a selection of the research work conducted during my PhD studyfrom January 1, 2013 until February 15, 2016 under supervision of Associate ProfessorMichael Stübert Berger, Associate Professor Henrik Lehrmann Christiansen, ProfessorLars Dittmann, Dr Georgios Kardaras (January 2013-December 2013), Dr Bjarne SkakBossen (January 2014-May 2015), and Dr Morten Høgdal (June 2015-February 2016). Itis submitted to the Department of Photonics Engineering at the Technical University ofDenmark in a partial fulfillment of the requirements for the Doctor of Philosophy (PhD)degree.
This Industrial PhD project was done in the Networks Technologies and ServicePlatforms group at the Department of Photonics Engineering at the Technical Universityof Denmark (DTU), Kgs. Lyngby, Denmark and in MTI Radiocomp, Hillerød, Denmark,where I was employed. The work was co-financed by the Ministry of Higher Educationand Science of Denmark within the framework of Industrial PhD Program. The workbenefited from collaboration within the EU HARP project, especially from a six-monthexternal stay at Alcatel-Lucent Bell Labs France under the guidance of Mr. LaurentRoullet.
Aleksandra CheckoKgs. Lyngby, February 2016
ix

x

Acknowledgements
Being a PhD student is not an easy job. Not only does one need to define a topic thatis challenging, but also advance the state-of-the-art within it. Whatever one finds, he orshe is welcome to re-search. On top of that, various formal aspects of the PhD projectneed to be taken care of. Fortunately, I was not alone in this battle. I would like to takethe opportunity to thank some of the people that made the accomplishment of this thesispossible.
First and foremost, I would like to thank my supervisors: Michael Berger, BjarneBossen, Henrik Christiansen, Lars Dittmann, Georgios Kardaras, and Morten Høgdal fortheir mentoring and support. I am particularly grateful to Michael Berger and to MTIRadiocomp for giving me this opportunity. Special thanks to Henrik Christiansen formaking things as simple as possible, but not simpler. Moreover, I am grateful to LaraScolari and Thomas Nørgaard for their help in starting this project, and to Laurent Roullet,Thomas Nørgaard, and Christian Lanzani for asking interesting questions and helping toshape the directions this thesis took.
I would like to acknowledge the members of the Networks group at DTU Fotonikand colleagues from MTI for all the fruitful discussions, and for maintaining a friendlyatmosphere at work. Lunch and seminar discussions were one-of-a-kind.
Merci beaucoup Laurent Roullet for welcoming me in his group at Alcatel LucentBell Labs for a six-month external stay, and to Aravinthan Gopalasingham for our fruitfulcollaboration. I am also grateful to the colleagues from Bell Labs for a warm welcome,guidance and making my time in Paris more enjoyable, especially for our trips to MachuPicchu.
I would like to show my gratitude to Henrik Christiansen, Michael Berger, MortenHøgdal, Andrea Marcano, Matteo Artuso, Jakub Jelonek, Małgorzata Checko and Geor-gios Kardaras for reviewing this thesis. Mange tak til Henrik Christiansen for translatingthe abstract.
This project would be a different experience if it was not for my cooperation withmembers of the HARP project, the Ijoin project, and the IEEE Student Branch at DTU.I am thankful for this multicultural experience.
And last but not least, I am grateful to my family and friends for their continuoussupport. A most special thanks to Jakub Jelonek who stood by me in all joyful but also
xi

xii Acknowledgements
tough moments.I had a great opportunity to work with so many bright people, from whom I have
learned so much. Dziekuje!

List of Figures
1.1 The pope elections in 2005 and 2013. . . . . . . . . . . . . . . . . . . 11.2 Traffic growth in mobile networks. . . . . . . . . . . . . . . . . . . . . 2
2.1 Statistical multiplexing gain in C-RAN architecture for mobile networks. 92.2 Base station functionalities. Exemplary baseband processing functionalities
inside BBU are presented for LTE implementation. Connection to RadioFrequency (RF) part and sub modules of RRH are shown. . . . . . . . 10
2.3 Base station architecture evolution. . . . . . . . . . . . . . . . . . . . . 112.4 C-RAN LTE mobile network. . . . . . . . . . . . . . . . . . . . . . . . 142.5 Daily load on base stations varies depending on base station location. . 152.6 Results of the survey on operators drives for deploying C-RAN. . . . . 192.7 An overview on technical solutions addressed in this chapter. . . . . . . 202.8 C-RAN architecture can be either fully or partially centralized depending
on L1 baseband processing module location. . . . . . . . . . . . . . . . 242.9 Possible fronthaul transport solutions . . . . . . . . . . . . . . . . . . . 262.10 Factors between which a trade off needs to be reached choosing an IQ
compression scheme. . . . . . . . . . . . . . . . . . . . . . . . . . . . . 292.11 C-RAN deployment scenarios. . . . . . . . . . . . . . . . . . . . . . . . 382.12 Possible functional splits for C-RAN . . . . . . . . . . . . . . . . . . . 442.13 Decentralization of logical functions . . . . . . . . . . . . . . . . . . . 462.14 Decentralization, centralization and further decentralization of physical
deployments, popular for given generations of mobile networks . . . . . 47
3.1 Layer 2 (green) and Layer 1 (yellow) of user-plane processing in DL in aLTE base station towards air interface. Possible PGs are indicated. Basedon [151], [148], [147], [46]. . . . . . . . . . . . . . . . . . . . . . . . . 52
3.2 Daily traffic distributions. . . . . . . . . . . . . . . . . . . . . . . . . . 603.3 Multiplexing gains for different locations based on daily traffic distributions
between office and residential cells. . . . . . . . . . . . . . . . . . . . . 61
xiii

xiv List of Figures
3.4 Multiplexing gains for different distributions between office, residentialand commercial cells. . . . . . . . . . . . . . . . . . . . . . . . . . . . . 61
3.5 Possible multiplexing gains on BBU pool and fronthaul links dependingon base station architecture. . . . . . . . . . . . . . . . . . . . . . . . . 63
3.6 Network model used for simulations. . . . . . . . . . . . . . . . . . . . 653.7 Modeled traffic from residential, office and aggregated traffic from 5 office
and 5 residential cells. . . . . . . . . . . . . . . . . . . . . . . . . . . . 653.8 Optimal distribution of office and residential cells - simulation results.
Confidence intervals for 95% level are shown. . . . . . . . . . . . . . . 673.9 Network model used for simulations. . . . . . . . . . . . . . . . . . . . 703.10 Multiplexing gain for for different percentage of web traffic in the system
and different throughput averaging windows: MGFH−UE−Cell (10 ms,no averaging) and MGFH−UE−Cell−AVG (100 ms, 1 s, 10 s, 57 s and100 s). . . . . . . . . . . . . . . . . . . . . . . . . . . . . . . . . . . . . 71
3.11 CDFs of throughput for an sample office and residential cell as well astotal throughput for all ten cells for 50% web traffic mix. . . . . . . . . 72
3.12 90th percentile of web page response time for different percentage of webtraffic in the system and for different aggregated link data rate. . . . . 73
3.13 90th percentile of video conferencing packet End-to-End delay for differentpercentage of web traffic in the system and for different aggregated linkdata rate. . . . . . . . . . . . . . . . . . . . . . . . . . . . . . . . . . . 74
3.14 80th, 90th and 95th percentile of base stations throughput for differentpercentage of web traffic in the system. . . . . . . . . . . . . . . . . . 74
3.15 Multiplexing gains for different locations based on daily traffic distributionsbetween office and residential cells. Data from China Mobile and Ericsson. 77
4.1 Delays associated with the UL HARQ process . . . . . . . . . . . . . . 854.2 Frequency and phase synchronization . . . . . . . . . . . . . . . . . . . 864.3 Traditional and discussed C-RAN architecture together with principles of
deriving synchronization for them . . . . . . . . . . . . . . . . . . . . 894.4 Model of the requirements and factor introducing uncertainties in LTE,
CPRI, 1588 and Ethernet layers. . . . . . . . . . . . . . . . . . . . . . 914.5 Time related requirements on a fronthaul network . . . . . . . . . . . . 924.6 Visual representation of 1588 operation. . . . . . . . . . . . . . . . . . 934.7 Protocol stack of the examined network. . . . . . . . . . . . . . . . . . 944.8 Ingress and egress timestamps should be taken as soon as Sync or
DelayReq packets enter and leave the node, respectively. . . . . . . . 944.9 Maximum phase error measured for various scenarios during stable opera-
tion. . . . . . . . . . . . . . . . . . . . . . . . . . . . . . . . . . . . . . 964.10 Maximum frequency error measured for various scenarios during stable
operation. . . . . . . . . . . . . . . . . . . . . . . . . . . . . . . . . . . 97

List of Figures xv
4.11 Maximum phase error observed during stable operation for various scenar-ios with offset averaging applied. . . . . . . . . . . . . . . . . . . . . . 97
4.12 Maximum frequency error observed during stable operation for variousscenarios with drift averaging applied. . . . . . . . . . . . . . . . . . . 98
4.13 Clock recovery scheme inside an RRH combined with CPRI2Eth gateway 994.14 Delays in Ethernet-based fronthaul . . . . . . . . . . . . . . . . . . . . 1004.15 RRH-BBU distance assuming no queuing . . . . . . . . . . . . . . . . . 1014.16 RRH-BBU distance for various queuing . . . . . . . . . . . . . . . . . . 1014.17 Protected window, here for the fronthaul traffic . . . . . . . . . . . . . 1024.18 Source scheduling used to reduce jitter. Here an example for UL . . . 1034.19 Preemption . . . . . . . . . . . . . . . . . . . . . . . . . . . . . . . . . 1044.20 Source scheduling algorithm . . . . . . . . . . . . . . . . . . . . . . . . 1064.21 Ethernet L1 and L2 as well as 1904.3 overhead comparing to Ethernet
frame payload size . . . . . . . . . . . . . . . . . . . . . . . . . . . . . 1074.22 Demonstrator of Ethernet fronthaul network . . . . . . . . . . . . . . . 1084.23 Ethernet-based C-RAN fronthaul - laboratory setup . . . . . . . . . . . 1094.24 Ping RTT over 1 - 3 switches . . . . . . . . . . . . . . . . . . . . . . . 1104.25 Fronthaul, backhaul and midhaul . . . . . . . . . . . . . . . . . . . . . 1124.26 Proposed architecture for Fronthaul over Ethernet . . . . . . . . . . . . 114
A.1 C-RAN architecture where OTN is used to transport fronthaul streams 121A.2 Reference setup for CPRI over OTN testing . . . . . . . . . . . . . . . 122A.3 CPRI over OTN mapping measurement setup . . . . . . . . . . . . . . 122A.4 Detailed measurement setup [86] . . . . . . . . . . . . . . . . . . . . . 122A.5 Results 64 QAM with OBSAI Using TPO125 Device . . . . . . . . . . 126

xvi

List of Tables
2.1 Comparison between traditional base station, base station with RRH andC-RAN . . . . . . . . . . . . . . . . . . . . . . . . . . . . . . . . . . . 13
2.2 IQ bit rates between a cell site and centralized BBU Pool . . . . . . . 212.3 Requirements for cloud computing and C-RAN applications [54] . . . . 232.4 Comparison of IQ compression methods. Compression ratio 33% corre-
sponds to 3:1 . . . . . . . . . . . . . . . . . . . . . . . . . . . . . . . . 322.5 DSP and GPP processors . . . . . . . . . . . . . . . . . . . . . . . . . 352.6 Research directions for C-RAN . . . . . . . . . . . . . . . . . . . . . . 422.7 Requirements for different functional splits [148] for the LTE protocol
stack . . . . . . . . . . . . . . . . . . . . . . . . . . . . . . . . . . . . . 45
3.1 Assumed pooling gains on different layers of the LTE protocol stack. . 543.2 Estimations of baseband complexity in GOPS of cell- and user-processing
for UL and DL and different cell sizes. Numbers are taken from [155]. 563.3 Multiplexing gains (MG) looking at traffic-dependent resources. . . . . 643.4 Traffic generation parameters for network modeling; C - Constant, E -
Exponential, L - log-normal, U - uniform, UI - uniform integer . . . . . 663.5 BBU save for various office/residential cell mixes, measured using different
methods. . . . . . . . . . . . . . . . . . . . . . . . . . . . . . . . . . . 683.6 Traffic generation parameters for network modeling; C - Constant, E -
Exponential, L - log-normal, G - gamma, U - uniform . . . . . . . . . . 693.7 Simulation parameters. . . . . . . . . . . . . . . . . . . . . . . . . . . . 693.8 Multiplexing gains calculated in different projects. MG - multiplexing gain. 76
4.1 EVM requirements for LTE-A . . . . . . . . . . . . . . . . . . . . . . . 844.2 Summary of timing requirements for LTE. . . . . . . . . . . . . . . . . 874.3 Delays in an Ethernet switch . . . . . . . . . . . . . . . . . . . . . . . 994.4 Exemplary delay budgets . . . . . . . . . . . . . . . . . . . . . . . . . . 1004.5 Analysis of a ping delay . . . . . . . . . . . . . . . . . . . . . . . . . . 1094.6 Delay measurements over a dedicated line using DPDK . . . . . . . . . 111
xvii

xviii List of Tables
A.1 Measurement scenarios . . . . . . . . . . . . . . . . . . . . . . . . . . . 123A.2 Setup specifications . . . . . . . . . . . . . . . . . . . . . . . . . . . . 124A.3 Measurements results summary . . . . . . . . . . . . . . . . . . . . . . 125

List of Tables xix

xx

Acronyms
3GPP Third Generation Partnership Project
ACK acknowledgment
AM Acknowledged Mode
ARPU Average Revenue Per User
ARQ Automatic Repeat-reQuest
BB Baseband
BBU Baseband Unit
BLP Bit-level processing
BSE Base Station Emulator
BTS Base Transceiver Station
C-RAN Cloud Radio Access Network
CA Carrier Aggregation
CAPEX CAPital EXpenditure
CDF Cumulative Distribution Function
CDN Content Distribution Network
CMOS Complementary metal-oxide-semiconductor
CoMP Coordinated Multi-Point
CP cyclic-prefix
xxi

xxii Acronyms
CPRI Common Public Radio Interface
CPRI2Eth CPRI-to-Ethernet
CRC Cyclic Redundancy Check
DAGC Digital Automatic Gain Control
DCN Dynamic Circuit Network
DL downlink
DPD Digital-to-Analog Converter
DPI Deep Packet Inspection
DSL Digital Subscriber Line
DSN Distributed Service Network
DSP Digital Signal Processor
eICIC enhanced Inter-cell Interference Coordination
EPC Evolved Packet Core
EVM Error Vector Magnitude
FCS Frame check sequence
FDD Frequency-Division Duplex
FEC Forward Error Correction
FFT Fast Fourier Transform
FIFO First Input First Output
FPGA Field-Programmable Gate Array
GOPS Giga Operations Per Second
GPP General Purpose Processor
GPS Global Positioning System
GSM Global System for Mobile Communications

Acronyms xxiii
HARQ Hybrid ARQ
HSS Home Subscriber Server
ICI Inter Cell Interference
ICIC Inter-cell Interference Coordination
IFFT Inverse FFT
IoT Internet of Things
IP Internet Protocol
IQ In-phase/Quadrature
KPI Key Performance Indicators
LTE Long Term Evolution
LTE-A LTE-Advanced
M2M Machine to Machine
MAC Media Access Control
MEF Metro Ethernet Forum
MG Multiplexing gain
MIMO Multiple Input Multiple Output
MME Mobility Management Entity
MoU Memorandum of Understanding
MPLS Multiprotocol Label Switching
MPLS-TP MPLS Transport Profile
MTU Maximum Transmission Unit
NACK non-acknowledgement
NFV Network Function Virtualisation
NGFI Next Generation Fronthaul Interface

xxiv Acronyms
NGMN Next Generation Mobile Networks
OAM Operations, Administration and Maintenance
OBSAI Open Base Station Architecture Initiative
ODU Optical channel Data Unit
OFDM Orthogonal Frequency-Division Multiple
OPEX OPerating EXpenditure
ORI Open Radio equipment Interface
OTN Optical Transport Network
PA Power Amplifier
PAR Project Authorization Request
PBB-TE Provider Backbone Bridge - Traffic Engineering
PDCP Packet Data Convergence Protocol
PDN-GW Packet Data Network Gateway
PDSCH Physical Downlink Shared Channel
PDU Packet Data Unit
PG Pooling gain
PLL Phase-locked Loop
PON Passive Optical Network
PTP Precision Time Protocol
QAM Quadrature Amplitude Modulation
QoS Quality of Service
QPSK Quadrature Phase Shift Keying
QSNR Quantization SNR
RAN Radio Access Network

Acronyms xxv
RANaaS RAN-as-a-Service
RF Radio Frequency
RLC Radio Link Control
RNC Radio Network Controller
ROHC RObust Header Compression
RRH Remote Radio Head
RRM Radio Resource Management
RTT Round Trip Time
SAE-GW Serving SAE Gateway
SDH Synchronous Digital Hierarchy
SDN Software Defined Networking
SDR Software Defined Radio
SDU Service Data Unit
SLA Service Level Agreement
SNR Signal-to-noise ratio
SoC System on a Chip
SON Self-Organizing Networks
SONET Synchronous Optical NETworking
TCO Total Cost of Ownership
TD-SCDMA Time Division Synchronous Code Division Multiple Access
TDD Time-Division Duplex
TM Transparent Mode
TSN Time-Sensitive Networking
UE User Equipment
UL uplink

xxvi Acronyms
UM Unacknowledged Mode
UMTS Universal Mobile Telecommunications System
WDM Wavelength-division multiplexing
WNC Wireless Network Cloud

CHAPTER 1Introduction
The advancements in Internet connectivity are driving socio-economical changes includingpersonalized broadband services, like TV on demand, laying the ground for e-health,self-driving cars, augmented reality, intelligent houses and cities, connecting variousindustrial sensors, e.g. for monitoring river levels. Figure 1.1 shows a pertinent exampleon how common smart mobile phones tuned into and how used people became to livingtheir life with them in their hands.
Figure 1.1: The pope elections in 2005 and 2013.
More and more of our communication becomes mobile. In 1991, the first digitalmobile call was made through the Global System for Mobile Communications (GSM)(2G) network by a Finnish prime minister. By 2001, the number of network subscribersexceeded 500 million [1]. That same year, the first 3G network, the Universal MobileTelecommunications System (UMTS), was introduced to increase the speed of datatransmission. The mobile Internet connectivity has gained a wide spread popularity with
1

2 Chapter 1. Introduction
0
10
20
30
40
50
60
2010 2015 2020
EB/m
on
th
Year
File sharing
Audio
Software download and update
Web Browsing
Social networking
Encrypted
Video
Figure 1.2: Traffic growth in mobile networks. Source: Ericsson, November 2015.
Long Term Evolution (LTE) networks, which have been commercially deployed since2011. By the end of 2012, the number of LTE subscribers had exceeded 60 million,while the total number of mobile devices amounted to 7 billion [1], exceeding the world’spopulation. The number of subscribers is forecast to grow further, reaching 9 billionin 2021 [2], especially with the increasing popularity of Machine to Machine (M2M)communication.
By 2021, a new generation of mobile networks will be standardized [3] - 5G - tosatisfy ever-growing traffic demand, offering increased speed and shorter delays, the latterenabling a tactile Internet. It will be also able to offer ultra-high reliability, and connecta vast number of various devices, such as cars and sensors, to the Internet, forming anInternet of Things (IoT) [4]. The actual applications of the future mobile networks areprobably beyond our current imagination.
Historical data as well as traffic forecast shows that this increase in number of sub-scribers is accompanied by an exponential growth in traffic, with video occupying themost bandwidth [5], [2], as shown on Figure 1.2. In order to support such a growth morecells or higher capacity per cell needs to be provided, which results in increased cost. Atthe same time, users would like to pay less and use more data. Therefore the increaseof cost cannot follow the same trend line as traffic growth. The same applies to powerconsumption both in terms of cost as well as respect towards the environment. Disruptive,affordable solutions are needed to deliver more capacity, shorter delays, and improvedreliability at the same time not increasing the power consumption.
In order to address the capacity requirements more cells can be deployed, or highercapacity needs to be provided per each cell. Small cells can be deployed in places withhigh user activity. Self-Organizing Networks (SON) techniques are important to ease man-agement and optimization of networks with many cells. In dense deployments interferenceis a challenge, therefore techniques like enhanced Inter-cell Interference Coordination(eICIC) and Coordinated Multi-Point (CoMP) are essential. To increase the capacity ofeach cell more antennas can be used using a Massive Multiple Input Multiple Output(MIMO). As spectrum is scarce in currently explored bands, higher frequency bands,

1.1. Thesis Outline 3
including millimeter waves, are explored. While virtualization became a commodity inIT sector, it is now considered to be applied for mobile networks. Leveraging NetworkFunction Virtualisation (NFV) and SDN offers potential benefits of cost efficient andflexible deployment of both core network and base stations [4]. The latter two techniquesare essential enablers for C-RAN. The main concept behind C-RAN is to pool the BBUsfrom multiple base stations into a centralized and virtualized BBU Pool, while leavingthe Remote Radio Heads (RRHs) and antennas at the cell sites. C-RAN enables energyefficient network operation and possible cost savings on baseband resources. Furthermore,it improves network capacity by performing load balancing and cooperative processing ofsignals originating from several base stations. Therefore base stations with high load andhigh deployment density may be deployed in C-RAN architecture. For low utilizationbase stations, e.g. in rural areas, C-RAN may not be the most cost-optimal solution.
Virtualization, now commodity for IT sector, is gaining a momentum in the telecom-munication sector. The main drive is cost savings and ability to offer additional servicesto the users to increase the revenue instead of being just a data carrier. C-RAN exploitsvirtualization at the air interface, however both mobile core networks and core networkscan benefit from cloudification. With a great industry and academia interest in NFV,C-RAN, based on NFV, is an indispensable part of 5G.
1.1 Thesis Outline
C-RAN is a novel RAN architecture that can address a number of challenges that theoperators face while trying to support the growing needs of end-users, therefore it is seenas a major technological foundation for 5G networks [[4], [6], [7], [8], [9]]. Chapter 2provides an extensive introduction to C-RAN, outlining its fundamental aspects, advan-tages, and the technical solutions that can address the challenges it faces. In addition,future research directions are outlined.
However, for the deployments to be widespread, they need to be economically feasible.Chapter 3 evaluates energy and cost savings coming from the statistical multiplexing gainin C-RAN. Three studies are covered, the first one not including protocol processing, thesecond exploring a tidal effect, and the third looking at different method of measuringmultiplexing gains.
One of the major challenges to address to deploy C-RAN is a flexible fronthaul withoptimized capacity requirements. Chapter 4 puts special focus on fronthaul networks,outlining their requirements, evaluating more traditional, circuit-switched transport so-lution, as well as innovative packet-based transport techniques. Emphasis is placed onEthernet, packet-based fronthaul, exploring options to ensure clock delivery and to meetdelay requirements.
Finally, Chapter 5 concludes the dissertation and explores future research directions.

4 Chapter 1. Introduction
1.2 A Note on contributions
The work done in this thesis would not be possible without my supervisors and colleaguesfrom EU project HARP consortium. This section highlights contributions of this thesisand describes my role in the joint work.
Summarizing state-of-the-art literature on C-RAN up to beginning of 2014. I haveperformed an extensive research on the state-of-the-art of C-RAN, sharing my experiencesfrom the time when I was getting familiar with the topic and determining the directionsof this thesis. I led writing of the paper [10], wrote myself all the sections apart fromsection III.C and VIII as well as revised the whole paper including the input from co-authors. Given the statistics on downloads (3500+) and citations (30+) within a year frompublication, I trust that the community found it useful.
Evaluating C-RAN benefits in terms of exploring statistical multiplexing gain.I have designed and performed OPNET simulations on evaluating statistical multiplexinggains in [11], [12] and [13], based on the measurement method proposed by me beforecommercing on the Ph.D. project [14]. The work presented in [13] was done withAndrijana P. Avramova, who performed teletraffic studies. All the papers were preparedunder the supervision of Henrik Christiansen and Michael Berger.
Summarizing requirements and challenges of Ethernet-based fronthaul. I haveorganized requirements and analyzed factors that are challenging for achieving syn-chronization in packet-based C-RAN fronthaul. Via discrete event-based simulationsI performed a feasibility study showing the performance for frequency and phase synchro-nization using IEEE 1588 in Ethernet networks in [15]. The work was done under thesupervision of Henrik Christiansen and Michael Berger.
Building Ethernet - based, SDN - controlled fronthaul ready for a single CPRIstream. This work was done in Alcatel-Lucent Bell Labs France in collaboration with Ar-avinthan Gopalasingham. We built this demonstrator configuring Open Flow switches andOpenDaylight together, while I was responsible for configuring DPDK traffic generationand performing delay measurements.
Proposing source scheduling algorithm. I proposed a traffic scheduling algorithm,important for enabling sharing Ethernet network between many fronthaul streams.
Experimentally verifying feasibility of using OTN for C-RAN. Together withGeorgios Kardaras and Altera we performed lab measurements on feasibility of ap-plying OTN to CPRI/OBSAI fronthaul. MTI Radiocomp setup was used on CPRI/OBSAIlayer, while Altera provided OTN equipment.
1.3 Publications prepared during the course of the PhD project
1.3.1 Journals1. A. Checko1st, A.P. Avramova1st, M.S. Berger and H.L. Christiansen, ”Evaluating C-
RAN fronthaul functional splits in terms of network level energy and cost savings”,

1.3. Publications prepared during the course of the PhD project 5
accepted to IEEE Journal Of Communications And Networks
2. A. Checko, H. Christiansen, Y. Yan, L. Scolari, G. Kardaras, M.S. Berger andL. Dittmann, “Cloud RAN for mobile networks - a technology overview” In: IEEESurveys and Tutorials journal, Vol. 17, no. 1, (Firstquarter 2015), pp. 405–426
3. M. Artuso, D. Boviz, A. Checko, et al. , “Enhancing LTE with Cloud-RAN andLoad-Controlled Parasitic Antenna Arrays”, submitted to IEEE CommunicationsMagazine
1.3.2 Conferences1. A. Checko, A. Juul, H. Christiansen and M.S. Berger, "Synchronization Challenges
in Packet-based Cloud-RAN Fronthaul for Mobile Networks", In proceedingsof IEEE ICC 2015 - Workshop on Cloud-Processing in Heterogeneous MobileCommunication Networks (IWCPM)
2. H. Holm, A. Checko, R. Al-obaidi and H. Christiansen, “Optimizing CAPEXof Cloud-RAN Deployments in Real-life Scenarios by Optimal Assignment ofCells to BBU Pools”, in Networks and Communications (EuCNC), 2015 EuropeanConference on, pp.205-209, June 29 2015-July 2 2015
3. R. Al-obaidi, A. Checko, H. Holm and H. Christiansen, “Optimizing Cloud-RANDeployments in Real-life Scenarios Using Microwave Radio”, in Networks andCommunications (EuCNC), 2015 European Conference on , vol., no., pp.159-163,June 29 2015-July 2 2015
4. L. Dittmann, H.L. Christiansen and A. Checko, “Meeting fronthaul challengesof future mobile network deployments - the HARP approach”, invited to WONCWorkshop, In proceedings of IEEE GLOBECOM 2014, Austin/USA, 2 December2014
5. A. Checko, H. Holm, and H. Christiansen, “Optimizing small cell deploymentby the use of C-RANs,” in European Wireless 2014; 20th European WirelessConference; Proceedings of, pp.1-6, 14-16 May 2014
6. S. Michail, A. Checko and L. Dittmann, “Traffic Adaptive Base Station Manage-ment Scheme for Energy-Aware Mobile Networks”, poster presented at EuCNC2014
7. A. Checko, H.L. Christiansen and M.S. Berger, "Evaluation of energy and cost sav-ings in mobile Cloud Radio Access Networks", In proceedings of OPNETWORK2013 conference, Washington D.C., USA, August 26-30 2013

6 Chapter 1. Introduction
8. A. Dogadaev, A. Checko, A.P. Avramova, A. Zakrzewska, Y. Yan, S. Ruepp,M.S. Berger, and L. Dittmann and H. Christiansen, “Traffic Steering Framework forMobile-Assisted Resource Management in Heterogeneous Networks”, In proceed-ings of IEEE 9th International Conference on Wireless and Mobile Communications(ICWMC) 2013, Nice, France 21-26 July 2013.
1.3.3 Patent application1. A. Checko "Method for Radio Resource Scheduling”. US patent provisional
application number 62294957, filled on 12.02.2016
1.3.4 Others1. A. Checko, G. Kardaras, C. Lanzani, D. Temple, C. Mathiasen, L. Pedersen,
B. Klaps, “OTN Transport of Baseband Radio Serial Protocols in C-RAN Architec-ture for Mobile Network Applications”. Industry white paper, March 2014
2. Contribution to the deliverable of the EU project HARP D6.4 “Eth2CPRI prototypeimplementation”, presented to European Commission in November 2015
3. Contribution to the deliverable of the EU project HARP D6.3 “Protocol ExtensionsDesign and Implementation”, presented to European Commission in August 2015
4. Coordination and contribution to Deliverable 6.2 “Aggregation network optimiza-tion” of the EU project HARP, presented to European Commission in January2015
5. Contribution to Y2 report of the EU project HARP, presented to European Com-mission in November 2014
6. Contribution to Y1 report of the EU project HARP, presented to European Com-mission in November 2013
7. Contribution to the deliverable of the EU project HARP D6.1 “Aggregation NetworkDefinition”, presented to European Commission in May 2014
8. Contribution to the deliverable of the EU project HARP D3.1 Requirements, metricsand network definition, presented to European Commission in July 2013
9. Contribution to the deliverable of the EU project HARP D1.5 “Final plan for theuse and dissemination of Foreground”, presented to European Commission partnersin May 2014

CHAPTER 2C-RAN overview
Base Transceiver Station (BTS), NodeB, eNodeB. Those are the names used to describe abase station in GSM, UMTS and LTE standards, respectively. As a concept, and logicalnode, a base station is responsible for receiving signal from/sending to user, prepare it tobe send up to/received from the core network and organize transmission. Physically, thisnode can be deployed as a standalone base station, base station with RRH or Cloud RAN(C-RAN).
As spectral efficiency for the LTE standard is approaching the Shannon limit, themost prominent way to increase network capacity is by either adding more cells, creatinga complex structure of Heterogeneous and Small cell Networks (HetSNets) [16] or byimplementing techniques such as multiuser MIMO [17] as well as Massive MIMO [18],where numerous antennas simultaneously serve a number of users in the same time-frequency resource. However, this results in growing inter-cell interference levels andhigh costs.
The Total Cost of Ownership (TCO) in mobile networks includes CAPital EXpenditure(CAPEX) and OPerating EXpenditure (OPEX). CAPEX mainly refers to expenditurerelevant to network construction which may span from network planning to site acquisition,RF hardware, baseband hardware, software licenses, leased line connections, installation,civil cost and site support, like power and cooling. OPEX covers the cost needed tooperate the network, i.e. site rental, leased line, electricity, operation and maintenance aswell as upgrade [19]. CAPEX and OPEX are increasing significantly when more basestations are deployed. More specifically, CAPEX increases as base stations are the mostexpensive components of a wireless network infrastructure, while OPEX increases as,among others, cell sites demand a considerable amount of power to operate, e.g., ChinaMobile estimates 72% of total power consumption originates from the cell sites [20].Mobile network operators need to cover the expenses for network construction, operation,maintenance and upgrade; meanwhile, the Average Revenue Per User (ARPU) stays flator even decreases over time, as the typical user is more and more data-hungry but expectsto pay less for data usage.
C-RAN is a novel mobile network architecture, which has the potential to answerthe above mentioned challenges. The concept was first proposed in [21] and describedin detail in [20]. In C-RAN, baseband processing is centralized and shared among sitesin a virtualized BBU Pool. This means that it is well prepared to adapt to non-uniformtraffic and utilizes resources, i.e., base stations, more efficiently. Due to that fact thatfewer BBUs are needed in C-RAN compared to the traditional architecture, C-RAN also
7

8 Chapter 2. C-RAN overview
has the potential to decrease the cost of network operation, because power and energyconsumption are reduced compared to the traditional RAN architecture. New BBUscan be added and upgraded easily, thereby improving scalability and easing networkmaintenance. A virtualized BBU Pool can be shared by different network operators,allowing them to rent Radio Access Network (RAN) as a cloud service. As BBUs frommany sites are co-located in one pool, they can interact with lower delays – thereforemechanisms introduced for LTE-Advanced (LTE-A) to increase spectral efficiency andthroughput, such as eICIC and CoMP are greatly facilitated. Methods for implementingload balancing between cells are also facilitated. Furthermore, network performance isimproved, e.g., by reducing delay during intra-BBU Pool handover.
C-RAN architecture is targeted by mobile network operators, as envisioned by ChinaMobile Research Institute [20], IBM [21], Alcatel-Lucent [22], Huawei [23], ZTE [24],Nokia Siemens Networks [19], Intel [25] and Texas Instruments [26]. Moreover, C-RANis seen as a typical realization of mobile network supporting soft and green technologiesin fifth generation (5G) mobile networks [27]. However, C-RAN is not the only candidatearchitecture that can answer the challenges faced by mobile network operators. Othersolutions include small cells, being part of HetSNets and Massive MIMO. Small cellsdeployments are the main competitors for outdoor hot spot as well as indoor coveragescenarios. All-in-one small footprint solutions like Alcatel-Lucent’s LightRadio [28] canhost all base station functionalities in a several-liter box. They can be placed outdoorsreducing cost of operation associated to cooling and cell site rental. However, they will beunderutilized during low-activity periods and cannot employ collaborative functionalitiesas well as C-RAN. Moreover, they are more difficult to upgrade and repair than C-RAN.A brief comparison between C-RAN, Massive MIMO and HetSNets is outlined in [16].Liu et al. in [29] prove that energy efficiency of large scale Small Cell Networks is highercompared with Massive MIMO. Furthermore, cost evaluation on different options needsto be performed in order for a mobile network operator to choose an optimal solution.Comparison of TCO including CAPEX and OPEX over 8 years of a traditional LTEmacro base station, LTE C-RAN and LTE small cell shows that the total transport costper Mbps is highest for macro cell deployments - 2200$, medium for C-RAN - 1800$and 3 times smaller for small cell - 600$ [30]. Therefore the author concludes thatC-RAN needs to achieve significant benefits to overcome such a high transportation cost.Collaborative techniques such as CoMP and eICIC can be implemented in small cellsgiving higher benefits in HetNet configuration instead of C-RAN. The author envisionsthat C-RAN might be considered for special cases like stadium coverage. However,C-RAN is attractive for operators that have free/cheap fiber resources available.
This chapter surveys the state-of-the-art literature published on C-RAN and its im-plementation until 2014. Such input helps mobile network operators to make an optimalchoice on deployment strategies. The chapter is organized as follows. In Section 2.1 thefundamental aspects of C-RAN architecture are introduced. Moreover, in Section 2.2the advantages of this architecture are discussed in detail along with the challenges thatneed to be overcome before fully exploiting its benefits in Section 2.3. In Section 2.4 a

2.1. What is C-RAN? Base Station architecture evolution 9
number of constraints in regards to the transport network capacity imposed by C-RANare presented and possible solutions are discussed, such as the utilization of compressionschemes. In Sections 2.5, 2.6 an overview of the state-of-the-art hardware solutionsthat are needed to deliver C-RAN from the radio, baseband and network sides are given.As the BBU Pool needs to be treated as a single entity, in Section 2.7 an overview ofvirtualization techniques that can be deployed inside a BBU Pool are presented. In Section2.8 possible deployment scenarios of C-RAN are evaluated. In Section 2.9 ongoing workon C-RAN and examples of first field trials and prototypes are summarized. Furthermore,future research directions are outlined in Section 2.10. Section 2.11 summarizes thechapter.
This section, Sections 2.1-2.6 and 2.8-2.9 were originally published in [10]. Thischapter provides an updated and extended version to reflect recent developments, espe-cially in case of Virtualization, covered in Section 2.7 and showing latest trends in 2.2.5and 2.9.4.
2.1 What is C-RAN? Base Station architecture evolution
C-RAN is a network architecture where baseband resources are pooled, so that they canbe shared between base stations. Figure 2.1 gives an overview of the overall C-RANarchitecture. This section gives an introduction to base station evolution and the basis ofthe C-RAN concept.
RRH 1
RRH 2
RRH n
...
Mobile Backhaul Network
BBU 2
BBU nBBU 1
(a) RAN with RRH
Cloud
RRH 1
RRH 2
RRH n
...
BBU Pool
Mobile Backhaul Network
Aggregated Traffic (h)
24 h
(b) C-RAN
Figure 2.1: Statistical multiplexing gain in C-RAN architecture for mobile networks.
The area which a mobile network covers is divided into cells, therefore mobilenetworks are often called cellular networks. Traditionally, in cellular networks, userscommunicate with a base station that serves the cell under coverage of which they are

10 Chapter 2. C-RAN overview
located. The main functions of a base station can be divided into baseband processing andradio functionalities. The main sub-functions of baseband processing module are shownin left side of Figure 2.2. Among those one can find coding, modulation, Fast FourierTransform (FFT), etc. The radio module is responsible for digital processing, frequencyfiltering and power amplification.
Co
ntr
ol-
RR
C
Tran
spo
rt-M
AC
L3 L2
Co
MP
eIC
IC
Ch
ann
el d
e-/
cod
ing
De-
/Qu
anti
zati
on
An
ten
na
Map
pin
g-M
IMO
De-
/Sam
plin
g
Res
ou
rce-
blo
ck
Map
pin
g
De-
/Mo
du
lati
on
IFFT
/FFT
... ... ... ...
IQ DL
IQ UL
CPRI/OBSAI/ORI
CFR/
DPD
DAC
ADC
Frequency filter
BBU RRH
RRC Radio Resource Control SRC Sampling Rate Conversion DAC Digital-to-Analog ConverterMAC Media Access Control DUC/DDC Digital Up/Downconversion ADC Analog-to-Digital ConverterFFT Fast Fourier Transform CFR Crest Factor Reduction Power Amplifier
DPD Digital Predistortion
CP
RI/
OB
SAI/
OR
I
L1SRC
DUC
SRC
DDC
Figure 2.2: Base station functionalities. Exemplary baseband processing functionalities insideBBU are presented for LTE implementation. Connection to RF part and sub modules ofRRH are shown.
2.1.1 Traditional architectureIn the traditional architecture, radio and baseband processing functionality is integratedinside a base station. The antenna module is generally located in the proximity (fewmeters) of the radio module as shown in Figure 2.3a as coaxial cables employed to connectthem exhibit high losses. This architecture was popular for 1G and 2G mobile networksdeployment.
2.1.2 Base station with RRHIn a base station with RRH architecture, the base station is separated into a radio unitand a signal processing unit, as shown in Figure 2.3b. The radio unit is called a RRH orRemote Radio Unit (RRU). RRH provides the interface to the fiber and performs digitalprocessing, digital to analog conversion, analog to digital conversion, power amplificationand filtering [31]. The baseband signal processing part is called a BBU or Data Unit (DU).More about BBU can be found in Chapter 16 of [32]. Interconnection and function splitbetween BBU and RRH are depicted in Figure 2.2. This architecture was introducedwhen 3G networks were being deployed and right now the majority of base stations use it.
The distance between a RRH and a BBU can be extended up to 40 km, where thelimitation is coming from processing and propagation delay as explained in Section 4.1.3.Optical fiber and microwave connections can be used. In this architecture, the BBUequipment can be placed in a more convenient, easily accessible place, enabling costsavings on site rental and maintenance compared to the traditional RAN architecture,

2.1. What is C-RAN? Base Station architecture evolution 11
Bas
eBan
da) Traditional macro base station
An
tenn
a
b) Base station with RRH
RF
RF
c) C-RAN with RRHs
Virtual BBU Pool
RRH
RRH
RRH
RF
Fiber – Digital BaseBand Coax cable – RF
BS
cellTr
ansp
ort
Co
ntr
ol
Syn
chB
aseB
and
Syn
ch
Co
ntr
ol
Tran
spo
rt
Bas
eBan
d
Syn
ch
Co
ntr
ol
Tran
spo
rt
Bas
eBan
d
Syn
ch
Co
ntr
ol
Tran
spo
rt
Bas
eBan
d
Tran
spo
rt
Co
ntr
ol
Syn
ch
RF
PA
An
tenn
a
cell
S1/X2
RRHRF
BBU
Bas
eBan
d
Tran
spo
rt
Co
ntr
ol
Syn
ch
Ir
Ir
S1/X2 X2
Figure 2.3: Base station architecture evolution.

12 Chapter 2. C-RAN overview
where a BBU needs to be placed close to the antenna. RRHs can be placed up on polesor rooftops, leveraging efficient cooling and saving on air-conditioning in BBU housing.RRHs are statically assigned to BBUs similarly to the traditional RAN. One BBU canserve many RRHs. RRHs can be connected to each other in a so called daisy-chainedarchitecture. An Ir interface is defined, which connects RRH and BBU.
Common Public Radio Interface (CPRI) [33] is the radio interface protocol widelyused for In-phase/Quadrature (IQ) data transmission between RRHs and BBUs - on Irinterface. It is a constant bit rate, bidirectional protocol that requires accurate synchro-nization and strict latency control. Other protocols that can be used are Open Base StationArchitecture Initiative (OBSAI) [34] and Open Radio equipment Interface (ORI) [35],[36]. For LTE base stations the X2 interface is defined between base stations, the S1interface connects a base station with mobile core network.
2.1.3 Cloud base station architecture - C-RANIn C-RAN, in order to optimize BBU utilization between heavily and lightly loaded basestations, the BBUs are centralized into one entity that is called a BBU/DU Pool/Hotel. ABBU Pool is shared between cell sites and virtualized as shown in Figure 2.3c. A BBUPool is a virtualized cluster which can consist of general purpose processors to performbaseband (PHY/MAC) processing. X2 interface in a new form, often referred to as X2+organizes inter-cluster communication as well as communication to other pools.
The concept of C-RAN was first introduced by IBM [21] under the name WirelessNetwork Cloud (WNC) and builds on the concept of Distributed Wireless CommunicationSystem [37]. In [37] Zhou et al. propose a mobile network architecture in which a usercommunicates with densely placed distributed antennas and the signal is processed byDistributed Processing Centers (DPCs). C-RAN is the term used now to describe thisarchitecture, where the letter C can be interpreted as: Cloud, Centralized processing,Cooperative radio, Collaborative or Clean.
Figure 2.4 shows an example of a C-RAN mobile LTE network. The fronthaul partof the network spans from the RRHs sites to the BBU Pool. The backhaul connects theBBU Pool with the mobile core network. At a remote site, RRHs are co-located withthe antennas. RRHs are connected to the high performance processors in the BBU Poolthrough low latency, high bandwidth optical transport links. Digital baseband, i.e., IQsamples, are sent between a RRH and a BBU.
Table 2.1 compares traditional base station, base station with RRH and base station inC-RAN architecture.
2.2 Advantages of C-RAN
Both macro and small cells can benefit from C-RAN architecture. For macro base stationdeployments, a centralized BBU Pool enables an efficient utilization of BBUs and reducesthe cost of base stations deployment and operation. It also reduces power consumption and

2.2. Advantages of C-RAN 13
Table 2.1: Comparison between traditional base station, base station with RRH and C-RAN
Architecture Radio and base-band functionali-ties
Problem itaddresses
Problems itcauses
Traditionalbase station
Co-located in oneunit
- High powerconsump-tionResourcesare underuti-lized
Base stationwith RRH
Spitted betweenRRH and BBU.RRH is placed to-gether with an-tenna at the re-mote site.BBU locatedwithin 20-40 kmaway.Generally de-ployed nowadays
Lowerpower con-sumption.More conve-nient place-ment ofBBU
Resourcesare underuti-lized
C-RAN Spitted into RRHand BBU.RRH is placed to-gether with an-tenna at the re-mote site.BBUs frommany sites areco-located in thepool within 20-40km away.Field trials andearly deploy-ments (2015)
Even lowerpower con-sumption.Lower num-ber of BBUsneeded - costreduction
ConsiderabletransportresourcesbetweenRRH andBBU

14 Chapter 2. C-RAN overview
EPC
Base
band
Base
band
Base
band
Base
band
S1
S1
X2
BBU
pool
Access
network
MME
SGW
PGW
Fronthaul Backhaul
Base
band
Base
band
Base
band
Base
band
BBU
pool
Aggregation
network
Mobile Core
NetworkRRH
RRH
RRH
RRH
RRH
Ir
Figure 2.4: C-RAN LTE mobile network.
provides increased flexibility in network upgrades and adaptability to non-uniform traffic.Furthermore, advanced features of LTE-A, such as CoMP and interference mitigation,can be efficiently supported by C-RAN, which is essential especially for small cellsdeployments. Last but not least, having high computational processing power shared bymany users placed closer to them, mobile operators can offer users more attractive ServiceLevel Agreements (SLAs), as the response time of application servers is noticeably shorterif data is cached in BBU Pool [38]. Network operators can partner with third-party servicedevelopers to host servers for applications, locating them in the cloud - in the BBU Pool[39]. In this section advantages of C-RAN are described and motivated: A. Adaptability tononuniform traffic and scalability, B. Energy and cost savings, C. Increase of throughput,decrease of delays as well as D. Ease in network upgrades and maintenance.
2.2.1 Adaptability to nonuniform traffic and scalabilityTypically, during a day, users are moving between different areas, e.g., residential andoffice. Figure 2.5 illustrates how the network load varies throughout the day. Base stationsare often dimensioned for busy hours, which means that when users move from officeto residential areas, the huge amount of processing power is wasted in the areas fromwhich the users have moved. Peak traffic load can be even 10 times higher than duringoff-the-peak hours [20]. In each cell, daily traffic distribution varies, and the peaks oftraffic occur at different hours. Since in C-RAN baseband processing of multiple cells iscarried out in the centralized BBU pool, the overall utilization rate can be improved. Therequired baseband processing capacity of the pool is expected to be smaller than the sumof capacities of single base stations. The ratio of sum of single base stations capacity tothe capacity required in the pool is called statistical multiplexing gain.
In [40] an analysis on statistical multiplexing gain is performed as a function of celllayout. The analysis shows that in the Tokyo metropolitan area, the number of BBUs canbe reduced by 75% compared to the traditional RAN architecture. In [41] Werthmann etal. prove that the data traffic influences the variance of the compute resource utilization,which in consequence leads to significant multiplexing gains if multiple sectors are

2.2. Advantages of C-RAN 15
0
5
10
15
20
25
30
35
40
45
0 6 12 18 24
Load
Time (h)
Office base station Residential base station
Figure 2.5: Daily load on base stations varies depending on base station location. Datasource: [20].
aggregated into one single cloud base station. Aggregation of 57 sectors in a single BBUPool saves more than 25% of the compute resources. Moreover, the user distribution hasa strong influence on the utilization of the compute resources. The results of last threeworks converge giving around 25% of potential savings on baseband resources. In [42]Bhaumik et al. show that the centralized architecture can potentially result in savings of atleast 22% in compute resources by exploiting the variations in the processing load acrossbase stations. In [40] Namba et al. analyze statistical multiplexing gain as a functionof cell layout. The analysis shows that for the metropolitan area, the number of BBUscan be reduced by 75% compared to the traditional base station. In [43] Madhavan etal. quantify the multiplexing gain of consolidating WiMAX base stations in differenttraffic conditions. The gain increases linearly with network size and it is higher whenbase stations are experiencing higher traffic intensity. On the contrary, in [44] Liu etal. analyzed that lighter load can increase the statistical multiplexing gain in virtualbase station pool. Moreover, multiplexing gain reaches significant level even for themedium-size pools and the increase in gain for larger pools in negligible.
In author’s previous work [11] initial evaluation of statistical multiplexing gain ofBBUs in C-RAN was presented. The paper concludes that 4 times less BBUs are neededfor user data processing in a C-RAN compared to a traditional RAN for specific trafficpatterns, making assumptions of the number of base stations serving different typesof areas. The model does not include mobile standard protocols processing. Afterincluding protocol processing in [12] the statistical multiplexing gain varied between 1.2and 1.6 depending on traffic mix, reaching the peak for 30% of office and thereby 70%of residential base stations, thereby enabling saving of 17% - 38%. Those results arepresented in Sections 3.2 and 3.3, respectively. Secondly, results obtained via simulations[12] have been compared to the ones achieved with teletraffic theory [45].
All those works referred to the traditional - Baseband (BB)/RF - functional split of

16 Chapter 2. C-RAN overview
C-RAN. In [46] authors estimate what they define as statistical multiplexing convergenceratio on fronthaul links by averaging observed daily throughput. Calculated ratio equalsto three. However, the analysis took only average network load into account and thereforecan be interpreted mostly as an average daily fronthaul utilization. In author’s most recentwork [13] different functional splits (as presented in Section 2.10.1) and different, preciselydefined application mixes are investigated. A numerical evaluation was given supportingthe intuitive conclusions that the maximum multiplexing gain on BBU resources can beachieved for a fully centralized C-RAN. The more functionality is moved from the BBUpool to the cell site, the lower the multiplexing gain on the BBU pool. However, whentraffic starts to be variable bit rate, a multiplexing gain on fronthaul links can be achieved,lowering the required capacity. Those results are presented in Section 3.4.
Statistical multiplexing gain can be maximized by employing a flexible, reconfigurablemapping between RRH and BBU adjusting to different traffic profiles [47]. Statisticalmultiplexing gain depends on the traffic, therefore it can be maximized by connectingRRHs with particular traffic profiles to different BBU Pools [12]. More on multiplexinggain evaluation can be found in Chapter 3.
Coverage upgrades simply require the connection of new RRHs to the already existingBBU Pool. To enhance network capacity, existing cells can then be split, or additionalRRHs can be added to the BBU Pool, which increases network flexibility. Deployment ofnew cells is in general more easily accepted by local communities, as only a small deviceneeds to be installed on site (RRH) and not a bulky base station. If the overall networkcapacity shall be increased, this can be easily achieved by upgrading the BBU Pool, eitherby adding more hardware or exchanging existing BBUs with more powerful ones.
As BBUs from a large area will be co-located in the same BBU Pool, load balancingfeatures can be enabled with advanced algorithms on both the BBU side and the cellsside. On the BBU side, BBUs already form one entity, therefore load balancing is amatter of assigning proper BBU resources within a pool. On the cells side, users can beswitched between cells without constraints if the BBU Pool has capacity to support them,as capacity can be assigned dynamically from the pool.
2.2.2 Energy and cost savings coming from statistical multiplexinggain in BBU Pool and use of virtualization
By deploying C-RAN, energy, and as a consequence, cost savings, can be achieved [48].80% of the CAPEX is spent on RAN [20], therefore it is important to work towardsreducing it.
Energy in mobile network is spent on power amplifiers, supplying RRH and BBUwith power and air conditioning. 41% of OPEX on a cell site is spent on electricity [20].Employing C-RAN offers potential reduction of electricity cost, as the number of BBUs ina C-RAN is reduced compared to a traditional RAN. Moreover, in the lower traffic period,e.g., during the night, some BBUs in the pool can be switched off not affecting overallnetwork coverage. Another important factor is the decrease of cooling resources, which

2.2. Advantages of C-RAN 17
takes 46% of cell site power consumption [20]. Due to the usage of RRHs air conditioningof radio module can be decreased as RRHs are naturally cooled by air hanging on mastsor building walls, as depicted in Figure 2.3. ZTE estimates that C-RAN enables 67%-80%power savings compared with traditional RAN architecture, depending on how many cellsone BBU Pool covers [24], which stays in line with China Mobile research claiming 71%power savings [49].
Civil work on remote sites can be reduced by gathering equipment in a central room,what contributes to additional OPEX savings.
In total, 15% CAPEX and 50% OPEX savings are envisioned comparing to RAN withRRH [49] or traditional RAN architecture [50]. However, the cost of leasing the fiberconnection to the site may increase CAPEX. IQ signal transported between RRHs andBBUs brings up a significant overhead. Consequently, the installation and operation oftransport network causes considerable costs for operators.
Moreover, virtualization helps to reduce cost of network deployment and operation, atthe same time enabling operators to offer additional services, not only serve as pipelinesfor carrying user date.
2.2.3 Increase of throughput, decrease of delayseICIC [51] and CoMP [52] are important features of LTE-A that aim at minimizing intercell interference and utilizing interference paths constructively, respectively.
If all the cells within a CoMP set are served by one BBU Pool, then a single entitydoing signal processing enables tighter interaction between base stations. Thereforeinterference can be kept to lower level and consequently the throughput can be increased[48]. It has been proven that combining clustering of cells with CoMP makes moreefficient use of the radio bandwidth [53]. Moreover, Inter-cell Interference Coordination(ICIC) can be implemented over a central unit - BBU Pool - optimizing transmission frommany cells to multiple BBUs [54].
In [55] Huiyu et al. discuss the factors affecting the performance of CoMP withLTE-A in C-RAN uplink (UL), i.e., receiver algorithm, reference signals orthogonalityand channel estimation, density and size of the network. In [20] authors present simulationresults which compare spectrum efficiency of intra-cell and inter-cell JT to non-cooperativetransmission. 13% and 20% increase in spectrum efficiency was observed, respectively.For a cell edge user, spectrum efficiency can increase by 75% and 119%, respectively.In [56] Li et al. introduce LTE UL CoMP joint processing and verify its operation ona C-RAN test bed around Ericsson offices in Beijing Significant gain was achieved atthe cell edge both for intra-site CoMP and inter-site CoMP. Throughput gain is 30-50%when there is no interference and can reach 150% when interference is present. Theauthors have compared MRC (Maximum Ratio Combining) and full IRC (InterferenceRejection Combining). Due to the reduction of X2 usage in C-RAN, real time CoMPcan give 10-15% of joint processing gain, while real time ICIC enables 10-30% of multicell Radio Resource Management (RRM) gain [19]. Performance of multiple-point JT

18 Chapter 2. C-RAN overview
and multiple-user joint scheduling has been analyzed for a non-ideal channel with carrierfrequency offset [57]. When carrier frequency offset does not exceed ±3 ∼ 5ppb, C-RANcan achieve remarkable performance gain on both capacity and coverage even in non-idealchannel, i.e., 20%/52% for cell average/cell edge.
With the introduction of the BBU Pool cooperative techniques, as Multi-Cell MIMO[58] can be enhanced. This can be achieved due to tighter cooperation between base stationwithin a pool. In [59], Liu et al. present a downlink Antenna Selection Optimizationscheme for MIMO based on C-RAN that showed advantages over traditional antennaselection schemes.
2.2.3.1 Decrease of the delaysThe time needed to perform handovers is reduced as it can be done inside the BBU Poolinstead of between eNBs. In [60] Liu et al. evaluate the improvement on handoverperformance in C-RAN and compare it with RAN with RRHs. In GSM, the total averagehandover interrupt time is lower and the signaling is reduced due to better synchroniza-tion of BBUs. In UMTS signaling, Iub transport bearer setup and transport bandwidthrequirements are reduced, however, the performance improvement may not be sensed bythe user. For LTE X2-based inter-eNB handover the delay and failure rate are decreased.Moreover, the general amount of signaling information sent to core mobile network isreduced, after being aggregated in the pool.
2.2.4 Ease in network upgrades and maintenanceC-RAN architecture with several co-located BBUs eases network maintenance: not onlyC-RAN capacity peaks and failure might be absorbed by BBU Pool automatic reconfigu-ration, therefore limiting the need for human intervention, but whenever hardware failuresand upgrades are really required, human intervention is to be done only in a very fewBBU pool locations. On the contrary for traditional RAN, the servicing may be requiredat as many cell sites as there are in the network. C-RAN with a virtualized BBU Poolgives a smooth way for introducing new standards, as hardware needs to be placed in fewcentralized locations. Therefore deploying it can be considered by operators as a part oftheir migration strategy.
Co-locating BBUs in BBU Pool enables more frequent CPU updates than in casewhen BBUs are located in remote sites. It is therefore possible to benefit from theIT technology improvements in CPU technology, be it frequency clock (Moore’s law)or energy efficiency (as currently seen in Intel mobile processor road map or ARMarchitecture).
Software Defined Radio (SDR) is a well known technology that facilitates implemen-tation in software of such radio functions like modulation/demodulation, signal generation,coding and link-layer protocols. The radio system can be designed to support multiplestandards [61]. A possible framework for implementing software base stations that areremotely programmable, upgradable and optimizable is presented in [62]. With such

2.3. Challenges of C-RAN 19
technology, C-RAN BBU Pool can support multi-standard multi-system radio communi-cations configured in software. Upgrades to new frequencies and new standards can bedone through software updates rather than hardware upgrades as it is often done today onnon-compatible vertical solutions. Multi-mode base station is therefore expected to allevi-ate the cost of network development and Operations, Administration and Maintenance(OAM).
2.2.5 Benefits driving deploymentsA recent (July 2015) study conducted by LightReading [63] on "What is the most importantdriver for operators to deploy a centralized or cloud RAN" shows that 27% of respondentschoose OPEX reduction through centralization, while another 24% pointed out CAPEXreduction through NFV. The complete results (excluding 3% of responses stating "other")are presented in Figure 2.6. What is interesting is that all the advantages mentioned inprevious sections are mentioned apart from boosting cooperative techniques, at least theyare not mentioned explicitly. OPEX reduction through centralization was a motivationto study multiplexing gain, as presented in Chapter 3, therefore the result of the surveyprovers that it was an important parameter to study.
OPEX reduction through centralization
27%
CAPEX reduction through NFV
25%
More flexibility in the network
23%
Greater scalability
12% Potential to deploy radios closer to the users
9%
Reducing baseband processing requirements
4%
Other 13%
LightReading survey results: what is the most important driver for operators to deploy C-RAN?
Figure 2.6: Results of the survey [63] on operators’ drives for deploying C-RAN.
2.3 Challenges of C-RAN
Before the commercial deployment of C-RAN architectures a number of challenges needto be addressed: A. High bandwidth, strict latency and jitter as well as low cost transport

20 Chapter 2. C-RAN overview
network needs to be available, B. Techniques on BBU cooperation, interconnection andclustering need to be developed as well as C. Virtualization techniques for BBU Pool needto be proposed. This section elaborates on those challenges. The latter sections present anongoing work on possible technical solutions that enable C-RAN implementation (Section2.4, 2.5, 2.6 and 2.7). Figure 2.7 gives an overview of technical solutions addressed inthis chapter.
Fronthaul transport network
Section 2.5
Base band
Base band
Base band
Base band
BBU pool
RRH
RRH
RRH
Virtualization
Section 2.8
Section 2.6
BBU
Implementation
Section 2.7
Figure 2.7: An overview on technical solutions addressed in this chapter.
2.3.1 A need for high bandwidth, strict latency and jitter as well aslow cost transport network
The C-RAN architecture brings a huge overhead on the optical links between RRH andBBU Pool. Comparing with backhaul requirements, the one on fronthaul are envisionedto be 50 times higher [54].
IQ data is sent between BBU and RRH as shown in Figure 2.2. The main contributorsto the size of IQ data are: turbocoding (e.g., in UMTS and LTE 1:3 turobocode is usedresulting in three times overhead), chosen radio interface (e.g., CPRI) IQ sample width andoversampling of LTE signal. For example, 30.72 MHz sampling frequency is standardizedfor 20 MHz LTE, which is more than 20 MHz needed according to Nyquist - Shannonsampling theorem. Total bandwidth depends also on number of sectors and MIMOconfiguration. Equation 2.1 summarizes factors that influence IQ bandwidth. Scenario of20 MHz LTE, 15+1 CPRI IQ Sample width, 10/8 line coding, 2x2 MIMO transmissionresulting in 2.4576 Gbps bit rate in fronthal link is often treated as a baseline scenario.Consequently, for 20 MHz 4x4 MIMO, 3 sector base station, the expected IQ throughputexceeds 10 Gbps. Examples on expected IQ bit rate between cell site and BBU in LTE-A,LTE, Time Division Synchronous Code Division Multiple Access (TD-SCDMA) andGSM networks can be found in Table 2.2. The centralized BBU Pool should support 10 -1000 base station sites [20], therefore a vast amount of data needs to be carried towards it.

2.3. Challenges of C-RAN 21
IQBandwidth = samplingFrequency · sampleWidth
·2 · lineCoding ·MIMO · noOfSectors (2.1)
Table 2.2: IQ bit rates between a cell site and centralized BBU Pool
Cell configuration Bit rate Source20 MHz LTE, 15+1 CPRI IQ Sam-ple width, 10/8 line coding, 2x2MIMO
2.5 Gbps
5x20 MHz LTE-A, 15 CPRI IQ Sam-ple width, 2x2 MIMO, 3 sectors
13.8 Gbps [64]
20 MHz LTE, 4x2 MIMO, 3 sectors 16.6 Gbps [22]TD-LTE, 3 sectors 30 Gbps [65]1.6 MHz TD-SCDMA, 8Tx/8Rx an-tennas, 4 times sampling rate
330 Mbps [20]
TD-SCDMA S444, 3 sectors 6 Gbps [65]200 kHz GSM, 2Tx/2Rx antennas,4x sampling rate
25.6 Mbps [20]
The transport network not only needs to support high bandwidth and be cost efficient,but also needs to support strict latency and jitter requirements. Below different constraintson delay and jitter are summarized:
1. The most advanced CoMP scheme, JT, introduced in Section 2.2.3 requires 0.5µstiming accuracy in collaboration between base stations, which is the tightest con-straint. However, it is easier to cope with synchronization challenges in C-RANcompared to traditional RAN due to the fact that BBUs are co-located in the BBUPool.
2. According to [20], regardless of the delay caused by the cable length, round tripdelay of user data may not exceed 5 µs, measured with the accuracy of ±16.276nson each link or hop [33].
3. The sub-frame processing delay on a link between RRHs and BBU should be keptbelow 1 ms, in order to meet HARQ requirements. Due to the delay requirementsof HARQ mechanism, generally maximum distance between RRH and BBU mustnot exceed 20-40 km [20].
Recommendations on transport network capacity can be found in Section 2.4.

22 Chapter 2. C-RAN overview
2.3.2 BBU cooperation, interconnection and clusteringCooperation between base stations is needed to support CoMP in terms of sharing theuser data, scheduling at the base station and handling channel feedback information todeal with interference.
Co-location of many BBUs requires special security and resilience mechanisms.Solutions enabling connection of BBUs shall be reliable, support high bandwidth andlow latency, low cost with a flexible topology interconnecting RRHs. Thus, C-RANmust provide a reliability that is better or comparable to traditional optical networks likeSynchronous Digital Hierarchy (SDH), which achieved high reliability due to their ringtopology. Mechanisms like fiber ring network protection can be used.
Cells should be optimally clustered to be assigned to one BBU Pool, in order toachieve statistical multiplexing gain, facilitate CoMP, but also to prevent the BBU Pooland the transport network from overloading. One BBU Pool should support cells fromdifferent areas such as office, residential or commercial. After analyzing interferences abeneficial assignment of cells to one BBU Pool can be chosen.
To achieve optimal energy savings of the C-RAN, base stations need to be chosen ina way that will optimize the number of active RRHs/BBU units within the BBU Pool.Proper RRH aggregation and assignment to one BBU Pool can also facilitate CoMP [53].
To achieve optimal throughput on the cell edges cooperative transmission/receptionschemes are needed to deal with large Inter Cell Interference (ICI), improving spectrumefficiency. The resource sharing algorithms have been developed by the research commu-nity. They need to be combined with an algorithm clustering the cells to reduce schedulingcomplexity. Therefore, the well-designed scheduler in C-RAN also has an impact on thespectrum efficiency [26].
In [40] Namba et al. propose an architecture of Colony RAN that can dynamicallychange the connections of BBUs and RRHs in respect to traffic demand. Semi-staticand adaptive BBU-RRH switching schemes for C-RAN are presented and evaluated in[66], where it was proved that the number of BBUs can be reduced by 26% and 47% forsemi-static and adaptive schemes, respectively, compared with the static assignment.
2.3.3 Virtualization techniqueA virtualization technique needs to be proposed to distribute or group processing betweenvirtual base station entities and sharing of resources among multiple operators. Anyprocessing algorithm should be expected to work real time - dynamic processing capacityallocation is necessary to deal with a dynamically changing cell load.
Virtualization and cloud computing techniques for IT applications are well definedand developed. However, C-RAN application poses different requirements on cloudinfrastructure than cloud computing. Table 2.3 compares cloud computing and C-RANrequirements on cloud infrastructure. More on virtualization solutions can be found inSection 2.7.

2.4. Transport network techniques 23
Table 2.3: Requirements for cloud computing and C-RAN applications [54]
IT - Cloud com-puting
Telecom - CloudRAN
Client/basestation datarate
Mbps range,bursty, lowactivity
Gbps range, con-stant stream
Latency andjitter
Tens of ms < 0.5 ms, jitter inns range
Life time of in-formation
Long (contentdata)
Extremely short(data symbols andreceived samples)
Allowedrecovery time
s range (some-times hours)
ms range to avoidnetwork outage
Number ofclients percentralizedlocation
Thousands, evenmillions
Tens, maybe hun-dreds
2.4 Transport network techniques
This section presents the technical solutions enabling C-RAN by discussing on transportnetwork, covering physical layer architecture, physical medium, possible transport net-work standards and devices needed to support or facilitate deployments. Moreover, IQcompression techniques are listed and compared.
As introduced in Section 2.3, a C-RAN solution imposes a considerable overhead onthe transport network. In this section, a number of transport network capacity issues areaddressed, evaluating the internal architecture of C-RAN and the physical medium inSection 2.4.1 as well as transport layer solutions that could support C-RAN in Section2.4.2. An important consideration is to apply IQ compression/decompression betweenRRH and BBU. Currently available solutions are listed in Section 2.4.4.
The main focus of this section is on fronthaul transport network, as this is characteristicfor C-RAN. Considerations on backhaul network can be found in, e.g., [67]. The choiceof the solution for the particular mobile network operator depends on whether C-RANis deployed from scratch as green field deployment or introduced on top of existinginfrastructure. More on deployment scenarios can be found in Section 2.8.

24 Chapter 2. C-RAN overview
2.4.1 Physical layer architecture and physical medium2.4.1.1 PHY layer architecture in C-RANThere are two approaches on how to split base station functions between RRH and BBUwithin C-RAN in order to reduce transport network overhead.
In the fully centralized solution, L1, L2 and L3 functionalities reside in the BBU Pool,as shown in Figure 2.8a. This solution intrinsically generates high bandwidth IQ datatransmission between RRH and BBU.
In partially centralized solution, shown in Figure 2.8b, L1 processing is co-located withthe RRH, thus reducing the burden in terms of bandwidth on the optical transport links,as the demodulated signal occupies 20 - 50 times less bandwidth [20] than the modulatedone. This solution is however less optimal because resource sharing is considerablyreduced and advanced features such as CoMP cannot be efficiently supported. CoMPbenefits from processing the signal on L1, L2 and L3 in one BBU Pool instead of inseveral base stations [20]. Therefore a fully centralized solution is more optimal. Othersolutions, in between the two discussed above, have also been proposed, where only somespecific functions of L1 processing are co-located with the RRH, e.g., L1 pre-processingof cell/sector specific functions, and most of L1 is left in the BBU [68].
RF
RF
a) C-RAN: fullly centralized solution
Virtual BBU Pool
L1
RRHRRH
RRH
RF
RF RRH
RF
RF
b) C-RAN: partially centralized solution
Virtual BBU Pool
RRH/L1RRH/L1
RRH/L1
RF
RF RRH/L1
Fiber Microwave
L1 L1
L1
L1
L2L3
O&M
L2L3
O&M
Figure 2.8: C-RAN architecture can be either fully or partially centralized depending on L1baseband processing module location.

2.4. Transport network techniques 25
2.4.1.2 Physical mediumAs presented in [22], only 35% of base stations were forecasted to be connected throughfiber, and 55% by wireless technologies, the remaining 10% by copper on a global scalein 2014. However, the global share of fiber connections is growing. In North America thehighest percentage of backhaul connections were forecasted to be done over fiber - 62.5%in 2014 [69].
Fiber links allow huge transport capacity, supporting up to tens of Gbps per channel.40 Gbps per channel is now commercially available, while future systems will be using100 Gbps modules and higher, when their price and maturity will become more attractive[20].
Typical microwave solutions offer from 10 Mbps-100 Mbps up to 1 Gbps range [70],the latter available only for a short range (up to 1.5 km) [69]. Therefore 3:1 compressionwould allow 2.5 Gbps data to be sent over such 1 Gbps link. In [71] Ghebretensae et al.propose to use E-band microwave transmission in (70/80 GHz) between BBU Pool andRRH. They proved that E-band microwave transmission can provide Gbps capacity, usingequipment currently available commercially (2012) on the distance limited to 1-2 km toassure 99.999% link availability and 5-7 km when this requirement is relaxed to 99.9%availability. In the laboratory setup they have achieved 2.5 Gbps on microwave CPRIlinks. This supports delivering 60 Mbps to the end user LTE equipment. E-BLINK [72] isan exemplary company providing wireless fronthaul.
For small cells deployment, Wi-Fi is seen as a possible solution for wireless back-hauling [67]. Therefore, using the same solutions, Wi-Fi can potentially be used forfronthauling. The latest Wi-Fi standard, IEEE 802.11ad, can achieve the maximum the-oretical throughput of 7 Gbps. However, the solution is not available on the market yet(2013).
The solution based on copper links is not taken into account for C-RAN, as DigitalSubscriber Line (DSL) based access can offer only up to 10-100 Mbps.
To conclude, full C-RAN deployment is currently only possible with fiber linksbetween RRH and BBU Pool. In case C-RAN is deployed in a partially centralizedarchitecture, or when compression is applied, microwave can be considered as a transportmedium between RRHs and BBU Pool.
2.4.2 Transport networkAs fiber is the most prominent solution for the physical medium, its availability for thenetwork operator needs to be taken into account choosing the optimal transport networksolution. Moreover, operators may want to reuse their existing deployments. Varioustransport network solutions are presented in Figure 2.9 and discussed below [20].
2.4.2.1 Point to point fiberPoint to point fiber is a preferred solution for a BBU Pool with less than 10 macrobase stations [20], due to capacity requirements. Dark fiber can be used with low cost,

26 Chapter 2. C-RAN overview
CPRI / OBSAI
CPRI / OBSAI
WDM
CPRI / OBSAI
CPRI / OBSAI
Microvawe
Compression Compression
Eth/CPRI/ OBSAI
Eth/CPRI/ OBSAI
Ethernet
CPRI/ OBSAI
CPRI/ OBSAI
OTN
BBU Pool
RRH
CPRI / OBSAI Point to point
Technology is ready
(capacity not necessarily)WDM-PON
Internet
Figure 2.9: Possible fronthaul transport solutions
because no additional optical transport network equipment is needed. On the otherhand, this solution consumes significant fiber resources, therefore network extensibilityis a challenge. New protection mechanisms are required in case of failure, as well asadditional mechanisms to implement O&M are needed. However, those challenges canbe answered. CPRI products are offering 1+1 backup/ring topology protection features. Iffiber is deployed with physical ring topology it offers resiliency similar to SDH. O&Mcapabilities can be introduced in CPRI.
2.4.2.2 WDM/OTNWavelength-division multiplexing (WDM)/Optical Transport Network (OTN) solutionsare suitable for macro cellular base station systems with limited fiber resources, especiallyin the access ring. The solution improves the bandwidth on BBU-RRH link, as 40-80optical wavelength can be transmitted in a single optical fiber, therefore with 10 Gbpslarge number of cascading RRH can be supported, reducing the demand on dark fiber. Onthe other hand, high cost of upgrade to WDM/OTN need to be covered. However, as thespan on fronthaul network does not exceed tens of kilometers, equipment can be cheaperthan in long distance backbone networks. Usage of plain WDM CPRI transceivers wasdiscussed and their performance was evaluated in [73]. [23] applies WDM in their visionof C-RAN transport network.
In [74] Ponzini et al. describe the concept of non-hierarchical WDM-based access for

2.4. Transport network techniques 27
C-RAN. The authors have proven that WDM technologies can more efficiently supportclustered base station deployments offering improved flexibility in term of networktransparency and costs. Using that concept already deployed fibers, such as PassiveOptical Networks (PONs) or metro rings, can be reused to carry any type of traffic,including CPRI, on a common fiber infrastructure. By establishing virtual P2P WDMlinks up to 48 bidirectional CPRI links per fiber can be supported.
For scarce fiber availability ZTE proposes enhanced fiber connection or xWDM/OTN[65]. Coarse WDM is suitable to be used for TD-SCDMA, while Dense WDM for LTE,due to capacity requirements.
OTN is a standard proposed to provide a way of supervising client’s signals, assurereliability compared with Synchronous Optical NETworking (SONET)/SDH network aswell as achieve carrier grade of service. It efficiently supports SONET/SDH as well asEthernet and CPRI. CPRI can be transported over OTN over low level Optical channelData Unit (ODU)k containers as described in ITU-T G.709/Y.1331 [75], [76].
2.4.2.3 Unified Fixed and Mobile accessUnified Fixed and Mobile access, like UniPON, based on Coarse WDM, combinesfixed broadband and mobile access network. UniPON provides both PON services andCPRI transmission. It is suitable for indoor coverage deployment, offers 14 differentwavelengths per optical cable, reducing overall cost as a result of sharing. However, itshould be designed to be competitive in cost. Such a WDM-OFDMA UniPON architectureis proposed and examined in [77], and a second one, based on WDM-PON in [71]. In[71], referenced also in Section 2.4.1.2, Ghebretensae et al. propose an end-to-endtransport network solution based on Dense WDM(-PON) colorless optics, which supportsload balancing, auto configuration and path redundancy, while minimizing the networkcomplexity. In [78] Fabrega et al. show how to reuse the deployed PON infrastructure forRAN with RRHs. Connections between RRHs and BBUs are separated using very denseWDM, coherent optical OFDM helps to cope with narrow channel spacings.
2.4.2.4 Carrier EthernetCarrier Ethernet transport can also be directly applied from RRH towards BBU Pool. Inthat case, CPRI-to-Ethernet (CPRI2Eth) gateway is needed between RRH and BBU Pool.CPRI2Eth gateway needs to be transparent in terms of delay. It should offer multiplexingcapabilities to forward different CPRI streams to be carried by Ethernet to differentdestinations.
The term Carrier Ethernet refers to two things. The first is the set of services thatenable to transport Ethernet frames over different transport technologies. The other oneis a solution how to deliver these services, named Carrier Ethernet Transport (CET).Carrier Ethernet, e.g., Provider Backbone Bridge - Traffic Engineering (PBB-TE) issupposed to provide carrier - grade transport solution and leverage the economies of scaleof traditional Ethernet [79]. It is defined in IEEE 802.1Qay-2009 standard. It evolved from

28 Chapter 2. C-RAN overview
IEEE 802.1Q Virtual LAN (VLAN) standard through IEEE 802.1ad Provider Bridges (PB)and IEEE 802.1ah Provider Backbone Bridges (PBB). To achieve Quality of Service (QoS)of Ethernet transport service, traffic engineering is enabled in Carrier Ethernet. PBB-TEuses the set of VLAN IDs to identify specific paths to given MAC address. Thereforea connection-oriented forwarding mode can be introduced. Forwarding information isprovided by management plane and therefore predictable behavior on predefined pathscan be assured. Carrier Ethernet ensures 99.999% service availability. Up to 16 millioncustomers can be supported which removes scalability problem of PBB-TE predecessor[80]. Carrier Ethernet grade of service can also be assured by using MPLS TransportProfile (MPLS-TP). Technologies are very similar, although PBB-TE is based on Ehternetand MPLS-TP on Multiprotocol Label Switching (MPLS).
The main challenge in using packet passed Ethernet in the fronthaul is to meet thestrict requirements on synchronization, syntonization and delay. Synchronization refersto phase and syntonization to the frequency alignment, respectively. Base stations needto be phase and frequency aligned in order to, e.g., switch between uplink and downlinkin the right moment and to stay within their allocated spectrum. For LTE-A frequencyaccuracy needs to stay within ±50ppb (for a wide area base station) [6.5 in [81]] whilephase accuracy of ±1.5µs is required for cell with radius ≤ 3km [82]. Time-SensitiveNetworking (TSN) features help to achieve delay and synchronization requirements. Moreinformation about them can be found in Section 4.7, while the whole Chapter 4 gives adeep overview of challenges and solutions for Carrier Ethernet-based fronthaul.
Altiostar is an exemplary company providing Ethernet fronthaul [83].
2.4.3 Transport network equipmentThis Section presents examples of network equipment that has been developed for usagein C-RAN architecture.
2.4.3.1 CPRI2Ethernet gatewayIf Ethernet is chosen as a transport network standard, CPRI2Eth gateway is needed tomap CPRI data to Ethernet packets, close to or at the interface of RRH towards BBU Pool.Patents on such a solutions have been filed, see for example, [84].
2.4.3.2 IQ data routing switchChina Mobile Research Institute developed a large scale BBU Pool supporting morethan 1000 carriers in 2011. The key enabler of this demonstration was a IQ data routingswitch [20]. It is based on a Fat-Tree architecture of Dynamic Circuit Network (DCN)technology. In Fat-Tree topology multiple root nodes are connected to separate trees. Thatensures high reliability and an easy solution to implement load balancing between BBUs.China Mobile has achieved real time processing and link load balancing. In addition,resource management platform has been implemented.

2.4. Transport network techniques 29
2.4.3.3 CPRI muxCPRI mux is a device that aggregates traffic from various radios and encapsulates itfor transport over a minimum number of optical interfaces. It can also implement IQcompression/decompression and have optical interfaces: for Coarse WDM and/or DenseWDM. BBU Pool will be demultiplexing the signals multiplexed by the CPRI mux [22].
2.4.3.4 x2OTN gatewayIf OTN is chosen as a transport network solution, then CPRI/OBSAI to OTN gatewayis needed to map signals from two standards. Altera has a Soft Silicon OTN processorthat can map any client into ODU container [85]. The work was started by TPACK.Performance of CPRI and OBSAI over OTN transport network has been proven in [86]for e.g., C-RAN application.
2.4.4 IQ Compression schemes and solutionsIn C-RAN the expected data rate at the fronthaul link can be 12 to 55 times highercompared to data rate on the radio interface, depending on CPRI IQ sample width andmodulation. RRHs transmit raw IQ samples towards BBU cloud, therefore, an efficientcompression schemes are needed to optimize such a huge bandwidth transmission overcapacity-constrained links. Potential solutions could be to reduce signal sampling rate,use non-linear quantization, frequency sub-carrier compression or IQ data compression[20]. Techniques can be mixed and a chosen scheme is a trade-off between achievablecompression ratio, algorithm and design complexity, computational delay and the signaldistortion it introduces as well as power consumption, as shown in Figure 2.10. Thefollowing techniques can be used to achieve IQ compression.
Compression ratio
Design complexity
EVM
Latency
Design size
Power consumption
Figure 2.10: Factors between which a trade off needs to be reached choosing an IQcompression scheme.
Reducing signal sampling rate is a low complex solution having minimal impact onprotocols, improves compression up to 66% with some performance degradation [20].

30 Chapter 2. C-RAN overview
By applying non-linear quantization, more quantization levels are specified for theregion in magnitude where more values are likely to be present. This solution improvesQuantization SNR (QSNR). Mature, logarithmic encoding algorithms, like µ-Law orA-law are available to specify the step size. Compression efficiency up to 53% can beachieved. This method creates additional Ir interface complexity (interface between RRHand BBU) [20].
IQ data compression can be done using e.g., Digital Automatic Gain Control (DAGC)[20], [87]. This technique is based on reducing the signal’s dynamic range by normal-izing the power of each symbol to the average power reference, therefore reducing thesignal dynamic range. This method affects Signal-to-noise ratio (SNR) and Error VectorMagnitude (EVM) deteriorates in DL. Potential high compression rate can be achieved,however the method has a high complexity and no mature algorithms are available.
One example of a frequency domain scheme is to perform sub carrier compression.Implementing the FFT/Inverse FFT (IFFT) blocks in the RRH allows 40% reductionof Ir interface load. It can be easily performed in DL, however RACH processing is abig challenge. This frequency domain compression increases IQ mapping and systemcomplexity. It also requires costly devices, more storage and larger FPGA processingcapacity [20]. On top of that, it limits the benefits of sharing the equipment in C-RAN, asL1 processing needs to be assigned to one RRH. Several patents have been filed for thistype of compression schemes.
In [88] Grieger et al. present design criteria for frequency domain compressionalgorithms for LTE-A systems which are then evaluated in large scale urban filed trials.Performance of JD under limited backhaul rates was observed. The authors provedthat a Gaussian compression codebook achieves good performance for the compressionof OFDM signals. The performance can be improved using Frequency Domain AGC(FDAGC) or decorrelation of antenna signals. However, field tests showed very limitedgains for the observed setups.
Samardzija et al. from Bell Laboratories propose an algorithm [89] which reducestransmission data rates. It removes redundancies in the spectral domain, performs blockscaling, and uses a non-uniform quantizer. It keeps EVM below 8% (3GPP requirementfor 64 QAM, as stated in [81]) for 17% of relative transmission data rate (compressionratio defined as transmission rate achieved after compression to the original one). Thealgorithm presented by Guo et al. [90], which authors are also associated with Alcatel-Lucent Bell Labs removes redundancies in spectral domain, preforms block scaling, anduses non-uniform quantizer. EVM stays within 3GPP requirements in simulations for30% compression ratio. TD-LTE demo test results showed no performance loss for 50%compression ratio.
Alcatel-Lucent Bell Labs’ compression algorithm reduces LTE traffic carried overCPRI interface from 18 Gbps to 8 Gbps [22], achieving a 44% compression ratio.
The solution discussed in [91] adapts to the dynamic range of the signal, removesfrequency redundancy and performs IQ compression creating 10.5 effective bits out of 12

2.5. RRH development 31
bits of data. This method allows 50% to 25% of compression ratio introducing 0.5% 1 to8% of EVM and latency below 1µs for LTE signal.
Lorca et al. from Telefonica I + D in [92] propose a lossless compression techniquewhere actual compression ratios depend upon the network load. For downlink direction,the algorithm removes redundancies in the frequency domain. Secondly, the amount ofcontrol data is reduced to minimum sending only the necessary information to reconstructcontrol signals at RRH. Moreover, a special constellation coding is used to reduce numberof bits needed to represent constellation symbols for QPSK, 16QAM and 64QAM mod-ulations. For uplink direction user detection is used to transmit only occupied carriers.Compression ratio of 33% is achieved at full cell load. Compression ratio up to 6.6% areachieved for 20% cell load.
Park et al. [93] propose a robust, distributed compression scheme applicable forUL transmission, which they combine with an efficient base station selection algorithm.Their current work focuses on implementing layered compression strategy as well as jointdecompression and decoding. Results in terms of compression ratio and EVM are notavailable.
Table 2.4 summarizes and compares various compression methods discussed in thissection. Compression of 33% is achieved by all the algorithms for which the ratio wasavailable. The best result, where the algorithm is known, is achieved by [89] and by [92]under small network load.
To conclude, in order not to lose the cost benefit of BBU Pooling for renting a transportnetwork, mobile network operator needs to either own substantial amount of fiber oruse an IQ compression scheme. Moreover, the cost of the optical high speed modulemust stay comparable to traditional SDH transport equipment in order to make C-RANeconomically attractive.
2.5 RRH development
This section presents requirements and solutions for RRH that are compatible with C-RAN.The existing RRHs are expected to work in a fully centralized C-RAN architecture in aplug-and-play manner. In case of partially centralized C-RAN architecture L1 needs tobe incorporated in RRH.
The biggest difference between RRHs deployed for C-RAN compared to previoussolutions is that in C-RAN transmission the signal occurs over many kilometers, while inthe latter architecture this distance is shorter, typically up to few kilometers. Thereforethe additional delay caused by increased transmission distance needs to be monitored.
In addition, the higher bit rates need to be supported. In order to transport 10 GbpsCPRI rate, the maximum CPRI line bit rate option 8, i.e., 10.1376 Gbps needs to bedeployed, which is supported so far by standard CPRI v 6.0 [33]. Additional upgrade ofthe standard is needed to accommodate more traffic, at least 16 Gbps to fully serve a 3
1equivalent to test equipment

32 Chapter 2. C-RAN overview
Table 2.4: Comparison of IQ compression methods. Compression ratio 33% corresponds to3:1
Method Techniques applied Compressionratio
EVM
[22] Not available 44% Notavailable
[89] removing redundancies in spectraldomain
28% 3%
preforming block scaling 23% 4%usage of non-uniform quantizer 17% 8%
[90] removing redundancies in spectraldomain
52% <1.4%
preforming block scaling 39% <1.5%
usage of non-uniform quantizer 30% <2.5%
[91] adaption of dynamic range of thesignal
50% 0.5%
removal of frequency redundancy 33% 3%IQ compression 25% 8%
[92] removal of frequency redundancyoptimized control information trans-missionIQ compressionuser detection
33% (100%cell load)7% (20%cell load)
Notavail-able
[93] self-defined robust method Not Notperformed jointly with base stationselection algorithm
available available

2.6. Synchronized BBU Implementation 33
sector 20 MHz LTE macro cell with 4x2 MIMO [22], see Table 2.2. Existing standards -CPRI and OBSAI can support connections between the BBU Pool and RRHs in C-RAN.Moreover, NGMN in [94] envisions ORI as a future candidate protocol. However, asthe nature of the interface between RRH and BBU is changing with an introduction ofC-RAN, the existing protocols may need to be redefined in order to be optimized for highvolume transmission over long distances.
Alcatel-Lucent is offering a lightRadio solution for C-RAN [22]. It uses a multiband,multistandard active antenna array, with MIMO and passive antenna array support. Alcatel-Lucent is working towards two multiband radio heads (one for high and one for low bands).Built-in digital modules are used for baseband processing. For C-RAN L1, L2 and L3 areseparated from radio functions.
In 2012, Ericsson announced the first CPRI over microwave connection implemen-tation [95], which is interesting for operators considering the deployment of a partiallycentralized C-RAN architecture.
2.6 Synchronized BBU Implementation
This section provides considerations on possible BBU implementation. The advantagesand disadvantages of different processors types that can be used in C-RAN are discussed.
The interconnection between BBUs is required to work with low latency, high speed,high reliability and real time transmission of 10 Gbps. Furthermore, it needs to supportCoMP, dynamic carrier scheduling, 1+1 failure protection and offer high scalability.Dynamic carrier scheduling implemented within the BBU Pool enhances redundancy ofBBU and increases reliability.
The BBU Pool needs to support 100 base stations for a medium sized urban network(coverage 5x5 km), 1000 base stations for 15x15 km [20]. In addition, it is beneficialwhen BBU has the intelligence to support additional services like Content DistributionNetwork (CDN), Distributed Service Network (DSN) and Deep Packet Inspection (DPI)[25].
Virtualization of base station resources is needed to hide the physical characteristicsof the BBU Pool and enable dynamic resource allocation.
There are also challenges for real time virtualized base station in centralized BBUPool, like high performance low-power signal processing, real time signal processing,BBU interconnection as well as between chips in a BBU, BBUs in a physical rack andbetween racks.
Optimal pooling of BBU resources in needed in C-RAN. In [42] Bhaumik et al.propose resource pooling scheme to minimize the number of required compute resources.The resource pooling time scale is of the order of several minutes, however, it can beexpected it can be done with finer granularity further optimizing the results.

34 Chapter 2. C-RAN overview
2.6.1 Current multi-standard open platform base station solutionsOperators need to support multiple standards, therefore multi-mode base stations are anatural choice. They can be deployed using either pluggable or software reconfigurableprocessing boards for different standards [20].
By separating the hardware and software, using e.g., SDR technology, differentwireless standards and various services can be introduced smoothly. Currently basestations are built on proprietary platforms (vertical solution). C-RAN is intended to bebuild on open platforms in order to relief mobile operators from managing multiple, oftennon-compatible platforms. C-RAN provides also higher flexibility in network upgradesand fosters the creation of innovative applications and services.
2.6.2 ProcessorsNowadays, Field-Programmable Gate Arrays (FPGAs) and embedded Digital Signal Pro-cessor (DSP) are used for wireless systems. However, the improvement in the processingpower of General Purpose Processor (GPP) used in IT is giving the possibility to bring ITand telecom worlds together and use flexible GPP-based signal processors.
DSPs are developed to be specially optimized for real-time signal processing. Theyare powerful and use multicore (3-6) technology with improved processing capacity.What is important for C-RAN, a real time OS running on DSP facilitates virtualization ofprocessing resources in a real time manner. However, there is no guarantee of backwardscompatibility between solutions from different, or even from the same manufacturer, asthey are built on generally proprietary platforms.
Texas Instruments [26] favors the usage of specialized wireless System on a Chip(SoC), providing arguments that SoC consumes one-tenth of the power consumed by atypical server chip, and has wireless accelerators and signal processing specialization.Considerations about power consumption of signal processors are essential to achievereduction in power consumption for C-RAN architecture compared to the traditionalRAN. In addition, for the same processing power, a DSP solution will also have a lowerprice compared to GPP. In [96] Wei et al. present an implementation of SDR system onan ARM Cortex-A9 processor that meets the real-time requirements of communicationsystem. As SDR technology further enables to benefit from C-RAN this is an importantproof of concept.
GPPs are getting more and more popular for wireless signal processing applications.The usage of GPP is facilitated by muli-core processing, single-instruction multiple data,low latency off-chip system memory and large on-chip caches. They also ensure backwardcompatibility, which makes it possible to smoothly upgrade the BBU. Multiple OS’s withreal-time capability allow virtualization of base station signal processing.
China Mobile Research Institute proved that commercial IT servers are capable ofperforming signal processing in a timely manner. Intel is providing the processors forboth C-RAN and traditional RAN [25]. More on Intel GPP solutions for DSP can befound in [97]. In [98], Kai et al. present a prototype of a TD-LTE eNB using a GPP.

2.7. Virtualization 35
It did not meet real-time requirements of LTE system, which is of great concern whenusing general processors for telecommunication applications. It used 6.587 ms for ULprocessing, with turbo decoding and FFT taking most of it and 1.225 ms for downlink(DL) processing, with IFFT and turbo coding being again the most time consuming.However, this system was based on a single core, and multi-core implementation with 4cores should make the latency fall within the required limits. Another approach to reachthe requirements is to optimize the turbo decoder as described in [99], where Zhang et al.prove that using multiple threads and a smart implementation, 3GPP requirements can bemet. De-Rate Matching and demodulation have been optimized for GPP used for LTEin [100]. In [101] Kaitz et al. propose to introduce a dedicated co-processor optimizedfor wireless and responsible for critical and computation intensive tasks. This optimizespower consumption at the cost of decreased flexibility. They have considered differentCPU partitioning approaches for LTE-A case.
The issue of real-time timing control and synchronization for SDR has been addressedin [102]. A real-time and high precision clock source is designed on a GPP-based SDRplatforms and users are synchronized utilizing Round-Trip Delay (RTD) algorithm. Themechanism is experimentally validated.
Table 2.5 summarizes the characteristics of DSP and GPP.
Table 2.5: DSP and GPP processors
DSP GPPFlexibility dedicated solution general purposeVendor compatibility vendor specific,
proprietaryhigher compatibil-ity between ven-dors
Backward compatibility limited assuredPower consumption lower higherReal-time processing optimized,
achievedonly possible withhigh power hard-ware
Virtualization of BBU possible possible
2.7 Virtualization
In order to implement Centralized RAN, BBU hardware needs to be co-located. However,in order to deploy RAN in the cloud - Cloud RAN - virtualization is needed. Althoughvirtualization is not the focus point of this thesis, it is briefly presented in this section forthe completeness of the C-RAN introduction, as it is an important foundation of C-RAN.

36 Chapter 2. C-RAN overview
Virtualization enables decoupling network functions, like baseband processing, fromnetwork hardware in order to reduce the network cost and to enable flexible deploymentsof services [103]. Legacy hardware can be used for new applications. Moreover, utilizationof the hardware can be increased. NFV and SDN are important concepts that help toimplement virtualization of baseband resources in C-RAN. The common goals of NFVand SDN are to allow network services to be automatically deployed and programmed.
NFV is an architecture framework currently under standardization by ETSI. Theframework relies on three different levels: Network Functions Virtualization Infrastructure,Virtual Network Functions (applications) and NFV Orchestrator (control and managementfunctions).
SDN [104] is a concept related to NFV. SDN decouples data from the control plane.In that way the control plane can be directly programmable while the underlying physicalinfrastructure can be abstracted from applications and services. In can bring greaterflexibility, fine-grained control, and ease-of-use to networking. OpenFlow [105] is aprotocol commonly used to organize communications between between network devices(e.g. switches) and the controller, on the so-called southbound interface. Northboundinterface refers to the communication between the controller and the network applications.OpenDaylight [106] is an open source project whose goal is to accelerate the adoption ofSDN.
SDN is not required to implement NFV and vice-versa. NFV alone allows deployinginfrastructure services on open hardware. However, NFV is often combined with SDN, asSDN is beneficial to the implementation and management of an NFV infrastructure [103].OpenNFV [107] is an exemplary NFV platform managing various components. Thisplatform integrates orchestration and management functions that run on top of VirtualNetwork Functions. Openstack [108] controls Compute Virtualization Control, StorageVirtualization Control and Network Virtualization Control. OpenDaylight (an SDN tool)is used for Network Virtualization Control, however, other mechanisms could be usedinstead of SDN for the networking part.
Altiostar is a sample company providing virtualized RAN based on an open sourceNFV platform [83]. Moreover, Wind River [109] offers an NFV software platform.
Nikaein et al. in [110] presents a virtualized RAN implemented with OpenStack andHeat stack. Heat implements an orchestration engine to manage multiple composite cloudapplications: OpenAirInterface [111] eNB, Home Subscriber Server (HSS) and EvolvedPacket Core (EPC).
2.8 Likely deployment Scenarios
C-RAN is intended to be an alternative delivery of cellular standards, like UMTS, LTE,LTE-A and beyond. It is a RAN deployment applicable to most typical scenarios, likemacro-, micro- and picocell, as well as for indoor coverage. This section elaborates onlikely deployment scenarios for C-RAN including green field deployments, i.e., estab-

2.8. Likely deployment Scenarios 37
lishing the network from scratch, as well as deployment of additional cells for boostingthe capacity of an existing network. Moreover, different stages of C-RAN deployment toleverage its full potential are listed.
It is advised to deploy C-RAN in metropolitan area to benefit from statistical multi-plexing gain, as users are moving through the day, but still remain within the maximumdistance (resulting from propagation and processing delay, up to 40 km) between RRHand BBU. However, a metropolitan area might be served by a few BBU Pools.
2.8.1 Green field deploymentIn case of green field deployment, RRH and BBU Pool placement need to be arrangedaccording to network planning. Physical medium and transport solution can be designedaccording to C-RAN specific requirements.
In author’s previous work [12] the most beneficial C-RAN deployments are evaluated.For the analyzed traffic model, to maximize statistical multiplexing gain it is advisable toserve 20-30% of office base stations and 70-80% of residential base stations in one BBUPool. Both analytical and simulation - based approach confirm the results.
The analysis on the cost of deployments from the same work shows that in order tominimize TCO a ratio of cost of one BBU to the cost of one kilometer of fiber deploymentshould be above 3. The ratio is smaller looking at smaller (100 km2) areas compared tolarger (400 km2) areas. Therefore, C-RAN is more promising for small scale deploymentsfor urban areas with densely placed cells.
2.8.2 C-RAN for capacity boostingSmall cells are a likely scenario for RRHs and C-RAN. Release 12 of mobile standardsaddresses enhancement of small cell deployment [112], as adding new cells is the mostpromising way to increase network capacity. In [70] authors envision that small cellsenhancements will be deployed with and without macro coverage, sparsely or densely,outdoor and indoor, being connected through ideal and non-ideal backhaul. Frequencieswill be separately assigned to macro- and small cells. C-RAN fits into these targetscenarios. It also fulfills the requirements for small cells enhancements, supportingboth operator and user deployed cells, SON mechanisms as well as co-existence andnetworking between different RATs.
In mobile networks within an underlying macro cell many small cells can be deployedto boosts network capacity and quality in homes, offices and public spaces. When a userwill move out of small cell coverage, he will change the cell to the macro cell. In order tosupport such an architecture, a coordination is required between macro- and small cells.The deployment of small cells with C-RAN architecture may reduce signaling resourcesas they are supported by one BBU pool, not many base stations. To deploy C-RAN forcapacity improvement, some of the existing BBUs can be moved to the BBU Pool. RRHscan remain in the same location, and additional ones can be added. Various possibilities

38 Chapter 2. C-RAN overview
of capacity improvement deployment scenarios are listed below [68]. The combination ofmentioned solutions is also possible.
RRH
RRH
RRH
RRH
RRH
RRH
RRH
RRH
RRH RRH
RRH
RRH
RRH
RRH
RRHRRH
RRH
RRH
RRH
RRH
RRH
RRH
RRHL1
RRHL1
RRHL1
RRH
RRH
RRH RRH
RRH
RRHRRH
RRHRRH
RRHRRHSmall cell
HetNet. Macro cell with small cells
deployed
f1f2
RRH
RRHRRH
RRH
L1L2L3
O&M
L2L3
O&M
RRHL1
RRHL1
RRHL1
RRHL1
RRHL1
RRHL1
RRHL1
RRHL1
RRHL1
RRHL1
RRHL1
RRHL1
RRHL1
RRHL1
RRHL1
RRHL1
RRHL1
RRHL1
BBU Pool 2
BBU Pool 1
Operator 1, RANaaS
Operator 2, RANaaS
Operator 3
Colored fiber, e.g. xWDM
Non-colored optics
Microwave
CPRI/OBSAI/ORI
λ1, λ2, ... , λn
Access ring
OTN/Carrier Ethernet
Cell split, small cell deployment with L1 integrated into RRH
Overlay
Railway/Highway
Super hot spot
RRH/Repeater
Mux/Demux
Mux/Demux
RRH/Repeater
RRH/Repeater
RRH/Repeater
WDM-UniPON
RRH
...
Figure 2.11: C-RAN deployment scenarios.
a) HetNets. Existing BBUs of macro Base Stations can be replaced by BBU Pool andadditional RRHs can be deployed to form small cells.
b) Cell split. Existing macro cells can be split into smaller ones increasing the systemcapacity. Interference management techniques are needed as all the cells willoperate at the same frequency. As explained in Section 2.2.3, C-RAN can enhancecooperative techniques like CoMP and eICIC. This scenario can also be used toprovide indoor coverage by deploying RRHs on each floor of the building or groupof offices offering high capacity. However, in this scenario Wi-Fi can be a cheapersolution, if users will have Wi-Fi connection in their devices switched on, enablingoffload from cellular network to Wi-Fi.
c) Overlay. Additional frequency band or a new cellular standard can be introduced toboost system capacity. In Figure 2.11 one RRH provides coverage in frequency f1.

2.9. Ongoing work 39
Additional RRHs operating on frequency f2 provide overlay coverage. Efficientinterference management techniques like CoMP and eICIC are needed in thisscenario, as many RRH operate at the same frequency f2.
d) Super hot spots, e.g., stadium, transportation hub. It is a scenario where many usersare present in one location. Small cells are needed to assure the capacity, as wellas provide the coverage in complex scenery, e.g., with balconies, ramps, etc. Thedensity of users is high, therefore it is crucial to efficiently support interferencemanagement schemes like CoMP and eICIC.
e) Railway/highway. Users are moving with a fast speed in this scenario, thereforeBBU Pool shall handle frequent handovers faster than traditional RAN.
Figure 2.11 summarizes C-RAN transport solutions and physical layer architecturediscussed in this chapter. Moreover, a possibility of sharing BBU Pool and rent RANaaSis emphasized. For a particular network operator the choice of physical medium andtransport network depends on whether an existing infrastructure is already deployed.
2.8.3 Different stages of deploymentThe path towards complete deployment of C-RAN can be paved through following stages[113].
1. Centralized RAN, where baseband units are deployed centrally supporting manyRRHs. However, resources are not pooled, nor virtualized.
2. Cloud RAN
- Phase 1, where baseband resources are pooled. Baseband processing is done usingspecialized baseband chip - DSPs,
- Phase 2, where resources are virtualized, using GPP, thereby leveraging full benefitsof C-RAN. Sometimes this deployment is referred to as V-RAN standing forVirtualized-RAN.
2.9 Ongoing work
This section introduces projects focused on C-RAN definition and development. Moreover,the survey on field trials and developed prototypes as well as the announcement of firstcommercial deployment is presented.

40 Chapter 2. C-RAN overview
2.9.1 Joint effortBoth academic and industrial communities are focusing their attention on C-RAN in anumber of projects. China Mobile has invited industrial partners to sign Memorandum ofUnderstanding (MoU) on C-RAN. The companies mentioned below have already signeda MoU with China Mobile Research Institute, and therefore engaged to work on novelC-RAN architectures: ZTE, IBM, Huawei, Intel, Orange, Chuanhua Telecom, Alcatel-Lucent, Datang Mobile, Ericsson, Nokia Siemens Networks and recently (February 2013)ASOCS.
The Next Generation Mobile Networks (NGMN) alliance has proposed requirementsand solutions for a new RAN implementation in the project "Project Centralized process-ing, Collaborative Radio, Real-Time Computing, Clean RAN System (P-CRAN)" [114].One of the project outcomes is a description of use cases for C-RAN and suggestions forsolutions on building and implementing C-RAN [68].
OpenAirInterface [111] is a software alliance working towards an open source softwarerunning on general purpose processors. Currently (February 2016) is offers a subset ofRelease 10 LTE for UE, eNB, Mobility Management Entity (MME), HSS, ServingSAE Gateway (SAE-GW) and Packet Data Network Gateway (PDN-GW) on standardLinux-based computing equipment.
Three projects sponsored by the Seventh Framework Programme (FP7) for Researchof the European Commission have been running since November 2012. The "MobileCloud Networking" (MCN) project [115] evaluated and seized the opportunities that cloudcomputing can bring to mobile networks. It was the biggest out of FP7 projects in terms offinancial resources. 19 partners worked on decentralized cloud computing infrastructurethat provided an end-to-end mobile network architecture from the air interface to theservice platforms, using cloud computing paradigm for an on-demand and elastic service.The "High capacity network Architecture with Remote Radio Heads & Parasitic antennaarrays" (HARP) project [116] focused on demonstrating a novel C-RAN architecturebased on RRHs and electronically steerable passive antenna radiators (ESPARs), whichprovide multi-antenna-like functionality with a single RF chain only. The "Interworkingand JOINt Design of an Open Access and Backhaul Network Architecture for SmallCells based on Cloud Networks" (IJOIN) project [117] introduced the novel conceptof RAN-as-a-Service (RANaaS) [118], where RAN is flexibly realized on a centralizedopen IT platform based on a cloud infrastructure. It aimed at integrating small cells,heterogeneous backhaul and centralized processing. The main scope of the CROWDproject [119] were very dense heterogeneous wireless access networks and integratedwireless-wired backhaul networks. The focus was put on SDN, which is relevant forC-RAN. iCirrus [120], an EU Horizon 2020 project, aims to enable a 5G network basedon Ethernet transport and switching for fronthaul, backhaul and midhaul (see Section4.10). ERAN is a nationally founded Danish project that brings together SDN and Ethernettechnologies, including TSN features, to provide flexibility and cost reductions in thefronthaul [121]. Table 2.6 summarizes research directions relevant for C-RAN and in

2.9. Ongoing work 41
which works they have been addressed up to beginning of 2014.
2.9.2 C-RAN prototypeChina Mobile, together with its industry partners - IBM, ZTE, Huawei, Intel, DatangChina Mobile, France Telecom Beijing Research Center, Beijing University of Post andTelecom and China Science Institute developed GPP based C-RAN prototype supportingGSM, TD-SCDMA and TD-LTE. The prototype is running on Intel processor-basedservers [25]. A commercial IT server processes IQ samples in real time. PCI Express,a high-speed serial computer expansion bus is connected to CPRI/Ir interface converter,which carries the signal towards RRHs. L1, L2 and L3 of GSM and TD-SCDMA as wellas L1 TD-LTE are supported. Future plans cover implementing L2 and L3 of TD-LTEand LTE-A features like CoMP [20].
Ericsson Beijing proved their concept of connecting LTE RRH and BBU using WDM-PON and the microwave E-band link, as described in [71]. This proves the novel transportnetwork concept, that can be used for C-RAN. However, the test was done for only 2.5Gbps connections, while 10 Gbps is desired for C-RAN macro base stations. Moreover,at Ericsson Beijing setup, the joint UL COMP was evaluated in [56]. NEC built OFDMA-based (here WiMAX) C-RAN test-bed with a reconfigurable fronthaul [47].
2.9.3 China Mobile field trialChina Mobile is running C-RAN trials in commercial networks in several cities in Chinasince 2010 [20].
In the GSM trial of C-RAN in Changsha 18 RRHs were connected in daisy-chainwith one pair of fiber [20], [65]. By using multi-RRH in one cell, improvement in radioperformance and user experience was measured. Reduced inter-site handover delay wasachieved, as handover was handled within one BBU Pool.
The trial in Zhuhai City, done on a TD-SCDMA network showed advantages in termsof cost, flexibility and energy saving over a traditional RAN. Dynamic carrier allocationadapted to dynamic load on the network. No change of Key Performance Indicators(KPI) for radio performance was observed. CAPEX and OPEX were reduced by 53%and 30%, respectively for new cell sites compared to traditional RAN. Reduced A/Cconsumption was observed for C-RAN compared to RAN with RRH. A decrease in basestation construction and maintenance cost were also observed. Moreover, base stationutilization was improved leading to reduced power consumption [20].
In the field trial in Guangzhou the dual-mode BBU-RRH supported 3G/4G standards.On 12 sites 36 LTE 20 MHz carriers were deployed [49].
2.9.4 First commercial deploymentsA number of operators: China Mobile, At&T, Orange, SK Telecom, SoftBank Corp [63]and NTT Docomo [144] are (in 2015) at various stages of C-RAN deployment whit Asia

42 Chapter 2. C-RAN overview
Table 2.6: Research directions for C-RAN
Researchdirection
Summary References
Quantifyingmultiplexinggains, energyand costsavings
1) Dynamic changes of RRH-BBUPool assignment as well pooling the re-sources within a BBU Pool helps max-imizing multiplexing gains in C-RAN.2) Work on evaluating energy and costsavings in C-RAN is ongoing, where amultiplexing gain is one of the factors.
1) [26], [40], [43], [11],[12], [42], [41], [47], [53],[66]; 2) [20], [24], [48],[49], [50]
Quantifyingan increase ofthroughput
It has been analyzed to what extend thecooperative techniques such as ICIC,CoMP and Massive MIMO can be en-hanced in C-RAN.
[19], [20], [48], [54], [53],[55], [56], [57], [58], [59]
Wireless fron-thaul for C-RAN
Although primary physical medium forC-RAN fronthaul is fiber, there areefforts to make transmission possiblethrough microwave or even, on shortdistances through Wi-Fi.
[67], [71], [95]
Optical fron-thaul for C-RAN
R&D efforts focus on evaluation andoptimization of optical transmission em-ploying WDM, OTN, PON and Ether-net.
[20], [22], [23], [65], [71],[73], [74], [77], [78], [85],[86]
IQ compres-sion
In order to reduce the need of a highbandwidth on the fronthaul links, var-ious compression schemes were pro-posed utilizing signal properties as wellas varying network load.
[20], [22], [88], [89], [90],[91], [92], [93]
Movingtowardssoftware -virtualizationsolutions
1) Various works on network, resourceand hardware virtualization in wire-less communication is relevant forBBU Pool virtualization in C-RAN. Bymeans of 2) NFV and 3) SDN benefitscan be further leveraged.
1) [20], [21], [25], [122],[123], [124], [125], [126],[127], [128], [129], [130],[131], [132], [133], [134];2) [135], [136], [137],[138]; 3) [139], [140],[141], [142], [119], [143]
Deploymentscenarios
Literature summarizes considerationson deployment scenarios covering theoptimal architectures for the given fiberresources as well as possibilities of de-ployments to boost the capacity of thenetwork. Moreover, an analysis hasbeen done on how to maximize the mul-tiplexing gains by grouping cells with agiven traffic profiles in a BBU Pool.
[22], [30], [12], [68]

2.10. Future directions 43
leading the effort. More operators, like Vodafone Hutchison Australia are planning thedeployments in 2018-2020 time frame.
2.10 Future directions
As it follows from the previous sections, CPRI and OBSAI are simple protocols thatserved well for short range separation between RRH and BBU. Typically the distancebetween RRH and BBU would be from the basement to the rooftop and a dedicatedpoint to point fiber connection could be easily established for carrying IQ data. With theintroduction of C-RAN, in order to benefit from the multiplexing gain coming from users’daily mobility between office and residential sites it is expected that the BBU pool wouldoften span the metropolitan area serving tens of cells. It will thereby require 100s of Gbpsconnections, which are often not available. The industry and academia are working ondefining a new functional split between RRH and BBU to address this issue. Moreover,an optimized transport is needed to carry the data for the new functional split.
Sections below provide more details about those directions. In the meanwhile the CPRIconsortium works on newer editions of the standard, with the latest one (6.1) supportingup to 12 Gbps [145]. Moreover, observations on centralization and decentralization trendsin base station architecture are provided.
2.10.1 Next Generation Fronthaul Interface (NGFI), functional splitWith the current functional split, all L1-L3 baseband processing is executed by theBBU making an RRH a relatively simple and cheap device. However, the followingshortcomings of CPRI motivate work on changing the functional split giving up some ofthe C-RAN advantages: limiting multiplexing gain of BBU resources, limited enhancingof collaborative techniques.
- Constant bit rate, independent on user traffic. CPRI line bit rate is constant,independent on whether there is any user activity within a cell. A solution scalingthe bit rate depending on user activity is desired.
- One-to-one mapping RRH-BBU. With CPRI each RRH is assigned to one BBU.For load balancing it is desired to be able to move RRH affiliation between pools.
- FH bandwidth scales with cell configuration. Current CPRI line rate depend oncell configuration: carrier bandwidth, number of sectors and number of antennas.Already for LTE-A up to 100 MHz can be used, and for Massive MIMO 100+antennas can be expected. That yields 100+Gbps of data per cell, which is notfeasible. Solution depending on user activity, and operating on lower bit ratesis desired. Compression techniques presented in Section 2.4.4 received a lot ofattention, however, none of the solutions are economically viable or flexible to meet5G requirements. Therefore more disruptive solutions are needed.

44 Chapter 2. C-RAN overview
Before 2013, to address the challenge of optimizing the fronthaul bit rate and flexibilityvarious compression techniques were considered. As more disruptive methods wereneeded to achieve higher data rate reduction, nowadays (from 2013 onwards) a new splitbetween RRH and BBU functionality is under extensive analysis by Alcatel Lucent BellLabs [146], [147], NGMN [68], Small Cell Forum [148], [149] and many others. Anew working group – NGFI – is under preparation (2015) under the sponsorship of anIEEE-SA Standards Sponsor with founding members of AT&T, Huawei, CMCC andBroadcom (more to join) [46]. Its goal is to encourage discussion on optimal functionalsplits between the pool and the cell site to address the above mentioned shortcomings oftraditional fronthaul. The considered functional splits are marked with arrows in Figure2.12. Functions to the left of each arrow will be executed centrally, while functions tothe right of the arrow will be executed by the device at the cell site. Split can be doneper cell [148], or even per bearer [150]. It may also be beneficial to implement differentsplit for DL and UL. Most likely a few functional splits will be implemented per BBUpool, as one solution does not fit all the deployment scenarios. That requires a varietyof devices at the cell site that will have the remaining functions implemented. With thecurrent functional split (BB-RF), RRH could be standard-agnostic, especially when highfrequency range was supported. Moving parts of L1 (and higher layers) to the devices atthe cell site makes them dependent on mobile network standards.
Executed centrally - Executed at the cell site
Co
ntr
ol-
RR
C
FEC
QA
M +
A
nte
nn
a m
app
ing
Res
ou
rce
map
pin
g
IFFT
Enco
din
g
CP
in
...
CFR/
DPD
DAC
ADC
Frequency filter
CP
RI/
OB
SAI/
OR
I SRC
DUC
SRC
DDC
RLC
PD
CP
Ap
plic
aio
ns
Dec
od
ing
QA
M-1
+
An
ten
na
pro
cess
ing
Res
ou
rce
dem
app
ing
FFT
CP
ou
t
FEC
-1
MAC-PHYUE-Cell
Services RLC-MAC
PDCP-RLC BB-RF(BBU-RRH)
MAC
L3 L1L2
MA
C
IQ UL
IQ DL
CP
RI/
OB
SAI/
OR
I
Executed centrally
Executed at the cell site
MA
C
Figure 2.12: Possible functional splits for C-RAN
Various functional splits pose different throughput and delay requirements, as pre-sented in Table 2.7. To benefit the most from centralization, the lowest split is rec-

2.10. Future directions 45
ommended, i.e. the closest to the current BB-RF split. However, in order to save onbandwidth higher splits can be more applicable. User Equipment (UE)-Cell split (sep-arating user and cell specific functionalities) is the lowest one for which data will havea variable bit rate, dependent on user traffic. Moreover, higher splits allow for higherfronthaul latency, e.g., 30 ms for PDCP-RLC split.
Table 2.7: Requirements for different functional splits [148] for the LTE protocol stack
Split Latency DL bandwidth UL bandwidthPDCP-RLC 30 ms 151 Mbps 48 MbpsMAC 6 ms 151 Mbps 49 MbpsMAC-PHY 2 ms 152 Mbps 49 MbpsUE-Cell 250 µs 1075 Mbps 922 MbpsBB-RF 250 µs 2457.6 Mbps 2457.6 Mbps
2.10.2 Ethernet-based fronthaulWith the new functional split, variable bit rate data streams on the fronthaul networkare expected. The transport will be packet-based to optimized resource utilization in thenetwork. Existing Ethernet networks can be reused for C-RAN fronthaul to leverageEthernet’s scalability and cost advantages. More on Ethernet-based fronthaul can be foundin Chapter 4.
2.10.3 Centralization and decentralization trendLooking at the base station architecture evolution, trends on centralization and decentral-ization can be observed as presented in Figures 2.13, 2.14. For an UMTS network, anexample of a 3G mobile network, base station (NodeB) is separated from the networkcontroller (Radio Network Controller (RNC)). For an LTE network those functionalitiesare distributed to each cell, and co-located in one logical node - eNodeB - in order tospeed up scheduling and associated processing. As those functions are executed locally ineNodeB it shows an example of decentralization.
The physical architecture of a base station of 2-4G can be either a traditional basestation (BB and RF units co-located), base station with RRH (decentralized) or C-RAN(decentralized looking at separation between RRH and BBU, but centralized BBUs).Towards 5G networks the trend is to move a part of BBU pool functionalities to the cellsite, thereby resulting in the decentralization of a part of the pool. The actual point offunctional split is moving over the years towards finding the optimal one for technologiesand capacities available at given times, for given deployments.

46 Chapter 2. C-RAN overview
eNodeB
NodeB RNC
Mobile core
network3G
Mobile core
network4G
RRHNodeB
eNodeB
Figure 2.13: Decentralization of logical functions
2.11 Summary
This chapter presents a detailed overview of the novel mobile network architecturecalled C-RAN and discusses the advantages and challenges that need to be solved beforeits benefits can be fully exploited. C-RAN has the potential to reduce the networkdeployment and operation cost and, at the same time, improve system, mobility andcoverage performance as well as energy efficiency.
The work towards resolving C-RAN challenges has been presented. Critical aspectssuch as the need for increased capacity in the fronthaul, virtualization techniques for theBBU pool and hardware implementation have been discussed. First prototypes and fieldtrials of networks based on C-RAN have also been presented, together with most likelydeployment scenarios.
While the concept of C-RAN has been clearly defined, more research is needed tofind an optimal architecture that maximizes the benefits behind C-RAN. Mobile networkoperators as well as the telecommunication industry show a very high interest in C-RANdue to the fact that it offers potential cost savings, improved network performance andpossibility to offer IaaS. However, the implementation of C-RAN needs to be justified byparticular network operators taking into account available fronthaul network capacity aswell as cost of virtualization of BBU resources. As the required fronthaul capacity is oneof the main challenges for C-RAN deployments, the work on defining the new functionalsplit is of utter importance.

2.11. Summary 47
BBU
RRH
BBU pool --
RRH++
Mobile core
network2G/3G/4G
Mobile core
network
Mobile core
network5G?
3G/4G
BBU
RRH++
BBU pool
RRH
Mobile core
network4G/5G?
RRH
RRH
a) Traditional Base Station
b) Base Station with RRH
c) C-RAN
d) C-RAN with a new functional split
Figure 2.14: Decentralization, centralization and further decentralization of physical deploy-ments, popular for given generations of mobile networks

48

CHAPTER 3Multiplexing gains in Cloud RAN
Multiplexing gains can be achieved everywhere where resources are shared - aggregatedby an aggregation point - and not occupied 100% of the time. This applies to printersshared by workers in one building, Internet packet-based networks where single lines areaggregated by e.g., a switch or a router as well as in C-RAN where BBUs are aggregatedin a pool or when variable bit rate fronthaul traffic streams are aggregated.
By allowing many users and base stations to share network resources, a multiplexinggain can be achieved, as they will request peak data rates at different times. The multi-plexing gain comes from traffic independence and from 1) burstiness of the traffic, and 2)the tidal effect - daily traffic variations between office and residential cells [20], describedbroader in Section 2.2.1. Given the fact that cells from metropolitan area can be connectedto one BBU pool (maximum distance between RRH and BBU is required to be below 20km) it is realistic to account for office and residential cells to be included. The tidal effectis one of the main motivations for introducing C-RAN [20].
The art of network/BBU dimensioning is to provide a network that is cost-effectivefor the operator and at the same time provides a reasonable QoS for users. As for anyother shared resources, multiplexing enables to serve the same amount of users with lessequipment. Multiplexing gain indicates the savings that come from the less equipmentrequired to serve the same number of users. In this way the cost of deploying BBU poolsand fronthaul links (CAPEX) will be lower. That will lead to energy savings, as fewerBBU units and fronthaul links need to be supplied with electricity (OPEX).
Multiplexing gain, along with enhancing cooperation techniques, co-locating BBUs,using RRHs as well as enabling easier deployment and maintenance are the major ad-vantages of C-RAN. However, operators need to evaluate those advantages against thecosts of introducing and maintaining C-RAN. This chapter presents several studies onquantifying the multiplexing gain that can serve as an input to the overall equation eval-uating benefits and costs of C-RAN. First, multiplexing gains for different functionalsplits are presented in Section 3.2.3. Second, the methodology used to evaluate multi-plexing gains is presented in Section 3.1. Section 3.2 presents two initial evaluationsof statistical multiplexing gain of BBUs in C-RAN using 1) simple calculations, basedon daily traffic load distribution, and 2) a simple network model, with real applicationdefinitions, however, without protocol processing. Section 3.3 presents results that includeprotocol processing and explore the tidal effect. Section 3.4 present results exploringdifferent application mixes and presents additional conclusions on the impact of networkdimensioning on users’ QoS. Section 3.5 provides a discussion on the results, giving a
49

50 Chapter 3. Multiplexing gains in Cloud RAN
comprehensive analysis of the results obtained in various projects with different modelsused and exposing traffic burstiness and tidal effect. Section 3.7 summarizes this chapter.
A part of this section, Sections 3.2.3 - 3.1 and 3.4 were previously published in[13]. Section 3.2.2 was previously published in [11], while Section 3.3 was previouslypublished in [12]. All of them are tailored and updated to fit this chapter.
3.1 Methodology
This chapter addresses the topic of multiplexing opportunities that are possible in C-RANinside a BBU pool and on a fronthaul network. The conclusions are drawn based onthe observation of the traffic aggregation properties in the simulated models and are anapproximation of actual multiplexing gains on BBUs and fronthaul. This section aims at:1) defining terms: multiplexing gain and pooling gain, 2) detailing elements of the LTEprotocol stack and their impact on traffic shape, 3) explaining the relationship betweenthe traffic aggregation properties and the gain in power consumption, processing resourceand transport.
3.1.1 DefinitionsThis section defines Multiplexing gain (MG) and Pooling gain (PG), both in terms ofprocessing resources and power.
MG - ratio between the sum of single resources and aggregated resources, showinghow many times fewer resources are needed to satisfy users’ needs when they are aggre-gated. Equation 3.1 shows an example for fronthaul resources, e.g. throughput. Linkresources specify sufficient bandwidth for a given deployment. They can be defined inseveral ways, as providing peak throughput requested by users is costly: 1) the 95th per-centile of requested throughput (used in Section 3.4.4), 2) mean plus standard deviation ofrequested resources (used in the teletraffic approach in [13]), 3) peak requested throughputaveraged over given time (used in Sections 3.3, 3.2 and 3.4.2), and 4) link data rate forwhich the application layer delay is acceptable (used in Section 3.4.3). MG can refer toany resources, however, in the thesis it refers to savings on the transport resources. Theyare possible when several links are aggregated.
MG =
cells∑SingleCellLinkResources
AggregatedLinkResources(3.1)
PG - savings on BBUs comparing C-RAN with RAN (base station architecture withor without RRH, but not centralized). We can distinguish pooling gains in terms ofprocessing, computational resources – PGprocessing and in terms of power savings –PGpower. Definition of PGprocessing is similar as for multiplexing gain but instead ofLink Resources, BBU resources are considered, as presented in Equation 3.2. PGpower
is defined in 3.3 in terms of power consumed by both architectures.
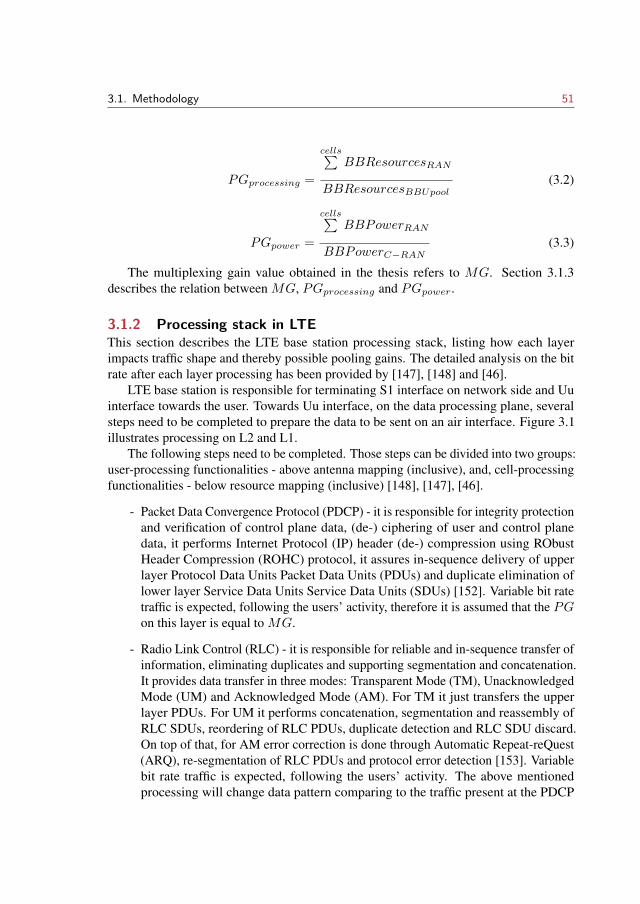
3.1. Methodology 51
PGprocessing =
cells∑BBResourcesRAN
BBResourcesBBUpool(3.2)
PGpower =
cells∑BBPowerRAN
BBPowerC−RAN(3.3)
The multiplexing gain value obtained in the thesis refers to MG. Section 3.1.3describes the relation between MG, PGprocessing and PGpower.
3.1.2 Processing stack in LTEThis section describes the LTE base station processing stack, listing how each layerimpacts traffic shape and thereby possible pooling gains. The detailed analysis on the bitrate after each layer processing has been provided by [147], [148] and [46].
LTE base station is responsible for terminating S1 interface on network side and Uuinterface towards the user. Towards Uu interface, on the data processing plane, severalsteps need to be completed to prepare the data to be sent on an air interface. Figure 3.1illustrates processing on L2 and L1.
The following steps need to be completed. Those steps can be divided into two groups:user-processing functionalities - above antenna mapping (inclusive), and, cell-processingfunctionalities - below resource mapping (inclusive) [148], [147], [46].
- Packet Data Convergence Protocol (PDCP) - it is responsible for integrity protectionand verification of control plane data, (de-) ciphering of user and control planedata, it performs Internet Protocol (IP) header (de-) compression using RObustHeader Compression (ROHC) protocol, it assures in-sequence delivery of upperlayer Protocol Data Units Packet Data Units (PDUs) and duplicate elimination oflower layer Service Data Units Service Data Units (SDUs) [152]. Variable bit ratetraffic is expected, following the users’ activity, therefore it is assumed that the PGon this layer is equal to MG.
- Radio Link Control (RLC) - it is responsible for reliable and in-sequence transfer ofinformation, eliminating duplicates and supporting segmentation and concatenation.It provides data transfer in three modes: Transparent Mode (TM), UnacknowledgedMode (UM) and Acknowledged Mode (AM). For TM it just transfers the upperlayer PDUs. For UM it performs concatenation, segmentation and reassembly ofRLC SDUs, reordering of RLC PDUs, duplicate detection and RLC SDU discard.On top of that, for AM error correction is done through Automatic Repeat-reQuest(ARQ), re-segmentation of RLC PDUs and protocol error detection [153]. Variablebit rate traffic is expected, following the users’ activity. The above mentionedprocessing will change data pattern comparing to the traffic present at the PDCP

52 Chapter 3. Multiplexing gains in Cloud RAN
Bit-level
processing
MAC
RLC
PDCP
CP
Resource mapping
IFFT
QAMAntenna mapping
Use
r p
roce
ssin
g
Variable
bit rate
Constant
bit rate
PGPDCP
PGRLC
PGMAC
PGBLP
PGQAM
PGRM_IFFT
PGCP
P
H
Y
Ce
ll
pro
ce
ssin
g
Figure 3.1: Layer 2 (green) and Layer 1 (yellow) of user-plane processing in DL in a LTEbase station towards air interface. Possible PGs are indicated. Based on [151], [148], [147],[46].
layer. Still, it is assumed that the PG on this layer is equal to MG due to variablebit rate traffic.
- Media Access Control (MAC) - this layer is responsible for data transfer and radioresource allocation. It maps logical channels and transport channels into whichinformation is organized, as well as multiplexes different logical channels intotransport blocks to be delivered to the physical channel on transport channels, anddemultiplexes information from different logical channels from transport blocksdelivered from the physical layer on transport channels. It reports schedulinginformation, does error correction by Hybrid ARQ (HARQ), performs priorityhandling between UEs and between logical channels of one UE, and it selects thetransport format [154]. Variable bit rate traffic is expected, following the users’activity. Above mentioned processing will change data pattern comparing to thetraffic present at the RLC layer. Still, it is assumed that the PG on this layer isequal to MG due to variable bit rate traffic.

3.1. Methodology 53
- various bit level processing takes place including Cyclic Redundancy Check (CRC)insertion, channel coding, HARQ and scrambling, increasing the traffic volume[151]. Still, a variable bit rate traffic is expected, following the users’ activity.This functionalities can be put under the umbrella of Forward Error Correction(FEC). Above mentioned processing will change data pattern comparing to thetraffic present at the MAC layer. Still, it is assumed that the PG on this layer isequal to MG due to variable bit rate traffic.
- Quadrature Amplitude Modulation (QAM) - downlink data modulation transformsa block of scrambled bits to a corresponding block of complex modulation symbols[151]. A variable bit rate traffic is expected in a form of IQ data, therefore it isassumed that the PG on this layer is equal to MG.
- the antenna mapping processes the modulation symbols corresponding to one ortwo transport blocks and maps the result to different antenna ports [151]. A variablebit rate traffic is expected in a form of IQ data, therefore it is assumed that the PGon this layer is equal to MG.
- the resource-block mapping takes the symbols to be transmitted on each antennaport and maps them to the resource elements of the set of resource blocks assignedby the MAC scheduler for the transmission. In order to generate an OrthogonalFrequency-Division Multiple (OFDM) signal IFFT is performed [151] resulting inconstant bit rate stream of IQ data, therefore it is assumed that the PG on this layeris equal to one.
- cyclic-prefix (CP) insertion - the last part of the OFDM symbol is copied andinserted at the beginning of the OFDM symbol [151]. The data remains constantbit rate, therefore it is assumed that the PG on this layer is equal to one.
For each of these steps computational resources are required. The BBU pool needs tobe dimensioned according to the planned user activity in order to meet strict real-timerequirements of LTE processing. Depending on the functional split, for each of the layers,when it is included in the BBU pool, pooling gain is possible, both in terms of process-ing resources they require and power those resources consume: PGPDCP , PGRLC ,PGMAC , PGBLP , PGQAM , PGRM_IFFT and PGCP . Section 3.1.3 elaborates onsuch gains, splitting functionalities in user-processing and cell-processing. Assumed pool-ing gain on user-processing resources equals toMG while pooling gain on cell-processingresources will be equal to one, as listed in Table 3.1. In fact PGPDCP will be closest toMG as the data is closest to the backhaul data. Processing by lower layers will changetraffic properties, therefore pooling gain can be approximated to MG.
3.1.3 Gains in C-RANFrom Section 3.1.2 it can be seen which functionalities process variable and whichconstant bit rate traffic. This has an impact on whether pooling gains can be obtained.

54 Chapter 3. Multiplexing gains in Cloud RAN
Table 3.1: Assumed pooling gains on different layers of the LTE protocol stack.
PG ValuePGPDCP MGPGRLC MGPGMAC MGPGBLP MGPGQAM MGPGRM_IFFT 1PGCP 1
Subsections below explain sources and nature of gains in processing resources, powerconsumption and transport network resources. The relation between MG, PGprocessing
and PGpower is described.
3.1.3.1 Gains in processing resourcesThose gains are referred to as pooling gains.
The BBU pool needs to be dimensioned according to the planned user activity. Themore traffic is expected, the more computing resources will need to be available (e.g.rented from a cloud computing provider). Modules for control plane BBctrl will need tobe provided, for cell-processing – traffic-independent functionalities BBc, like FFT/IFFT,decoding/encoding as well as for user-processing – traffic dependent resources BBu, likeBit-level processing (BLP). Equation 3.2 can be further expanded into equation 3.4 byinserting these components. Control resources, if dimensioned precisely, will be similar inRAN and C-RAN. In fact, in case of C-RAN, more control information may be needed tocoordinate cells for e.g. CoMP. Cell-processing resources, also if dimensioned preciselywill be similar in RAN and C-RAN. However, user-processing resources could be reducedby the factor of MG as listed in equation 3.5.

3.1. Methodology 55
PGprocessing =
cells∑BBResourcesRAN
BBResourcesBBUpool=
=
cells∑(BBRANctrl
+BBRANc+BBRANu
)
BBBBUpoolctrl +BBBBUpoolc +BBBBUpoolu
≈ (3.4)
≈
cells∑BBRANctrl
+cells∑
BBRANc+
cells∑BBRANu
cells∑BBRANctrl
+cells∑
BBRANc +
cells∑BBRANu
MG
(3.5)
Therefore it can be seen that multiplexing gain calculated in the PhD project willaffect only the amount of processing resources required for user-processing modules,leaving the fixed part aside. The factor of MG cannot be applied directly, as real lifeimplementation needs to respond in real time to changing traffic, while averaged valueswere evaluated in the project, hence the almost equal to sign between equations 3.4 and3.5. However, referring to the equation 3.2, it is worth noticing that, in practice, BBUswill always be dimensioned with a margin comparing to planned consumption, allowingto accommodate higher traffic peaks if they occur and to account for forecasted overalltraffic growth. When BBUs are aggregated in a pool, such a margin could be shared,allowing additional pooling gain in C-RAN comparing to RAN. Such an additional marginis especially applicable to resources required to support traffic peaks in different cells. Inother words, capacity can be scaled based on average utilization across all cells, ratherthan all cells peak utilization. Moreover, the processing power can be dynamically shiftedto heavily loaded cells as the need arises.
In [41], Werthmann et al. show results on pooling gain, analyzing compute resourceutilization, in Giga Operations Per Second (GOPS), for different number of sectorsaggregated into a BBU pool. In [155], Desset et al. elaborate on how many GOPS areneeded for different base station modules, including:
- Digital-to-Analog Converter (DPD)
- Filter: up/down-sampling and filtering
- CRPI/SERDES: serial link to backbone network
- OFDM: FFT and OFDM-specific processing
- FD: Frequency-Domain processing (mapping/demapping, MIMO equalization); itis split into two parts, scaling linearly and non-linearly with the number of antennas

56 Chapter 3. Multiplexing gains in Cloud RAN
Table 3.2: Estimations of baseband complexity in GOPS of cell- and user-processing for ULand DL and different cell sizes. Numbers are taken from [155].
DL ULmacro femto macro femto
GOPSc 830 180 700 240GOPSu 30 25 140 120%GOPSu 3% 12% 17% 33%
- FEC
- CPU: platform control processor.
For the reference case, assuming 20 MHz bandwidth, single-antenna, 64-QAM, rate-1encoding and a load of 100%, and treating DPD, filtering, SERDES, OFDM, and linearpart of FD as cell-processing, and non-linear part of FD and FEC as user-processing,Table 3.2 summarizes estimations on GOPS for UL and DL for macro and femto cellfor cell-processing GOPSc and for user-processing GOPSu. It would require furtherinvestigation on how to split platform control processor resources. It can be concludedthat especially for downlink, share of user-processing resources is small comparing tocell-processing resources (3-12%). For uplink processing relatively more can be saved onuser-processing (17-33%).
To conclude, MG calculated in the project applies only to user-processing resources,which are a fraction of total resources. Moreover, as mentioned above there are factorsimplying that MG calculated in the project is actually both lower (protocol processing)and higher (dimensioning margin) in reality. Given the complexity of the system andamount of factors influencing the final result, obtained MG gives only a contribution tothe approximation of the real-life PGprocessing.
3.1.3.2 Gains in power consumptionA base station consumes power on the following:
- powering the main equipment (51% of the cell site power consumption for tradi-tional base station in China Mobile [20], 83% for Vodafone [156] found in [157]and [158])
- air conditioning (46% of the cell site power consumption for traditional base stationin China Mobile [20], 10-25% for Vodafone [156])
- fronthaul network transmission (in case of C-RAN).
Power consumption of the main equipment can be further broken down into:

3.1. Methodology 57
- PowerRRH powering RRH, necessary to assure coverage, not dependent on thetraffic load, includes RF processing and Power Amplifier (PA);
- Powerctrl powering modules responsible for control-plane processing
- Powerc powering modules responsible for baseband processing of cell-processingfunctionalities, not dependent on the traffic load, including resource mapping, IFFTand CP
- Poweru powering modules responsible for baseband processing of user-processingfunctionalities, dependent on the traffic load, including PDCP, RLC, MAC, BLP,QAM and antenna mapping.
According to [156] main equipment consumes power on:
- PA - 50-80% of total base station consumption
- signal processing - 5-15% of total base station consumption
- power supply - 5-10% of total base station consumption
. Based on this data Powerctrl + Powerc + Poweru account for 5-10% of total basestation power consumption. In [159] Auer et al. reports that 2-24 % of total base stationconsumption are spent on baseband processing.
Similar as for processing resources, equation 3.3 can be further expanded into equation3.6 by inserting these components. Also, only user-processing resources could be reducedby the factor of MG as listed in equation 3.7.
PGpower =
cells∑BBPowerRAN
BBPowerC−RAN=
=
cells∑(PowerRANctrl
+ PowerRANc + PowerRANu)
PowerBBUpoolctrl + PowerBBUpoolc + PowerBBUpoolu
≈ (3.6)
≈
cells∑PowerRANctrl
+cells∑
PowerRANc +cells∑
PowerRANu
cells∑PowerRANctrl
+cells∑
PowerRANc+
cells∑PowerRANu
MG
(3.7)
In [155], Desset et al. propose a more detailed power model of a base station,listing factors that impact power consumption. Power consumption is proportional toGOPS: the number of operations that can be performed per second and per Watt is 40

58 Chapter 3. Multiplexing gains in Cloud RAN
GOPS/Ws for large base stations and default technology, here i.e., 65 nm General PurposeComplementary metal-oxide-semiconductor (CMOS), and it is three times larger for picoand femto cells. Therefore PGpower on user-processing resources can be reduced by thesame factor as PGprocessing on user-processing resources.
To conclude, PGpower, similarly to PGprocessing , accounting for 2-24% of base sta-tion power consumption, is affected by MG by reducing power spent by user-processingresources. Model including the whole LTE processing stack would be needed to determineoverall savings more precisely, as well as detailed information on how user traffic impactspower consumption.
3.1.3.3 Gains in transportThe fronthaul network capacity needs to be dimensioned according to the planned useractivity. In a packet-based fronthaul, traffic to different cells can be aggregated. ForUE-Cell functional split traffic will be variable bit rate and will resemble traffic from thesimulations, however simplifications mentioned in Section 3.5.6 apply. Aggregated linkcapacity can be directly reduced by MG times, if the QoS is assured.
3.1.4 ApproachMathematical, teletraffic theories have been used to calculate an overbooking factor [160]that dimensions the link, based on the definition of an effective bandwidth [161]. Theyprovide an important indication when the fundamentals of the networks are studied.
However, teletraffic theories focus on well-defined traffic models, such as ON - OFFsource traffic e.g., Interrupted Poisson Process, Interrupted Bernoulli Process [161]. Assuch, they do not capture all the aspects of real-life networks. In current and future mobilenetworks there is a big variety of applications and the traffic varies throughout the daydepending on cell location (office or residential). In order to capture this heterogeneity theanalysis is done in a discrete event-based simulator - OPNET [162]. Such scenario withdetailed and heterogeneous traffic definition is especially important to evaluate the UE-Cell split (introduced in Figure 2.12. Simulations allow to capture protocol interactionsand thereby observe implications of different network architectures on end-to-end delayseen at the application layer. On the other hand, a mathematical approach allows to createsimpler models that can run with lower simulation time, thereby enabling testing moreextended scenarios, e.g., with more cells. Both approaches are important to compareand validate the results. This chapter reports simulation results that have been validatedanalytically by collaborators, as presented in Section 3.3.2.
Quantifying multiplexing gains has been addressed by research and industry commu-nities. Related work is presented in Section 2.2.1 and 3.4.4.

3.2. Origins of multiplexing gain 59
3.2 Origins of multiplexing gain
Sections 3.2.1, 3.2.2 and 3.2.3 present different sources of multiplexing gain: tidal effect,traffic burstiness and C-RAN functional splits. Section 3.2.1 explores average daily loadsin office, residential and commercial areas via simple calculations. Section 3.2.2 presentsresults of a simple network model where applications have been modeled on top of dailytraffic loads. Section 3.2.3 presents theoretical considerations.
3.2.1 Tidal effectA tidal effect is one of the main factors affecting multiplexing gain. People tend to bein at least two places during the day (e.g., home and work), therefore as a rule of thumbthey could use 1 BBU in C-RAN instead of 2 different BBUs in RAN, what can becounted as a multiplexing gain of 2, based on equation 3.2. However, they could use thenetwork differently in different places causing different amount and characteristics oftraffic. Therefore the value of multiplexing gain could be slightly lower or higher than 2.
Two examples of data sets have been used to calculate multiplexing gain according toequations 3.2, where BBResources correspond to traffic load:
- from China Mobile, presented in Section 2.2.1
- from Ericsson and MIT analyzed within the project "A tale of many cities" [163].Data shows daily, weekly, monthly and overall traffic patterns in terms of calls,SMS, DL data, UL data and requests from various districts of London, New York,Los Angeles and Hong Kong. DL data was analyzed.
Sample values are shown in Figure 3.2.Figure 3.3 shows multiplexing gain calculated based on data from China Mobile and
Ericsson/MIT (London, New York and Hong Kong) for varying percentage of office vsresidential cells. Traffic from Ericsson/MIT includes DL data for a typical week in twodifferent office/residential areas: City of London and Newham for London, Battery ParkCity - Tribeca (Lower Manhattan) and Ridgewood for New York, as well as "Centraland Western" and Yuen Long for Hong Kong. Tuesday is taken into account to show atypical day in the middle of the week. For 100% of residential (0% office) and 100% ofoffice cells multiplexing gain equals to one, which is expected, since similar daily trafficdistributions are aggregated. In other cases values are within 1.0 - 1.32 with peak valuesfor 20-30% of office cells for all the cities except for Hong Kong, where peak occursfor 60% of office cells. The differences are due to different daily traffic distribution indifferent cities. Figure 3.2 shows an example. Values of traffic load cannot be directlycompared as they come without absolute values, but the trend lines can. In data fromChina Mobile, presented in Figure 3.2(a), traffic during business hours in residential areasis significantly lower than in the office areas and the traffic load is complimentary in officeand residential areas through the day, hence a higher multiplexing gain value. On thecontrary, in London, Figure 3.2(b), traffic is more uniformly distributed between office

60 Chapter 3. Multiplexing gains in Cloud RAN
0
10
20
30
40
50
0 6 12 18 24
Load
Time (h)
Data from China Mobile
Office Residential
(a) Overall traffic reported by ChinaMobile
0
0.5
1
1.5
2
2.5
0 6 12 18 24
DL
dat
a
Time (h)
Traffic in London, from MIT/Ericsson
City of London Newham
(b) Example of traffic in an officeand residential cell in London
0
0.5
1
1.5
2
2.5
0 6 12 18 24
DL
dat
a
Time (h)
Traffic in New York, from MIT/Ericsson
Lower Manhattan Ridgewood
(c) Example of traffic in office andresidential cell in New York
0
0.5
1
1.5
2
2.5
0 6 12 18 24
DL
dat
a
Time (h)
Traffic in New York, from MIT/Ericsson
Business Residential Commercial
(d) Overall traffic in New York
Figure 3.2: Daily traffic distributions.
and residential areas, only peaking in the office area in business hours, hence lower valuesof multiplexing gain. Data for Los Angeles: Downtown and Florence, resembles datafrom London. Values for New York, Figure 3.2(c) lie in between values for London anddata from China Mobile, as the curves of traffic.
Typically in the cities there are not only residential and office areas but also commercialareas, like shopping malls, movie theaters as well as parks and mixed areas. They willall have different daily and weekly traffic distributions that will affect the value ofmultiplexing gain. Based on the available data impact of commercial sites is estimatedas shown in Figure 3.4. It is based on the overall data for New York from MIT/Ericssonpresented in Figure 3.2(d). Analyzed deployments consist of office, residential andcommercial cells. Values vary between 1.0, for 100% of one cell type, to 1.21 for 30% ofoffice cells, 70% residential and 0% commercial. As shown in Figure 3.2(d) commercialareas in New York have a uniform traffic distribution in the daytime therefore they lowerthe multiplexing gain.
To conclude, in order to maximize multiplexing gains it is best to combine in a BBUpool cells whose daily traffic distributions are complementary i.e. traffic is low in some

3.2. Origins of multiplexing gain 61
0.8
0.9
1.0
1.1
1.2
1.3
1.4
0 10 20 30 40 50 60 70 80 90 100
Mu
ltip
lexi
ng
gain
Office cells (%)
Multiplexing gain for different locations
London/LosAngeles
New York
Hong Kong
China Mobile
Figure 3.3: Multiplexing gains for different locations based on daily traffic distributionsbetween office and residential cells.
0.90
0.95
1.00
1.05
1.10
1.15
1.20
1.25
0 10 20 30 40 50 60 70 80 90 100
Mu
ltip
lexi
ng
gain
Office cells (%)
Multiplexing gain for different mix of office, residential and commercial cells, New York
0% commercial
10% commercial
20% commercial
30% commercial
40% commercial
50% commercial
60% commercial
70% commercial
80% commercial
90% commercial
100% commercial
Figure 3.4: Multiplexing gains for different distributions between office, residential andcommercial cells.
cells while it is high in others and vice versa.
3.2.2 Traffic burstinessMultiplexing gain comes not only from the tidal effect, but also from traffic burstiness.Due to the fact that user activity varies in time, it is possible to allow many users to sharethe same link without too much queuing, in the same way as printers could be shared

62 Chapter 3. Multiplexing gains in Cloud RAN
by office workers on one floor. In order to capture traffic burstiness real-life applicationcharacteristics need to be taken into account.
Paper [11] presents an initial evaluation of the multiplexing gain including both thetidal effect and traffic burstiness. A real case scenario is modeled with the mobile trafficforecast for year 2017, a number of recommendations on traffic models, including adaily traffic variations between office and residential cells as presented in [20] and aproposed RAN and C-RAN implementation. RAN and C-RAN are modeled by nodesperforming simple traffic aggregation. Multiplexing gain is evaluated as in equation 3.1,where LinkResources are represented by the peak requested throughput.
The results show that the statistical multiplexing gain for user traffic in a C-RANarchitecture, when traffic burstiness is taken into account, is 4.34, σ = 1.42, comparedto a traditional RAN architecture. Please refer to [11] for more details on the model andresults.
3.2.3 Different functional splitsIn a traditional base station or in a base station with RRH, for each cell, basebandprocessing resources are statically assigned to the RRH, as shown in Figure 3.5a. InC-RAN, presented in Figure 3.5d the baseband units are shared in a virtualized BBUpool, hence it is expected that in C-RAN the amount of processors needed to performbaseband processing will be lower compared to RAN. The CPRI protocol is constantbit rate, independent of user activity. Hence, there is no multiplexing gain on fronthaullinks. This split is referred to as BB-RF as it separates baseband and radio frequencyfunctionalities.
Several examples of functional splits are indicated in Figure 3.5: BB-RF (Figure 3.5d),discussed above, PDCP-RLC (Figure 3.5b) and UE-Cell (Figure 3.5c). With the UE-Cellsplit (separating user and cell specific functionalities) traffic between RRH and BBU istraffic-dependent, hence multiplexing gain can be expected both on BBU resources andalso on the fronthaul links.
For PDCP-RLC split, the majority of data processing is executed at the cell site, onlya small portion of it is done in the pool, hence a marginal BBU pool multiplexing gain.However, a variable bit rate traffic is transmitted on the fronthaul links, hence a possibilityfor a multiplexing gain on the fronthaul. This split leaves the MAC scheduling and PHYfunctionality to reside at the RRH, which limits the possibility of joint PHY processingand joint scheduling for multi-cell cooperation.
Generally, the more processing is centralized, the higher savings on BBU pool costand benefits coming from centralization, but higher burden on fronthaul links. On theother hand, the more functionalities are left at the cell site, the lower savings on the BBUpool, but at the same time lower cost of fronthaul coming from multiplexing gain, lowerbit rates and relaxed latency requirements, as indicated in Section 2.10.1.
The aggregated link in equation 3.1 represents fronthaul and BBU traffic for UE-Cellsplit, therefore the multiplexing gain on fronthaul links for UE-Cell split can be calculated

3.2. Origins of multiplexing gain 63
BB-RF split
Present layer
Absent layer
UE-Cell split
PDCP-RLC split
Traditional RAN
RRHSwitch BBUPHY
RLC/MAC
PDCP
Layers present at BBU side
BBU pool
Aggregation link
Aggregated Traffic (over 24h)
Residential cell traffic (over 24h)
Office cell traffic (over 24h)
Multiplexing gain on BBU pool
backaul
fronthaul
Multiplexing gain on FH links
Legend
CPRI
CPRI
CPRI
a)
b)
c)
d)
Figure 3.5: Possible multiplexing gains on BBU pool and fronthaul links depending on basestation architecture.
MGFH−UE−Cell. MGFH−UE−Cell comes straightforward from equation (3.1) whereLinkResources are quantified as throughput or data rate. Only traffic dependent re-sources are evaluated, therefore the comparison between single and aggregated linkresources is analogical to comparing traffic on BBUs in RAN to BBU pool in C-RAN.As a consequence, multiplexing gain on fronthaul for UE-Cell split MGFH−UE−Cell isthe same as multiplexing gain on BBU for UE-Cell split MGBBU−UE−Cell and BB-RFsplit MGBBU−BB−RF . Later in this chapter, all these results will be referred to asMG, however the same conclusions appear to MGFH−UE−Cell, MGBBU−UE−Cell andMGBBU−BB−RF . Table 3.3 shows dependencies between the values.

64 Chapter 3. Multiplexing gains in Cloud RAN
Table 3.3: Multiplexing gains (MG) looking at traffic-dependent resources.
RAN Architecture BBU linksTraditional RAN 1 (no MG) MG presented in
this chapter ap-ply
PDCP-RLC split [13] [13]UE-Cell split MG presented
in this chapterapply
MG presented inthis chapter ap-ply
BB-RF MG presentedin this chapterapply
1 (no MG)
3.3 Exploring the tidal effect
As stated before, multiplexing gain comes from traffic burstiness and from the tidal effect.This section explores the tidal effect and summarizes efforts to find the most optimal mixof residential and office cells in order to maximize the multiplexing gain. The results canbe applied to the BBU pool for BB-RF split.
3.3.1 Network modelNetwork simulations are carried out in OPNET Modeler inspired by a traffic forecasts for2019 [164], [1]. Simulations are carried out for 16 hours to study the impact on varyingtraffic load throughout the day - from 8 a.m. to midnight. Traffic load for the average officeand residential base station follows the trend observed in the network operated by ChinaMobile, presented in Figure 2.5 [20]. The parameters of the traffic models are summarizedin Table 3.4. The actual applications run on top of the TCP/IP and Ethernet protocolstack, as shown in Figure 3.6. The simulations are ran for 10 cells, varying the number ofoffice and residential base stations. Traffic is aggregated by the Ethernet switch. The peakthroughput in downlink direction is observed on the links between the cells and the switchto obtain SingleCellLinkResources and the peak throughput on the link between theEthernet switch and the BBU pool to collect SingleCellLinkResources, in order tocalculate multiplexing gain according to equation (3.1). Throughput measurements aretaken every 576 s (100 measurement points in 16 hours). 24 runs with different seedvalues allow to obtain standard deviation of the results. Confidence intervals for 95% levelare calculated using the Student’s t distribution. Student’s t distribution is used instead ofa normal distribution because a relatively small number of samples (24) is analyzed.

3.3. Exploring the tidal effect 65
Switch…
.
Office cells
….
Residential
cells
Ethernet
IP
TCP
Application
Ethernet
IP
TCP
Application
Ethernet Ethernet
Traffic (h)
24 h
Traffic (h)
24 h
Aggregated
Traffic (h)
24 h
BBU Pool
Figure 3.6: Network model used for simulations.
1
10
100
0 4 8 12 16 20 24
Load
(M
bp
s)
Time (h)
Office base station Residential base station Aggregated traffic
Figure 3.7: Modeled traffic from residential, office and aggregated traffic from 5 office and5 residential cells.

66 Chapter 3. Multiplexing gains in Cloud RAN
Table 3.4: Traffic generation parameters for network modeling; C - Constant, E - Exponential,L - log-normal, U - uniform, UI - uniform integer
Traffic Parameters Value DistributionVideo application - 50% of total traffic
Frame interarrival time 10 frames/sec CFrame size 128 x 120 pixels -
17280 BC
Start time offset min 50 s, max 3600 s UDuration of profile run mean: 180 s EInter-repetition time mean: 1800 s E
File sharing application - 40% of total trafficInter request time mean: 180 s [165] PFile size mean 2 MB [165] LFile size Standard Deviation 0.722 MB [165]Duration of profile run mean: 1200 s EInter-repetition time 300 s E
Web browsing application - 10% of total trafficPage interarrival time mean: 10 s EPage properties main object: 1 KB C
Number of images: 7 CSize of images: min2KB, max 10KB
UI
3.3.2 Discussion on the results exploring the tidal effectFigure 3.7 shows modeled traffic from residential, office and aggregated traffic from 5office and 5 residential cells. Please note the logarithmic scale.
Figure 3.8 summarizes the results on the statistical multiplexing gain for differentpercentage of office base stations for the studied traffic profile. It shows that the maximumstatistical multiplexing gain is achieved for a BBU Pool serving 30% of office basestations and 70% of residential base stations. Multiplexing gain value of 1.6 correspondsto 38% of BBU savings. The way this and the following BBU savings are calculated is aspresented in equation 3.8.
BBUSaving =MG− 1
MG=
1.6− 1
1.6(3.8)
Multiplexing gain for all the cases is above 1.2, corresponding to 17% of BBU savings.Different traffic profiles will affect the results, however the same model can be used toprocess different input data.

3.4. Exploring different resources measurement methods and application mixes 67
0.0
0.2
0.4
0.6
0.8
1.0
1.2
1.4
1.6
1.8
0 10 20 30 40 50 60 70 80 90 100
Mu
ltip
lexi
ng
gain
Office cells (%)
Figure 3.8: Optimal distribution of office and residential cells - simulation results. Confidenceintervals for 95% level are shown.
Simulation results are verified and confirmed by collaborators, using 1) an analyticalapproach using calculations based on averaged throughput in [12], as well as, 2) usingteletraffic methods in [45]. Looking at the statistical multiplexing gain that can beachieved in C-RAN under our assumptions, it reaches the maximum value for: 1) 30% ofoffice cells concluding from the modeling approach, with the statistical multiplexing gainreaching 1.6, 2) 21% of office cells in the analytical approach resulting in 70% of BBUsave, and 3) 22% of office cells in the teletraffic approach resulting in 84% of BBU saving.The analytical approach takes an average network load for each hour, teletraffic approach- aggregated traffic characteristics, while the modeling approach included burstinessresulting from application definitions and protocol stack processing. All three approachesshow the same trend line for optimal office/residential cell mix peaking at 20-30% ofoffice cells, which validates the results. Values of BBU saving are less straightforward tocompare as they are obtained with different methods. The ones coming from multiplexinggain itself vary between 35-49%. Table 3.5 compares the results.
3.4 Exploring different resources measurement methods and applica-tion mixes
The previous section investigates multiplexing gains resulting from the tidal effect. In thissection the most optimal office/residential cells mix is considered and the different meth-ods of evaluating LinkResources from equation 3.1 are used and compared. Moreover,the investigation focuses on the application mix impact, therefore the percentage of weband video traffic is varied, while the total offered traffic follows the daily load for eachsimulation run. Those results study the impact of traffic burstiness, therefore they can beapplied to both BBU pool and fronthaul for UE-Cell split.

68 Chapter 3. Multiplexing gains in Cloud RAN
Table 3.5: BBU save for various office/residential cell mixes, measured using differentmethods.
Method Maximum BBU save % of officecells
Source
Discrete-event basedsimulations
38% coming from MG(MG=1.6)
30% [12]
Analytical - averagedcalculations
35% coming from MG(MG=1.54), 70% usingauthors method
21% [12]
Teletraffic studybased on a multi-dimensional losssystem
49% coming from MG(MG=1.96), 84% usingthe Moe’s principle
22% [45]
3.4.1 Discrete event simulation modelA sample system is built with an architecture and protocol stack similar to the one used forour previous study [12]. Ten base stations are connected to one switch and then to a server,as presented in Figure 3.9. Traffic in the BBU pool and on the fronthaul links in UE-Cellsplit can be compared to Ethernet traffic on the MAC layer. PHY layer cell processing isdone at the cell site leaving MAC-layer-like traffic on the fronthaul. Each base stationis connected with a 1 Gbps link, as this could be a radio link throughput of LTE-A andinitially data rate of the aggregated link is 10 Gbps not to create any bottleneck. There arethree office and seven residential base stations, as this is the mix for which we observedthe maximum multiplexing gain in our previous studies [12], [45]. Daily traffic loadbetween office and residential cells varies according to [20], as in previous studies. Wesend video and web traffic according to the definitions presented in Table 3.6 to representdelay sensitive (ms level) and delay insensitive (s level) applications. Parameters for videotraffic are based on [166] and for web traffic on [167] considering an average web pagesize growth between years 2007 and 2014 [168]. Values presented in the table representtraffic from 8 a.m. to 9 a.m. for office base stations (lowest load observed in the system)and are multiplied for other hours and residential base stations to reflect the daily load.Simulation parameters are presented in Table 3.7. No QoS-aware scheduling is done, thepackets are processed in First Input First Output (FIFO) manner. This simple schedulingalgorithm is used to show the emphasis on traffic aggregation, not scheduling as such.
3.4.2 Throughput measurements for quantifying multiplexing gainsGiven the fact that the links between the base station and the aggregating switch have adata rate of 1 Gbps, it can be seen on ns level whether a bit is sent or not. LTE schedulingis done every 1 ms, therefore it is viable to measure not more often then once every

3.4. Exploring different resources measurement methods and application mixes 69
Table 3.6: Traffic generation parameters for network modeling; C - Constant, E - Exponential,L - log-normal, G - gamma, U - uniform
Traffic Parameters Value, DistributionVideo application
Frame interarrival time 10 frames/sec, CFrame size 4193 B, CDuration of video con-ference, 50% cases
mean: 16 s, variance: 5 s, N
Duration of video con-ference, 25% cases
mean: 208 s, variance: 3364 s, N
Duration of video con-ference, 25% cases
mean: 295 s, variance: 2500 s, N
Inter-repetition time mean: 1250 s, EWeb browsing application
Page interarrival time mean: 28.5 s, variance: 1774966s, L
Page properties
main object size mean: 63346 B,variance: 86205010504 B, max 6MB, LNumber of embedded objectsscale: 40, shape: 0.1414, max 300,Gembedded object sizemean: 142103 B, variance:2264446191523 B, max 6 MB, L
Table 3.7: Simulation parameters.
Parameter ValueModeler and simula-tion software
OPNET 17.5.A PL3
Simulated time 16 hSeeds 24, randomValues per statistic For throughput measurements every
10 ms, for delay measurements ev-ery 1 s

70 Chapter 3. Multiplexing gains in Cloud RAN
Switch
….
3 office cells
….
7 residential
cells
MAC
IP
TCP
Application
MAC
IP
TCP
Application
MAC MAC
Traffic (h)
24 h
Traffic (h)
24 h
Aggregated
Traffic (h)
24 h
BBU Pool
Figure 3.9: Network model used for simulations.
1 ms. For practical reasons, in order to be able to process the results efficiently, thedata is collected every 10 ms. Operators will most likely not dimension their networksfor peak user data measured over 1 ms, but allow some buffering, thereby saving thecosts, although lowering the user data rate. Therefore different averaging is applied oversimulated throughput as follows.
For each cell c and for the aggregated link a the data set resulting from simulationsconsists of 16hours
10ms = 5760000 throughput measurements x measured at time t. Anaveraging window (bucket) is defined with width W such that for the samples (ti, xi)where i = 0, 1, ..., n and tn−t0 =W . The averaging window size represents the networksability to smoothen the traffic and has a similar function to a buffer. 16 hours simulatedtime is divided into such windows W and for each of them an average throughput is
calculated y =
n∑i=0
xi
n . Out of all the y values, a maximum value of all the averages isfound ymax for each cell ymax,c and for an aggregated link ymax,a. Based on equation(3.1) MGAVG is calculated as presented in equation (3.9).
MGAVG =
cells∑c=1
ymax,c
ymax,a(3.9)
Values of MGAVG coming from simulations for different web and video traffic

3.4. Exploring different resources measurement methods and application mixes 71
0
1
2
3
4
5
6
7
0 10 20 30 40 50 60 70 80 90 100
Mu
ltip
lexi
ng
gain
Web traffic (%)
10 ms
100 ms
1 s
10 s
57.6 s
100 s
Figure 3.10: Multiplexing gain for for different percentage of web traffic in the systemand different throughput averaging windows: MGFH−UE−Cell (10 ms, no averaging) andMGFH−UE−Cell−AV G (100 ms, 1 s, 10 s, 57 s and 100 s).
mixes are presented in Figure 3.10. Confidence intervals for 95% level are calculatedusing the Student’s t distribution. Different series present data averaged over 100 ms,1 s, 10 s, 57 s and 100 s (averaging window W ). For 10 ms series throughput is notaveraged, only the maximum values are taken for each cell and aggregated link to computeMG. Values vary for different mixes of web traffic. For no web traffic present in thenetwork, the multiplexing gain has similar value within our averaging intervals, as videoconferencing sessions have constant bit rates. As soon as web traffic is present (17-100%)multiplexing gain varies from 1.5 to 6 depending on the averaging window. It can beseen that multiplexing gain is very sensitive to the measurement interval. There is a cleardependence of the averaging period on the multiplexing gain.
In principle, if we take longer, up to infinite, averaging periods the multiplexing gainshould be getting lower and reaching one, as the average bandwidth of an aggregationlink will need to match the sum of average bandwidths of single links. Therefore it is notstraightforward why the value is low for every 10 ms, then increases for 100 ms and 1 s andthen lowers again. The possible cause could be that the Cumulative Distribution Function(CDF) of the throughput looks in a way that for 90% of the time the throughput to basestations is below 100 Mbps and aggregated throughput is below 1 Gbps, as presented inFigure 3.11. This indicates that by adequate dimensioning the multiplexing gain valuecan be different. Moreover, if the dimensioning is done according to the results fromaveraging over longer periods, the risk of dropped packets and connections will increase,as buffer sizes may be exceeded and packets may be dropped or users may not be satisfied

72 Chapter 3. Multiplexing gains in Cloud RAN
with the delay. In this study none of the packets were dropped. The averaging is doneonly in post processing of the data, so actually it is not verified what will be the impactof providing only the data rates as averaged on the application level delays. For videoconferencing and web browsing averaging only up to 10 - 100 ms is safe, as applicationlayer delays should not exceed the order of magnitude of 150 ms and 1 s, respectively.Delays on the application level will give an ultimate criterion for network dimensioning.The following section elaborates on them.
0.0
0.2
0.4
0.6
0.8
1.0
1.2
0 1 2 3 4 5 6
CD
F
Throughput (Gbps)
Office (1)
Residential (1)
Total (10)
0.0
0.2
0.4
0.6
0.8
1.0
1.2
0 0.1 0.2 0.3
Figure 3.11: CDFs of throughput for an sample office and residential cell as well as totalthroughput for all ten cells for 50% web traffic mix.
3.4.3 Delay-based criteria for network dimensioningThe ultimate criterion to dimension the discussed links and BBU pool is to assure accept-able performance on the application level. For that web page response time and videopacket end-to-end delay is checked via discrete event simulations. For 100-400 Mbpsaggregated link data rate the delay differences are the highest and they reach the pointwhen they become acceptable. The links are intentionally examined with fine granularityof throughputs (every 50 Mbps) as lines and computational power can be leased with finegranularity of data rates [169]. The results are presented in Figures 3.12 and 3.13. Forweb traffic 90th percentile of web page response time is below 1 s for link data rates ≥200

3.4. Exploring different resources measurement methods and application mixes 73
Mbps. For video conferencing 90th percentile of packet end-to-end delays are below 150ms for link ≥200 Mbps.
As expected, the delays are lower when the offered link data rates are higher. Theimpact on delay is higher for the cases with less web traffic. It is due to the fact, that themore video traffic is present in the network, the delays are more sensitive to the aggregatedlink bandwidth. Small change of data rate affects delay considerably, even by a factor of10 (for 17% of web traffic - 83% of video traffic). The reason could be that video occupiesa link at a constant bit rate for at least a minute, so if the links are under-dimensionedqueuing occurs. The conclusion is, that the more bursty the traffic is, the less sensitive isit to under-dimensioning. The more video traffic present in the network the dimensioningbecomes more relevant for achieving quality of service. Traffic forecast [2] predicts thatin 2020 60% of the mobile traffic will be video; it will, however, vary between light andheavy users.
0.1
1.0
10.0
100.0
0 10 20 30 40 50 60 70 80 90 100
90
th p
erc
en
tile
of
web
pag
e re
spo
nse
tim
e, s
Web traffic (%)
100 Mbps
150 Mbps
200 Mbps
250 Mbps
Figure 3.12: 90th percentile of web page response time for different percentage of web trafficin the system and for different aggregated link data rate.
3.4.4 Analysis based on the 95th percentile of requested throughputThe 80th, 90th, and 95th percentiles of the sums of single cells throughputs and of anaggregated link throughput are analyzed. The results are presented in Figure 3.14. Thesum of the 80th and 90th percentiles are getting lower because the more web traffic ispresent in the network the lower the mean traffic, but the standard deviation gets higher.However, looking at the 80th and 90th percentiles on the aggregated link, it is gettinghigher because the peaks occur more often. The trend shown in Figures 3.12 and 3.13 isthe same as for the sum of the 80th and 90th percentiles in Figure 3.14. The values closestto 200 Mbps proven to be sufficient from the delay analysis. They account for the higherone of those values: the 80th percentile on aggregated link or the sum of 90th percentiles.Therefore it can be concluded that in order to dimension fronthaul links and BBU, the

74 Chapter 3. Multiplexing gains in Cloud RAN
0.000
0.001
0.010
0.100
1.000
10.000
100.000
0 10 20 30 40 50 60 70 80 90 100
90
th p
erc
en
tile
of
v id
eo
co
nfe
ren
cin
g P
acke
t En
d-t
o-E
nd
D
ela
y (s
)
Web traffic (%)
100 Mbps
150 Mbps
200 Mbps
250 Mbps
Figure 3.13: 90th percentile of video conferencing packet End-to-End delay for differentpercentage of web traffic in the system and for different aggregated link data rate.
sum of 90th percentile of throughputs from fronthaul links and the 80th percentile ofaggregated link need to be provided (here 200 Mbps). In case of under-dimensioning, forhigher percentages of web traffic the delay increase will be lower, as is the sum of the80th and the 90th percentiles.
0
100
200
300
400
500
600
700
0 10 20 30 40 50 60 70 80 90 100
Thro
ughp
ut (M
bps)
Web traffic (%)
Sum of 95thpercentiles
95th percentile onaggregated link
Sum of 90thpercentiles
90th percentile onaggregated link
Sum of 80thpercentiles
80th percentile onaggregated link
Figure 3.14: 80th, 90th and 95th percentile of base stations throughput for differentpercentage of web traffic in the system.
These results can be used not only for quantifying multiplexing gains but also fornetwork dimensioning providing traffic distribution with a CDF similar to the one studiedhere. For upgrading existing networks, operators could measure single cell throughput

3.5. Discussion and verification of the results 75
and calculate the 90th percentile of it and measure 80th percentile of aggregated traffic.Then depending on how many cells should belong to one BBU pool/be aggregated on asingle fronthaul link, the higher number will assure the necessary capacity. If it is notmet, it means that links should be upgraded to the next available data rate. For greenfield deployments based on traffic forecast, the operators will need to estimate what is the90th percentile of throughput they would like to offer to the users. The challenge thenwould be to add those throughputs taking into account forecasted user activity. Having thesum of the 90th percentile of such aggregated traffic for each base station, and the 80thpercentile of aggregated traffic, the capacities need to be summed considering how manycells will be aggregated on a link/BBU pool. The sum will give the desired link/BBUpool resources.
The results for the sum of the 95th percentiles can be applied to the equation (3.1),where sufficient AggregatedLinkResources are 200 Mbps, based on delay measure-ments. Using this method computed MG95th is in the range of 1.27 - 2.66 which con-verges with the results for MG for throughput measured every 10 ms (1.5-2.2). Moreover,2.7 is the result of MGBBU−BB−RF concluded with the teletraffic method published in[13], which confirms the thesis that MGFH−UE−Cell =MGBBU−BB−RF stated at thebeginning of this chapter. These results serve as validation of the two approaches.
3.5 Discussion and verification of the results
A summary of the results achieved in this and another project and impact of averaging,traffic burstiness and tidal effect are shown in Table 3.8. The particular values hold forgiven application mixes (from the literature) and given daily traffic load in office andresidential cells (from an operator - China Mobile as well as a vendor - Ericsson). Still,the trends can be observed and conclusions can be made.
Table 3.8 shows a clear dependence of the averaging period on the multiplexing gain.Depending on the averaging window size, the impact of traffic burstiness and tidal effectcan be observed. Sections below discuss those dependencies as well as impact on networkmodel and methodology used to calculate the multiplexing gain. Results are comparedthereby allowing to verify network models, assumptions and methodology.
3.5.1 Impact of traffic burstinessBurstiness is one of the main factors contributing to the multiplexing gain. In order toobserve the impact of traffic burstiness, the throughput needs to be measured with finegranularity. Traffic models used in these studies (presented in Tables 3.4 and 3.6) haveparameters in order of seconds, e.g., page interarrival time - 10 s, duration of a video - 16s. Therefore throughput needs to be measured at least every 10 s to observe such trafficfluctuations.
Project 1 shows only impact of traffic burstiness, because 1 hour of network operationwas simulated.

76 Chapter 3. Multiplexing gains in Cloud RAN
Table 3.8: Multiplexing gains calculated in different projects. MG - multiplexing gain.
Project simula-ted time(h)
measurementinterval
MG bursti-ness
tidaleffect
1. LTE dimension-ing [14]
1 1 s 5.5 X -
2. C-RAN MG ini-tial study, Section3.2.1
24 1 h 1.0 - 1.33 - X
3. C-RAN MG ini-tial study [11], Sec-tion 3.2.2
24 1 s 4.34 σ 1.42 X X
4. C-RAN MG vary-ing % Office cells[12], Section 3.3
16 576 s 1.2 - 1.6 little X
5. C-RANMG varying% Web Traffic[13], Section3.4
16
10 ms 1.9 - 2.3 X Xaveraging win-dow W
0%web
≥17%web
100 ms 1.6 4.5 - 6.1 X X1 s 1.6 3.7 - 5.9 X X10 s 1.5 - 3.1 edge X57.6 s 1.5 - 1.7 - X100 s 1.5 - 1.6 - X
For measurement interval (averaging window) of 1 s in projects 1, 3 and 5 the resultsare in range of 3 - 6. Therefore this is the value of the multiplexing gain coming fromtraffic burstiness. Values for project 5, 10 ms averaging are an exception from thisreasoning. The values could be lower due to the long tails of CDFs of throughput.
3.5.1.1 Impact of application mixProject 5 evaluates multiplexing gain for different application mixes varying percentageof web versus video application traffic. Values are the lowest (1.5-1.9) for 0% of webtraffic. As soon as the bursty web traffic is present in the network the values increaseto 3.7 - 6.1 (project 4, case for 100 ms and 1 s averaging). Similar results are reportedfor projects 1 and 3 (5.5 and 4.34, respectively). In the majority of networks there is atraffic mix between video and web, e.g., Ericsson reports that in 2015 video accounted foraround 50% of mobile data traffic, therefore an operator can count on a multiplexing gainvalue of 3.7 - 6.1. However, if an operator expects 100% of video traffic (e.g., dedicatingthe network to users using services like Netflix), multiplexing gain will be lower.

3.5. Discussion and verification of the results 77
Projects 1, 3 and 5 take into account different application definitions. Still the resultsremain similar (3 - 6).
3.5.2 Impact of the tidal effectThe tidal effect is another main factor contributing to the multiplexing gain. Section3.3.2 presents results of three studies that aimed at finding an optimal mix of office toresidential cells, all reaching a maximum multiplexing gain for 20-30% of office cells.
Project 4, due to the high value of the averaging window shows mostly the impact ofthe tidal effect on the value of the multiplexing gain and little impact of traffic burstiness.The value range between 1.2 and 1.6 depending on percentage of office vs residentialcells. Figure 3.15 compares values from projects 2 and 4 (latter marked as simulated).Values obtained via simulations in project 4 are 0.2 - 0.3 higher than the ones from initialcalculations in project 2 showing little impact of traffic burstiness.
0.80.91.01.11.21.31.41.51.61.7
0 10 20 30 40 50 60 70 80 90 100
Mu
ltip
lexi
ng
gain
Office cells (%)
Multiplexing gain for different locations, for different mix of office and residential cells
London
New York
Hong Kong
China Mobile
China Mobile,simulated
Figure 3.15: Multiplexing gains for different locations based on daily traffic distributionsbetween office and residential cells. Data from China Mobile and Ericsson.
Project 5 explores the most optimal cell mix from project 4. Similar values (1.5 -1.7) can be observed for project 4, with 57.6 s and 100 s averaging. For longer averag-ing in project 5, the multiplexing gain value 1.6 matches the value 1.6 from project 4,despite different application definitions and mixes. Therefore it can be concluded thatmultiplexing gain coming from the tidal effect equals to 1.0 - 1.33. The value is rathersmall, therefore enabling multiplexing gains should not be treated as the main reason tointroduce C-RAN, rather an additional benefit on top of advantages mentioned in Section2.2. However, there are cells with occasional traffic load, like stadiums, that will greatlybenefit from multiplexing gains. Therefore C-RAN is beneficial for such deployments ona local scale, smaller than metropolitan scale.

78 Chapter 3. Multiplexing gains in Cloud RAN
3.5.3 Impact of the functional splitFor BB-RF split multiplexing gain can be observed only on a BBU pool. On the fronthaullinks data is constant bit rate, therefore no multiplexing gain can be observed. For thefunctional splits, where fronthaul traffic is bursty, like UE-Cell split, multiplexing gaincan be achieved also on the fronthaul. In both cases values of multiplexing gain reach 2 -6.
3.5.4 Impact of the modelValue of the multiplexing gain close to 5 is obtained for 1 s averaging for three differentprojects - 1, 3 and 5 - despite the fact that the first is based on backhaul traffic includingwhole LTE protocol stack, the second is based on very simple traffic generation and thethird covers aggregation of traffic streams on the MAC layer. It is interesting that a verysimple traffic aggregation model gave similar results as the advanced LTE model. Thissimilarity shows that for analyzed scenarios protocol processing had little impact on thetraffic characteristics. Probably there was little need for e.g. retransmissions.
3.5.5 Impact of the methodAll the analysis presented in this chapter (Sections 3.2 - 3.4) is done using a methodologydescribed in Section 3.1 observing properties of aggregated traffic. The tidal effect,application burstiness and protocol processing (for 3.3 - 3.4) are modeled.
In [41], Werthmann et al. show results of a simulation study using a different approach- analyzing compute resource utilization, in GOPS, for different number of sectors aggre-gated into a BBU pool. Dimensioning the hardware according to the 99%-th percentileof the compute load at a system load of 60%, the aggregation of 10 sectors would gain9%, 20 sectors would gain 20% and 57 sectors would gain 27%, which correspondsto multiplexing gain of 1.09 - 1.37 according to definition presented in equation 3.2.Authors modeled in detail radio network, computation resources as well as locations ofusers. However, their traffic model does not take the tidal effect into account. It would beinteresting to run this traffic definition in model presented in Section 3.4 to compare thebaseline scenario, without the tidal effect.
On the contrary, in [40] Namba et al. presents an estimation of the multiplexing gainof C-RAN based on the population of the Tokyo metropolitan area. Authors concludedthat up to 75% of BBUs can be saved (corresponding to multiplexing gain 4). It is anapproximated result as no traffic is taken into account and the assumption is that BBUscorrespond to population rather than area the cells cover.
All those three studies are very different in their nature and assumptions. Interestingly,the results presented in Sections 3.2 - 3.4 fit the rage of 1.1 - 4, reaching the value up to 6only because of traffic profile definition.

3.5. Discussion and verification of the results 79
3.5.6 Simplifications and assumptions in modelingAs in every modeling work, only some aspects of the system could be captured. C-RAN protocol stack is a complex system, especially when several functional splits areconsidered. Implementing BBU pool with a full LTE protocol stack is challenging asit requires e.g. complex algorithms for scheduling traffic to many cells and how theprocessing of this data is handled by various BBUs in the pool, HARQ implementationfor the pool. This section aims at listing the assumptions made and how do they limit theresults.
3.5.6.1 Protocol stackThe results reported in Section 3.2.2 do not include any protocol processing, while theresults reported in Sections 3.2.1, 3.3 and 3.4 include Ethernet protocol processing. Allof them resemble variable bit rate data. Actual data for UE-Cell split will be different,because control data will be present and user data will be processed according to the LTEprotocol stack. Applied modeling was an approximation in order to be able to use theavailable tools. OPNET was the key tool used in the thesis. It is an event-based simulationtool that is especially suited to model protocol interactions, however, it does not includephysical layer processing on bit level. There is a built-in model of an eNodeB, howeverPHY layer is not fully implemented there. Moreover, there is also no support for poolingthe baseband parts. This model could be potentially interfaced with Matlab, which canmodel PHY layer processing. However, as the PHY layer performance is implementationspecific and involves several parameters, such a model with again be an approximation ofa real life system. Additional challenge will arise on how to exactly split layers to modelUE-Cell split, how to organize scheduling, HARQ. Moreover, such a complex model willtake a lot of time to run. Based on those factors data is generated and sent as Ethernetpackets. Such data streams better represent backhaul traffic and it is an approximation tomodel fronthaul traffic with them.
3.5.6.2 MethodologyIn modeling work the traffic aggregation properties were observed. In fact, they referto the multiplexing gain on transport resources. In order to truly evaluate pooling gainactual computational resources will need to be modeled. Each of the LTE protocol stacklayers requires different amount of GOPS, that will scale differently depending on theuser activity. Moreover, in C-RAN an additional functionality will need to be in place, e.g.orchestrator, to enable multiplexing gains on BBUs. Full LTE BBU pool implementationwill enable a more detailed evaluation of those resources. Lastly, modeling of actualpower consumption will give a better insight on possible power savings.

80 Chapter 3. Multiplexing gains in Cloud RAN
3.5.6.3 Time scale resolutionTraffic measurements in the PhD projects are taken every 10ms - 1h, therefore they donot fully reflect possible traffic peaks that can happen in real time networks. Traffic inLTE is scheduled for each sub-frame - 1 ms. Therefore to observe traffic peaks resourceswould need to be measured every 1 ms. In project 5., due to the fact that time averagingwas applied, the information on traffic peaks is reduced. The results sense what is themaximum value of multiplexing gain if QoS is compromised. The only case where theresults could be applicable is if they are measured every few ms - then they would definegains in traffic-dependent resources.
3.5.6.4 Control/user planeIn all the work in PhD project only user plane was considered. Resources neededfor control plane processing were not evaluated. Results on PGprocessing and therebyPGpower will be affected when the control plane is included.
3.5.7 ConclusionsBased on the analyzed data set, in a typical, real-life mobile network, with a mix ofconstant bit rate and bursty traffic, multiplexing gain on traffic-dependent resources inrange of 3 - 6 can be expected.
The contribution to the multiplexing gain that C-RAN as such enables on a metropoli-tan scale is between 1.0 and 1.33, depending on the cell mix. Such a multiplexing gaincan be obtained on a BBU pool for all functional splits. To enable higher gains, cells withoccasional traffic, like stadiums, should be included in the BBU pool.
However, for the functional splits above UE-Cell, where fronthaul carries variable bitrate data, multiplexing gain 3 - 6 can be achieved on the fronthaul links. This is a strongmotivation to investigate and deploy other functional splits than the traditional one, whereall the baseband processing is done in the pool.
3.6 Future work
This studies concentrated on multiplexing gain that is dependent on user traffic. As thereare parts of base station that need to be on to provide coverage, even when no users areactive, it would be beneficial to study overall multiplexing gain including those modules,too.
3.7 Summary
C-RAN is seen as a candidate architecture for 5G mobile networks because of the cost andperformance benefits it offers. Due to the fact that securing fronthaul capacity to deploy

3.7. Summary 81
fully centralized C-RAN can be costly, a careful analysis of cost and energy savings fordifferent functional splits is of great importance.
Multiplexing gain observed from traffic aggregation approximates possible gains onaggregation transport links. Such a multiplexing gain is proportional to power savingsand processing resources savings only on parts of the BBU pool responsible for user-processing functionalities of data-plane processing. However, as exact power and costmodels are complex in the analyzed scenarios, the results present only an approximation.Gains in power consumption and pooling gains will be lower than the multiplexing gain.
Pooling gains on processing resources can be achieved only on user-processingresources, which are a fraction of overall signal processing resources - 3-12% on downlink,17-33% on uplink.
Concerning power savings, 2-24% of total base station power consumption is spendon baseband signal processing. Multiplexing gain can be achieved on user-processingmodules, which constitute a fraction of these resources - 3-12% on downlink, 17-33% onuplink.
As only a fraction of resources are impacted by pooling gains, those gains should notbe a priority in designing new functional splits. However, a variable bit rate functionalsplit reduces needed bandwidth and enables multiplexing gains on the fronthaul network,which is an important motivation.
Gains in transport are the closest to derive from multiplexing gain value, however, ac-tual traffic patterns in fronthaul network for UC-Cell split will be different than simulatedwhen the LTE protocol stack is included.
Such a lack of the full LTE protocol stack is a major simplification in the modelingwork. Others include: methodology based on traffic throughput measurements, not smallenough time scale of measurements, and lack of control plane considerations. A fullLTE protocol stack BBU pool implementation will enable more precise measurements onpooling gains on baseband resources as well as multiplexing gain on fronthaul link forvariable bit rate splits. As energy and cost savings are related to the multiplexing gain, inthis study the multiplexing gain is evaluated for different functional splits. Multiplexinggains on throughput-dependent functionalities of a base station are calculated for differentC-RAN functional splits: BB-RF and separating user and cell specific functions using fourdifferent approaches. For given traffic definitions, a quantitative analysis of multiplexinggains is given. However, the results are sensitive to the traffic profiles as well as to themultiplexing gain calculation method. Therefore the main outcome of this study is toprovide the trend lines that will facilitate finding an optimal trade off when fronthaul orBBU resources are more costly for an operator.
For fully centralized C-RAN - with BB-RF split - maximum multiplexing gain onBBU resources can be achieved. However, the required fronthaul capacity is the highest.Therefore this split is vital for operators with access to a cheap fronthaul network. Addi-tionally, if the traffic load is high, the operator will mostly benefit from the multiplexinggain at the BBU pool.

82 Chapter 3. Multiplexing gains in Cloud RAN
The more functionality is moved from the BBU pool to the cell site, the lower themultiplexing gain on the BBU pool. However, when traffic starts to be variable bit rate, amultiplexing gain on the fronthaul links can be achieved, lowering the required capacity.Hence, for low traffic load, and even more for bursty traffic, the BBU pool should onlyhave higher layer processing and then the requirements on the fronthaul link can berelaxed.
An initial evaluation concludes that up to 1.3 times fewer BBUs are needed foruser data processing in C-RAN compared to a traditional RAN looking at daily trafficdistributions between office, residential and commercial areas. This number grows to 4when taking into account specific traffic patterns, making assumptions about the numberof base stations serving different types of areas. The latter model does not includemobile standard protocols processing. After including protocols processing the statisticalmultiplexing gain varied between 1.2 and 1.6 depending on traffic mix, reaching the peakfor 30% of office and thereby 70% of residential base stations, enabling savings of 17% -38%.
The application level delays are verified for different aggregated link bit rates andthereby it is concluded what is the practical value of the multiplexing gain that can beachieved. Rules of thumb for network/BBU dimensioning are proposed based on theCDFs of throughput. The more video traffic is present in the network, the delays are moresensitive to the aggregated link bandwidth, what influences achievable multiplexing gain.
A high impact on the multiplexing gain value is observed depending on the multi-plexing gain calculation method, i.e. using different throughput averaging windows. Theresults vary between 1.0 and 6. The multiplexing gain that C-RAN in traditional, BB-RFsplit solely enables due to the tidal effect is between 1.0 and 1.33 depending on the cellmix, thereby enabling savings of up to 25%. The major contribution to the numbers higherthan 3 comes from traffic burstiness, and in order to benefit from it on the fronthaul links,functional splits that result in variable bit rate on the fronthaul need to be in place.

CHAPTER 4Towards packet-based fronthaul
networksWhile the connection between RF and BB parts in a traditional base station was just aninterface in one device, in a base station with RRH it often spanned few meters betweenRRH and BBU in a point-to-point connection, up to the distance from the basement tothe rooftop. For C-RAN it is beneficial to connect sites from a metropolitan area, whichrequires a whole network to support those connections. This network is called fronthauland spans between cell sites, traditionally equipped with RRH up to the centralizedprocessing location, traditionally equipped with BBU pool.
High capacity requirements on fronthaul are seen as one of the major deal-breakersfor introducing C-RAN. Therefore, a thorough analysis of fronthaul requirements as wellas solutions to optimally transport data are of high importance, which is reflected innumerous standardization activities, referenced throughout the chapter.
As introduced in Section 2.4, several solutions can be used to organize transport inthe fronthaul network, such as: point to point, WDM, WDM over PON, microwave oftencombined with compression, OTN and Ethernet. This chapter elaborates on the fronthaulrequirements (Section 4.1) as well as presents a proof of concept of CPRI/OBSAI overOTN transport (Section 4.2). Moreover, it motivates using Ethernet for fronthaul (Section4.3) as well as explores challenges and possible solutions to deliver synchronization(Section 4.5 and 4.6) and fulfill delay requirements for a packet-based fronthaul network(Section 4.7 and 4.8). Furthermore, it presents a demonstration of Ethernet fronthaul builtin this project (Section 4.9) as well as future directions (Section 4.10). Finally, Section4.11 summarizes relevant standardization activities, while Section 4.12 summarizes thechapter.
The material presented in Sections 4.3-4.6 was originally published in [15]. It wasexpended and updated for this dissertation.
4.1 Requirements
This section elaborates on throughput, EVM, delay, jitter and synchronization require-ments that fronthaul network needs to support in order for a mobile network to workaccording to 3GPP specifications.
83

84 Chapter 4. Towards packet-based fronthaul networks
4.1.1 ThroughputAs introduced in Section 2.3.1 a popular LTE cell configuration (2x2 MIMO, 20MHz) willrequire 2.5 Gbps capacity on the fronthaul link, provided that IQ samples are transmittedusing CPRI. For higher bandwidth and more antennas this requirement will scale almostlinearly 1. With the UE-Cell split this throughput can be reduced to 498 Mbps, 700 Mbps[46] or 933 Mbps [148], depending whether 7, 10 or 16 bit sample width is used. [46]assumes 7 bits for DL, 10 bits for UL, while [148] reserves 16 bits. With MAC-PHYbandwidth can be further reduced to 152 Mbps for DL [148].
4.1.2 EVMFronthaul network may introduce errors in data transmission. EVM defines how much thereceived signal is distorted from the ideal constellation points. No matter the fronthaularchitecture, general requirements for LTE-A need to be observed for different modulationschemes on the main data bearing channel (Physical Downlink Shared Channel (PDSCH)):Quadrature Phase Shift Keying (QPSK), 16 QAM and 64 QAM, as listed in Table 4.1.
Table 4.1: EVM requirements for LTE-A [[81], Clause 6.5.2]
Modulation EVMQPSK <17.5%
16 QAM <12.5%64 QAM <8.0%
4.1.3 DelayA HARQ is a process that poses the most stringent delay requirement for LTE-A. Asa retransmission mechanism, it takes part in error control and correction. Accordingto the LTE-A standard, for FDD the HARQ RTT Timer is set to 8 subframes (8ms)[170], which means that the user using subframe n needs to know whether retransmissionor transmission of new data should occur at subframe n + 8, as illustrated in Figure4.1. Due to the timing advance, the user sends data ahead of time compensating for thepropagation delay, in order to fit into the subframe structure at the base station. It appearsto be an industry standard that a base station needs to prepare a HARQ acknowledgment(ACK)/non-acknowledgement (NACK) within 3ms [20], [171], [172]: decode UL data,prepare ACK/NACK and create a DL frame with ACK/NACK. Only then will the userreceive a ACK/NACK in the 4th subframe after sending the data, 3ms processing time atUE can be accommodated, and a possible retransmission can occur during 8th subframe.If a user will not get ACK/NACK it will retransmit the data in 8th subframe. This 3msdelay budget is spent on BBU and RRH processing as well as UL and DL fronthaul delay,
1For CPRI line bit rate option 7A (8110.08 Mbps) and above a more optimal 64B/66B line coding can beused instead to 8B/10B

4.1. Requirements 85
leaving 100-200 µs [20]/220 µs [46]/ 250 µs [148], [173] for fronthaul one way delay orin other words 200-500 µs Round Trip Time (RTT). Otherwise throughput will be lowered[148]. Section 4.10 discusses possible future directions for the HARQ requirement.
RRHUE BBU
DataPropDel
UE processing
≤3ms
TxRx TxRx
NACK/ACK
1st Rtx/Data
PropDel
BS processing
≤3ms
n subframe
n+4
n+8
8ms HARQ timeout
Data
NACK/ACK
BBU processing
≈ 2.5ms
1 subframe 1ms
FHULDel
FHDLDel
Figure 4.1: Delays associated with the UL HARQ process. PropDel - propagation delay, Rtx- retransmission, FHULDel - Fronthaul UL Delay
Looking at Metro Ethernet Forum Classes of Service for mobile backhaul, Class"High" backhaul could be reused for fronthaul (frame delay 6 1ms) [174] or a new classcould be specified looking at lower delays, in the order of 100 µs.
4.1.4 JitterNowadays BBUs and RRHs read the delay at the bootup time, therefore the delay needsto be constant. This requirement can be relaxed by buffering the data, however, this willbe done at the cost of a higher delay.

86 Chapter 4. Towards packet-based fronthaul networks
4.1.5 SynchronizationA proper synchronization is essential for mobile network operation. In order for a RRHto modulate the data to a particular frequency it needs to know the precise definition of1 Hz. It is important to keep the carrier frequency sharp in order for the signal comingfrom the base stations operating in a different frequency band not to overlap and for theUE to be able to receive it. For successful TDD network operation, the RRH needs tofollow time frames precisely in order for DL and UL frames not to overlap. Two typesof synchronization can be differentiated: frequency and phase (time) synchronization.Clocks are synchronized in frequency if the time between two rising edges of the clockmatches. For phase synchronization, rising edges must happen in the same time, as shownin Figure 4.2.
Δt
Δt
Frequency synchronization Frequency and phase synchronization
Figure 4.2: Frequency and phase synchronization
In Table 4.2 the requirements that need to be observed for various network features,like Time-Division Duplex (TDD), Frequency-Division Duplex (FDD), MIMO, CarrierAggregation (CA), eICIC and CoMP are summarized. For latter three, the requirements areexpressed relatively to a common reference between the cells/streams involved, otherwisethe maximum deviation from an ideal source is listed. Moreover, for Enhanced 9-1-1services, FCC requires the localization accuracy to be within 50 meters [175], whichrequires synchronization in the 100 ns range [176].
Taking the example of ±50 ppb frequency synchronization requirement it is worthnoticing that only one-third of this budget, i.e. ±16 ppb is available for the frequencyreference used for the radio frequency synthesis [177], therefore this is the requirementon frequency accuracy delivered over the network. The rest of this budget is consumedwithin the RRH. The reference requirement of ±50 ppb dates back to GSM networks[178]. It results from the need to compensate for the Doppler effect for high mobilityusers and allow for some frequency error tolerance for the receiver at the user side [179].It is forecasted that for 5G networks this requirement will be even tighter [180].

4.2. OTN-based fronthaul 87
Table 4.2: Summary of timing requirements for LTE. BS - base station
Feature Frequency TimeLTE-A FDD ±50 ppb (wide area BS)
±100 ppb (local area BS)±250 ppb (home BS) [[81],Clause 6.5.1.1]
–LTE-A TDD ±5 µs (cell with radius >
3km)±1.5 µs (cell with radius ≤3km) [[82], Clause 7.4.2]
MIMO, CA ≤ 65ns [[81], Clause6.5.3.1]
eICIC ±1 µs [181]CoMP ±1.5 µs [181]CPRI ±2 ppb [Req. R-18 [33]] ±16.276 ns [Req. R-20 [33]]911 call localization 100 ns [176]
4.2 OTN-based fronthaul
OTN can be found in many fiber network deployments and can be reused to enableC-RANs. Mapping of CPRI/OBSAI bit streams over OTN is done over low level ODUcontainers as specified in ITU-T G.709/Y.1331. The main challenges of transmittingCPRI/OBSAI over OTN is to limit the frequency error introduced while mapping andde-mapping CPRI/OBSAI to OTN. Moreover, the signal must not be deteriorated tomaintain its characteristics. Deterministic awareness of the delays through each hop needsto be maintained (not covered in this work).
- OTN is a standard proposed to provide a way of supervising client’s signals, assurereliability as well as achieve carrier grade of service.
- OTN is a promising solution for optical transport network of C-RAN when existingOTN legacy network can be reused for C-RAN fronthaul connecting RRHs to theBBU Pool.
- OTN provides FEC allowing the transport of client signals like CPRI in noisyenvironments or over longer distances.
- OTN supports both wavelength- and time-domain multiplexing maximizing thebandwidth utilization of the fiber network.
OTN-based fronthaul was experimentally verified by connecting a Base Station Emu-lator (BSE) and a RRH provided from MTI Radiocomp to an OTN compliant client-to-OTU2 Mapper and Multiplexer from Altera using both CPRI and OBSAI bit streams atdifferent rates (2.4576 Gbps and 3.072 Gbps, respectively) carrying LTE traffic. It wasobserved that carrier Frequency Error and EVM changes are within Third Generation

88 Chapter 4. Towards packet-based fronthaul networks
Partnership Project (3GPP) specifications for LTE-Advanced. It was a very useful exercisetowards understanding frequency error and EVM. More details about those measurementscan be found in Appendix A.
4.3 Motivation for using Ethernet-based fronthaul
The traditional view on the C-RAN architecture is to connect multiple RRHs to the BBUPool, each using a dedicated fiber connection to carry IQ data, as shown in Figure 4.3(a).Traffic is delivered using a constant bit rate protocol - CPRI, or the less popular OBSAI.Following up on author’s earlier work presented in Chapter 3, in order to decrease thecost of fronthaul network and a BBU pool, a packet-based fronthaul was proposed, wherevariable bit rate data from the new functional split can be transported in packets, as wellas cells from residential and office areas can be dynamically associated to different poolsto maximize multiplexing gain. The proposed architecture is shown in Figure 4.3(b).In order to further optimize the cost, fronthaul network could utilize widely-deployedexisting Ethernet deployments so that IQ data shares resources with other types of traffic.Moreover, Ethernet enables traffic aggregation and switching and should be cheaper thane.g. deploying WDM networks.
Packet-based fronthaul architecture is of high interest for industry.
• NGMN performed initial analysis of functional splits, which included variable bitrate fronthaul, which can be most optimally transported in packet-based manner[68].
• NGFI working group is under preparation at IEEE [180] aiming at standardizing newfunctional split decoupling the fronthaul bandwidth from the number of antennas,decoupling cell/UE processing, focusing on high-performance-gain collaborativetechnologies as well as reliable synchronization and data transport in packetizednetworks [182], [46].
• In October 2014 the 1904.3 Task Force [183] has been started in IEEE to standardizea transport protocol and an encapsulation format for transporting time-sensitivewireless (cellular) radio related application streams in Ethernet-based transportnetworks. The new standard will be called “Standard for Radio over EthernetEncapsulations and Mappings”. Both CPRI and any other functional split can besupported. The standard is also independent on the synchronization solution. Thescope of the standard is as follows:
- encapsulation of IQ data to Ethernet packets, both in terms of a header formatand actual CPRI streams to Ethernet packets mapping,
- defining a protocol that enables multiplexing of several streams,- defining a protocol that supports sequence numbers/timestamps to allow the
received data to be played back keeping original timing,

4.3. Motivation for using Ethernet-based fronthaul 89
Access network - fronthaul
Aggregation network - backhaul
BBU Pool
CPRI / OBSAI
RemoteRadio Heads
(a) Traditional C-RAN architecturewith a dedicated line to each RRH.
CPRI / OBSAI
Aggregation network - fronthaul
Aggregation network - backhaulRemote
Radio Heads
IQ over Eth
CPRI2EthGateways
BBU Pool
(b) C-RAN with packet based fron-thaul.
GPS, 1588, ect
RRH
CPRI
Sync delivered together with data (CPRI)
BBU
(c) Synchronization in a traditionalfronthaul.
GPS?, 1588?, new solution?
Variable delay
RRH++
BBU Pool++
New Sync solution needed
(d) Synchronization in a packet-based fronthaul.
Figure 4.3: Traditional and discussed C-RAN architecture together with principles of derivingsynchronization for them
- a control protocol for link and endpoint management.
The use cases of IEEE 1904.3 cover both legacy RRH and BBU as well as Ethernet-based RRH and BBU. The first version of the standard is planned for May 2017.IEEE 1904.3 will be referred to as 1904.3 later on in the text.
• CCSA founded a project to study the requirements, scenarios and the key technolo-gies for next-generation fronthaul [180].
• Fronthaul is an essential topic in recently founded ITU-T IMT-2020 Focus Group,which looks into how to support synchronization for NGFI [180].

90 Chapter 4. Towards packet-based fronthaul networks
4.4 Challenges of using packet-based fronthaul
In the traditional C-RAN architecture synchronization and timely delivery of traffic areensured by using a synchronous protocol - CPRI, or the less popular OBSAI. Today’smobile technologies, especially LTE-A, require high accuracy in terms of frequency andphase for proper transmission. By using C-RAN, these requirements are extended to thelink connecting the RRH and the BBU Pool, and thereby to the Ethernet. It is not in thenature of Ethernet to be synchronous, which conflicts with CPRI. The main challenge isthen to find a method of assuring synchronization and latency across Ethernet meeting thedemands of LTE-A, which this section focuses on.
Secondly, in packet-based network queues in the switches can be expected whichmakes it challenging to support tight delay and jitter requirements detailed in Section 4.1.
Sections below explain those challenges in more detail as well as propose solutions toaddress them.
4.5 Technical solutions for time and frequency delivery
4.5.1 Synchronization todayIn current networks BBU is typically equipped with a high precision clock having the timesource in form of Global Positioning System (GPS) or IEEE 1588 Precision Time Protocol(PTP) [184] possibly supported by SyncE, as shown in Figure 4.3(c). Currently deployed,and considered in this dissertation, is the second version (v2) of the protocol, also referredto as IEEE-2008. Later in the text, IEEE 1588 v2 will be referred to as 1588. GPS and1588 can deliver both frequency and phase synchronization, while SyncE can only deliverfrequency synchronization. Therefore, SyncE is often used as a complementary solutionto GPS or IEEE 1588 to enhance frequency accuracy. RRH gets precise time informationvia CPRI link, where timing information is included together with a data stream.
4.5.2 Synchronization in the futureIn the future, a fronthaul link might be multipoint-to-multipoint with packet-based trans-port which will affect synchronization. A comparison between the synchronizationsolution used today and a scenario for the future is illustrated in Figure 4.3. Especiallychallenging in Ethernet networks is the fact that packets will experience variable de-lays passing through the switches. Moreover, the Ethernet switches themselves haveuncertainty of their internal clocks in the order of ±100ppm [[185], clause 22.2.2.1] andintroduce a timestamping error, that influences 1588 performance. The timestamping errordepends on the switch clock frequency and the delay introduced in the de-serializationcircuit, and can be reduced, if the delay in the de-serialization circuit can be estimated.
To use legacy RRHs, a CPRI2Eth gateway is needed to bridge the Ethernet andCPRI domains. For future RRHs (RRHs++) the Ethernet link could terminate at theRRH, omitting CPRI. A possible solution for delivering synchronization is to equip the

4.5. Technical solutions for time and frequency delivery 91
CPRI
1588
RRH BBU Pool
Frequency error requirement: ±50ppb (Wide Area BS).±250ppb (Home BS).Cell phase synchronisation requirement: ±5µs between to overlapping cells ≤65ns between MIMO signals
Radio, LTE-A TDD
Inhibiting factors in nodes:· Local Oscillator phase &
frequency noise, up to ±100ppm· Queueing in Eth switches
Performance affected by· Variable queueing delay· Timestamping error: +1ns/
+4ns
Ethernet
Ethernet clock accuracy defined as ±100ppm.Realistic values are ±1ppm.
R-18: Maximum jitter contribution from CPRI link to RRH: ±2ppb.R-20: Round trip absolute accuracy: ±16.276ns.
1588 Slave
1588 Master1588
Transparent Clock
CPRI2EthGW
IQ Data
1588 packets
Switch
Eth Eth
1588
IQ
Eth
1588
IQ
1588
CPRICPRILTELTE
CPRI Data
Note: switch may not support 1588, leading to bigger timing recovery
errors
3ms Round Trip Time latency allowed, 200-500us RTT left for fronthaul link
GPS
Figure 4.4: Model of the requirements and factor introducing uncertainties in LTE, CPRI,1588 and Ethernet layers.
CPRI2Eth gateways or the RRHs++ with GPS. This solution assures both frequency andphase delivery. However, it increases the cost, spent not only on GPS equipment but alsoon an oven-controlled oscillator. Moreover, the coverage indoors and in metropolitanvalleys (small cell on a lamp post between high buildings) will be problematic. For someoperators it is also important not to depend on a third-party solution for their network.Another solution could be to implement a 1588 slave in the CPRI2Eth gateways or inthe RRH++. This solution assures lower equipment cost, however, it will be affected byvariable network delay present in Ethernet networks. Ashwood [186] shows that such ajitter, when the background traffic is present, can be in the order of µs per Ethernet switch.
The architecture considered is presented in Figure 4.4. Ethernet packets are sentfrom the BBU through the network of switches to reach the CPRI2Eth gateway. Theyare repacked there to CPRI stream to reach legacy RRHs. Alternatively, Ethernet RRHscan be used, omitting CPRI. A packet-based solution - IEEE 1588 - is used to assuresynchronization with a 1588 master present in BBU Pool and a 1588 slave present inCPRI2Eth gateway. Figure 4.4 summarizes requirements on different layers: LTE, CPRIand Ethernet as well as factors introducing inaccuracies in 1588 and Ethernet layers.In the section below a feasibility study of using 1588 for timing delivery is performed.The modeling work takes into account the factors influencing the performance of 1588

92 Chapter 4. Towards packet-based fronthaul networks
mentioned in Figure 4.4. A dedicated Ethernet network was taken into account, leavingfor future work the case of sharing Ethernet infrastructure with other types of traffic.
It is worth noticing, that the requirements need to be fulfilled on two levels:
- delay requirements,
- frequency accuracy requirements,
where the delay of synchronization packets lies between them, as 1588 helps to recoverthe clock, but is affected by network delays, as emphasized in Figure 4.5.
Delay
Clock recovery
Delay of 1588 packets
Figure 4.5: Time related requirements on a fronthaul network
4.6 Feasibility study IEEE 1588v2 for assuring synchronization
The 1588 standard defines a set of messages (Sync, DelayReq (delay request) andDelayResp (delay response)) for an end-to-end operation in order to exchange a set oftimestamps between master and slave clocks as shown in Figure 4.6. The master clockneeds a precise time definition e.g. from GPS and then propagates this timing informationto the slaves. Timestamp t1 is inserted into the Sync message when it leaves the masternode, t2 is noted when the message arrives to the slave. In the model, each time Sync andDelayReq messages pass through an Ethernet switch (working as a 1588 TransparentClock (TC)) the value of CorrectionF ield (CFS and CFD, respectively) is updated forthe residence time as presented in the Equation (4.1). Recording residence time is veryimportant as variable traffic in packet-based networks will fill-in the queues leading tovariable network delay for 1588 packets, thereby affecting time reference arriving at theslave. In response to the Sync message slave sends the DelayReq noting down when the

4.6. Feasibility study IEEE 1588v2 for assuring synchronization 93
message leaves the node - timestamp t3. The master node notes the time when it receivesthe message - t4 and sends it to the slave via the DelayResp message. Based on thosetimestamps, the delay and offset between the clocks can be computed as shown in theEquation (4.2) and (4.3), respectively. It can be observed that the messaging of the timestamps from the 1588 master to the slave is a feed forward messaging algorithm. Moreinformation on the 1588 operation can be found in [187].
Timestamps known by
slave
Sync
Delay Req
t1
t2
t3
t4
t1, t2, t3,CFS
t1, t2, t3,t4,CFS,CFD
MasterTCSlave
Delay Resp
CFS
CFD
Figure 4.6: Visual representation of 1588 operation.
CF = EgressT imestamp− IngressT imestamp (4.1)
Delay =(t2 − t1) + (t4 − t3)− CFS − CFD
2(4.2)
Offset =(t2 − t1)− (t4 − t3)− CFS + CFD
2(4.3)
A protocol stack of the suggested solution is shown in Figure 4.7. Here the relevantprotocols when CPRI traffic is transmitted over Ethernet using 1588 are shown.
The crucial aspect in implementing 1588 functionalities is to execute timestampsgeneration as close as possible to the moment when each packet enters/leaves each node.It is important that the timestamp t1 is taken exactly when the Sync message leavesthe Master node, t2 when the Sync message enters the Slave node etc. Otherwise,the variable internal processing time of the packets will affect the measurements. Itis especially important in case of Ethernet switches, as a variable residence time isexpected, depending on variable traffic queuing up in the switches. Therefore, for thecorrection fields ingress and egress timestamps should be taken as soon as the packetenters and leaves the node, respectively, as shown in Figure 4.8 in order to compute theCorrectionF ield value precisely.

94 Chapter 4. Towards packet-based fronthaul networks
L1
L2
IP
UDP
S1-U
Eth PHY
MAC
RLC
BBU
Radio L1
RRH
PDCP GTP-U
Relay
RRH
Radio L1
MAC
RLC
IP
PDCP
UE LTE-Uu
Application
L2L1 CPRI
IQ over Eth
Eth switches
CPRI2Eth gateway
CPRI2Eth gateway
Eth switch
BBU Pool
1588 Master
1588 Slave
EtH PHY
CPRI
Eth MAC
Eth PHY
CPRI
Eth MAC
15
88
15
88
15
88
Eth MAC
15
88
Figure 4.7: Protocol stack of the examined network.
Eth switch
EthPHY
1588
Eth MAC
1588 messages Ingress
timestampEgress
timestamp
Figure 4.8: Ingress and egress timestamps should be taken as soon as Sync or DelayReqpackets enter and leave the node, respectively.

4.6. Feasibility study IEEE 1588v2 for assuring synchronization 95
The 1588 standard defines the establishment of a clock hierarchy and format ofmessages, so that the equipment from different vendors can communicate in the network.The standard gives an example on how to calculate the clock drift as presented in theEquation (4.4). However, the implementation of an actual synchronization algorithmlies outside of its scope and this can possibly give a competitive advantage to certainvendors over others in performance of their solutions. Various works have been publishedpresenting synchronization algorithms. Xie et al. in [188] propose to maintain two timescales in the slave: syntonous (frequency aligned) and synchronous (time and frequencyaligned). For delay calculations they use t2 and t3 measured in a syntonous time scale.They concluded that it is the most optimal to apply drift correction every third time theexchange of 1588 messages is completed. This way of drift calculation was implemented,as in Equation (4.5).
DriftStd =
=t2(N) − t2(0)
(t1 +Delay + CFS)N − (t1 +Delay + CFS)(0)(4.4)
DriftImplemented =
=t2(N) − t2(N−3)
(t1 +Delay + CFS)N − (t1 +Delay + CFS)(N−3)(4.5)
A network model in OPNET modeler was built checking the performance of thisalgorithm. OPNET is an event-driven simulation software, where a user can build hisscenario from self-defined nodes and processes. A network consisting of a 1588 Master,a 1588 Slave and a variable number of Ethernet switches working as 1588 transparentclocks was built. Sync and DelayReq packet rate is 64 packets per second (pps). Thenovelty of this work is a network view where the protocol was tested against variouserrors that can occur in the network. The slave node has an initial frequency drift of 1ppm or 100 ppm (maximum that an Ethernet switch can have). Each of the Ethernetswitches has a frequency error of 1 ppm or 100 ppm and timestamping error of 1 ns or 4ns. As it is not possible to measure the exact arrival time of a packet using the internalclock reference in the switch, a random timestamping error is introduced up to 1 ns and 4ns, respectively. The values mentioned above represent parameters of newer and oldergeneration equipment from the industry. The models follow the protocol stack fromFigure 4.7 on the link between the BBU and the CPRI2Eth gateways. 2.5 Gbps CPRItraffic was sent over a 10 Gbps Ethernet network. In between master and slave node 0-21Ethernet switches were put. The simulations were run for 10 minutes, while CPRI trafficwas sent after 30 s. 30 seconds were required to get the network operational with Ethernetswitching topology getting established.
For each exchange of 1588 messages, after all timestamps are gathered, delay, driftand offset are computed. Drift correction is applied to slave clock frequency fS every

96 Chapter 4. Towards packet-based fronthaul networks
third exchange of timestamps. That affects both synchronous and syntonous time scalesat slave having impact on t2(Syntonous) and t3(Syntonous). The synchronous time scaleof the slave is updated for the offset after each exchange of timestamps. That affects localtime at the slave tS . A relative frequency error between master clock frequency fM andslave clock frequency fS was measured, as presented in Equation (4.6) and an absolutephase error between time in master tM and time at slave tS as presented in Equation (4.7).
FrequencyError =fM − fSfM
(4.6)
PhaseError = tM − tS (4.7)
0.0
5.0
10.0
15.0
20.0
25.0
30.0
35.0
40.0
0 5 10 15 20 25
Max
imu
m e
rro
r (n
s)
#Switches
Phase error for different # of Eth switches (x) and different
timestamping errors (2 series)
1 ns
4 ns
Figure 4.9: Maximum phase error measured for various scenarios during stable operation.
Figure 4.9 presents the maximum observed phase (time) error during stable operation(after initial time discovery) for different numbers of the Ethernet switches present in thenetwork and two different timestamping error values. The phase error stays in the orderof nanoseconds and is highly dependent on timestamping errors. The dependency is closeto linear. The results are shown for the worst-case scenario of 100 ppm drift for both theEthernet switches and slave, as drift value had marginal effect whether it was 1 ppm or100 ppm in both cases.
Figure 4.10 shows the frequency error for the afore mentioned scenarios. The fre-quency error falls way above required values (16 ppm or below, depending on implemen-tation). It is also highly dependent on timestamping errors. That is the reason why theimprovements to this method were applied.
4.6.1 Improving the 1588 slave designIn order to improve 1588 performance, averaging to both offset and drift correction wasapplied. In that way if one of the packets experienced delay way longer than others, dueto e.g. queuing, this outrageous measurement will have lower impact on the slave clockadjustments. The method is presented in Equation (4.8) for the drift and applies also for

4.6. Feasibility study IEEE 1588v2 for assuring synchronization 97
0.0
100.0
200.0
300.0
400.0
500.0
600.0
700.0
800.0
0 5 10 15 20
Max
imu
m e
rro
r (p
pb
)
#Switches
Frequency error for different # of Eth switches (x) and different
timestamping errors (2 series)
1 ns
4 ns
Figure 4.10: Maximum frequency error measured for various scenarios during stable operation.
the offset. The frequency is adjusted by averaged drift computed taking only a fractionalvalue of currently computed drift - drift - and previously computed drift - driftPrev.The performance of the system for different values of alpha was checked, and it wasconcluded that the higher it gets, the lower frequency error is observed. However, forhigher values of alpha it takes more time for the system to converge to stable operation.For simulations alpha = 0.99 was used. After 180 s the system reached stable operation.The frequency error got significantly smaller for all the cases (20 times smaller), whilethe phase error got slightly smaller (2 times) as presented in Figures 4.11 and 4.12.
driftAvg = alpha · driftPrev + (1− alpha) · drift (4.8)freq = freq − driftAvg (4.9)
0.0
2.0
4.0
6.0
8.0
10.0
12.0
14.0
16.0
18.0
0 5 10 15 20 25
Max
imu
m e
rro
r (n
s)
#Switches
Phase error for different # of Eth switches (x) and different
timestamping errors (2 series) when drift averaging was applied
1 ns
4 ns
Figure 4.11: Maximum phase error observed during stable operation for various scenarioswith offset averaging applied.

98 Chapter 4. Towards packet-based fronthaul networks
0.0
5.0
10.0
15.0
20.0
25.0
30.0
35.0
0 5 10 15 20
Max
imu
m e
rro
r (p
pb
)
#Switches
Frequency error for different # of Eth switches (x) and different
timestamping errors (2 series) when drift averaging was applied
1 ns
4 ns
Figure 4.12: Maximum frequency error observed during stable operation for various scenarioswith drift averaging applied.
4.6.2 Presented results vs mobile network requirementsIt should be noted what the dependency between synchronization inaccuracies of a localoscillator and the inaccuracies of an RF signal is. As presented in Figure 4.13, anEthernet signal entering an RRH carries both the IQ baseband signal and 1588 packetscarrying timestamps. The 1588 module processes timestamps from Sync, DelReq andDelResp messages in order to calculate drift and offset of a clock. This informationserves as an input to the Phase-locked Loop (PLL) system. The PLL then controls thelocal oscillator. The baseband signal is processed to become an RF signal and the timinginformation is taken from the local oscillator. In Section 4.1, requirements for an LTE-ARF signal are outlined. In this work, the accuracy of 1588 inputs are studied. It isimplementation-specific how this will affect the PLL performance, the local oscillator andas a consequence, the inaccuracies of an RF signal. These factors should be taken intoaccount designing the clock recovery mechanisms. For the frequency up conversion fromthe local oscillator fLO to the RF frequency fRF , a scaling factor fRF
fLOwill proportionally
scale the frequency error (in the example in Figure 4.13 it is equal to 10).
4.7 Technical solutions for delay and jitter minimization
The sections above focus on evaluating synchronization challenges and possibility ofapplying IEEE 1588 to deliver clocking reference. On top of synchronization requirements,as stated in Section 4.1, fronthaul network needs to be able to transmit the data within100-250 µs, depending on BBU processing time. In this Section various factors affectingthe delay are analyzed. Moreover, two mechanisms: source scheduling and preemptionare presented, that aim at reducing delay and jitter. In the next Section a design of sourcescheduling algorithm and considerations on its implementation are presented.

4.7. Technical solutions for delay and jitter minimization 99
Low pass filter
IQ Baseband/CPRI
Packet selection and preprocessing
OscillatorEthernet
Ethernet2CPRI gateway combined with RRH
Results of this study
1/3 LTE-A requirements
LTE-A requirements
Time scale comparator
Local time scale
Figure 4.13: Clock recovery scheme inside an RRH combined with CPRI2Eth gateway. LO -local oscillator
Table 4.3: Delays in an Ethernet switch
Maximum Transmission Delay10 Gbps link, µs
SwitchingDelay, µs
Number ofswitches
MTU, B E.g.1500 3000 6000 9000
1 1.2 2.4 4.8 7.2 3.02 2.4 4.8 9.6 14.4 6.05 6.0 12.0 24.0 36.0 15.0
10 12.0 24.0 48.0 72.0 30.0
4.7.1 Analysis of the delay in Ethernet networkThe main challenge in enabling an Ethernet-based fronthaul is to keep the queuing delayas low and with as little jitter as possible.
The network delay has the following components, as illustrated in Figure 4.14:
- propagation delay – deterministic, 5 µs/km,
- switching delay – deterministic, for store-and-forward switches it is in the µs orderof magnitude, e.g. 3 µs in the switches measured, as presented in Section 4.9; forcut through switches will be shorter, in order of the ns,
- transmission delay – deterministic, depending on the packet size and link speed,examples for 10 Gbps Ethernet link are shown in Table 4.3,
- queuing delay – non-deterministic, depending on the load of the network.
The examples of delay budgets are defined in Table 4.4. Figure 4.15 shows thedependency between RRH-BBU distance, number and type of switches as well as MTU

100 Chapter 4. Towards packet-based fronthaul networks
RRH BBU Pool
CPRI2EthGW
3ms Round Trip Time latency allowed, 200-500us RTT left for fronthaul link
Propagation delay 5us/1km
Switching delay
RRH CPRI2EthGW
Queueing delay
Packet transmiss
ion (B)
Switch
010101011110101001001101001010
Computational delay
Packet reception
(B)
Figure 4.14: Delays in Ethernet-based fronthaul
Table 4.4: Exemplary delay budgets
# Total dis-tance, km
#switches
Type ofswitch
MTU Delay on 10 Gbps link, µs
1 20 10 store-and-forward
9000 100 + 30 + 72 + queuing =202 + queuing
2 10 10 cut-through
9000 50 + ns + 72 + queuing = 122+ queuing
3 10 5 cut-through
1500 50 + ns + 6 + queuing = 56 +queuing
size. It assumes no queuing delay. Figure 4.16 takes the best case (cut through switches,MTU 1500) and evaluates it for different queuing delay per switch.
If a dedicated Ethernet link is used for a fronthaul link, there will not be any queuingdelay. However, for multiplexing gains on links it is desired that many fronthaul streamswill share the link, possibly also with other types of traffic. Even if various fronthaulstreams will be given the highest priority, it needs to be assured they will not collide.Moreover, the lower priority packets should not slow down fronthaul packets if theyhappen to be under processing by a switch. The following two methods are aiming toaddress these problems and are currently under the standardization in IEEE:
1. Traffic scheduling - IEEE 802.1Qbv Bridges and Bridged Networks — Amendment:Enhancements for Scheduled Traffic [189]
2. Preemption – IEEE 802.1Qbu “Bridges and Bridged Networks – Amendment:Frame Preemption” [190]

4.7. Technical solutions for delay and jitter minimization 101
0
10
20
30
40
50
60
0 5 10 15 20
Dis
tan
ce, k
m
Number of switches
RRH-BBU distance assuming no queuing
CT MTU 1500
CT MTU 3000
CT MTU 6000
CT MTU 9000
SAF MTU 1500
SAF MTU 3000
SAF MTU 6000
SAF MTU 9000
Figure 4.15: Allowed distance between RRH and BBU for a total delay budget of 250 µsdepending on the number of switches in the network, MTU size and type of switch (SAF -Store and forward, CT - Cut through). Assumed queuing delay is zero.
0
10
20
30
40
50
60
0 1 2 3 4 5 6 7 8
Dis
tan
ce, k
m
Number of switches
RRH-BBU distance for various queuing
0 µs
20 µs
40 µs
60 µs
80 µs
Figure 4.16: Allowed distance between RRH and BBU for a total delay budget of 250 µsdepending on the number of switches in the network, MTU size and queuing delay per switch.CT switch, MTU 1500.

102 Chapter 4. Towards packet-based fronthaul networks
Both solutions belong to the TSN set of standards, which can be applied to anytime sensitive application. In April 2015 the Project Authorization Request (PAR) of anew standard was prepared - 802.1CM Time-Sensitive Networking for Fronthaul thataims at defining profiles that select features, options, configurations, defaults, protocolsand procedures of bridges, stations and LANs for the fronthaul applications [191]. Thesections below describe the source scheduling and preemption.
4.7.2 Lowering jitter using source schedulingWhen the fronthaul data needs to share the link with traffic with different priority, it needsto be assured that they will not collide. Moreover, when the Ethernet links will be sharedbetween many fronthaul streams it needs to be assured that they will not collide, either. Inorder to keep the fronthaul delay deterministic, it might be beneficial to delay the timewhen a single packet leaves the source, so that it will not collide with other packets inthe network. The ideas behind traffic scheduling are standardized in the IEEE 802.1Qbvspecification. However, they can be implemented by using any type of controllers e.g.SDN or control packets of IEEE 1903.4.
Case 1: one fronthaul stream (protected traffic), one or more other traffic streams(unprotected traffic) One approach to achieve that can be to assure that only onestream has access to the network at specific times (protected window, from T1 to T2 inFigure 4.17), in other words, the transmission for protected traffic is scheduled betweentime T1 and T2. However, in order to make sure that the unprotected traffic is notunder transmission while the protected one arrives, a certain guard band needs to bein place (T0-T1). The simplest solution would be to have a guard band equal to thetransmission time of the largest packet size supported by the network. That however, leadsto resource inefficiency, as the network could be unnecessarily idle. More optimally, theimplementation could check if there are any packets in the queues, whose transmissioncould end before the transmission of protected traffic. Unprotected traffic will be sent onthe best effort basis.
Start of a guard band
(T0)
Start of a protected
window (T1)
End of a protected
window (T2)
AB A
A
B
Protected traffic
B Unprotected traffic
time
Figure 4.17: Protected window, here for the fronthaul traffic

4.7. Technical solutions for delay and jitter minimization 103
Case 2: many fronthaul streams In this case it is not sufficient to schedule a protectedwindow when the fronthaul stream requests it, as many streams may collide, creatingvariable (and non-deterministic) delay due to queuing in the switches. In the fronthaulapplication it is important that the delay would be as stable as possible (low jitter) whilemaintaining the delay within the requirements. Traffic scheduling can be implementedalready in the sources and it is illustrated in Figure 4.18. Packets A and B initially wouldarrive at the switch at the same time and one of them will need to wait in the queue,therefore experiencing a non-deterministic delay. When one of the packets – here B - isinitially delayed its delay would be larger, but deterministic-predictable. It is especiallyimportant when packets are going through many switches and a non-deterministic delaywould create a big jitter.
A
BB A
A
BB A
No scheduling – B delay non deterministic
Scheduling – B delayed initially, delay deterministic
BBU pool BBU pool
Figure 4.18: Source scheduling used to reduce jitter. Here an example for UL
Case 3: many fronthaul streams and one or more other traffic streams (unprotectedtraffic) Traffic scheduling as described in the section above can be used between manyfronthaul streams. Unprotected traffic will be sent on the best effort basis.
Using gate opening to create protected windows The 802.1Qbv standard allows theimplementation of traffic scheduling by means of a gate opening. A sequence of gateopen/close operations can be scheduled for each port and traffic class, allowing eachtraffic class to be sent at a given time but be blocked at others. The schedule can bechanged periodically. A frame of a given class can be transmitted only if the gate is openand it will remain open long enough for the packet to be transmitted.
4.7.3 Lowering delay and jitter using preemptionEven if the packet has the highest priority, when it arrives at the switch there might beanother lower priority packet already under processing. In case jumbo frames are used, thedelay might be up to 7.2 µs on a 10 Gbps link. It is shown in the case for no preemptionin Figure 4.19. The low priority packet B is transmitted first and only then can the highpriority packet A be transmitted.
This problem can be addressed with preemption. With preemption a lower priority– preemptable – packet can be interrupted from a transmission when a high prioritypacket arrives. This scenario is show in a Figure 4.19: packet B is preempted, packetA transmitted and then transmission on packet B can be resumed. At the receiver end,

104 Chapter 4. Towards packet-based fronthaul networks
A
B
A
AB B
B
Input (high priority)
Input (low priority)
Output (no preemption)
Output (with preemption)
A
B
AB
AB B
Figure 4.19: Preemption
preempted packets are then merged. The technical details of preemption are describedin 802.3br Draft Standard for Ethernet Amendment: Specification and ManagementParameters for Interspersing Express Traffic [192].
This approach is especially useful when a fronthaul stream will share the network withother applications. It can optimize guard band size for scheduled traffic, as bigger parts ofthe packets can fit before gate closing. The smallest size of a preempted packet needs to benot smaller than 64 B, and thereby packets up to 124 B can be preempted. Alternatively,only with source scheduling the whole packets will need to wait for transmission, even ifthe switch would be free for some time. Therefore the capacity would be wasted. Withpreemption it is safe to allow a portion of the packet to be sent.
4.7.4 DiscussionAs can be seen from the delay analysis, it is possible to enable Ethernet-based fronthaulwithout TSN functionalities for dedicated links. However, as soon as more than onefronthaul stream will use the link, it is important to observe potential queuing delays.Source scheduling is a beneficial technique that requires intelligence only at the networkedges (CPRI2Eth gateway or Ethernet RRH), while the legacy switches can be used. Ifother services are supposed to share the network with the fronthaul streams, then the delaymay get even bigger. Preemption is a technique that assures timely delivery of higherpriority packets at the same time allowing other traffic to use the link whenever it is notcolliding with fronthaul packets.
If only preemption is enabled, than the delay can be kept deterministic for only onestream. For more streams algorithms minimizing the overall delay on the network levelwould need to be in place.
For fast networks (10+ Gbps) with low load TSN features are less significant.Wan et al. in [193] presents discrete-event based simulation results on transmitting
CPRI over Ethernet. The authors measured that for a tree topology network where eachtraffic stream went through 2-4 switches the delay was about 90 µs and the jitter was up to400 µs. When background traffic was inserted, the Ethernet with preemption performedsimilarly - delay was 91 µs and the jitter was 410 µs. However, with the schedulingalgorithm the authors proposed the performance was not consistent - in the majority of the

4.8. Source scheduling design 105
cases the jitter was removed, but in some grew up to 1000 µs. The authors recommend touse Ethernet with preemption and buffering at the edge.
Farkas et al. in [194] present other simulation results of CPRI over Ethernet transportwith TSN features. Without the TSN features in a tree topology comprised of 10 Gbpslinks, where each stream went through 1-3 switches, the switching delay was 1500 ns ±5 ns variation. For the scenario with background traffic, the jitter raised up to 3 µs, butwhen the preemption was enabled jitter stabilized in 100 ns level. With source schedulingthe jitter amounted to up to 50 ns. When source scheduling with 70 ns guard band wasadded on top of preemption the jitter was reduced to 0 ns. The delay for all the caseswas below 26 µs. Therefore it was shown in simulations that usage TSN standards and aproper network configuration the delay and jitter requirements for fronthaul can be met.
4.8 Source scheduling design
The previous section describes two approaches that are under standardization and can beused to reduce jitter and delays in Ethernet-based fronthaul source scheduling and preemp-tion. In this section source scheduling algorithm is proposed and several considerationson its implementation are presented.
4.8.1 Algorithm for reducing UL jitterThe 802.1Qbv standard defines a framework for implementing traffic scheduling. However,an actual algorithm when to open and close the gates, is left outside of it and is up to thenetwork configuration. The following algorithm is proposed for scheduling the trafficaiming at UL jitter reduction for fronthaul streams. It is optimized for symmetrical ULand DL, however, it can be used for any case when DL traffic is higher or equal than ULtraffic.
The use cases are for one BBU per network and for:
1. 4G - CPRI traffic packetized into Ethernet frames. Many streams could share onelink. The bit rate per each stream would be 2 Gbps instead of the original 2.5 Gbpswhen 8B/10B line coding is removed (Ethernet already implements error detectingcoding by means of Frame check sequence (FCS)),
2. 5G - Fronthaul data from one of the new functional splits sent in the Ethernetpackets. The bit rate per each stream would be between 150 Mbps and 2 Gbps,instead of a 2.5 Gbps CPRI. Optionally, for small cells the CPRI split can be used,as bit rates would be lower for small cells.
The BBU schedules the DL traffic to all the RRHs. The packets leave the output portof the BBU pool in order, which can be compared to virtual timeslots. For each packetreceived in DL, the RRH will send one UL packet. Therefore the UL packets will notcollide if they are sent with correct timing advance fitting the virtual timeslots prepared for

106 Chapter 4. Towards packet-based fronthaul networks
DL. At the RRH bootup, control packets will need to be exchanged to measure the delay,in a similar way in which timing advance is implemented in GSM. Figure 4.20 describesthe initial DL scheduling (left) and UL and DL packets fitting the virtual timeslots (right).
A
BA B
Switch BBU10 Gbps link
2 Gbps traffic
2 Gbps traffic
4 Gbps traffic
DLADL
BDL
ADL BDL
Switch BBU
DL
RRHs RRHs
BUL
AUL
BUL AUL
UL
timeA2 rcx
B1 rcx
B2 sent
A1 rcx
a) DL scheduling done by BBU b) UL scheduling follows DL scheduling
Figure 4.20: Source scheduling algorithm
In case more BBU pools are present in the network, a more generic solution will beneeded. The methods used for wavelength assignment in wavelength routed networks[195] can be exploited. In case the network will be shared by other, non-fronthaul servicesit is recommended to add the preemption functionality.
4.8.2 Design considerationsThe data need to be packetized into Ethernet frames. The choice of the optimal packetsize is a trade off between a lower overhead for bigger sizes and smaller impact on lost orcorrupted packet for smaller sizes. Figure 4.21 presents an overhead for various MaximumTransmission Unit (MTU) sizes starting from 128 B up to jumbo frame - 9000 B. Ethernetpacket overhead was considered; on Layer 1: preamble (8 B), Interpacket gap (12 B), onLayer 2: frame header (14 B) and FCS (4 B) without an 802.1Q tag, in total 38 B, as wellas 1904.3 overhead (10 B). For standard payload size of 1500 B the overhead is 3.2% andstays in the order of a few percent for higher sizes. Therefore 1500 B can be treated as acandidate packet size.
The algorithm described above can be implemented by means of control packets ofthe IEEE 1904.3. The framework given by IEEE 802.1Qbv can also be used.
The following procedure needs to be in place when RRH joins the network. Exampleimplementation using IEEE 1904.3 RoE D0.1 is provided.
1. Stream setup
a) BBU sends packet, notes the timestamp (T1)
• High priority,• RoE pkt_type =ctrl (000000b), subtype=Access_1

4.8. Source scheduling design 107
0%
5%
10%
15%
20%
25%
30%
35%
40%
0 2000 4000 6000 8000 10000
He
ade
rsSi
ze/P
aylo
adSi
ze
Payload size, B
Overhead
Figure 4.21: Ethernet L1 and L2 as well as 1904.3 overhead comparing to Ethernet framepayload size
b) Upon packet arrival RRH notes the time (T2), sends it back to BBU
• Low priority,• RoE ctrl, subtype=Access_2
c) BBU computes delay Delay=T2-T1 informs RRH
• Low priority,• RoE ctrl, subtype=Access_3
d) RRH acknowledges
• Low priority,• RoE ctrl, subtype=Access_4
2. Data transmission
a) BBU schedules traffic to the cell, sends it
• RoE pkt_type =data(000001b - 000100b or 100100b),
b) After receiving at least two packets m and m+1 at times Rcx(m) and Rcx(m+1),respectively, RRH measures receiving interval RcxInt = Rcx(m + 1) −Rcx(m)
c) Cell receives the traffic in time DLrcx, cell can send back the traffic in theearliest time in the future such that time DLrcx− 2 ·Delay + n ·RcxInt• RoE data
For the dependency between required RRH-BBU distance and allowed number ofswitches, the delay budget analysis presented in Section 4.7.1 applies.

108 Chapter 4. Towards packet-based fronthaul networks
4.9 Demonstrator of an Ethernet fronthaul
Previous sections described motivation for using packet-based fronthaul, associatedchallenges and solutions for meeting synchronization and delay requirements. Thissection presents a demonstrator of an Ethernet fronthaul that was built during this projectand that is capable of transmitting one fronthaul stream. Future extensions are possible toenable network sharing between many streams and other applications.
In a joint laboratory work with Alcatel-Lucent Bell Labs France a demonstrator ofan Ethernet-based fronthaul network was set up. A network consisting of 3 Ethernetswitches controlled by an OpenDaylight SDN controller (default application) was built aspresented in Figure 4.22. OpenFlow was used as a communication protocol. Two PCs, Aand B, were running Linux, distribution Ubuntu version 14.04. It is a part of a C-RANsetup shown in Figure 4.23.
The delay measurements were performed using two methods:
1. Differential ping, method proposed by Henrik Christiansen,
2. DPDK application.
10 G Ethswitches
A B
Controller
Loop connection for DPDK
Data, 10 G cables
Control, 1 G cables
Figure 4.22: Demonstrator of Ethernet fronthaul network
4.9.1 Delay measurements using differential ping methodA ping test was performed for 1-3 switches for packet of different sizes (0 - 8972 B). Thesample results are shown on Figure 4.24. The delay consists of the following factors, asintroduced in Section 4.7:
Delay = PropDel + SwitchDel + TransDel(B) + queuing (4.10)
Here the distance was within few meters, therefore:
PropDel ≈ ns (4.11)PingRTT = 2 ·Delay + TimeInPCs (4.12)

4.9. Demonstrator of an Ethernet fronthaul 109
RRH
SDN
Eth
Eth switch
CPRI2Eth
BBU Pool
1588 Master
1588 Slave
Measurements
Figure 4.23: Ethernet-based C-RAN fronthaul - laboratory setup
Table 4.5: Analysis of a ping delay
# switches minRTT (0B), µs Diff to #-1 (µs) Jitter, µs Avg jitter, µs1 53.4 - 18-210 1202 58.2 4.8 16-203 and 576 1123 62.5 4.3 22-384 and 575 120
TimeInPCs is the one needed for the kernel to process packets in each of the PCs.In order to calculate the switching delay (SwitchDel), the values where the minimumRTT crosses the y axes were noted down, corresponding to the delay where transmissiondelay depending on packet size (TransDel(B)) is zero and queuing delay is also zero -e.g. PingRTT1switch(0) for one switch. That leads to:
PingRTT1switch(0) = 2 · SwitchDelay + TimeInPCs (4.13)PingRTT2switches(0) = 4 · SwitchDelay + TimeInPCs (4.14)PingRTT3switches(0) = 6 · SwitchDelay + TimeInPCs (4.15)
By subtracting the PingRTTNswitch(0) values (and dividing the difference by 2),as shown in Table 4.5, an average switch delay is 2.3 µs.
4.9.2 Delay measurements using DPDK applicationIn order to test the delay more accurately a measurement setup was prepared using aData Plane Development Kit (DPDK). DPDK is a set of libraries and drivers for fastpacket processing that runs on an Ethernet card. In that way the TimeInPCs is reducedto minimum. The measurements were performed between 2 ports of the same PC (Ain Figure 4.22), in order to measure time with a common clock. Traffic from 1 Gbpsto 9 Gbps was sent over 1, 2 and 3 switches. The results are summarized in Table 4.6.Average SwitchDelay is 2.1 µs, thereby the processing time is PC TimeInPCs can beestimated to 0.4 µs.

110 Chapter 4. Towards packet-based fronthaul networks
y = 0.0075x + 53.472
0
50
100
150
200
250
300
0 2000 4000 6000 8000 10000
RTT
, us
Ping size, B
Ping RTT over 1 switch
Min
Avg
Max
Linear (Min)
(a)
y = 0.0089x + 58.19
0
100
200
300
400
500
600
700
800
0 2000 4000 6000 8000 10000
RTT
, us
Ping size, B
Ping RTT over 2 switches
Min
Avg
Max
Linear (Min)
(b)
y = 0.0106x + 62.463
0
100
200
300
400
500
600
700
800
0 2000 4000 6000 8000 10000
RTT
, us
Ping size, B
Ping RTT over 3 switches
Min,
Avg,
Max,
Linear (Min,)
(c)
Figure 4.24: Ping RTT over 1 - 3 switches

4.10. Future directions 111
Table 4.6: Delay measurements over a dedicated line using DPDK
# switches Avg Delay, (µs) Max Jitter, (µs)1 2.5 0.52 4.6 0.63 6.7 0.6
4.9.3 Summary and discussionA demonstrator capable of transmitting a single CPRI stream over Ethernet fulfilling thedelay requirements was built. Measured delays are as expected for a store-and-forwardswitch, in the order of µs. The measured value for the Differential ping, which is asimple method, was 2.3 µs, while for DPDK, which required a DPDK application andmore complicated configuration, was 2.1 µs. Therefore a Differential ping proved to be asufficiently accurate method. However, measurements using DPDK were more accurateand served as a useful verification. For Differential ping method TimeInPCs was over50 µs, while for DPDK 0.4 µs. This huge difference is due to the fact that higher protocollayers were processed and more PC components were involved to measure ping thanusing only an Ethernet card for DPDK application.
4.10 Future directions
The new functional split between RRH and BBU will result in variable bit rate data,that can be transported in a similar way to backhaul traffic. Therefore the work on bothare converged under the term Xhaul [196], [197]. X-haul refers to the network segmentoptimized for transporting any type of data, especially packet-based data, as opposedto IQ samples carried by traditional fronthaul. It should not be confused with midhaulwhich is defined by Metro Ethernet Forum (MEF) [174] as network between base stations,typically between one macro base station and several small cell sites. It is illustrated inFigure 4.25. Fronthaul is an intra-base station connection, while midhaul is an inter-basestation connection.
Current delay requirements result from HARQ process timeout of 8 ms. For 5Gnetworks it is considered to relax this requirement. Also, if out of this 8ms both UE andbase station would need less than 3ms the budget for fronthaul could be extended.
4.11 Summary of standardization activities
Fronthaul evolution leads to different fronthaul splits for different deployment scenariosmost likely resulting in packet-based transport on a fronthaul network. To enable that thefollowing standardization activities are in place:
- IEEE NGFI is under preparation to define new functional splits.

112 Chapter 4. Towards packet-based fronthaul networks
EPC
Base
band
Base
band
Base
band
Base
band
S1
S1
X2
BBU
pool
MME
SGW
PGW
Fronthaul Backhaul
Base
band
Base
band
Base
band
Base
band
BBU
pool
Mobile Core
NetworkRRH
RRH
RRH
RRH
RRH
RRH
BBU
RRH
BBU
Midhaul
Figure 4.25: Fronthaul, backhaul and midhaul
- IEEE 1904.3 “Standard for Radio Over Ethernet Encapsulations and Mappings”that aims to define encapsulation of fronthaul data, independent on the functionalsplit, to Ethernet frames.
- IEEE 802.1Qbv “Bridges and Bridged Networks–Amendment: Enhancementsfor Scheduled Traffic” standardizes traffic scheduling in order to reduce jitter offronthaul streams in Ethernet switches by ensuring that, at specific times, only onetraffic stream has access to the network.
- IEEE 802.1Qbu “Bridges and Bridged Networks–Amendment: Frame Preemption”standardizes preemption which can suspend the transmission of the lower prioritytraffic when fronthaul traffic needs to be transmitted.
- IEEE 802.1CM “Time-Sensitive Networking for Fronthaul” profile that selectfeatures, options, configurations, defaults, protocols and procedures defined inIEEE 802 standard for switches and stations for a fronthaul application.
- IEEE 1588 “Standard for a Precision Clock Synchronization Protocol for Net-worked Measurement and Control Systems” v3 is under preparation which aims,among others to improve accuracy to 100s ps and enhance security. The expectedcompletion date of v3 of the standard is 31 December 2017 [7].
IEEE 802.1Qbv, IEEE 802.1Qbu and IEEE 802.1CM are part of TSN Task Group.

4.12. Summary 113
4.12 Summary
In order to lower the costs and improve the flexibility of C-RAN deployments, existingpacket-based, e.g. Ethernet, networks can be reused for fronthaul.
Sections above analyze requirements on bit rates, delay, phase and frequency synchro-nization for fronthaul with current and new functional splits. Architecture sufficient forfulfilling them was derived, namely: CPRI/OBSAI over OTN and CPRI/new functionalsplit data over Ethernet. It has been proved that OTN can support existing deploymentswith CPRI/OBSAI. Factors that are challenging for achieving synchronization in packet-based C-RAN fronthaul were analyzed. A feasibility study was presented showing theperformance for frequency and phase synchronization using 1588 in Ethernet networksunder various inaccuracies that can be present in the network. Apart from possible queu-ing delays, the one that has the highest impact is the timestamping error associated withthe way timestamps are generated in Ethernet switches. Whether this performance willmeet the requirements of future mobile network depends on PLL and local oscillatorimplementation, based on 1588 feedback to clock offset and drift. Moreover, an Ethernetnetwork that is ready to be integrated in the fronthaul part of a C-RAN demo and whichfulfills the delay requirements was built. The delay measurements were performed, whichallowed to obtain a better understanding of the delays encountered in an Ethernet network.To address the delay requirements in shared networks source scheduling and preemptionare investigated. A source scheduling algorithm is proposed, which is optimized forsymmetrical fronthaul traffic, however can also be applied in cases when downlink trafficexceeds uplink traffic.
Figure 4.26 presents a protocol stack enabling various functionalities for fronthaulover Ethernet transport. Devices at the cell site can either be legacy RRHs running onCPRI and connected to a CPRI2Eth gateway or native Ethernet RRHs. 1588 assuressynchronization between a master clock located in a BBU pool and a slave clock locatedat the cell site. It is beneficial to allow on path support of 1588 for better compensationof queuing related delays, however, in principle it is not mandatory. It is recommendedto use TCs for a better network delay compensation. If an Ethernet network consistsof unknown types of switches, non-TSN enabled, it is recommended to enable sourcescheduling at the network edges to control the delay. Moreover, if it is desired to share thenetwork with other services, preemption is a recommended feature for Ethernet switches.

114 Chapter 4. Towards packet-based fronthaul networks
L1
L2
IP
UDP
Eth PHY
MAC
RLC
BBURRH
PDCP GTP-U
Relay
Radio L1
MAC
RLC
IP
PDCP
UE
Application
L2L1
CPRI2Eth gateway
Eth switch
CPRI
Eth PHY
Eth MAC Eth MAC
EthRRH, 1588 slave
Fronthaul over Eth
Eth switches
BBU Pool
1588 Master
CPRIRRH
CPRI2Eth Gateway,
1588 Slave
Possibly one device (no CPRI then)
1904.31904.3 1904.3Radio L1
CPRIEth MAC
Eth PHY
Devices
Data plane
Fronthaul control plane
SDN
TSN1588
Figure 4.26: Proposed architecture for Fronthaul over Ethernet. Dashed lines highlightoptional functionality.

CHAPTER 5Conclusions and outlook
In order to satisfy the ever growing need for capacity in mobile networks, and, at the sametime, to create cost and energy efficient solutions, new and disruptive ideas are needed.With its performance gains and cost benefits, C-RAN proves to be a major technologicalfoundation for 5G mobile networks. By applying the concept of NFV, C-RAN mobilenetworks are following the IT paradigm towards virtualization and cloudification. De-coupling hardware from software enables software to orchestrate various components,including BBU pool and network resources. Such a flexible, automated, and self organizednetwork allows for various optimizations.
C-RAN builds on the base station architecture evolution from a traditional base station,via a base station with RRH to a centralized and virtualized one. In C-RAN base stationfunctionalities are split between cell locations and the centralized pool. It is a challengeto find an optimal splitting point as well as assuring efficient interconnectivity betweenthe parts. This dissertation summarizes the efforts to analyze this architecture, evaluateits benefits towards energy and cost savings as well as investigates a flexible fronthaularchitecture. To conclude, C-RAN is a candidate architecture worth considering for 5Gdeployments to address its performance needs and optimize deployment costs. Central-ization and virtualization indeed offer cost savings. The point where the functionalityneeds to be split between the cell site and the centralized location needs to be chosen for aparticular deployment, and a variable bit rate splits are foreseen. Ethernet-based fronthaulis not straightforward to implement. However, with the discussed techniques it has thepotential to meet mobile networks’ requirements.
A comprehensive overview of C-RAN is presented. Details of this architecture areprovided, along with its benefits and technical challenges. Due to sharing of basebandresources, C-RAN adapts well to traffic fluctuations among cells. Capacity can be scaledmore easily, energy and cost of baseband units pool deployment and operation can belowered. Moreover, cooperative techniques are enhanced, increasing the overall cellthroughput, while dealing efficiently with interference. However, requirements of highcapacity and low delay are put on the fronthaul network, and development of virtualizationtechniques is needed. Answers to those challenges follow in terms of: analysis of possibletransport network mediums and techniques, the needed RRH and BBU developmentas well as an overview of virtualization techniques. Likely deployment scenarios arepresented together with a broad overview of industry and academic work on developingand boosting C-RAN up to the beginning of 2014. Last, but not least, an overview offuture directions for C-RAN is provided with a strong focus on defining a new functional
115

116 Chapter 5. Conclusions and outlook
split between BBU and RRH in order to enable flexible fronthaul and lower data bit ratein this network segment.
One of the main advantages of C-RAN, multiplexing gains, is thoroughly analyzed.Various sources of multiplexing gains have been identified and quantified for traffic-dependent resources, namely: users changing location daily between e.g. work and home- the so called tidal effect, traffic burstiness, as well as different functional splits. Fortraditional C-RAN deployments, with a functional split between baseband and radiofunctionalities, a multiplexing gain can be achieved on baseband units. However, whenthe functional split allows for variable bit rate, multiplexing gains can also be exploitedon fronthaul links. The latter is an important motivation and guideline for designing thefunctional split not only to lower the bit rate, but also costs of the fronthaul network. Forthe analyzed data sets, the multiplexing gain value reaches six, in deployments wherevarious traffic types are mixed (bursty, e.g. web browsing and constant bit rate, e.g. videostreaming) and cells from various areas (e.g. office and residential) are connected to thesame BBU pool.
In order to further optimize the cost of C-RAN deployments, the possibility of reusingexisting Ethernet networks has been exploited. Such an architecture is especially optimalfor functional splits resulting in variable bit rate traffic in the fronthaul. Packet-basednetworks enable multiplexing gains and flexible, multipoint-to-multipoint connectivity be-tween cell sites and centralized locations. However, assuring synchronization and meetingstringent delay requirements is a challenge. Mechanisms for delivering a reference clockto cell sites have been analyzed, and an architecture employing IEEE 1588, also known asPTP, has been evaluated as a candidate technology for C-RAN. For the tested CPRI-likescenario, the proposed filtering gave sufficient accuracy to fulfill the requirements ofmobile networks - in the order of nanoseconds. Regarding the delay requirements, thesources of delays have been identified and quantified. The non-deterministic queuingdelay is challenging because of its possibly variable value, however, it can be addressedwith: 1) source scheduling, especially at the edge of the network, and 2) preemption inthe switches. A source scheduling algorithm has been proposed to address the jitter anddelay constraints. It is optimized for cases where downlink traffic equals uplink traffic,but can also be used when downlink traffic exceeds uplink. Moreover, a demonstrator ofan SDN controlled Ethernet-based fronthaul has been prepared.
This thesis identifies several possible directions for future work, both to furtherimprove its findings and to explore a wider perspective.
5.1 Future research
Five years until the standardization of 5G networks is a busy time for the mobile networksecosystem. Several directions are investigated to enable further capacity growth andsupport the increasing number of devices, especially for IoT. This section attempts todiscuss possible directions for fronthaul networks development.

5.1. Future research 117
The traditional base station functional split between baseband and radio functionali-ties was fine for short scale deployments, e.g., between rooftop and basement. However,with C-RAN, bringing fronthaul into metropolitan scale with ever-growing capacity needs,more disruptive solutions are needed. When this project was started, the main focus toaddress this issue was on compression. Now, towards the end of the project, new func-tional spits are being discussed: load-dependent and multipoint-to-multipoint. The usercentric/cell centric split is a very promising one, as it brings the fronthaul data rate almostto the level offered for users, creating backhaul-like traffic, still leaving many functionscentralized. Fronthaul networks are receiving high interest from the standardizationbodies, in terms of both defining a functional split and on meeting synchronization anddelay requirements. The main examples are IEEE NGFI, IEEE 1904.3, and 802.1CM -TSN profile for fronthaul.
This project concentrated on studying multiplexing gains on resources dependent onuser traffic. As there are parts of the base station that need to be on to provide coverage,even when no users are active, it would be beneficial to study overall multiplexing gainsincluding those modules, too. Moreover, another method could be used to quantify themultiplexing gains, not applying traffic averaging, but possibly quantifying computationalresources in terms of e.g., the number of operations per second.
In this project, a CPRI-like scenario, including one data stream was analyzed forsynchronization accuracy. Future work could investigate how the varying network loadfor several data streams from a variable-bit rate splits affects synchronization accuracy.
The proposed source scheduling algorithm does not cover scenarios with uplink trafficexceeding downlink. Moreover, it is assumed that only one BBU pool is present in thenetwork. A more generalized algorithm for source scheduling, with multiple BBUpools and possibly other services present in the network, is of interest for 5G.
One of the main constraints for fronthaul is the delay requirement coming fromthe HARQ process. With the current design, not meeting this requirement results inretransmission, thereby lowering application data throughput. Therefore more studies areneeded on whether HARQ is needed in 5G, if the timer could be extended, or what couldbe the delay budget share between base station and UE.
Moreover, substituting fibers with a wireless fronthaul is an important research anddevelopment topic. Exploring new frequency bands, together with increasing spectralefficiency of transport via this medium can address growing capacity needs.
Last but not least, solutions for hardware sharing are of high interest. Virtualizationenables sharing e.g. baseband resources, however methods for sharing other elements,like fronthaul or cell site equipment, are important, too. The topic of network sharing isconnected with hybrid fronthaul and backhaul optimization. Future mobile networkswill most likely consist of standalone base stations as well as base stations aggregated ina C-RAN. Joint capacity and control plane optimization for midhaul networks will enablemore efficient usage of resources, thereby lowering network deployment and operationcosts.

118

Appendices
119


APPENDIX AOTN-based fronthaul
The following sections on OTN demonstrator are published in [86].
A.1 OTN solution context
When the customer/mobile network operator owns little fiber or when the cost of leasingfiber is high in both 1st and 2nd mile, the C-RAN architecture presented in Figure A.1 isbeneficial. Baseband pool (BBU Pool) is located on OTN ring. CPRI/OBSAI is carriedbetween BBU Pool and RRH over OTN. CPRI/OBSAI can be mapped to OTN containersusing the OTN mapper from Altera.
Access network - fronthaul
Aggregation network - backhaul
Mobile core network
BBU Pool
CPRI / OBSAI
RemoteRadio Heads
CPRI / OBSAI
Over OTN
OTN Mapper
OTN Mapper
Figure A.1: C-RAN architecture where OTN is used to transport fronthaul streams
A.2 Overview
We benchmarked the CPRI/OBSAI over OTN transport performance against a referencesetup shown in Figure A.2. BSE sends IQ data, here over CPRI protocol to RRH. A signalanalyzer is used to measure EVM and Frequency Error of the transmitted signal from theRRH antenna port.
The actual measurement setup is shown in Figure A.3. We introduced the AlteraTPO124/125 OTN multiplexer that maps CPRI client signals to OTN containers and backfrom OTN containers to CPRI. We measured data EVM and Frequency Error and compareit to the one achieved with the setup presented in Figure A.2. The detailed overview ofthe system is presented in Figure A.4.
121

122 Appendix A. OTN-based fronthaul
RRH
BSE
CPRIRF
Spectrum analyzer
Figure A.2: Reference setup for CPRI over OTN testing
BSE
CPRI
CPRI to OTN
CPRI
RRH
RF
Spectrum analyzerOTN to CPRI
OTN
OTN mapper
OTNOTN
Figure A.3: CPRI over OTN mapping measurement setup
CPRI CPRIOTU2
Bit
transpar.
CPRI
- ODUk
mapper
ODUk
-
ODU2
mux
CPRI
TPO 124/125
OTU2
frame,
FEC
OTU2
OTN ref. clock
NC (free running)
ODU2
-
ODUk
dmux
TPO124/125
OTN ref. clock
NC (free running)
CPRI
CPRI-ODUk mapping
options supported:
OTU2
frame,
FEC
ODUk
- CPRI
demapper,
clk recov.
Tamdhu
ref. board
BSERRH
153.6 MHz
CLKIN
10 MHz
CLKIN
Agilent MXA
N9020A
Figure A.4: Detailed measurement setup [86]

A.3. Results 123
Four separate sets of measurements were conducted, focusing on CPRI and OB-SAI, using TPO124 and TPO125 mappers as summed up in Table A.1. Parameters aresummarized in Table A.2.
Table A.1: Measurement scenarios
Client OTN Mapper TPO124 TPO125CPRI-3 2.4576 Gbps Scenario 1 Scenario 2OBSAI 3.072 Gbps Scenario 3 Scenario 4
A.3 Results
Table A.3 summarizes the results for CPRI and OBSAI protocols. For three differentmodulations: QPSK, 16 QAM and 64 QAM measurements were taken without OTNdevice, as presented in Figure A.2, and then with TPO124 and TPO125 as OTN mappers,as presented in Figure A.3. We present maximum observed EVM and frequency error foreach modulation, for each scenario. Table A.3 presents worst case observations over a1-minute interval.
Looking at the performance of transmission of CPRI over OTN, we can see that OTNtransmission caused negligible EVM comparing to reference scenario. The frequencyerror increased; however, it stays within the requirements. The performance of OBSAIover OTN transmission should be compared to its reference scenario. The conclusions aresimilar: negligible EVM increase, frequency error stays within requirements.
Figure A.5 shows an example of results for 64 QAM modulated signal transmitted withOBSAI protocol over OTN with TPO125 device. Upper left figure shows the modulationconstellation. In the upper right figure the frequency error is displayed for each of the 20slots of a 10 ms LTE frame. Lower right figure shows summary of measurements withEVM and averaged Frequency Error.
A.4 Conclusion
OTN is a posible optical transport solution for IQ transport between RRH and BBU Poolwhen mobile network operator has a cost-efficient access to legacy OTN network, whichcan be reused for C-RAN. We present a proof of concept of transmitting radio interfaceprotocols over OTN enabling to exploit benefits of C-RAN. Tested solution introducesnegligible EVM increase and small frequency error. It is fully compliant with 3GPPrequirements for LTE-Advanced. Future work could include integration of setup withhigher CPRI/OBSAI bit rates up to 10 Gbps and introducing verification of deterministicdelay measurements.

124 Appendix A. OTN-based fronthaul
Table A.2: Setup specifications
Base Station Base Station Emulator MultimodeExternal clock 153.6 MHz
Optical transport FiberSFP Multimode, 850nm, Fin-
isar FTLF8524P2xNy
OTNTPO124 Talisker Reference board
with TPO124 client-to-OTU2 mapper
TPO125 Tamdhu Reference boardwith TPO125 client-to-OTU2 mapper
Optical fiber loopback onOTU2 port
RRH for CPRI Model RRH 700 MHz, FDD,2x67 W
Carrier center frequency 737 MHz
RRH for OBSAI Model RRH 850 MHz, FDD,2x40 W
Carrier center frequency 880 MHz
Client: CPRI-32.4576 Gbps
Mapping GMP/ODU1Multiplexing AMP ODU1/ODU2Line OTU2
Client: OBSAI3.072 Gbps
Mapping BMP/ODUflex (as perCPRI-4)
Multiplexing GMP ODUflex/ODU2Line OTU2
Test signals [81]
LTE, 10MHz, 10 msQPSK ETM 3.316 QAM ETM 3.264 QAM ETM 3.1

A.4. Conclusion 125
Table A.3: Measurements results summary
Modu-lation
OTNdevice
CPRI OBSAI RequirementsEVM,%
FrequencyError,ppm
EVM,%
FrequencyError,ppm
EVM,%[81]
FrequencyError,ppm
QPSK- 5.5 0.003 9.9 0.005
<17.5%
<0.05ppm [81]
TPO124 5.7 0.026 9.9 0.034TPO125 5.7 0.015 - -
16 QAM- 5.5 0.003 6.9 0.007
<12.5%TPO124 5.6 0.023 7.2 0.028TPO125 5.6 0.016 - -
64 QAM- 5.5 0.003 4.4 0.005
<8%TPO124 5.7 0.027 5.1 0.028TPO125 5.7 0.018 4.5 0.034

126 Appendix A. OTN-based fronthaul
Figure A.5: Results 64 QAM with OBSAI Using TPO125 Device

Bibliography[1] Visual Networking Index: Global Mobile Data Traffic Forecast Update, 2012-2017.
Tech. rep. Cisco, February 2013 (cit. on pp. 2, 64).
[2] Mobility Report. Tech. rep. Ericsson, November 2015 (cit. on pp. 2, 73).
[3] J. Gozalvez. “Tentative 3GPP Timeline for 5G [Mobile Radio]”. In: VehicularTechnology Magazine, IEEE 10.3 (Sept. 2015), pp. 12–18. ISSN: 1556-6072. DOI:10.1109/MVT.2015.2453573 (cit. on p. 2).
[4] 5G White Paper. Tech. rep. NGMN Alliance, February 2015 (cit. on pp. 2, 3).
[5] Mobility Report. Tech. rep. Ericsson, November 2011 (cit. on p. 2).
[6] P. Demestichas, A. Georgakopoulos, D. Karvounas, K. Tsagkaris, V. Stavroulaki,J. Lu, C. Xiong, and J. Yao. “5G on the Horizon: Key Challenges for the Radio-Access Network”. In: Vehicular Technology Magazine, IEEE 8.3 (Sept. 2013),pp. 47–53. ISSN: 1556-6072. DOI: 10.1109/MVT.2013.2269187 (cit. onp. 3).
[7] C.-L. I, C. Rowell, S. Han, Z. Xu, G. Li, and Z. Pan. “Toward Green and Soft: a 5GPerspective”. In: Communications Magazine, IEEE 52.2 (Feb. 2014), pp. 66–73.ISSN: 0163-6804. DOI: 10.1109/MCOM.2014.6736745 (cit. on p. 3).
[8] L. B. Le1, V. Lau, E. Jorswieck, N.-D. Dao, A. Haghighat, D. I. Kim, and T.Le-Ngoc. “Enabling 5G mobile wireless technologies”. In: EURASIP JournalonWireless Communications and Networking (Dec. 2015). DOI: DOI10.1186/s13638-015-0452-9 (cit. on p. 3).
[9] M. Peng, Y. Li, Z. Zhao, and C. Wang. “System architecture and key technologiesfor 5G heterogeneous cloud radio access networks”. In: Network, IEEE 29.2 (Mar.2015), pp. 6–14. ISSN: 0890-8044. DOI: 10.1109/MNET.2015.7064897(cit. on p. 3).
[10] A. Checko, H. L. Christiansen, Y. Yan, L. Scolari, G. Kardaras, M. S. Berger,and L. Dittmann. “Cloud RAN for Mobile Networks - a Technology Overview”.In: IEEE Communications Surveys & Tutorials, IEEE 17.1 (Firstquarter 2015).c©2015 IEEE. Reprinted, with permission, pp. 405–426. ISSN: 1553-877X. DOI:10.1109/COMST.2014.2355255 (cit. on pp. 4, 9).
127

128 Bibliography
[11] A. Checko, H. Christiansen, and M. S. Berger. “Evaluation of energy and costsavings in mobile Cloud-RAN”. In: Proceedings of OPNETWORK Conference.2013 (cit. on pp. 4, 15, 42, 50, 62, 76).
[12] A. Checko, H. Holm, and H. Christiansen. “Optimizing small cell deploymentby the use of C-RANs”. In: European Wireless 2014; 20th European WirelessConference; Proceedings of. c©2014 VDE. Reprinted, with permission. May 2014,pp. 1–6 (cit. on pp. 4, 15, 16, 37, 42, 50, 67, 68, 76).
[13] A. Checko1st, A. P. Avramova1st, H. L. Christiansen, and M. S. Berger. “Eval-uating C-RAN fronthaul functional splits in terms of network level energy andcost savings”. In: accepted to IEEE Journal Of Communications And Networks ()(cit. on pp. 4, 16, 50, 64, 75, 76).
[14] A. Checko, L. Ellegaard, and M. Berger. “Capacity planning for Carrier EthernetLTE backhaul networks”. In: Wireless Communications and Networking Confer-ence (WCNC), 2012 IEEE. Apr. 2012, pp. 2741–2745. DOI: 10.1109/WCNC.2012.6214266 (cit. on pp. 4, 76).
[15] A. Checko, A. Juul, H. Christiansen, and M. Berger. “Synchronization challengesin packet-based Cloud-RAN fronthaul for mobile networks”. In: Communica-tion Workshop (ICCW), 2015 IEEE International Conference on. c©2015 IEEE.Reprinted, with permission. June 2015, pp. 2721–2726. DOI: 10.1109/ICCW.2015.7247590 (cit. on pp. 4, 83).
[16] I. Hwang, B. Song, and S. Soliman. “A Holistic View on Hyper-Dense Hetero-geneous and Small Cell Networks”. In: Communications Magazine, IEEE 51.6(2013). ISSN: 0163-6804. DOI: 10.1109/MCOM.2013.6525591 (cit. onpp. 7, 8).
[17] D. Gesbert, M. Kountouris, R. Heath, C.-B. Chae, and T. Salzer. “Shifting theMIMO Paradigm”. In: Signal Processing Magazine, IEEE 24.5 (2007), pp. 36–46.ISSN: 1053-5888. DOI: 10.1109/MSP.2007.904815 (cit. on p. 7).
[18] J. Hoydis, S. ten Brink, and M. Debbah. “Massive MIMO: How many antennasdo we need?” In: Communication, Control, and Computing (Allerton), 2011 49thAnnual Allerton Conference on. 2011, pp. 545–550. DOI: 10.1109/Allerton.2011.6120214 (cit. on p. 7).
[19] H. Guan, T. Kolding, and P. Merz. Discovery of Cloud-RAN. Tech. rep. NokiaSiemens Networks, April 2010 (cit. on pp. 7, 8, 17, 42).
[20] China Mobile Research Institute. C-RAN The Road Towards Green RAN. WhitePaper, Version 2.5, October 2011 (cit. on pp. 7, 8, 14–17, 20, 21, 24, 25, 28–30,33, 34, 41, 42, 49, 56, 62, 64, 68, 84, 85).

Bibliography 129
[21] Y. Lin, L. Shao, Z. Zhu, Q. Wang, and R. K. Sabhikhi. “Wireless network cloud:Architecture and system requirements”. In: IBM Journal of Research and De-velopment 54.1 (Jan. 2010), 4:1–4:12. ISSN: 0018-8646. DOI: 10.1147/JRD.2009.2037680 (cit. on pp. 7, 8, 12, 42).
[22] J. Segel. lightRadio Portfolio: White Paper 3. Tech. rep. Alcatel-Lucent Bell Labs,2011 (cit. on pp. 8, 21, 25, 29, 30, 32, 33, 42).
[23] Huawei. Cloud RAN Introduction. The 4th CJK International Workshop –Technol-ogy Evolution and Spectrum. September 2011 (cit. on pp. 8, 26, 42).
[24] ZTE Green Technology Innovations White Paper. Tech. rep. ZTE, 2011 (cit. onpp. 8, 17, 42).
[25] Intel Heterogenous Network Solution Brief. Tech. rep. 2011 (cit. on pp. 8, 33, 34,41, 42).
[26] T. Flanagan. Creating cloud base stations with TI’s KeyStone multicore architec-ture. Tech. rep. Texas Instruments, October 2011 (cit. on pp. 8, 22, 34, 42).
[27] C.-L. I, C. Rowell, S. Han, Z. Xu, G. Li, and Z. Pan. “Toward Green and Soft: a 5GPerspective”. In: Communications Magazine, IEEE 52.2 (Feb. 2014), pp. 66–73.ISSN: 0163-6804. DOI: 10.1109/MCOM.2014.6736745 (cit. on p. 8).
[28] lightRadio Network. Alcatel-Lucent. [cited: January 2016]. URL: https://www.alcatel-lucent.com/solutions/lightradio (cit. on p. 8).
[29] W. Liu, S. Han, C. Yang, and C. Sun. “Massive MIMO or Small Cell Network:Who is More Energy Efficient?” In: Wireless Communications and NetworkingConference Workshops (WCNCW), 2013 IEEE. 2013, pp. 24–29. DOI: 10.1109/WCNCW.2013.6533309 (cit. on p. 8).
[30] J. Madden. Cloud RAN or Small Cells? Tech. rep. Mobile Experts, April 2013(cit. on pp. 8, 42).
[31] G. Kardaras and C. Lanzani. “Advanced Multimode Radio for Wireless and Mo-bile Broadband Communication”. In: European Wireless Technology Conference,2009. EuWIT 2009, pp. 132–135 (cit. on p. 10).
[32] E. Dahlman, S. Parkvall, J. Skold, and P. Beming. 3G Evolution: HSPA and LTEfor Mobile Broadband. 3G Evolution. Elsevier Science, 2010. ISBN: 9780080923192(cit. on p. 10).
[33] Common Public Radio Interface (CPRI); Interface Specification V6.0. Aug. 2013(cit. on pp. 12, 21, 31, 87).
[34] Open Base Station Architecture Initiative (OBSAI) BTS System Reference Docu-ment Version 2.0. 2006 (cit. on p. 12).
[35] ETSI GS ORI 002-1 V1.1.1 (2011-10). Open Radio equipment Interface (ORI);ORI Interface Specification; Part 1: Low Layers (Release 1) (cit. on p. 12).

130 Bibliography
[36] ETSI GS ORI 002-2 V1.1.1 (2012-08). Open Radio equipment Interface (ORI);ORI Interface Specification; Part 2: Control and Management (Release 1) (cit. onp. 12).
[37] S. Zhou, M. Zhao, X. Xu, J. Wang, and Y. Yao. “Distributed wireless communica-tion system: a new architecture for future public wireless access”. In: Communi-cations Magazine, IEEE 41.3 (Mar. 2003), pp. 108–113. ISSN: 0163-6804. DOI:10.1109/MCOM.2003.1186553 (cit. on p. 12).
[38] F. Anger. Smart Mobile Broadband. In proceedings of RAN Evolution to the CloudWorkshop. June 2013 (cit. on p. 14).
[39] G. Brown. Converging Telecom & IT in the LTE RAN. Tech. rep. Samsung, Feb2013 (cit. on p. 14).
[40] S. Namba, T. Matsunaka, T. Warabino, S. Kaneko, and Y. Kishi. “Colony-RANarchitecture for future cellular network”. In: Future Network Mobile Summit(FutureNetw), 2012. July 2012, pp. 1–8 (cit. on pp. 14, 15, 22, 42, 78).
[41] T. Werthmann, H. Grob-Lipski, and M. Proebster. “Multiplexing gains achieved inpools of baseband computation units in 4G cellular networks”. In: Personal Indoorand Mobile Radio Communications (PIMRC), 2013 IEEE 24th InternationalSymposium on. Sept. 2013, pp. 3328–3333. DOI: 10.1109/PIMRC.2013.6666722 (cit. on pp. 14, 42, 55, 78).
[42] S. Bhaumik, S. P. Chandrabose, M. K. Jataprolu, A. Muralidhar, V. Srinivasan,G. Kumar, P. Polakos, and T. Woo. “CloudIQ: A framework for processing basestations in a data center”. In: Proceedings of the Annual International Conferenceon Mobile Computing and Networking, MOBICOM (2012), pp. 125–136 (cit. onpp. 15, 33, 42).
[43] M. Madhavan, P. Gupta, and M. Chetlur. “Quantifying multiplexing gains in aWireless Network Cloud”. In: Communications (ICC), 2012 IEEE InternationalConference on. 2012, pp. 3212–3216. DOI: 10.1109/ICC.2012.6364658(cit. on pp. 15, 42).
[44] J. Liu, S. Zhou, J. Gong, Z. Niu, and S. Xu. “On the statistical multiplexing gainof virtual base station pools”. In: Global Communications Conference (GLOBE-COM), 2014 IEEE. Dec. 2014, pp. 2283–2288. DOI: 10.1109/GLOCOM.2014.7037148 (cit. on p. 15).
[45] A. Avramova, H. Christiansen, and V. Iversen. “Cell Deployment Optimizationfor Cloud Radio Access Networks using Teletraffic Theory”. In: The EleventhAdvanced International Conference on Telecommunications, AICT 2015. June2015 (cit. on pp. 15, 67, 68).

Bibliography 131
[46] White Paper of Next Generation Fronthaul Interface. Tech. rep. China MobileResearch Institute, Alcatel-Lucent, Nokia Networks, ZTE Corporation, BroadcomCorporation, Intel China Research Center, October 2015 (cit. on pp. 16, 44, 51,52, 84, 85, 88).
[47] C. Liu, K. Sundaresan, M. Jiang, S. Rangarajan, and G.-K. Chang. “The case for re-configurable backhaul in Cloud-RAN based small cell networks”. In: INFOCOM,2013 Proceedings IEEE. Apr. 2013, pp. 1124–1132. DOI: 10.1109/INFCOM.2013.6566903 (cit. on pp. 16, 41, 42).
[48] H. Jinling. “TD-SCDMA/TD-LTE evolution - Go Green”. In: CommunicationSystems (ICCS), 2010 IEEE International Conference on. 2010, pp. 301–305.DOI: 10.1109/ICCS.2010.5686439 (cit. on pp. 16, 17, 42).
[49] C. Chen. C-RAN: the Road Towards Green Radio Access Network. Presentation.August 2012 (cit. on pp. 17, 41, 42).
[50] C-RAN - Road Towards Green Radio Access Network. Centralized baseband,Collaborative radio, and real-time Cloud computing RAN. Presentation. EXPO2010 (cit. on pp. 17, 42).
[51] J. Acharya, L. Gao, and S. Gaur. Heterogeneous Networks in LTE-Advanced.Wiley, 2014. ISBN: 9781118693957. URL: https://books.google.dk/books?id=RiDnAgAAQBAJ (cit. on p. 17).
[52] P. Marsch and G. Fettweis. "Coordinated Multi-Point in Mobile Communications:From Theory to Practice". Cambridge University Press, 2011. ISBN: 9781107004115(cit. on p. 17).
[53] R. Irmer, H. Droste, P. Marsch, M. Grieger, G. Fettweis, S. Brueck, H.-P. Mayer,L. Thiele, and V. Jungnickel. “Coordinated multipoint: Concepts, performance,and field trial results”. In: Communications Magazine, IEEE 49.2 (2011), pp. 102–111. ISSN: 0163-6804. DOI: 10.1109/MCOM.2011.5706317 (cit. on pp. 17,22, 42).
[54] H. Holma and A. Toskala. "LTE-Advanced: 3GPP Solution for IMT-Advanced".John Wiley and Sons, Ltd, 2012. ISBN: 9781119974055 (cit. on pp. 17, 20, 23,42).
[55] Y. Huiyu, Z. Naizheng, Y. Yuyu, and P. Skov. “Performance Evaluation of Co-ordinated Multipoint Reception in CRAN Under LTE-Advanced uplink”. In:Communications and Networking in China (CHINACOM), 2012 7th InternationalICST Conference on. 2012, pp. 778–783. DOI: 10.1109/ChinaCom.2012.6417589 (cit. on pp. 17, 42).
[56] L. Li, J. Liu, K. Xiong, and P. Butovitsch. “Field test of uplink CoMP jointprocessing with C-RAN testbed”. In: Communications and Networking in China(CHINACOM), 2012 7th International ICST Conference on. 2012, pp. 753–757.DOI: 10.1109/ChinaCom.2012.6417584 (cit. on pp. 17, 41, 42).

132 Bibliography
[57] J. Li, D. Chen, Y. Wang, and J. Wu. “Performance Evaluation of Cloud-RAN Sys-tem with Carrier Frequency Offset”. In: Globecom Workshops (GC Wkshps), 2012IEEE. Dec. 2012, pp. 222–226. DOI: 10.1109/GLOCOMW.2012.6477573(cit. on pp. 18, 42).
[58] D. Gesbert, S. Hanly, H. Huang, S. Shamai Shitz, O. Simeone, and W. Yu. “Multi-Cell MIMO Cooperative Networks: A New Look at Interference”. In: SelectedAreas in Communications, IEEE Journal on 28.9 (2010), pp. 1380–1408. ISSN:0733-8716. DOI: 10.1109/JSAC.2010.101202 (cit. on pp. 18, 42).
[59] A. Liu and V. Lau. “Joint power and antenna selection optimization for energy-efficient large distributed MIMO networks”. In: Communication Systems (ICCS),2012 IEEE International Conference on. 2012, pp. 230–234. DOI: 10.1109/ICCS.2012.6406144 (cit. on pp. 18, 42).
[60] L. Liu, F. Yang, R. Wang, Z. Shi, A. Stidwell, and D. Gu. “Analysis of handoverperformance improvement in cloud-RAN architecture”. In: Communications andNetworking in China (CHINACOM), 2012 7th International ICST Conferenceon. 2012, pp. 850–855. DOI: 10.1109/ChinaCom.2012.6417603 (cit. onp. 18).
[61] Wipro Technologies. Software-Defined Radio Technology Overview, White Paper.August 2002 (cit. on p. 18).
[62] M. Bansal, J. Mehlman, S. Katti, and P. Levis. “OpenRadio: A ProgrammableWireless Dataplane”. In: ACM SIGCOMM Workshop on Hot Topics in SoftwareDefined Networking (HotSDN’12), ACM SIGCOMM 2012, pp. 109–114 (cit. onp. 18).
[63] S. Thomas. Poll: Savings Drive CRAN Deployments. LightReading, July 2015(cit. on pp. 19, 41).
[64] Front-haul Compression for Emerging C-RAN and Small Cell Networks. Tech. rep.Integrated Device Technology, April 2013 (cit. on p. 21).
[65] W. Huitao and Z. Yong. C-RAN Bearer Network Solution. Tech. rep. ZTE, Novem-ber 2011 (cit. on pp. 21, 27, 41, 42).
[66] S. Namba, T. Warabino, and S. Kaneko. “BBU-RRH Switching Schemes forCentralized RAN”. In: Communications and Networking in China (CHINACOM),2012 7th International ICST Conference on. 2012, pp. 762–766. DOI: 10.1109/ChinaCom.2012.6417586 (cit. on pp. 22, 42).
[67] H. Raza. “A brief survey of radio access network backhaul evolution: part I”. In:Communications Magazine, IEEE 49.6 (2011), pp. 164–171. ISSN: 0163-6804.DOI: 10.1109/MCOM.2011.5784002 (cit. on pp. 23, 25, 42).
[68] C. Chen, J. Huang, W. Jueping, Y. Wu, and G. Li. Suggestions on PotentialSolutions to C-RAN. Tech. rep. NGMN Alliance, 2013 (cit. on pp. 24, 38, 40, 42,44, 88).

Bibliography 133
[69] J. Segel and M. Weldon. lightRadio Portfolio: White Paper 1. Tech. rep. Alcatel-Lucent Bell Labs, 2011 (cit. on p. 25).
[70] 3GPP TR 36.932 Scenarios and requirements for small cell enhancements forE-UTRA and E-UTRAN V 12.1.0. Mar. 2013 (cit. on pp. 25, 37).
[71] Z. Ghebretensae, K. Laraqui, S. Dahlfort, J. Chen, Y. Li, J. Hansryd, F. Ponzini,L. Giorgi, S. Stracca, and A. Pratt. “Transmission solutions and architectures forheterogeneous networks built as C-RANs”. In: Communications and Network-ing in China (CHINACOM), 2012 7th International ICST Conference on. 2012,pp. 748–752. DOI: 10.1109/ChinaCom.2012.6417583 (cit. on pp. 25, 27,41, 42).
[72] E-BLINK. Wireless Fronthaul Technology. [cited: January 2016]. URL: http://e-blink.com/ (cit. on p. 25).
[73] J. H. Lee, S.-H. Cho, K. H. Doo, S.-I. Myong, J. H. Lee, and S. S. Lee. “CPRItransceiver for mobile front-haul based on wavelength division multiplexing”. In:ICT Convergence (ICTC), 2012 International Conference on. 2012, pp. 581–582.DOI: 10.1109/ICTC.2012.6387205 (cit. on pp. 26, 42).
[74] F. Ponzini, L. Giorgi, A. Bianchi, and R. Sabella. “Centralized radio accessnetworks over wavelength-division multiplexing: a plug-and-play implementa-tion”. In: Communications Magazine, IEEE 51.9 (2013). ISSN: 0163-6804. DOI:10.1109/MCOM.2013.6588656 (cit. on pp. 26, 42).
[75] ITU-T G.709/Y.1331, Interfaces for the optical transport network. Geneva, Feb.2012 (cit. on p. 27).
[76] ODU0 and ODUflex A Future-Proof Solution for OTN Client Mapping. Tech. rep.TPACK, February 2010 (cit. on p. 27).
[77] B. Liu, X. Xin, L. Zhang, and J. Yu. “109.92-Gb/s WDM-OFDMA Uni-PON withdynamic resource allocation and variable rate access”. In: OPTICS EXPRESS,Optical Society of America 20.10 (May 2012) (cit. on pp. 27, 42).
[78] J. Fabrega, M. Svaluto Moreolo, M. Chochol, and G. Junyent. “WDM overlayof distributed base stations in deployed passive optical networks using coherentoptical OFDM transceivers”. In: Transparent Optical Networks (ICTON), 201214th International Conference on. 2012, pp. 1–4. DOI: 10.1109/ICTON.2012.6253934 (cit. on pp. 27, 42).
[79] S. Chia, M. Gasparroni, and P. Brick. “The Next Challenge for Cellular Networks:Backhaul”. In: IEEE Microwave (August 2009) (cit. on p. 27).
[80] R. Sánchez, L. Raptis, and K. Vaxevanakis. “Ethernet as a Carrier Grade Tech-nology: Developments and Innovations”. In: IEEE Communications Magazine(September 2008) (cit. on p. 28).

134 Bibliography
[81] 3GPP TS 36.104 Evolved Universal Terrestrial Radio Access (E-UTRA); BaseStation (BS) radio transmission and reception V 12.0.0. July 2013 (cit. on pp. 28,30, 84, 87, 124, 125).
[82] 3GPP TS 36.133 Evolved Universal Terrestrial Radio Access (E-UTRA); Require-ments for Support of Radio Resource Management. V 12.0.0. July 2013 (cit. onpp. 28, 87).
[83] NFV Cloud RAN with Ethernet Fronthaul. [cited: January 2016]. URL: http://www.altiostar.com/solution/ (cit. on pp. 28, 36).
[84] W. Liu, K. Chen, W. Ma, and S. Norberg. “Remote radio data transmission overethernet”. United States Patent Application 20120113972 A1. 2012 (cit. on p. 28).
[85] Altera. SoftSilicon OTN Processors. [cited: September 2013]. URL: http://www.altera.com/end-markets/wireline/applications/otn/softsilicon-processors/proc-index.html (cit. on pp. 29, 42).
[86] A. Checko, G. Kardaras, C. Lanzani, D. Temple, C. Mathiasen, L. A. Pedersen,and B. Klaps. OTN Transport of Baseband Radio Serial Protocols in C-RANArchitecture for Mobile Network Applications. Tech. rep. MTI Mobile and Altera,March 2014 (cit. on pp. 29, 42, 121, 122).
[87] D. Holberg, Hughes Aircraft Company. “An adaptive digital automatic gaincontrol for MTI radar Systems”. 3781882. 1973 (cit. on p. 30).
[88] M. Grieger, S. Boob, and G. Fettweis. “Large scale field trial results on frequencydomain compression for uplink joint detection”. In: Globecom Workshops (GCWkshps), 2012 IEEE. 2012, pp. 1128–1133. DOI: 10.1109/GLOCOMW.2012.6477737 (cit. on pp. 30, 42).
[89] D. Samardzija, J. Pastalan, M. MacDonald, S. Walker, and R. Valenzuela. “Com-pressed Transport of Baseband Signals in Radio Access Networks”. In: WirelessCommunications, IEEE Transactions on 11.9 (September 2012), pp. 3216–3225.ISSN: 1536-1276. DOI: 10.1109/TWC.2012.062012.111359 (cit. onpp. 30–32, 42).
[90] B. Guo, W. Cao, A. Tao, and D. Samardzija. “CPRI compression transport forLTE and LTE-A signal in C-RAN”. In: Communications and Networking in China(CHINACOM), 2012 7th International ICST Conference on. 2012, pp. 843–849.DOI: 10.1109/ChinaCom.2012.6417602 (cit. on pp. 30, 32, 42).
[91] I. D. Technology. Compression IP for Wireless Infrastructure Applications. Prod-uct brief. [July 2013] (cit. on pp. 30, 32, 42).
[92] J. Lorca and L. Cucala. “Lossless compression technique for the fronthaul ofLTE/LTE-advanced Cloud-RAN architectures”. In: World of Wireless, Mobile andMultimedia Networks (WoWMoM), 2013 IEEE 14th International Symposium andWorkshops on a. June 2013, pp. 1–9 (cit. on pp. 31, 32, 42).

Bibliography 135
[93] S.-H. Park, O. Simeone, O. Sahin, and S. Shamai (Shitz). “Robust and Effi-cient Distributed Compression for Cloud Radio Access Networks”. In: VehicularTechnology, IEEE Transactions on 62.2 (February 2013), pp. 692–703. ISSN:0018-9545. DOI: 10.1109/TVT.2012.2226945 (cit. on pp. 31, 32, 42).
[94] Philippe Sehier et al. Liaisons, Contributions to 3GPP ETSI on CollaborativeRadio/MIMO, ORI Interface, ect. Tech. rep. NGMN Alliance, 2013 (cit. on p. 33).
[95] Ericsson. World’s first microwave connection between LTE main and remoteradio units. [February 2012]. URL: http://www.ericsson.com/news/1588074 (cit. on pp. 33, 42).
[96] X. Wei, X. Qi, L. Xiao, Z. Shi, and L. Huang. “Software-defined Radio basedOn Cortex-A9”. In: Communications and Networking in China (CHINACOM),2012 7th International ICST Conference on. 2012, pp. 758–761. DOI: 10.1109/ChinaCom.2012.6417585 (cit. on p. 34).
[97] D. Martinez-Nieto, V. Santos, M. McDonnell, K. Reynolds, and P. Carlston. “Dig-ital Signal Processing on Intel R© Architecture”. In: Intel R© Technology Journal13 (1 2009) (cit. on p. 34).
[98] N. Kai, S. Jianxing, C. Kuilin, and K. K. Chai. “TD-LTE eNodeB prototypeusing general purpose processor”. In: "Communications and Networking in China(CHINACOM), 2012 7th International ICST Conference on". 2012, pp. 822–827.DOI: 10.1109/ChinaCom.2012.6417598 (cit. on p. 34).
[99] S. Zhang, R. Qian, T. Peng, R. Duan, and K. Chen. “High throughput turbodecoder design for GPP platform”. In: Communications and Networking in China(CHINACOM), 2012 7th International ICST Conference on. 2012, pp. 817–821.DOI: 10.1109/ChinaCom.2012.6417597 (cit. on p. 35).
[100] Z. Guanghui, N. Kai, H. Lifeng, and H. Jinri. “A method of optimizing the de-RateMatching and demodulation in LTE based on GPP”. In: Communications andNetworking in China (CHINACOM), 2012 7th International ICST Conferenceon. 2012, pp. 828–832. DOI: 10.1109/ChinaCom.2012.6417599 (cit. onp. 35).
[101] T. Kaitz and G. Guri. “CPU-MPU partitioning for C-RAN applications”. In:Communications and Networking in China (CHINACOM), 2012 7th InternationalICST Conference on. 2012, pp. 767–771. DOI: 10.1109/ChinaCom.2012.6417587 (cit. on p. 35).
[102] H. Duan, D. Huang, Y. Huang, Y. Zhou, and J. Shi. “A time synchronizationmechanism based on Software Defined Radio of general-purpose processor”. In:Communications and Networking in China (CHINACOM), 2012 7th InternationalICST Conference on. 2012, pp. 772–777. DOI: 10.1109/ChinaCom.2012.6417588 (cit. on p. 35).

136 Bibliography
[103] N. Omnes, M. Bouillon, G. Fromentoux, and O. Le Grand. “A programmableand virtualized network IT infrastructure for the internet of things: How canNFV SDN help for facing the upcoming challenges”. In: Intelligence in NextGeneration Networks (ICIN), 2015 18th International Conference on. Feb. 2015,pp. 64–69. DOI: 10.1109/ICIN.2015.7073808 (cit. on p. 36).
[104] B. Nunes, M. Mendonca, X.-N. Nguyen, K. Obraczka, and T. Turletti. “A Surveyof Software-Defined Networking: Past, Present, and Future of ProgrammableNetworks”. In: Communications Surveys Tutorials, IEEE 16.3 (Third 2014),pp. 1617–1634. ISSN: 1553-877X. DOI: 10.1109/SURV.2014.012214.00180 (cit. on p. 36).
[105] OpenFlow - Open Networking Foundation. [cited: January 2016]. URL: https://www.opennetworking.org/sdn-resources/openflow (cit. onp. 36).
[106] The OpenDaylight Platform. [cited: January 2016]. URL: https://www.opendaylight.org/ (cit. on p. 36).
[107] Open Platform form NFV (OPNFV). Software. [cited: January 2016]. URL:https://www.opnfv.org/software (cit. on p. 36).
[108] OpenStack Open Source cloud Computing Software. [cited: January 2016]. URL:http://www.openstack.org/ (cit. on p. 36).
[109] Wind River Titanium Server. [cited: January 2016]. URL: http://www.windriver.com/products/titanium-server/ (cit. on p. 36).
[110] N. Nikaein, R. Knopp, L. Gauthier, E. Schiller, T. Braun, D. Pichon, C. Bonnet,F. Kaltenberger, and D. Nussbaum. “Demo: Closer to Cloud-RAN: RAN Asa Service”. In: Proceedings of the 21st Annual International Conference onMobile Computing and Networking. MobiCom ’15. Paris, France: ACM, 2015,pp. 193–195. ISBN: 978-1-4503-3619-2. DOI: 10.1145/2789168.2789178.URL: http://doi.acm.org.proxy.findit.dtu.dk/10.1145/2789168.2789178 (cit. on p. 36).
[111] OpenAirInterface. [cited: January 2016]. URL: http://www.openairinterface.org/ (cit. on pp. 36, 40).
[112] T. Nakamura, S. Nagata, A. Benjebbour, Y. Kishiyama, T. Hai, S. Xiaodong,Y. Ning, and L. Nan. “Trends in small cell enhancements in LTE advanced”. In:Communications Magazine, IEEE 51.2 (2013), pp. 98–105. ISSN: 0163-6804.DOI: 10.1109/MCOM.2013.6461192 (cit. on p. 37).
[113] G. Brown. C-RAN – The Next Generation Mobile Access Platform. LightReadingwebinar. 2013 (cit. on p. 39).

Bibliography 137
[114] Next Generation Mobile Networks. Project Centralized Processing, Collab-orative Radio, Real-Time Computing, Clean RAN System (P-CRAN). [cited:February 2013]. URL: http : / / www . ngmn . org / workprogramme /centralisedran.html (cit. on p. 40).
[115] Mobile Cloud Networking (MCN) Project. [cited: April 2013]. URL: https://www.mobile-cloud-networking.eu/ (cit. on p. 40).
[116] FP7 project High capacity network Architecture with Remote radio heads andParasitic antenna arrays (HARP). [cited: February 2014]. URL: http://www.fp7-harp.eu/ (cit. on p. 40).
[117] iJOIN. Interworking and JOINt Design of an Open Access and Backhaul NetworkArchitecture for Small Cells based on Cloud Networks. [cited: Septemebr 2013].URL: http://www.ict-ijoin.eu/ (cit. on p. 40).
[118] D. Sabella, P. Rost, Y. Sheng, E. Pateromichelakis, U. Salim, P. Guitton-Ouhamou,M. Di Girolamo, and G. Giuliani. “RAN as a service: Challenges of designing aflexible RAN architecture in a cloud-based heterogeneous mobile network”. In:Future Network and Mobile Summit (FutureNetworkSummit), 2013. July 2013,pp. 1–8 (cit. on p. 40).
[119] Connectivity management for eneRgy Optimised Wireless Dense networks (CROWD).[cited: February 2014]. URL: http://www.ict-crowd.eu/publications.html (cit. on pp. 40, 42).
[120] Motivation and Vision. iCirrus. [cited: Septemebr 2013]. URL: http://www.icirrus-5gnet.eu/motivation-and-vision/ (cit. on p. 40).
[121] ERAN press release. Cloud-based technology for 5G mobile networks basedtechnology for 5G mobile networks. [cited: January 2016]. URL: http://comcores.com/Files/2014%2012%2018%20ERAN%20press%20release.pdf (cit. on p. 40).
[122] R. Kokku, R. Mahindra, H. Zhang, and S. Rangarajan. “NVS: a virtualizationsubstrate for WiMAX networks”. In: MOBICOM’10. 2010, pp. 233–244 (cit. onp. 42).
[123] D. Raychaudhuri and M. Gerla. New Architectures and Disruptive Technologiesfor the Future Internet: The Wireless, Mobile and Sensor Network Perspective.Technical Report 05-04, GENI Design Document. 2005 (cit. on p. 42).
[124] L. Xia, S. Kumar, X. Yang, P. Gopalakrishnan, Y. Liu, S. Schoenberg, and X. Guo.“Virtual WiFi: bring virtualization from wired to wireless”. In: VEE’11. 2011,pp. 181–192 (cit. on p. 42).

138 Bibliography
[125] G. Smith, A. Chaturvedi, A. Mishra, and S. Banerjee. “Wireless virtualizationon commodity 802.11 hardware”. In: Proceedings of the second ACM inter-national workshop on Wireless network testbeds, experimental evaluation andcharacterization. WinTECH ’07. Montreal, Quebec, Canada: ACM, 2007, pp. 75–82. ISBN: 978-1-59593-738-4. DOI: 10.1145/1287767.1287782. URL:http://doi.acm.org/10.1145/1287767.1287782 (cit. on p. 42).
[126] Y. Zaki, L. Zhao, C. Goerg, and A. Timm-Giel. “LTE wireless virtualizationand spectrum management”. In: Wireless and Mobile Networking Conference(WMNC), 2010 Third Joint IFIP. 2010, pp. 1–6. DOI: 10.1109/WMNC.2010.5678740 (cit. on p. 42).
[127] L. Zhao, M. Li, Y. Zaki, A. Timm-Giel, and C. Gorg. “LTE virtualization: Fromtheoretical gain to practical solution”. In: Teletraffic Congress (ITC), 2011 23rdInternational. 2011, pp. 71–78 (cit. on p. 42).
[128] Z. Zhu, P. Gupta, Q. Wang, S. Kalyanaraman, Y. Lin, H. Franke, and S. Sarangi.“Virtual base station pool: towards a wireless network cloud for radio access net-works”. In: Proceedings of the 8th ACM International Conference on ComputingFrontiers. CF ’11. Ischia, Italy: ACM, 2011, 34:1–34:10. ISBN: 978-1-4503-0698-0. DOI: 10.1145/2016604.2016646. URL: http://doi.acm.org/10.1145/2016604.2016646 (cit. on p. 42).
[129] G. Aljabari and E. Eren. “Virtualization of wireless LAN infrastructures”. In:Intelligent Data Acquisition and Advanced Computing Systems (IDAACS), 2011IEEE 6th International Conference on. Vol. 2. 2011, pp. 837–841. DOI: 10.1109/IDAACS.2011.6072889 (cit. on p. 42).
[130] H. Coskun, I. Schieferdecker, and Y. Al-Hazmi. “Virtual WLAN: Going beyondVirtual Access Points”. In: ECEASST (2009), pp. -1–1 (cit. on p. 42).
[131] Y. Al-Hazmi and H. De Meer. “Virtualization of 802.11 interfaces for Wire-less Mesh Networks”. In: Wireless On-Demand Network Systems and Services(WONS), 2011 Eighth International Conference on. 2011, pp. 44–51. DOI: 10.1109/WONS.2011.5720199 (cit. on p. 42).
[132] M. Li, L. Zhao, X. Li, X. Li, Y. Zaki, A. Timm-Giel, and C. Gorg. “Investigationof Network Virtualization and Load Balancing Techniques in LTE Networks”. In:Vehicular Technology Conference (VTC Spring), 2012 IEEE 75th. 2012, pp. 1–5.DOI: 10.1109/VETECS.2012.6240347 (cit. on p. 42).
[133] G. Bhanage, D. Vete, I. Seskar, and D. Raychaudhuri. “SplitAP: LeveragingWireless Network Virtualization for Flexible Sharing of WLANs”. In: GlobalTelecommunications Conference (GLOBECOM 2010), 2010 IEEE. 2010, pp. 1–6.DOI: 10.1109/GLOCOM.2010.5684328 (cit. on p. 42).

Bibliography 139
[134] J. Vestin, P. Dely, A. Kassler, N. Bayer, H. Einsiedler, and C. Peylo. “CloudMAC:towards software defined WLANs”. In: ACM SIGMOBILE Mobile Computingand Communications Review 16.4 (2013), pp. 42–45. ISSN: 15591662, 19311222.DOI: 10.1145/2436196.2436217 (cit. on p. 42).
[135] Network Functions Virtualisation – Introductory White Paper. Tech. rep. ETSI,October 2012 (cit. on p. 42).
[136] NFV working group. Network Function Virtualization – Introductory white paperETSI. 2012 (cit. on p. 42).
[137] NFV working group. Network Function Virtualization; Architectural Framework.2013 (cit. on p. 42).
[138] NFV working group. Network Function Virtualization (NFV); Use Cases. 2013(cit. on p. 42).
[139] H. Kim. and G. F. “Improving network management with software defined net-working”. In: Communications Magazine, IEEE 51.2 (2013), pp. 114–119. DOI:10.1109/MCOM.2013.6461195 (cit. on p. 42).
[140] X. Jin, L. E. Li, L. Vanbever, and J. Rexford. “SoftCell: Scalable and Flexible Cel-lular Core Network Architecture”. In: Proceedings of the Ninth ACM Conferenceon Emerging Networking Experiments and Technologies. CoNEXT ’13. SantaBarbara, California, USA: ACM, 2013, pp. 163–174. ISBN: 978-1-4503-2101-3.DOI: 10.1145/2535372.2535377. URL: http://doi.acm.org/10.1145/2535372.2535377 (cit. on p. 42).
[141] A. Gudipati, D. Perry, L. E. Li, and S. Katti. “SoftRAN: software defined radioaccess network”. In: ACM SIGCOMM Workshop on Hot Topics in SoftwareDefined Networking (HotSDN’13), ACM SIGCOMM 2013, pp. 25–30 (cit. onp. 42).
[142] K. Pentikousis, Y. Wang, and W. Hu. “Mobileflow: Toward software-definedmobile networks”. In: Communications Magazine, IEEE 51.7 (2013), pp. 44–53.ISSN: 0163-6804. DOI: 10.1109/MCOM.2013.6553677 (cit. on p. 42).
[143] H. Ali-Ahmad, C. Cicconetti, A. de la Olivia, M. Draexler, R. Gupta, V. Mancuso,L. Roullet, and V. Sciancaleporee. “CROWD: An SDN Approach for DenseNets”.In: Second European Workshop on Software Defined Networks (EWSDN), 2013,pp. 25–31 (cit. on p. 42).
[144] K. Kiyoshima, T. Takiguchi, Y. Kawabe, and Y. Sasaki. “Commercial Devel-opment of LTE-Advanced Applying Advanced C-RAN Architecture”. In: NTTDOCOMO Technical Journal 17.2 (Oct. 2015), pp. 10–18 (cit. on p. 41).
[145] Common Public Radio Interface (CPRI); Interface Specification V6.1. July 2014(cit. on p. 43).

140 Bibliography
[146] U. Dotsch, M. Doll, H.-P. Mayer, F. Schaich, J. Segel, and P. Sehier. “Quantita-tive analysis of split base station processing and determination of advantageousarchitectures for LTE”. In: vol. 18. 1. June 2013, pp. 105–128 (cit. on p. 44).
[147] B. Haberland. Smart Mobile Cloud. 2013 (cit. on pp. 44, 51, 52).
[148] Small cell virtualization functional splits and use cases. Tech. rep. Small CellForum, June 2015 (cit. on pp. 44, 45, 51, 52, 84, 85).
[149] H. Lee, Y. O. Park, and S. S. Song. “A traffic-efficient fronthaul for the cloud-RAN”. In: Information and Communication Technology Convergence (ICTC),2014 International Conference on. Oct. 2014, pp. 675–678. DOI: 10.1109/ICTC.2014.6983252 (cit. on p. 44).
[150] B. Haberland. Cloud RAN architecture evolution from 4G to 5G Mobile Systems.2014 (cit. on p. 44).
[151] E. Dahlman, S. Parkvall, and J. Skold. 4G: LTE/LTE-Advanced for Mobile Broad-band. Elsevier Science, 2011. ISBN: 9780123854902. URL: https://books.google.com.qa/books?id=DLbsq9GD0zMC (cit. on pp. 52, 53).
[152] 3GPP, Technical Specification Group Radio Access Network; Evolved UniversalTerrestrial Radio Access (E-UTRA). Packet Data Convergence Protocol (PDCP)specification (Release 8). Tech. rep. 36.323, v. 8.6.0. 2009 (cit. on p. 51).
[153] 3GPP, Technical Specification Group Radio Access Network; Evolved Univer-sal Terrestrial Radio Access (E-UTRA). Radio Link Control (RLC) protocolspecification (Release 8). Tech. rep. 36.322, v. 8.8.0. 2010 (cit. on p. 51).
[154] 3GPP, Technical Specification Group Radio Access Network; Evolved UniversalTerrestrial Radio Access (E-UTRA). Medium Access Control (MAC) protocolspecification (Release 8). Tech. rep. 36.321, v. 8.11.0. 2011 (cit. on p. 52).
[155] C. Desset, B. Debaillie, V. Giannini, A. Fehske, G. Auer, H. Holtkamp, W. Wajda,D. Sabella, F. Richter, M. J. Gonzalez, H. Klessig, I. Gódor, M. Olsson, M. A. Im-ran, A. Ambrosy, and O. Blume. “Flexible power modeling of LTE base stations”.In: Wireless Communications and Networking Conference (WCNC), 2012 IEEE.Apr. 2012, pp. 2858–2862. DOI: 10.1109/WCNC.2012.6214289 (cit. onpp. 55–57).
[156] Alcatel-Lucent and Vodafone Chair on Mobile Communication Systems. Studyon Energy Efficient Radio Access Network (EERAN) Technologies. UnpublishedProject Report, Technical University of Dresden, Dresden, Germany, 2009 (cit. onpp. 56, 57).
[157] L. M. Correia, D. Zeller, O. Blume, D. Ferling, Y. Jading, I. Gódor, G. Auer,and L. V. D. Perre. “Challenges and enabling technologies for energy awaremobile radio networks”. In: IEEE Communications Magazine 48.11 (Nov. 2010),pp. 66–72. ISSN: 0163-6804. DOI: 10.1109/MCOM.2010.5621969 (cit. onp. 56).

Bibliography 141
[158] Z. Hasan, H. Boostanimehr, and V. K. Bhargava. “Green Cellular Networks:A Survey, Some Research Issues and Challenges”. In: IEEE CommunicationsSurveys Tutorials 13.4 (Fourth 2011), pp. 524–540. ISSN: 1553-877X. DOI: 10.1109/SURV.2011.092311.00031 (cit. on p. 56).
[159] G. Auer, V. Giannini, I. Godor, P. Skillermark, M. Olsson, M. A. Imran, D. Sabella,M. J. Gonzalez, C. Desset, and O. Blume. “Cellular Energy Efficiency EvaluationFramework”. In: Vehicular Technology Conference (VTC Spring), 2011 IEEE73rd. May 2011, pp. 1–6. DOI: 10.1109/VETECS.2011.5956750 (cit. onp. 57).
[160] C. Chen. “The Notion of overbooking and Its Application to IP/MPLS Traffic En-gineering”. In: Request for Comments: internet draft <draft-cchen-te-overbooking-01.txt> (November 2001) (cit. on p. 58).
[161] M. Stasiak, M. Głabowski, A. Wisniewski, and P. Zwierzykowski. Modeling anddimensioning of mobile networks : from GSM to LTE. John Wiley & Sons Ltd.,2011 (cit. on p. 58).
[162] OPNET. [cited: January 2016]. URL: http://www.opnet.com/ (cit. onp. 58).
[163] Many cities. MIT Senseable City Lab. [cited: January 2016]. URL: http://www.manycities.org/ (cit. on p. 59).
[164] Mobility Report. Tech. rep. Ericsson, November 2013 (cit. on p. 64).
[165] 3GPP TR 25.896 Feasibility Study for Enhanced Uplink for UTRA FDD. Mar.2004 (cit. on p. 66).
[166] X. Cheng. “Understanding the Characteristics of Internet Short Video Sharing:YouTube as a Case Study”. In: Procs of the 7th ACM SIGCOMM Conference onInternet Measurement, San Diego (CA, USA), 15. 2007, p. 28 (cit. on p. 68).
[167] J. J. Lee and M. Gupta. A new traffic model for current user web browsingbehavior. Tech. rep. Intel, 2007 (cit. on p. 68).
[168] Average Web Page Breaks 1600K. [cited: June 2015]. URL: http://www.websiteoptimization.com/speed/tweak/average-web-page/(cit. on p. 68).
[169] Metro Ethernet Forum. EVC Ethernet Services Definitions Phase 3, Tech. Spec.MEF 6.2. July 2014 (cit. on p. 72).
[170] 3GPP TS 36.321 Evolved Universal Terrestrial Radio Access (E-UTRA); MediumAccess Control (MAC) protocol specification V 12.0.0. Dec. 2013 (cit. on p. 84).

142 Bibliography
[171] B. Sadiq, R. Madan, and A. Sampath. “Downlink Scheduling for Multiclass Trafficin LTE”. In: EURASIP Journal on Wireless Communications and Networking2009.1 (2009), p. 510617. ISSN: 1687-1499. DOI: 10.1155/2009/510617.URL: http://jwcn.eurasipjournals.com/content/2009/1/510617 (cit. on p. 84).
[172] T. Pfeiffer and F. Schaich. Optical Architectures For Mobile Back- And Fronthaul-ing. OFC/NFOEC wireless backhauling workshop. Los Angeles: Alcatel-LucentBell Labs Stuttgart, Mar. 5, 2012 (cit. on p. 84).
[173] J. H. et al. Further Study on Critical C-RAN Technologies, Version 1.0, tech. rep.NGMN Alliance, 2015 (cit. on p. 85).
[174] Metro Ethernet Forum. Mobile Backhaul Implementation Agreement – Phase 2,Amendment 1 – Small Cells, Tech. Spec. MEF 22.1.1. July 2014 (cit. on pp. 85,111).
[175] Federal Communications Commission FCC 15-9, PS Docket No. 07-114. Feb.2015 (cit. on p. 86).
[176] M. Weiss. Telecom Requirements for Time and Frequency Synchronization. Pre-sented at 52nd Meeting of the Civil GPS Service Interface Committee in Nashville,September 17th-18th, 2012. Time and Frequency Division, NIST (cit. on pp. 86,87).
[177] E. Metsälä and J. Salmelin. Mobile Backhaul. John Wiley and Sons, Ltd., 2012.ISBN: 978-1-119-97420-8 (cit. on p. 86).
[178] ETSI/GSM. GSM Recommendation 05.10, 3GPP TS 05.10 Radio subsystemsynchronization, Release Ph1. Oct. 1992 (cit. on p. 86).
[179] H. Li. Consideration on CRAN fronthaul architecture and interface. Presented at1st NGFI workshop in Beijing, China, June 4th, 2015. China Mobile ResearchInstitute, June 4, 2015 (cit. on p. 86).
[180] C.-L. I. NGFI: Next Generation Fronthaul towards 4.5G and 5G. Presented at1st NGFI workshop in Beijing, China, June 4th, 2015. China Mobile ResearchInstitute, June 4, 2015 (cit. on pp. 86, 88, 89).
[181] D. Bladsjo, M. Hogan, and S. Ruffini. “Synchronization aspects in LTE smallcells”. In: Communications Magazine, IEEE 51.9 (2013), pp. 70–77. ISSN: 0163-6804. DOI: 10.1109/MCOM.2013.6588653 (cit. on p. 87).
[182] C.-L. I, Y. Yuan, J. Huang, S. Ma, C. Cui, and R. Duan. “Rethink fronthaul forsoft RAN”. In: Communications Magazine, IEEE 53.9 (Sept. 2015), pp. 82–88.ISSN: 0163-6804. DOI: 10.1109/MCOM.2015.7263350 (cit. on p. 88).
[183] IEEE 1904.3 Task Force. URL: http://www.ieee1904.org/3 (cit. onp. 88).

Bibliography 143
[184] “IEEE Standard for a Precision Clock Synchronization Protocol for NetworkedMeasurement and Control Systems”. In: IEEE Std 1588-2008 (Revision of IEEEStd 1588-2002) (July 2008), pp. c1–269. DOI: 10.1109/IEEESTD.2008.4579760 (cit. on p. 90).
[185] “IEEE Standard for Ethernet”. In: IEEE Std 802.3-2012 (Dec. 2012), pp. 1–. DOI:10.1109/IEEESTD.2012.6419735 (cit. on p. 90).
[186] P. A. Smith. CPRI “FrontHaul” requirements discussion with TSN. San Diego,CA: Huawei, July 1, 2014 (cit. on p. 91).
[187] Precise Timing for Base Stations in the Evolution to LTE. Tech. rep. Vitesse, 2013(cit. on p. 93).
[188] L. Xie, Y. Wu, and J. Wang. “Efficient time synchronization of 1588v2 technologyin packet network”. In: Communication Software and Networks (ICCSN), 2011IEEE 3rd International Conference on. May 2011, pp. 181–185. DOI: 10.1109/ICCSN.2011.6014030 (cit. on p. 95).
[189] “Time Sensitive Networking Task Group of IEEE 802.1, IEEE 802.1Qbv/D2.3Bridges and Bridged Networks—Amendment: Enhancements for Scheduled Traf-fic, IEEE”. In: (2015) (cit. on p. 100).
[190] “Time Sensitive Networking Task Group of IEEE 802.1, IEEE 802.1Qbu/D2.2Bridges and Bridged Networks—Amendment: Frame Preemption, IEEE”. In:(2015) (cit. on p. 100).
[191] “IEEE Higher Layer LAN Protocols Working Group (C/LM/WG802.1), Time-Sensitive Networking for Fronthaul, P802.1CM PAR”. In: (2015) (cit. on p. 102).
[192] “LAN/MAN Standards Committee, IEEE P802.3br/D1.0 Draft Standard for Eth-ernet Amendment: Specification and Management Parameters for InterspersingExpress Traffic., IEEE”. In: (2014) (cit. on p. 104).
[193] T. Wan and P. Ashwood. A Performance Study of CPRI over Ethernet. Presentedat IEEE 1904.3 Task Force meeting in Louisville, January 30th, 2015. HuaweiCanada Research Center, Jan. 30, 2015 (cit. on p. 104).
[194] J. Farkas and B. Varga. Applicability of Qbu and Qbv to Fronthaul. Ericsson,Nov. 11, 2015 (cit. on p. 105).
[195] T. Stern and K. Bala. Multiwavelength Optical Networks: A Layered Approach.Addison-Wesley professional computing series. Addison-Wesley, 1999. ISBN:9780201309676. URL: https://books.google.dk/books?id=C%5C_lSAAAAMAAJ (cit. on p. 106).
[196] A. De La Oliva, X. Costa Perez, A. Azcorra, A. Di Giglio, F. Cavaliere, D.Tiegelbekkers, J. Lessmann, T. Haustein, A. Mourad, and P. Iovanna. “Xhaul:toward an integrated fronthaul/backhaul architecture in 5G networks”. In: WirelessCommunications, IEEE 22.5 (Oct. 2015), pp. 32–40. ISSN: 1536-1284. DOI:10.1109/MWC.2015.7306535 (cit. on p. 111).

144 Bibliography
[197] N. J. Gomes, P. Chanclou, P. Turnbull, A. Magee, and V. Jungnickel. “Fronthaulevolution: From CPRI to Ethernet”. In: Optical Fiber Technology 26, Part A(2015). Next Generation Access Networks, pp. 50–58. ISSN: 1068-5200. DOI:http://dx.doi.org/10.1016/j.yofte.2015.07.009. URL:http : / / www . sciencedirect . com / science / article / pii /S1068520015000942 (cit. on p. 111).