A flexible UMTS/WLAN architecture for improved network performance
Upload
khangminh22Category
view
0download
0
PROJECT DEVELOPED IN COOPERATION WITH FORMER ORANGE PCS. LTD (UK), NOWADAYS EE LTD
Overview of UMTS network evolution through radio and
transmission feature validation UNIVERSITAT POLITÈCNICA DE CATALUNYA
Escola Tècnica Superior d’Enginyeria en Telecomunicació de Barcelona
Jorge Rafael Sevilla Castillo
Bristol, United Kingdom
Overview of UMTS network evolution through radio and transmission feature validation Jorge Rafael Sevilla Castillo
2
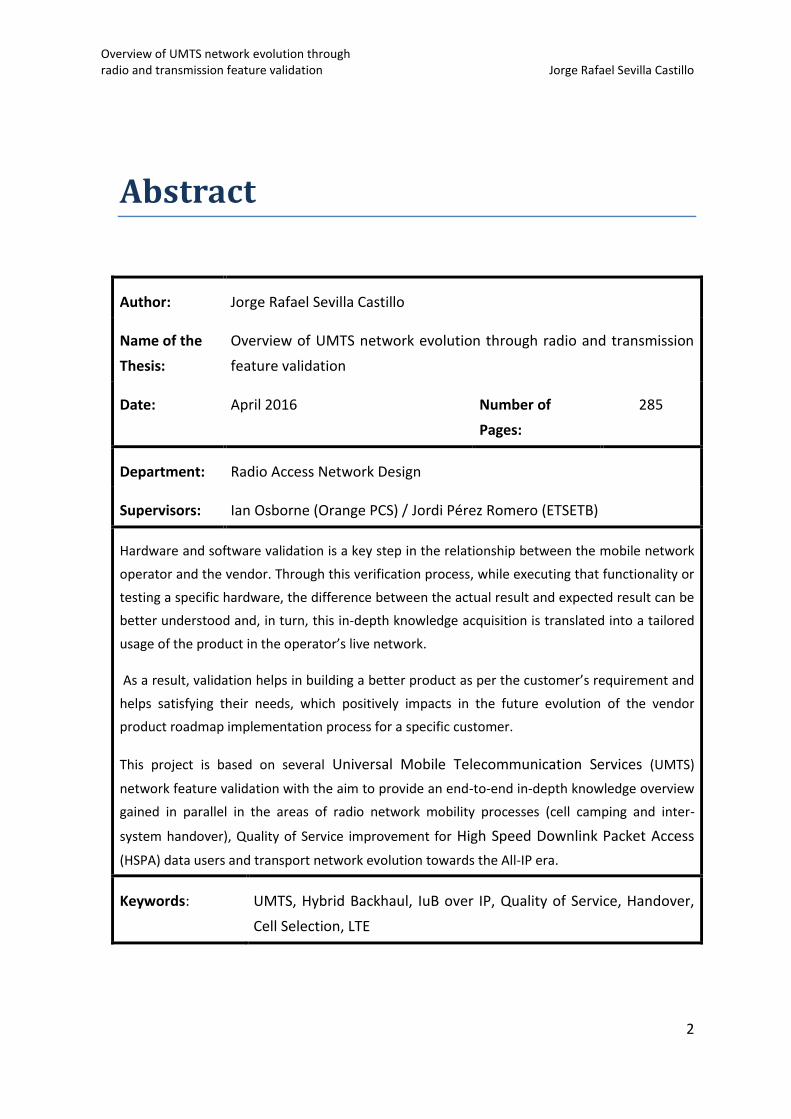
Abstract
Author: Jorge Rafael Sevilla Castillo
Name of the
Thesis:
Overview of UMTS network evolution through radio and transmission
feature validation
Date: April 2016 Number of
Pages:
285
Department: Radio Access Network Design
Supervisors: Ian Osborne (Orange PCS) / Jordi Pérez Romero (ETSETB)
Hardware and software validation is a key step in the relationship between the mobile network
operator and the vendor. Through this verification process, while executing that functionality or
testing a specific hardware, the difference between the actual result and expected result can be
better understood and, in turn, this in-depth knowledge acquisition is translated into a tailored
usage of the product in the operator’s live network.
As a result, validation helps in building a better product as per the customer’s requirement and
helps satisfying their needs, which positively impacts in the future evolution of the vendor
product roadmap implementation process for a specific customer.
This project is based on several Universal Mobile Telecommunication Services (UMTS)
network feature validation with the aim to provide an end-to-end in-depth knowledge overview
gained in parallel in the areas of radio network mobility processes (cell camping and inter-
system handover), Quality of Service improvement for High Speed Downlink Packet Access
(HSPA) data users and transport network evolution towards the All-IP era.
Keywords: UMTS, Hybrid Backhaul, IuB over IP, Quality of Service, Handover,
Cell Selection, LTE

Overview of UMTS network evolution through radio and transmission feature validation Jorge Rafael Sevilla Castillo
3
Overview of UMTS network evolution through radio and transmission feature validation Jorge Rafael Sevilla Castillo
4
Contents
Acknowledgements ................................................................................................................... 7
List of Abbreviations .................................................................................................................. 8
Introduction ............................................................................................................................. 13
1 Cell Selection Parameter Set ................................................................................................ 16
1.1 Theoretical Background ....................................................................................................... 16
1.1.1 Radio Resource Control ................................................................................................ 16
1.1.2 System Information Block type 3 and 4 ....................................................................... 18
1.2 Feature validation ................................................................................................................ 19
1.2.1 Feature Description ...................................................................................................... 19
1.2.2 Purpose of validation .................................................................................................... 19
1.2.3 Testbed configuration and settings .............................................................................. 20
1.2.4 Test Results ................................................................................................................... 22
1.2.5 Test Conclusions ........................................................................................................... 33
2 Inter-System Handover Cancellation .................................................................................... 35
2.1 Theoretical Background ....................................................................................................... 35
2.1.1 Handover in Mobile networks: a quick overview ......................................................... 35
2.1.2 Types of handover in 3G WCDMA systems .................................................................. 36
2.1.3 Objectives of handover ................................................................................................ 37
2.1.4 Handover procedures and measurements ................................................................... 38
2.1.5 Soft Handover (SHO) .................................................................................................... 40
2.1.6 Handover between WCDMA and GSM: Inter System Handover ................................. 47
2.1.7 Mobility procedures between WCDMA and GSM ....................................................... 51
Overview of UMTS network evolution through radio and transmission feature validation Jorge Rafael Sevilla Castillo
5
2.2 Feature Validation ............................................................................................................... 56
2.2.1 Feature description ...................................................................................................... 56
2.2.2 Purpose of validation .................................................................................................... 59
2.2.3 Testbed configuration and settings .............................................................................. 60
2.2.4 Test Results ................................................................................................................... 64
2.2.5 Test Conclusions ........................................................................................................... 73
3 QoS Aware HSPA Scheduling ................................................................................................ 74
3.1 Theoretical Background ....................................................................................................... 74
3.1.1 Introduction: What is QoS? .......................................................................................... 74
3.1.2 Why is QoS needed? ..................................................................................................... 75
3.1.3 QoS Challenges ............................................................................................................. 75
3.1.4 UMTS QoS Architecture ................................................................................................ 76
3.1.5 Overview of different levels of QoS ............................................................................. 78
3.1.6 UMTS QoS Classes and Attributes ................................................................................ 80
3.1.7 UTRAN QoS Mapping Mechanism ................................................................................ 85
6.1.1 UTRAN QoS Management ............................................................................................ 92
6.2 Feature Validation ............................................................................................................... 99
6.2.1 Feature description ...................................................................................................... 99
6.2.2 Purpose of validation .................................................................................................. 105
6.2.3 Testbed configuration and settings ............................................................................ 106
6.2.4 Test Results ................................................................................................................. 114
6.2.5 Test conclusions ......................................................................................................... 123
6.3 Network Evolution: QoS in 4G networks ........................................................................... 125
6.3.1 Overview of QoS Management .................................................................................. 125
6.3.2 Basic Principles ........................................................................................................... 126
Overview of UMTS network evolution through radio and transmission feature validation Jorge Rafael Sevilla Castillo
6
6.3.3 ENode B QoS Management Policies ........................................................................... 130
6.3.4 Future testing ............................................................................................................. 135
7 IuB evolution: hybrid backhaul and full IP solutions .......................................................... 136
7.1 Theoretical Background ..................................................................................................... 136
7.1.1 Introduction ................................................................................................................ 136
7.1.2 Legacy IuB Transport Solution .................................................................................... 138
7.1.3 Understanding the challenge ..................................................................................... 141
7.1.4 Hybrid Backhaul Solution Overview ........................................................................... 144
7.2 Hybrid Backhaul Feature Validation .................................................................................. 148
7.2.1 Hybrid Backhaul feature description .......................................................................... 148
7.2.2 Purpose of Validation ................................................................................................. 154
7.2.3 Testbed Configuration and Settings ........................................................................... 155
7.2.4 Test Results ................................................................................................................. 196
7.2.5 Test Conclusions ......................................................................................................... 233
7.3 IuB over IP feature validation ............................................................................................ 235
7.3.1 Feature Description .................................................................................................... 236
7.3.2 Testbed configuration and settings ............................................................................ 242
7.3.3 Test results ................................................................................................................. 261
7.3.4 BFD Testing ................................................................................................................. 266
7.3.5 IuB Transport QoS testing .......................................................................................... 270
7.4 Test Conclusions ................................................................................................................ 280
8 Conclusions and future work .............................................................................................. 282
8.1 Conclusions ........................................................................................................................ 282
8.2 Future work ....................................................................................................................... 283

Overview of UMTS network evolution through radio and transmission feature validation Jorge Rafael Sevilla Castillo
7
Acknowledgements
This Master’s Thesis was carried out in Orange PCS LTD in Bristol (United
Kingdom) as a result of cooperation with the Universitat Politècnica de Catalunya. First, I
would like to thank my former boss Ian Osborne, for opening my way to Orange and
giving me the opportunity to work in his team. Raj Shadev and Martin Candeas deserve
special thanks for answering my questions and giving me useful and helpful advice
during the long feature validation sessions in Eagleswood testbed. I want to give
particular thanks to my former colleague and friend, Atul Roy, for his continuous
encouragement and support during my stay in Bristol. His inspiring way of thinking will
be always in my mind.
I would also like to express my gratitude to Jordi Pérez, for his support and
prompt feedback to all my questions during this period.
To my family and friends, I warmly want to give thanks for their love, patience,
and endless support during my tenure in Bristol. Especially, to my father Jose Rafael and
brother Jose Antonio, I really appreciate all the encouragement they have given to me
during the hard times. And to the most special person in my life, Nieves, thank you for
your love and support to reach this last milestone.
My dearest thanks, though, belong to the person who I want to dedicate this
Thesis, my mother. She forged my personality and share credit on every goal I achieve.
You will always be in my heart.
Jorge Rafael Sevilla Castillo
Madrid, Apr 2016
Overview of UMTS network evolution through radio and transmission feature validation Jorge Rafael Sevilla Castillo
8
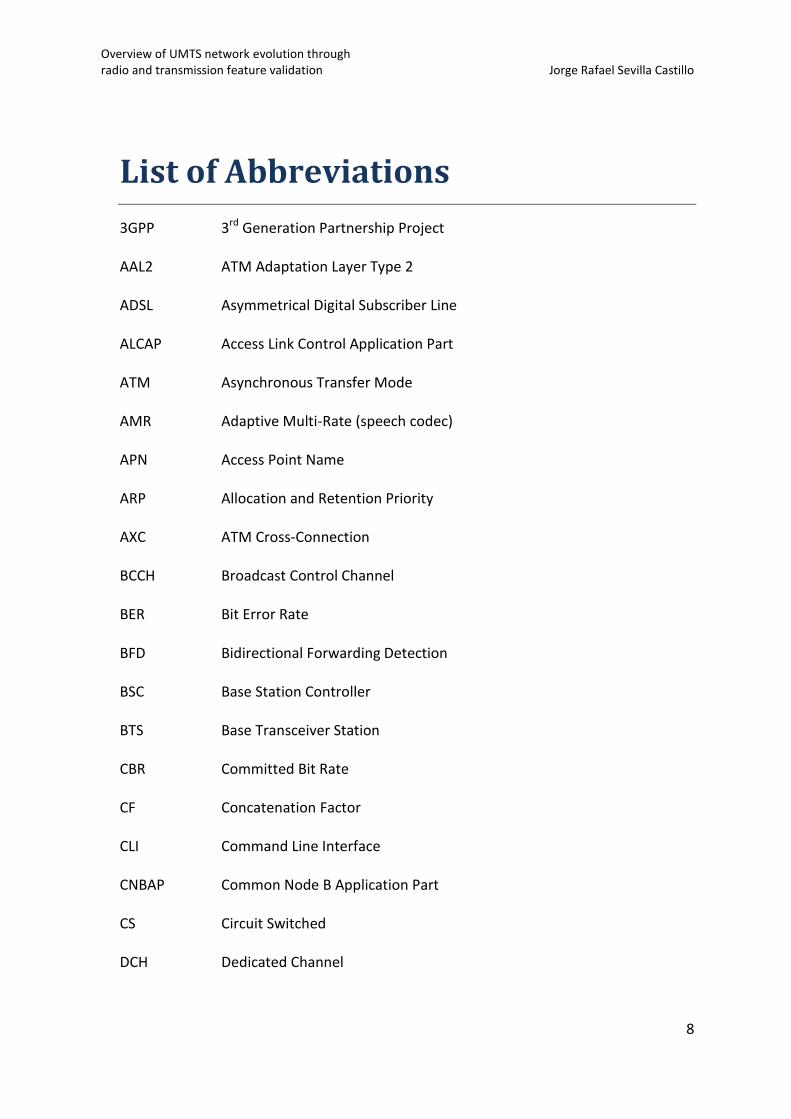
List of Abbreviations
3GPP 3rd Generation Partnership Project
AAL2 ATM Adaptation Layer Type 2
ADSL Asymmetrical Digital Subscriber Line
ALCAP Access Link Control Application Part
ATM Asynchronous Transfer Mode
AMR Adaptive Multi-Rate (speech codec)
APN Access Point Name
ARP Allocation and Retention Priority
AXC ATM Cross-Connection
BCCH Broadcast Control Channel
BER Bit Error Rate
BFD Bidirectional Forwarding Detection
BSC Base Station Controller
BTS Base Transceiver Station
CBR Committed Bit Rate
CF Concatenation Factor
CLI Command Line Interface
CNBAP Common Node B Application Part
CS Circuit Switched
DCH Dedicated Channel
Overview of UMTS network evolution through radio and transmission feature validation Jorge Rafael Sevilla Castillo
9
DNBAP Dedicated Node B Application Part
DSCP Differentiated Services Code Point
E-DCH Enhanced uplink DCH
EPC Evolved Packet Core
FACH Forward Access Channel
FTP File Transfer Protocol
GGSN Gateway GPRS Support Node
GPS Global Positioning System
GSM Global System for Mobile communications
HO Handover
HHO Hard Handover
HSDPA High Speed Downlink Packet Access
HSPA High Speed Packet Access
HSUPA High Speed Uplink Packet Access
IETF Internet Engineering Task Force
IMA Inverse Multiplexing over ATM
IMSI International Mobile Subscriber Identity
IP Internet Protocol
ITU International Telecommunications Union
KPI Key Performance Indicator
LLU Local Loop Unbundling
LOS Loss Of Signal
MAC Medium Access Control
Overview of UMTS network evolution through radio and transmission feature validation Jorge Rafael Sevilla Castillo
10
MCO Major Country Operator
MDCR Minimum Desired Cell Rate
MIB Master Information Block
MML Man Machine Language
MO Mobile Originated
MPLS Multi-Protocol Layer Switching
MSC Mobile Switching Center
MSP Multiplex Section Protection
MT Mobile Termination
NNI Network-Node Interface
NRT Non Real Time
OAM Operation, Administration and Maintenance
OPEX Operational Expenses
OSI Open System Interconnection
OSS Operation Support System
PCR Peak Cell Rate
PDH Plesiochronous Digital Hierarchy
PDP Packet Data Protocol
PHB Per Hop Behavior
PS Packet Switched
PT Packetization Timer
PWE3 Pseudo Wire Emulation Edge to Edge
QoS Quality of Service
Overview of UMTS network evolution through radio and transmission feature validation Jorge Rafael Sevilla Castillo
11
RAB Radio Access Bearer
RAN Radio Access Network
RAT Radio Access Technology
RF Radio Frequency
RNC Radio Network Controller
RRC Radio Resource Control
RSCP Received Signal Code Power
RT Real Time
RTT Round Trip Time
RX Reception
SC Scrambling Code
SCC Serving Cell Change
SCTP Stream Control Transmission Protocol
SDH Synchronous Digital Hierarchy
SDU Service Data Unit
SGSN Serving GPRS Support Node
SHDSL Single-Pair High-speed Digital Subscriber Line
SHO Soft Handover
SIB System Information Block
STM-1 Synchronous Transport Module Level-1
TCP Transmission Control Protocol
TDM Time Division Multiplexing
THP Traffic Handling Priority
Overview of UMTS network evolution through radio and transmission feature validation Jorge Rafael Sevilla Castillo
12
TMSI Temporary IMSI
ToS Type of Service
TRB Traffic Radio Bearer
TX Transmission
UARFCN UTRAN Absolute Radio Frequency Channel Number
UBR Unspecified Bit Rate
UDP User Datagram Protocol
UE User Equipment
UMTS Universal Mobile Telecommunication Services
UNI User-Network Interface
VCC Virtual Channel Connection
VPC Virtual Path Connection
VLAN Virtual Local Area Network
WBTS WCDMA Base Transceiver Station
WCDMA Wideband CDMA Code Division Multiple Access
WTR Wait To Restore
Overview of UMTS network evolution through radio and transmission feature validation Jorge Rafael Sevilla Castillo
13
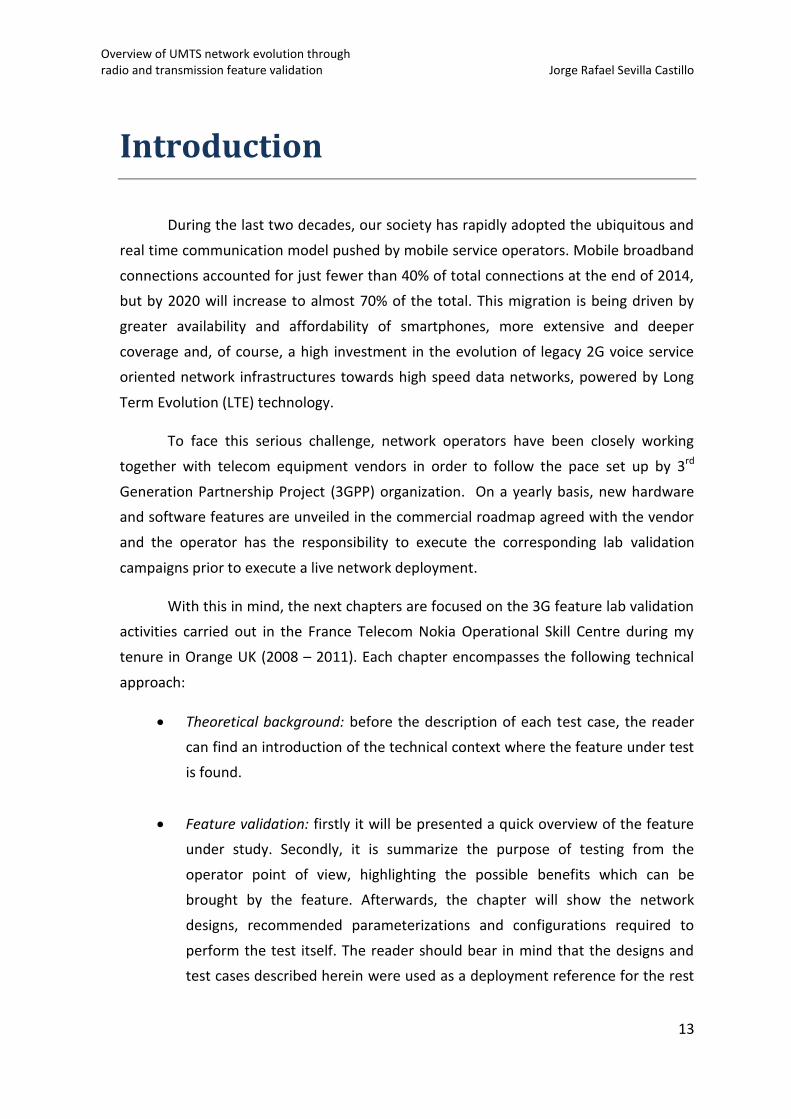
Introduction
During the last two decades, our society has rapidly adopted the ubiquitous and
real time communication model pushed by mobile service operators. Mobile broadband
connections accounted for just fewer than 40% of total connections at the end of 2014,
but by 2020 will increase to almost 70% of the total. This migration is being driven by
greater availability and affordability of smartphones, more extensive and deeper
coverage and, of course, a high investment in the evolution of legacy 2G voice service
oriented network infrastructures towards high speed data networks, powered by Long
Term Evolution (LTE) technology.
To face this serious challenge, network operators have been closely working
together with telecom equipment vendors in order to follow the pace set up by 3rd
Generation Partnership Project (3GPP) organization. On a yearly basis, new hardware
and software features are unveiled in the commercial roadmap agreed with the vendor
and the operator has the responsibility to execute the corresponding lab validation
campaigns prior to execute a live network deployment.
With this in mind, the next chapters are focused on the 3G feature lab validation
activities carried out in the France Telecom Nokia Operational Skill Centre during my
tenure in Orange UK (2008 – 2011). Each chapter encompasses the following technical
approach:
Theoretical background: before the description of each test case, the reader
can find an introduction of the technical context where the feature under test
is found.
Feature validation: firstly it will be presented a quick overview of the feature
under study. Secondly, it is summarize the purpose of testing from the
operator point of view, highlighting the possible benefits which can be
brought by the feature. Afterwards, the chapter will show the network
designs, recommended parameterizations and configurations required to
perform the test itself. The reader should bear in mind that the designs and
test cases described herein were used as a deployment reference for the rest
Overview of UMTS network evolution through radio and transmission feature validation Jorge Rafael Sevilla Castillo
14
of Major Country Operators (MCOs) in France Telecom Group, so the
inspection of low-level commands and the description of the network
elements’ commissioning procedures are relevant for the purpose of the
document. Providing installation guidelines of all the new hardware
introduced within these chapters was also part of the testbed environment
preparation, but not relevant for the scope of the thesis. Each chapter finishes
with the presentation of the test results and conclusions, which are translated
into recommendations for live network deployment activities.
The test cases presented in this document will give the reader an end to end
understanding of the main aspects concerning a 3G network and the interworking with
other radio access technologies, such as 2G systems. They are structured as follows:
1) Mobility: two features have been selected within this category. 2G and 3G
coverage layers are usually overlapped. Under these conditions, the operator
must ensure that user is given the best service experience, network camping
procedures - that is, when the User Equipment (UE) is firstly switched on -
must be oriented to avoid continuous ping-pong between layers, considering
the best signal quality. Chapter 1 Cell Selection Parameter Set shows what
can be done to alleviate this problem. Once a mobile user enters the
connected mode, it will experience handover procedures within 3G system,
but the lack of 3G coverage at some points of the network usually is
translated into an inter-system handover to 2G. However, sometimes this
degradation in radio conditions might be just a matter of seconds (3G signal
fading, poor in-building coverage…) and the user is unnecessarily degraded
to a lower performance coverage layer. The feature introduced in Chapter 2
2G/3G Inter-System Handover Cancellation explains how these situations can
be avoided.
2) Quality of Service (QoS): if the operator wants to squeeze the era of data
monetization, it should firstly fit the network for this purpose. In a scenario
where the voice service has turned into a commodity product, the offer of
different data tariffs and premium data services is crucial to maintain a
competitive advantage in the mobile market. Chapter 3 QoS Aware HSPA
Scheduling explains how QoS is implemented in a 3G network and what can
be done in the radio system to prioritize premium user services. In addition,
Overview of UMTS network evolution through radio and transmission feature validation Jorge Rafael Sevilla Castillo
15
due to the relevance of this topic, it is explained the implementation of QoS
in current 4G networks.
3) Transmission: finally, Chapter 4 Hybrid Backhaul and Full IP evolution, will
introduce the importance of a hand in hand evolution of transmission
network if the operator wants to squeeze the maximum radio capabilities
brought by 3GPP standard. Considering that the starting point is a low
capacity transmission network with copper-based E1 connections in IuB
interface, the chapter explains the evolution path in two steps: first of all, the
Hybrid Backhaul solution is introduced, which explains how to emulate
Asynchronous Transfer Mode (ATM) connections over Fast Ethernet media,
showing the path for the second solution tested, IuB over IP, which
introduces the IP convergence process in the IuB protocol stack and, also,
offers a quick overview of how QoS can be controlled by using IP protocol
standard specifications.
Chapter 5 Conclusions and future work will summarize the main results obtained on
each part and which network evolutions could be studied now that 4G networks are
being massively deployed in the mobile ecosystem.
Overview of UMTS network evolution through radio and transmission feature validation Jorge Rafael Sevilla Castillo
16
1 Cell Selection Parameter Set
1.1 Theoretical Background
1.1.1 Radio Resource Control
The Radio Resource Control (RRC) handles the control plane signaling of layer 3
between the UEs and the Radio Access Network (RAN). RRC allows a dialogue between
the RAN and the UE and also between the core network and the UE. An RRC connection
is a logical association between the UE and the RAN used by two peer identities to
support the upper layer exchange of information flows. There can only be one RRC
connection per UE.
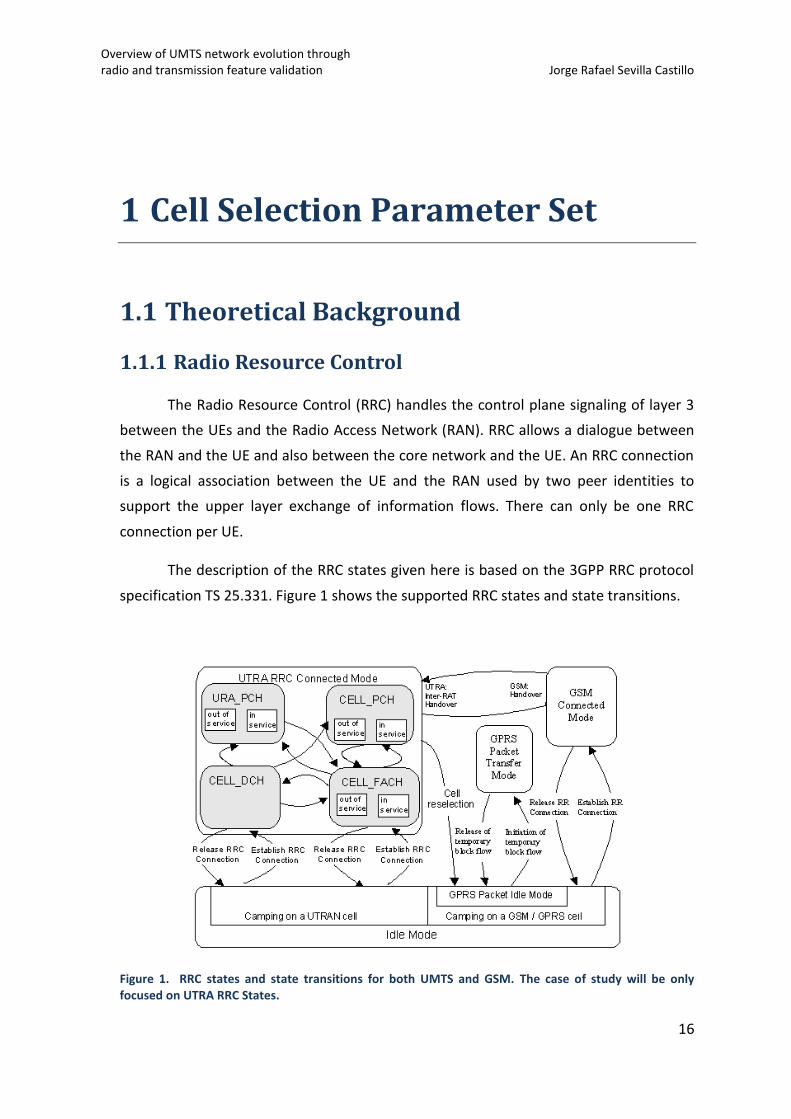
The description of the RRC states given here is based on the 3GPP RRC protocol
specification TS 25.331. Figure 1 shows the supported RRC states and state transitions.
Figure 1. RRC states and state transitions for both UMTS and GSM. The case of study will be only focused on UTRA RRC States.
Overview of UMTS network evolution through radio and transmission feature validation Jorge Rafael Sevilla Castillo
17
Since the analysis is focused on UTRAN, according to Figure 1, there are two
general states in which the UE can be: idle mode and connected mode.
Idle mode
When the UE is switched on, it selects a Public Land Mobile Network (PLMN) and
searches for a suitable cell to camp on. Once the suitable cell is found, the UE tunes
itself to the control channel of that cell. Selecting a cell in this manner is known as
“camping on the cell”.
After the power is switched on, the UE stays in idle mode until it transmits a
request to establish an RRC connection. In idle mode, the connection of the UE is closed
on all layers of the UTRAN and the UE can be only identifies by Non Access Stratum
identities such as International Mobile Subscriber Identity (IMSI), Temporary
international Mobile Subscriber Identity (TMSI) or packet TMSI (P-TMSI).
Once in connected mode, the UE will return to idle mode when the RRC
connection is released or there is a failure during the RRC establishment.
Connected mode
When a signaling connection exists, there is an RRC connection and the UE is in
UTRAN connected mode. In this mode, the position of the UE is known on cell level and
can be in one of the following four states: CELL_FACH, CELL_DCH, CELL_PCH or
URA_PCH.
The CELL_DCH state is characterized by the allocation of a dedicated transport
channel to the UE. The UE is transferred from idle mode to CELL_DCH through the setup
of an RRC connection or by establishing a Dedicated Channel (DCH) from CELL_FACH
state. Transition from CELL_DCH to idle mode is done through the release of the RRC
connection. Transition from CELL_DCH to CELL_FACH is performed when the last active
Non Real Time (NRT) DCH is released and there is no Real Time (RT) Radio Access Bearer
(RAB). Finally, transition from CELL_DCH to CELL_PCH/URA_PCH cam be performed
when during inactive NRT connection, RT service is released.
In CELL_FACH state the UE monitors the Forward Access Channel (FACH). In this
state, the UE is able to transmit uplink control signals and may be able to transmit small
data packets on the Random Access Channel (RACH). A transition from CELL_FACH to
CELL_DCH occurs when a dedicated transport channel is established through explicit
signaling. Whilst in CELL_FACH, the UE monitors the FACH continuously and therefore it
Overview of UMTS network evolution through radio and transmission feature validation Jorge Rafael Sevilla Castillo
18
should be moved to CELL_PCH sub state when the data service has been inactive for a
while. When the timer expires, the UE is transferred to CELL_PCH in order to decrease
UE power consumption. When the RRC connection is released, the UE is moved back to
idle mode.
In CELL_PCH and URA_PCH sub states, the UE listens to the PCH transport
channel. The dedicated control channel (DCCH) logical channel cannot be used in this
state. If the network wants to initiate any activity, it needs to make a paging request on
the PCCH logical channel in the known cells to initiate any downlink activity. The UE
initiates a cell update procedure when it selects a new cell in CELL_PCH sate. The only
overhead in keeping a UE in PCH state is the potential possibility of cell updating when
the UE moves to other cells. To reduce it, the UE is moved to URA_PCH when low
activity is observed. The UE is transferred from CELL_PCH to CELL_FACH state either by a
packet paging command from Radio Access Network (RAN) or through any uplink
access.
It is worth mentioning that an operator may not have activated all the RRC
states, being the most common configuration formed by idle mode, CELL_FACH and
CELL_DCH states.
1.1.2 System Information Block type 3 and 4
When the UE is switched on, the UE can read the status of the network via the
System Information Message broadcasted in the Broadcast Control Channel (BCCH). The
System Information Message consists of a Master Information Block (MIB) and several
System Information Blocks (SIBs 1, 2, 3, 5, 7 and 11, apart from 4, which is introduced
with this feature). The information in these SIBs helps the UE to establish a successful
communication with the network.
In this case it is interesting to analyze certain parameters communicated by SIB 3
and SIB 4, which define the cell selection criteria in idle mode and connected mode
respectively. This criterion is commanded by the equations shown in 1.2.4.
Overview of UMTS network evolution through radio and transmission feature validation Jorge Rafael Sevilla Castillo
19
1.2 Feature validation
1.2.1 Feature Description
Cell Selection Parameter Set feature includes the support of new hysteresis and
timer parameters for cell reselection introduced in 3GPP Rel5/Rel6. In addition, System
Information Block type 4 (SIB 4) scheduling on the BCCH is added to support different
parameters for cell selection and reselection in connected mode.
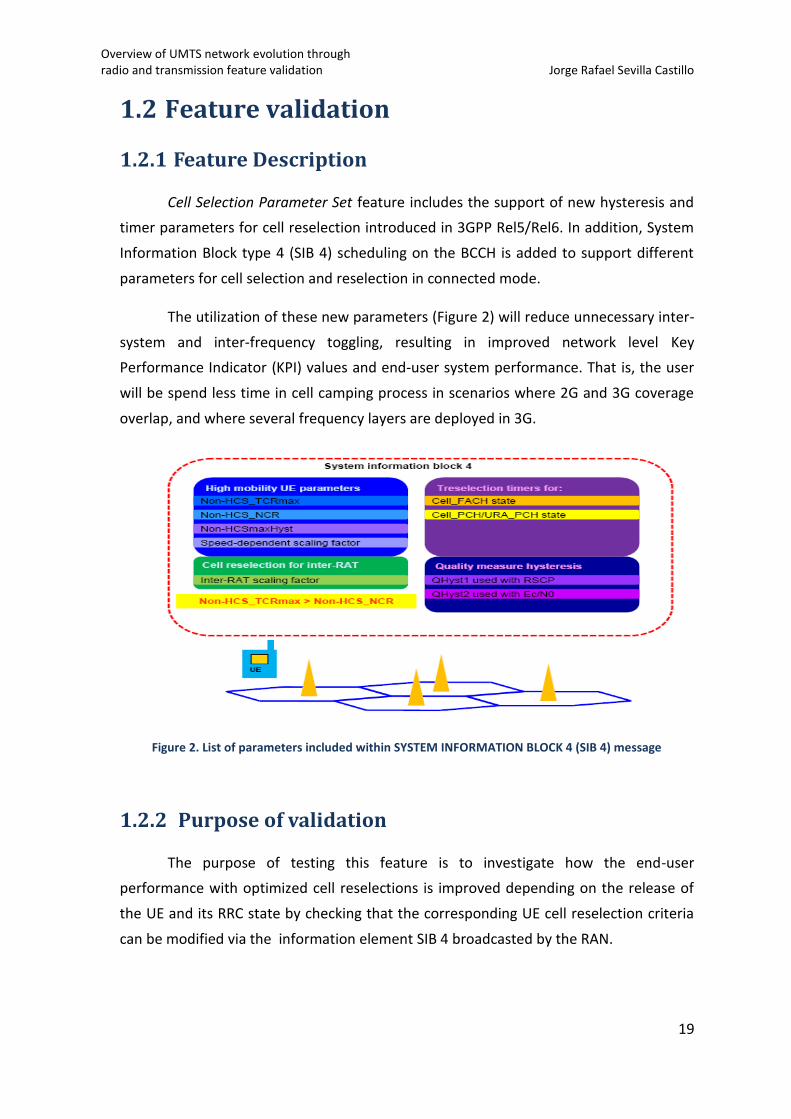
The utilization of these new parameters (Figure 2) will reduce unnecessary inter-
system and inter-frequency toggling, resulting in improved network level Key
Performance Indicator (KPI) values and end-user system performance. That is, the user
will be spend less time in cell camping process in scenarios where 2G and 3G coverage
overlap, and where several frequency layers are deployed in 3G.
Figure 2. List of parameters included within SYSTEM INFORMATION BLOCK 4 (SIB 4) message
1.2.2 Purpose of validation
The purpose of testing this feature is to investigate how the end-user
performance with optimized cell reselections is improved depending on the release of
the UE and its RRC state by checking that the corresponding UE cell reselection criteria
can be modified via the information element SIB 4 broadcasted by the RAN.
Overview of UMTS network evolution through radio and transmission feature validation Jorge Rafael Sevilla Castillo
20
1.2.3 Testbed configuration and settings
A detail of hardware and software levels required for the validation of this
feature is included in this section as well as configuration of the correct parameters
needed in Node B - also referred in this document as WCDMA Base Transceiver Station
(WBTS) - and RNC.
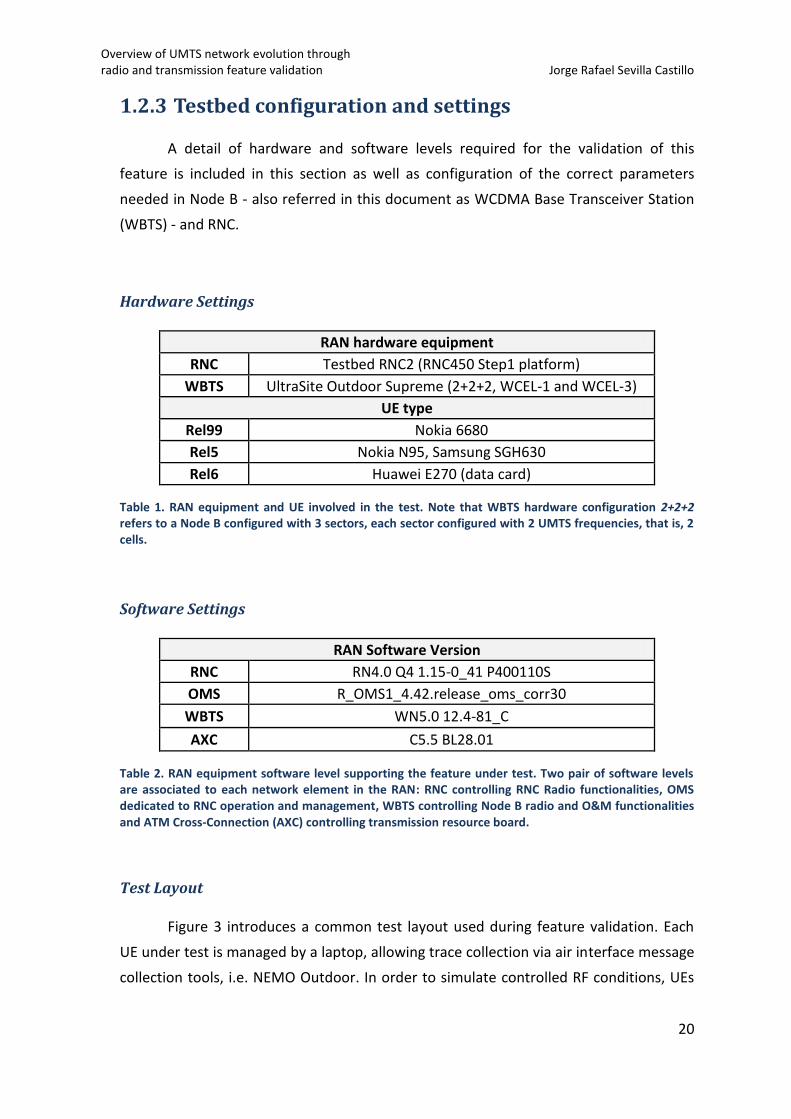
Hardware Settings
RAN hardware equipment
RNC Testbed RNC2 (RNC450 Step1 platform)
WBTS UltraSite Outdoor Supreme (2+2+2, WCEL-1 and WCEL-3)
UE type
Rel99 Nokia 6680
Rel5 Nokia N95, Samsung SGH630
Rel6 Huawei E270 (data card)
Table 1. RAN equipment and UE involved in the test. Note that WBTS hardware configuration 2+2+2 refers to a Node B configured with 3 sectors, each sector configured with 2 UMTS frequencies, that is, 2 cells.
Software Settings
RAN Software Version
RNC RN4.0 Q4 1.15-0_41 P400110S
OMS R_OMS1_4.42.release_oms_corr30
WBTS WN5.0 12.4-81_C
AXC C5.5 BL28.01
Table 2. RAN equipment software level supporting the feature under test. Two pair of software levels are associated to each network element in the RAN: RNC controlling RNC Radio functionalities, OMS dedicated to RNC operation and management, WBTS controlling Node B radio and O&M functionalities and ATM Cross-Connection (AXC) controlling transmission resource board.
Test Layout
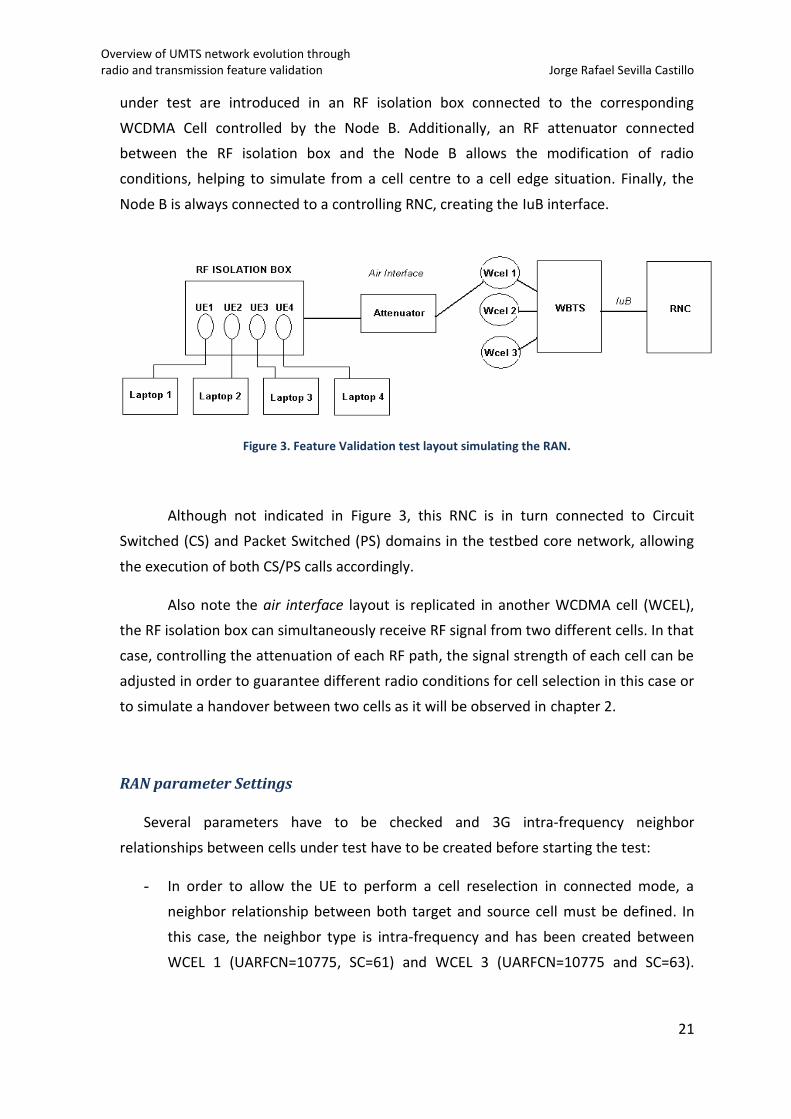
Figure 3 introduces a common test layout used during feature validation. Each
UE under test is managed by a laptop, allowing trace collection via air interface message
collection tools, i.e. NEMO Outdoor. In order to simulate controlled RF conditions, UEs
Overview of UMTS network evolution through radio and transmission feature validation Jorge Rafael Sevilla Castillo
21
under test are introduced in an RF isolation box connected to the corresponding
WCDMA Cell controlled by the Node B. Additionally, an RF attenuator connected
between the RF isolation box and the Node B allows the modification of radio
conditions, helping to simulate from a cell centre to a cell edge situation. Finally, the
Node B is always connected to a controlling RNC, creating the IuB interface.
Figure 3. Feature Validation test layout simulating the RAN.
Although not indicated in Figure 3, this RNC is in turn connected to Circuit
Switched (CS) and Packet Switched (PS) domains in the testbed core network, allowing
the execution of both CS/PS calls accordingly.
Also note the air interface layout is replicated in another WCDMA cell (WCEL),
the RF isolation box can simultaneously receive RF signal from two different cells. In that
case, controlling the attenuation of each RF path, the signal strength of each cell can be
adjusted in order to guarantee different radio conditions for cell selection in this case or
to simulate a handover between two cells as it will be observed in chapter 2.
RAN parameter Settings
Several parameters have to be checked and 3G intra-frequency neighbor
relationships between cells under test have to be created before starting the test:
- In order to allow the UE to perform a cell reselection in connected mode, a
neighbor relationship between both target and source cell must be defined. In
this case, the neighbor type is intra-frequency and has been created between
WCEL 1 (UARFCN=10775, SC=61) and WCEL 3 (UARFCN=10775 and SC=63).
Overview of UMTS network evolution through radio and transmission feature validation Jorge Rafael Sevilla Castillo
22
UARFCN indicates the channel number of DL UMTS frequency 2155 MHz (the
relationship between UARFCN and frequency is 1 to 5).
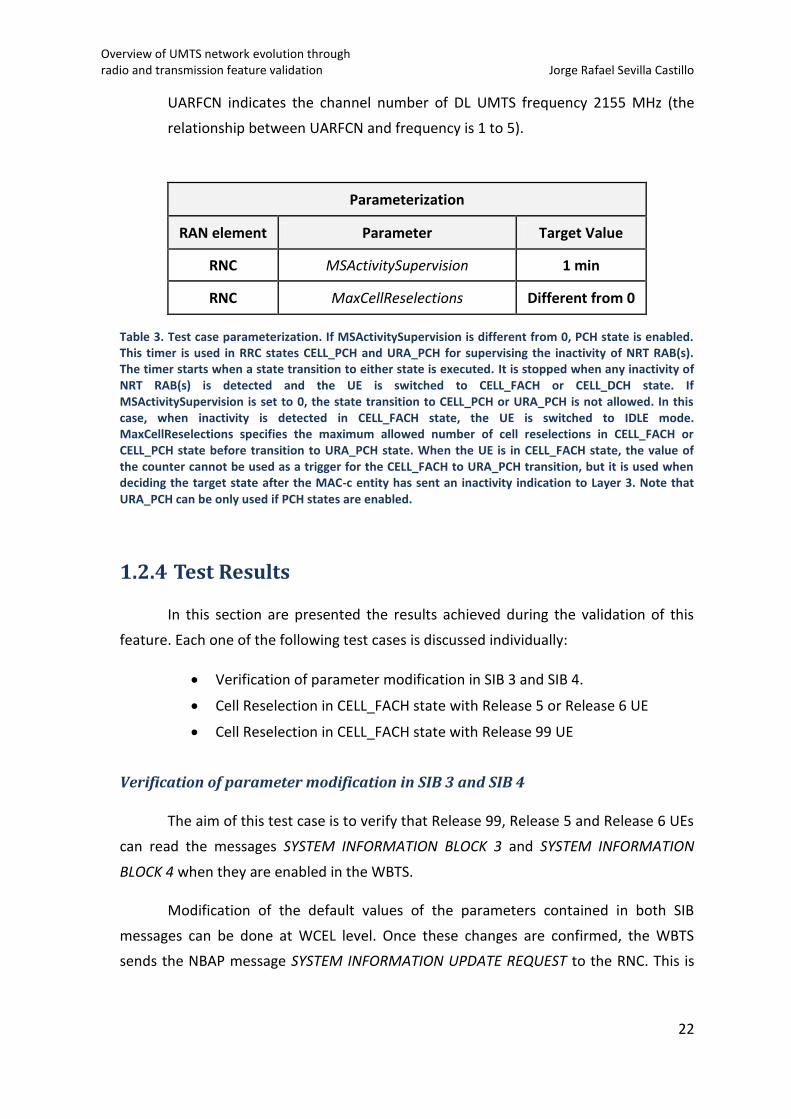
Parameterization
RAN element Parameter Target Value
RNC MSActivitySupervision 1 min
RNC MaxCellReselections Different from 0
Table 3. Test case parameterization. If MSActivitySupervision is different from 0, PCH state is enabled. This timer is used in RRC states CELL_PCH and URA_PCH for supervising the inactivity of NRT RAB(s). The timer starts when a state transition to either state is executed. It is stopped when any inactivity of NRT RAB(s) is detected and the UE is switched to CELL_FACH or CELL_DCH state. If MSActivitySupervision is set to 0, the state transition to CELL_PCH or URA_PCH is not allowed. In this case, when inactivity is detected in CELL_FACH state, the UE is switched to IDLE mode. MaxCellReselections specifies the maximum allowed number of cell reselections in CELL_FACH or CELL_PCH state before transition to URA_PCH state. When the UE is in CELL_FACH state, the value of the counter cannot be used as a trigger for the CELL_FACH to URA_PCH transition, but it is used when deciding the target state after the MAC-c entity has sent an inactivity indication to Layer 3. Note that URA_PCH can be only used if PCH states are enabled.
1.2.4 Test Results
In this section are presented the results achieved during the validation of this
feature. Each one of the following test cases is discussed individually:
Verification of parameter modification in SIB 3 and SIB 4.
Cell Reselection in CELL_FACH state with Release 5 or Release 6 UE
Cell Reselection in CELL_FACH state with Release 99 UE
Verification of parameter modification in SIB 3 and SIB 4
The aim of this test case is to verify that Release 99, Release 5 and Release 6 UEs
can read the messages SYSTEM INFORMATION BLOCK 3 and SYSTEM INFORMATION
BLOCK 4 when they are enabled in the WBTS.
Modification of the default values of the parameters contained in both SIB
messages can be done at WCEL level. Once these changes are confirmed, the WBTS
sends the NBAP message SYSTEM INFORMATION UPDATE REQUEST to the RNC. This is
Overview of UMTS network evolution through radio and transmission feature validation Jorge Rafael Sevilla Castillo
23
also verified by analyzing the IuB interface with Nethawk M5 interface protocol
analyzer.
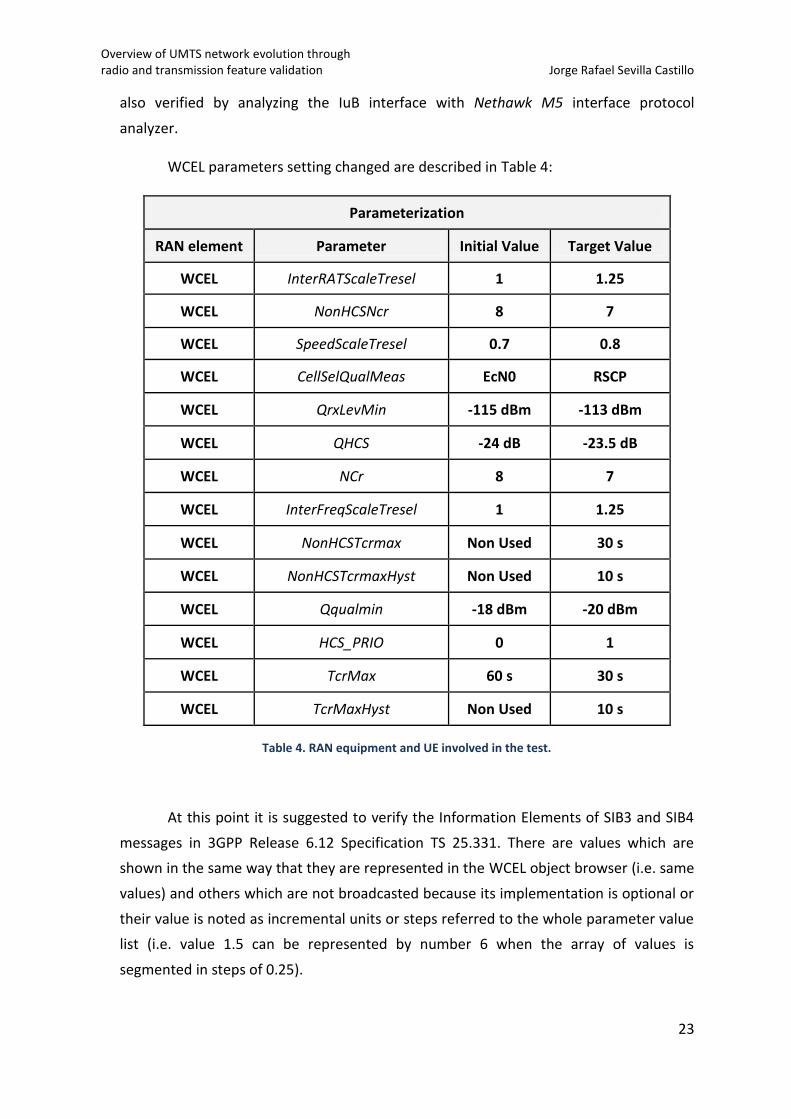
WCEL parameters setting changed are described in Table 4:
Parameterization
RAN element Parameter Initial Value Target Value
WCEL InterRATScaleTresel 1 1.25
WCEL NonHCSNcr 8 7
WCEL SpeedScaleTresel 0.7 0.8
WCEL CellSelQualMeas EcN0 RSCP
WCEL QrxLevMin -115 dBm -113 dBm
WCEL QHCS -24 dB -23.5 dB
WCEL NCr 8 7
WCEL InterFreqScaleTresel 1 1.25
WCEL NonHCSTcrmax Non Used 30 s
WCEL NonHCSTcrmaxHyst Non Used 10 s
WCEL Qqualmin -18 dBm -20 dBm
WCEL HCS_PRIO 0 1
WCEL TcrMax 60 s 30 s
WCEL TcrMaxHyst Non Used 10 s
Table 4. RAN equipment and UE involved in the test.
At this point it is suggested to verify the Information Elements of SIB3 and SIB4
messages in 3GPP Release 6.12 Specification TS 25.331. There are values which are
shown in the same way that they are represented in the WCEL object browser (i.e. same
values) and others which are not broadcasted because its implementation is optional or
their value is noted as incremental units or steps referred to the whole parameter value
list (i.e. value 1.5 can be represented by number 6 when the array of values is
segmented in steps of 0.25).
Overview of UMTS network evolution through radio and transmission feature validation Jorge Rafael Sevilla Castillo
24
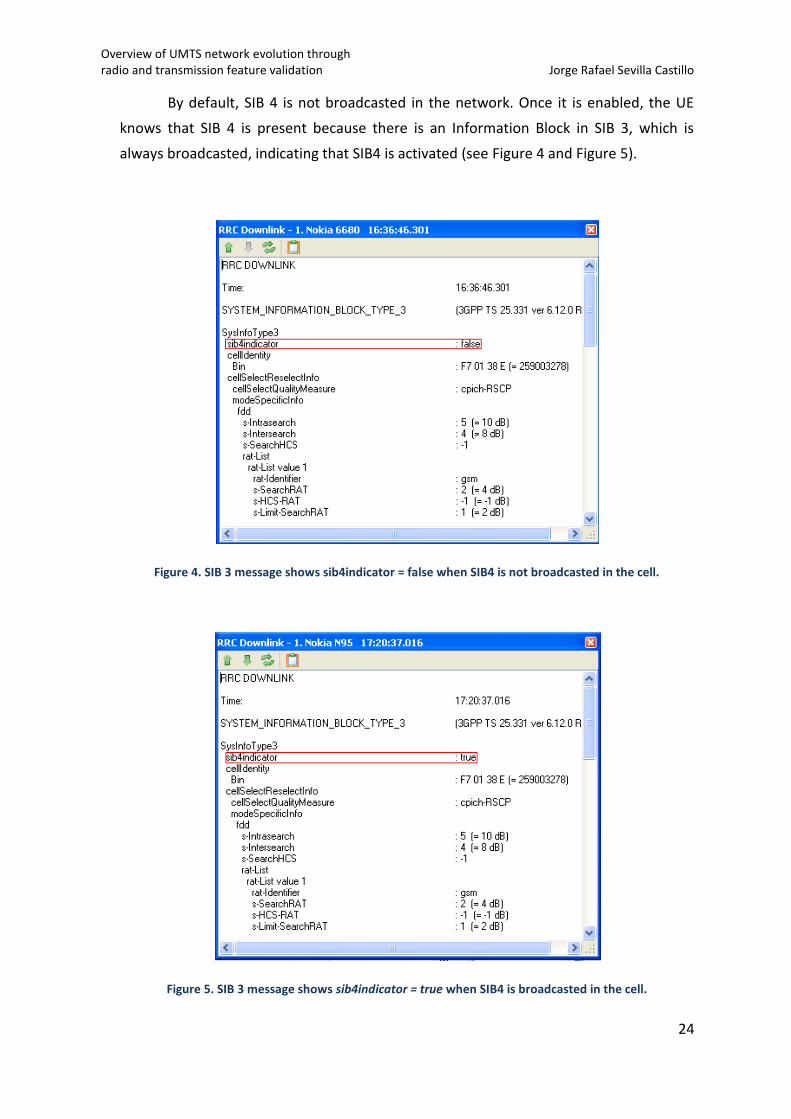
By default, SIB 4 is not broadcasted in the network. Once it is enabled, the UE
knows that SIB 4 is present because there is an Information Block in SIB 3, which is
always broadcasted, indicating that SIB4 is activated (see Figure 4 and Figure 5).
Figure 4. SIB 3 message shows sib4indicator = false when SIB4 is not broadcasted in the cell.
Figure 5. SIB 3 message shows sib4indicator = true when SIB4 is broadcasted in the cell.
Overview of UMTS network evolution through radio and transmission feature validation Jorge Rafael Sevilla Castillo
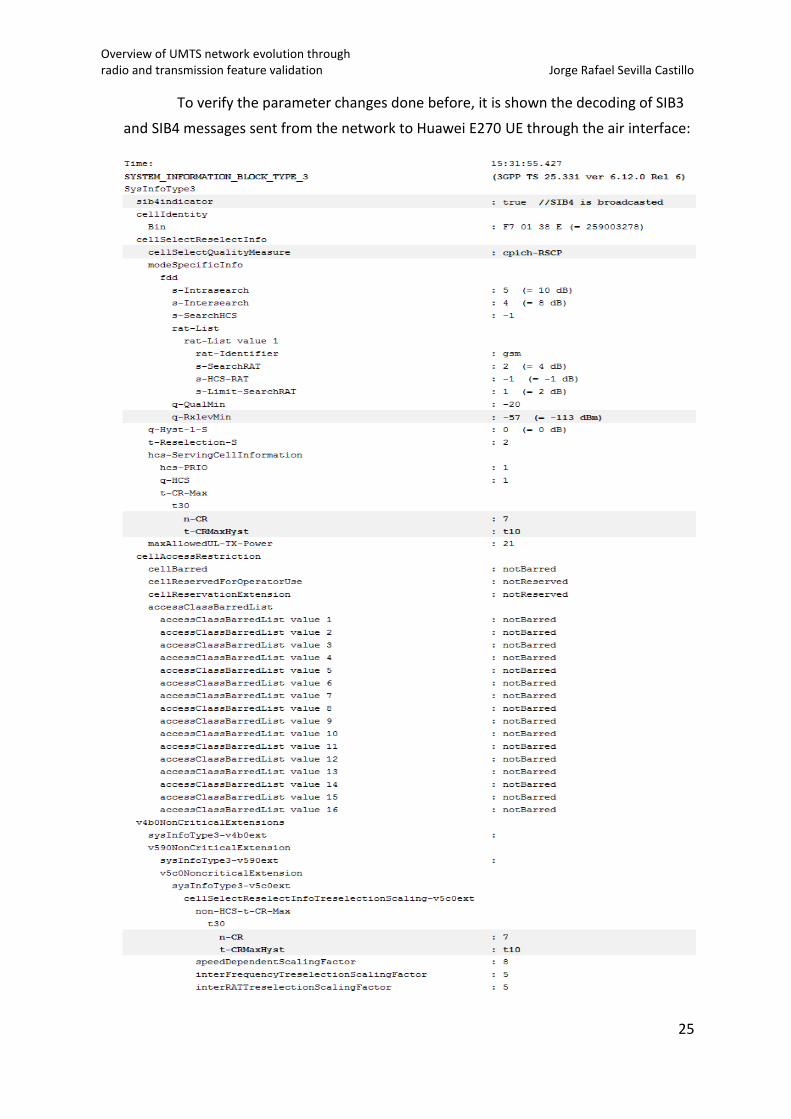
25
To verify the parameter changes done before, it is shown the decoding of SIB3
and SIB4 messages sent from the network to Huawei E270 UE through the air interface:
Overview of UMTS network evolution through radio and transmission feature validation Jorge Rafael Sevilla Castillo
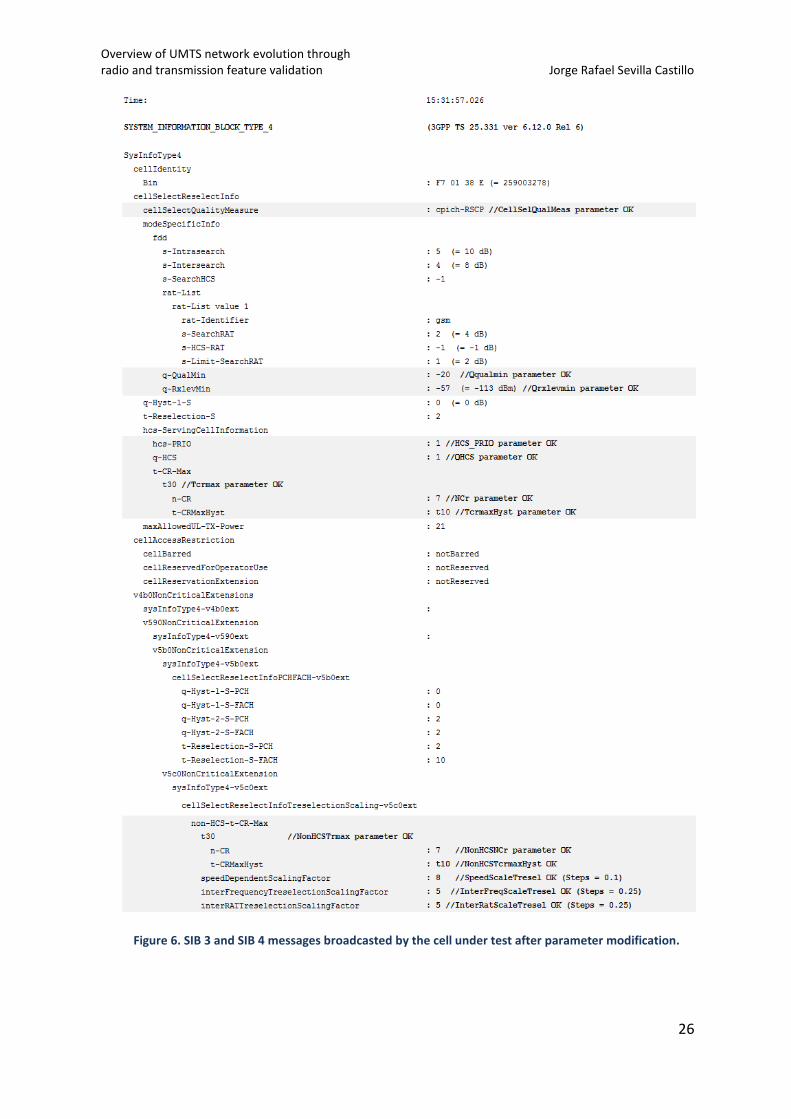
26
Figure 6. SIB 3 and SIB 4 messages broadcasted by the cell under test after parameter modification.
Overview of UMTS network evolution through radio and transmission feature validation Jorge Rafael Sevilla Castillo
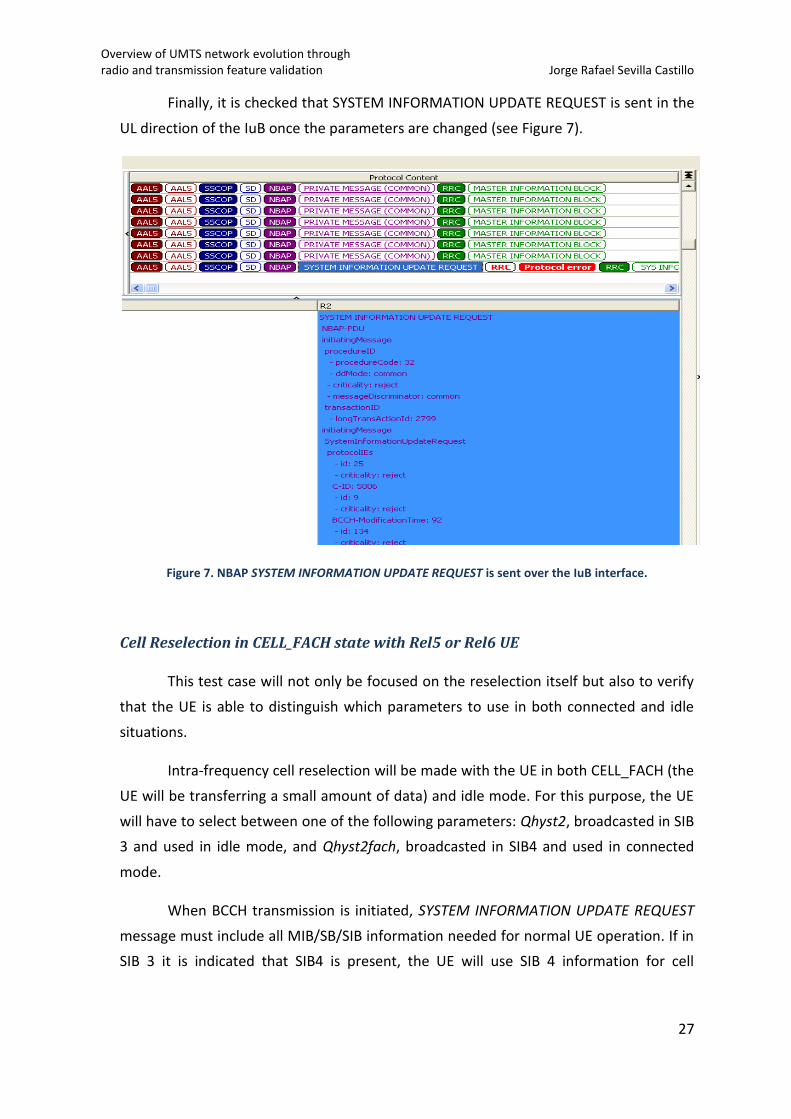
27
Finally, it is checked that SYSTEM INFORMATION UPDATE REQUEST is sent in the
UL direction of the IuB once the parameters are changed (see Figure 7).
Figure 7. NBAP SYSTEM INFORMATION UPDATE REQUEST is sent over the IuB interface.
Cell Reselection in CELL_FACH state with Rel5 or Rel6 UE
This test case will not only be focused on the reselection itself but also to verify
that the UE is able to distinguish which parameters to use in both connected and idle
situations.
Intra-frequency cell reselection will be made with the UE in both CELL_FACH (the
UE will be transferring a small amount of data) and idle mode. For this purpose, the UE
will have to select between one of the following parameters: Qhyst2, broadcasted in SIB
3 and used in idle mode, and Qhyst2fach, broadcasted in SIB4 and used in connected
mode.
When BCCH transmission is initiated, SYSTEM INFORMATION UPDATE REQUEST
message must include all MIB/SB/SIB information needed for normal UE operation. If in
SIB 3 it is indicated that SIB4 is present, the UE will use SIB 4 information for cell
Overview of UMTS network evolution through radio and transmission feature validation Jorge Rafael Sevilla Castillo
28
selection and re-selection in connected mode. Otherwise, SIB 3 information is used in
both idle and connected mode.
At this point it is worth mentioning that the use of Qhyst2fach is the main
difference between performing cell reselections between Release 99 UEs and Release
5/Release 6 UEs. Even though a Release 99 UE is able to read SIB 4 messages, it cannot
decipher its content, so this kind of UEs will always use the parameter Qhyst2 for its cell
selection criteria.
Environment and threshold modifications
Scenarios where Ec/N0 measurements are involved are very sensitive to
interference. It is important to set up the correct working environment so to have
maximum control over Ec/N0 in both WCEL 1 and WCEL 3 RF signals. It was proved that
using the same attenuator and avoiding interference with other RF sources eased the
achievement of results.
There are two main conditions to fulfill in order to perform a successful
reselection between WCEL 1 and WCEL 3 in both idle and connected mode:
For IDLE state:
1) CPICH Ec/N0 < Qqualmin + Sintrasearch_for_idle_mode; this equation fixes
the threshold from which measurements for cell reselection will be started.
2) Qhyst2; once condition 1 is met, Qhyst2 gives the absolute Ec/N0 difference
needed to perform a reselection between two cells. It means that a re-
selection will take place if Ec/N02 - Ec/N01 > Qhyst2, being Ec/N02 the quality
level of the destination cell and Ec/N01 the quality level of the source cell.
For FACH state:
1) CPICH Ec/N0 < Qqualmin + Sintrasearch_for_connected mode: this
equation fixes the threshold from which measurements for cell reselection
in CELL_FACH state will be started.
2) Qhyst2fach; Once condition 1 is met, Qhyst2 gives the absolute Ec/N0
difference needed to perform a reselection between two cells. It means that
Overview of UMTS network evolution through radio and transmission feature validation Jorge Rafael Sevilla Castillo
29
a re-selection will take place if Ec/N02 - Ec/N01 > Qhyst2fach, being Ec/N02
the quality level of the destination cell and Ec/N01 the quality level of the
source cell.
As previously said, these conditions will apply for a non-R99 UE. For a R99 UE
conditions set for IDLE state are also valid for FACH state.
The strategy followed to verify the functionality in both IDLE and a FACH cell
states is the following: same Sintrasearch value has been defined for both idle and
connected mode, so the cell reselection trigger criteria will be the same (Qqualmin
remains constant for both states). Therefore, by defining Qhyst2 < Qhyst2fach it will be
possible to verify a different cell reselection threshold for idle and connected mode.
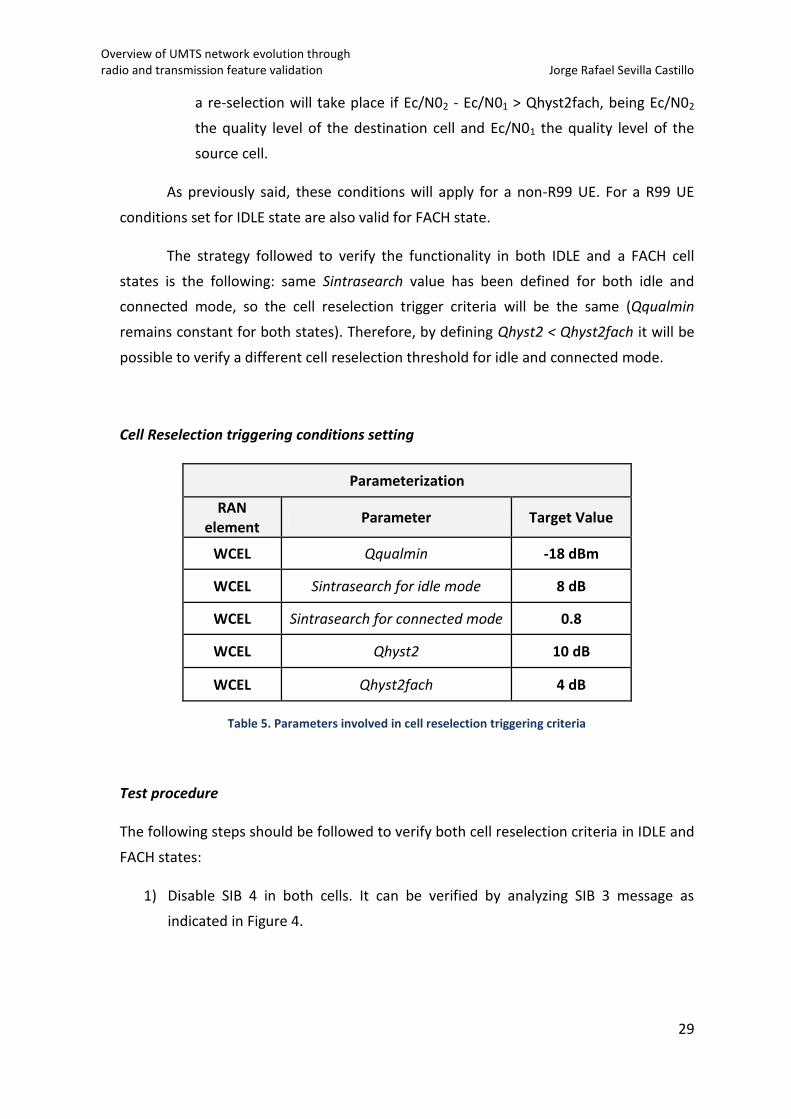
Cell Reselection triggering conditions setting
Parameterization
RAN element
Parameter Target Value
WCEL Qqualmin -18 dBm
WCEL Sintrasearch for idle mode 8 dB
WCEL Sintrasearch for connected mode 0.8
WCEL Qhyst2 10 dB
WCEL Qhyst2fach 4 dB
Table 5. Parameters involved in cell reselection triggering criteria
Test procedure
The following steps should be followed to verify both cell reselection criteria in IDLE and
FACH states:
1) Disable SIB 4 in both cells. It can be verified by analyzing SIB 3 message as
indicated in Figure 4.
Overview of UMTS network evolution through radio and transmission feature validation Jorge Rafael Sevilla Castillo
30
2) Cell re-selection is performed in IDLE state. First of all, attenuation conditions are
set in order to meet condition 1 and then verify that the cell-reselection is done
once according to condition 2.
3) Cell re-selection is performed in FACH state. Condition 1 and condition 2 have to
be met the same way as in step 2. Since SIB 4 has not been broadcasted, the UE
should be using conditions set for idle state.
4) SIB 4 is enabled in both cells. It can be verified by analyzing SIB 3 as indicated in
Figure 5.
5) Cell re-selection is performed in IDLE state. The UE should be using idle mode
conditions.
6) Cell re-selection is performed in FACH state. The UE should be using FACH state
conditions since SIB 4 has been broadcasted.
How to force the UE to send data in FACH state
NEMO Outdoor can be used to monitor the UE RRC state. When the UE is switched on it
starts in IDLE mode. A 0 byte ping, running in the background, to the File Transfer
Protocol (FTP) server used during the test (ping 192.168.1.2 –l 0 –t) switches the UE to
DCH state. If the command is stopped for a few seconds, the RRC status monitor will
show that the UE is in FACH state and, after that, the UE can be maintained in this state
by re-running the same ping again.
Test Results
Successful results were achieved with Release 5 UE Nokia N95. The crucial point of the
test case is that once SIB 4 is enabled, cell reselection in IDLE follows Qhyst2 criteria,
whereas in FACH it will follow Qhyst2fach.
Overview of UMTS network evolution through radio and transmission feature validation Jorge Rafael Sevilla Castillo
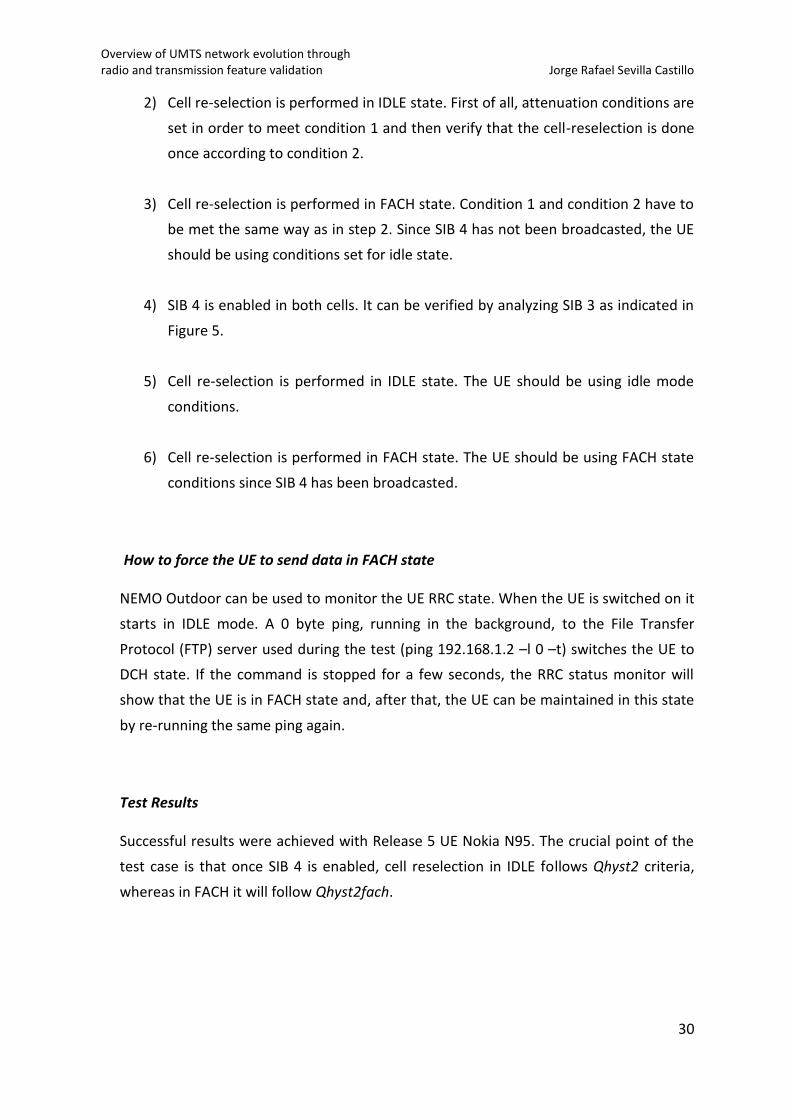
31
Figure 8. Situation just a timestamp before cell reselection occurs in IDLE mode (Note RRC State = IDLE). Screenshot from NEMO Outdoor, showing RSRP and Ec/N0 levels for both serving (blue) cell and target (red) cell.
Initial situation is displayed in Figure 8, where CPICH RSRP and Ec/N0 is shown for both
the current serving cell (WCEL-1, blue) and the target cell (WCEL-2, red) where the
reselection should occur. According to the parameters set in Table 5, CPICH Ec/N01 < -10
dB and Ec/N02 – Ec/N01 = 11 dB > Qhyst2, thus the reselection in IDLE mode occurs since
conditions 1 and 2 for IDLE mode are met.
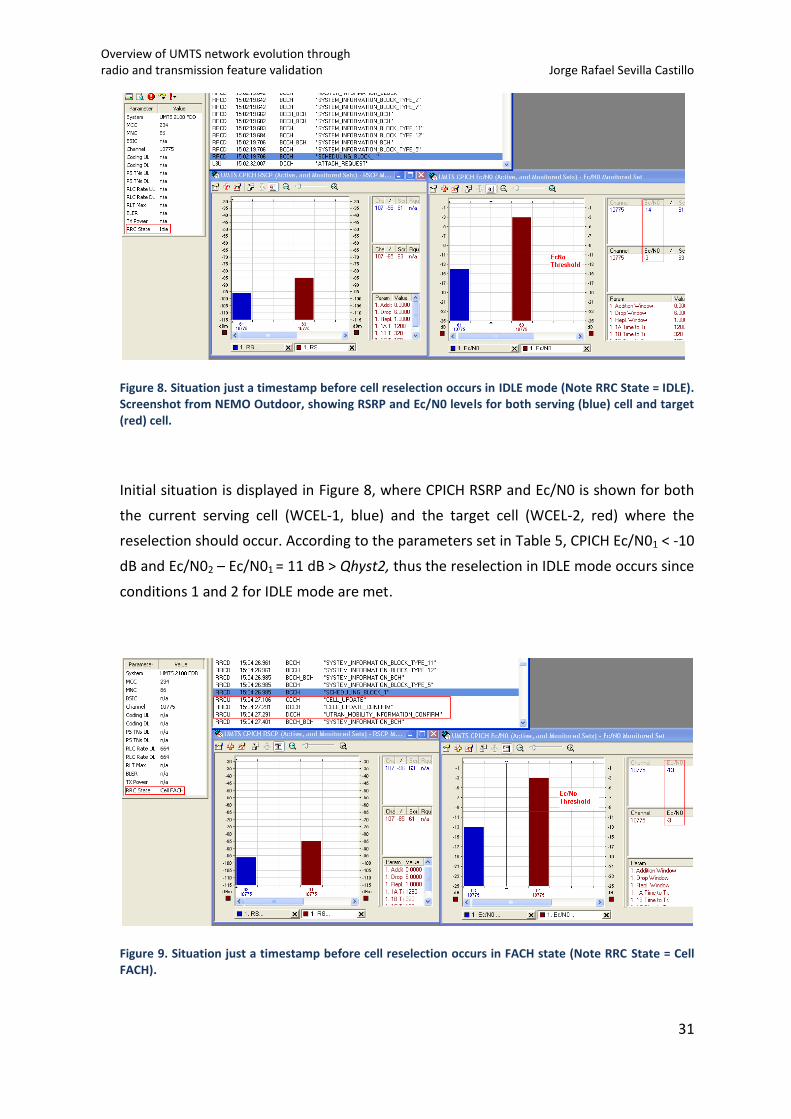
Figure 9. Situation just a timestamp before cell reselection occurs in FACH state (Note RRC State = Cell FACH).
Overview of UMTS network evolution through radio and transmission feature validation Jorge Rafael Sevilla Castillo
32
Once the UE has been forced to enter CELL_FACH state, it can be observed in Figure 9
the radio status the timestamp just before the reselection is triggered. At this point,
CPICH Ec/N01 < -10 dB and Ec/N02 – Ec/N01 = 10 dB > Qhyst2. Additionally, SIB 4 is
disabled at this stage, so Qhyst2fach is not available yet. Note that in CELL_FACH state,
cell reselection is advertised by the UE with the message CELL UPDATE.
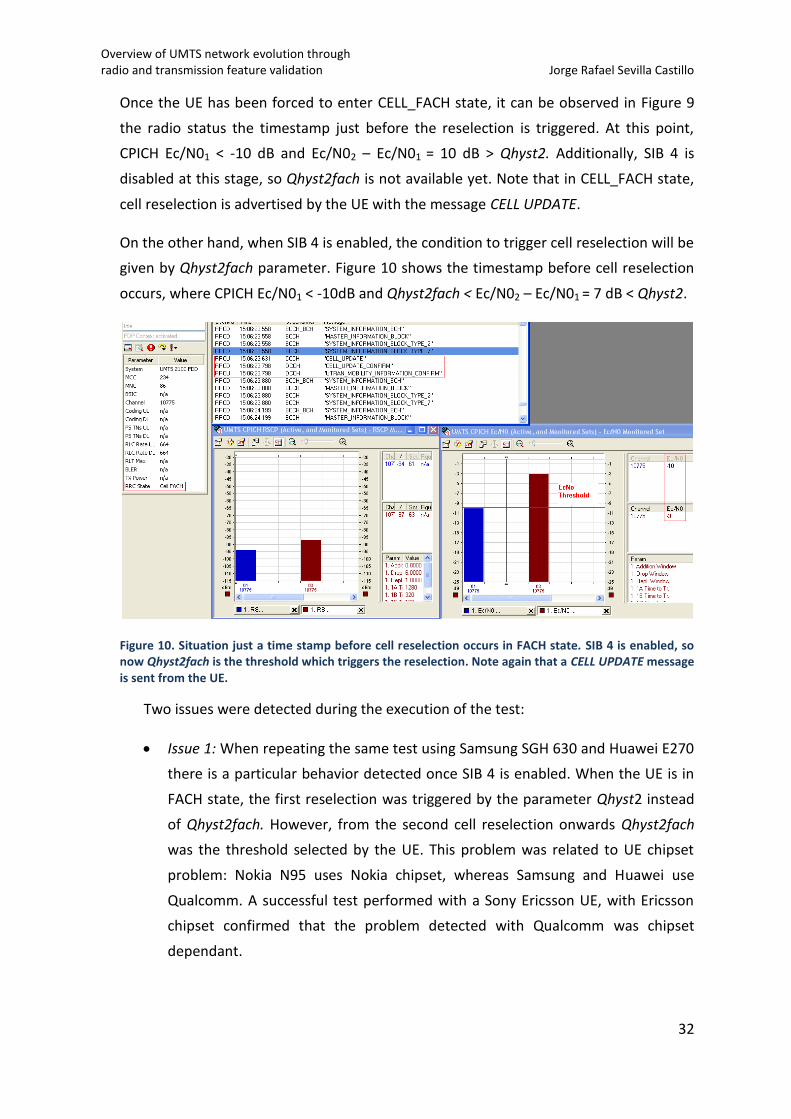
On the other hand, when SIB 4 is enabled, the condition to trigger cell reselection will be
given by Qhyst2fach parameter. Figure 10 shows the timestamp before cell reselection
occurs, where CPICH Ec/N01 < -10dB and Qhyst2fach < Ec/N02 – Ec/N01 = 7 dB < Qhyst2.
Figure 10. Situation just a time stamp before cell reselection occurs in FACH state. SIB 4 is enabled, so now Qhyst2fach is the threshold which triggers the reselection. Note again that a CELL UPDATE message is sent from the UE.
Two issues were detected during the execution of the test:
Issue 1: When repeating the same test using Samsung SGH 630 and Huawei E270
there is a particular behavior detected once SIB 4 is enabled. When the UE is in
FACH state, the first reselection was triggered by the parameter Qhyst2 instead
of Qhyst2fach. However, from the second cell reselection onwards Qhyst2fach
was the threshold selected by the UE. This problem was related to UE chipset
problem: Nokia N95 uses Nokia chipset, whereas Samsung and Huawei use
Qualcomm. A successful test performed with a Sony Ericsson UE, with Ericsson
chipset confirmed that the problem detected with Qualcomm was chipset
dependant.
Overview of UMTS network evolution through radio and transmission feature validation Jorge Rafael Sevilla Castillo
33
Issue 2: The range of values for Qhyst2 and Qhyst2fach parameters goes from 0
to 40 dB. In the worst case scenario of setting Qhyst2 = 40 dB, theoretically the
UE will never perform a cell reselection according to the conditions previously
explained. However, when the Ec/N0 difference between source and target cells
is nearly 16 dB, the UE always performs a cell reselection. It not only happened
with Qhyst2 set to 40dB, but also with values greater than 18 dB. One of the
possible causes behind this behavior could be associated to the dynamic signal
detection range of the UE.
Cell reselection in CELL_FACH state with R99 UE
Successful results were achieved for this scenario. The expected behavior was
witnessed: a R99 UE can read SIB 4 messages but cannot modify its cell reselection
criteria for CELL_FACH state according to Qhyst2fach. In both IDLE and FACH states the
cell reselection is triggered by Qhyst2 criteria.
1.2.5 Test Conclusions
Validation of the feature Cell Selection Parameter Set proved that:
SIB 3 and SIB 4 messages are correctly broadcasted and their information blocks
can be modified by the operator.
Release 99, Release 5 and Release 6 UEs trigger the same cell reselection
threshold when SIB 4 is disabled for both idle and connected mode.
Release 5 and Release 6 UEs modify their triggering criteria for cell reselection in
connected mode according to the parameter Qhyst2fach once SIB 4 is
broadcasted. The trigger criterion in idle mode remains unmodified.
Release 99 UE can read SIB 4 messages but its trigger criterion for connected
mode is still controlled with the parameter Qhyst2.
Issue 1 explained in section 1.2.4 reflects the importance of IOT (inter-operability
test) in feature testing. The operator should take into account the different kind of
handsets present in its network and deploy new features accordingly. In this case,
probably it was not worth for the operator to invest in this kind of features since

Overview of UMTS network evolution through radio and transmission feature validation Jorge Rafael Sevilla Castillo
34
majority of the users still had Global System for Mobile communications (GSM) or R99
UEs at the time of the test. In addition, Release 6 UEs at that very first stage were mainly
represented by data dongles usually oriented for static conditions.
Overview of UMTS network evolution through radio and transmission feature validation Jorge Rafael Sevilla Castillo
35
2 Inter-System Handover
Cancellation
2.1 Theoretical Background
2.1.1 Handover in Mobile networks: a quick overview
Mobile networks allow users to access services while on the move so giving end
users “freedom” in terms of mobility. However, this freedom does bring uncertainties to
mobile systems. The mobility of end users causes dynamic variations both in the link
quality and the interference level, sometimes requiring that a particular user change its
serving base station. This procedure is known as Handover (HO).
Handover is the essential component for dealing with the mobility of end users.
It guarantees the continuity of the wireless services when the mobile user moves across
cellular boundaries.
In first-generation cellular systems like AMPS, handovers were relatively simple.
Second-generation systems like GSM and PACS are superior to 1G systems in many
ways, including the handover algorithms used. More sophisticated signal processing and
handover decision procedures were incorporated in these systems, hence substantially
reducing handover decision delays. Since the introduction of CDMA technology, new
handover algorithms and types were developed in order to cope with new mobility
scenarios unveiled with 3G systems and the interaction of these with legacy GSM
technologies.
Overview of UMTS network evolution through radio and transmission feature validation Jorge Rafael Sevilla Castillo
36
2.1.2 Types of handover in 3G WCDMA systems
There are four different types of handovers in WCDMA mobile networks. They
are: Intra-system HO, Inter-system HO, Hard Handover (HHO), Soft Handover (SHO) and
Softer Handover.
Intra-System Handover
Intra-system HO occurs within one radio system. It can be further divided into
Intra-frequency HO and Inter-frequency HO. Intra-frequency occurs between cells
belonging to the same WCDMA carrier, while Inter-frequency occurs between cells
operating on different WCDMA carriers.
Inter-system HO
Inter-system HO takes place between cells belonging to two different Radio
Access Technologies (RATs) or different Radio Access Modes (RAMs). The most frequent
case for this type is expected between WCDMA and GSM/EDGE systems and this is the
focus of the work in this section.
Handover between two different CDMA systems also belongs to this type. An
example of inter-RAM HO is between UTRA FDD and UTRA TDD modes.
Hard Handover (HHO)
HHO is a category of HO procedures in which all the old radio links of a mobile
communication are released before the new radio links are established. For real-time
bearers it means a short disconnection of the bearer. However, for non-real time
bearers HHO is lossless. Hard handover can occur as intra or inter-frequency handover.
Soft Handover (SHO) and Softer HO
During soft handover, a mobile simultaneously communicates with two (2-way
SHO) or more cells belonging to different Base Stations of the same RNC (intra-RNC) or
different RNCs (inter-RNC). In the downlink (DL), the mobile receives both signals for
maximal ratio combining; in the uplink (UL), the mobile code channel is detected by
both Base Stations (2-way SHO), and is routed to the RNC for selection combining. Two
active power control loops participate in soft handover, one for each Base Transceiver
Station (BTS).
Overview of UMTS network evolution through radio and transmission feature validation Jorge Rafael Sevilla Castillo
37
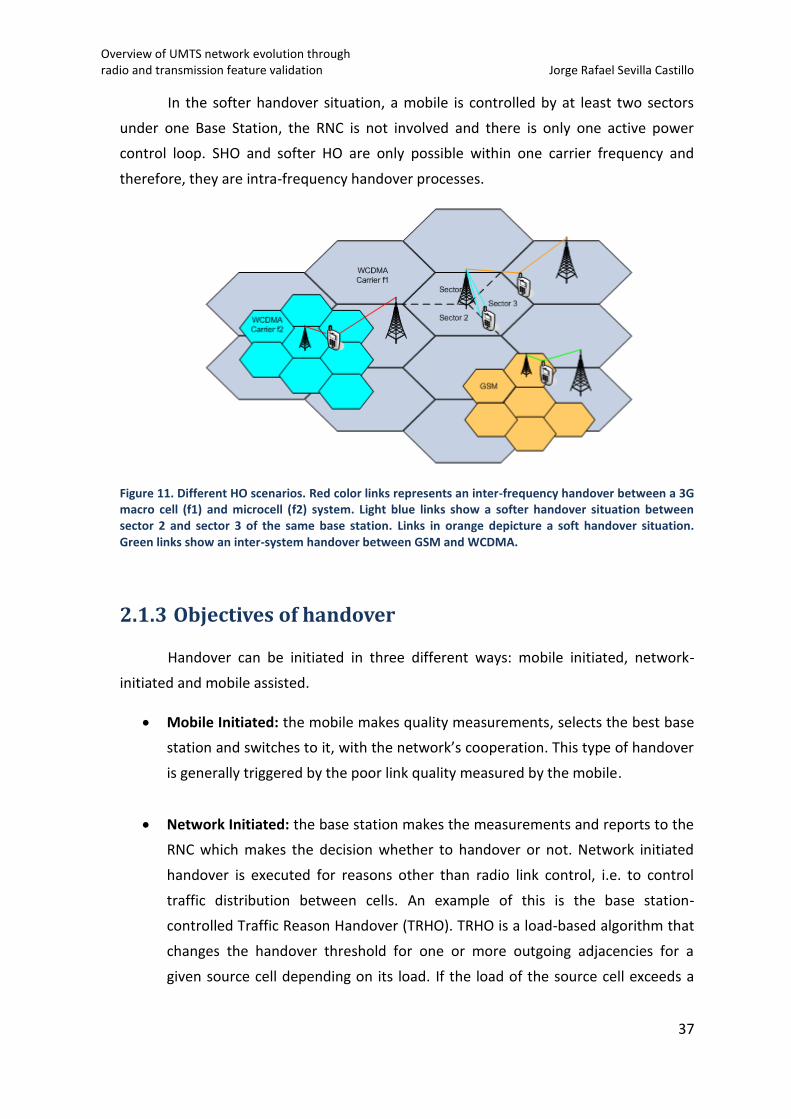
In the softer handover situation, a mobile is controlled by at least two sectors
under one Base Station, the RNC is not involved and there is only one active power
control loop. SHO and softer HO are only possible within one carrier frequency and
therefore, they are intra-frequency handover processes.
Figure 11. Different HO scenarios. Red color links represents an inter-frequency handover between a 3G macro cell (f1) and microcell (f2) system. Light blue links show a softer handover situation between sector 2 and sector 3 of the same base station. Links in orange depicture a soft handover situation. Green links show an inter-system handover between GSM and WCDMA.
2.1.3 Objectives of handover
Handover can be initiated in three different ways: mobile initiated, network-
initiated and mobile assisted.
Mobile Initiated: the mobile makes quality measurements, selects the best base
station and switches to it, with the network’s cooperation. This type of handover
is generally triggered by the poor link quality measured by the mobile.
Network Initiated: the base station makes the measurements and reports to the
RNC which makes the decision whether to handover or not. Network initiated
handover is executed for reasons other than radio link control, i.e. to control
traffic distribution between cells. An example of this is the base station-
controlled Traffic Reason Handover (TRHO). TRHO is a load-based algorithm that
changes the handover threshold for one or more outgoing adjacencies for a
given source cell depending on its load. If the load of the source cell exceeds a
Overview of UMTS network evolution through radio and transmission feature validation Jorge Rafael Sevilla Castillo
38
given level, and the load in a neighboring cell is below another given level, then
the source cell will shrink its coverage, handing over some traffic to the other
cell. Therefore, the overall blocking rate can be reduced, leading to a greater
utilization of the cell resource.
Mobile Assisted: here both the network and the mobile make measurements.
The mobile reports the measurement results from nearby base stations and the
network makes the decision to hand over or not.
The objectives of handover can be summarized as follows:
1) Guarantee the continuity of wireless services when the mobile user moves
across the cellular boundaries.
2) Keep required QoS levels.
3) Minimize the interference level of the whole system by keeping the mobile
linked to the strongest base station/s.
4) Roaming between different networks.
5) Distributing load from hot spot areas (load balancing).
The trigger that can be used for the initiation of a handover process could be the
UL or DL link quality, the changing of service, the speed variation, traffic reasons or
O&M (Operation & Maintenance) intervention.
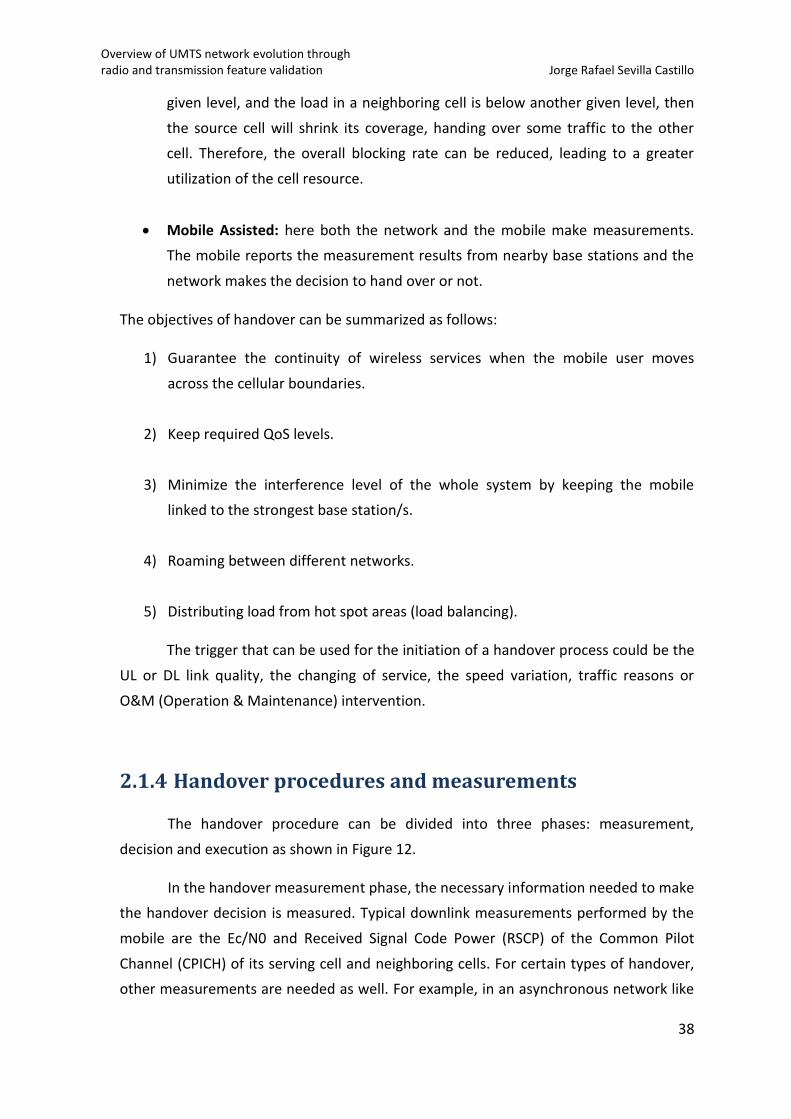
2.1.4 Handover procedures and measurements
The handover procedure can be divided into three phases: measurement,
decision and execution as shown in Figure 12.
In the handover measurement phase, the necessary information needed to make
the handover decision is measured. Typical downlink measurements performed by the
mobile are the Ec/N0 and Received Signal Code Power (RSCP) of the Common Pilot
Channel (CPICH) of its serving cell and neighboring cells. For certain types of handover,
other measurements are needed as well. For example, in an asynchronous network like
Overview of UMTS network evolution through radio and transmission feature validation Jorge Rafael Sevilla Castillo
39
UTRA FDD (WCDMA), the relative timing information between the cells needs to be
measured in order to adjust the transmission timing in soft handover to allow coherent
combining in the Rake receiver. Otherwise, the transmissions from different base
stations would be difficult to combine and especially the power control operation in soft
handover would suffer additional delay.
Figure 12. Handover Procedure
In the handover decision phase, the measurement results are compared against
the predefined thresholds and then it is decided whether to initiate the handover or
not. Different handover algorithms have different trigger conditions.
In the execution phase, the handover process is completed and the relative
parameters are changed according to the different types of handover. For example, in
the execution phase of the soft handover, the mobile enters or leaves the soft handover
state, a new base station is added or released, the active set is updated and the power
of each channel involved in soft handover is adjusted.
Overview of UMTS network evolution through radio and transmission feature validation Jorge Rafael Sevilla Castillo
40
2.1.5 Soft Handover (SHO)
Soft handover was introduced by CDMA technology. Compared to conventional
hard handover, soft handover has quite a few inherent advantages. However it also has
the disadvantages of complexity and extra resource consumption. Planning of soft
handover overhead is one of the fundamental components of the radio network
planning and optimization. In this section, the basic principles of soft handover are
presented.
Principles of soft handover
Soft handover is different from the traditional hard handover process. With hard
handover, a definite decision is made on whether to handover or not and the mobile
only communicates with one base station (BS) at a time. With soft handover, a
conditional decision is made on whether to handover or not. Depending on the changes
in pilot signal strength from the two or more BSs involved, a hard decision will
eventually be made to communicate with only one. This normally happens after it is
clear that the signal coming from one BS is considerably stronger than those coming
from the others. In the interim period of soft handover, the mobile communicates
simultaneously with all the BSs in the active set. The difference between hard and soft
handover is that the first one happens on a time point, whereas the second one lasts for
a period of time.
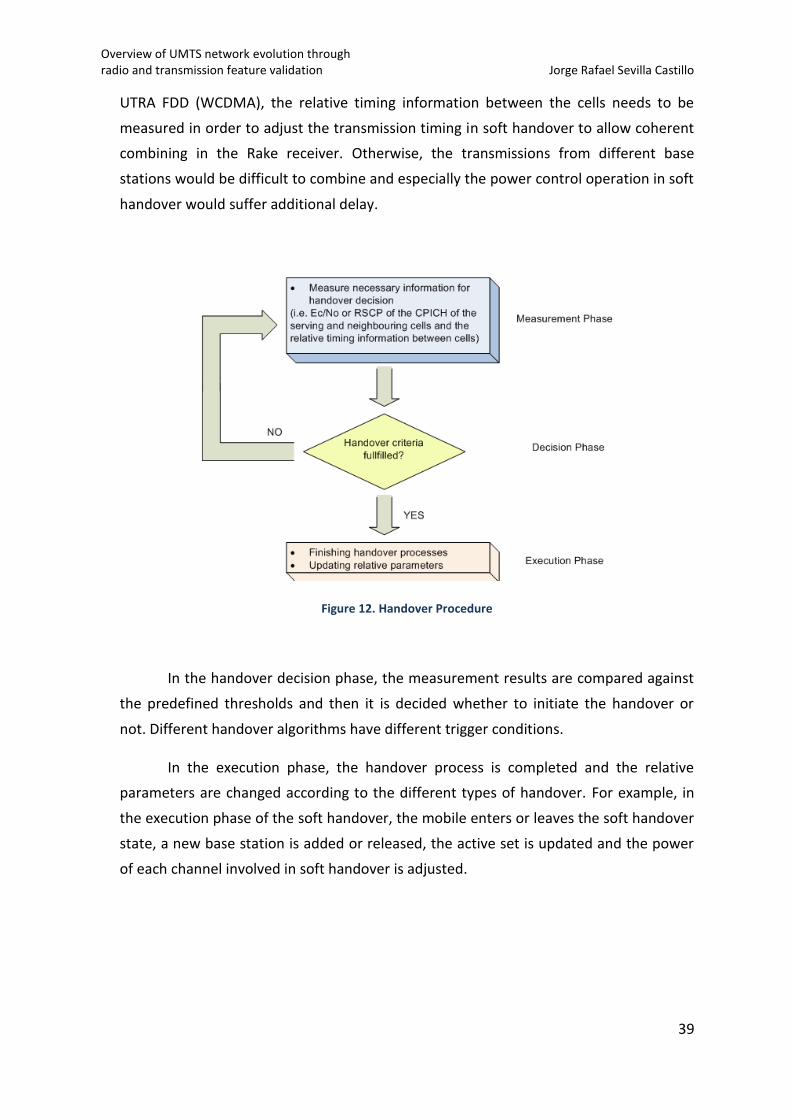
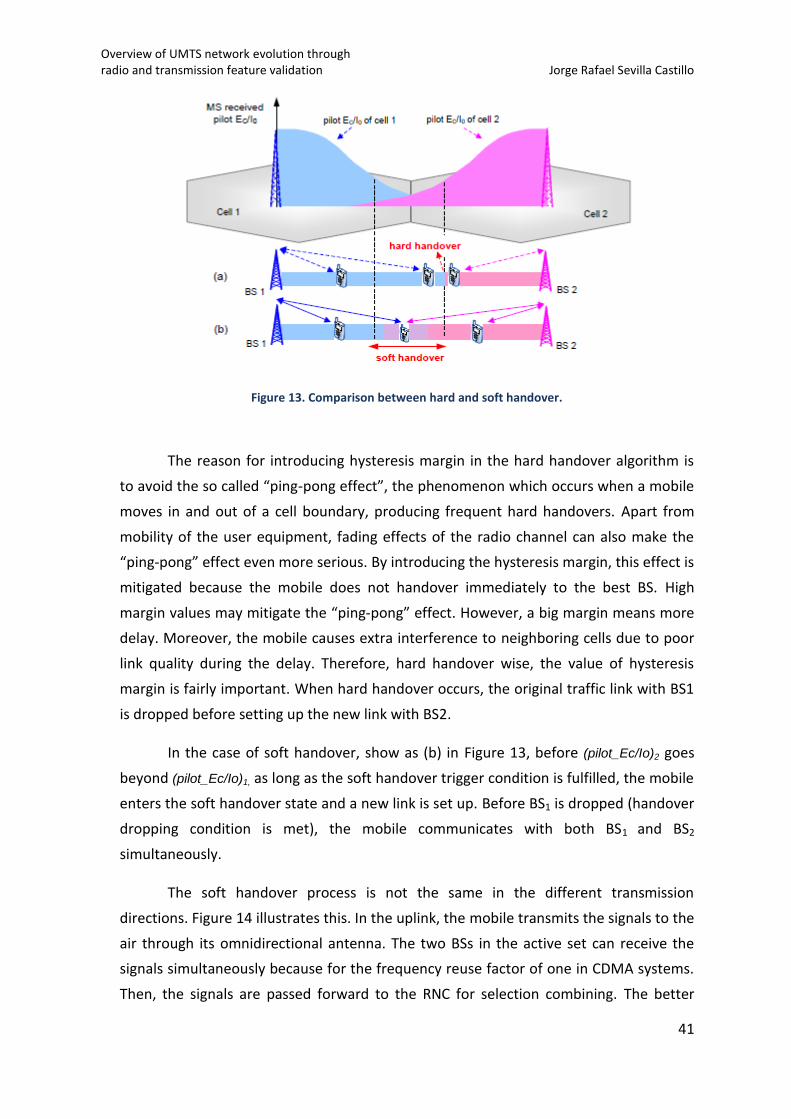
Figure 13 shows the basic process of hard and soft handover (2-way case).
Assuming there is a mobile terminal moving from cell1 to cell2, BS1 is the mobile’s
original serving BS. While moving, the mobile continuously measures the pilot signal
strength received from the nearby BSs. With hard handover shown as (a) in figure 3, the
trigger of the handover can be simply described as:
If (pilot_Ec/Io)2 - (pilot_Ec/Io)1 > D and BS1 is the serving BS
Handover to BS2;
Else
Do not handover;
End
Where (pilot_Ec/Io)1 and (pilot_Ec/Io)2 are the received pilot Ec/N0 from BS1 and BS2
respectively; D is the hysteresis margin.
Overview of UMTS network evolution through radio and transmission feature validation Jorge Rafael Sevilla Castillo
41
Figure 13. Comparison between hard and soft handover.
The reason for introducing hysteresis margin in the hard handover algorithm is
to avoid the so called “ping-pong effect”, the phenomenon which occurs when a mobile
moves in and out of a cell boundary, producing frequent hard handovers. Apart from
mobility of the user equipment, fading effects of the radio channel can also make the
“ping-pong” effect even more serious. By introducing the hysteresis margin, this effect is
mitigated because the mobile does not handover immediately to the best BS. High
margin values may mitigate the “ping-pong” effect. However, a big margin means more
delay. Moreover, the mobile causes extra interference to neighboring cells due to poor
link quality during the delay. Therefore, hard handover wise, the value of hysteresis
margin is fairly important. When hard handover occurs, the original traffic link with BS1
is dropped before setting up the new link with BS2.
In the case of soft handover, show as (b) in Figure 13, before (pilot_Ec/Io)2 goes
beyond (pilot_Ec/Io)1, as long as the soft handover trigger condition is fulfilled, the mobile
enters the soft handover state and a new link is set up. Before BS1 is dropped (handover
dropping condition is met), the mobile communicates with both BS1 and BS2
simultaneously.
The soft handover process is not the same in the different transmission
directions. Figure 14 illustrates this. In the uplink, the mobile transmits the signals to the
air through its omnidirectional antenna. The two BSs in the active set can receive the
signals simultaneously because for the frequency reuse factor of one in CDMA systems.
Then, the signals are passed forward to the RNC for selection combining. The better
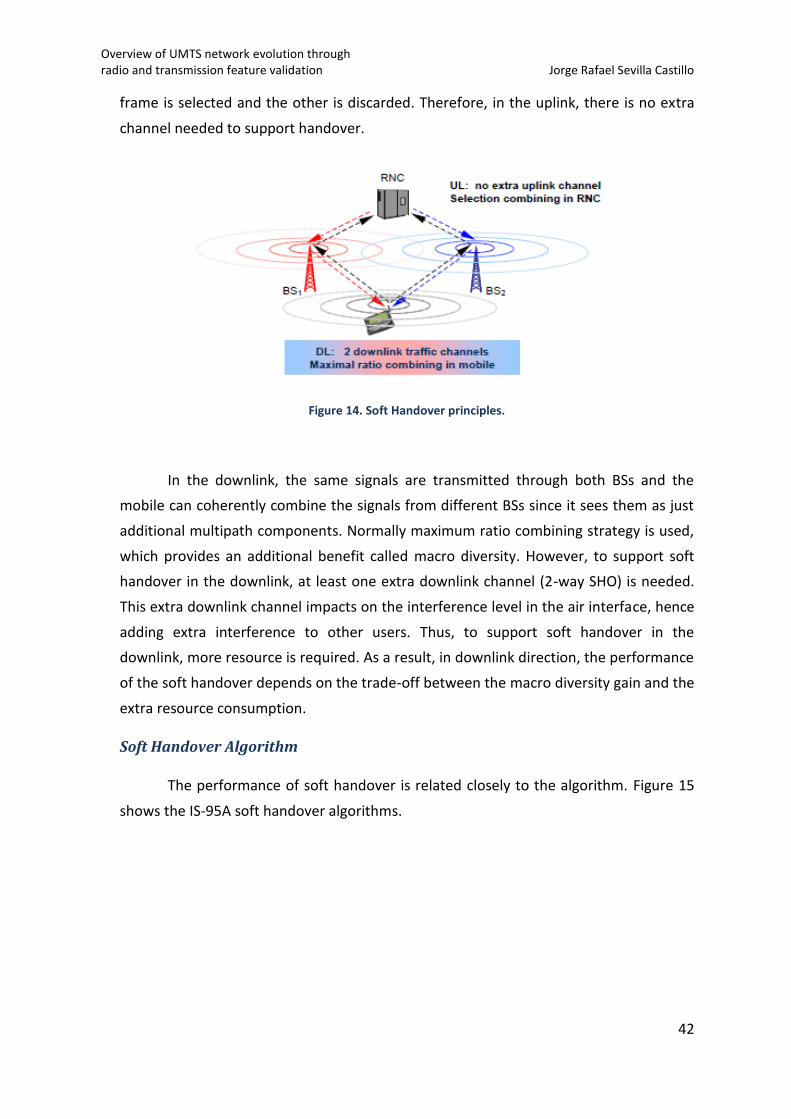
Overview of UMTS network evolution through radio and transmission feature validation Jorge Rafael Sevilla Castillo
42
frame is selected and the other is discarded. Therefore, in the uplink, there is no extra
channel needed to support handover.
Figure 14. Soft Handover principles.
In the downlink, the same signals are transmitted through both BSs and the
mobile can coherently combine the signals from different BSs since it sees them as just
additional multipath components. Normally maximum ratio combining strategy is used,
which provides an additional benefit called macro diversity. However, to support soft
handover in the downlink, at least one extra downlink channel (2-way SHO) is needed.
This extra downlink channel impacts on the interference level in the air interface, hence
adding extra interference to other users. Thus, to support soft handover in the
downlink, more resource is required. As a result, in downlink direction, the performance
of the soft handover depends on the trade-off between the macro diversity gain and the
extra resource consumption.
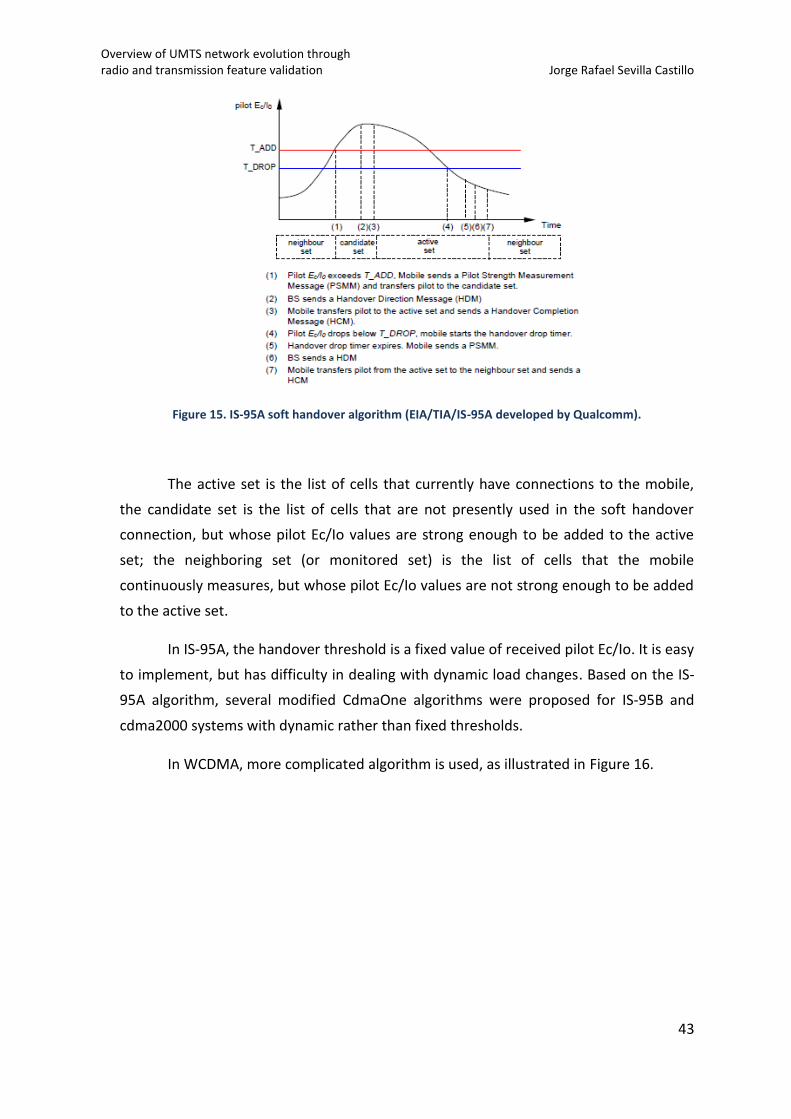
Soft Handover Algorithm
The performance of soft handover is related closely to the algorithm. Figure 15
shows the IS-95A soft handover algorithms.
Overview of UMTS network evolution through radio and transmission feature validation Jorge Rafael Sevilla Castillo
43
Figure 15. IS-95A soft handover algorithm (EIA/TIA/IS-95A developed by Qualcomm).
The active set is the list of cells that currently have connections to the mobile,
the candidate set is the list of cells that are not presently used in the soft handover
connection, but whose pilot Ec/Io values are strong enough to be added to the active
set; the neighboring set (or monitored set) is the list of cells that the mobile
continuously measures, but whose pilot Ec/Io values are not strong enough to be added
to the active set.
In IS-95A, the handover threshold is a fixed value of received pilot Ec/Io. It is easy
to implement, but has difficulty in dealing with dynamic load changes. Based on the IS-
95A algorithm, several modified CdmaOne algorithms were proposed for IS-95B and
cdma2000 systems with dynamic rather than fixed thresholds.
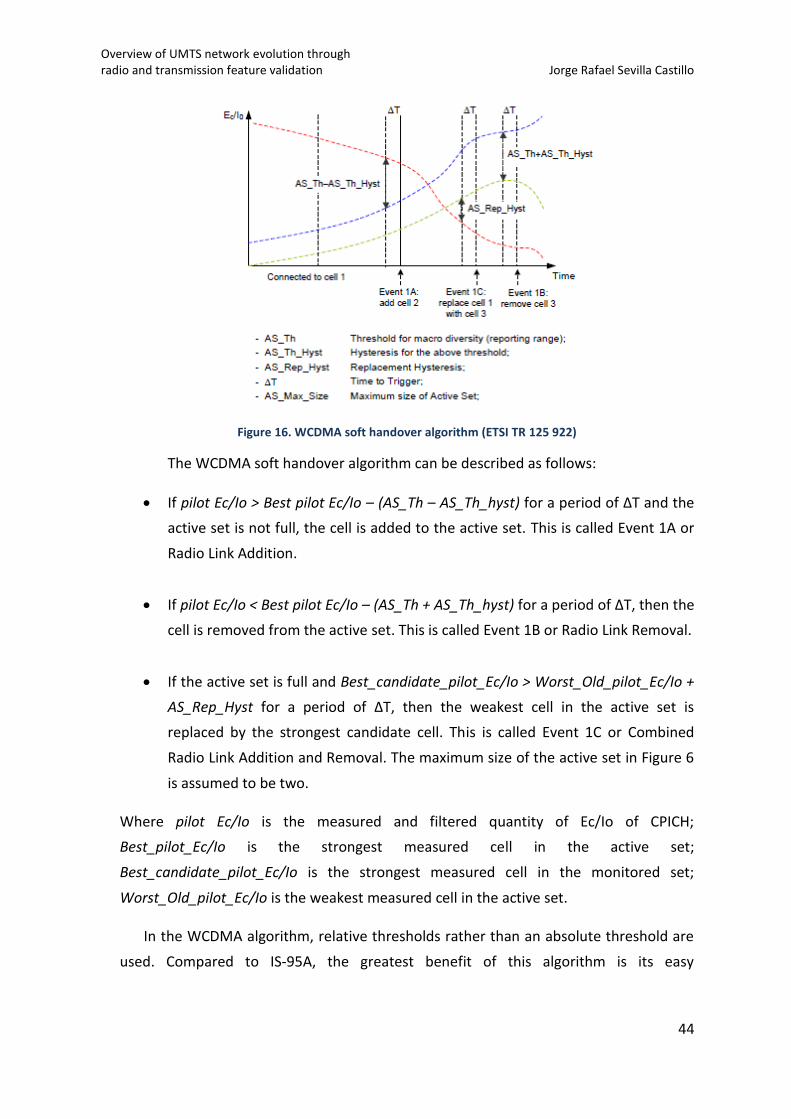
In WCDMA, more complicated algorithm is used, as illustrated in Figure 16.
Overview of UMTS network evolution through radio and transmission feature validation Jorge Rafael Sevilla Castillo
44
Figure 16. WCDMA soft handover algorithm (ETSI TR 125 922)
The WCDMA soft handover algorithm can be described as follows:
If pilot Ec/Io > Best pilot Ec/Io – (AS_Th – AS_Th_hyst) for a period of ∆T and the
active set is not full, the cell is added to the active set. This is called Event 1A or
Radio Link Addition.
If pilot Ec/Io < Best pilot Ec/Io – (AS_Th + AS_Th_hyst) for a period of ∆T, then the
cell is removed from the active set. This is called Event 1B or Radio Link Removal.
If the active set is full and Best_candidate_pilot_Ec/Io > Worst_Old_pilot_Ec/Io +
AS_Rep_Hyst for a period of ∆T, then the weakest cell in the active set is
replaced by the strongest candidate cell. This is called Event 1C or Combined
Radio Link Addition and Removal. The maximum size of the active set in Figure 6
is assumed to be two.
Where pilot Ec/Io is the measured and filtered quantity of Ec/Io of CPICH;
Best_pilot_Ec/Io is the strongest measured cell in the active set;
Best_candidate_pilot_Ec/Io is the strongest measured cell in the monitored set;
Worst_Old_pilot_Ec/Io is the weakest measured cell in the active set.
In the WCDMA algorithm, relative thresholds rather than an absolute threshold are
used. Compared to IS-95A, the greatest benefit of this algorithm is its easy
Overview of UMTS network evolution through radio and transmission feature validation Jorge Rafael Sevilla Castillo
45
parameterization with no parameter tuning being required for high and low
interference areas due to the relative thresholds.
Soft Handover Features
Compared to the traditional hard handover, soft handover shows some
advantages, such eliminating the “ping-pong” effect and smoothing the transmission
(there is no break point in soft handover). No “ping-pong” effect means lower load on
the network signaling and with soft handover, there is no data loss due to the
momentary transmission break that happens in hard handover.
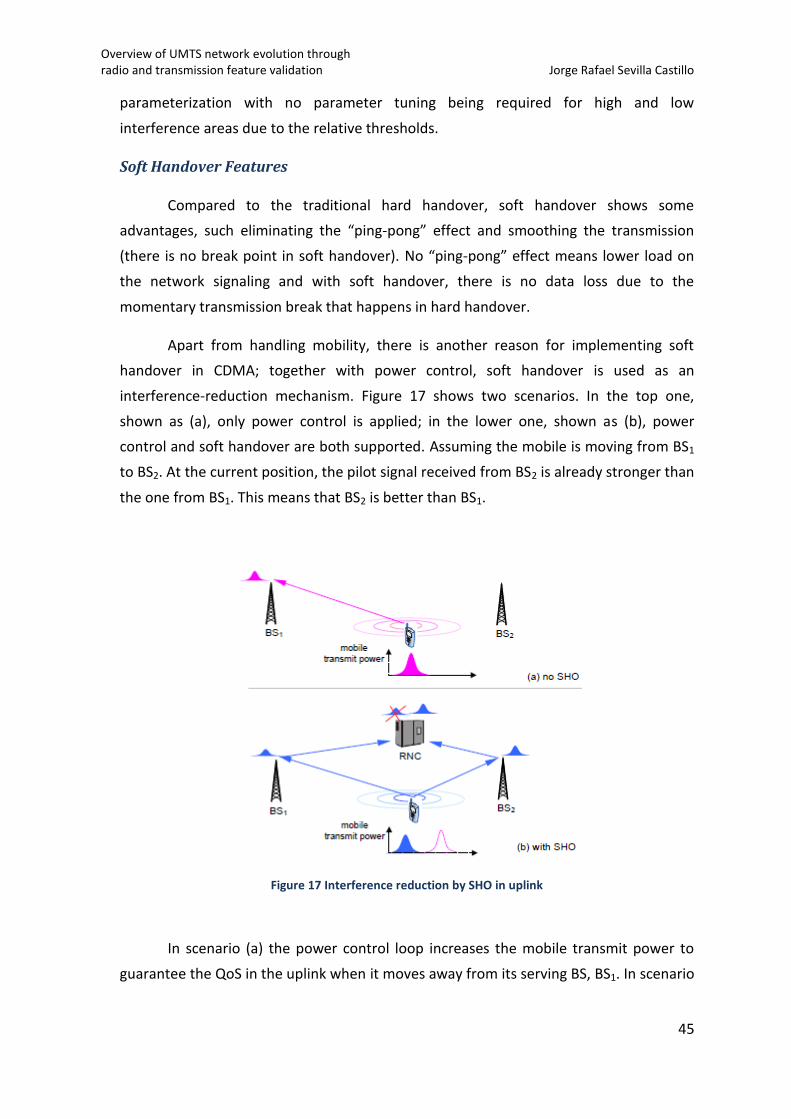
Apart from handling mobility, there is another reason for implementing soft
handover in CDMA; together with power control, soft handover is used as an
interference-reduction mechanism. Figure 17 shows two scenarios. In the top one,
shown as (a), only power control is applied; in the lower one, shown as (b), power
control and soft handover are both supported. Assuming the mobile is moving from BS1
to BS2. At the current position, the pilot signal received from BS2 is already stronger than
the one from BS1. This means that BS2 is better than BS1.
Figure 17 Interference reduction by SHO in uplink
In scenario (a) the power control loop increases the mobile transmit power to
guarantee the QoS in the uplink when it moves away from its serving BS, BS1. In scenario
Overview of UMTS network evolution through radio and transmission feature validation Jorge Rafael Sevilla Castillo
46
(b), the mobile is in soft handover status: BS1 and BS2 both listen to the mobile
simultaneously.
The received signals, then, are passed forward to the RNC for combining. In the
uplink direction, selection combining is used in soft handover. The stronger frame is
selected and the weaker one is discarder. Because BS2 is better than BS1, to meet the
same QoS target, the required transmit power (in blue) from the mobile is lower
compared to the power (in pink) needed in scenario (a). Therefore, the interference
contributed by this mobile in the uplink is lower under soft handover because soft
handover always keeps the mobile linked to the best BS. In downlink direction, the
situation is further complex. Although the maximum ratio combining gives macro
diversity gain, extra downlink channels are needed to support soft handover.
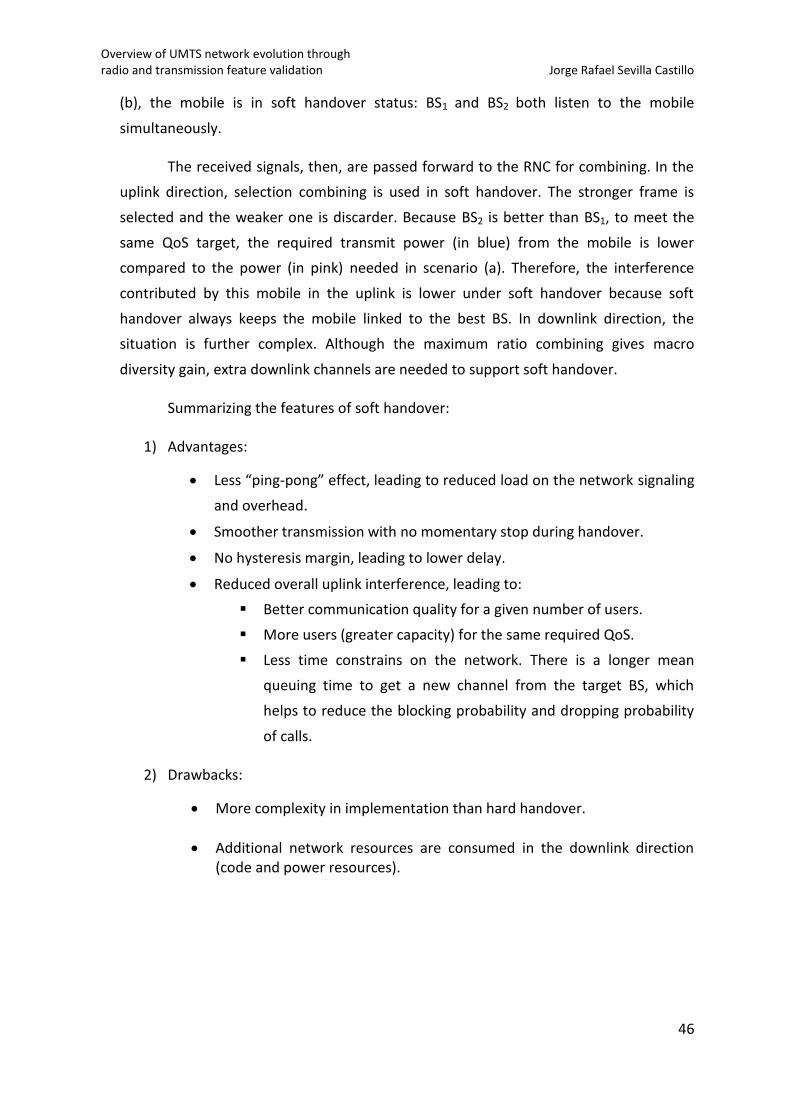
Summarizing the features of soft handover:
1) Advantages:
Less “ping-pong” effect, leading to reduced load on the network signaling
and overhead.
Smoother transmission with no momentary stop during handover.
No hysteresis margin, leading to lower delay.
Reduced overall uplink interference, leading to:
Better communication quality for a given number of users.
More users (greater capacity) for the same required QoS.
Less time constrains on the network. There is a longer mean
queuing time to get a new channel from the target BS, which
helps to reduce the blocking probability and dropping probability
of calls.
2) Drawbacks:
More complexity in implementation than hard handover.
Additional network resources are consumed in the downlink direction (code and power resources).
Overview of UMTS network evolution through radio and transmission feature validation Jorge Rafael Sevilla Castillo
47
2.1.6 Handover between WCDMA and GSM: Inter System
Handover
Handover between WCDMA and GSM allows legacy GSM network to be used to
give fallback coverage for WCDMA technology. This means that subscribers can
experience seamless services, which was of importance to the earlier commercial
launches.
In this section, features such as cell-reselection between WCDMA and GSM,
compressed mode measurements, WCDMA-to-GSM cell-change order, handover from
WCDMA to GSM and handover from GSM to WCDMA will be covered.
In addition, at the end of the section it will be presented a live network
optimization feature which aims to reduce the amount of unnecessary handovers
between both technologies in line with operator network planning evolution.
Introduction to Inter System Handover
Third-generation mobile services were introduced throughout the world.
Although WCDMA technology was initially deployed to cover urban areas, many
operators felt the need to provide nationwide coverage from the very start. GSM
networks have a global footprint that provides access to mobile services, such as voice,
circuit-switched and packet-switched data, short message service (SMS) and multimedia
messaging service (MMS). Those operators which already had a GSM network wanted to
capitalize on their investments when migrating to WCDMA technology. A third-
generation mobile terminal equipped with both WCDMA and GSM technology would
put the end-user in contact with seamless mobile service.
Dual mode WCDMA-GSM mobile terminals of this kind require an interworking
mechanism between WCDMA and GSM technologies. For instance, if the user has
established a voice call using WCDMA, and then moves outside WCDMA coverage, the
voice call needs to be handed over to GSM without any perceived disturbance.
Main challenges
Several challenges had to be overcome to achieve interworking between
WCDMA and GSM. First, to get feasible technical solutions for the mobile terminal and
network implementations, some restrictions had to be set. For example, in the early
discussions it was proposed that the mobile terminal should be able to have a voice call
Overview of UMTS network evolution through radio and transmission feature validation Jorge Rafael Sevilla Castillo
48
in WCDMA while sending data in GSM. However, this capability was restricted in the
standard, allowing the mobile terminal to communicate with only one of the
technologies at a time.
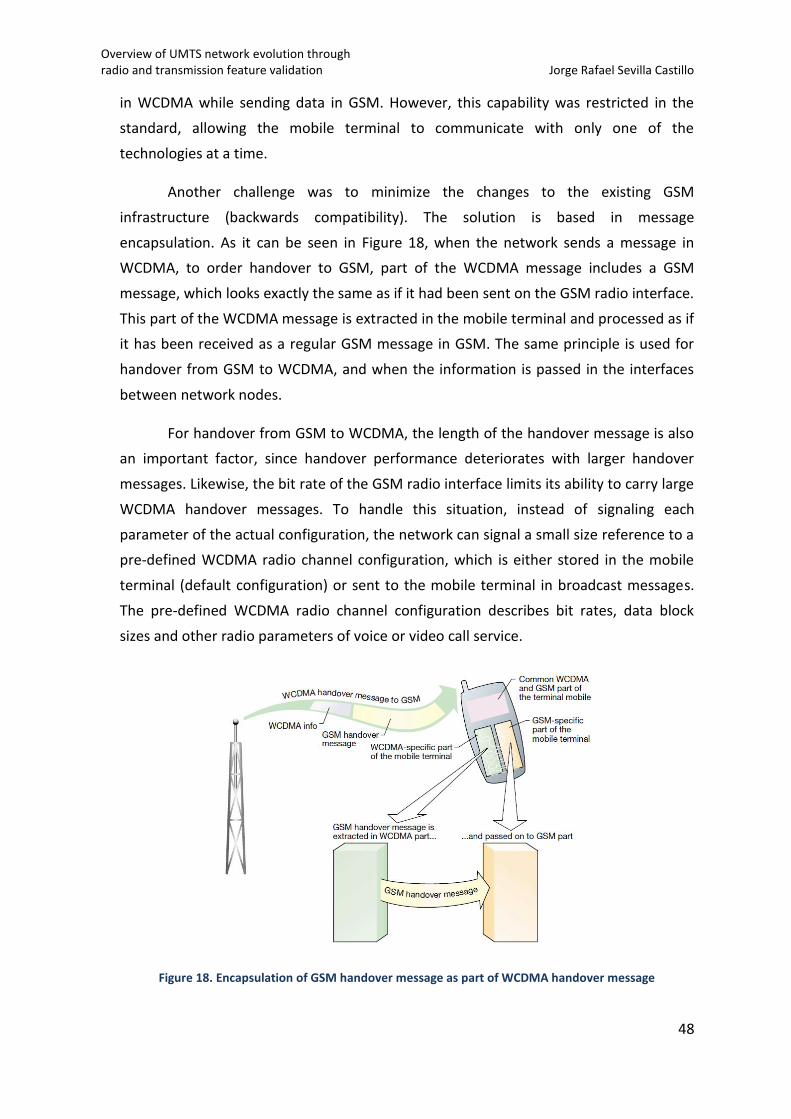
Another challenge was to minimize the changes to the existing GSM
infrastructure (backwards compatibility). The solution is based in message
encapsulation. As it can be seen in Figure 18, when the network sends a message in
WCDMA, to order handover to GSM, part of the WCDMA message includes a GSM
message, which looks exactly the same as if it had been sent on the GSM radio interface.
This part of the WCDMA message is extracted in the mobile terminal and processed as if
it has been received as a regular GSM message in GSM. The same principle is used for
handover from GSM to WCDMA, and when the information is passed in the interfaces
between network nodes.
For handover from GSM to WCDMA, the length of the handover message is also
an important factor, since handover performance deteriorates with larger handover
messages. Likewise, the bit rate of the GSM radio interface limits its ability to carry large
WCDMA handover messages. To handle this situation, instead of signaling each
parameter of the actual configuration, the network can signal a small size reference to a
pre-defined WCDMA radio channel configuration, which is either stored in the mobile
terminal (default configuration) or sent to the mobile terminal in broadcast messages.
The pre-defined WCDMA radio channel configuration describes bit rates, data block
sizes and other radio parameters of voice or video call service.
Figure 18. Encapsulation of GSM handover message as part of WCDMA handover message
Overview of UMTS network evolution through radio and transmission feature validation Jorge Rafael Sevilla Castillo
49
Although the network solely communicates with the mobile terminal using one
access technology at a time, the mobile terminal needs to perform measurements on
GSM while communicating in WCDMA and vice versa. In order to achieve that, mobile
terminals which have a single radio receiver are required to perform a process called
compressed mode.
Compressed Mode
Compressed mode is a radio path feature that enables the UE to maintain the
current connection on a certain frequency while performing measurements on another
frequency. This allows the UE to monitor neighboring cells on another frequency or RAT,
typically GSM. Compressed mode means that transmission and reception are halted for
a short time – a few milliseconds – to perform a measurement on another frequency or
RAT. The required transmission/reception gap is produced without any loss of DCH user
data by compressing the data transmission in the time domain.
The following methods are used to compress the data transmission:
Halving the spreading factor: This temporarily doubles the physical
channel data rate in the radio channel. The same amount of data can be
sent in half the time it would normally take. Halving the spreading factor
does not affect the DCH user data rate. This method is usually applied to
CS services.
Higher layer scheduling: This mechanism reduces the DCH user data rate
in the radio channel by restricting the high bit rate transport format
combinations (TFCs). This method is usually applied to PS services.
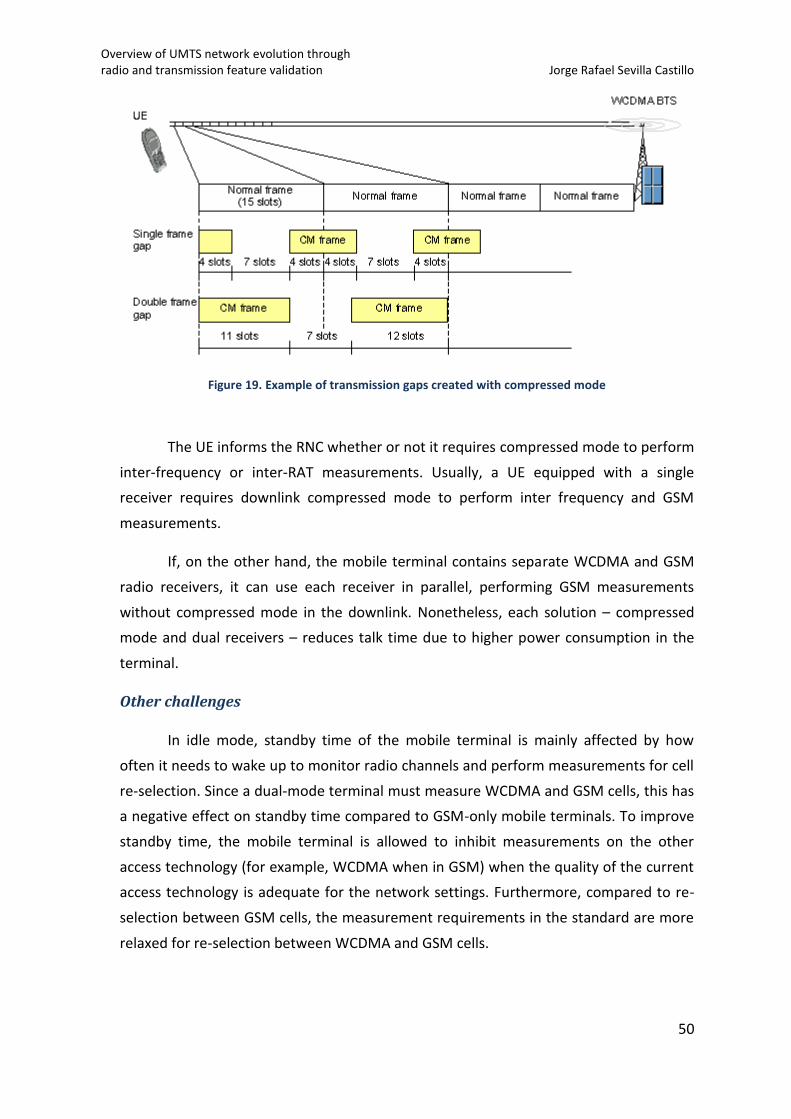
The Transmission/Reception (TX/RX) gap always has seven slots. A gap can be
places within one frame or within two consecutive frames, depending on the
compressed mode method.
Overview of UMTS network evolution through radio and transmission feature validation Jorge Rafael Sevilla Castillo
50
Figure 19. Example of transmission gaps created with compressed mode
The UE informs the RNC whether or not it requires compressed mode to perform
inter-frequency or inter-RAT measurements. Usually, a UE equipped with a single
receiver requires downlink compressed mode to perform inter frequency and GSM
measurements.
If, on the other hand, the mobile terminal contains separate WCDMA and GSM
radio receivers, it can use each receiver in parallel, performing GSM measurements
without compressed mode in the downlink. Nonetheless, each solution – compressed
mode and dual receivers – reduces talk time due to higher power consumption in the
terminal.
Other challenges
In idle mode, standby time of the mobile terminal is mainly affected by how
often it needs to wake up to monitor radio channels and perform measurements for cell
re-selection. Since a dual-mode terminal must measure WCDMA and GSM cells, this has
a negative effect on standby time compared to GSM-only mobile terminals. To improve
standby time, the mobile terminal is allowed to inhibit measurements on the other
access technology (for example, WCDMA when in GSM) when the quality of the current
access technology is adequate for the network settings. Furthermore, compared to re-
selection between GSM cells, the measurement requirements in the standard are more
relaxed for re-selection between WCDMA and GSM cells.
Overview of UMTS network evolution through radio and transmission feature validation Jorge Rafael Sevilla Castillo
51
2.1.7 Mobility procedures between WCDMA and GSM
There are two basic modes of operation for handling mobility:
Mobile terminal-controlled mode.
Network-controlled mode.
In the mobile terminal-controlled mode, the mobile terminal selects the cell to
which it will connect. However, the network can broadcast various parameters to
influence this process.
In the network-controlled mode, the network explicitly orders the mobile
terminal to connect to a specific cell. Ordinarily, the network bases its decisions on
measurement information provided by the mobile terminal. For either mode of
operation, the network should consider cells that use each access technology. Besides
radio link quality, the network might also consider other aspects when selection the cell,
for example current load of the established service.
Two procedures have been defined by which the network can order the mobile
terminal to connect to a cell using another technology, namely the handover and cell
change order procedures. These are employed when the mobile terminal uses a
dedicated channel. The handover procedure provides a higher level of service, since it
involves a preparation phase in which resources in the target cell are reserved prior to
the actual handover. Accordingly, the handover procedure is employed when the mobile
terminal is provided circuit switched service, for instance, voice. The cell change order
procedure applies when the mobile terminal is provided packet switched services, such
as web browsing.
Cell re-selection between WCDMA and GSM
While in WCDMA, the mobile terminal performs cell re-selection in idle mode
and in connected mode when common channels are used for packet switched service.
The dual-mode mobile terminal re-selects a GSM cell when that cell is ranked
higher than the current WCDMA cell or any other WCDMA cell. WCDMA and GSM cells
are ranked together according to signal strength. This same type of ranking applies in
GSM.
When performing cell-reselection in WCDMA, the mobile terminal either
measures GSM cells continuously or when the quality of the serving WCDMA cell falls
Overview of UMTS network evolution through radio and transmission feature validation Jorge Rafael Sevilla Castillo
52
below a given threshold. The mobile terminal is only allowed to select a new WCDMA or
GSM cell when the average received quality and average signal strength exceed a
minimum threshold. The minimum-quality threshold (signal-to-noise ratio) ensures that
the mobile terminal can receive the information transmitted by the potential target cell.
The minimum threshold for signal strength ensures that the network can receive the
information for cell re-selection transmitted by the mobile terminal in the target cell.
This criterion also takes into account the maximum transmit power that the mobile
terminal is allowed to use when accessing the cell and the maximum radio frequency
output power that the mobile terminal can transmit.
Frequent re-selections can be avoided with mechanism such as penalty time and
temporary offset. Likewise, mechanisms are defined to keep fast-moving mobile
terminals from re-selecting small-sized cells when a large overlay cell has been
configured.
The network can configure these options by broadcasting parameters in the
WCDMA cell.
When the mobile terminal is actively providing packet-switched data service in
WCDMA and re-selects a GSM cell, it establishes the radio connection to the GSM base
station subsystem (BSS) and then initiates the routing area update procedure. During
this procedure, the core network may retrieve information from the UMTS Terrestrial
Radio Access Network (UTRAN) on the context of the mobile terminal, which includes
any data packets waiting in the downlink queue. When complete, the connection to
UTRAN is released. Finally, the core network confirms the routing area update. Figure 20
shows the message sequence after cell-reselection from WCDMA to a GSM cell in idle
mode.
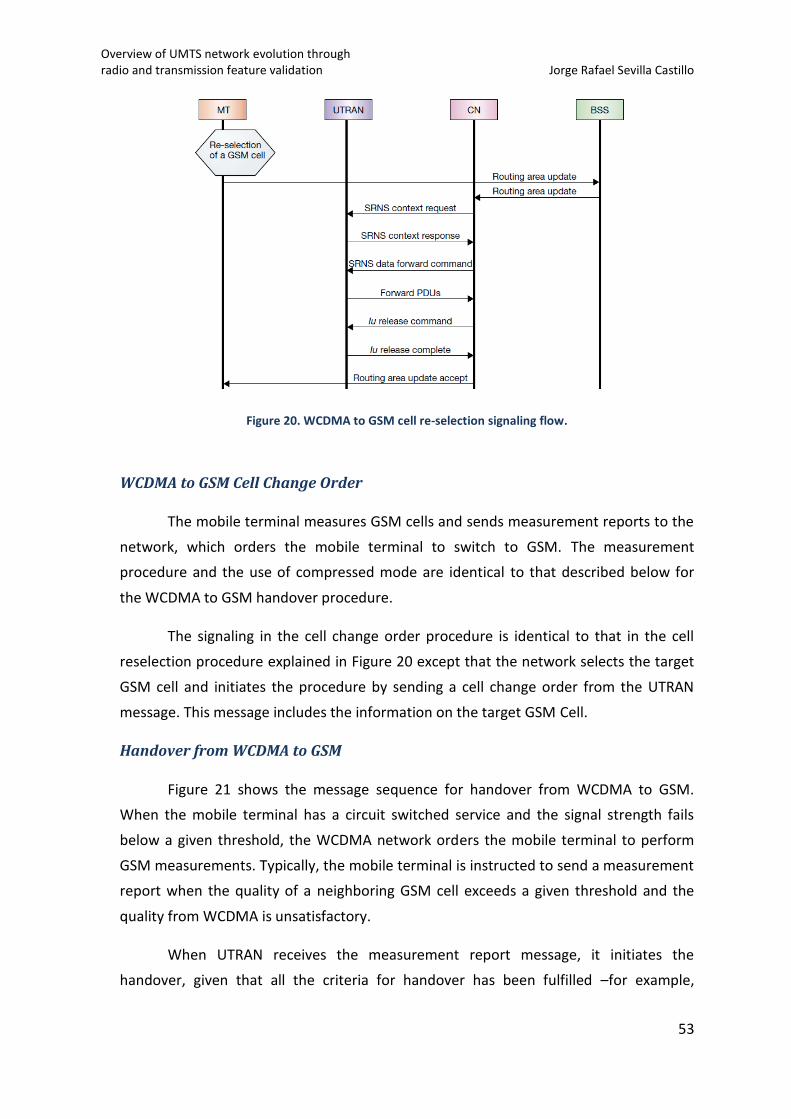
Overview of UMTS network evolution through radio and transmission feature validation Jorge Rafael Sevilla Castillo
53
Figure 20. WCDMA to GSM cell re-selection signaling flow.
WCDMA to GSM Cell Change Order
The mobile terminal measures GSM cells and sends measurement reports to the
network, which orders the mobile terminal to switch to GSM. The measurement
procedure and the use of compressed mode are identical to that described below for
the WCDMA to GSM handover procedure.
The signaling in the cell change order procedure is identical to that in the cell
reselection procedure explained in Figure 20 except that the network selects the target
GSM cell and initiates the procedure by sending a cell change order from the UTRAN
message. This message includes the information on the target GSM Cell.
Handover from WCDMA to GSM
Figure 21 shows the message sequence for handover from WCDMA to GSM.
When the mobile terminal has a circuit switched service and the signal strength fails
below a given threshold, the WCDMA network orders the mobile terminal to perform
GSM measurements. Typically, the mobile terminal is instructed to send a measurement
report when the quality of a neighboring GSM cell exceeds a given threshold and the
quality from WCDMA is unsatisfactory.
When UTRAN receives the measurement report message, it initiates the
handover, given that all the criteria for handover has been fulfilled –for example,
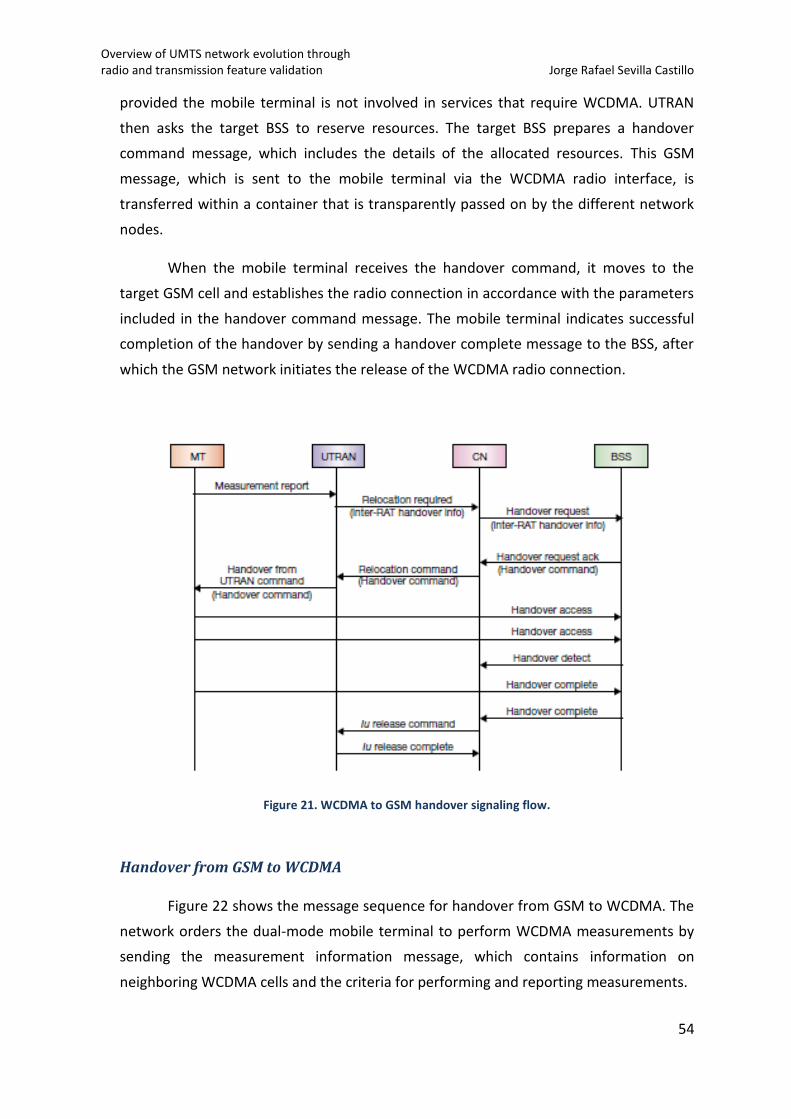
Overview of UMTS network evolution through radio and transmission feature validation Jorge Rafael Sevilla Castillo
54
provided the mobile terminal is not involved in services that require WCDMA. UTRAN
then asks the target BSS to reserve resources. The target BSS prepares a handover
command message, which includes the details of the allocated resources. This GSM
message, which is sent to the mobile terminal via the WCDMA radio interface, is
transferred within a container that is transparently passed on by the different network
nodes.
When the mobile terminal receives the handover command, it moves to the
target GSM cell and establishes the radio connection in accordance with the parameters
included in the handover command message. The mobile terminal indicates successful
completion of the handover by sending a handover complete message to the BSS, after
which the GSM network initiates the release of the WCDMA radio connection.
Figure 21. WCDMA to GSM handover signaling flow.
Handover from GSM to WCDMA
Figure 22 shows the message sequence for handover from GSM to WCDMA. The
network orders the dual-mode mobile terminal to perform WCDMA measurements by
sending the measurement information message, which contains information on
neighboring WCDMA cells and the criteria for performing and reporting measurements.
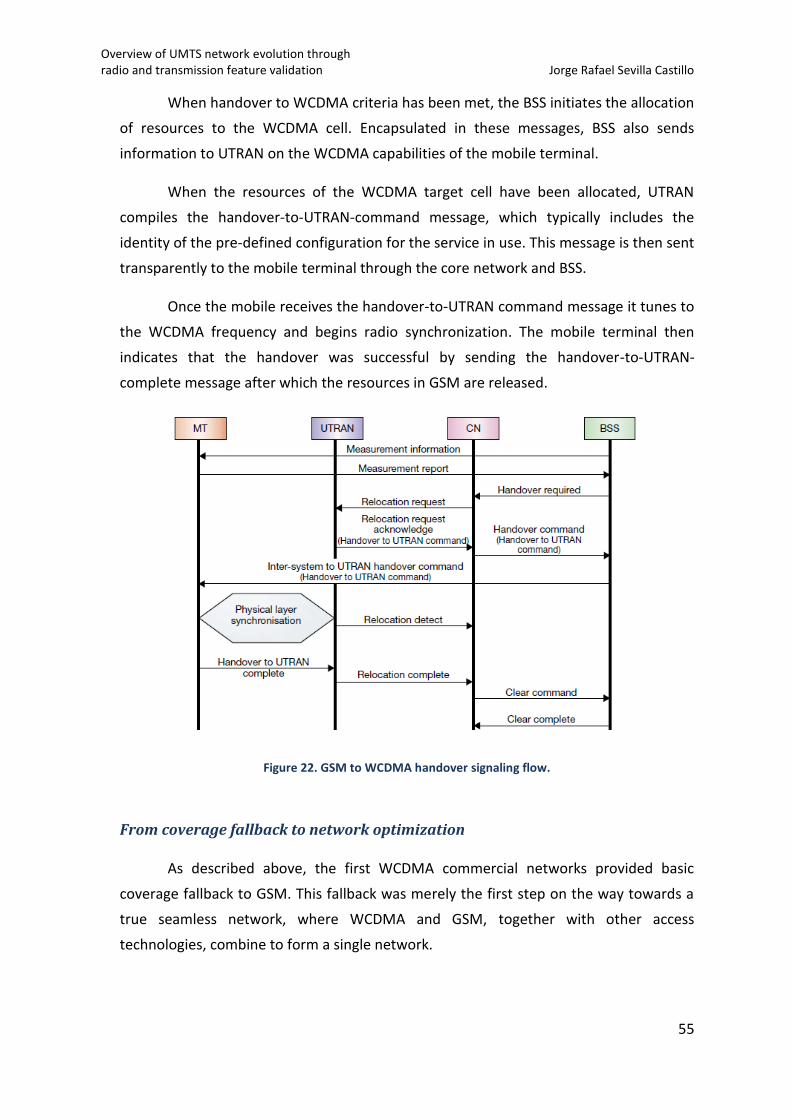
Overview of UMTS network evolution through radio and transmission feature validation Jorge Rafael Sevilla Castillo
55
When handover to WCDMA criteria has been met, the BSS initiates the allocation
of resources to the WCDMA cell. Encapsulated in these messages, BSS also sends
information to UTRAN on the WCDMA capabilities of the mobile terminal.
When the resources of the WCDMA target cell have been allocated, UTRAN
compiles the handover-to-UTRAN-command message, which typically includes the
identity of the pre-defined configuration for the service in use. This message is then sent
transparently to the mobile terminal through the core network and BSS.
Once the mobile receives the handover-to-UTRAN command message it tunes to
the WCDMA frequency and begins radio synchronization. The mobile terminal then
indicates that the handover was successful by sending the handover-to-UTRAN-
complete message after which the resources in GSM are released.
Figure 22. GSM to WCDMA handover signaling flow.
From coverage fallback to network optimization
As described above, the first WCDMA commercial networks provided basic
coverage fallback to GSM. This fallback was merely the first step on the way towards a
true seamless network, where WCDMA and GSM, together with other access
technologies, combine to form a single network.
Overview of UMTS network evolution through radio and transmission feature validation Jorge Rafael Sevilla Castillo
56
There are two important areas in this evolution. The first relates to minimize the
perceived impact on the user when the mobile terminal changes between WCDMA and
GSM. The Third-generation Partnership Project (3GPP) has been working on
enhancements to the WCDMA and GSM standard that reduces the interruption in user
data transfer from seconds to fractions of a second during packet-switched service.
The other area relates to the ability of the system to select the access technology
that is best capable of providing the requested service and quality. This includes the
triggering criteria for moving between GSM and WCDMA access technologies. By
triggering a change of radio access technology on, for example, the requested service
type, it is possible to provide the appropriate quality of service for the call, and to
increase the overall capacity if the system.
It is inside the latter area where the WCDMA feature Inter System Handover
Cancellation falls into. With this functionality the 3G network is able to interrupt the
handover procedure between WCDMA and GSM if the cancellation trigger conditions
are met. That will help to avoid unnecessary handovers in areas where the radio
conditions in 3G are temporarily degraded, improving 3G network KPIs.
2.2 Feature Validation
2.2.1 Feature description
Inter System handover from WCDMA to GSM/EDGE can be triggered
due to connection quality or radio coverage reasons (uplink DCH quality, UE TX
power, downlink DPCH power, CPICH RSCP or CPICH Ec/N0). During the handover
process, the WCDMA network conditions may change so that handover is not
needed anymore.
It is during the inter system measurement phase when the UE also measures
intra frequency WCDMA neighbors. If these measurements indicate that the conditions
have improved in the WCDMA layer so that the predefined cancellation thresholds are
exceeded, the RNC stops the handover and compressed mode measurements.
An active set update procedure during the measurements causes the inter
system handover cancellation. The RNC should cancel the inter system measurements in
the UE when the following cancellation triggers are met:
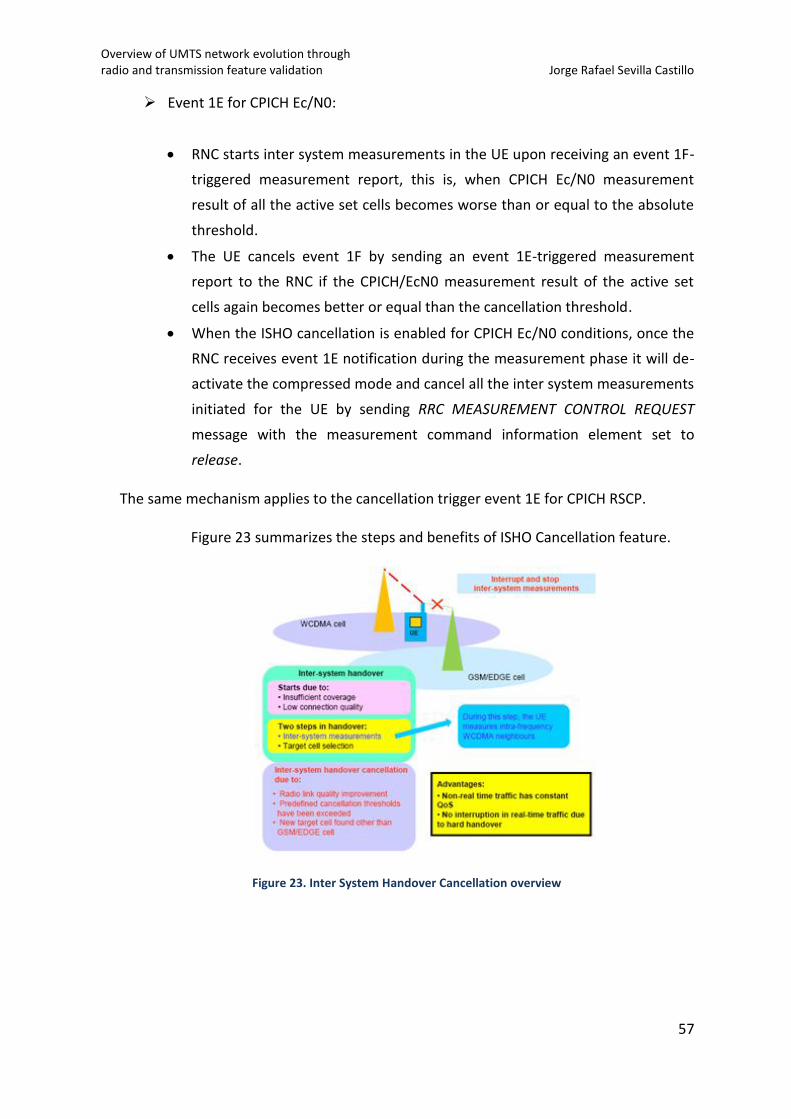
Overview of UMTS network evolution through radio and transmission feature validation Jorge Rafael Sevilla Castillo
57
Event 1E for CPICH Ec/N0:
RNC starts inter system measurements in the UE upon receiving an event 1F-
triggered measurement report, this is, when CPICH Ec/N0 measurement
result of all the active set cells becomes worse than or equal to the absolute
threshold.
The UE cancels event 1F by sending an event 1E-triggered measurement
report to the RNC if the CPICH/EcN0 measurement result of the active set
cells again becomes better or equal than the cancellation threshold.
When the ISHO cancellation is enabled for CPICH Ec/N0 conditions, once the
RNC receives event 1E notification during the measurement phase it will de-
activate the compressed mode and cancel all the inter system measurements
initiated for the UE by sending RRC MEASUREMENT CONTROL REQUEST
message with the measurement command information element set to
release.
The same mechanism applies to the cancellation trigger event 1E for CPICH RSCP.
Figure 23 summarizes the steps and benefits of ISHO Cancellation feature.
Figure 23. Inter System Handover Cancellation overview
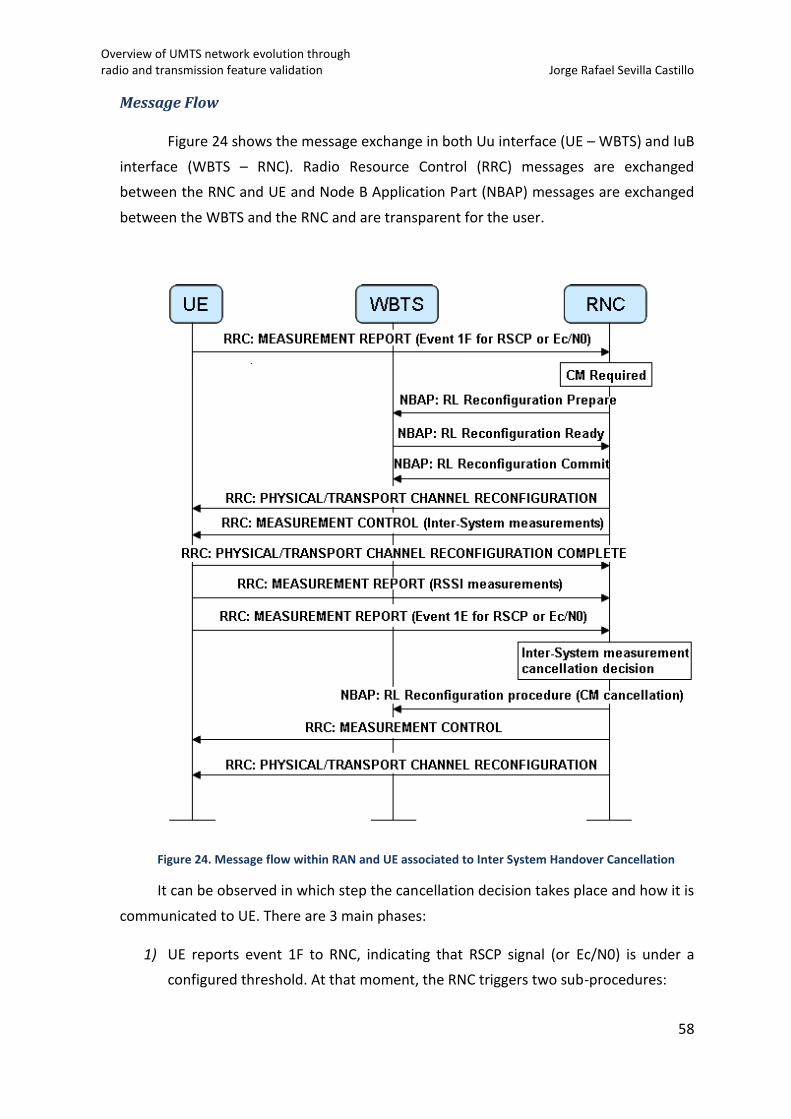
Overview of UMTS network evolution through radio and transmission feature validation Jorge Rafael Sevilla Castillo
58
Message Flow
Figure 24 shows the message exchange in both Uu interface (UE – WBTS) and IuB
interface (WBTS – RNC). Radio Resource Control (RRC) messages are exchanged
between the RNC and UE and Node B Application Part (NBAP) messages are exchanged
between the WBTS and the RNC and are transparent for the user.
Figure 24. Message flow within RAN and UE associated to Inter System Handover Cancellation
It can be observed in which step the cancellation decision takes place and how it is
communicated to UE. There are 3 main phases:
1) UE reports event 1F to RNC, indicating that RSCP signal (or Ec/N0) is under a
configured threshold. At that moment, the RNC triggers two sub-procedures:
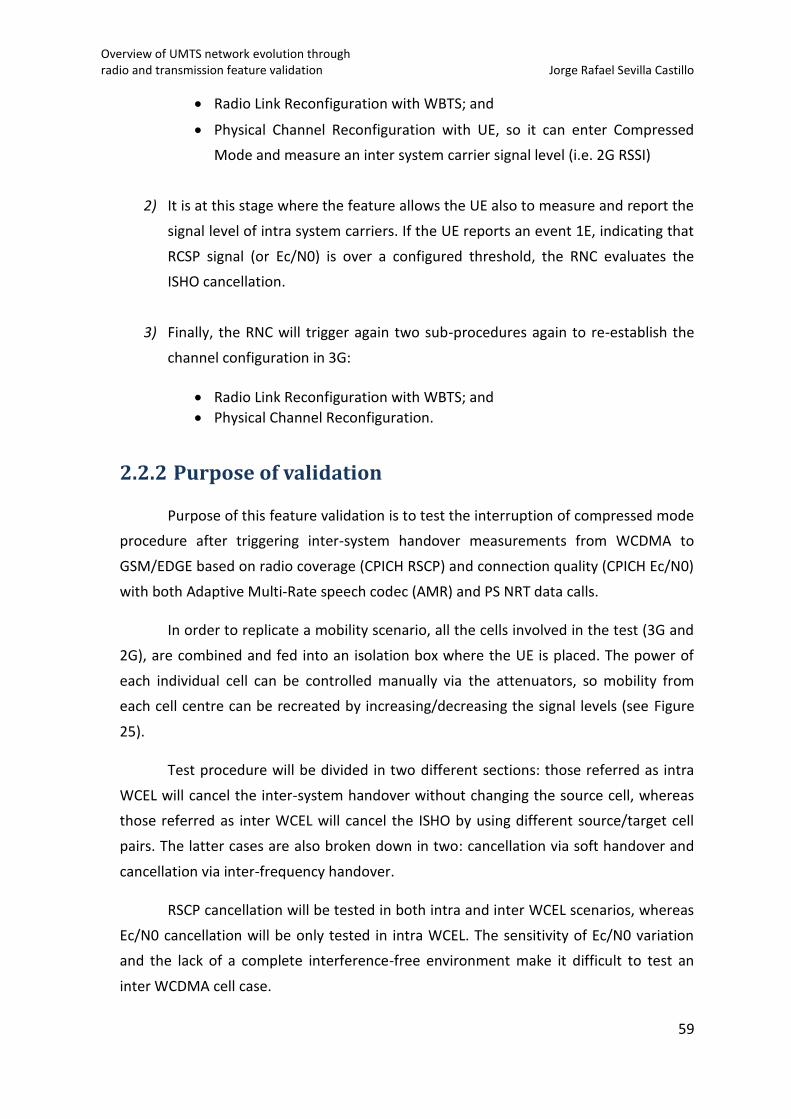
Overview of UMTS network evolution through radio and transmission feature validation Jorge Rafael Sevilla Castillo
59
Radio Link Reconfiguration with WBTS; and
Physical Channel Reconfiguration with UE, so it can enter Compressed
Mode and measure an inter system carrier signal level (i.e. 2G RSSI)
2) It is at this stage where the feature allows the UE also to measure and report the
signal level of intra system carriers. If the UE reports an event 1E, indicating that
RCSP signal (or Ec/N0) is over a configured threshold, the RNC evaluates the
ISHO cancellation.
3) Finally, the RNC will trigger again two sub-procedures again to re-establish the
channel configuration in 3G:
Radio Link Reconfiguration with WBTS; and
Physical Channel Reconfiguration.
2.2.2 Purpose of validation
Purpose of this feature validation is to test the interruption of compressed mode
procedure after triggering inter-system handover measurements from WCDMA to
GSM/EDGE based on radio coverage (CPICH RSCP) and connection quality (CPICH Ec/N0)
with both Adaptive Multi-Rate speech codec (AMR) and PS NRT data calls.
In order to replicate a mobility scenario, all the cells involved in the test (3G and
2G), are combined and fed into an isolation box where the UE is placed. The power of
each individual cell can be controlled manually via the attenuators, so mobility from
each cell centre can be recreated by increasing/decreasing the signal levels (see Figure
25).
Test procedure will be divided in two different sections: those referred as intra
WCEL will cancel the inter-system handover without changing the source cell, whereas
those referred as inter WCEL will cancel the ISHO by using different source/target cell
pairs. The latter cases are also broken down in two: cancellation via soft handover and
cancellation via inter-frequency handover.
RSCP cancellation will be tested in both intra and inter WCEL scenarios, whereas
Ec/N0 cancellation will be only tested in intra WCEL. The sensitivity of Ec/N0 variation
and the lack of a complete interference-free environment make it difficult to test an
inter WCDMA cell case.
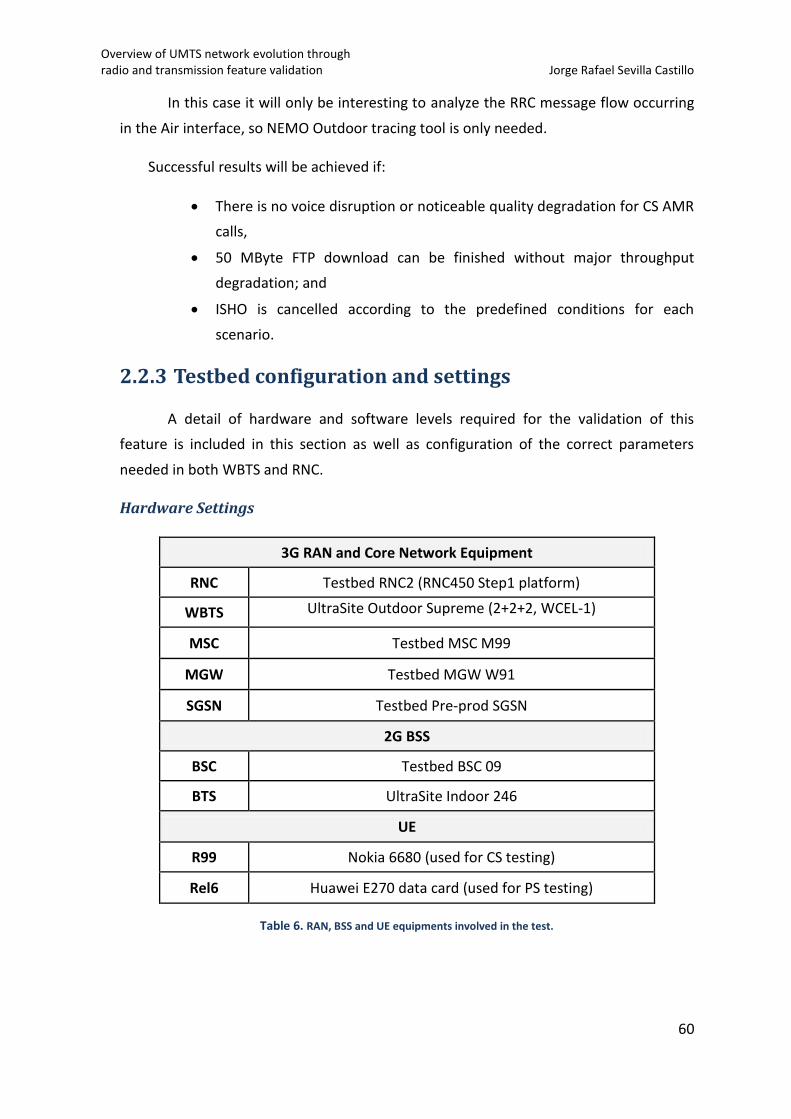
Overview of UMTS network evolution through radio and transmission feature validation Jorge Rafael Sevilla Castillo
60
In this case it will only be interesting to analyze the RRC message flow occurring
in the Air interface, so NEMO Outdoor tracing tool is only needed.
Successful results will be achieved if:
There is no voice disruption or noticeable quality degradation for CS AMR
calls,
50 MByte FTP download can be finished without major throughput
degradation; and
ISHO is cancelled according to the predefined conditions for each
scenario.
2.2.3 Testbed configuration and settings
A detail of hardware and software levels required for the validation of this
feature is included in this section as well as configuration of the correct parameters
needed in both WBTS and RNC.
Hardware Settings
3G RAN and Core Network Equipment
RNC Testbed RNC2 (RNC450 Step1 platform)
WBTS UltraSite Outdoor Supreme (2+2+2, WCEL-1)
MSC Testbed MSC M99
MGW Testbed MGW W91
SGSN Testbed Pre-prod SGSN
2G BSS
BSC Testbed BSC 09
BTS UltraSite Indoor 246
UE
R99 Nokia 6680 (used for CS testing)
Rel6 Huawei E270 data card (used for PS testing)
Table 6. RAN, BSS and UE equipments involved in the test.
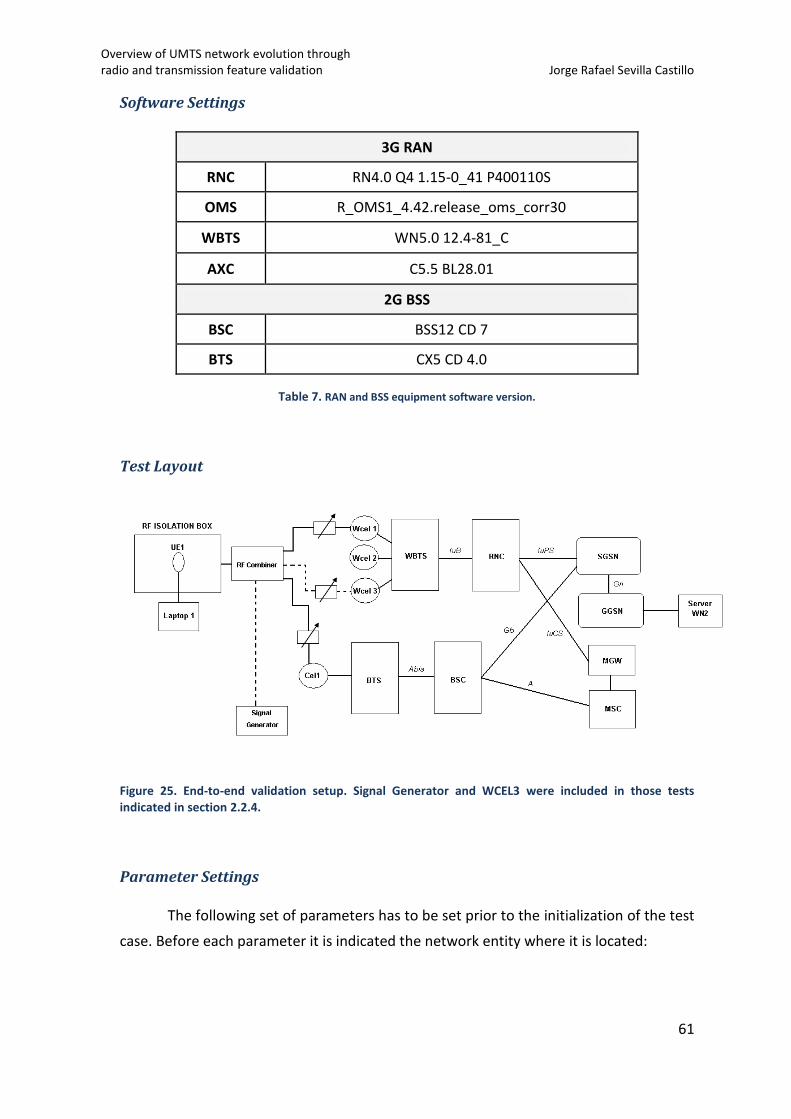
Overview of UMTS network evolution through radio and transmission feature validation Jorge Rafael Sevilla Castillo
61
Software Settings
3G RAN
RNC RN4.0 Q4 1.15-0_41 P400110S
OMS R_OMS1_4.42.release_oms_corr30
WBTS WN5.0 12.4-81_C
AXC C5.5 BL28.01
2G BSS
BSC BSS12 CD 7
BTS CX5 CD 4.0
Table 7. RAN and BSS equipment software version.
Test Layout
Figure 25. End-to-end validation setup. Signal Generator and WCEL3 were included in those tests indicated in section 2.2.4.
Parameter Settings
The following set of parameters has to be set prior to the initialization of the test
case. Before each parameter it is indicated the network entity where it is located:
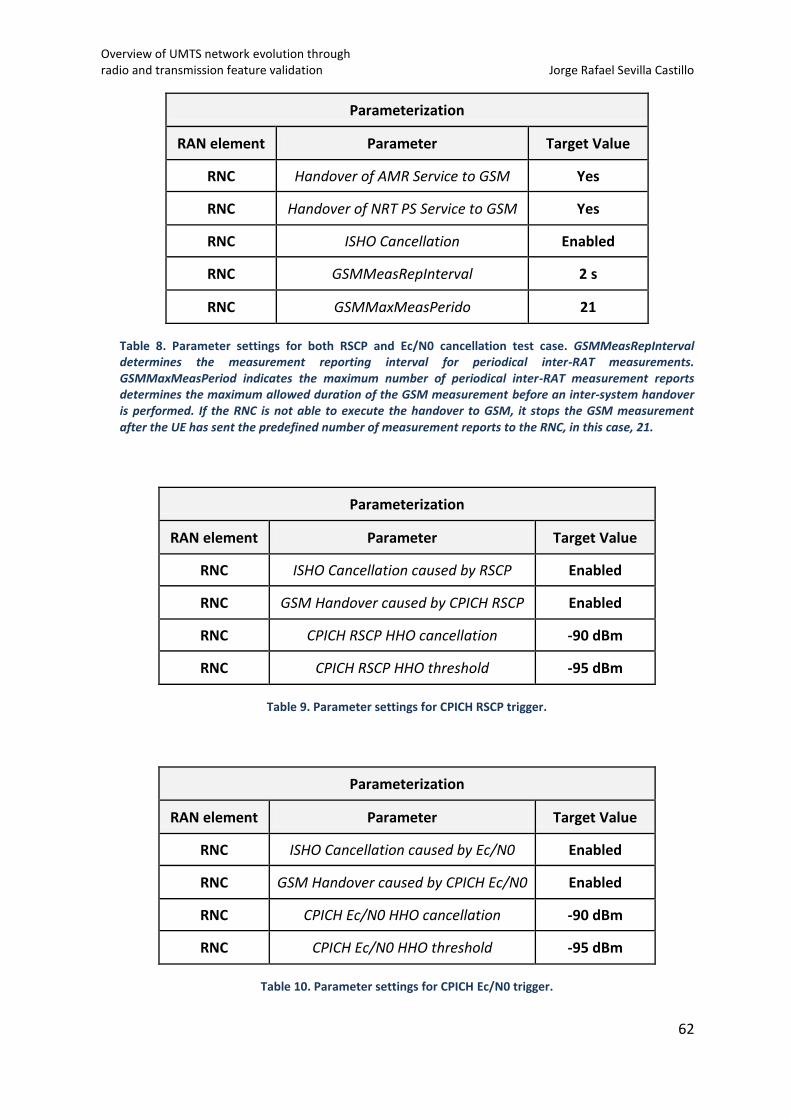
Overview of UMTS network evolution through radio and transmission feature validation Jorge Rafael Sevilla Castillo
62
Parameterization
RAN element Parameter Target Value
RNC Handover of AMR Service to GSM Yes
RNC Handover of NRT PS Service to GSM Yes
RNC ISHO Cancellation Enabled
RNC GSMMeasRepInterval 2 s
RNC GSMMaxMeasPerido 21
Table 8. Parameter settings for both RSCP and Ec/N0 cancellation test case. GSMMeasRepInterval determines the measurement reporting interval for periodical inter-RAT measurements. GSMMaxMeasPeriod indicates the maximum number of periodical inter-RAT measurement reports determines the maximum allowed duration of the GSM measurement before an inter-system handover is performed. If the RNC is not able to execute the handover to GSM, it stops the GSM measurement after the UE has sent the predefined number of measurement reports to the RNC, in this case, 21.
Parameterization
RAN element Parameter Target Value
RNC ISHO Cancellation caused by RSCP Enabled
RNC GSM Handover caused by CPICH RSCP Enabled
RNC CPICH RSCP HHO cancellation -90 dBm
RNC CPICH RSCP HHO threshold -95 dBm
Table 9. Parameter settings for CPICH RSCP trigger.
Parameterization
RAN element Parameter Target Value
RNC ISHO Cancellation caused by Ec/N0 Enabled
RNC GSM Handover caused by CPICH Ec/N0 Enabled
RNC CPICH Ec/N0 HHO cancellation -90 dBm
RNC CPICH Ec/N0 HHO threshold -95 dBm
Table 10. Parameter settings for CPICH Ec/N0 trigger.
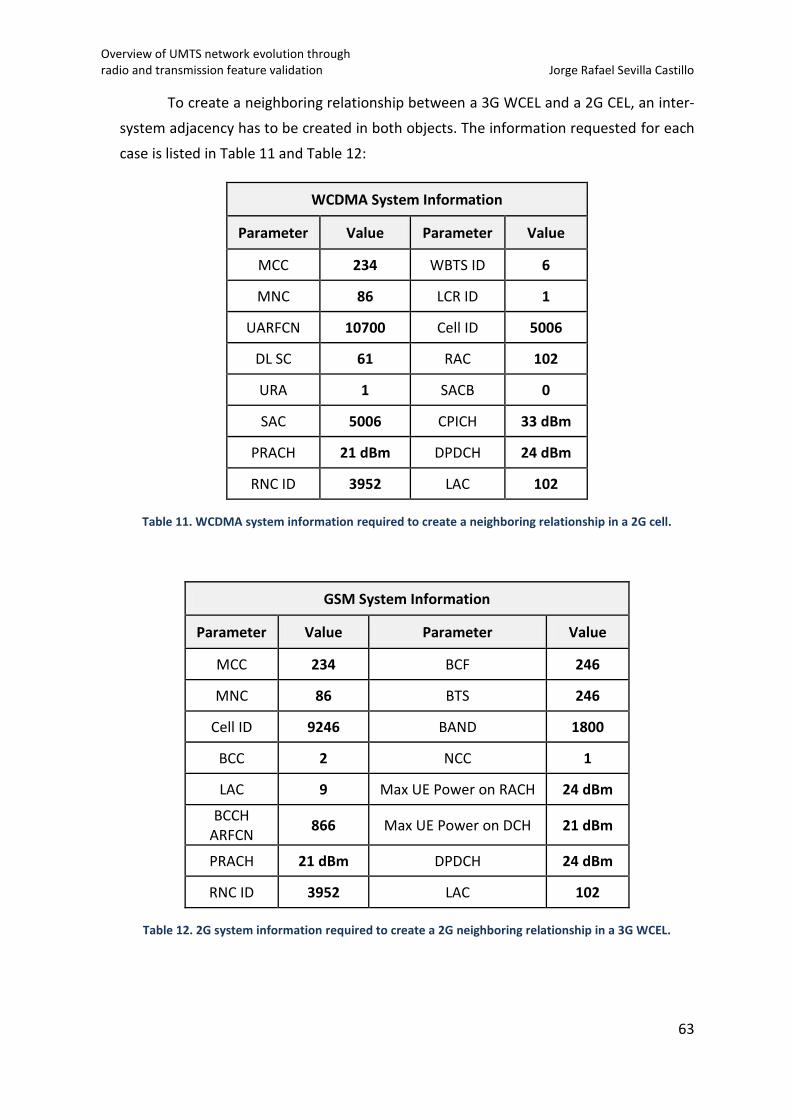
Overview of UMTS network evolution through radio and transmission feature validation Jorge Rafael Sevilla Castillo
63
To create a neighboring relationship between a 3G WCEL and a 2G CEL, an inter-
system adjacency has to be created in both objects. The information requested for each
case is listed in Table 11 and Table 12:
WCDMA System Information
Parameter Value Parameter Value
MCC 234 WBTS ID 6
MNC 86 LCR ID 1
UARFCN 10700 Cell ID 5006
DL SC 61 RAC 102
URA 1 SACB 0
SAC 5006 CPICH 33 dBm
PRACH 21 dBm DPDCH 24 dBm
RNC ID 3952 LAC 102
Table 11. WCDMA system information required to create a neighboring relationship in a 2G cell.
GSM System Information
Parameter Value Parameter Value
MCC 234 BCF 246
MNC 86 BTS 246
Cell ID 9246 BAND 1800
BCC 2 NCC 1
LAC 9 Max UE Power on RACH 24 dBm
BCCH ARFCN
866 Max UE Power on DCH 21 dBm
PRACH 21 dBm DPDCH 24 dBm
RNC ID 3952 LAC 102
Table 12. 2G system information required to create a 2G neighboring relationship in a 3G WCEL.
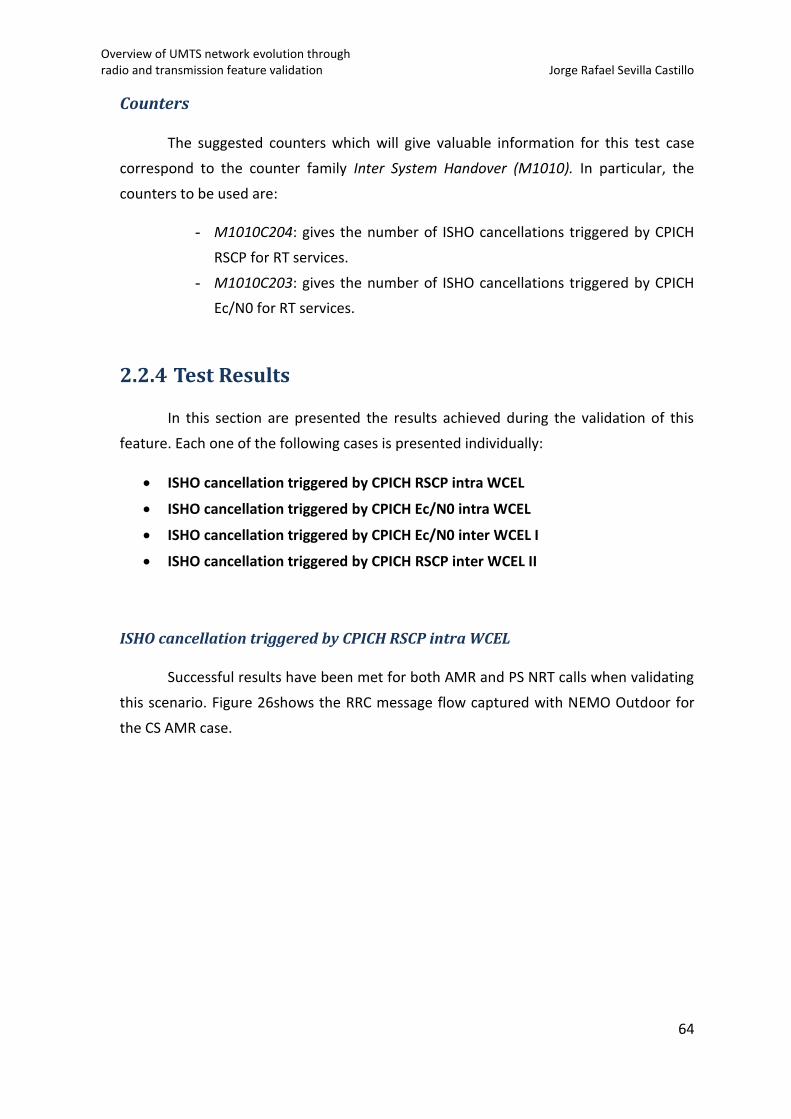
Overview of UMTS network evolution through radio and transmission feature validation Jorge Rafael Sevilla Castillo
64
Counters
The suggested counters which will give valuable information for this test case
correspond to the counter family Inter System Handover (M1010). In particular, the
counters to be used are:
- M1010C204: gives the number of ISHO cancellations triggered by CPICH
RSCP for RT services.
- M1010C203: gives the number of ISHO cancellations triggered by CPICH
Ec/N0 for RT services.
2.2.4 Test Results
In this section are presented the results achieved during the validation of this
feature. Each one of the following cases is presented individually:
ISHO cancellation triggered by CPICH RSCP intra WCEL
ISHO cancellation triggered by CPICH Ec/N0 intra WCEL
ISHO cancellation triggered by CPICH Ec/N0 inter WCEL I
ISHO cancellation triggered by CPICH RSCP inter WCEL II
ISHO cancellation triggered by CPICH RSCP intra WCEL
Successful results have been met for both AMR and PS NRT calls when validating
this scenario. Figure 26shows the RRC message flow captured with NEMO Outdoor for
the CS AMR case.
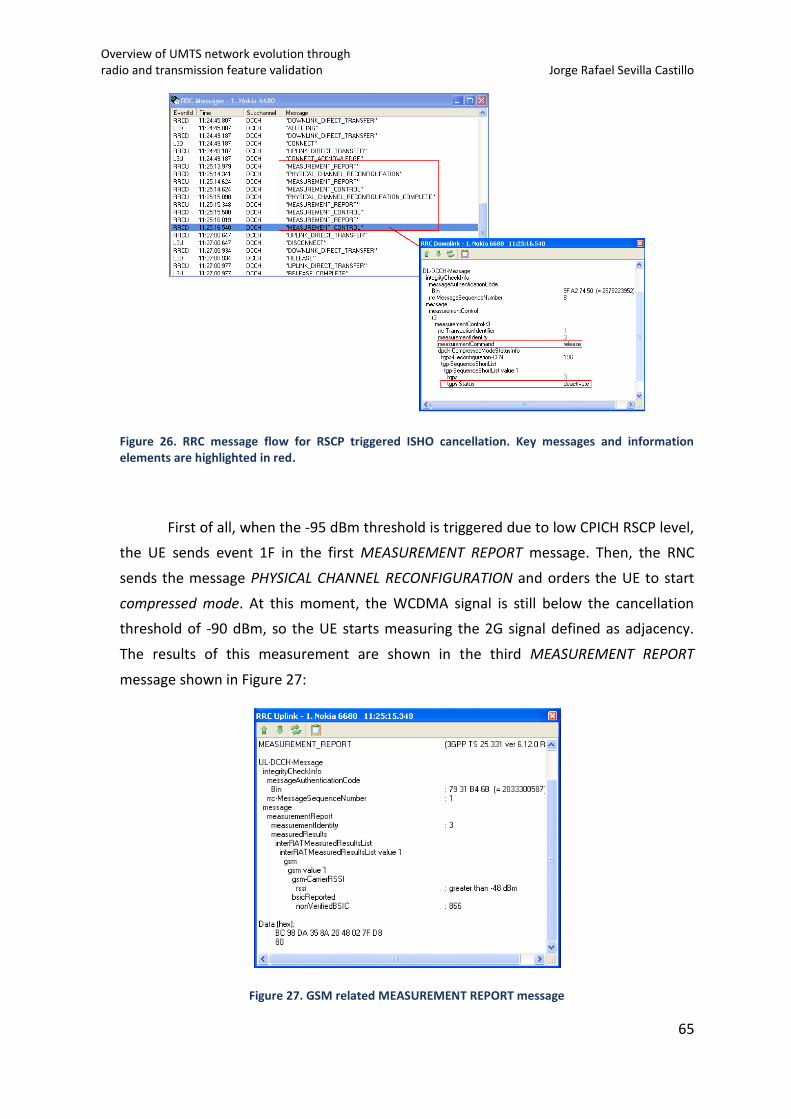
Overview of UMTS network evolution through radio and transmission feature validation Jorge Rafael Sevilla Castillo
65
Figure 26. RRC message flow for RSCP triggered ISHO cancellation. Key messages and information elements are highlighted in red.
First of all, when the -95 dBm threshold is triggered due to low CPICH RSCP level,
the UE sends event 1F in the first MEASUREMENT REPORT message. Then, the RNC
sends the message PHYSICAL CHANNEL RECONFIGURATION and orders the UE to start
compressed mode. At this moment, the WCDMA signal is still below the cancellation
threshold of -90 dBm, so the UE starts measuring the 2G signal defined as adjacency.
The results of this measurement are shown in the third MEASUREMENT REPORT
message shown in Figure 27:
Figure 27. GSM related MEASUREMENT REPORT message
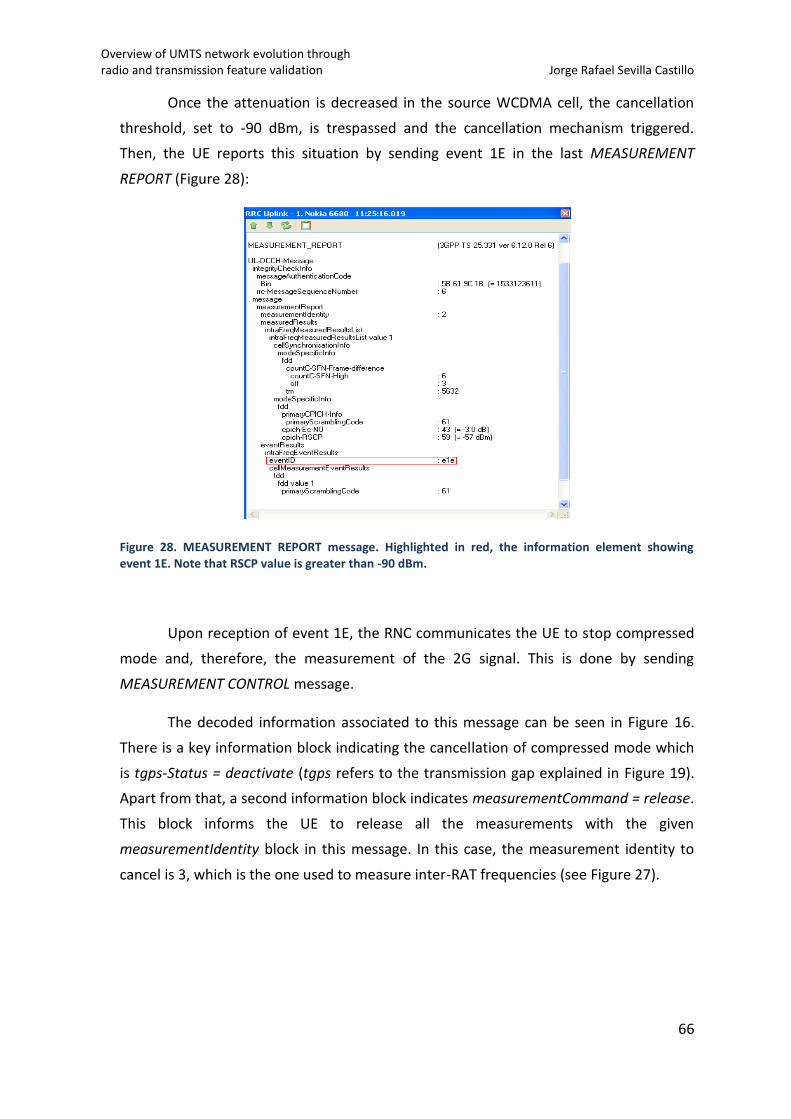
Overview of UMTS network evolution through radio and transmission feature validation Jorge Rafael Sevilla Castillo
66
Once the attenuation is decreased in the source WCDMA cell, the cancellation
threshold, set to -90 dBm, is trespassed and the cancellation mechanism triggered.
Then, the UE reports this situation by sending event 1E in the last MEASUREMENT
REPORT (Figure 28):
Figure 28. MEASUREMENT REPORT message. Highlighted in red, the information element showing event 1E. Note that RSCP value is greater than -90 dBm.
Upon reception of event 1E, the RNC communicates the UE to stop compressed
mode and, therefore, the measurement of the 2G signal. This is done by sending
MEASUREMENT CONTROL message.
The decoded information associated to this message can be seen in Figure 16.
There is a key information block indicating the cancellation of compressed mode which
is tgps-Status = deactivate (tgps refers to the transmission gap explained in Figure 19).
Apart from that, a second information block indicates measurementCommand = release.
This block informs the UE to release all the measurements with the given
measurementIdentity block in this message. In this case, the measurement identity to
cancel is 3, which is the one used to measure inter-RAT frequencies (see Figure 27).
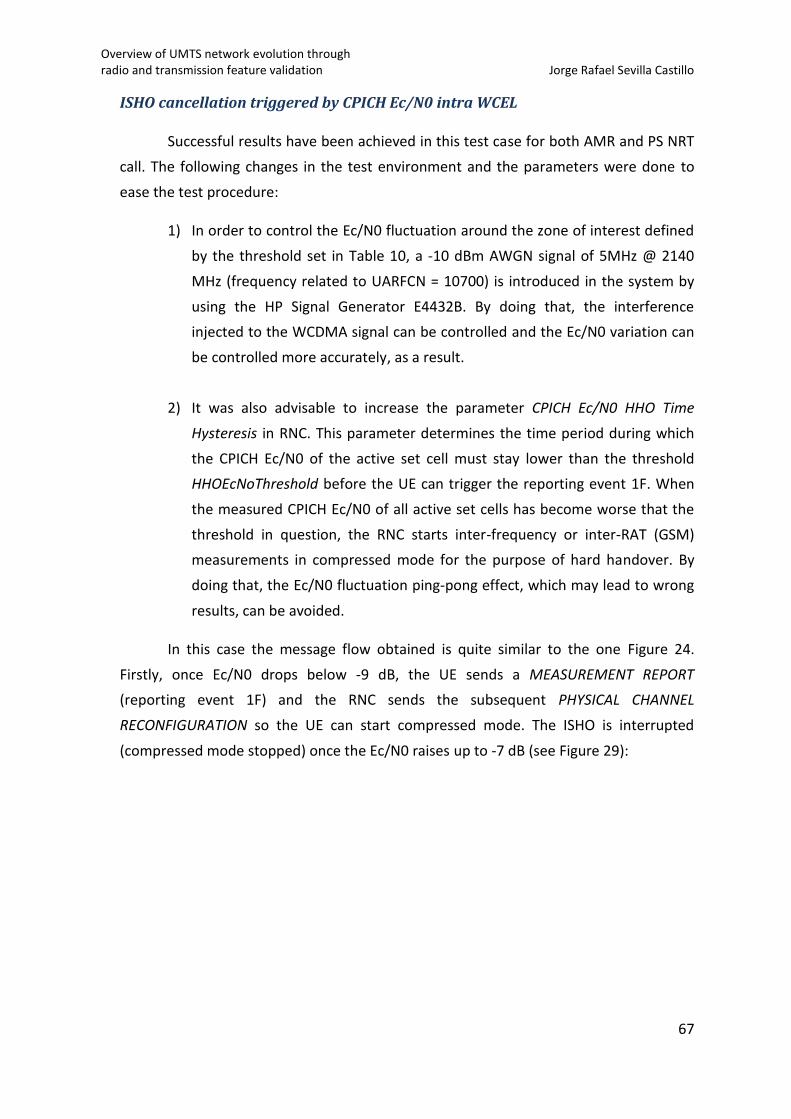
Overview of UMTS network evolution through radio and transmission feature validation Jorge Rafael Sevilla Castillo
67
ISHO cancellation triggered by CPICH Ec/N0 intra WCEL
Successful results have been achieved in this test case for both AMR and PS NRT
call. The following changes in the test environment and the parameters were done to
ease the test procedure:
1) In order to control the Ec/N0 fluctuation around the zone of interest defined
by the threshold set in Table 10, a -10 dBm AWGN signal of 5MHz @ 2140
MHz (frequency related to UARFCN = 10700) is introduced in the system by
using the HP Signal Generator E4432B. By doing that, the interference
injected to the WCDMA signal can be controlled and the Ec/N0 variation can
be controlled more accurately, as a result.
2) It was also advisable to increase the parameter CPICH Ec/N0 HHO Time
Hysteresis in RNC. This parameter determines the time period during which
the CPICH Ec/N0 of the active set cell must stay lower than the threshold
HHOEcNoThreshold before the UE can trigger the reporting event 1F. When
the measured CPICH Ec/N0 of all active set cells has become worse that the
threshold in question, the RNC starts inter-frequency or inter-RAT (GSM)
measurements in compressed mode for the purpose of hard handover. By
doing that, the Ec/N0 fluctuation ping-pong effect, which may lead to wrong
results, can be avoided.
In this case the message flow obtained is quite similar to the one Figure 24.
Firstly, once Ec/N0 drops below -9 dB, the UE sends a MEASUREMENT REPORT
(reporting event 1F) and the RNC sends the subsequent PHYSICAL CHANNEL
RECONFIGURATION so the UE can start compressed mode. The ISHO is interrupted
(compressed mode stopped) once the Ec/N0 raises up to -7 dB (see Figure 29):
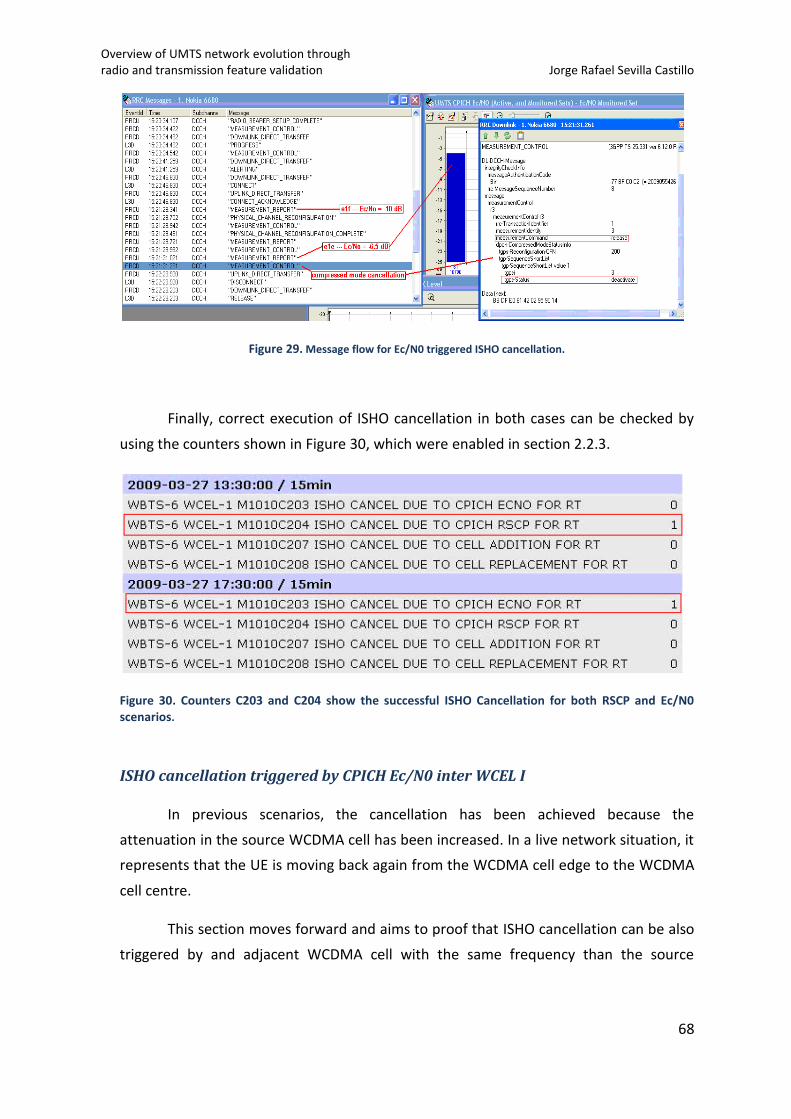
Overview of UMTS network evolution through radio and transmission feature validation Jorge Rafael Sevilla Castillo
68
Figure 29. Message flow for Ec/N0 triggered ISHO cancellation.
Finally, correct execution of ISHO cancellation in both cases can be checked by
using the counters shown in Figure 30, which were enabled in section 2.2.3.
Figure 30. Counters C203 and C204 show the successful ISHO Cancellation for both RSCP and Ec/N0 scenarios.
ISHO cancellation triggered by CPICH Ec/N0 inter WCEL I
In previous scenarios, the cancellation has been achieved because the
attenuation in the source WCDMA cell has been increased. In a live network situation, it
represents that the UE is moving back again from the WCDMA cell edge to the WCDMA
cell centre.
This section moves forward and aims to proof that ISHO cancellation can be also
triggered by and adjacent WCDMA cell with the same frequency than the source
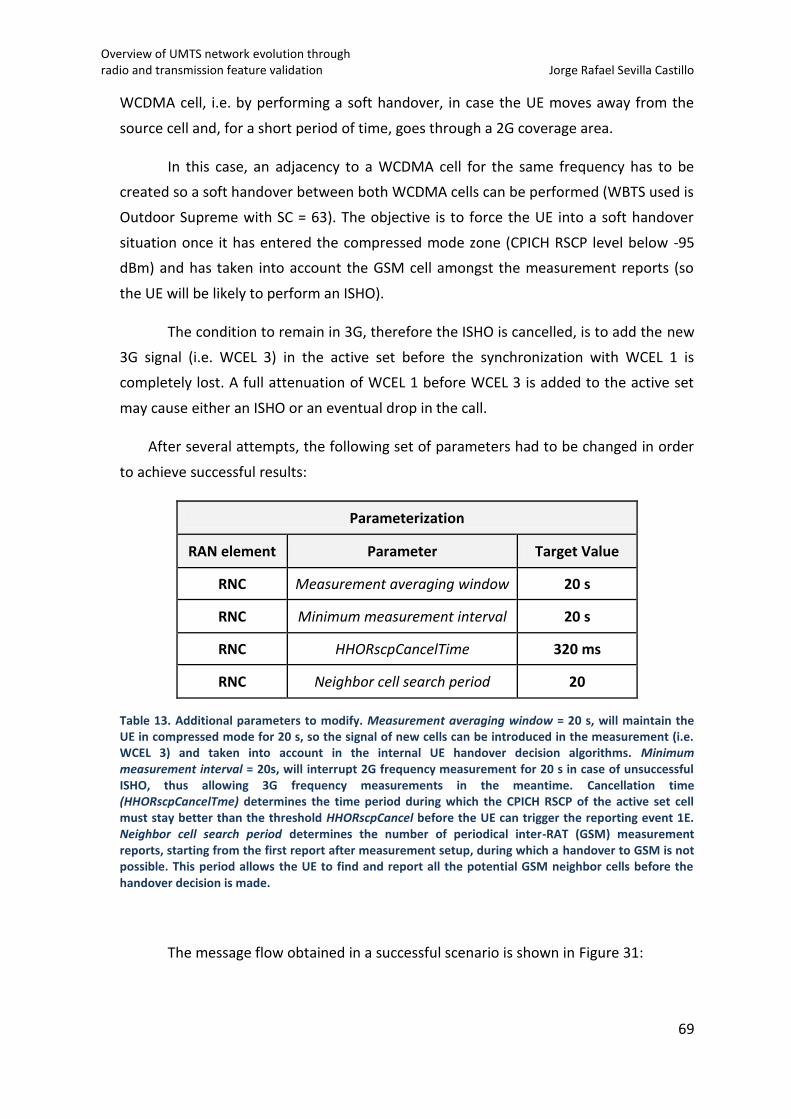
Overview of UMTS network evolution through radio and transmission feature validation Jorge Rafael Sevilla Castillo
69
WCDMA cell, i.e. by performing a soft handover, in case the UE moves away from the
source cell and, for a short period of time, goes through a 2G coverage area.
In this case, an adjacency to a WCDMA cell for the same frequency has to be
created so a soft handover between both WCDMA cells can be performed (WBTS used is
Outdoor Supreme with SC = 63). The objective is to force the UE into a soft handover
situation once it has entered the compressed mode zone (CPICH RSCP level below -95
dBm) and has taken into account the GSM cell amongst the measurement reports (so
the UE will be likely to perform an ISHO).
The condition to remain in 3G, therefore the ISHO is cancelled, is to add the new
3G signal (i.e. WCEL 3) in the active set before the synchronization with WCEL 1 is
completely lost. A full attenuation of WCEL 1 before WCEL 3 is added to the active set
may cause either an ISHO or an eventual drop in the call.
After several attempts, the following set of parameters had to be changed in order
to achieve successful results:
Parameterization
RAN element Parameter Target Value
RNC Measurement averaging window 20 s
RNC Minimum measurement interval 20 s
RNC HHORscpCancelTime 320 ms
RNC Neighbor cell search period 20
Table 13. Additional parameters to modify. Measurement averaging window = 20 s, will maintain the UE in compressed mode for 20 s, so the signal of new cells can be introduced in the measurement (i.e. WCEL 3) and taken into account in the internal UE handover decision algorithms. Minimum measurement interval = 20s, will interrupt 2G frequency measurement for 20 s in case of unsuccessful ISHO, thus allowing 3G frequency measurements in the meantime. Cancellation time (HHORscpCancelTme) determines the time period during which the CPICH RSCP of the active set cell must stay better than the threshold HHORscpCancel before the UE can trigger the reporting event 1E. Neighbor cell search period determines the number of periodical inter-RAT (GSM) measurement reports, starting from the first report after measurement setup, during which a handover to GSM is not possible. This period allows the UE to find and report all the potential GSM neighbor cells before the handover decision is made.
The message flow obtained in a successful scenario is shown in Figure 31:
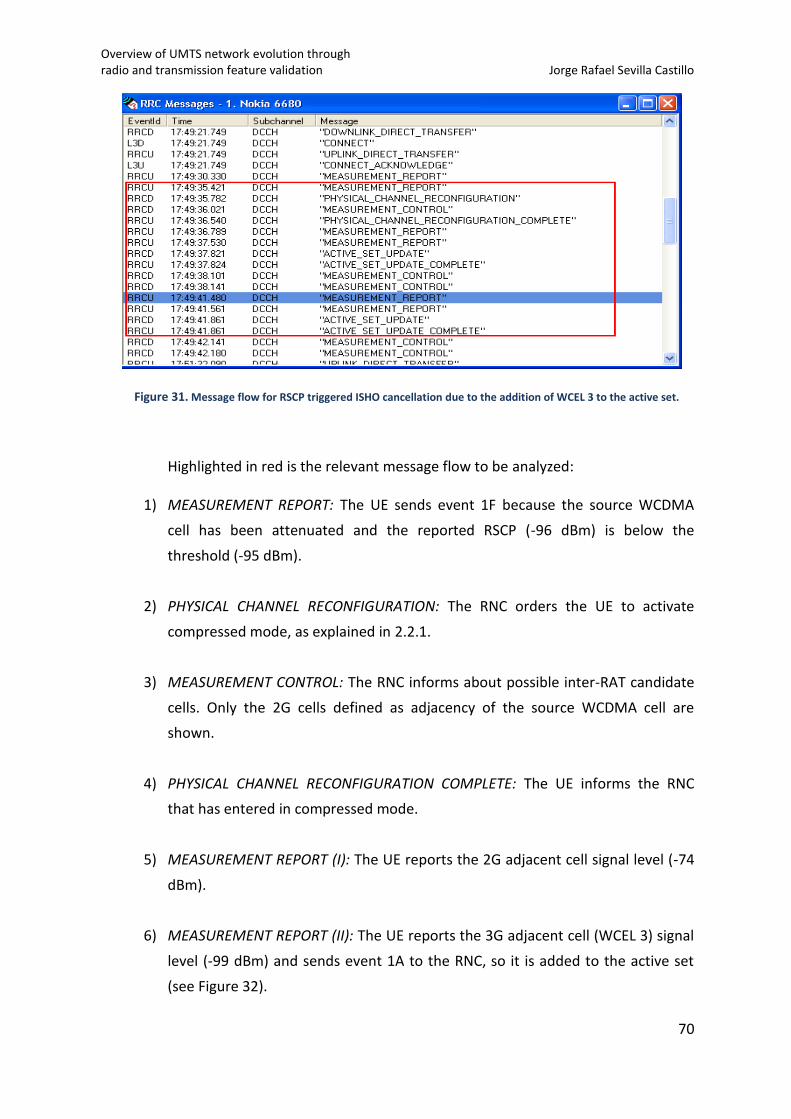
Overview of UMTS network evolution through radio and transmission feature validation Jorge Rafael Sevilla Castillo
70
Figure 31. Message flow for RSCP triggered ISHO cancellation due to the addition of WCEL 3 to the active set.
Highlighted in red is the relevant message flow to be analyzed:
1) MEASUREMENT REPORT: The UE sends event 1F because the source WCDMA
cell has been attenuated and the reported RSCP (-96 dBm) is below the
threshold (-95 dBm).
2) PHYSICAL CHANNEL RECONFIGURATION: The RNC orders the UE to activate
compressed mode, as explained in 2.2.1.
3) MEASUREMENT CONTROL: The RNC informs about possible inter-RAT candidate
cells. Only the 2G cells defined as adjacency of the source WCDMA cell are
shown.
4) PHYSICAL CHANNEL RECONFIGURATION COMPLETE: The UE informs the RNC
that has entered in compressed mode.
5) MEASUREMENT REPORT (I): The UE reports the 2G adjacent cell signal level (-74
dBm).
6) MEASUREMENT REPORT (II): The UE reports the 3G adjacent cell (WCEL 3) signal
level (-99 dBm) and sends event 1A to the RNC, so it is added to the active set
(see Figure 32).
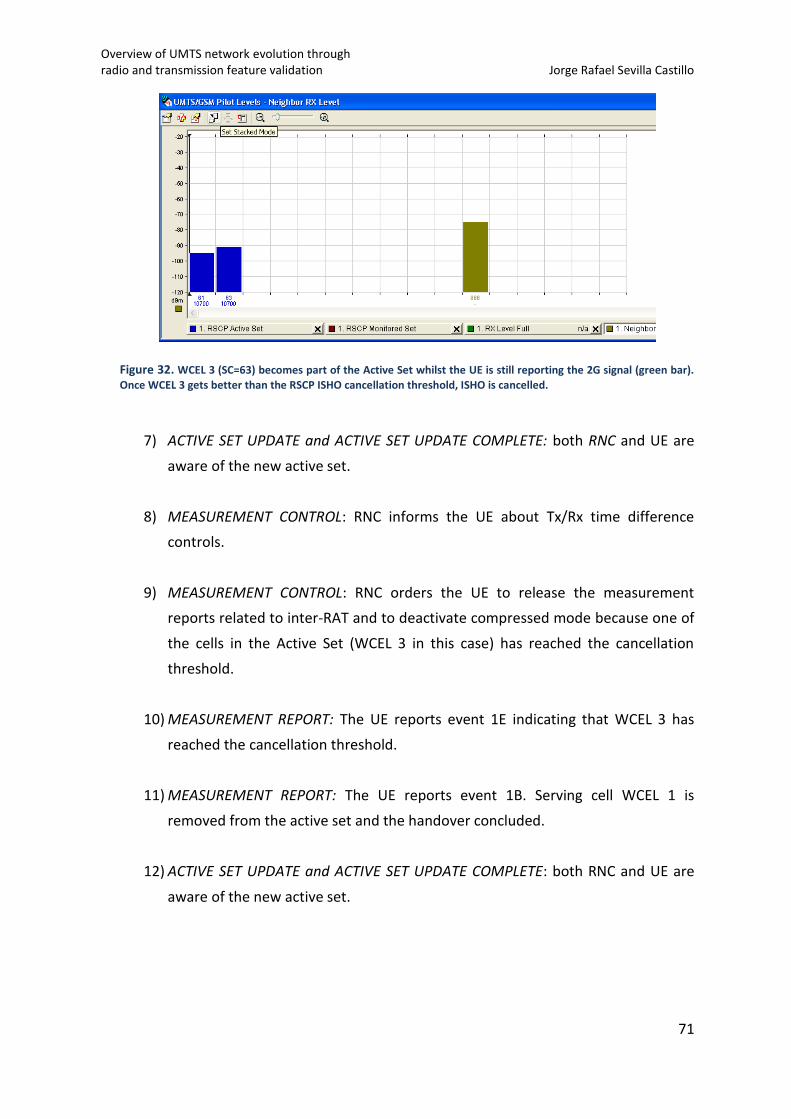
Overview of UMTS network evolution through radio and transmission feature validation Jorge Rafael Sevilla Castillo
71
Figure 32. WCEL 3 (SC=63) becomes part of the Active Set whilst the UE is still reporting the 2G signal (green bar).
Once WCEL 3 gets better than the RSCP ISHO cancellation threshold, ISHO is cancelled.
7) ACTIVE SET UPDATE and ACTIVE SET UPDATE COMPLETE: both RNC and UE are
aware of the new active set.
8) MEASUREMENT CONTROL: RNC informs the UE about Tx/Rx time difference
controls.
9) MEASUREMENT CONTROL: RNC orders the UE to release the measurement
reports related to inter-RAT and to deactivate compressed mode because one of
the cells in the Active Set (WCEL 3 in this case) has reached the cancellation
threshold.
10) MEASUREMENT REPORT: The UE reports event 1E indicating that WCEL 3 has
reached the cancellation threshold.
11) MEASUREMENT REPORT: The UE reports event 1B. Serving cell WCEL 1 is
removed from the active set and the handover concluded.
12) ACTIVE SET UPDATE and ACTIVE SET UPDATE COMPLETE: both RNC and UE are
aware of the new active set.

Overview of UMTS network evolution through radio and transmission feature validation Jorge Rafael Sevilla Castillo
72
ISHO cancellation triggered by CPICH RSCP inter WCEL II
Since the situation explained in the previous test has shown beneficial results for
the operator, the purpose of this section is to verify whether ISHO can be cancelled due
to an IFHO.
To proceed correctly, an inter-frequency adjacency has to be added. It can be
done by maintaining the same scenario as in Figure 25, but changing the frequency of
WCEL 3, for instance to UARFCN = 10725.
The aim of the test is to introduce WCEL 3 once the measurement of the 2G
signal has started. Note that, in this case, no active set update procedure is involved
since the target cell has got a different frequency.
After several unsuccessful attempts it can be concluded that ISHO cancellation
cannot be triggered by an IFHO because once the UE enters in compressed mode, it is
only capable to measure two frequencies at a time. If it is taken into account that one of
frequencies that he UE is always measuring is the one from the source cell, it only will
be allowed to measure an extra frequency (3G or 2G).
The RNC proceeds in the following manner: RNC knows about the existence of
two kinds of adjacencies, defined by the inter-frequency (ADJI) and inter-system (ADJG)
objects. Once the UE reports event 1F, the RNC orders the UE to start compressed mode
and prioritizes inter-frequency measurements over inter-system measurements by
giving the correct information to the UE inside MEASUREMENT CONTROL messages.
Being 3G the preferred system, inter-frequency measurements are performed first.
Once the UE cannot manage to find WCEL 3, otherwise an ISHO cannot be forced, a
measurement control message is received from the RNC cancelling the 3G inter-
frequency measurement and ordering the inter-RAT measurement. Once the UE starts
measuring 2G cells, there is no way to measure again WCEL 3, even though its
attenuation is decreased in order to meet the cancellation threshold, and the ISHO is
performed.
Overview of UMTS network evolution through radio and transmission feature validation Jorge Rafael Sevilla Castillo
73
2.2.5 Test Conclusions
Validation of the feature Inter System Handover Cancellation has proved that:
ISHO cancellation can be triggered by RSCP for both intra and inter WCDMA cell
scenarios, provided that the same frequency is involved.
ISHO cancellation can be triggered by Ec/N0 in intra WCDMA cell scenario.
Nowadays, with optimized services integrated in the 3G network it is beneficial
for the operator to maintain the users in the WCDMA layer rather than in 2G network,
provided that correct load and coverage levels are met in the cell. Introducing inter-
system handover cancellation in the network optimizes both the user experience and
operator mobility KPIs, in particular CS ISHO drop rate and PS ISHO drop rate, by
avoiding unnecessary 2G transitions that may be triggered when the UE remains
temporarily in cell edge situations.
Overview of UMTS network evolution through radio and transmission feature validation Jorge Rafael Sevilla Castillo
74
3 QoS Aware HSPA Scheduling
3.1 Theoretical Background
3.1.1 Introduction: What is QoS?
First of all, I would like to introduce what does the term QoS (Quality of Service)
refers to in cellular networks. QoS in cellular networks is defined as the capability of the
cellular service to provide a satisfactory service which includes voice quality, signal
strength, low call blocking and dropping probability, high data rates for data
applications, etc… In network-based services QoS basically depends on the following
factors:
Throughput: the rate at which the packets go through the network. Maximum
rate is always preferred, indeed.
Delay: this is the time which a packet takes to travel E2E (end-to-end). Minimum
delay is always preferred.
Packet Loss Rate: percentage of packets lost during data transmission. This
should be also as low as possible.
Packet Error Rate: errors present in a received packet due to corrupted bits. This
indicator should be kept as minimum as possible.
Reliability: this concept is related to the availability of the data connection.
It is for these reasons that providing QoS has been a great challenge in the past
and it continues to be hot topic as there is still a lot of scope to provide better service
standards.
Overview of UMTS network evolution through radio and transmission feature validation Jorge Rafael Sevilla Castillo
75
3.1.2 Why is QoS needed?
Imagine you are in the middle of a phone call and you are hardly able to hear
what your friend is talking over the phone of the call drops when you are talking
something important. These things are highlight undesirable and are the major concern
of the operators when providing service to their customers, as the number of
complaints should be dramatically reduced.
Communication plays a major role in today’s world and to support it, QoS has to
be given a major priority. It is important to differentiate the traffic based on priority
levels. This is when the concept of traffic class and prioritization arises: it is important to
differentiate the traffic based on priority level. Some traffic classes should be given
higher priority over other classes, for example: voice should be given a higher priority
compared to data traffic as voice is still considered as the most important service (apart
from emergency call service, which should be classified as the top prioritize service). In
addition, it should be noted that more preference has to be given to customers who pay
a premium to get better service, without affecting the remaining customers who pay the
standard price.
It is this last point where the feature test proposed herein is focused: provide
more radio and transmission resources to those non-real time High Speed Downlink
Packet Access (HSDPA) data VIP users versus standard tariffs under congested
conditions.
Nevertheless, further background should be provided in order to understand the
test case.
3.1.3 QoS Challenges
In wireless mobile networks, QoS refers to the measurement of a system with
good transmission quality, service availability and minimum delay. Nowadays, 4G
systems are expected to have a reliability of at least 99.999, referred to as the five-nine
reliability.
The major challenges when considering QoS in cellular networks are varying rate
channel characteristics, bandwidth allocation, fault tolerance and handoff support
among heterogeneous wireless networks. It is not a coincidence that each protocol layer
Overview of UMTS network evolution through radio and transmission feature validation Jorge Rafael Sevilla Castillo
76
involved in the communication process (including physical, MAC, IP, TCP and
application) has got their own mechanisms to provide QoS, because it is important to
guarantee QoS in each layer if we want to have a consistent QoS policy in the whole
network. Other challenge is efficient usage of the spectrum as it is a scarce resource and
this is where bandwidth allocation plays a key role.
The problem is even complex when data and voice services have to be
supported: voice services are very delay sensitive and require real-time service. On the
other hand, data services are less delay sensitive but are highly intolerant to packet loss
and packet error rate. So both these factors have to be considered for providing QoS for
voice and data services.
3.1.4 UMTS QoS Architecture
In 1G and 2G networks, such as GSM, there was only one aspect of QoS to take
into account: voice. Providing quality speech was the major concern. In 3G networks,
though, QoS has to be provided for voice as well as data. Still priority is given for voice
services as they are considered as the primary service. They are very delay sensitive and
require real-time service. Data services, mainly comprised of text and multimedia, are
less delay sensitive but better throughput and less or no packet loss rate are expected.
In this section, UMTS QoS architecture at every layer is described, together with
their functionalities. Further down, they are described the different QoS classes and
attributes involved.
Basically, since end-to-end (E2E) QoS should be preserved all the nodes from the
transmitter to the receiver need to cooperate with each other. QoS is defined during
subscription, and the related information is saved on the Core Network (CN). When a
user sends a service request, the CN negotiates with the UTRAN and the User
Equipment (UE) according to the subscribed QoS. If the negotiation is successful, a set of
QoS parameters accepted by all the nodes can be obtained. Then, each network
element provides the services for this user based on these parameters. It is very
important to note that the user can be satisfied with the E2E services only when all the
nodes meet the QoS requirements.
In the UTRAN, the QoS is determined by the QoS management strategy as shown
in Figure 33.
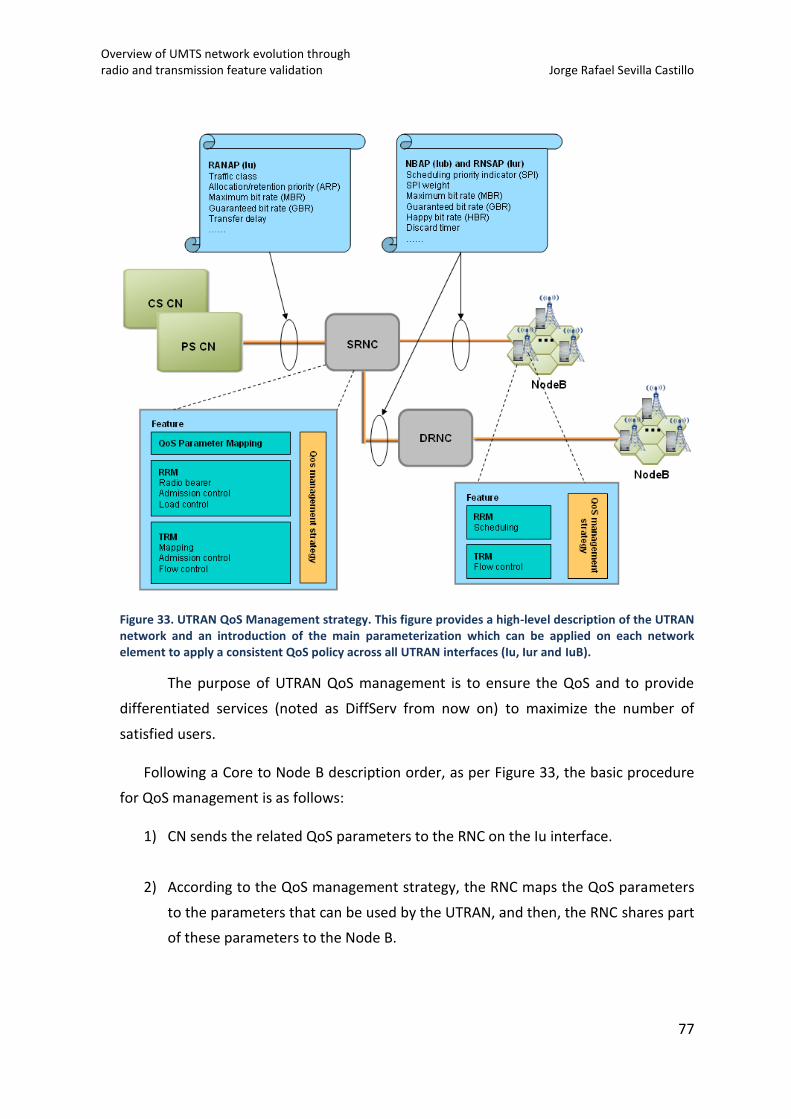
Overview of UMTS network evolution through radio and transmission feature validation Jorge Rafael Sevilla Castillo
77
Figure 33. UTRAN QoS Management strategy. This figure provides a high-level description of the UTRAN network and an introduction of the main parameterization which can be applied on each network element to apply a consistent QoS policy across all UTRAN interfaces (Iu, Iur and IuB).
The purpose of UTRAN QoS management is to ensure the QoS and to provide
differentiated services (noted as DiffServ from now on) to maximize the number of
satisfied users.
Following a Core to Node B description order, as per Figure 33, the basic procedure
for QoS management is as follows:
1) CN sends the related QoS parameters to the RNC on the Iu interface.
2) According to the QoS management strategy, the RNC maps the QoS parameters
to the parameters that can be used by the UTRAN, and then, the RNC shares part
of these parameters to the Node B.
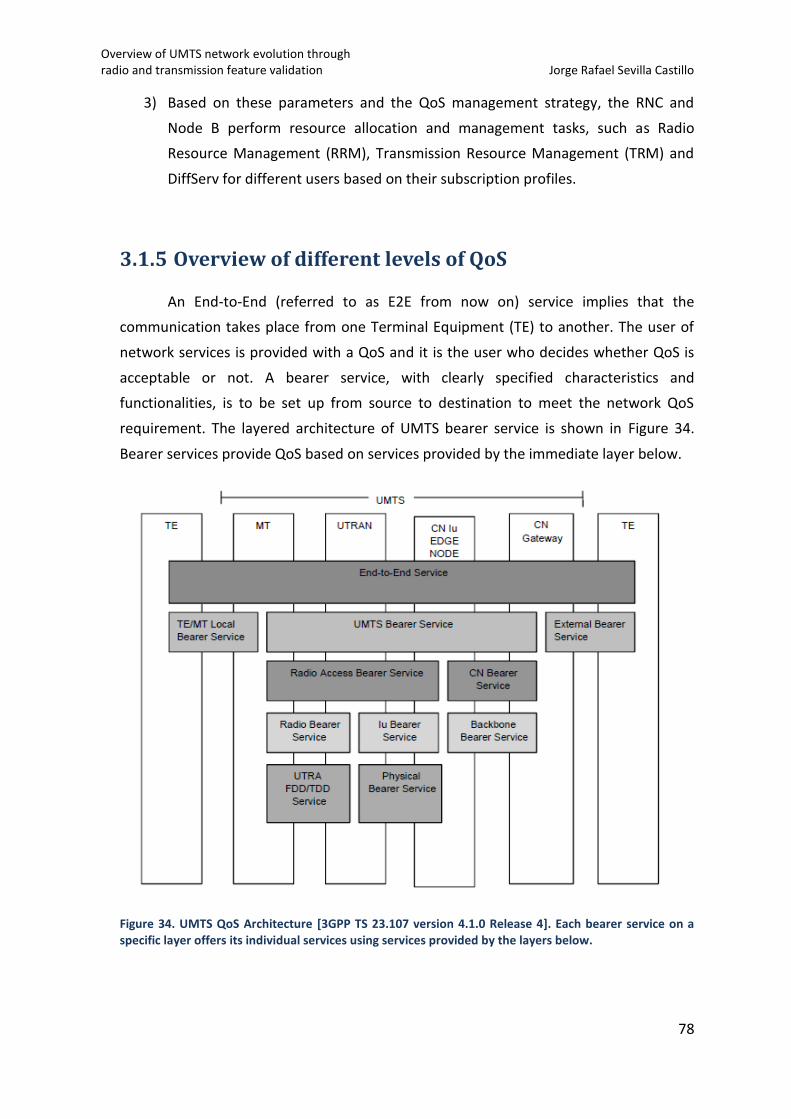
Overview of UMTS network evolution through radio and transmission feature validation Jorge Rafael Sevilla Castillo
78
3) Based on these parameters and the QoS management strategy, the RNC and
Node B perform resource allocation and management tasks, such as Radio
Resource Management (RRM), Transmission Resource Management (TRM) and
DiffServ for different users based on their subscription profiles.
3.1.5 Overview of different levels of QoS
An End-to-End (referred to as E2E from now on) service implies that the
communication takes place from one Terminal Equipment (TE) to another. The user of
network services is provided with a QoS and it is the user who decides whether QoS is
acceptable or not. A bearer service, with clearly specified characteristics and
functionalities, is to be set up from source to destination to meet the network QoS
requirement. The layered architecture of UMTS bearer service is shown in Figure 34.
Bearer services provide QoS based on services provided by the immediate layer below.
Figure 34. UMTS QoS Architecture [3GPP TS 23.107 version 4.1.0 Release 4]. Each bearer service on a specific layer offers its individual services using services provided by the layers below.
Overview of UMTS network evolution through radio and transmission feature validation Jorge Rafael Sevilla Castillo
79
E2E Service and UMTS Bearer Service
As shown in Figure 34, the E2E service layer is the topmost layer of the QoS
architecture. It makes communication possible from one TE to the other. It is depictured
that a TE is connected to the UMTS network by means of a Mobile Termination (MT).
The E2E services used by a TE will be realized by the layers below, namely TE/MT local
bearer service, a UMTS bearer service and external bearer service. The UMTS operator
offers services provided by the UMTS bearer service. Thus UMTS bearer service provides
the UMTS QoS.
Radio Access Bearer Service and Core Network Bearer Service
The UMTS Bearer service is comprised of two parts which are the Radio Access
Bearer service and the Core Network Bearer service. Both these services take care of the
Bearer service over the network topology, taking into consideration attributes such as
mobility and mobile subscriber profiles. The Radio Access Bearer Service makes
provision for the transport of signaling and user data between MT and Core Network
(CN) Edge Node with QoS adequate to the negotiated UMTS bearer service or with
default QoS for signaling.
The CN Bearer Service of the UMTS core network connects the UMTS CN Edge
Node with the CN Gateway to the external network. This service controls and utilizes
the backbone network efficiently in order to provide the contracted UMTS bearer
service.
Radio Bearer Service and RAN Access Bearer Service
The Radio Access Bearer Service is supported by a Radio Bearer (RB) Service and
a RAN Access Bearer Service. The RB Service covers all aspects of the radio interface
transport. To support unequal error protection, RAN and MT have the ability to
segment/reassemble the user flows into the different subflows requested by the Radio
Access Bearer Service. The segmentation/reassemble is given by the Service Data Unit
(SDU) payload format signaled at Radio Access Bearer establishment.
Backbone Network Service
The CN Bearer Service uses a generic Backbone Network (BN) Service. The BN
Service covers the layer 1/layer 2 functionality and is selected according to the
operator’s choice in order to fulfill the QoS requirements of the CN Bearer Service.
Overview of UMTS network evolution through radio and transmission feature validation Jorge Rafael Sevilla Castillo
80
3.1.6 UMTS QoS Classes and Attributes
QoS Classes
There are four different QoS classes, namely:
Conversational class
Streaming class
Interactive class
Background class
The main differences between these QoS classes are how delay sensitive the
traffic is. Conversation class is meant for very delay sensitive traffic, whereas
Background class is the most delay insensitive class.
Conversational and Streaming classes are used to serve real-time traffic flows
which are very sensitive to delay. Examples of conversational and streaming classes
include real-time services like voice services, video telephony and data streams.
Interactive and Background (also called best-effort) classes are mainly meant for
applications such as World Wide Web (WWW), e-Mail, FTP, instant messaging services,
etc… Since these classes are less delay sensitive compared to conversational and
streaming, both provide better error rate by means of enhanced channel coding
techniques and retransmissions. This means that packet retransmission is done
whenever packet error/packet loss/packet order mismatch occurs. The reason is that
these classes are delay insensitive but expect high throughput and less error rates. The
main difference between Interactive and Background class is that Interactive class is
mainly used for applications like interactive e-Mail and interactive Web browsing, while
Background class is meant for background traffic, e.g. background e-Mail download or
background file downloading. The scheduling algorithm gives more priority to
interactive class than background; therefore, background applications use the
transmission resources only when the interactive applications do not need them.
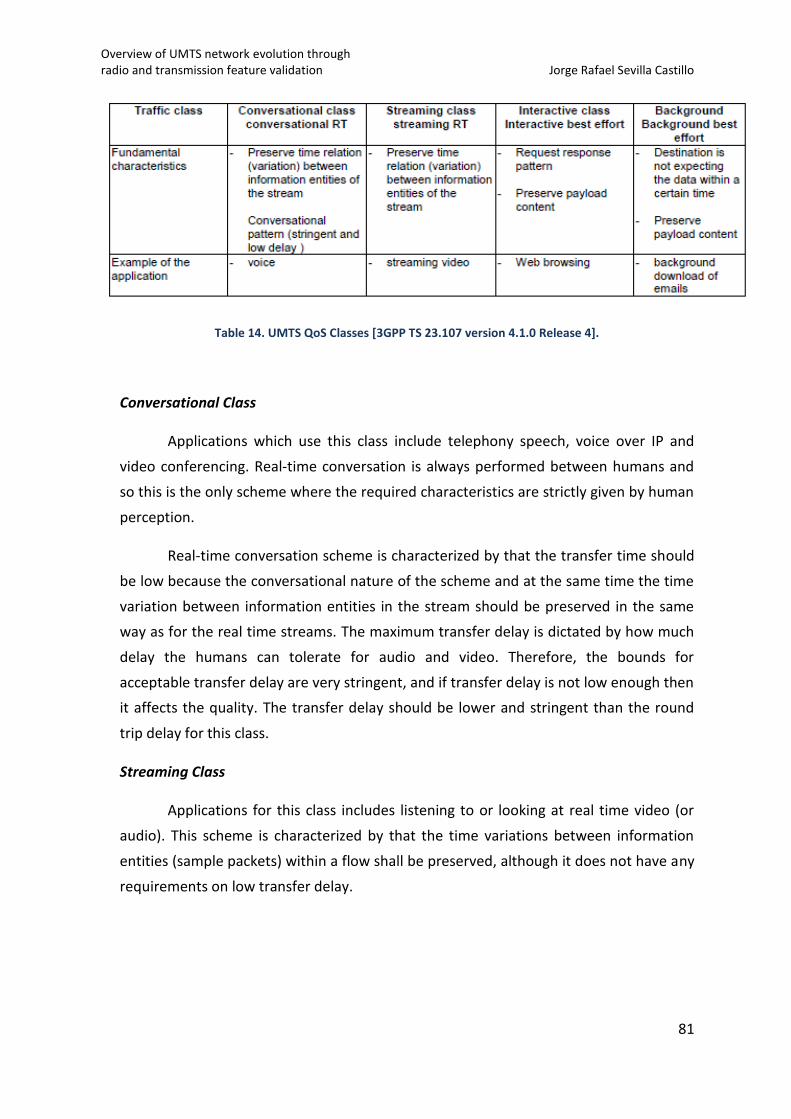
Overview of UMTS network evolution through radio and transmission feature validation Jorge Rafael Sevilla Castillo
81
Table 14. UMTS QoS Classes [3GPP TS 23.107 version 4.1.0 Release 4].
Conversational Class
Applications which use this class include telephony speech, voice over IP and
video conferencing. Real-time conversation is always performed between humans and
so this is the only scheme where the required characteristics are strictly given by human
perception.
Real-time conversation scheme is characterized by that the transfer time should
be low because the conversational nature of the scheme and at the same time the time
variation between information entities in the stream should be preserved in the same
way as for the real time streams. The maximum transfer delay is dictated by how much
delay the humans can tolerate for audio and video. Therefore, the bounds for
acceptable transfer delay are very stringent, and if transfer delay is not low enough then
it affects the quality. The transfer delay should be lower and stringent than the round
trip delay for this class.
Streaming Class
Applications for this class includes listening to or looking at real time video (or
audio). This scheme is characterized by that the time variations between information
entities (sample packets) within a flow shall be preserved, although it does not have any
requirements on low transfer delay.
Overview of UMTS network evolution through radio and transmission feature validation Jorge Rafael Sevilla Castillo
82
Interactive Class
Applications for this class include Web browsing, database retrieval, server
access, etc… Interactive traffic is a communication scheme which is characterized by the
request-response pattern of the end user. Round trip delay and low error rate are the
most important attributes for this class.
Background Class
This is a service class in which the applications run in the background. E-Mail
program running in the background is an example for this kind of service (it sleeps for
most of the time and wakes up when email arrives). Other examples include instant
messaging, FTP downloads, etc… Background traffic is characterized by that the
destination is not expecting the data within a certain time. Thus this class is less delay
sensitive, but the contents should be delivered with low error rate.
Finally, the main QoS attributes are presented.
QoS Attributes
UMTS bearer services attributes describe the service provided by the UMTS
network to the user of the UMTS bearer service. A set of QoS attributes (QoS profile)
specifies this service. Below is a list with the main attributes:
Maximum bit rate (kbps): MBR is defined as the maximum number of bits
delivered by the UMTS and to the UMTS at a Service Access Point (SAP)
within a period of time, divided by the duration period. The maximum bit
rate is the upper limit a user or application can accept or provide. The
purpose of this attribute is:
- To limit the delivered bit rate to applications or external networks with such limitation; and
- To allow maximum user bit rated to be defined for applications able to operate with different rates.
Guaranteed bit rate (kbps): GBR is defined as the guaranteed number of bits
delivered by UMTS at a SAP within a period of time (provided that there is
data to deliver), divided by the duration period. The purpose of this attribute
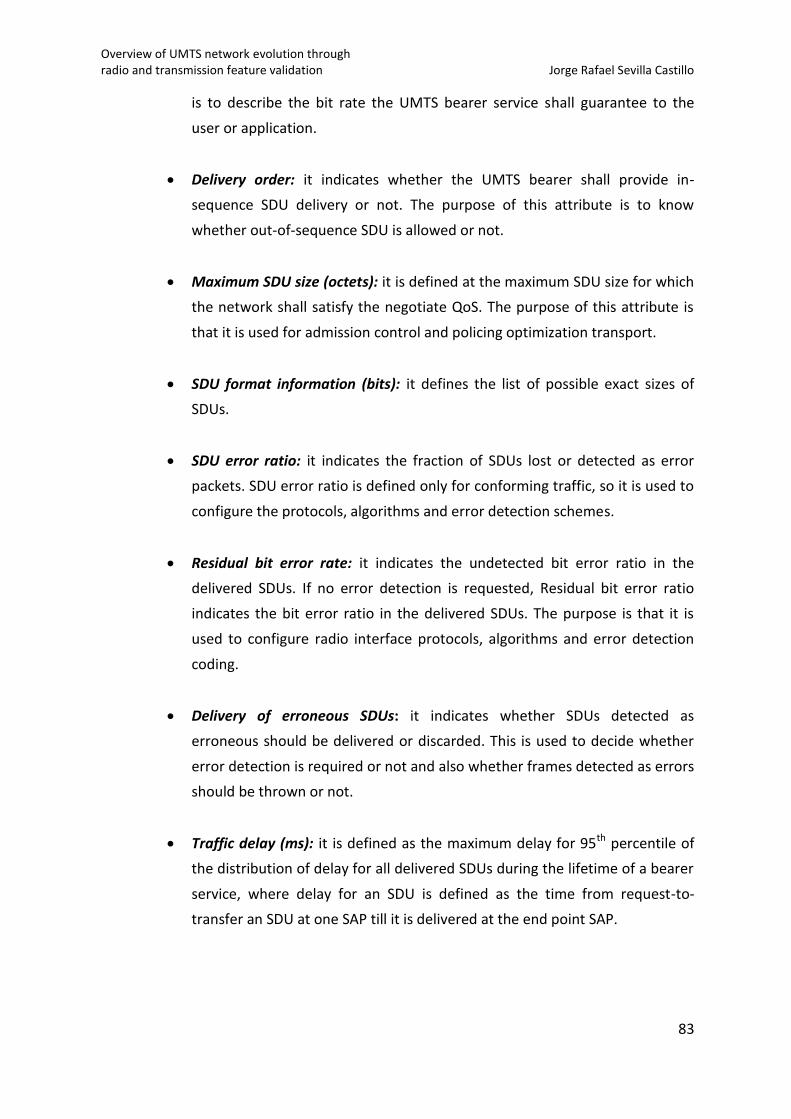
Overview of UMTS network evolution through radio and transmission feature validation Jorge Rafael Sevilla Castillo
83
is to describe the bit rate the UMTS bearer service shall guarantee to the
user or application.
Delivery order: it indicates whether the UMTS bearer shall provide in-
sequence SDU delivery or not. The purpose of this attribute is to know
whether out-of-sequence SDU is allowed or not.
Maximum SDU size (octets): it is defined at the maximum SDU size for which
the network shall satisfy the negotiate QoS. The purpose of this attribute is
that it is used for admission control and policing optimization transport.
SDU format information (bits): it defines the list of possible exact sizes of
SDUs.
SDU error ratio: it indicates the fraction of SDUs lost or detected as error
packets. SDU error ratio is defined only for conforming traffic, so it is used to
configure the protocols, algorithms and error detection schemes.
Residual bit error rate: it indicates the undetected bit error ratio in the
delivered SDUs. If no error detection is requested, Residual bit error ratio
indicates the bit error ratio in the delivered SDUs. The purpose is that it is
used to configure radio interface protocols, algorithms and error detection
coding.
Delivery of erroneous SDUs: it indicates whether SDUs detected as
erroneous should be delivered or discarded. This is used to decide whether
error detection is required or not and also whether frames detected as errors
should be thrown or not.
Traffic delay (ms): it is defined as the maximum delay for 95th percentile of
the distribution of delay for all delivered SDUs during the lifetime of a bearer
service, where delay for an SDU is defined as the time from request-to-
transfer an SDU at one SAP till it is delivered at the end point SAP.
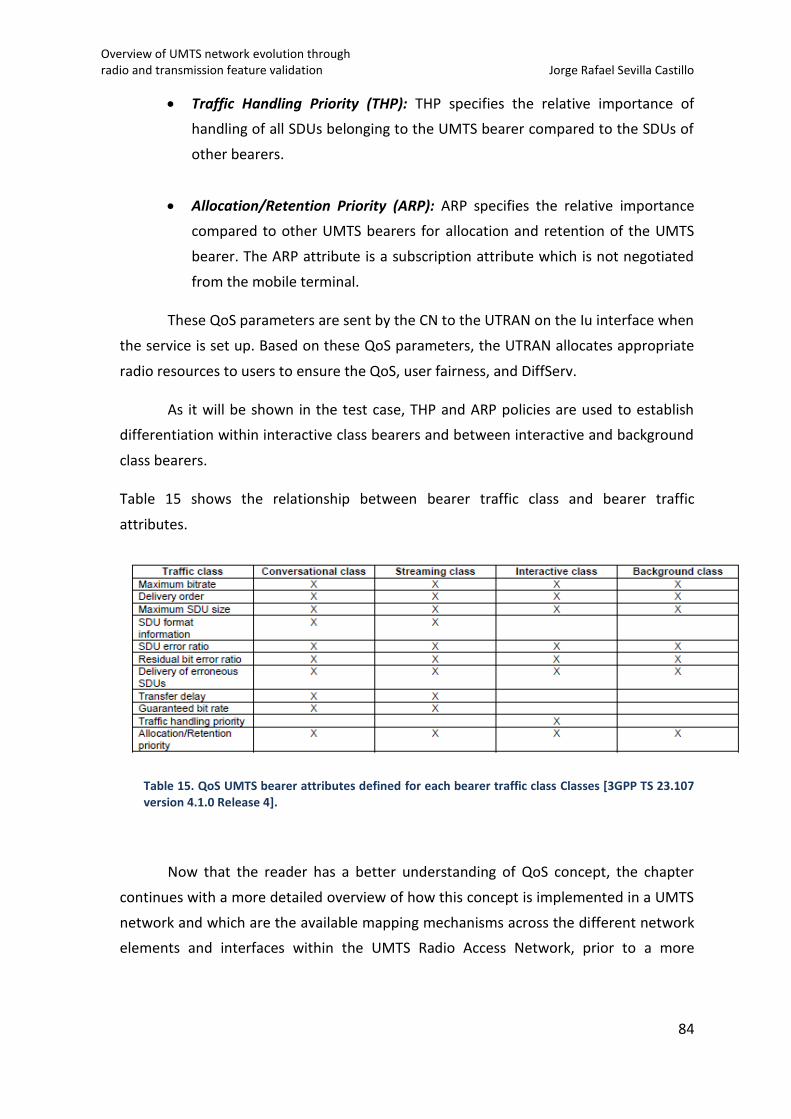
Overview of UMTS network evolution through radio and transmission feature validation Jorge Rafael Sevilla Castillo
84
Traffic Handling Priority (THP): THP specifies the relative importance of
handling of all SDUs belonging to the UMTS bearer compared to the SDUs of
other bearers.
Allocation/Retention Priority (ARP): ARP specifies the relative importance
compared to other UMTS bearers for allocation and retention of the UMTS
bearer. The ARP attribute is a subscription attribute which is not negotiated
from the mobile terminal.
These QoS parameters are sent by the CN to the UTRAN on the Iu interface when
the service is set up. Based on these QoS parameters, the UTRAN allocates appropriate
radio resources to users to ensure the QoS, user fairness, and DiffServ.
As it will be shown in the test case, THP and ARP policies are used to establish
differentiation within interactive class bearers and between interactive and background
class bearers.
Table 15 shows the relationship between bearer traffic class and bearer traffic
attributes.
Table 15. QoS UMTS bearer attributes defined for each bearer traffic class Classes [3GPP TS 23.107 version 4.1.0 Release 4].
Now that the reader has a better understanding of QoS concept, the chapter
continues with a more detailed overview of how this concept is implemented in a UMTS
network and which are the available mapping mechanisms across the different network
elements and interfaces within the UMTS Radio Access Network, prior to a more
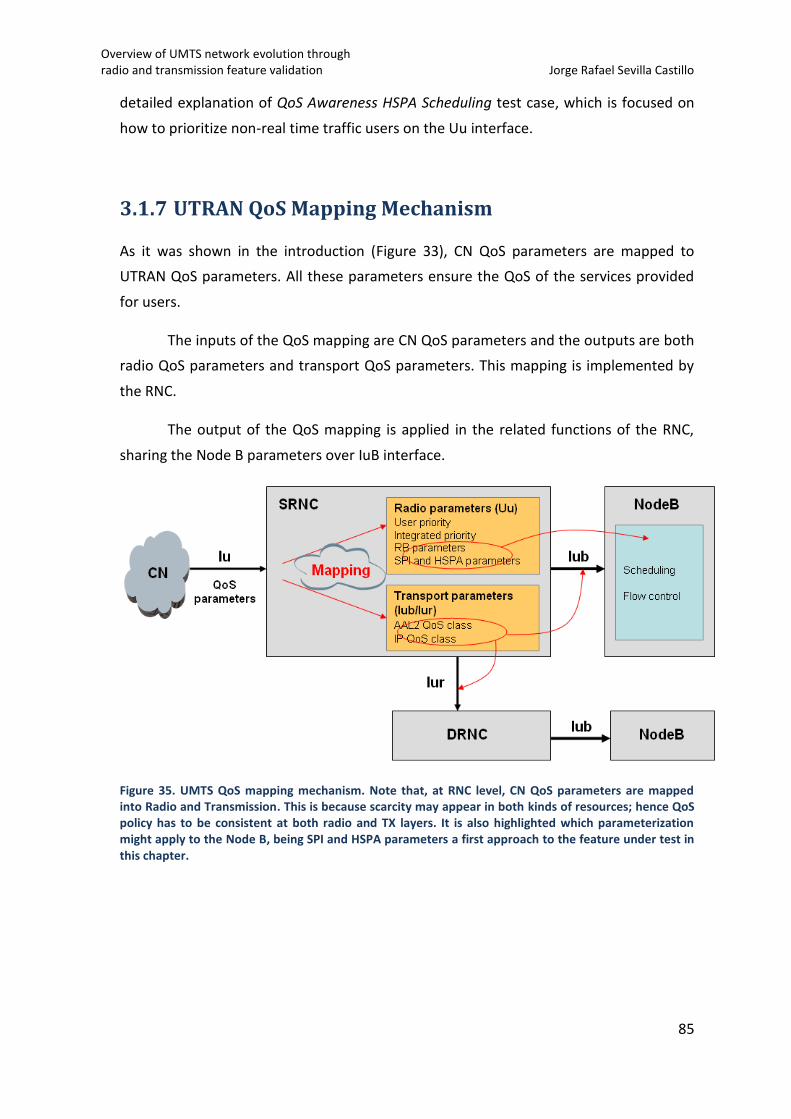
Overview of UMTS network evolution through radio and transmission feature validation Jorge Rafael Sevilla Castillo
85
detailed explanation of QoS Awareness HSPA Scheduling test case, which is focused on
how to prioritize non-real time traffic users on the Uu interface.
3.1.7 UTRAN QoS Mapping Mechanism
As it was shown in the introduction (Figure 33), CN QoS parameters are mapped to
UTRAN QoS parameters. All these parameters ensure the QoS of the services provided
for users.
The inputs of the QoS mapping are CN QoS parameters and the outputs are both
radio QoS parameters and transport QoS parameters. This mapping is implemented by
the RNC.
The output of the QoS mapping is applied in the related functions of the RNC,
sharing the Node B parameters over IuB interface.
Figure 35. UMTS QoS mapping mechanism. Note that, at RNC level, CN QoS parameters are mapped into Radio and Transmission. This is because scarcity may appear in both kinds of resources; hence QoS policy has to be consistent at both radio and TX layers. It is also highlighted which parameterization might apply to the Node B, being SPI and HSPA parameters a first approach to the feature under test in this chapter.
Overview of UMTS network evolution through radio and transmission feature validation Jorge Rafael Sevilla Castillo
86
Uu Radio QoS Mapping
Uu, which is the air interface, radio QoS parameters are used to manage the
radio resources on the Uu interface. This mapping is implemented by the RNC and
comprises different procedures:
RAB-to-RB Mapping
User Priority Mapping
RAB Integrated Priority Mapping
HSPA SPI Mapping and GBR Mapping
RAB-to-RB Mapping
The RAB setup request initiated by the CN carries the QoS parameters,
describing QoS requirements. Based on these parameters, the RNC selects the
appropriate RB parameters, such as the bearer channel type, channel parameters, RLC
mode, data transmission parameters and power control parameters. The RB parameters
provide the basic configuration information about the RB service. Part of this
information is sent to the Node B on the IuB interface.
RAB-to-RB mapping considers all the QoS parameters of the CN.
Figure 36. RAB-to-RB mapping. Here it is depictured the different parameters shared between the CN and the RNC related to QoS. TRB stands for Traffic Radio Bearer, and contains the already mapped RB parameters to be shared between RNC and Node B, including Qos parameters (noted as RB QoS). Note that this information sharing is a key part of the admission control checks when establishing a Radio Access Bearer Service.
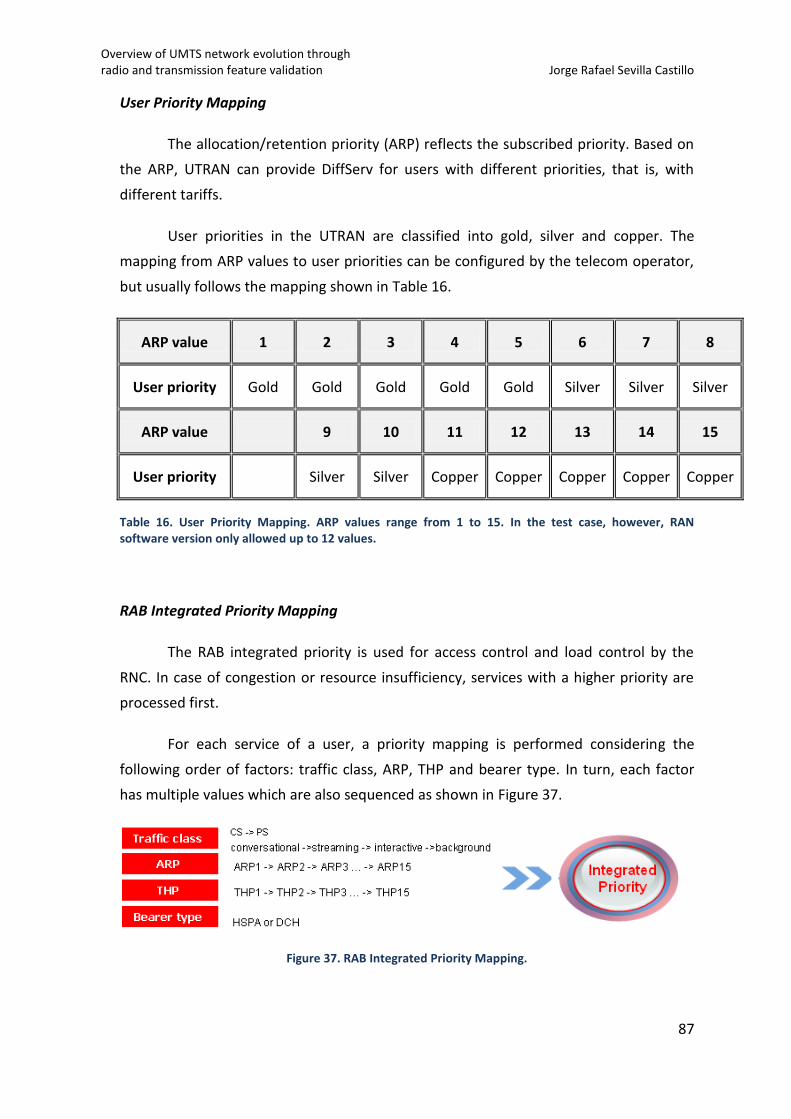
Overview of UMTS network evolution through radio and transmission feature validation Jorge Rafael Sevilla Castillo
87
User Priority Mapping
The allocation/retention priority (ARP) reflects the subscribed priority. Based on
the ARP, UTRAN can provide DiffServ for users with different priorities, that is, with
different tariffs.
User priorities in the UTRAN are classified into gold, silver and copper. The
mapping from ARP values to user priorities can be configured by the telecom operator,
but usually follows the mapping shown in Table 16.
ARP value 1 2 3 4 5 6 7 8
User priority Gold Gold Gold Gold Gold Silver Silver Silver
ARP value 9 10 11 12 13 14 15
User priority Silver Silver Copper Copper Copper Copper Copper
Table 16. User Priority Mapping. ARP values range from 1 to 15. In the test case, however, RAN software version only allowed up to 12 values.
RAB Integrated Priority Mapping
The RAB integrated priority is used for access control and load control by the
RNC. In case of congestion or resource insufficiency, services with a higher priority are
processed first.
For each service of a user, a priority mapping is performed considering the
following order of factors: traffic class, ARP, THP and bearer type. In turn, each factor
has multiple values which are also sequenced as shown in Figure 37.
Figure 37. RAB Integrated Priority Mapping.
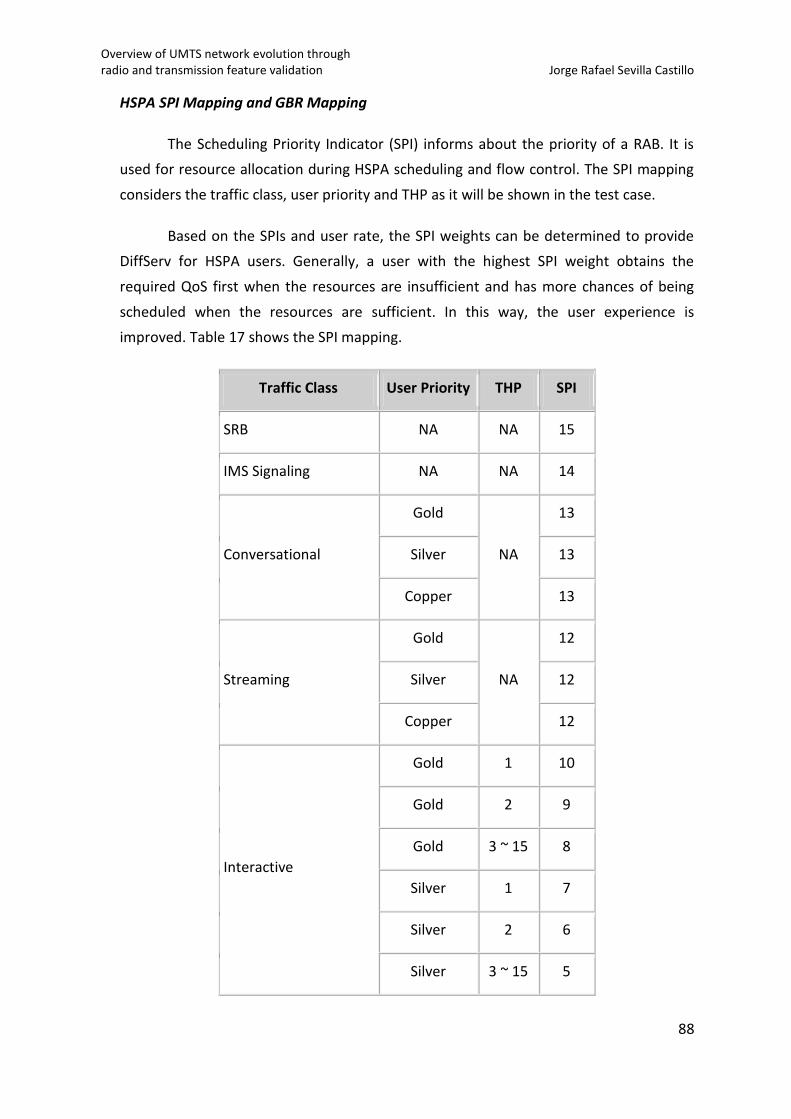
Overview of UMTS network evolution through radio and transmission feature validation Jorge Rafael Sevilla Castillo
88
HSPA SPI Mapping and GBR Mapping
The Scheduling Priority Indicator (SPI) informs about the priority of a RAB. It is
used for resource allocation during HSPA scheduling and flow control. The SPI mapping
considers the traffic class, user priority and THP as it will be shown in the test case.
Based on the SPIs and user rate, the SPI weights can be determined to provide
DiffServ for HSPA users. Generally, a user with the highest SPI weight obtains the
required QoS first when the resources are insufficient and has more chances of being
scheduled when the resources are sufficient. In this way, the user experience is
improved. Table 17 shows the SPI mapping.
Traffic Class User Priority THP SPI
SRB NA NA 15
IMS Signaling NA NA 14
Conversational
Gold
NA
13
Silver 13
Copper 13
Streaming
Gold
NA
12
Silver 12
Copper 12
Interactive
Gold 1 10
Gold 2 9
Gold 3 ~ 15 8
Silver 1 7
Silver 2 6
Silver 3 ~ 15 5
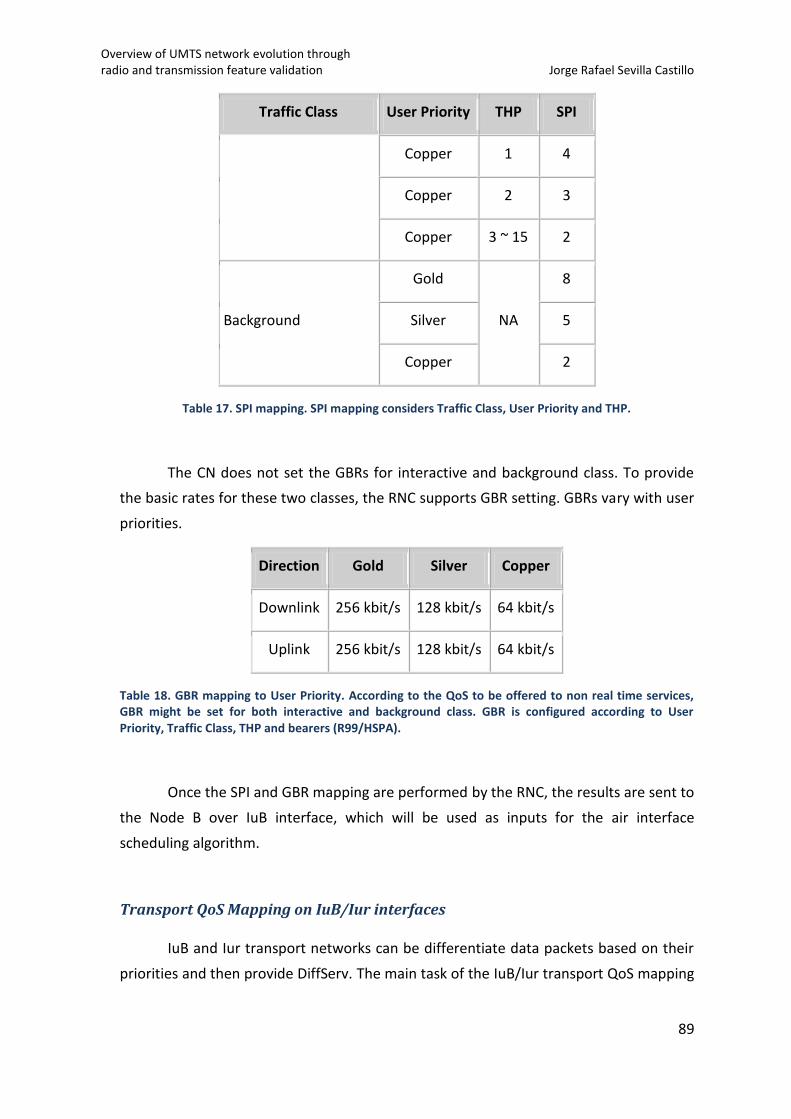
Overview of UMTS network evolution through radio and transmission feature validation Jorge Rafael Sevilla Castillo
89
Traffic Class User Priority THP SPI
Copper 1 4
Copper 2 3
Copper 3 ~ 15 2
Background
Gold
NA
8
Silver 5
Copper 2
Table 17. SPI mapping. SPI mapping considers Traffic Class, User Priority and THP.
The CN does not set the GBRs for interactive and background class. To provide
the basic rates for these two classes, the RNC supports GBR setting. GBRs vary with user
priorities.
Direction Gold Silver Copper
Downlink 256 kbit/s 128 kbit/s 64 kbit/s
Uplink 256 kbit/s 128 kbit/s 64 kbit/s
Table 18. GBR mapping to User Priority. According to the QoS to be offered to non real time services, GBR might be set for both interactive and background class. GBR is configured according to User Priority, Traffic Class, THP and bearers (R99/HSPA).
Once the SPI and GBR mapping are performed by the RNC, the results are sent to
the Node B over IuB interface, which will be used as inputs for the air interface
scheduling algorithm.
Transport QoS Mapping on IuB/Iur interfaces
IuB and Iur transport networks can be differentiate data packets based on their
priorities and then provide DiffServ. The main task of the IuB/Iur transport QoS mapping
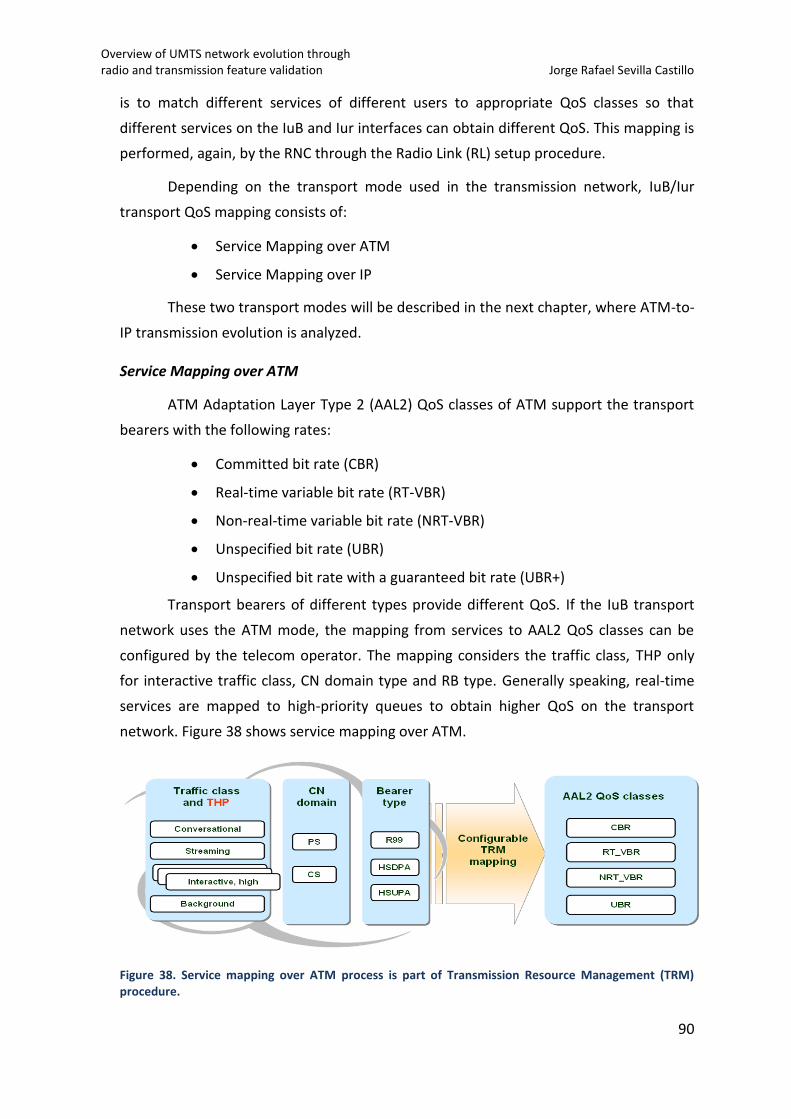
Overview of UMTS network evolution through radio and transmission feature validation Jorge Rafael Sevilla Castillo
90
is to match different services of different users to appropriate QoS classes so that
different services on the IuB and Iur interfaces can obtain different QoS. This mapping is
performed, again, by the RNC through the Radio Link (RL) setup procedure.
Depending on the transport mode used in the transmission network, IuB/Iur
transport QoS mapping consists of:
Service Mapping over ATM
Service Mapping over IP
These two transport modes will be described in the next chapter, where ATM-to-
IP transmission evolution is analyzed.
Service Mapping over ATM
ATM Adaptation Layer Type 2 (AAL2) QoS classes of ATM support the transport
bearers with the following rates:
Committed bit rate (CBR)
Real-time variable bit rate (RT-VBR)
Non-real-time variable bit rate (NRT-VBR)
Unspecified bit rate (UBR)
Unspecified bit rate with a guaranteed bit rate (UBR+)
Transport bearers of different types provide different QoS. If the IuB transport
network uses the ATM mode, the mapping from services to AAL2 QoS classes can be
configured by the telecom operator. The mapping considers the traffic class, THP only
for interactive traffic class, CN domain type and RB type. Generally speaking, real-time
services are mapped to high-priority queues to obtain higher QoS on the transport
network. Figure 38 shows service mapping over ATM.
Figure 38. Service mapping over ATM process is part of Transmission Resource Management (TRM) procedure.
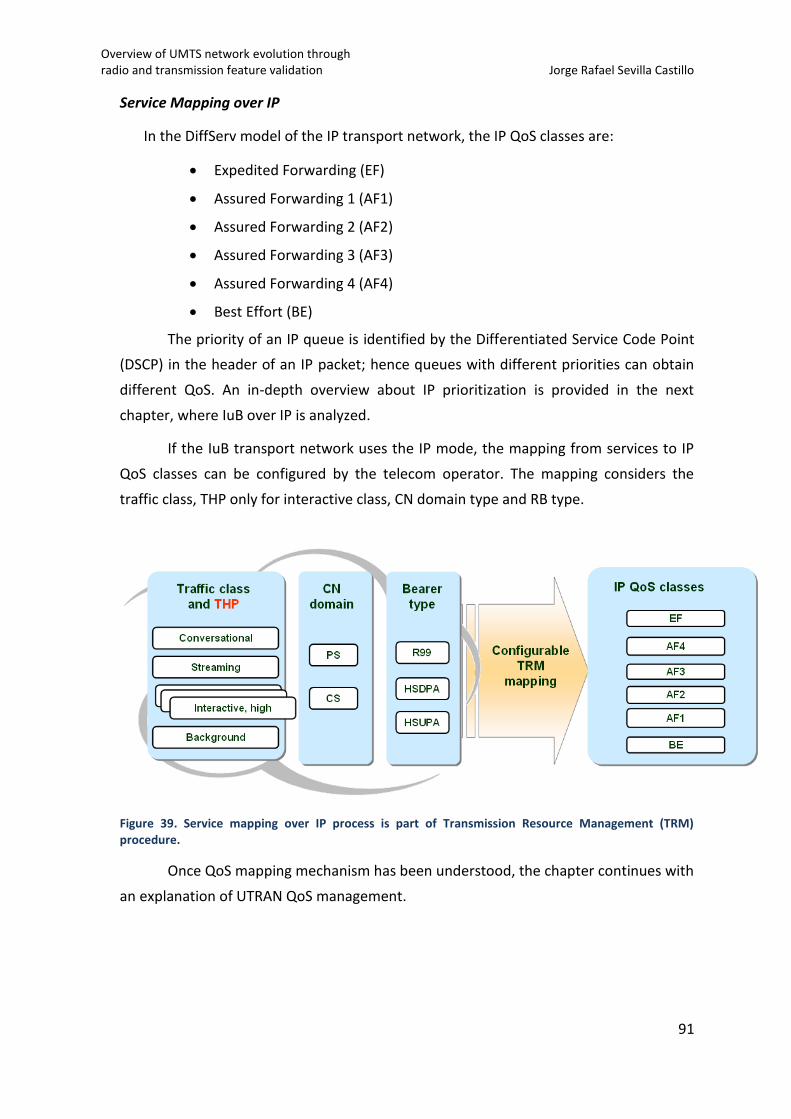
Overview of UMTS network evolution through radio and transmission feature validation Jorge Rafael Sevilla Castillo
91
Service Mapping over IP
In the DiffServ model of the IP transport network, the IP QoS classes are:
Expedited Forwarding (EF)
Assured Forwarding 1 (AF1)
Assured Forwarding 2 (AF2)
Assured Forwarding 3 (AF3)
Assured Forwarding 4 (AF4)
Best Effort (BE)
The priority of an IP queue is identified by the Differentiated Service Code Point
(DSCP) in the header of an IP packet; hence queues with different priorities can obtain
different QoS. An in-depth overview about IP prioritization is provided in the next
chapter, where IuB over IP is analyzed.
If the IuB transport network uses the IP mode, the mapping from services to IP
QoS classes can be configured by the telecom operator. The mapping considers the
traffic class, THP only for interactive class, CN domain type and RB type.
Figure 39. Service mapping over IP process is part of Transmission Resource Management (TRM) procedure.
Once QoS mapping mechanism has been understood, the chapter continues with
an explanation of UTRAN QoS management.
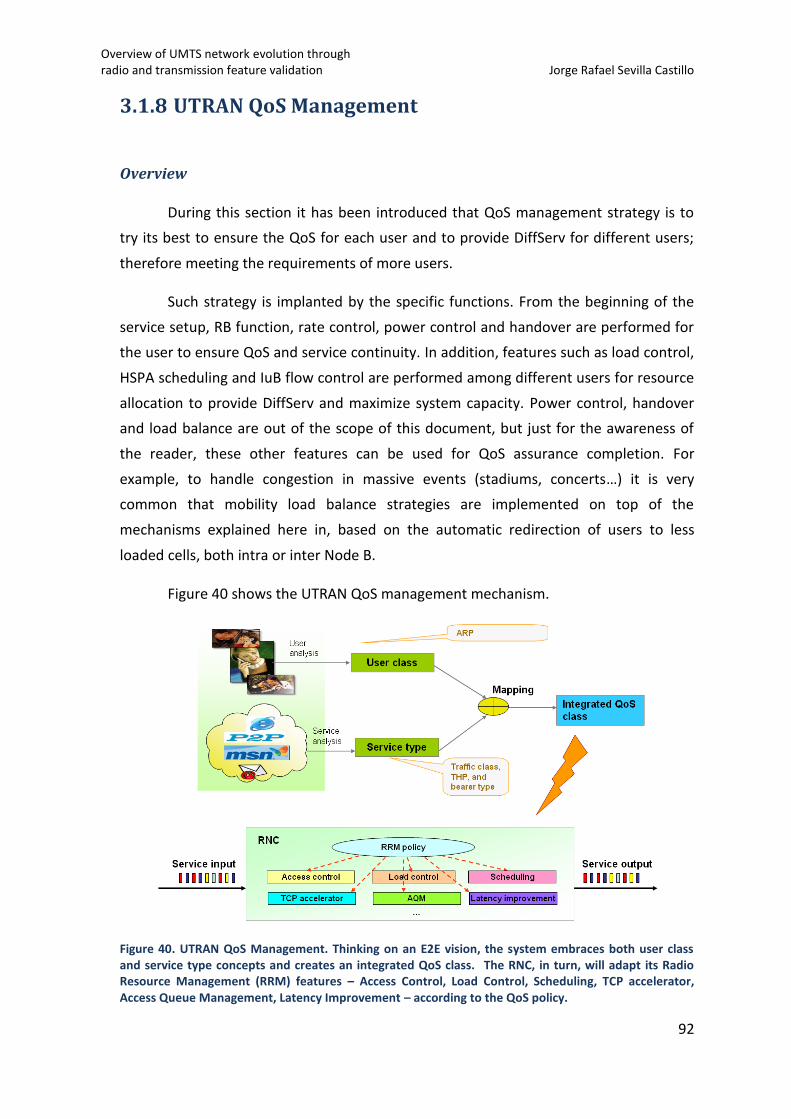
Overview of UMTS network evolution through radio and transmission feature validation Jorge Rafael Sevilla Castillo
92
3.1.8 UTRAN QoS Management
Overview
During this section it has been introduced that QoS management strategy is to
try its best to ensure the QoS for each user and to provide DiffServ for different users;
therefore meeting the requirements of more users.
Such strategy is implanted by the specific functions. From the beginning of the
service setup, RB function, rate control, power control and handover are performed for
the user to ensure QoS and service continuity. In addition, features such as load control,
HSPA scheduling and IuB flow control are performed among different users for resource
allocation to provide DiffServ and maximize system capacity. Power control, handover
and load balance are out of the scope of this document, but just for the awareness of
the reader, these other features can be used for QoS assurance completion. For
example, to handle congestion in massive events (stadiums, concerts…) it is very
common that mobility load balance strategies are implemented on top of the
mechanisms explained here in, based on the automatic redirection of users to less
loaded cells, both intra or inter Node B.
Figure 40 shows the UTRAN QoS management mechanism.
Figure 40. UTRAN QoS Management. Thinking on an E2E vision, the system embraces both user class and service type concepts and creates an integrated QoS class. The RNC, in turn, will adapt its Radio Resource Management (RRM) features – Access Control, Load Control, Scheduling, TCP accelerator, Access Queue Management, Latency Improvement – according to the QoS policy.
Overview of UMTS network evolution through radio and transmission feature validation Jorge Rafael Sevilla Castillo
93
How can be the QoS guaranteed for a single user?
Single user Qos can be guaranteed by implementing a series of functions. One
purpose is to ensure the user requirement for its basic QoS by carrying the user services
on the appropriate channels and setting corresponding parameters. The second purpose
is to ensure service continuity by monitoring the link quality when the user is in mobility
conditions. So it can be said that there are two phases in this process:
QoS guarantee during service setup
QoS guarantee after service setup
Guaranteeing QoS during Service Setup
The functions to be performed for guaranteeing QoS during service setup are
channel type selection and admission control.
When a service setup request is initiated, the RB function selects an appropriate
channel type such as R99 or HSPA channel according to service attributes such as the
traffic class and MBR. The R99 channel can provide an MBR of 384 kbps, requiring
dedicated radio resources. In comparison, the HSPA channel can provide an MBR of 28.8
Mbps (3GPP Release 7) and even higher, according to technology development. The
HSPA channel resources, though, can be shared and, therefore, the service rate may
vary with the channel environment and the user priority. As a result, selecting an
appropriate channel type based on the service attributes is an important step for
guaranteeing QoS.
Once the channel type is determined, an appropriate cell needs to be selected to
provide services. The admission control of each cell prevents the cell from being
overloaded due to the admission of too many users. This function monitors the cell load,
predicts the load increase after a new service is admitted and determines whether the
admission will lead to an overload state. Admission control ensures the QoS of admitted
services and the QoS of the new service after it is admitted. If a new user is rejected
because the cell is overloaded, the new user will attempt to access another cell with the
same coverage.
Guaranteeing QoS after Service Setup
The functions to be performed for QoS guarantee after service setup are as
follows:
Overview of UMTS network evolution through radio and transmission feature validation Jorge Rafael Sevilla Castillo
94
Power control: After service setup, power control enables the user data to be
transmitted with the appropriate power. It ensures correct data reception and at
the same time avoids a bad usage of power resource.
Mobility management: When the user moves to the cell edge, the QoS may
degrade due to radio conditions. The handover function can direct the user to a
more suitable cell in time to ensure the service continuity.
Rate Control: If the service is set up on the DCH, the RNC can detect whether the
transmit power for this user is limited in the uplink or downlink. If the transmit
power is limited, the data transmission capability may be affected and call drop
may occur. To ensure the QoS in this case, the system reduces the service rate or
performs an inter-frequency or inter-RAT handover to select a more suitable cell.
HSDPA resource management: If the service is set up on the HSPA channel, the
HSPA scheduling function ensures that the user is able to obtain the basic QoS.
For example, for a delay-sensitive service, this function ensures that the packet
transmission delay is within an acceptable range; for a throughput-sensitive
service, this function ensures that the rates provided are not lower than the
GBR.
User experience improvement: If the service is set up on the HSPA channel, the
HSPA scheduling function ensures that the user is able to obtain the basic QoS.
For example, for a delay-sensitive service, this function ensures that the packet
transmission delay is within an acceptable range; for a throughput-sensitive
service, this function ensures that the rates provided are not lower than the
GBR.
- For the voice, the de-jitter function can be applied in IP transport.
When the IuB/Iur interface uses the IP mode, data packets may not
be transmitted in sequence. In this case, the de-jitter function can
restore the data transmission order and limit the transmission delay
within an acceptable range.
- For the TCP service, the RNC may have features such as TCP
Performance Enhancer (TPE) and Active Queue Management (AQM)
to improve QoS. TPE aims at a service with only one TCP connection
and increases the data transmission rate at the TCP layer. AQM aims
Overview of UMTS network evolution through radio and transmission feature validation Jorge Rafael Sevilla Castillo
95
at a service with multiple TCP connections and improves the QoS of
the TCP connections with a small amount of data.
How can be different services provided amongst different users?
The objective of DiffServ is to serve as many users as possible with limited
resources; hence meeting the requirements of more users.
DiffServ Provision Principles
The DiffServ provision principles are as follows:
Providing DiffServ for users with different priorities, with high-priority users
being served preferentially.
Providing DiffServ for services with different traffic classes:
- A CS service has a higher priority than a PS service
- Within PS services, delay-sensitive services have higher priorities than
throughput-sensitive services.
- Emergency services are always provided preferentially.
As seen before, the provision of DiffServ requires the mapping of the following
parameters:
User Priority: Different users have different priorities. The ARPs sent from the CN
indicate the subscribed priorities. Based on the ARPs, users are classified into 15
priorities. In the UTRAN, users are classified into three priorities, namely gold, silver,
and copper. Therefore, the user priority mapping is based on the ARP to provide
DiffServ for users in the UTRAN.
RAB integrated priority: this parameter is set on the basis of the RAB and with
reference to the traffic class, user priority, THP and bearer type. It is used for the
provision of DiffServ during Access Control (AC) and load control by RNC.
Overview of UMTS network evolution through radio and transmission feature validation Jorge Rafael Sevilla Castillo
96
SPI and SPI weight: The SPI is used to indicate the priority of each HSPA service. The
SPI weight is determined on the basis of the SPI and used to provide the HSPA
DiffServ.
DiffServ Provision
DiffServ provision is described as follows:
DiffServ provision during service setup: During channel type selection, the
processing is based on service attributes. Generally, CS services have stable rates
and a high requirement for low delay. Therefore, they are carried on the R99
channel to use dedicated radio resources and to obtain required bandwidths. In
comparison, PS services usually have a huge amount of data to transmit in burst
mode. Therefore, they are carried on the HSPA channel to improve the resource
sharing degree and to ensure the basic QoS.
During admission control, the provision of DiffServ is based on traffic
classes. Compared with PS services, high-priority CS services such as the AMR
voice service have lower admission limits and higher access success rates.
If the service admission fails, a service with a higher integrated priority
can preempt the resources of a service with a lower integrated priority to
increase the access success rate. Whether the integrated priority considers the
traffic class first or the user priority first can be determined by the telecom
operator. Generally, it is recommended that the traffic class be considered first.
Therefore, CS services can have higher integrated priorities than PS services and
can preempt the resources of PS services. In this way, the access probability can
be increased and the overall user satisfaction can be improved.
During admission control, emergency services are assigned the highest
priority and therefore they have the highest access success rate.
Congestion control after service setup: If the system enters the basic congestion
state, there are two methods for ensuring the system stability. One is to
decrease the rates of admitted users by reserving resources for new services.
The other is to reduce the cell load by performing operations such as handover.
If the system enters the overload state, it terminates the services of some users
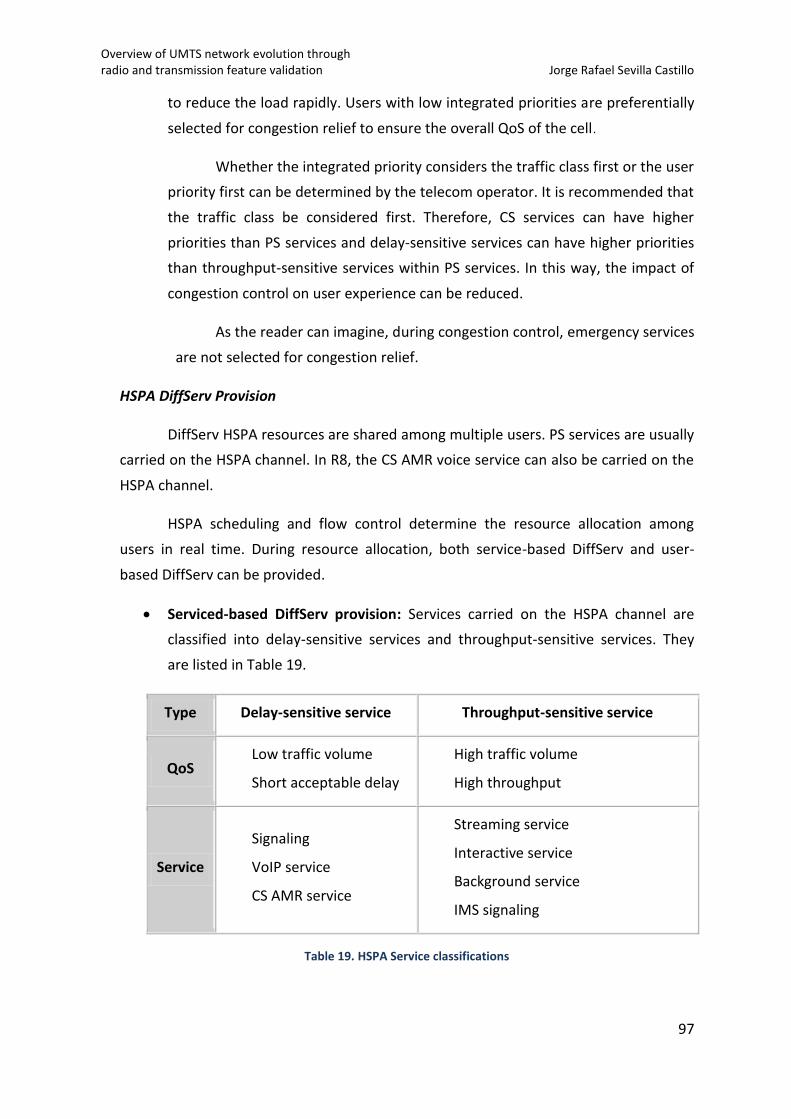
Overview of UMTS network evolution through radio and transmission feature validation Jorge Rafael Sevilla Castillo
97
to reduce the load rapidly. Users with low integrated priorities are preferentially
selected for congestion relief to ensure the overall QoS of the cell.
Whether the integrated priority considers the traffic class first or the user
priority first can be determined by the telecom operator. It is recommended that
the traffic class be considered first. Therefore, CS services can have higher
priorities than PS services and delay-sensitive services can have higher priorities
than throughput-sensitive services within PS services. In this way, the impact of
congestion control on user experience can be reduced.
As the reader can imagine, during congestion control, emergency services
are not selected for congestion relief.
HSPA DiffServ Provision
DiffServ HSPA resources are shared among multiple users. PS services are usually
carried on the HSPA channel. In R8, the CS AMR voice service can also be carried on the
HSPA channel.
HSPA scheduling and flow control determine the resource allocation among
users in real time. During resource allocation, both service-based DiffServ and user-
based DiffServ can be provided.
Serviced-based DiffServ provision: Services carried on the HSPA channel are
classified into delay-sensitive services and throughput-sensitive services. They
are listed in Table 19.
Type Delay-sensitive service Throughput-sensitive service
QoS Low traffic volume
Short acceptable delay
High traffic volume
High throughput
Service
Signaling
VoIP service
CS AMR service
Streaming service
Interactive service
Background service
IMS signaling
Table 19. HSPA Service classifications
Overview of UMTS network evolution through radio and transmission feature validation Jorge Rafael Sevilla Castillo
98
For different services, different QoS is provided. For example, for a delay-
sensitive service, the scheduling function limits the packet transmission delay
within an acceptable range; for a throughput-sensitive service, this function
ensures that provided rates are not lower than the GBR. Users are more
sensitive to the QoS of delay-sensitive services. Therefore, the requirement for
this kind of QoS is met first during scheduling.
3GPP TS 23.107 defines only four traffic classes, which cannot fully reflect
the requirements for QoS. For example, a Web page may contain video streams
in addition to texts and pictures. All of email, video website browsing, and Bit
Torrent (BT) download may be mapped to the background class, but they have
different QoS requirements. After service setup, the RNC can further identify
and classify the traffic classes and attributes and then provide appropriate QoS
to improve user experience.
User-based DiffServ provision: User-based DiffServ is mainly aimed at throughput-sensitive services. The provision is described as follows:
- The CN does not set the GBRs for the interactive class and background
class. The RNC, however, can set the GBRs based on user priorities. The
HSPA scheduling function ensures that users with different priorities
obtain different GBRs.
- The RNC can also set Happy Bit Rate (HBR) which determines the
throughput expected by the user based on a study on user experience.
When the rate for a user reaches the HBR, the scheduler decreases the
scheduling probability for the user.
- The SPI weight is set on the basis of the SPI and user rate range, and the
SPI considers both the user priority and the traffic class. The SPI weight is
always used in throughput-sensitive services. Users with higher SPI
weights have more chances to obtain required resources and satisfied
user experience.
Now the reader is in a position to understand the following test case, based on a
lab test simulation of HSPA Scheduling feature and the QoS guarantee when the scarce
resource is found at transmission level (air interface congestion was harder to be
simulated due to a limitation in the number of UEs).
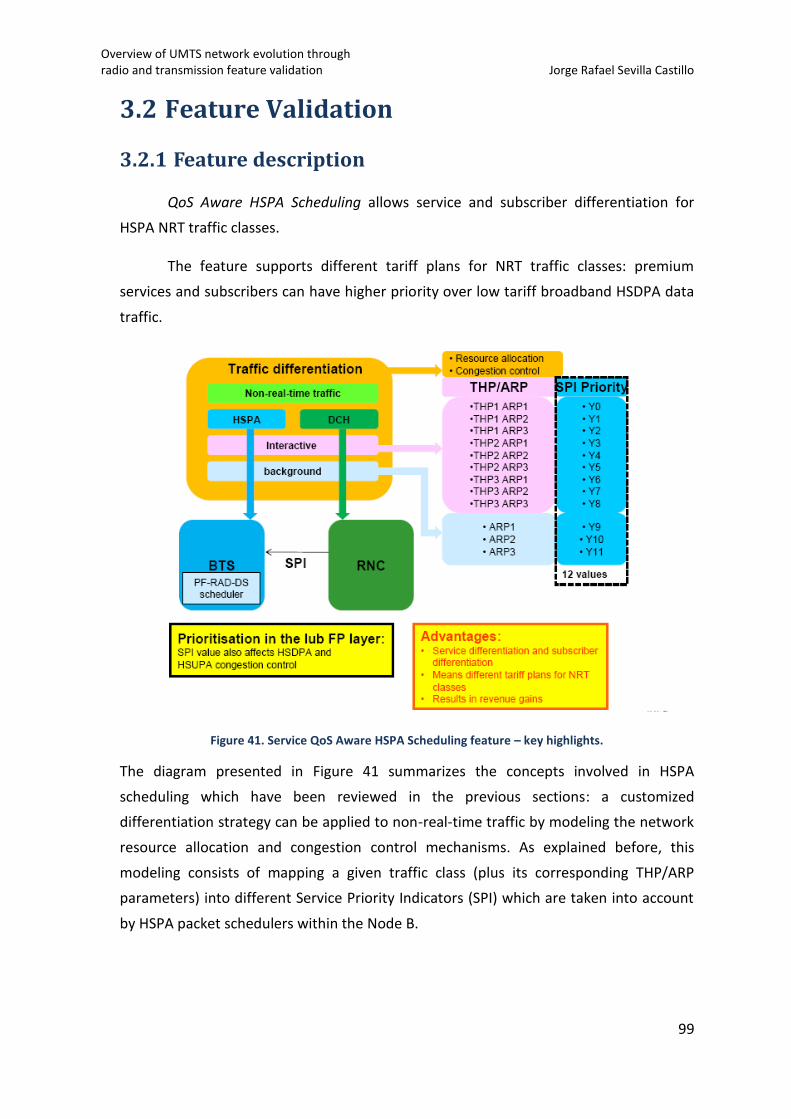
Overview of UMTS network evolution through radio and transmission feature validation Jorge Rafael Sevilla Castillo
99
3.2 Feature Validation
3.2.1 Feature description
QoS Aware HSPA Scheduling allows service and subscriber differentiation for
HSPA NRT traffic classes.
The feature supports different tariff plans for NRT traffic classes: premium
services and subscribers can have higher priority over low tariff broadband HSDPA data
traffic.
Figure 41. Service QoS Aware HSPA Scheduling feature – key highlights.
The diagram presented in Figure 41 summarizes the concepts involved in HSPA
scheduling which have been reviewed in the previous sections: a customized
differentiation strategy can be applied to non-real-time traffic by modeling the network
resource allocation and congestion control mechanisms. As explained before, this
modeling consists of mapping a given traffic class (plus its corresponding THP/ARP
parameters) into different Service Priority Indicators (SPI) which are taken into account
by HSPA packet schedulers within the Node B.
Overview of UMTS network evolution through radio and transmission feature validation Jorge Rafael Sevilla Castillo
100
These schedulers weight different priority queues based on their SPI values.
There is a weight value per SPI on the Node B, which sets the magnitude for how often
queues of different SPI classes are scheduled in relation to other SPI classes. Note that in
the introduction chapter, 15 SPI values have been introduced. However, due to RAN
software limitations, the test case reflects only the mapping for 12.
Usually, HSDPA uses Proportional Fair Resource Packet Schedules (PFR).
However, to support this feature a new scheduler type is implemented: Proportional
Fair Required Activity Detection with Delay Sensitivity (PF-RAD-DS), which will be
explained hereunder.
PFR vs. PF-RAD-DS
The Proportional Fair Resource (PFR) algorithm utilizes the radio channel state
information from the UEs in its scheduling decisions. The PFR principle is to maximize
the relative instantaneous channel quality (ratio of instantaneous throughput to average
throughput) for scheduling in the following 2ms TTI. The relative instantaneous channel
quality is calculated every 2 ms TTI using the Channel Quality Indicator (CQI) information
reported by the UE and the information from previous transmissions.
Scheduling metric for each UE is calculated every TTI as follows:
Scheduling metric = TPinst / TPmean
where TPinst is the predicted throughput of priority queue for the TTI being scheduled
and TPmean is the mean throughput of the priority queue in the past. TPmean is decreased
when priority queue is not scheduled and increased otherwise. It is calculated over 100
TTIs if nothing prevented the scheduling of the priority queue.
With this method a user is prioritized if it has good instantaneous conditions
compared to the average level or has been served with little throughput in the past.
At each scheduling interval of 2ms, Packet Scheduler selects the user which has
the best scheduling metric among users that can be scheduled in the next TTI.
On the other hand, PF-RAD-DS modifies the scheduling metric of the actual PFR
scheduler by scaling it according to the QoS parameters. As it has been explained
before, these QoS parameters are shared between Node B and RNC.
Overview of UMTS network evolution through radio and transmission feature validation Jorge Rafael Sevilla Castillo
101
The QoS parameters communicated between RNC and Node B via NBAP
message in order to setup the queue priority are Guaranteed Bit Rate (GBR) or Nominal
Bit Rate (NBR), Scheduling Priority Indicator (SPI) and Discard Timer (DT).
The QoS parameters managed exclusively by the WBTS are the Scheduling
Weight and the Congestion Control for each SPI.
Scheduling Priority Indicator and Scheduling Weights
The operator can prioritize the traffic of different characteristics by configuring a
mapping from RAB parameters (Traffic Class, Traffic Handling Priority, Allocation
Retention Priority) into SPI values to the RNC.
The Node B uses the SPI value (range 0…15) to select which Scheduling Weight
(range 0…100) to apply for each priority queue and to control which users are served in
resource limited situation. Higher priority users are served first. The weights are used to
control how often priority queues of different priorities are scheduled in relation to
each other. Proportion is defined with factor:
where SchWeight (SPIN) is the weight of class N and ∑SchWeight (SPIDATA) is the sum of
weights from queues with data.
For example, if background class is mapped to SPI 0 and given weight 1 and
interactive class is mapped to SPI 1 and given weight 2, then the SPI class 1 is scheduled
twice as often as SPI class 0. Note that the scheduling rate depends also on the PFR
metric, terminal capabilities and available data amount in priority queues.
Discard Timer
The DT defines the maximum time a MAC-d PDU of streaming traffic class is
allowed to stay in Node B buffer before being scheduled or discarded. Node B uses the
value to improve the scheduling metric of a priority queue as the expiration time for the
packet approaches, eventually forcing the queue to be scheduled.
Since streaming traffic class is still not present in the network, DT will be an
irrelevant parameter for the test.
Overview of UMTS network evolution through radio and transmission feature validation Jorge Rafael Sevilla Castillo
102
Guaranteed Bit Rate, Nominal Bit Rate and Congestion Control policy
Node B uses GBR to ensure that priority queue is scheduled at least as often as it
is needed to fulfill the GBR requirement. Scheduling rate of GBR/NBR queues is
determined according to their required scheduling activity:
where GBR is in bits per 2 ms TTI and Tsch is the average transport block size of the
priority queue.
For example, in the situation of:
- HS-PDSCH codes in a cell
- 1 User scheduled per TTI
- UE category 6 (maximum amount of bits per TTI is 7298 bits)
- Guaranteed Bit Rate of 384 kbps (768 bits per 2ms TTI)
in optimal radio conditions UE needs to be scheduled 384000/7298 = 52.6 TTIs.
If the cell has capacity left after GBR and NBR queues, the scheduler allocates the
remaining capacity to all priority queues with data in buffers. This means that the
activity is:
The SPI classes with GBR need only a small weight, because the actual GBR
parameter is used to calculate the needed scheduling rate of the priority queue. Any
non-zero weights allocate additional capacity on top of GBR. This way, remaining
capacity is distributed to other users.
GBR and NBR are configured in Node B by using the same information element
present in the NBAP message received from the RNC, so they are treated similarly in the
scheduler. The difference is that NBRs always have lower SPI than GBRs so the overload
handling fulfils the NBRs only when GBRs do not use all available capacity.
The congestion control policy parameter can be used to define the treatment of
each SPI class in case of IuB congestion.
Overview of UMTS network evolution through radio and transmission feature validation Jorge Rafael Sevilla Castillo
103
Air interface overload control and prioritization
Admission Control in the RNC ensures that no more GBR queues are admitted
into a cell than can be served in all available scheduling time.
However, after admission, a sudden increase in amount of AMR traffic can cause
reduction of the capacity available for HSDPA. For NBR queues, no admission control is
done, so the scheduling time requirement of GBR and/or NBR queues could exceed the
total available scheduling time in a cell. The radio conditions could also change so that
not all GBR and NBR queues can be served within the available scheduling time. For this
reason, Node B performs fast overload control in order to satisfy scheduling needs in SPI
order. If lower priority queues do not fit into available scheduling time, fast overload
control temporarily deprioritizes them in the scheduling.
Each TTI, the algorithm calculates a required activity factor for each priority
queue, which the priority queue needs to be scheduled in order to fulfill the possible
GBR or NBR requirement in current conditions.
The activity factor is used to control which priority queues are candidates to be
scheduled in current TTI by summing the activity factors of all queues starting from the
highest SPI class and within SPI class from queue having the lowest activity factor and
comparing it to the maximum load. The lowest one is used instead of the highest to
satisfy as many GBR queues as possible, while preventing one terminal in bad radio
conditions from blocking all the other GBR queues. Queues without GBR or NBR are
given zero activity factor and the remaining capacity is divided to those according to
Scheduling Weights after satisfying GBR and NBR queues.
The RNC maps, according to the operator settings, the SPI from the RAB QoS
parameters (TC, THP and ARP) and delivers it to the packet schedulers.
The SPI used in the RNC for resources required by the RAB is defined based on
the RAB QoS parameters. In case of HS-DSCH and Enhanced uplink DCH (E-DCH)
transport channels, the priority is also sent to the Node B as an SPI value.
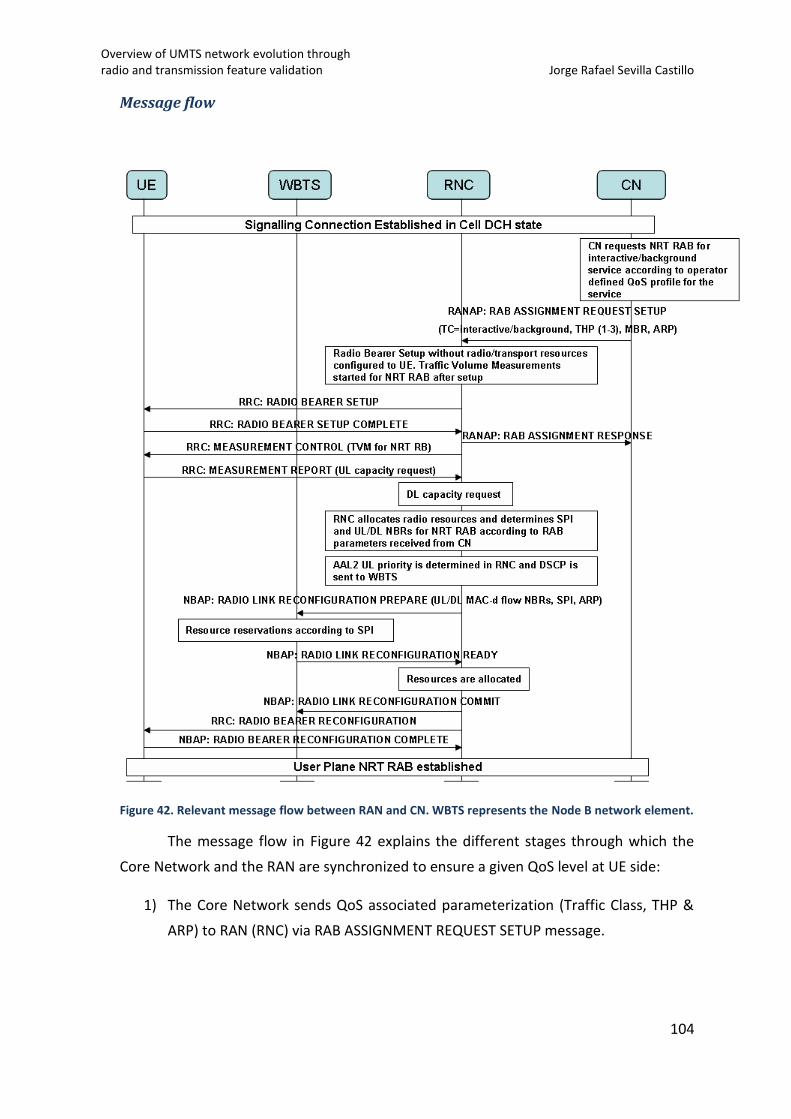
Overview of UMTS network evolution through radio and transmission feature validation Jorge Rafael Sevilla Castillo
104
Message flow
Figure 42. Relevant message flow between RAN and CN. WBTS represents the Node B network element.
The message flow in Figure 42 explains the different stages through which the
Core Network and the RAN are synchronized to ensure a given QoS level at UE side:
1) The Core Network sends QoS associated parameterization (Traffic Class, THP &
ARP) to RAN (RNC) via RAB ASSIGNMENT REQUEST SETUP message.
Overview of UMTS network evolution through radio and transmission feature validation Jorge Rafael Sevilla Castillo
105
2) The RNC establishes the Radio Bearer with the UE (associated to its Radio Access
Bearer) via RRC messaging and, once it guarantees the resource availability, the
RNC accepts the assignment requests sent from the CN.
3) Once the UE starts the data download session, according to the Traffic Volume
Measurement (TVM) reported by the UE and the transmission resource
availability, RNC will trigger the resource prioritization phase:
a. RNC communicates the SPI to WBTS within RADIO LINK
RECONFIGURATION PREPARE message. Remember that SPI value is
decided based on Traffic Class/THP/ARP mapping in RNC.
b. WBTS checks whether air interface scheduling can be made according to
SPI weight and confirms it with the RNC, which in turn, confirms the new
resource allocation (RADIO LINK RECONFIGURATION READY / RADIO LINK
RECONFIGURATION COMMIT).
c. Finally the RNC communicates the UE the new Radio Bearer
parameterization based on the new resource allocation. (RADIO BEARER
RECONFIGURATION / RADIO BEARE RECONFIGURATION COMPLETE).
3.2.2 Purpose of validation
Purpose of this test case is to verify that HSDPA QoS Aware Packet Scheduling
expected behavior is correct under different QoS priority and scheduling weight
parameterization.
Basically, four different users are given different QoS parameters in order to
achieve different kinds of traffic to be scheduled as explained in the previous section. UE
behavior will be recorded before and after the activation of the feature for a latter post-
analysis.
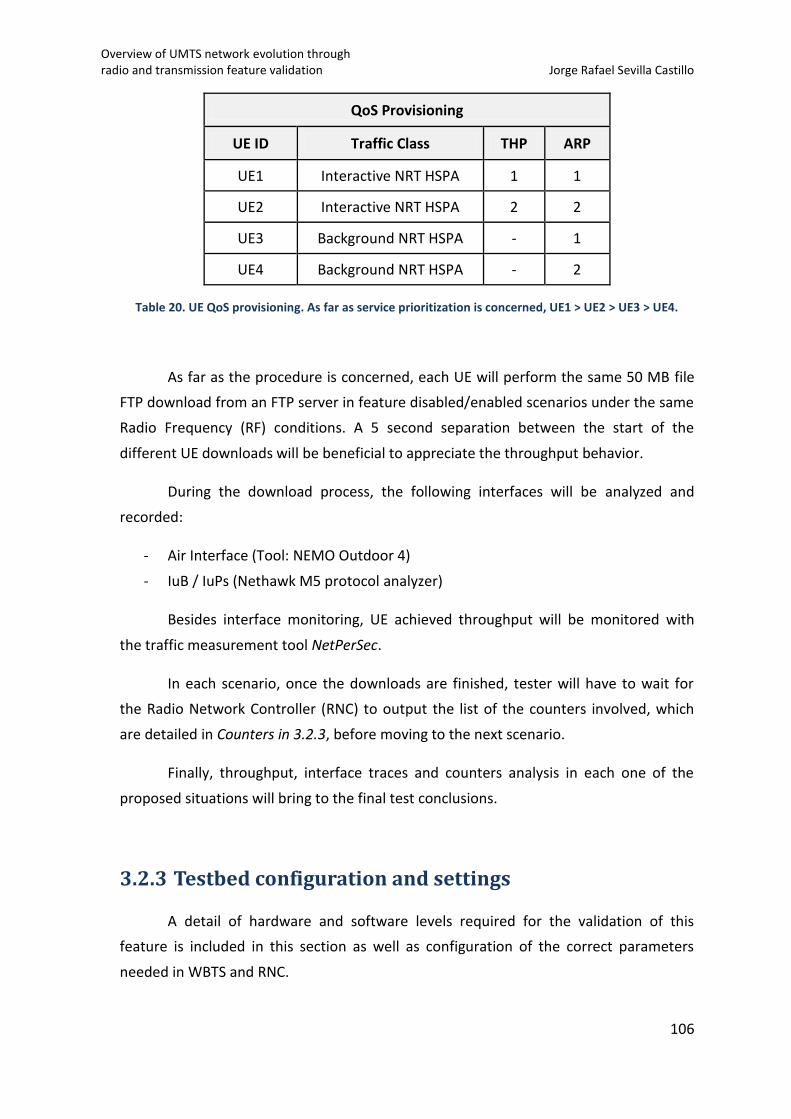
Overview of UMTS network evolution through radio and transmission feature validation Jorge Rafael Sevilla Castillo
106
QoS Provisioning
UE ID Traffic Class THP ARP
UE1 Interactive NRT HSPA 1 1
UE2 Interactive NRT HSPA 2 2
UE3 Background NRT HSPA - 1
UE4 Background NRT HSPA - 2
Table 20. UE QoS provisioning. As far as service prioritization is concerned, UE1 > UE2 > UE3 > UE4.
As far as the procedure is concerned, each UE will perform the same 50 MB file
FTP download from an FTP server in feature disabled/enabled scenarios under the same
Radio Frequency (RF) conditions. A 5 second separation between the start of the
different UE downloads will be beneficial to appreciate the throughput behavior.
During the download process, the following interfaces will be analyzed and
recorded:
- Air Interface (Tool: NEMO Outdoor 4)
- IuB / IuPs (Nethawk M5 protocol analyzer)
Besides interface monitoring, UE achieved throughput will be monitored with
the traffic measurement tool NetPerSec.
In each scenario, once the downloads are finished, tester will have to wait for
the Radio Network Controller (RNC) to output the list of the counters involved, which
are detailed in Counters in 3.2.3, before moving to the next scenario.
Finally, throughput, interface traces and counters analysis in each one of the
proposed situations will bring to the final test conclusions.
3.2.3 Testbed configuration and settings
A detail of hardware and software levels required for the validation of this
feature is included in this section as well as configuration of the correct parameters
needed in WBTS and RNC.
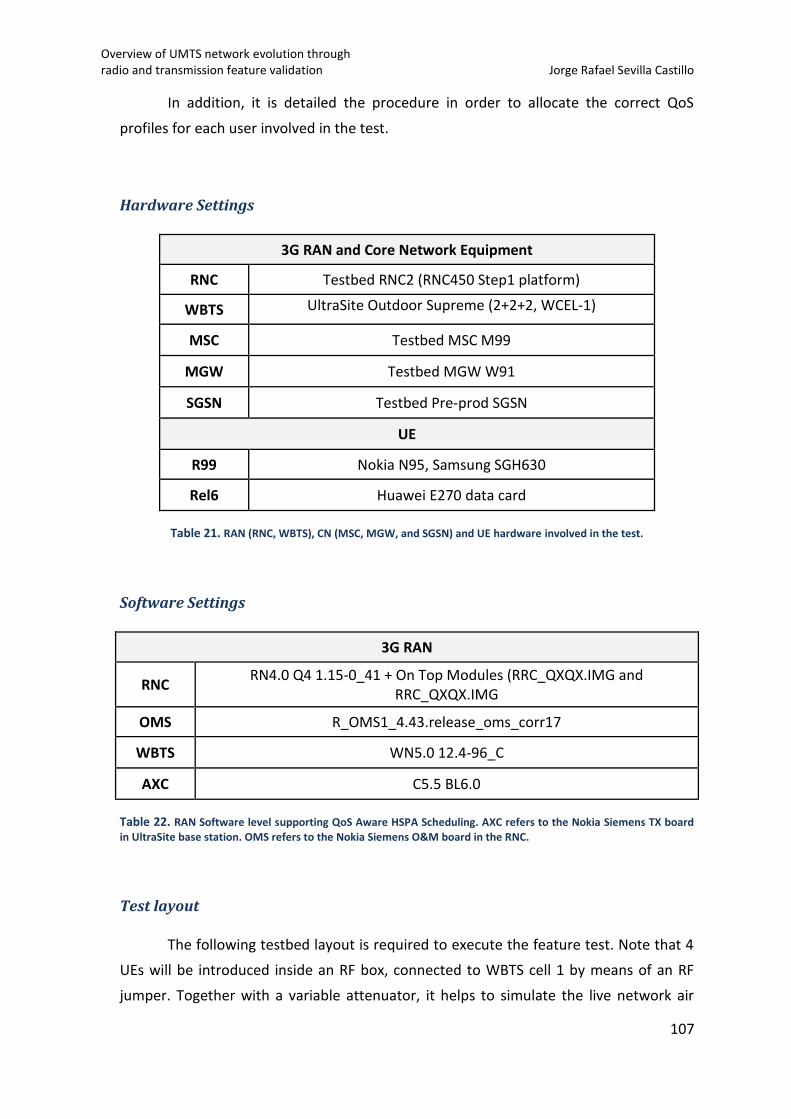
Overview of UMTS network evolution through radio and transmission feature validation Jorge Rafael Sevilla Castillo
107
In addition, it is detailed the procedure in order to allocate the correct QoS
profiles for each user involved in the test.
Hardware Settings
3G RAN and Core Network Equipment
RNC Testbed RNC2 (RNC450 Step1 platform)
WBTS UltraSite Outdoor Supreme (2+2+2, WCEL-1)
MSC Testbed MSC M99
MGW Testbed MGW W91
SGSN Testbed Pre-prod SGSN
UE
R99 Nokia N95, Samsung SGH630
Rel6 Huawei E270 data card
Table 21. RAN (RNC, WBTS), CN (MSC, MGW, and SGSN) and UE hardware involved in the test.
Software Settings
3G RAN
RNC RN4.0 Q4 1.15-0_41 + On Top Modules (RRC_QXQX.IMG and
RRC_QXQX.IMG
OMS R_OMS1_4.43.release_oms_corr17
WBTS WN5.0 12.4-96_C
AXC C5.5 BL6.0
Table 22. RAN Software level supporting QoS Aware HSPA Scheduling. AXC refers to the Nokia Siemens TX board in UltraSite base station. OMS refers to the Nokia Siemens O&M board in the RNC.
Test layout
The following testbed layout is required to execute the feature test. Note that 4
UEs will be introduced inside an RF box, connected to WBTS cell 1 by means of an RF
jumper. Together with a variable attenuator, it helps to simulate the live network air
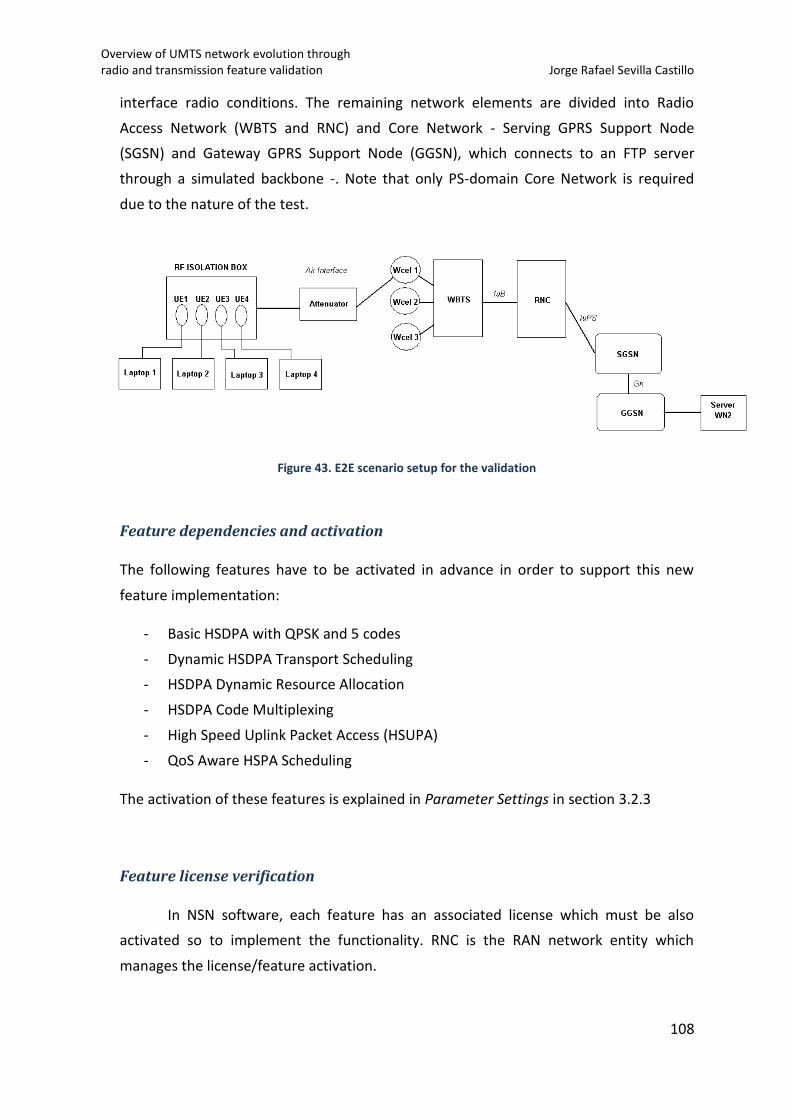
Overview of UMTS network evolution through radio and transmission feature validation Jorge Rafael Sevilla Castillo
108
interface radio conditions. The remaining network elements are divided into Radio
Access Network (WBTS and RNC) and Core Network - Serving GPRS Support Node
(SGSN) and Gateway GPRS Support Node (GGSN), which connects to an FTP server
through a simulated backbone -. Note that only PS-domain Core Network is required
due to the nature of the test.
Figure 43. E2E scenario setup for the validation
Feature dependencies and activation
The following features have to be activated in advance in order to support this new
feature implementation:
- Basic HSDPA with QPSK and 5 codes
- Dynamic HSDPA Transport Scheduling
- HSDPA Dynamic Resource Allocation
- HSDPA Code Multiplexing
- High Speed Uplink Packet Access (HSUPA)
- QoS Aware HSPA Scheduling
The activation of these features is explained in Parameter Settings in section 3.2.3
Feature license verification
In NSN software, each feature has an associated license which must be also
activated so to implement the functionality. RNC is the RAN network entity which
manages the license/feature activation.
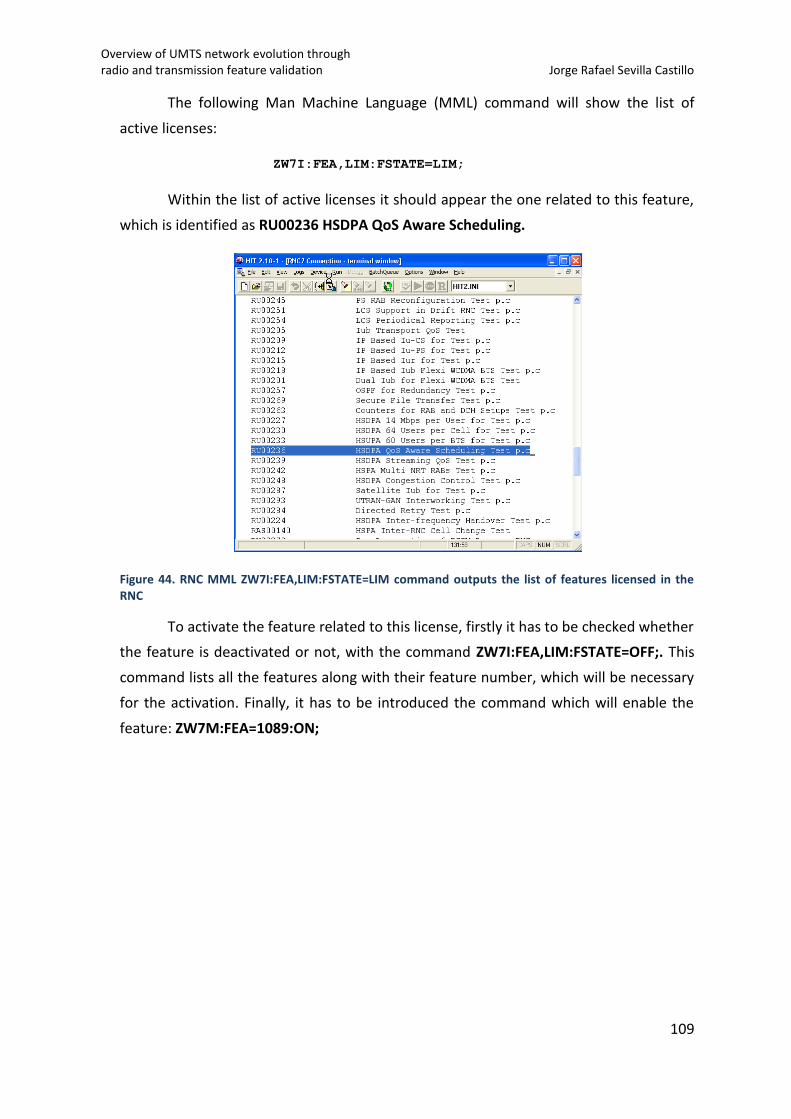
Overview of UMTS network evolution through radio and transmission feature validation Jorge Rafael Sevilla Castillo
109
The following Man Machine Language (MML) command will show the list of
active licenses:
ZW7I:FEA,LIM:FSTATE=LIM;
Within the list of active licenses it should appear the one related to this feature,
which is identified as RU00236 HSDPA QoS Aware Scheduling.
Figure 44. RNC MML ZW7I:FEA,LIM:FSTATE=LIM command outputs the list of features licensed in the RNC
To activate the feature related to this license, firstly it has to be checked whether
the feature is deactivated or not, with the command ZW7I:FEA,LIM:FSTATE=OFF;. This
command lists all the features along with their feature number, which will be necessary
for the activation. Finally, it has to be introduced the command which will enable the
feature: ZW7M:FEA=1089:ON;
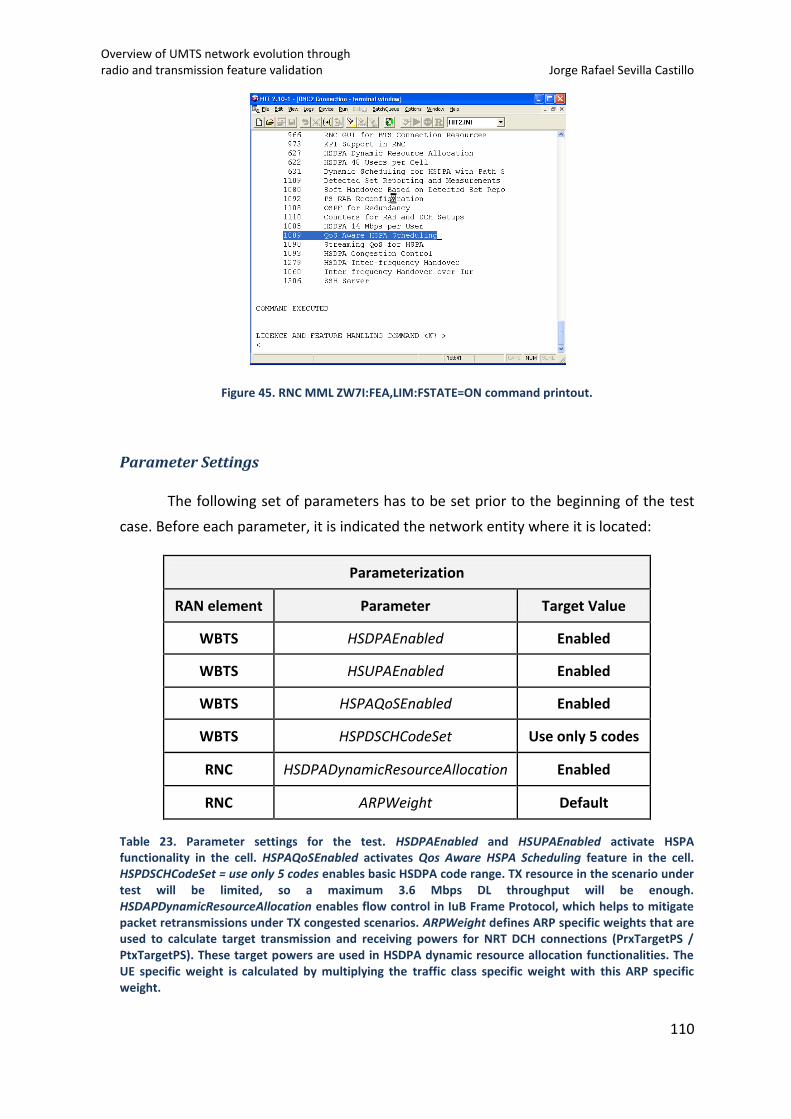
Overview of UMTS network evolution through radio and transmission feature validation Jorge Rafael Sevilla Castillo
110
Figure 45. RNC MML ZW7I:FEA,LIM:FSTATE=ON command printout.
Parameter Settings
The following set of parameters has to be set prior to the beginning of the test
case. Before each parameter, it is indicated the network entity where it is located:
Parameterization
RAN element Parameter Target Value
WBTS HSDPAEnabled Enabled
WBTS HSUPAEnabled Enabled
WBTS HSPAQoSEnabled Enabled
WBTS HSPDSCHCodeSet Use only 5 codes
RNC HSDPADynamicResourceAllocation Enabled
RNC ARPWeight Default
Table 23. Parameter settings for the test. HSDPAEnabled and HSUPAEnabled activate HSPA functionality in the cell. HSPAQoSEnabled activates Qos Aware HSPA Scheduling feature in the cell. HSPDSCHCodeSet = use only 5 codes enables basic HSDPA code range. TX resource in the scenario under test will be limited, so a maximum 3.6 Mbps DL throughput will be enough. HSDAPDynamicResourceAllocation enables flow control in IuB Frame Protocol, which helps to mitigate packet retransmissions under TX congested scenarios. ARPWeight defines ARP specific weights that are used to calculate target transmission and receiving powers for NRT DCH connections (PrxTargetPS / PtxTargetPS). These target powers are used in HSDPA dynamic resource allocation functionalities. The UE specific weight is calculated by multiplying the traffic class specific weight with this ARP specific weight.
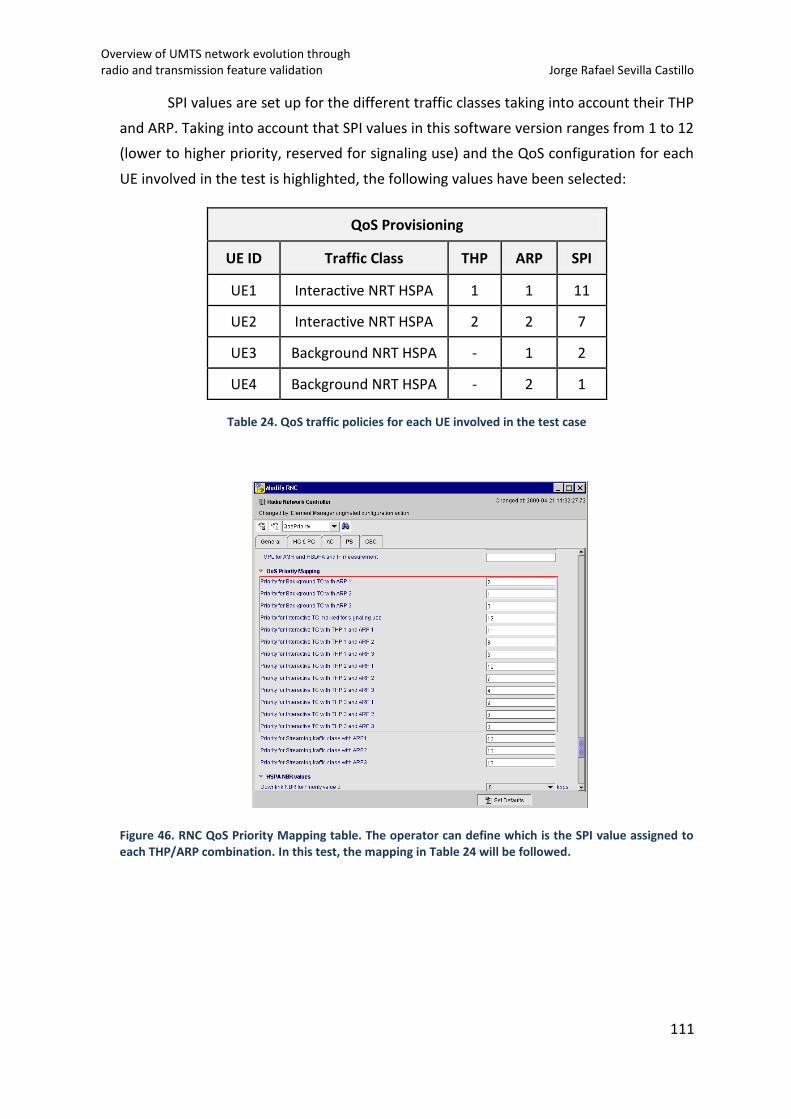
Overview of UMTS network evolution through radio and transmission feature validation Jorge Rafael Sevilla Castillo
111
SPI values are set up for the different traffic classes taking into account their THP
and ARP. Taking into account that SPI values in this software version ranges from 1 to 12
(lower to higher priority, reserved for signaling use) and the QoS configuration for each
UE involved in the test is highlighted, the following values have been selected:
QoS Provisioning
UE ID Traffic Class THP ARP SPI
UE1 Interactive NRT HSPA 1 1 11
UE2 Interactive NRT HSPA 2 2 7
UE3 Background NRT HSPA - 1 2
UE4 Background NRT HSPA - 2 1
Table 24. QoS traffic policies for each UE involved in the test case
Figure 46. RNC QoS Priority Mapping table. The operator can define which is the SPI value assigned to each THP/ARP combination. In this test, the mapping in Table 24 will be followed.
Overview of UMTS network evolution through radio and transmission feature validation Jorge Rafael Sevilla Castillo
112
HLR configuration for QoS differentiation
THP and ARP QoS parameters for UEs have to be setup in the HLR. Here is the
detailed information of the procedure and date needed to configure these new QoS
profiles, according to Table 20.
The following lines detail the procedure followed to configure the different USIM
QoS profiles for each UE.
UE1: Samsung SGH-Z630
SIM number: 8944122340012129429
SIM ID: S80397
IMSI: 234860000037656
PDP Context ID: 2 (WN2 server)
New QoS profile: Interactive NRT HSPA + THP=1 + ARP=1. The following MML command
has to be introduced in the HLR for its creation:
ZMYQ:INDEX=33,NAME=RU10TEST1:CLASS=I(interactive),ORDER=Y,DELERR=N,SDUM
AX=1500,DWNMAX=16000,UPMAX=8640,BER=7,SDUERR=5,PRIOR=1(THP);
GPRS Data: Once the QoS profile is created, the GPRS data for this particular IMSI has to
be updated with the following MML command:
ZMNM:IMSI=234860000037656::PDPID=2,ALLOC=1(ARP),QOSP=33:DISPL=Y;
UE2: Huawei E270
SIM number: 8944122340012129437
SIM ID: S80398
IMSI: 234860000037657
PDP Context ID: 2 (WN2 server)
New QoS profile: Interactive NRT HSDPA/HSPA + THP=2 + ARP=2. The following MML
command has to be introduced in the HLR for its creation:
Overview of UMTS network evolution through radio and transmission feature validation Jorge Rafael Sevilla Castillo
113
ZMYQ:INDEX=34,NAME=RU10TEST2:CLASS=I(interactive),ORDER=Y,DELERR=N,SDUM
AX=1500,DWNMAX=16000,UPMAX=8640,BER=7,SDUERR=5,PRIOR=2(THP);
GPRS Data: Once the QoS profile is created, the GPRS data for this IMSI has to be
updated with the following MML command:
ZMNM:IMSI=234860000037657::PDPID=2,ALLOC=2(ARP),QOSP=34:DISPL=Y;
UE3: Nokia N95
SIM number: 8944122340012136390
SIM ID: SIM-3
IMSI: 234860000038353
PDP Context ID: 2 (WN2 server)
New QoS profile: Background NRT HSDPA/HSPA + ARP=1. The following MML command
has to be introduced in the HLR for its creation:
ZMYQ:INDEX=35,NAME=RU10TEST2:CLASS=B(background),ORDER=Y,DELERR=N,SDUMA
X=1500,DWNMAX=16000,UPMAX=8640,BER=7,SDUERR=5;
GPRS Data: Once the QoS profile is created, the GPRS data for this IMSI has to be
updated with the following MML command:
ZMNM:IMSI=234860000038353::PDPID=2,ALLOC=1(ARP),QOSP=35:DISPL=Y;
UE4: Huawei E270
SIM number: 8944122340012129460
SIM ID: S80401
IMSI: 234860000037660
PDP Context ID: 2 (WN2 server)
New QoS profile: Background NRT HSDPA/HSPA + ARP=2. The following MML command
has to be introduced in the HLR for its creation:
Overview of UMTS network evolution through radio and transmission feature validation Jorge Rafael Sevilla Castillo
114
ZMYQ:INDEX=35,NAME=RU10TEST2:CLASS=B(background),ORDER=Y,DELERR=N,SDUMA
X=1500,DWNMAX=16000,UPMAX=8640,BER=7,SDUERR=5;
GPRS Data: Once the QoS profile is created, the GPRS data for this IMSI has to be
updated with the following MML command:
ZMNM:IMSI=234860000037660::PDPID=2,ALLOC=2(ARP),QOSP=35:DISPL=Y;
Counters
The suggested counters which will give valuable information for this test case
correspond to the counter family Cell Throughput WBTS (M5002). In particular, these
counters will be used:
- M5002C16: controls the total acknowledged data in MAC-hs PDUs for SPI 11
(UE1).
- M5002C12: controls the total acknowledged data in MAC-hs PDUs for SPI 7
(UE2).
- M5002C7: controls the total acknowledged data in MAC-hs PDUs for SPI 2 (UE3).
- M5002C6: controls the total acknowledged data in MAC-hs PDUs for SPI 1 (UE4).
3.2.4 Test Results
In this section are presented the results achieved during the validation of this
feature. Each one of the following cases is presented individually:
Behavior with feature deactivated
Behavior with feature activated
Behavior with feature deactivated
As explained in feature overview section, this situation reflects the usage of
Proportional Fair Resource scheduler in WBTS. Not for conclusions though, the results
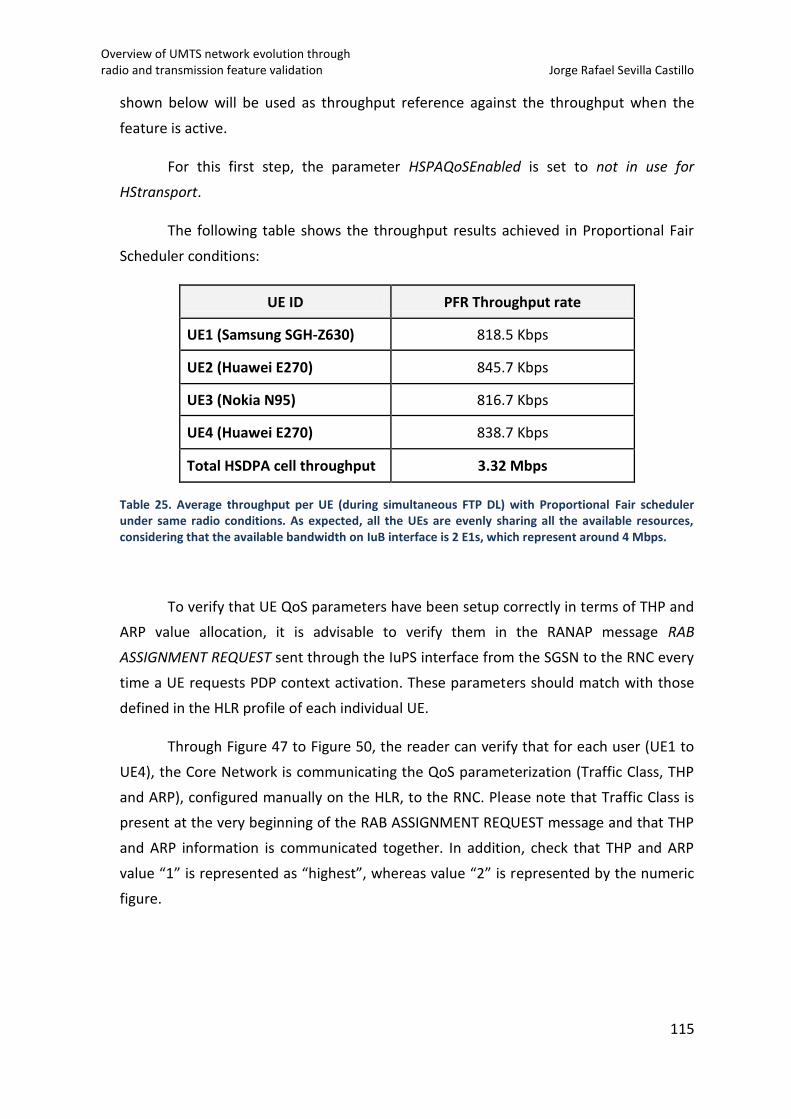
Overview of UMTS network evolution through radio and transmission feature validation Jorge Rafael Sevilla Castillo
115
shown below will be used as throughput reference against the throughput when the
feature is active.
For this first step, the parameter HSPAQoSEnabled is set to not in use for
HStransport.
The following table shows the throughput results achieved in Proportional Fair
Scheduler conditions:
UE ID PFR Throughput rate
UE1 (Samsung SGH-Z630) 818.5 Kbps
UE2 (Huawei E270) 845.7 Kbps
UE3 (Nokia N95) 816.7 Kbps
UE4 (Huawei E270) 838.7 Kbps
Total HSDPA cell throughput 3.32 Mbps
Table 25. Average throughput per UE (during simultaneous FTP DL) with Proportional Fair scheduler under same radio conditions. As expected, all the UEs are evenly sharing all the available resources, considering that the available bandwidth on IuB interface is 2 E1s, which represent around 4 Mbps.
To verify that UE QoS parameters have been setup correctly in terms of THP and
ARP value allocation, it is advisable to verify them in the RANAP message RAB
ASSIGNMENT REQUEST sent through the IuPS interface from the SGSN to the RNC every
time a UE requests PDP context activation. These parameters should match with those
defined in the HLR profile of each individual UE.
Through Figure 47 to Figure 50, the reader can verify that for each user (UE1 to
UE4), the Core Network is communicating the QoS parameterization (Traffic Class, THP
and ARP), configured manually on the HLR, to the RNC. Please note that Traffic Class is
present at the very beginning of the RAB ASSIGNMENT REQUEST message and that THP
and ARP information is communicated together. In addition, check that THP and ARP
value “1” is represented as “highest”, whereas value “2” is represented by the numeric
figure.
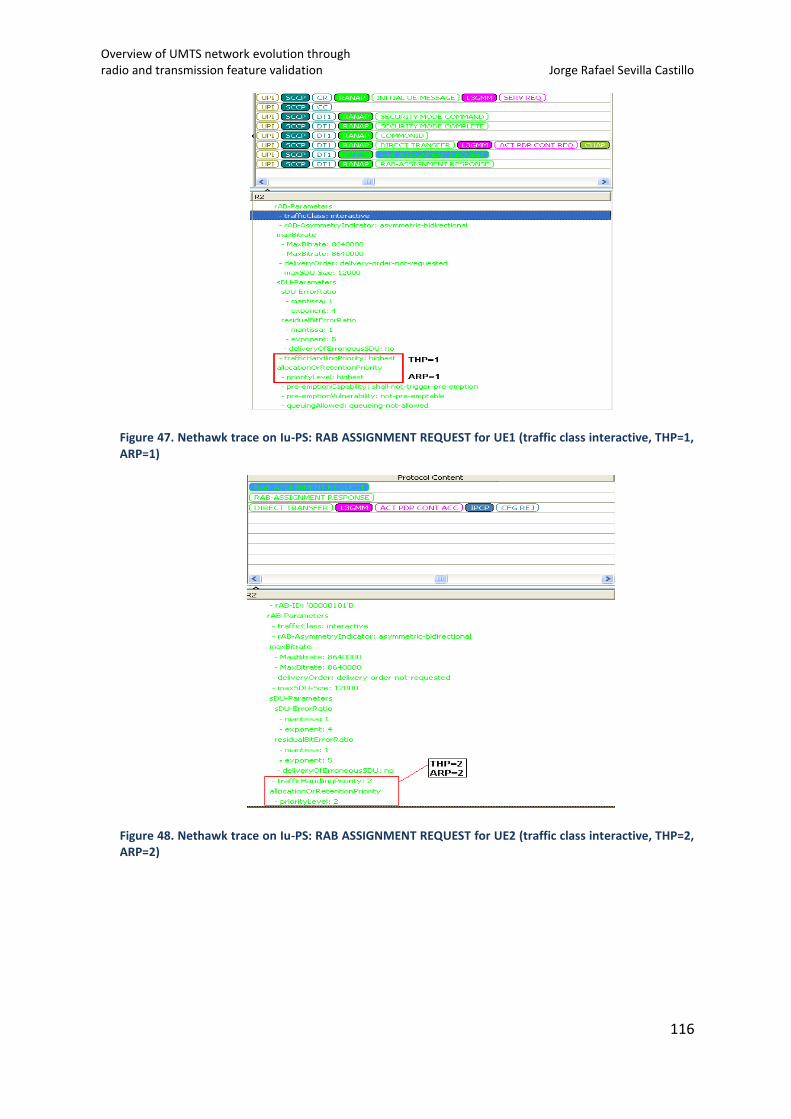
Overview of UMTS network evolution through radio and transmission feature validation Jorge Rafael Sevilla Castillo
116
Figure 47. Nethawk trace on Iu-PS: RAB ASSIGNMENT REQUEST for UE1 (traffic class interactive, THP=1, ARP=1)
Figure 48. Nethawk trace on Iu-PS: RAB ASSIGNMENT REQUEST for UE2 (traffic class interactive, THP=2, ARP=2)
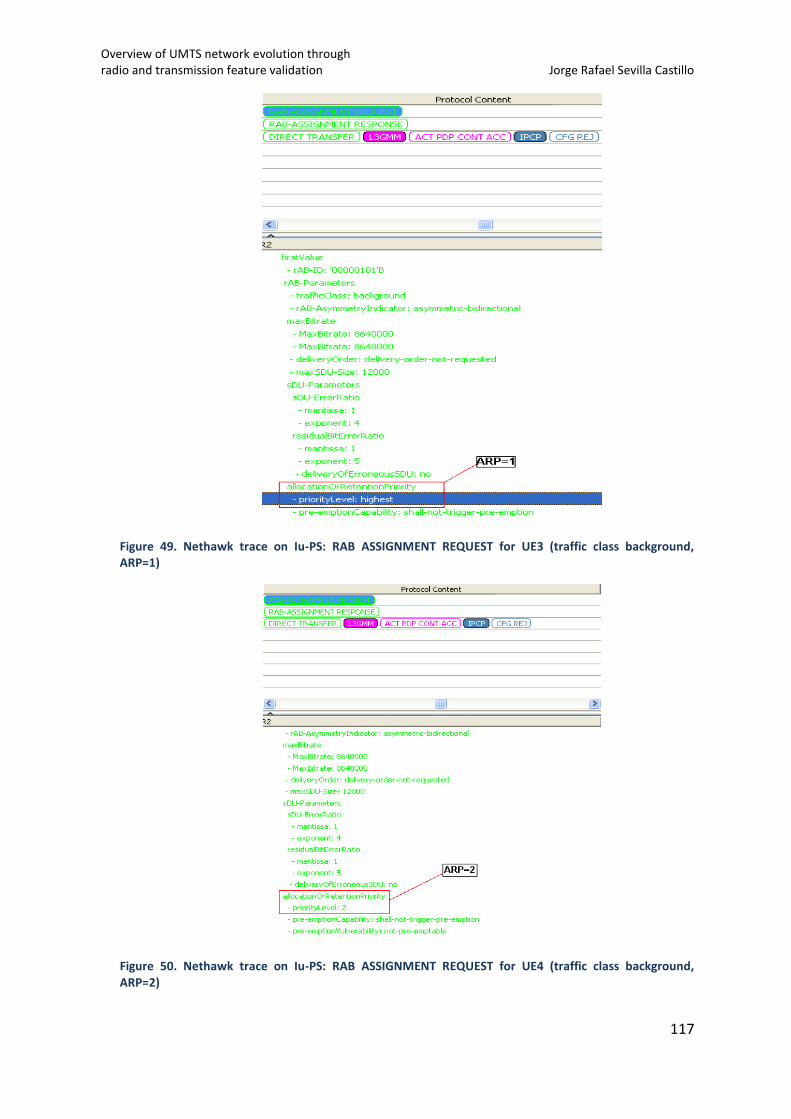
Overview of UMTS network evolution through radio and transmission feature validation Jorge Rafael Sevilla Castillo
117
Figure 49. Nethawk trace on Iu-PS: RAB ASSIGNMENT REQUEST for UE3 (traffic class background, ARP=1)
Figure 50. Nethawk trace on Iu-PS: RAB ASSIGNMENT REQUEST for UE4 (traffic class background, ARP=2)
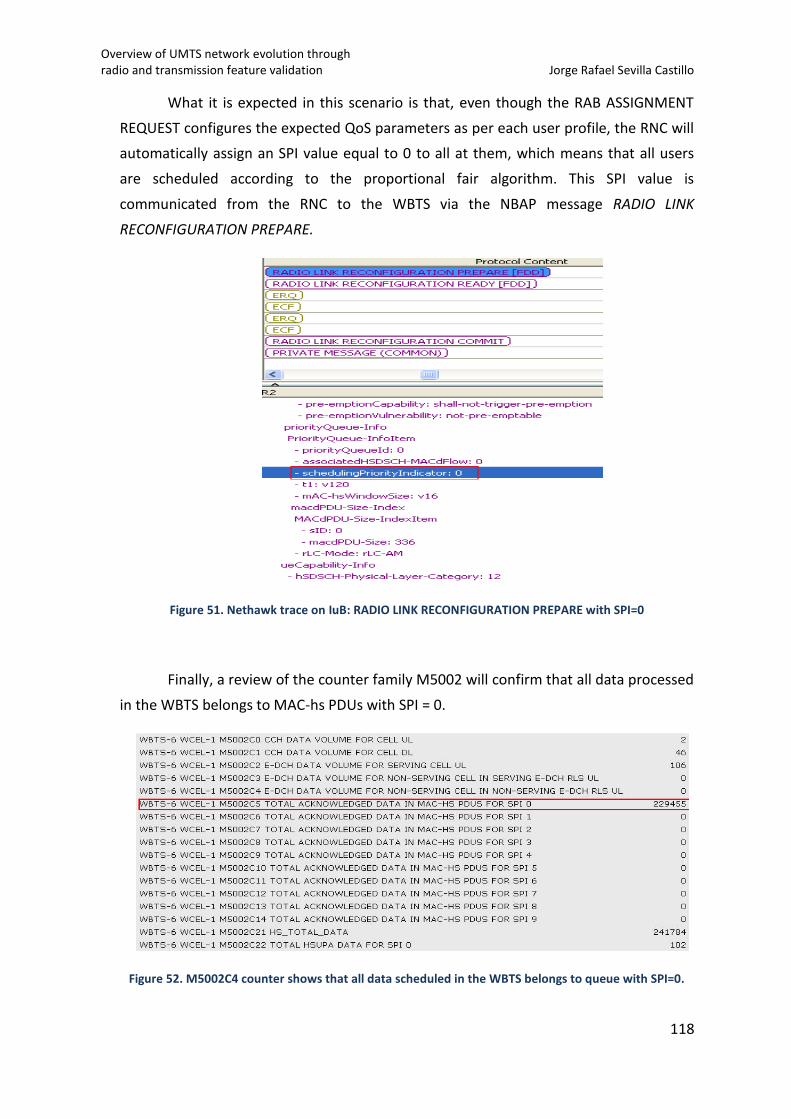
Overview of UMTS network evolution through radio and transmission feature validation Jorge Rafael Sevilla Castillo
118
What it is expected in this scenario is that, even though the RAB ASSIGNMENT
REQUEST configures the expected QoS parameters as per each user profile, the RNC will
automatically assign an SPI value equal to 0 to all at them, which means that all users
are scheduled according to the proportional fair algorithm. This SPI value is
communicated from the RNC to the WBTS via the NBAP message RADIO LINK
RECONFIGURATION PREPARE.
Figure 51. Nethawk trace on IuB: RADIO LINK RECONFIGURATION PREPARE with SPI=0
Finally, a review of the counter family M5002 will confirm that all data processed
in the WBTS belongs to MAC-hs PDUs with SPI = 0.
Figure 52. M5002C4 counter shows that all data scheduled in the WBTS belongs to queue with SPI=0.
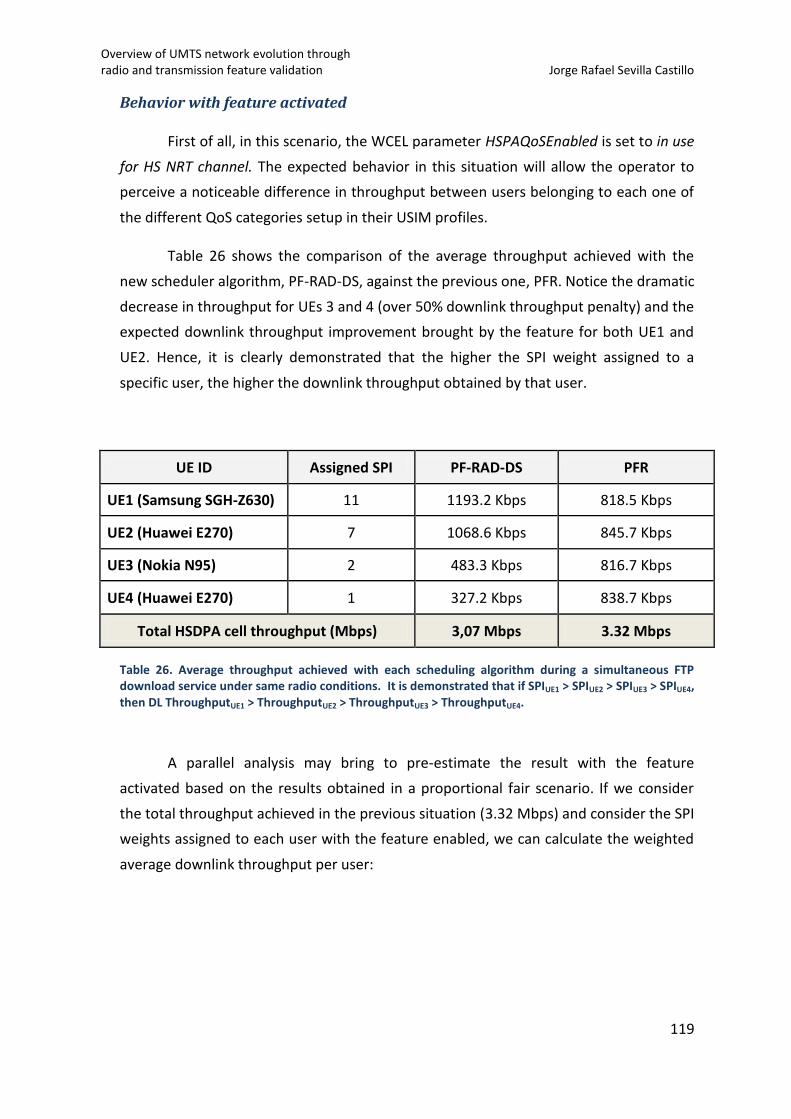
Overview of UMTS network evolution through radio and transmission feature validation Jorge Rafael Sevilla Castillo
119
Behavior with feature activated
First of all, in this scenario, the WCEL parameter HSPAQoSEnabled is set to in use
for HS NRT channel. The expected behavior in this situation will allow the operator to
perceive a noticeable difference in throughput between users belonging to each one of
the different QoS categories setup in their USIM profiles.
Table 26 shows the comparison of the average throughput achieved with the
new scheduler algorithm, PF-RAD-DS, against the previous one, PFR. Notice the dramatic
decrease in throughput for UEs 3 and 4 (over 50% downlink throughput penalty) and the
expected downlink throughput improvement brought by the feature for both UE1 and
UE2. Hence, it is clearly demonstrated that the higher the SPI weight assigned to a
specific user, the higher the downlink throughput obtained by that user.
UE ID Assigned SPI PF-RAD-DS PFR
UE1 (Samsung SGH-Z630) 11 1193.2 Kbps 818.5 Kbps
UE2 (Huawei E270) 7 1068.6 Kbps 845.7 Kbps
UE3 (Nokia N95) 2 483.3 Kbps 816.7 Kbps
UE4 (Huawei E270) 1 327.2 Kbps 838.7 Kbps
Total HSDPA cell throughput (Mbps) 3,07 Mbps 3.32 Mbps
Table 26. Average throughput achieved with each scheduling algorithm during a simultaneous FTP download service under same radio conditions. It is demonstrated that if SPIUE1 > SPIUE2 > SPIUE3 > SPIUE4, then DL ThroughputUE1 > ThroughputUE2 > ThroughputUE3 > ThroughputUE4.
A parallel analysis may bring to pre-estimate the result with the feature
activated based on the results obtained in a proportional fair scenario. If we consider
the total throughput achieved in the previous situation (3.32 Mbps) and consider the SPI
weights assigned to each user with the feature enabled, we can calculate the weighted
average downlink throughput per user:
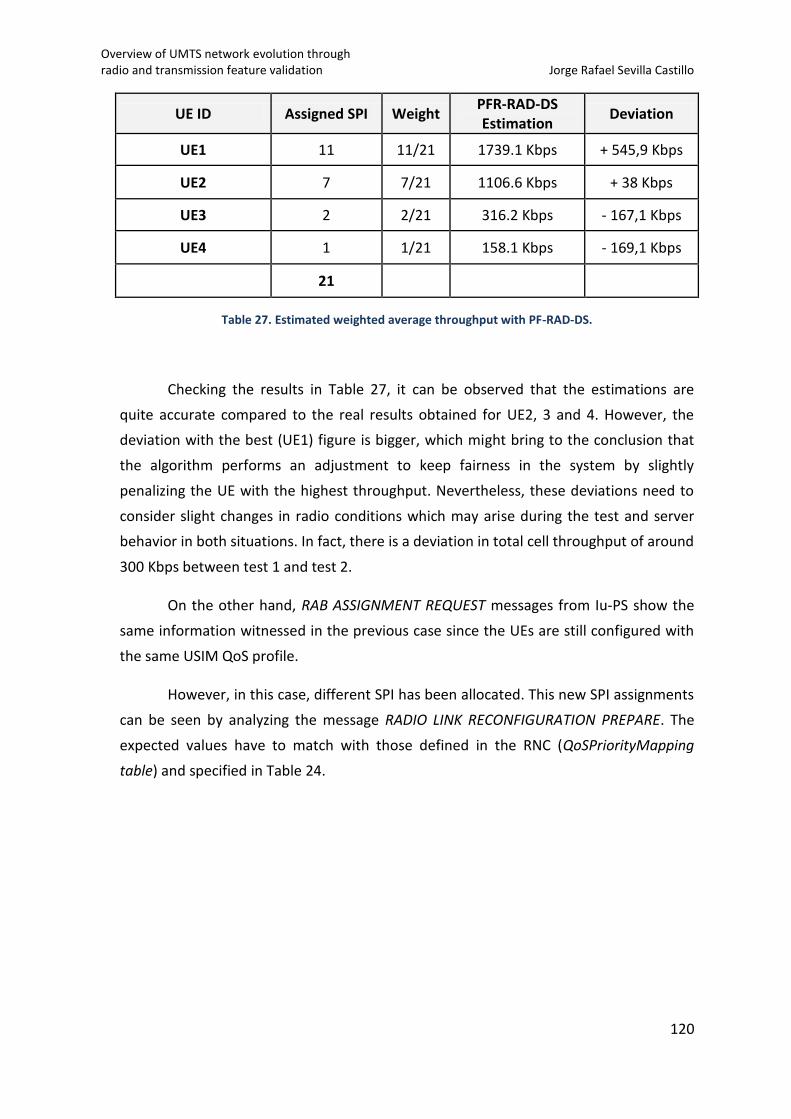
Overview of UMTS network evolution through radio and transmission feature validation Jorge Rafael Sevilla Castillo
120
UE ID Assigned SPI Weight PFR-RAD-DS Estimation
Deviation
UE1 11 11/21 1739.1 Kbps + 545,9 Kbps
UE2 7 7/21 1106.6 Kbps + 38 Kbps
UE3 2 2/21 316.2 Kbps - 167,1 Kbps
UE4 1 1/21 158.1 Kbps - 169,1 Kbps
21
Table 27. Estimated weighted average throughput with PF-RAD-DS.
Checking the results in Table 27, it can be observed that the estimations are
quite accurate compared to the real results obtained for UE2, 3 and 4. However, the
deviation with the best (UE1) figure is bigger, which might bring to the conclusion that
the algorithm performs an adjustment to keep fairness in the system by slightly
penalizing the UE with the highest throughput. Nevertheless, these deviations need to
consider slight changes in radio conditions which may arise during the test and server
behavior in both situations. In fact, there is a deviation in total cell throughput of around
300 Kbps between test 1 and test 2.
On the other hand, RAB ASSIGNMENT REQUEST messages from Iu-PS show the
same information witnessed in the previous case since the UEs are still configured with
the same USIM QoS profile.
However, in this case, different SPI has been allocated. This new SPI assignments
can be seen by analyzing the message RADIO LINK RECONFIGURATION PREPARE. The
expected values have to match with those defined in the RNC (QoSPriorityMapping
table) and specified in Table 24.
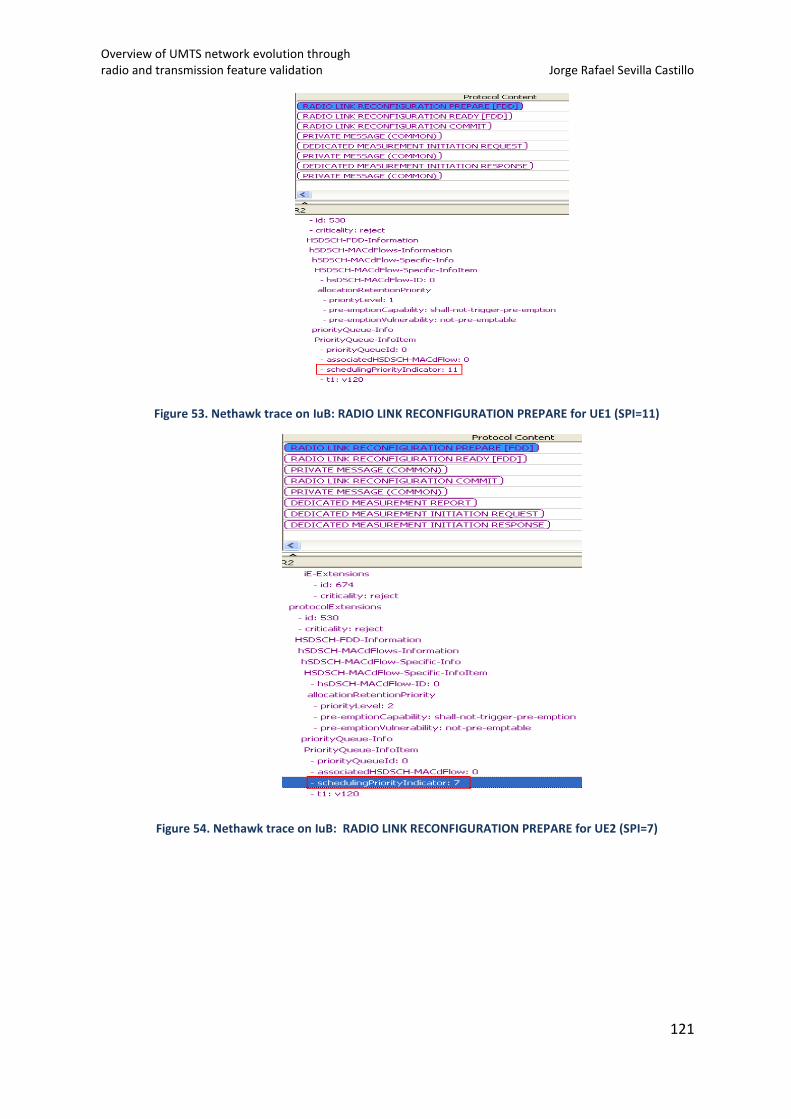
Overview of UMTS network evolution through radio and transmission feature validation Jorge Rafael Sevilla Castillo
121
Figure 53. Nethawk trace on IuB: RADIO LINK RECONFIGURATION PREPARE for UE1 (SPI=11)
Figure 54. Nethawk trace on IuB: RADIO LINK RECONFIGURATION PREPARE for UE2 (SPI=7)
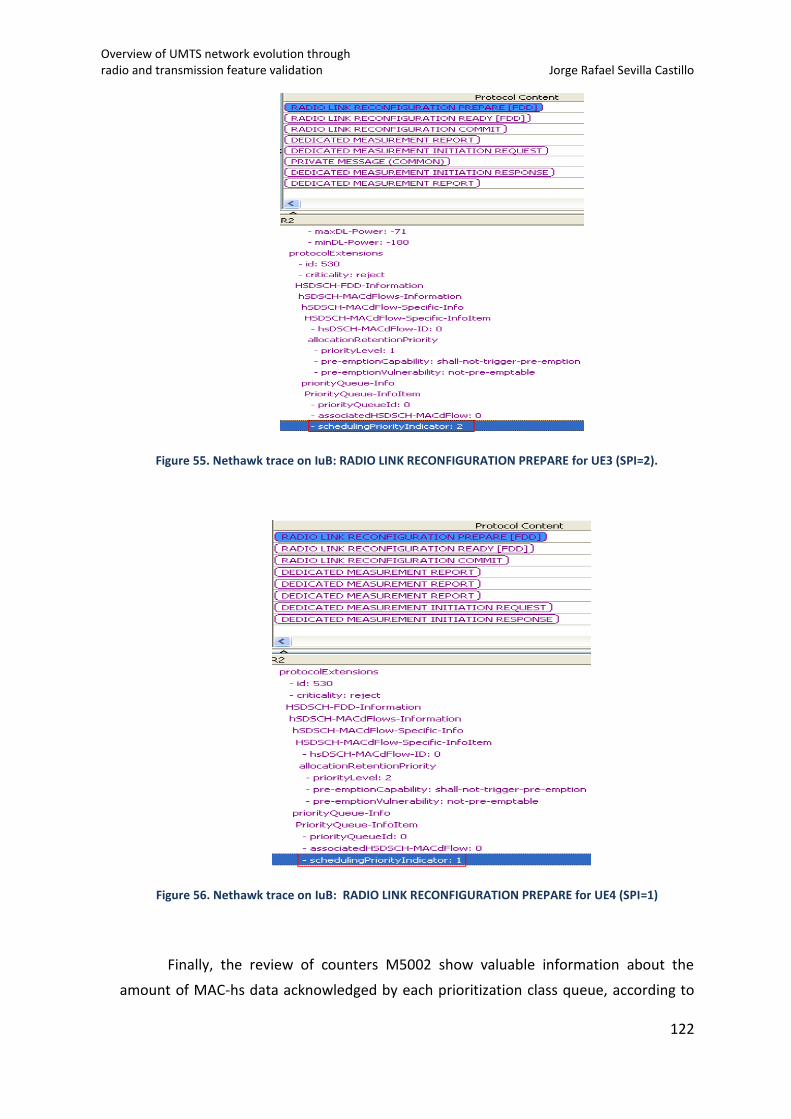
Overview of UMTS network evolution through radio and transmission feature validation Jorge Rafael Sevilla Castillo
122
Figure 55. Nethawk trace on IuB: RADIO LINK RECONFIGURATION PREPARE for UE3 (SPI=2).
Figure 56. Nethawk trace on IuB: RADIO LINK RECONFIGURATION PREPARE for UE4 (SPI=1)
Finally, the review of counters M5002 show valuable information about the
amount of MAC-hs data acknowledged by each prioritization class queue, according to
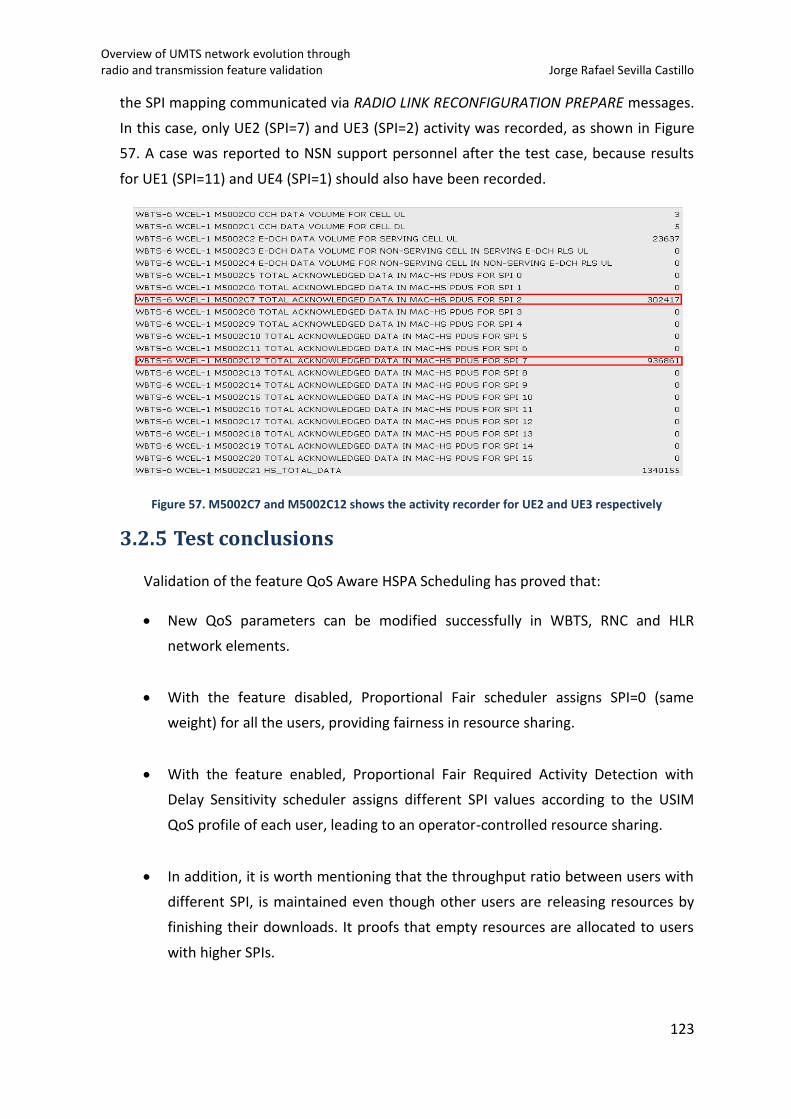
Overview of UMTS network evolution through radio and transmission feature validation Jorge Rafael Sevilla Castillo
123
the SPI mapping communicated via RADIO LINK RECONFIGURATION PREPARE messages.
In this case, only UE2 (SPI=7) and UE3 (SPI=2) activity was recorded, as shown in Figure
57. A case was reported to NSN support personnel after the test case, because results
for UE1 (SPI=11) and UE4 (SPI=1) should also have been recorded.
Figure 57. M5002C7 and M5002C12 shows the activity recorder for UE2 and UE3 respectively
3.2.5 Test conclusions
Validation of the feature QoS Aware HSPA Scheduling has proved that:
New QoS parameters can be modified successfully in WBTS, RNC and HLR
network elements.
With the feature disabled, Proportional Fair scheduler assigns SPI=0 (same
weight) for all the users, providing fairness in resource sharing.
With the feature enabled, Proportional Fair Required Activity Detection with
Delay Sensitivity scheduler assigns different SPI values according to the USIM
QoS profile of each user, leading to an operator-controlled resource sharing.
In addition, it is worth mentioning that the throughput ratio between users with
different SPI, is maintained even though other users are releasing resources by
finishing their downloads. It proofs that empty resources are allocated to users
with higher SPIs.
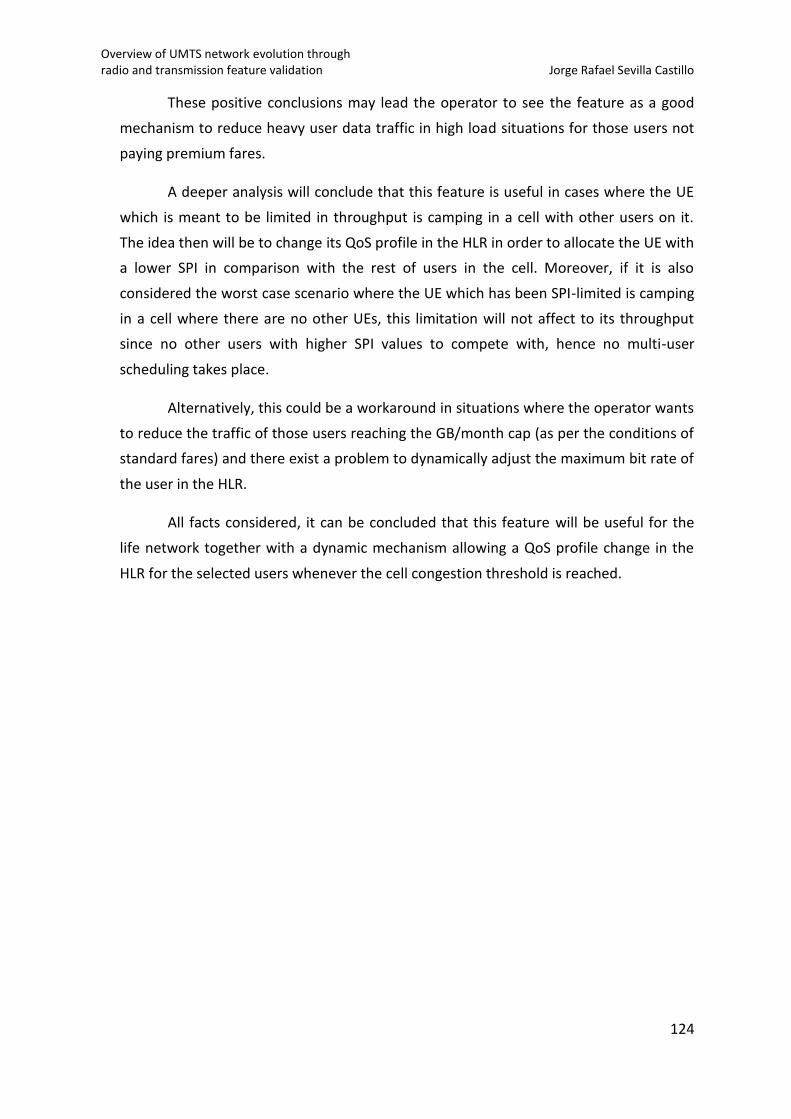
Overview of UMTS network evolution through radio and transmission feature validation Jorge Rafael Sevilla Castillo
124
These positive conclusions may lead the operator to see the feature as a good
mechanism to reduce heavy user data traffic in high load situations for those users not
paying premium fares.
A deeper analysis will conclude that this feature is useful in cases where the UE
which is meant to be limited in throughput is camping in a cell with other users on it.
The idea then will be to change its QoS profile in the HLR in order to allocate the UE with
a lower SPI in comparison with the rest of users in the cell. Moreover, if it is also
considered the worst case scenario where the UE which has been SPI-limited is camping
in a cell where there are no other UEs, this limitation will not affect to its throughput
since no other users with higher SPI values to compete with, hence no multi-user
scheduling takes place.
Alternatively, this could be a workaround in situations where the operator wants
to reduce the traffic of those users reaching the GB/month cap (as per the conditions of
standard fares) and there exist a problem to dynamically adjust the maximum bit rate of
the user in the HLR.
All facts considered, it can be concluded that this feature will be useful for the
life network together with a dynamic mechanism allowing a QoS profile change in the
HLR for the selected users whenever the cell congestion threshold is reached.
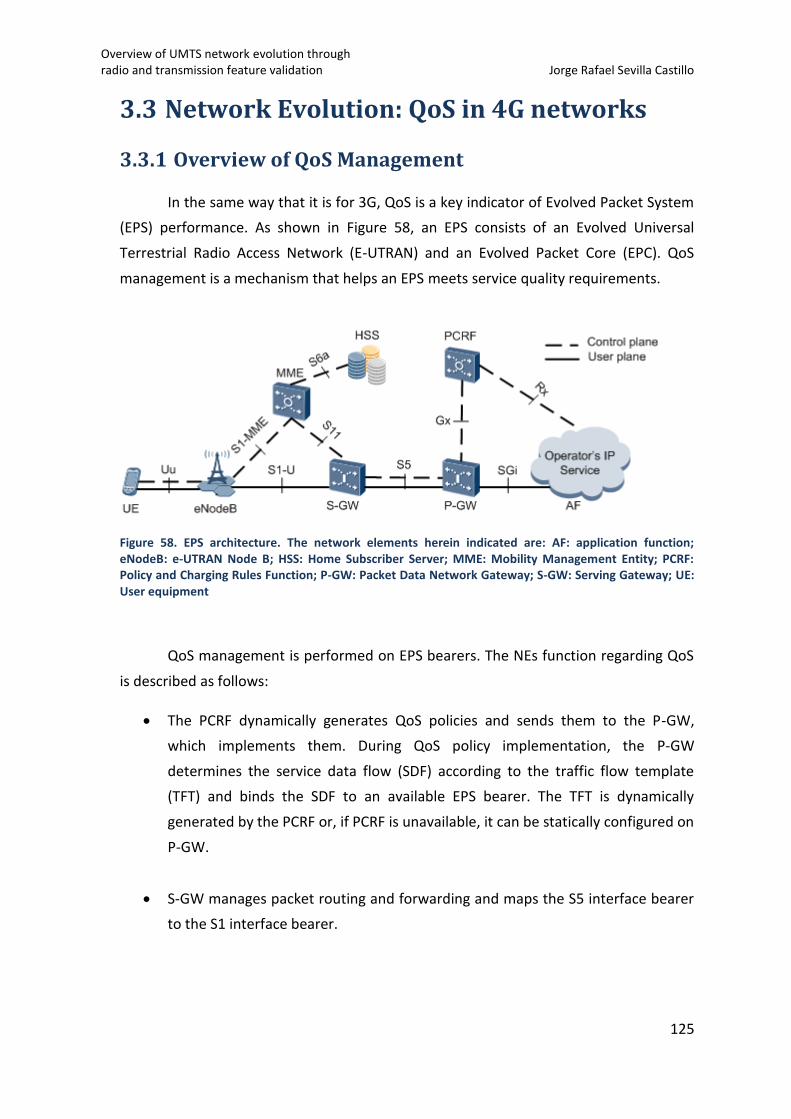
Overview of UMTS network evolution through radio and transmission feature validation Jorge Rafael Sevilla Castillo
125
3.3 Network Evolution: QoS in 4G networks
3.3.1 Overview of QoS Management
In the same way that it is for 3G, QoS is a key indicator of Evolved Packet System
(EPS) performance. As shown in Figure 58, an EPS consists of an Evolved Universal
Terrestrial Radio Access Network (E-UTRAN) and an Evolved Packet Core (EPC). QoS
management is a mechanism that helps an EPS meets service quality requirements.
Figure 58. EPS architecture. The network elements herein indicated are: AF: application function; eNodeB: e-UTRAN Node B; HSS: Home Subscriber Server; MME: Mobility Management Entity; PCRF: Policy and Charging Rules Function; P-GW: Packet Data Network Gateway; S-GW: Serving Gateway; UE: User equipment
QoS management is performed on EPS bearers. The NEs function regarding QoS
is described as follows:
The PCRF dynamically generates QoS policies and sends them to the P-GW,
which implements them. During QoS policy implementation, the P-GW
determines the service data flow (SDF) according to the traffic flow template
(TFT) and binds the SDF to an available EPS bearer. The TFT is dynamically
generated by the PCRF or, if PCRF is unavailable, it can be statically configured on
P-GW.
S-GW manages packet routing and forwarding and maps the S5 interface bearer
to the S1 interface bearer.
Overview of UMTS network evolution through radio and transmission feature validation Jorge Rafael Sevilla Castillo
126
MME obtains UE subscription data from the HSS and transfers the QoS
parameters among the NEs.
HSS stores UE subscription data and subscribed QoS policies.
The eNode B establishes UE bearers and schedules UE data based on the QoS
parameter settings and the status of radio and transport resources. The eNode B
uses differentiated resource management and allocation policies to meet QoS
requirements of UE bearers.
3.3.2 Basic Principles
EPS Bearer Architecture
In the EPS, the basic unit for QoS management is an EPS bearer, upon which SDFs
are created. The same QoS management policies are applied to SDFs on the same EPS
bearer. These policies include a scheduling policy and a radio bearer policy. To provide
different QoS management policies for different SDFs, these SDFs must be mapped to
different EPS bearers.
Figure 59. EPS bearer architecture according to 3GPP TS 36.300 specifications
Overview of UMTS network evolution through radio and transmission feature validation Jorge Rafael Sevilla Castillo
127
In LTE, an EPS bearer carries one or more SDFs with the same QoS attribute
between the UE and P-GW. In Figure 59, the bearer between the UE and eNode B is
radio bearer, and the bearer between the eNode B and S-GW is S1 bearer. The radio
bearer and S1 bearer form the E-UTRAN radio access bearer (E-RAB). The end-to-end
bearers in the EPS are divided by layer, and QoS management is performed based on
layers.
EPS Bearer Types
EPS bearers can be divided into GBR and non-GBR bearers.
Based on dedicated bearers, GBR bearers are used for real-time services, such as
voice, video, and real-time gaming.
Non-GBR bearers are used to carry non-real-time services, such as emails, File
Transfer Protocol (FTP) services, and Hypertext Transfer Protocol (HTTP) services.
EPS bearers can also be divided into default and dedicated bearers.
Default bearer: Allocated by the EPC to a UE when the UE initially accesses the
EPS. If the UE have multiple Access Point Names (APNs), the EPS sets up a default
bearer for each APN, such as different default bearers for IMS APN and Internet
APN. The default bearer remains established to ensure a short delay for the UE
to start a service and provide the UE with always-on IP connectivity. The default
bearer is a non-GBR bearer.
Dedicated bearer: Set up for a UE if the default bearer cannot meet the QoS
requirements. A dedicated bearer can generally meet more stringent QoS
requirements than the default bearer. Multiple dedicated bearers can be set up
for a UE simultaneously. The EPC sets up dedicated bearers for a UE based on
QoS requirements. A dedicated bearer can be a GBR or non-GBR bearer.
Up to eight bearers with different QCIs can be set up between the eNode B and
the UE.
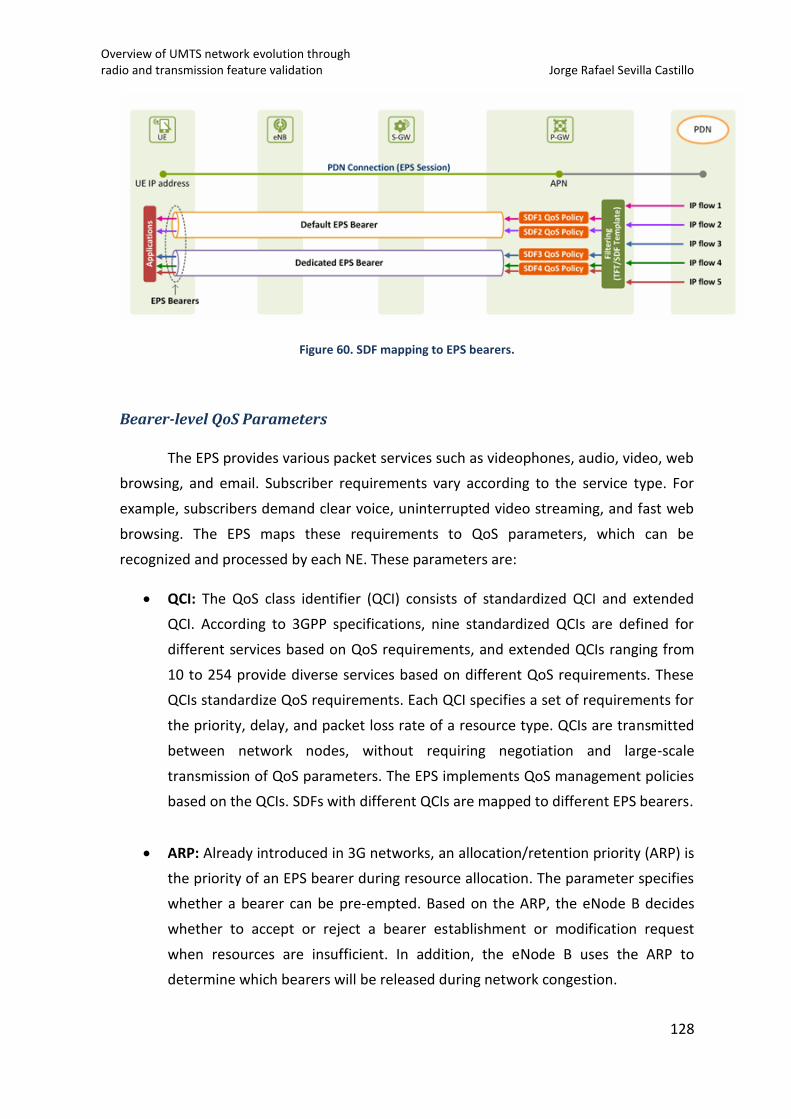
Overview of UMTS network evolution through radio and transmission feature validation Jorge Rafael Sevilla Castillo
128
Figure 60. SDF mapping to EPS bearers.
Bearer-level QoS Parameters
The EPS provides various packet services such as videophones, audio, video, web
browsing, and email. Subscriber requirements vary according to the service type. For
example, subscribers demand clear voice, uninterrupted video streaming, and fast web
browsing. The EPS maps these requirements to QoS parameters, which can be
recognized and processed by each NE. These parameters are:
QCI: The QoS class identifier (QCI) consists of standardized QCI and extended
QCI. According to 3GPP specifications, nine standardized QCIs are defined for
different services based on QoS requirements, and extended QCIs ranging from
10 to 254 provide diverse services based on different QoS requirements. These
QCIs standardize QoS requirements. Each QCI specifies a set of requirements for
the priority, delay, and packet loss rate of a resource type. QCIs are transmitted
between network nodes, without requiring negotiation and large-scale
transmission of QoS parameters. The EPS implements QoS management policies
based on the QCIs. SDFs with different QCIs are mapped to different EPS bearers.
ARP: Already introduced in 3G networks, an allocation/retention priority (ARP) is
the priority of an EPS bearer during resource allocation. The parameter specifies
whether a bearer can be pre-empted. Based on the ARP, the eNode B decides
whether to accept or reject a bearer establishment or modification request
when resources are insufficient. In addition, the eNode B uses the ARP to
determine which bearers will be released during network congestion.
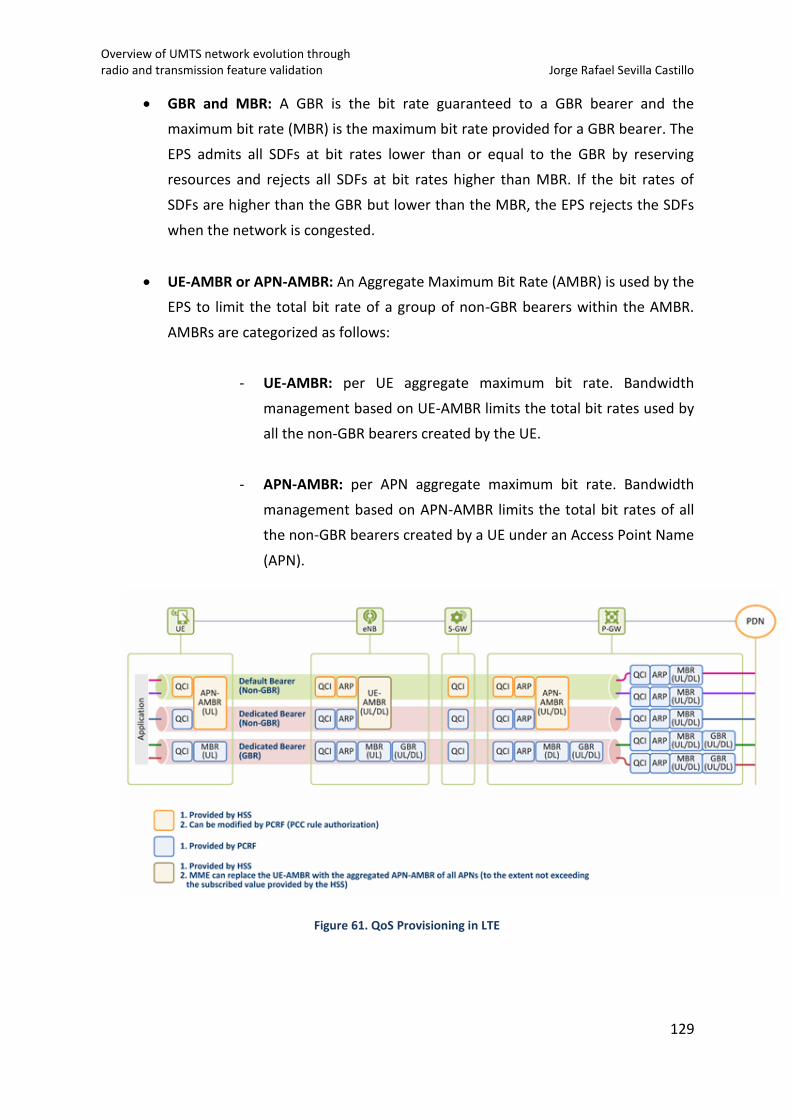
Overview of UMTS network evolution through radio and transmission feature validation Jorge Rafael Sevilla Castillo
129
GBR and MBR: A GBR is the bit rate guaranteed to a GBR bearer and the
maximum bit rate (MBR) is the maximum bit rate provided for a GBR bearer. The
EPS admits all SDFs at bit rates lower than or equal to the GBR by reserving
resources and rejects all SDFs at bit rates higher than MBR. If the bit rates of
SDFs are higher than the GBR but lower than the MBR, the EPS rejects the SDFs
when the network is congested.
UE-AMBR or APN-AMBR: An Aggregate Maximum Bit Rate (AMBR) is used by the
EPS to limit the total bit rate of a group of non-GBR bearers within the AMBR.
AMBRs are categorized as follows:
- UE-AMBR: per UE aggregate maximum bit rate. Bandwidth
management based on UE-AMBR limits the total bit rates used by
all the non-GBR bearers created by the UE.
- APN-AMBR: per APN aggregate maximum bit rate. Bandwidth
management based on APN-AMBR limits the total bit rates of all
the non-GBR bearers created by a UE under an Access Point Name
(APN).
Figure 61. QoS Provisioning in LTE
Overview of UMTS network evolution through radio and transmission feature validation Jorge Rafael Sevilla Castillo
130
3.3.3 ENode B QoS Management Policies
Subscribers' subscription data is stored on the HSS. When a UE initiates a service
request, the P-GW/S-GW and eNode B provide the service for the UE based on the QoS
subscription data stored on the HSS and the QoS parameters delivered by the PCRF.
ENode B QoS management consists of radio QoS management and transport
QoS management. Radio QoS management ensures the quality of services on radio
bearers, and transport QoS management ensures the quality of services on the S1
bearer.
During the service setup request phase, the Uu interface and transport network
execute admission control on the services, and the eNode B supports only those services
that are admitted. Meanwhile, the eNode B maps the QoS parameters and the
differentiated services code points (DSCPs) for QoS management.
After a service is set up, the eNode B performs QoS management on services
based on QCIs. To ensure the quality of high-priority services, admission control is
performed on low-priority services when the Uu interface and transport network are
congested. This procedure ensures service continuity based on QoS management during
UE movements.
In order to introduce these mechanisms, the single subscriber case is explained.
QoS Guarantees for a Single Subscriber
QoS management provides QoS guarantees for an entire service process
implemented during the service setup request phase and post-service-setup phase.
Service Setup Request Phase: The service setup request phase requires QoS
parameter mapping and admission control based on the availability of cell
resources.
QoS Parameter Mapping: During the service setup request phase, the
eNode B maps the QoS parameters of a service, such as the QCI, GBR,
and MBR, to the service's radio bearer and transport parameters,
providing consistent QoS parameters for eNode B QoS management.
Overview of UMTS network evolution through radio and transmission feature validation Jorge Rafael Sevilla Castillo
131
Two types of QCI configurations can be set up in the eNode B at radio
level:
o ENode B-level QCI: maps QoS parameters to scheduling priorities
and to the radio link control (RLC) and Packet Data Convergence
Protocol (PDCP) transmission modes and transport parameters.
o Cell-level QCI: maps QoS parameters to service-based
discontinuous reception (DRX), scheduling request indicator (SRI)
and handover parameters.
Transport parameter configuration maps QoS parameters to transport
parameters in S1/X2 interfaces, based on DSCP differentiation at IP layer.
Cell-level Admission Control: Admission control in each cell prevents an
excessive number of subscribers from accessing the cell and ensures that
the cell is not overloaded. Admission control is performed on the Uu
interface and on the transport network. A service is admitted only when
it successfully passes both.
o Admission control on the Uu interface: it helps ensure the quality
of admitted services and expected quality of new services. It
applies to both GBR and non-GBR services. Admission control is
performed on GBR services based on the PUCCH (Physical Uplink
Control Channel) resources, UE capability, cell load status, and
QoS satisfaction rate. It is performed on non-GBR services based
on only PUCCH resources.
o Admission control on the transport network: different admission
control policies are applied to services based on the occupation
rate of transmission bandwidths and service types, ensuring the
quality of admitted services and improving access success rates of
high-priority services.
Post-Service-Setup Phase: Post service setup request phase requires power
control and mobility management to help ensuring QoS policies.
Overview of UMTS network evolution through radio and transmission feature validation Jorge Rafael Sevilla Castillo
132
Power Control: After a service is set up, power control limits the transmit
power for the service within an appropriate range. This function ensures
correct data reception and improves power efficiency. Based on power
control and scheduling, the block error rate (BLER) can converge to the
target value.
Mobility Management: Service quality may deteriorate when a UE moves
to the cell edge. By using the handover function, the eNode B promptly
triggers a handover to enable the UE to be served by another cell and
thereby ensures service continuity.
Scheduling: Scheduling consists of downlink and uplink scheduling. In
scheduling, the eNode B determines the scheduling priorities of radio
bearers and UEs based on the input QoS parameters and the quality of
PUSCH and PDSCH. This maximizes system throughput while meeting
UEs' QoS requirements. Scheduling helps ensure basic quality for
services. For example, scheduling ensures acceptable transmission delay
for data packets of delay-sensitive voice over IP (VoIP) services, and
ensures the service rate and packet delay budget (PDB) for GBR services.
.
QoS Management Methods
ARP-based QoS Management
ARP-based QoS management ensures equal subscriber resource use in
traditional packet services. Requirements of high-priority subscribers cannot be fully
met with these traditional services.
ARP-based QoS management provides DiffServ by using admission and
congestion control based on service priority information contained in subscription data.
During the setup of an E-UTRAN radio access bearer (E-RAB), the EPC transmits
an ARP (which includes subscription data) to the eNode B. The eNode B then maps the
ARP to a service priority (gold, silver, or bronze). A larger ARP value indicates a lower
priority. The probability that the services fail admission control is higher when the
network is congested.
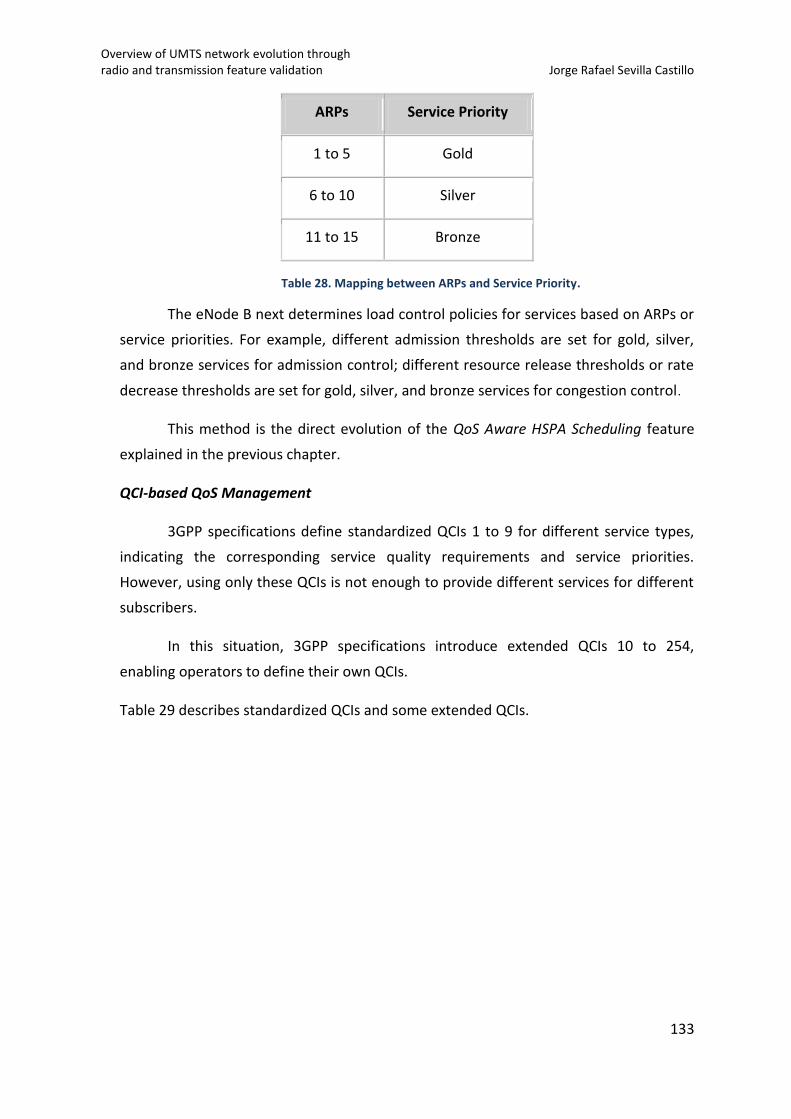
Overview of UMTS network evolution through radio and transmission feature validation Jorge Rafael Sevilla Castillo
133
ARPs Service Priority
1 to 5 Gold
6 to 10 Silver
11 to 15 Bronze
Table 28. Mapping between ARPs and Service Priority.
The eNode B next determines load control policies for services based on ARPs or
service priorities. For example, different admission thresholds are set for gold, silver,
and bronze services for admission control; different resource release thresholds or rate
decrease thresholds are set for gold, silver, and bronze services for congestion control.
This method is the direct evolution of the QoS Aware HSPA Scheduling feature
explained in the previous chapter.
QCI-based QoS Management
3GPP specifications define standardized QCIs 1 to 9 for different service types,
indicating the corresponding service quality requirements and service priorities.
However, using only these QCIs is not enough to provide different services for different
subscribers.
In this situation, 3GPP specifications introduce extended QCIs 10 to 254,
enabling operators to define their own QCIs.
Table 29 describes standardized QCIs and some extended QCIs.
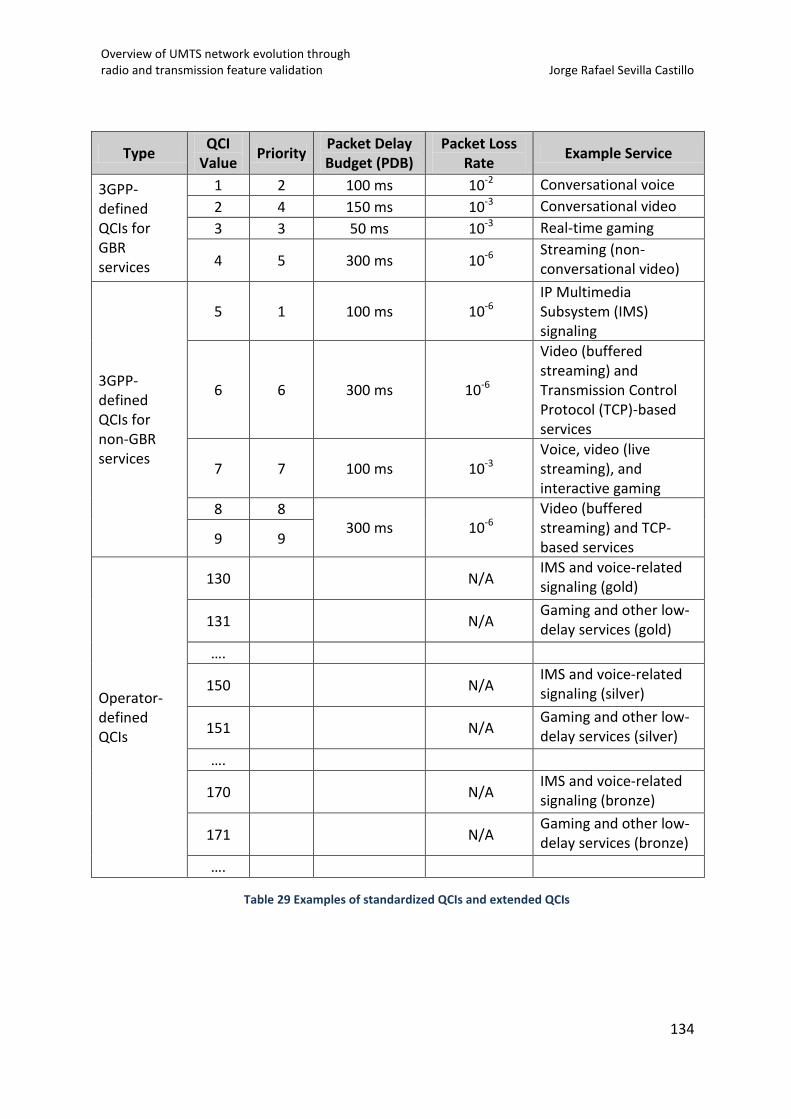
Overview of UMTS network evolution through radio and transmission feature validation Jorge Rafael Sevilla Castillo
134
Type QCI
Value Priority
Packet Delay Budget (PDB)
Packet Loss Rate
Example Service
3GPP-defined QCIs for GBR services
1 2 100 ms 10-2 Conversational voice
2 4 150 ms 10-3 Conversational video
3 3 50 ms 10-3 Real-time gaming
4 5 300 ms 10-6 Streaming (non-conversational video)
3GPP-defined QCIs for non-GBR services
5 1 100 ms 10-6 IP Multimedia Subsystem (IMS) signaling
6 6 300 ms 10-6
Video (buffered streaming) and Transmission Control Protocol (TCP)-based services
7 7 100 ms 10-3 Voice, video (live streaming), and interactive gaming
8 8 300 ms 10-6
Video (buffered streaming) and TCP-based services
9 9
Operator-defined QCIs
130 N/A IMS and voice-related signaling (gold)
131 N/A Gaming and other low-delay services (gold)
….
150 N/A IMS and voice-related signaling (silver)
151 N/A Gaming and other low-delay services (silver)
….
170 N/A IMS and voice-related signaling (bronze)
171 N/A Gaming and other low-delay services (bronze)
….
Table 29 Examples of standardized QCIs and extended QCIs
Overview of UMTS network evolution through radio and transmission feature validation Jorge Rafael Sevilla Castillo
135
3.3.4 Future testing
This section has been included within the scope of this project to introduce the
QoS mechanisms included in evolved radio networks, such as Long Term Evolution (LTE).
After analyzing the QoS management architecture and QoS management methods that
are implemented by the eNode B, it can be seen that service prioritization can be
achieved by following a similar rationale. The Enhanced proportional Fair (EPF)
scheduling mechanism used in LTE considers two basic parameters in order to prioritize
a single user data bearer: QCI – which is newly introduced in 4G networks as a way to
establish QoS differentiation within a variety of services (refer to Table 29) and
Allocation Retention Priority (ARP), which can be used to establish bearer pre-emption
priorities within services associated to the same or different QCIs. Thus, the test shown
in the previous section could be replicated also in a 4G network for future study by
forcing a transmission congested scenario and observing what is the behavior in a multi-
user scenario when:
Different users are assigned bearers with different QCIs and same ARP
values. In this case it should be observed that higher throughput is
obtained the higher the QCI (in descending order, that is, a QCI 7 bearer
is prioritized over a QCI 9 bearer).
Different users are assigned bearers with the same QCI but different ARP
values. It should be observed that, starting a test with low ARP users
triggering downlink congestion, once a higher ARP user initiates a data
service, lower ARP users’ resources will be pre-empted, increasing the
throughput of the new coming user.
Overview of UMTS network evolution through radio and transmission feature validation Jorge Rafael Sevilla Castillo
136
4 IuB evolution: hybrid backhaul
and full IP solutions
4.1 Theoretical Background
4.1.1 Introduction
In a society where communication technology is becoming more and more
relevant and where the “always-on” user experience is a must, it is very important that
the network supporting radio technologies evolves even faster.
In particular, the mobile communication sector has been experiencing vast
changes during the last two decades. The development and deployment of third
generation radio technologies (UMTS, HSxPA, and HSPA+) have been the enablers for
mobile broadband and, together with the smartphone, tablet and dongle market
success, have made it possible for the users to access real-time information from their
mobile devices. As a result, it is being confirmed the trend which delegates voice data
services to a secondary paper in front of data services, which have experienced an
exponential growth.
However, the evolution in radio access technologies and user equipments should
not be the only success factor to consider. Transmission access network evolution and
dimensioning, in particular, is key to support second, third and fourth radio network
generations and, in most cases, a barrier for these technologies to perform at their
maximum capacity.
The basic function of transmission network is to convey signaling and user data
between radio network equipment - Base Station Controller (BSC) and RNC- and remote
base stations - BTS and Node B- that is for 2G and 3G; and between eNode B and EPC in
case of 4G communications.
Given the importance of the economic investment associated to the deployment
of a network across a large geographical area, choosing the appropriate transmission
mechanism and equipments is a key strategic decision which directly impacts the
Overview of UMTS network evolution through radio and transmission feature validation Jorge Rafael Sevilla Castillo
137
business competitiveness. That is the main reason why the operator should balance the
cost-effectiveness of the solution and the quality of service to be offered.
First radio access network deployments were intended to support 2G standards,
which were mainly focused on voice services. For that reason, the operator decided to
deploy Time Division Multiplexing (TDM) transmission-based technology, focused on
connection-oriented circuit switching.
Later on, with the arrival of 3G standards, data services came to the picture. At
the beginning, the existing TDM network was able to cope with the initial data traffic
growth, but soon appeared the first limitations to carry a type of traffic for which it was
not initially designed.
For that reason, operators decided to migrate their transmission network to a
fresh data transport oriented technology. In fact, due to the presence of internet
protocol stack across the fixed network, IP/Ethernet packet-switching technology was
adopted as the new reference across mobile networks. In addition, the election of a
universal standard allowed the operator to leverage the large-scale economies provided
by the Ethernet-based packet technologies.
Nevertheless, considering the investment already made in TDM network, the
new investment required to deploy an All-IP based network and the huge amount paid
for the radio spectrum, most operators decided to postpone the migration.
By the end of 2008, the increasing user demand for greater bandwidths and
data-hungry services pushed the operators to think about the technology transition on
their transmission network if they wanted to keep their future competitive position in
the market, also considering that the evolution towards 4G technology started to be a
hot topic in the roadmap of the operator portfolio.
For the mid and long term, this migration has turned into great opportunities for
the operator, ensuring both technical (4G ready networks) and economical (savings in
OPEX after all the traffic has been swapped to IP technology) competitive position with
the possibility to converge mobile and fixed network services.
All things considered, this chapter wants to introduce the reader to the technical
challenge that the smooth network transition brought to the operators by analyzing
different solutions focused on the IuB interface, which is the last mile link where the
Node B connects to. The reader will find a brief overview on legacy transmission
Overview of UMTS network evolution through radio and transmission feature validation Jorge Rafael Sevilla Castillo
138
technologies, so it can be understood why an expansion of this kind of media could turn
into an inefficient strategy; followed by the core section, the hybrid backhaul, which
emulates ATM over Ethernet transport solution that I personally configured and tested
for first time in the operator where I developed this project. The analysis shown herein
should be taken from the operator point of view at that particular point in time.
Finally, it is also shown the validation results obtained when configuring and testing the
performance of an “all-IP” based IuB, solution which established the critical milestone
into transmission network design evolution.
4.1.2 Legacy IuB Transport Solution
A look into the past: the role of ATM in 3G Access Networks
A cellular access network connects Node Bs to RNCs (Radio Network Controllers)
via IuB interface. The IuB interface is a complex set of protocols handling all aspects of
Node B-to-RNC communication, including media, signaling and Operation,
Administration and Maintenance (OAM) over ATM. ATM, in turn, can be transported
over various TDM links.
In practice, most Node B connections range from a fractional E1 to several E1s
bundled as an Inverse Multiplexing over ATM (IMA) group. RNC connections are usually
either E1s or Synchronous Transport Module Level-1s (STM-1s).
Early releases of the 3G standard defined the Node B-to-RNC connection as
purely TDM connection. In the ATM layer, Node Bs and RNCs were connected via a
direct ATM link, without intermediate ATM switching. The definition provides the
following functions:
Independence of the underlying transmission layer.
Definition of groups of several TDM links as one logical link using the ATM
IMA mechanism
Ability to carry voice and data over the same link.
Implementation of statistical multiplexing between different applications
on the same Node B maintaining QoS.
Overview of UMTS network evolution through radio and transmission feature validation Jorge Rafael Sevilla Castillo
139
Introduction of ATM Switching into the Access Networks
Release 4 of 3GPP standard formally described how to perform ATM switching in
the access network, and how to provide the QoS guaranties required for the successful
operation of 3G applications.
ATM switching in the access network provides two major advantages:
The ability to configure RNCs with STM-1 interfaces instead of E1s, thus
drastically reducing the cost of the RNC. Consider the cost of deploying
copper-based E1s (capacity ≈ 2Mbps) versus optical fiber based STM-1
(capacity ≈ 155Mbps)
Savings in bandwidth consumption.
Current deployments demonstrate that it is not cost-effective to deploy E1 links
in the RNC. STM-1, on the other hand, has proved to be a far less expensive solution,
even with the cost of intermediate ATM switching.
In a TDM-based network, the link between the Node B and the RNC has a
granularity of E1. Although fractional E1 connections are feasible, these are usually
reserved for sub-E1 rates, such as the ones required in GSM networks.
This bandwidth allocation is part of the basic design of the Node B. However,
ATM concentration in the access network can improve bandwidth utilization. For
example, if the peak traffic to/from a Node B is estimated to be 3 Mbps, then two E1
interfaces (2 x 2.048 Mbps) must be allocated to the Node B at the TDM level. On the
other hand, an ATM switch concentrating traffic from 10 Node Bs can concentrate from
40 Mbps (10 x 2 E1) to 30 Mbps (10 x 3 Mbps, or only 15 E1s) without violating the basic
bandwidth allocation rule of 3 Mbps per Node B.
Statistical Multiplexing Based on Peak and Sustained rate
An ATM link can contain many ATM virtual circuits, each with its own
parameters. The main parameters are the Peak Cell Rate (PCR) and the Sustained Cell
Rate (SCR).
Overview of UMTS network evolution through radio and transmission feature validation Jorge Rafael Sevilla Castillo
140
The peak cell rate controls the maximum permissible cell rate, whereas the
sustained rate is the average connection rate. A Node B may transmit at the peak rate
for a short period of time only (controlled by the maximum burst size), which is typically
lower than 50ms. Over longer intervals, traffic must be controlled by the sustained cell
rate, typically much lower. In the real world, only few Node Bs transmit at the peak rate
(i.e. hotspot areas), whereas the majority transmits at the sustained rate.
ATM concentration in the access layer eases to maintain the peak rate of the
connection at high level, thus ensuring short delays. As the number of Node Bs
transmitting concurrently at the peak rate can be statistically bounded, bandwidth must
be allocated for the sustained rate for all the Node Bs, with the peak rate allocated to
only some. As a result, bandwidth consumption is significantly lower. Nonetheless, there
is a lower chance that all Node Bs send a burst of traffic simultaneously with the
resulting loss of ATM cells. This can easily be computed based on the ATM policing and
shaping mechanisms, which guarantee cell rate in compliance with 3G standards.
Multiplexing based on usage statistics
Bandwidth allocation per Node B is based on the maximum concurrent
bandwidth demanded by users being served by the specific Node B. While it is desirable
to provide full service to all users in any scenario, this is economically impossible.
As with any mass service, statistical assumptions about overall cell usage can
safely be made. For example, in GSM voice-based deployments, network designs
assume that not all subscribers will make a call at the same time. If they do, some will be
rejected. 3G services are subject to the same design considerations. In effect, due to the
burst nature of data, network planning must rely on the statistical nature of usage
patterns. Unlike ATM statistical multiplexing (which allows users to send high rate traffic
over short periods of time and then forces them to reduce the rate), usage statistical
multiplexing is based on the assumption that not all subscribers user the network
concurrently. Consequently, this multiplexing method may vary with changes in usage
patterns. As it is the nature of data to adapt the application to the available bandwidth,
usage-based multiplexing can be implemented even if the service level is sometimes
degraded.
Overview of UMTS network evolution through radio and transmission feature validation Jorge Rafael Sevilla Castillo
141
Higher Savings
Reducing bandwidth consumption is always a recommended approach.
However, depending on the network structure and design, the reduction ration may
vary between operators.
When using leased-lines or licensed radio frequencies (for microwave links) to
build a network, lower bandwidth consumption translates into direct savings in
Operational Expenditure (OPEX). This reduction involves more than only the monthly
cost of leasing the lines and the radio frequencies. In addition, when bandwidth
consumption is reduced, the access network becomes smaller. Service providers can
then manage a smaller transmission network with less expensive interfaces, less
equipment cards and less manpower.
4.1.3 Understanding the challenge
In an ATM-based transport scenario, a 3G cellular access network can be
deployed in one of the following configurations:
RNCs with E1 ports connected to the Node Bs via pure TDM transmission
network.
RNCs with STM-1 ports and Node Bs with E1 ports. In this configuration,
ATM switches deployed along the connection convert E1s originating in
the Node Bs to STM-1s by:
- Co-locating ATM concentration devices with the RNC.
- Putting in place ATM concentration devices within the access
network.
The following sections describe the advantages and disadvantages of each
approach.
Overview of UMTS network evolution through radio and transmission feature validation Jorge Rafael Sevilla Castillo
142
Deployment over Pure TDM Transmission
ATM switching in the access network is recommended, but is not technically
mandatory.
It is possible to build a network connecting an E1 port from a Node B directly to
an E1 port from the RNC (basic ATM configuration which is usually considered in a lab
environment). This approach, however, lacks the advantage of using STM-1 ports in the
RNC and ATM concentration in the network that results in savings in bandwidth and
network costs, as well as not being suitable for network dimensioning and scalability.
Co-location of ATM switches in RNCs
A second alternative is to deploy an ATM switch co-located with the RNC. In this
scenario, the access network carries TDM connections from the Node Bs to the ATM
switch; the switch concentrates E1s into a single STM-1, which in turn is connected to
the RNC.
RNCs can then be configured with STM-1 ports, resulting in a more economical
network structure. However, bandwidth consumption is still based on the peak demand
of every Node B, without ATM concentration.
ATM Concentration devices within the access network
The deployment of ATM switches in the access network is therefore the most
efficient and cost-effective implementation. The switches concentrate traffic from Node
Bs into VC-4 containers, enabling an economical RNC configuration.
The cost of using ATM switches in the access
ATM access networks are necessary, but expensive, as ATM is an expensive
technology. Moreover, the installation of a simple ATM switch for traffic concentration
includes the addition of ATM hardware, as well as support of a significant number of
Plesiochronous Digital Hierarchy (PDH) and Synchronous Digital Hierarchy (SDH)
interfaces.
Overview of UMTS network evolution through radio and transmission feature validation Jorge Rafael Sevilla Castillo
143
Imagine a typical scenario in which STM-1 links concentrate traffic from Node Bs.
For example, a switch can concentrate traffic from a channelized STM-1 with 52 active
channels (E1s), with 20 E1s from local Node Bs.
The total number of E1s is 72 and therefore a channelized STM-1 is no longer
sufficient. Concentration must be performed at the ATM level, as TDM concentration
results in the need for additional STM-1s, which is a waste of bandwidth considering
that an STM-1 handles up to 63 E1s and the additional STM-1 will be carrying only 9.
As already described, an ATM switch can easily compress traffic originally carried
on 72 E1s into one VC-4. However, the ATM switch must connect to 72 E1 ports and one
STM-1 port. Therefore, to enable ATM concentration, the following components must
be added:
An ATM switch with 72 E1 interfaces and one STM-1 interface
An additional STM-1 interface in the transmission network
Additional 72 E1 interfaces in the transmission network.
The above configuration is extremely expensive and casts a shadow on the cost-
effectiveness of ATM concentration in the access network. Clearly, a far more
economical solution is required.
The extra costs of maintaining IMA groups
IMA is a low level protocol transporting ATM over multiple E1 links. It configures
multiple physical links as a single ATM link, and adds and drops physical links without
affecting traffic.
The capability to add and drop TDM capacity from the IMA link without affecting
ATM traffic is extremely powerful but costly. IMA is implemented at the hardware level,
and therefore all the links in the same IMA group must reside on the same interface
card.
Continuing with the previous example, we can assume that the 72 E1
connections are originated in 36 Node Bs, where each one is connected via an IMA
Overview of UMTS network evolution through radio and transmission feature validation Jorge Rafael Sevilla Castillo
144
group of two E1s. If the operator plans to upgrade the Node B links to an IMA group of 4
E1s, two options are available:
Deploy an ATM switch with 72 E1 interfaces and upgrade them when
traffic volume increases, or
Deploy an ATM switch with 144 E1 interfaces, leaving room for future
IMA expansion.
The first option is extremely complicated. When upgrading the network
connection of the Node Bs from two to four E1 links, the new links must all be allocated
to the same interface card. At some point in time, a new ATM interface card will be
needed, requiring a rewiring of the physical cables. The resulting upgrade is a traffic-
affecting cable management procedure.
The second option of reserving ports for future use is simple, but requires
investing in equipment that will not be used until needed, if at all, which has been
demonstrated to be the case. The deployment of ATM interfaces based on future
upgrade plans is not economically justifiable for an operator due to uncertain changes in
the traffic volume and transport technologies.
All in all, assigning E1 links to IMA groups according to future network upgrades
situates the operator in a difficult position. In addition, upgrade procedures are very
complex and may demand traffic-affecting cable changes. The alternatives are
expensive and require initial rollouts for unpredictable future scenarios.
Next section shows the next step to follow when the operator requires a
capacity upgrade without dismantling the legacy TDM resources
4.1.4 Hybrid Backhaul Solution Overview
Hybrid backhaul, the next step
High Speed Packet Access (HSPA) is one of the crucial evolutionary steps of 3G
networks development. Starting with 1.8 Mbps, users will experience downlink peak
rates of up to 3.6 Mbps, 7.2 Mbps and 14.4 Mbps provided in steps*. However, widening
the air interface between the user equipment (UE) and base station is not enough at all:
Overview of UMTS network evolution through radio and transmission feature validation Jorge Rafael Sevilla Castillo
145
also the IuB interface between the Node B and RNC must be dimensioned accordingly;
that implies the need to evolve from 2 Mbps, which is an E1 capacity, to greater
bandwidths.
Current backhaul networks are often low-dimensioned to support such an
evolution. This particularly happens when transport capacity is leased: the OPEX
(Operational Expenses) of additional leased lines is prohibitive when the operator aim is
to decouple capacity expenses with cost per bit. In contrast to traditional E1 lines,
Ethernet-based services have the potential to separate cost from capacity – that is, to
provide the bandwidth required for HSPA and capping the associated OPEX at once.
Ethernet can be applied either as a substitute or as a complementary solution: in the
first case all cell site traffic is carried over Ethernet; in the second case, the E1 is kept to
carry all-delay sensitive traffic (Operation & Maintenance traffic included) and Ethernet
is used for HSDPA only.
The way the operators may act is a two-step deployment, moving smoothly from
the current E1 architecture to a total Ethernet-based backhaul with a hybrid solution as
an intermediate milestone. The next paragraphs show which would be a reasonable way
to achieve the final “All-IP” goal.
*HSDPA rates till 3GGP R5. With the introduction of higher capacity modulations (i.e. 64QAM), the
implementation of MIMO techniques and N-carrier support, HSDPA speeds have evolved to 337.5 Mbps in
3GPP R11. For further information, please refer to 3GPP TS 25.306 documentation.
Network Trend: near, medium and long term scenario
When considering R99 and HSPA traffic, the operator can deploy different
transport backhaul strategies depending on the traffic growth forecast of each of the
aforementioned technologies. At this point, three different alternatives may be taken
into account.
First of all, there will be scenarios in which HSPA can still fit into the current
infrastructure without expensive upgrades (i.e. microwave upgrades in a “pay as you
grow” model) at near/medium term in areas where large amounts of data are not
expected, that is, rural areas.
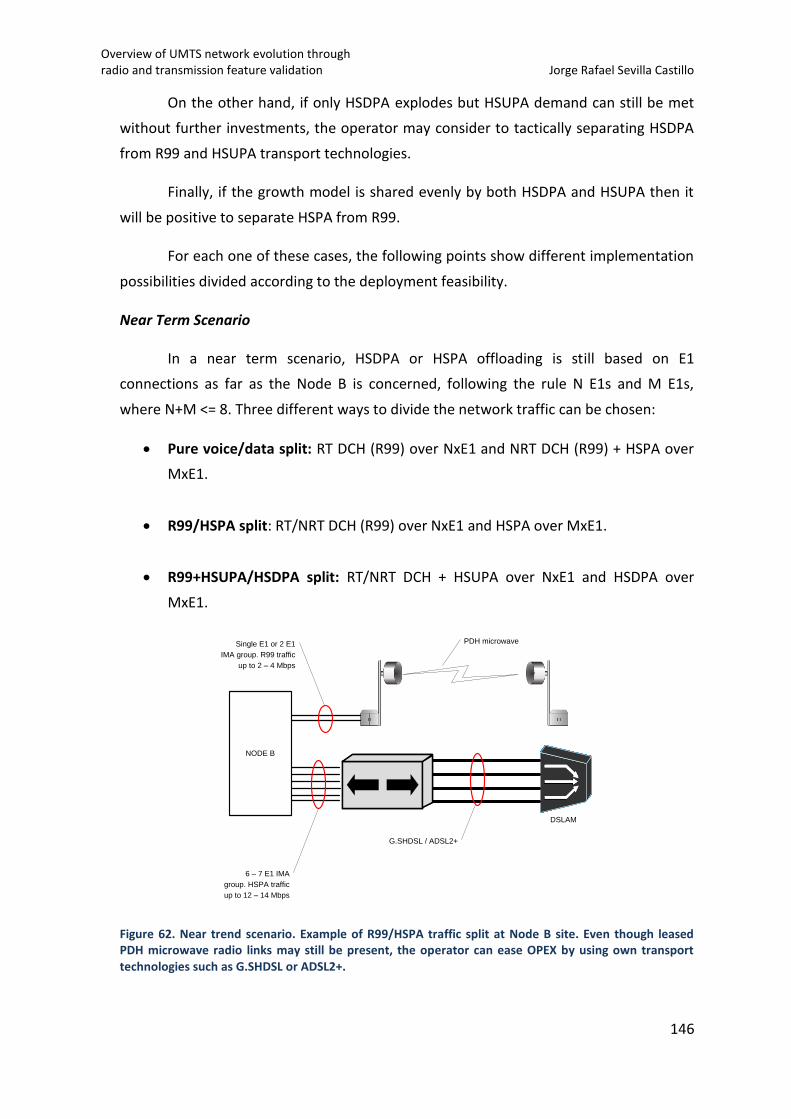
Overview of UMTS network evolution through radio and transmission feature validation Jorge Rafael Sevilla Castillo
146
On the other hand, if only HSDPA explodes but HSUPA demand can still be met
without further investments, the operator may consider to tactically separating HSDPA
from R99 and HSUPA transport technologies.
Finally, if the growth model is shared evenly by both HSDPA and HSUPA then it
will be positive to separate HSPA from R99.
For each one of these cases, the following points show different implementation
possibilities divided according to the deployment feasibility.
Near Term Scenario
In a near term scenario, HSDPA or HSPA offloading is still based on E1
connections as far as the Node B is concerned, following the rule N E1s and M E1s,
where N+M <= 8. Three different ways to divide the network traffic can be chosen:
Pure voice/data split: RT DCH (R99) over NxE1 and NRT DCH (R99) + HSPA over
MxE1.
R99/HSPA split: RT/NRT DCH (R99) over NxE1 and HSPA over MxE1.
R99+HSUPA/HSDPA split: RT/NRT DCH + HSUPA over NxE1 and HSDPA over
MxE1.
NODE B
Single E1 or 2 E1
IMA group. R99 traffic
up to 2 – 4 Mbps
6 – 7 E1 IMA
group. HSPA traffic
up to 12 – 14 Mbps
PDH microwave
G.SHDSL / ADSL2+
DSLAM
Figure 62. Near trend scenario. Example of R99/HSPA traffic split at Node B site. Even though leased PDH microwave radio links may still be present, the operator can ease OPEX by using own transport technologies such as G.SHDSL or ADSL2+.
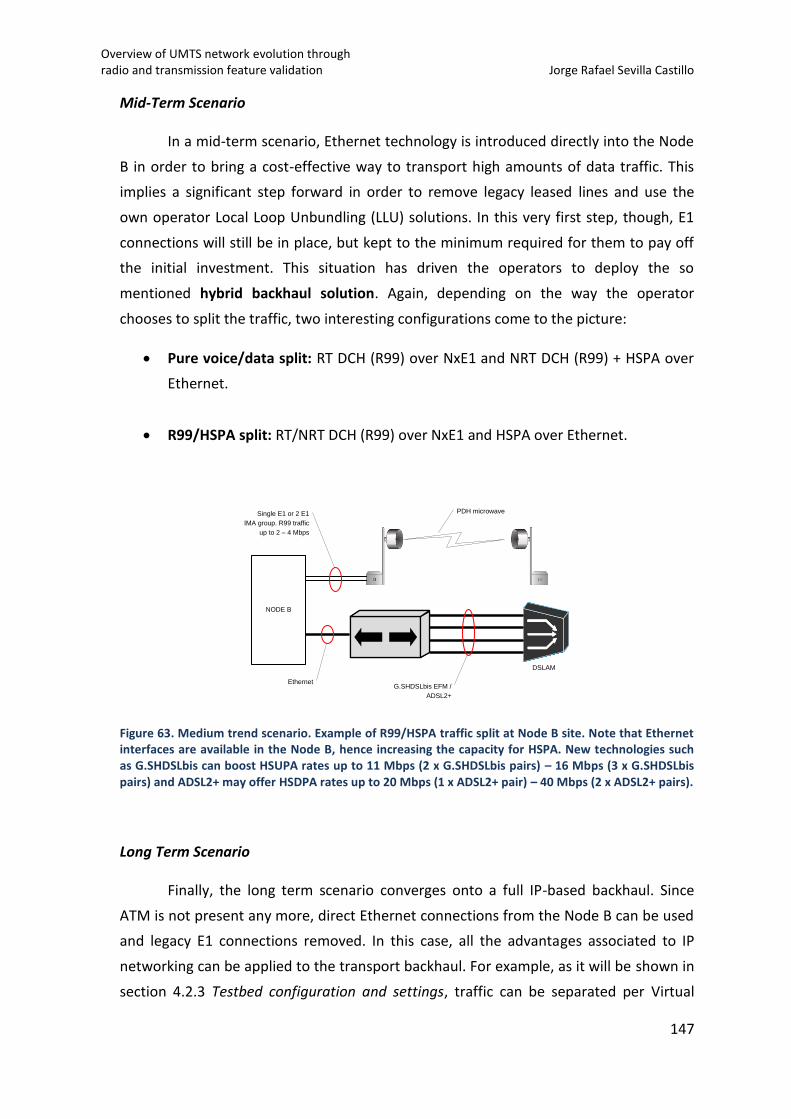
Overview of UMTS network evolution through radio and transmission feature validation Jorge Rafael Sevilla Castillo
147
Mid-Term Scenario
In a mid-term scenario, Ethernet technology is introduced directly into the Node
B in order to bring a cost-effective way to transport high amounts of data traffic. This
implies a significant step forward in order to remove legacy leased lines and use the
own operator Local Loop Unbundling (LLU) solutions. In this very first step, though, E1
connections will still be in place, but kept to the minimum required for them to pay off
the initial investment. This situation has driven the operators to deploy the so
mentioned hybrid backhaul solution. Again, depending on the way the operator
chooses to split the traffic, two interesting configurations come to the picture:
Pure voice/data split: RT DCH (R99) over NxE1 and NRT DCH (R99) + HSPA over
Ethernet.
R99/HSPA split: RT/NRT DCH (R99) over NxE1 and HSPA over Ethernet.
NODE B
Single E1 or 2 E1
IMA group. R99 traffic
up to 2 – 4 Mbps
Ethernet
PDH microwave
G.SHDSLbis EFM /
ADSL2+
DSLAM
Figure 63. Medium trend scenario. Example of R99/HSPA traffic split at Node B site. Note that Ethernet interfaces are available in the Node B, hence increasing the capacity for HSPA. New technologies such as G.SHDSLbis can boost HSUPA rates up to 11 Mbps (2 x G.SHDSLbis pairs) – 16 Mbps (3 x G.SHDSLbis pairs) and ADSL2+ may offer HSDPA rates up to 20 Mbps (1 x ADSL2+ pair) – 40 Mbps (2 x ADSL2+ pairs).
Long Term Scenario
Finally, the long term scenario converges onto a full IP-based backhaul. Since
ATM is not present any more, direct Ethernet connections from the Node B can be used
and legacy E1 connections removed. In this case, all the advantages associated to IP
networking can be applied to the transport backhaul. For example, as it will be shown in
section 4.2.3 Testbed configuration and settings, traffic can be separated per Virtual
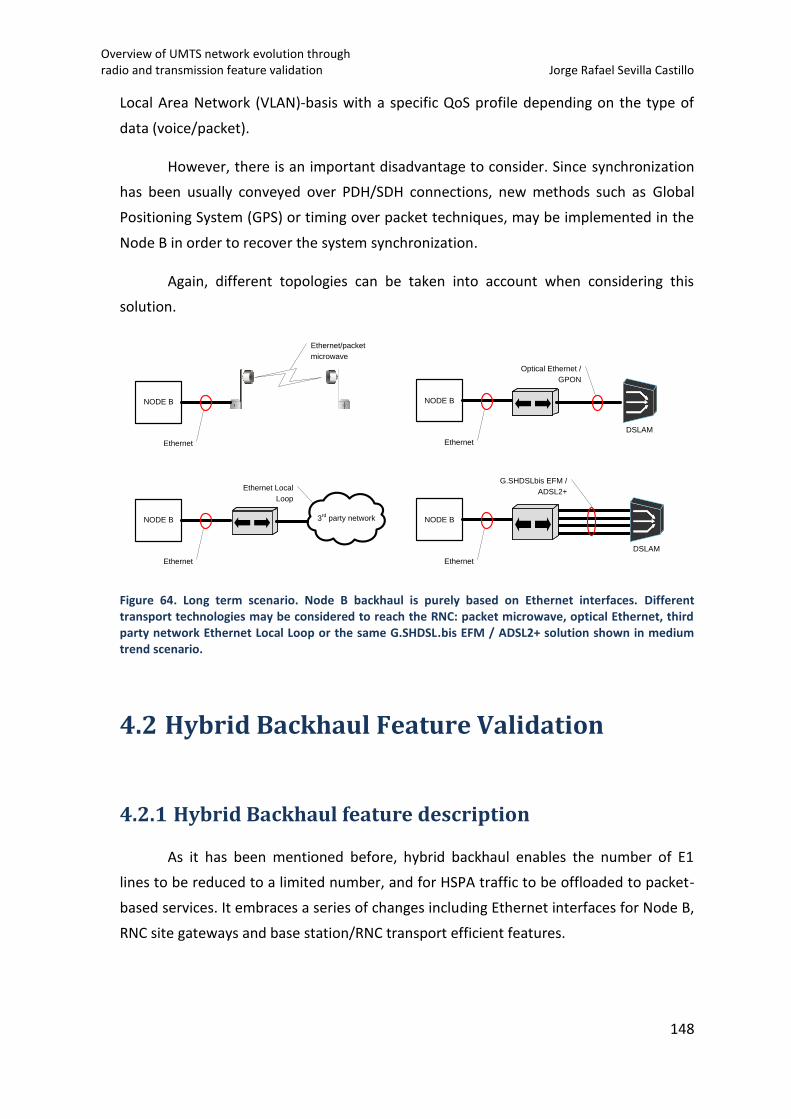
Overview of UMTS network evolution through radio and transmission feature validation Jorge Rafael Sevilla Castillo
148
Local Area Network (VLAN)-basis with a specific QoS profile depending on the type of
data (voice/packet).
However, there is an important disadvantage to consider. Since synchronization
has been usually conveyed over PDH/SDH connections, new methods such as Global
Positioning System (GPS) or timing over packet techniques, may be implemented in the
Node B in order to recover the system synchronization.
Again, different topologies can be taken into account when considering this
solution.
Ethernet
Ethernet/packet
microwave
Ethernet
NODE B
G.SHDSLbis EFM /
ADSL2+
DSLAM
NODE B 3rd
party network
Ethernet Local
Loop
NODE B
Ethernet
Optical Ethernet /
GPON
DSLAM
NODE B
Ethernet
Figure 64. Long term scenario. Node B backhaul is purely based on Ethernet interfaces. Different transport technologies may be considered to reach the RNC: packet microwave, optical Ethernet, third party network Ethernet Local Loop or the same G.SHDSL.bis EFM / ADSL2+ solution shown in medium trend scenario.
4.2 Hybrid Backhaul Feature Validation
4.2.1 Hybrid Backhaul feature description
As it has been mentioned before, hybrid backhaul enables the number of E1
lines to be reduced to a limited number, and for HSPA traffic to be offloaded to packet-
based services. It embraces a series of changes including Ethernet interfaces for Node B,
RNC site gateways and base station/RNC transport efficient features.
Overview of UMTS network evolution through radio and transmission feature validation Jorge Rafael Sevilla Castillo
149
The case to be covered in this study is based on offloading only the HSPA portion
of the IuB traffic. It may result in a number of benefits:
Relaxed QoS: HSPA tolerates better both delay and packet loss. In case of HSDPA
is in the Node B where the packet scheduling takes place. The RNC only has to
control Node B buffer status, making the functionality less time critical.
Relaxed restoration time: if the packet service is disrupted due to transmission
issues in the offload path, only HSPA becomes unavailable, while dedicated
traffic channel (DCH) services continue and Node B maintains normal operation.
High-quality Node B synchronization and secure OAM: TDM link is still active to
distribute the clock reference and supply OAM services to the different Node B.
Live network wise, DSL (Digital Subscriber Line) fits well in these properties.
Wholesale DSL products are widely available and service can be provided also at remote
locations. The wholesale supplier provides Point-to-Multipoint connectivity between
base station sites and RNC sites. Last mile connections are physically based on
Asymmetrical Digital Subscriber Line (ADSL), the aggregate traffic is passed to the
mobile network as an Ethernet trunk.
Fundamentals
Hybrid backhaul is based on IuB ATM service emulation over a packet-switched
network, according to the Pseudo Wire Emulation Edge to Edge specification (PWE3) of
the Internet Engineering Task Force (IETF)*.
One of the main advantages of this kind of system is that the ATM layer remains
intact, so all the processing in the RNC remains the same. The way the system deals with
it is further explained: traffic is first split into separated ATM Virtual Path Connections
(VPC) and Virtual Channel Connections (VCC). Both VPCs and VCCs are then mapped
onto different paths, being TDM or Ethernet at an external PWE3 gateway (in-build in
the Node B from an uplink perspective and external equipment, Tellabs 8630 router in
this case, needed from the RNC point of view). ATM cells going through the Ethernet
path are then concatenated, to become the payload of an Ethernet packet. This kind of
encapsulation has been specified by the IETF pseudo wire emulation edge-to-edge
(PWE3).
Overview of UMTS network evolution through radio and transmission feature validation Jorge Rafael Sevilla Castillo
150
In order to ensure robustness and to avoid packet loss across the transport
network, the traffic between the Node B and the PWE3 gateway is routed using Multi
Protocol Layer Switching (MPLS) pseudo wires.
MPLS is a highly scalable data-carrying mechanism whose purpose is to
encapsulate packets of various network protocols. In an MPLS network, data packets are
assigned labels. Packet-forwarding decisions are made based on the contents of this
label, without the need to examine the packet itself. This allows the operator to create
end-to-end circuits, called pseudo wires across this document, across any type of
transport medium, using any protocol. The primary benefit is to eliminate dependence
on a particular Data Link Layer technology such as ATM, Frame Relay, SONET or
Ethernet, and to eliminate the need for multiple Layer 2 networks to satisfy different
types of traffic. MPLS belongs to the family of packet-switched networks.
MPLS operates at an Open System Interconnection (OSI) model layer that is
generally considered to lie between Layer 2 (Data Link layer) and Layer 3 (Network
Layer).
The label mechanism used for the Node B and PWE3 gateway to implement the
pseudo wire across the packet-switched network is detailed in section 4.2.3 Testbed
configuration and settings.
Concatenation factor, packetization timer and frame structure
Two of the cornerstones of the hybrid backhaul solution, and primarily the ATM
emulation over Ethernet, are the concatenation factor and the packetization timer
parameters.
The concatenation factor is the amount of ATM cells introduced in an Ethernet
packet. In order to avoid IP fragmentation issues, up to 28 cells can be concatenated in
one packet, leading to an Ethernet frame of 1510 bytes (1484 bytes of ATM data, taking
into account 53 bytes per ATM cell). The efficiency increases exponentially with the
number of ATM cells per pseudo wire packet (see Figure 65).
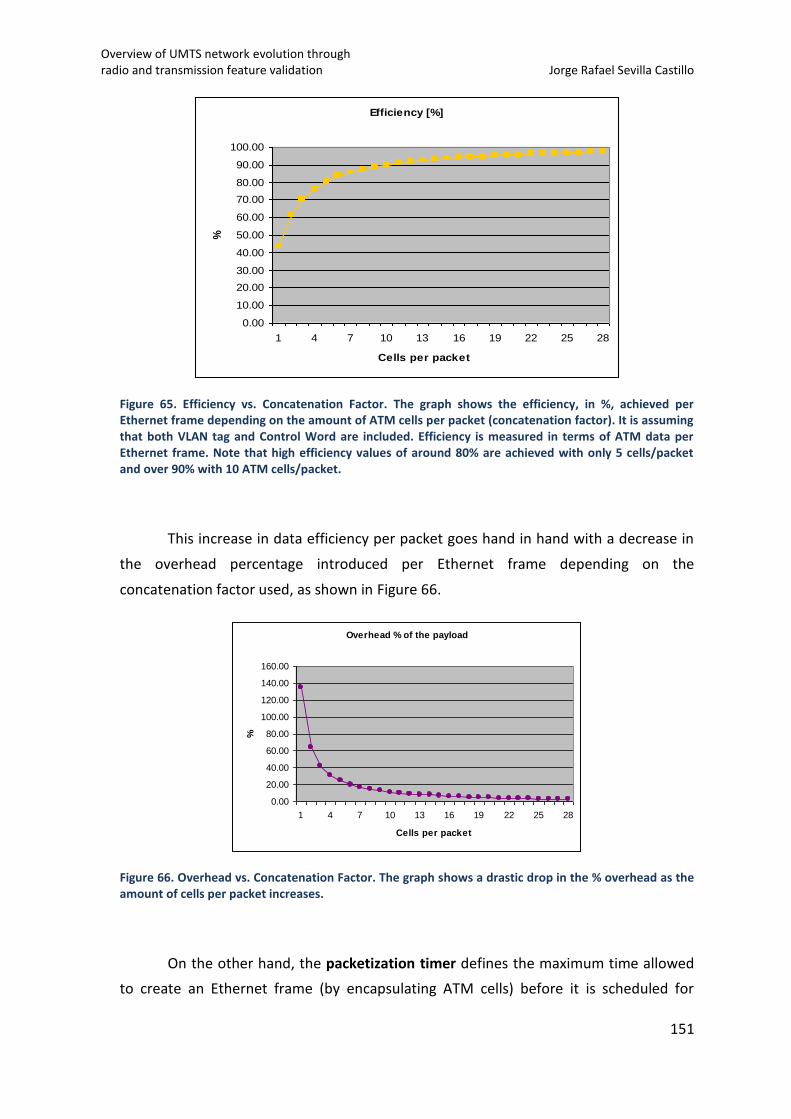
Overview of UMTS network evolution through radio and transmission feature validation Jorge Rafael Sevilla Castillo
151
Figure 65. Efficiency vs. Concatenation Factor. The graph shows the efficiency, in %, achieved per Ethernet frame depending on the amount of ATM cells per packet (concatenation factor). It is assuming that both VLAN tag and Control Word are included. Efficiency is measured in terms of ATM data per Ethernet frame. Note that high efficiency values of around 80% are achieved with only 5 cells/packet and over 90% with 10 ATM cells/packet.
This increase in data efficiency per packet goes hand in hand with a decrease in
the overhead percentage introduced per Ethernet frame depending on the
concatenation factor used, as shown in Figure 66.
Figure 66. Overhead vs. Concatenation Factor. The graph shows a drastic drop in the % overhead as the amount of cells per packet increases.
On the other hand, the packetization timer defines the maximum time allowed
to create an Ethernet frame (by encapsulating ATM cells) before it is scheduled for
Efficiency [%]
0.00
10.00
20.00
30.00
40.00
50.00
60.00
70.00
80.00
90.00
100.00
1 4 7 10 13 16 19 22 25 28
Cells per packet
%
Overhead % of the payload
0.00
20.00
40.00
60.00
80.00
100.00
120.00
140.00
160.00
1 4 7 10 13 16 19 22 25 28
Cells per packet
%
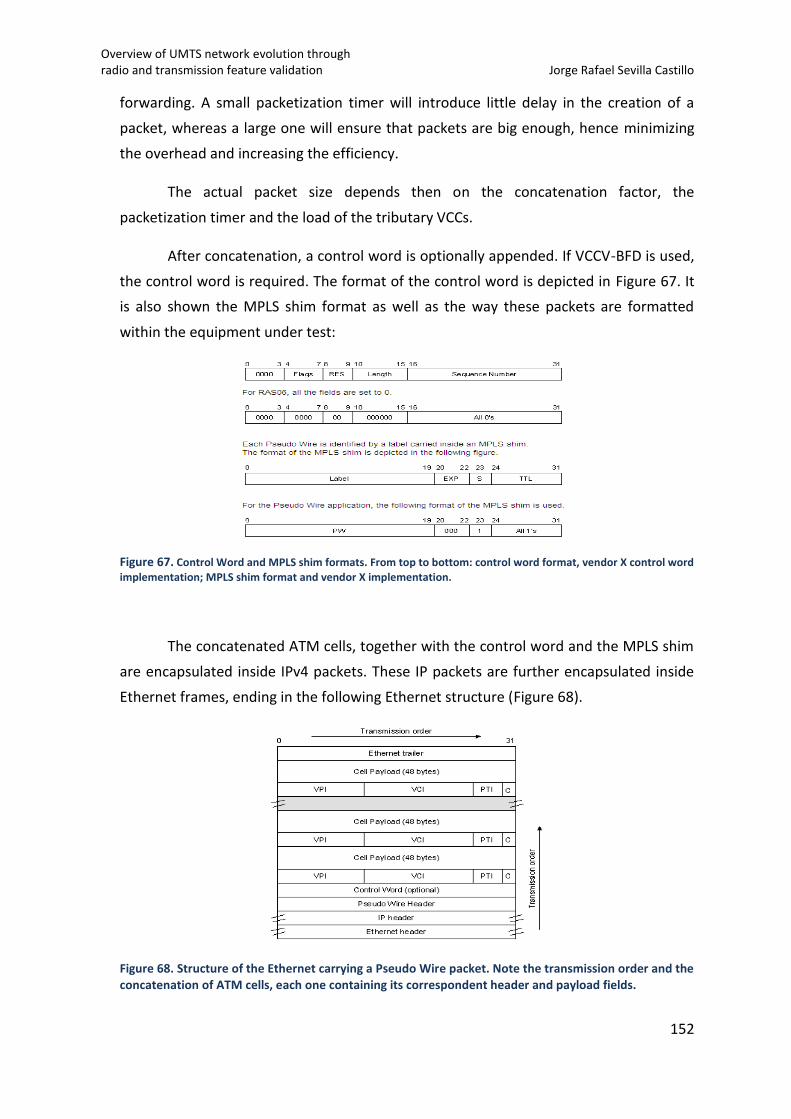
Overview of UMTS network evolution through radio and transmission feature validation Jorge Rafael Sevilla Castillo
152
forwarding. A small packetization timer will introduce little delay in the creation of a
packet, whereas a large one will ensure that packets are big enough, hence minimizing
the overhead and increasing the efficiency.
The actual packet size depends then on the concatenation factor, the
packetization timer and the load of the tributary VCCs.
After concatenation, a control word is optionally appended. If VCCV-BFD is used,
the control word is required. The format of the control word is depicted in Figure 67. It
is also shown the MPLS shim format as well as the way these packets are formatted
within the equipment under test:
Figure 67. Control Word and MPLS shim formats. From top to bottom: control word format, vendor X control word implementation; MPLS shim format and vendor X implementation.
The concatenated ATM cells, together with the control word and the MPLS shim
are encapsulated inside IPv4 packets. These IP packets are further encapsulated inside
Ethernet frames, ending in the following Ethernet structure (Figure 68).
Figure 68. Structure of the Ethernet carrying a Pseudo Wire packet. Note the transmission order and the concatenation of ATM cells, each one containing its correspondent header and payload fields.
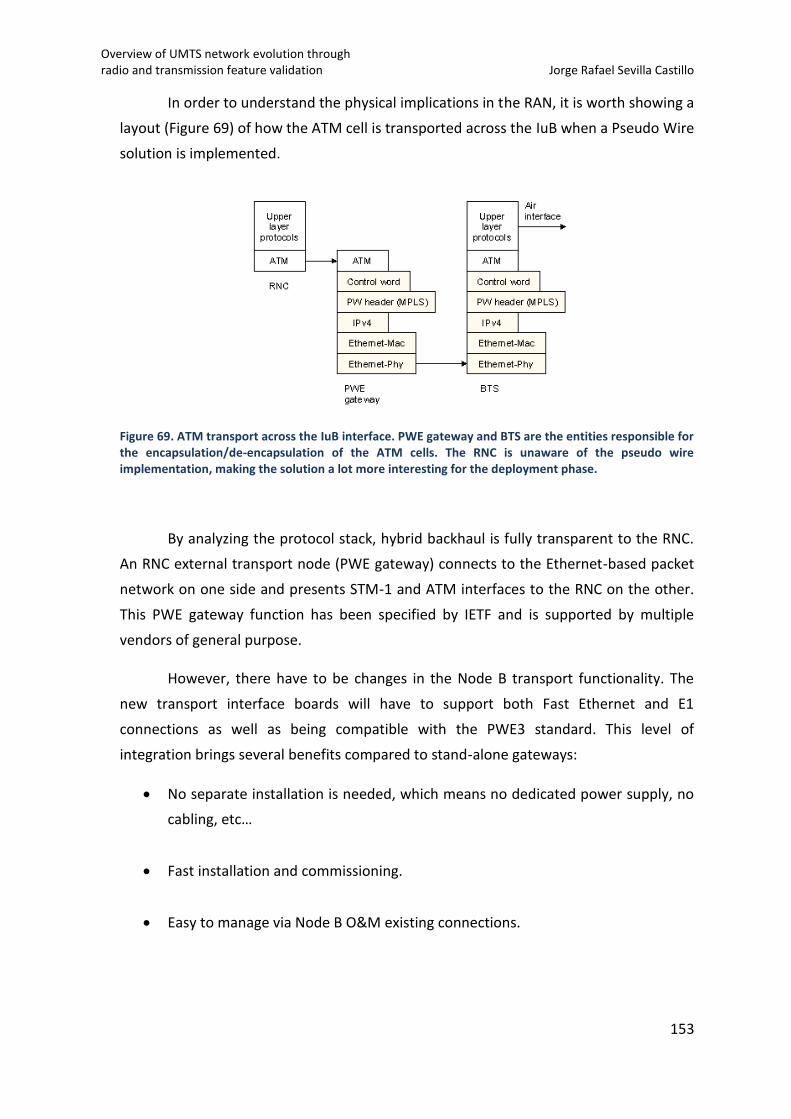
Overview of UMTS network evolution through radio and transmission feature validation Jorge Rafael Sevilla Castillo
153
In order to understand the physical implications in the RAN, it is worth showing a
layout (Figure 69) of how the ATM cell is transported across the IuB when a Pseudo Wire
solution is implemented.
Figure 69. ATM transport across the IuB interface. PWE gateway and BTS are the entities responsible for the encapsulation/de-encapsulation of the ATM cells. The RNC is unaware of the pseudo wire implementation, making the solution a lot more interesting for the deployment phase.
By analyzing the protocol stack, hybrid backhaul is fully transparent to the RNC.
An RNC external transport node (PWE gateway) connects to the Ethernet-based packet
network on one side and presents STM-1 and ATM interfaces to the RNC on the other.
This PWE gateway function has been specified by IETF and is supported by multiple
vendors of general purpose.
However, there have to be changes in the Node B transport functionality. The
new transport interface boards will have to support both Fast Ethernet and E1
connections as well as being compatible with the PWE3 standard. This level of
integration brings several benefits compared to stand-alone gateways:
No separate installation is needed, which means no dedicated power supply, no
cabling, etc…
Fast installation and commissioning.
Easy to manage via Node B O&M existing connections.
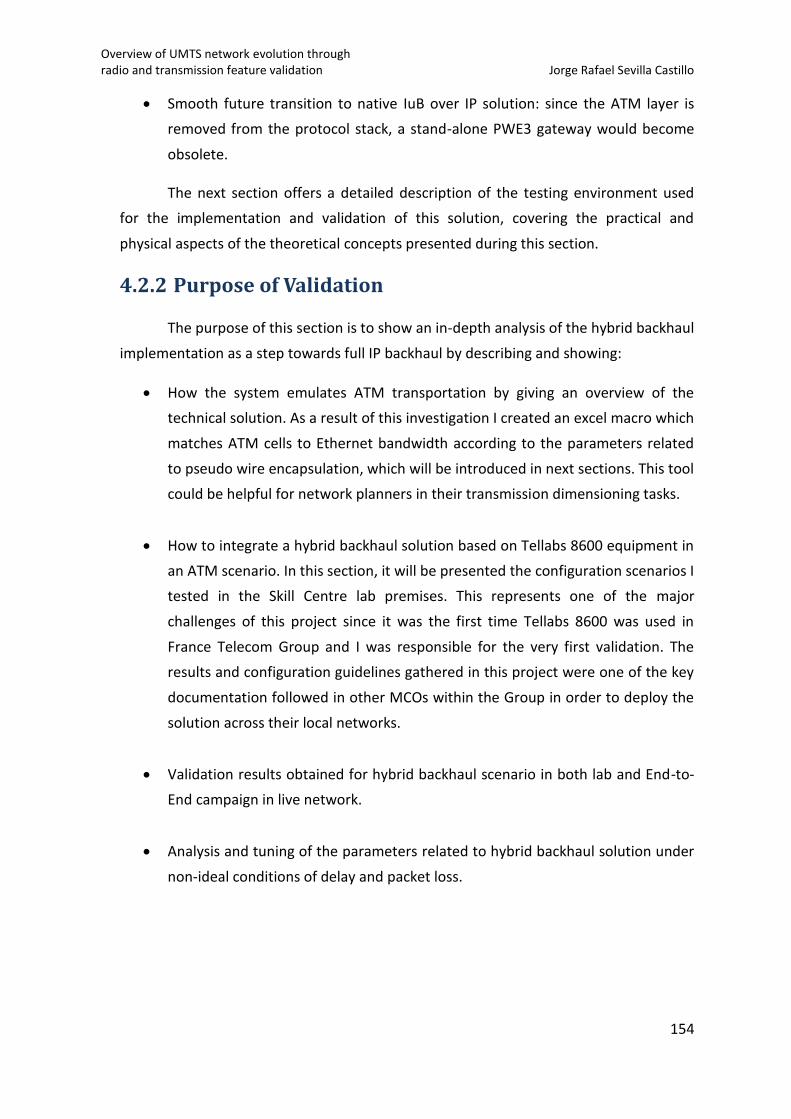
Overview of UMTS network evolution through radio and transmission feature validation Jorge Rafael Sevilla Castillo
154
Smooth future transition to native IuB over IP solution: since the ATM layer is
removed from the protocol stack, a stand-alone PWE3 gateway would become
obsolete.
The next section offers a detailed description of the testing environment used
for the implementation and validation of this solution, covering the practical and
physical aspects of the theoretical concepts presented during this section.
4.2.2 Purpose of Validation
The purpose of this section is to show an in-depth analysis of the hybrid backhaul
implementation as a step towards full IP backhaul by describing and showing:
How the system emulates ATM transportation by giving an overview of the
technical solution. As a result of this investigation I created an excel macro which
matches ATM cells to Ethernet bandwidth according to the parameters related
to pseudo wire encapsulation, which will be introduced in next sections. This tool
could be helpful for network planners in their transmission dimensioning tasks.
How to integrate a hybrid backhaul solution based on Tellabs 8600 equipment in
an ATM scenario. In this section, it will be presented the configuration scenarios I
tested in the Skill Centre lab premises. This represents one of the major
challenges of this project since it was the first time Tellabs 8600 was used in
France Telecom Group and I was responsible for the very first validation. The
results and configuration guidelines gathered in this project were one of the key
documentation followed in other MCOs within the Group in order to deploy the
solution across their local networks.
Validation results obtained for hybrid backhaul scenario in both lab and End-to-
End campaign in live network.
Analysis and tuning of the parameters related to hybrid backhaul solution under
non-ideal conditions of delay and packet loss.
Overview of UMTS network evolution through radio and transmission feature validation Jorge Rafael Sevilla Castillo
155
4.2.3 Testbed Configuration and Settings
In addition to the before mentioned RAN network elements (RNC and Node B),
the whole end-to-end scenario including UEs, laptops, Core Network elements,
interfaces, additional routers, switches and servers should support the preferred new
features in terms of configuration, licenses and available bandwidth. The following
subsections list all the elements used during this validation phase.
Requirements
The following network hardware and software was used during testbed validation:
1. RNC with RAS06 RN3.0 software level.
2. Transmission and Transport:
16 Mbps user plane capacity in the IuB (TDM link, 2 x E1 IMA group, and
Fast Ethernet connection).
Core Network and application server connectivity not limiting testing (i.e.
SIM QoS profile provisioned in the HLR supporting at least a DL speed of
7.2 Mbps).
Hybrid backhaul feature activated in RNC.
Macro Indoor Node B (UltraSite) equipped with IFUH transmission card
for ATM Cross-Connect (AXC). IFUH provides two Fast Ethernet interfaces
and one Gigabit Ethernet interface. It requires only one slot in the AXC
subrack and is fully compatible with AXUA and AXUB type of ATM Cross-
Connection Units. TDM links are routed via IFUD E1 transport interface.
Distributed Indoor Node B (Flexi) equipped with FTJA. FTJA transmission
module provides two Fast Ethernet interfaces, one Gigabit Ethernet
interface and four E1 interfaces.
External PWE3 gateway: Tellabs 8630 router.
Overview of UMTS network evolution through radio and transmission feature validation Jorge Rafael Sevilla Castillo
156
3. Node B (Indoor macro and distributed solution) with the following software levels:
NODE B: RAS06 WN4.0 or newest.
AXC: RAS06 C3.0 or newest (Indoor macro only).
4. Other Dependencies:
CS core network:
MSC with M13 software level or newest.
MGW with U3B software level or newest.
PS core network:
SGSN with SGN3 software level or newest.
O&M network:
NetAct management system with OSS4.2 software level or
newest.
GSM network:
BSC with S11.5 or S12 software level.
Test Tools
Several tools are required for this validation: UEs, USB dongles, protocol
analyzers, laptops, antenna line devices such as RF attenuators and feeders, and cabling
(Fast Ethernet cables, coaxial cables and optical fibers). The detail for each one of them
is described below:
1. R99 WCDMA UEs
Non-Nokia models used in the operator’s network: Qualcomm chipset 6275, e.g. Samsung SGH-Z630.
Nokia N95
2. UEs with E-DCH (HSUPA) enabled Cat 4-5 / HSDPA Cat 7-10 (16QAM + 10/15 codes).
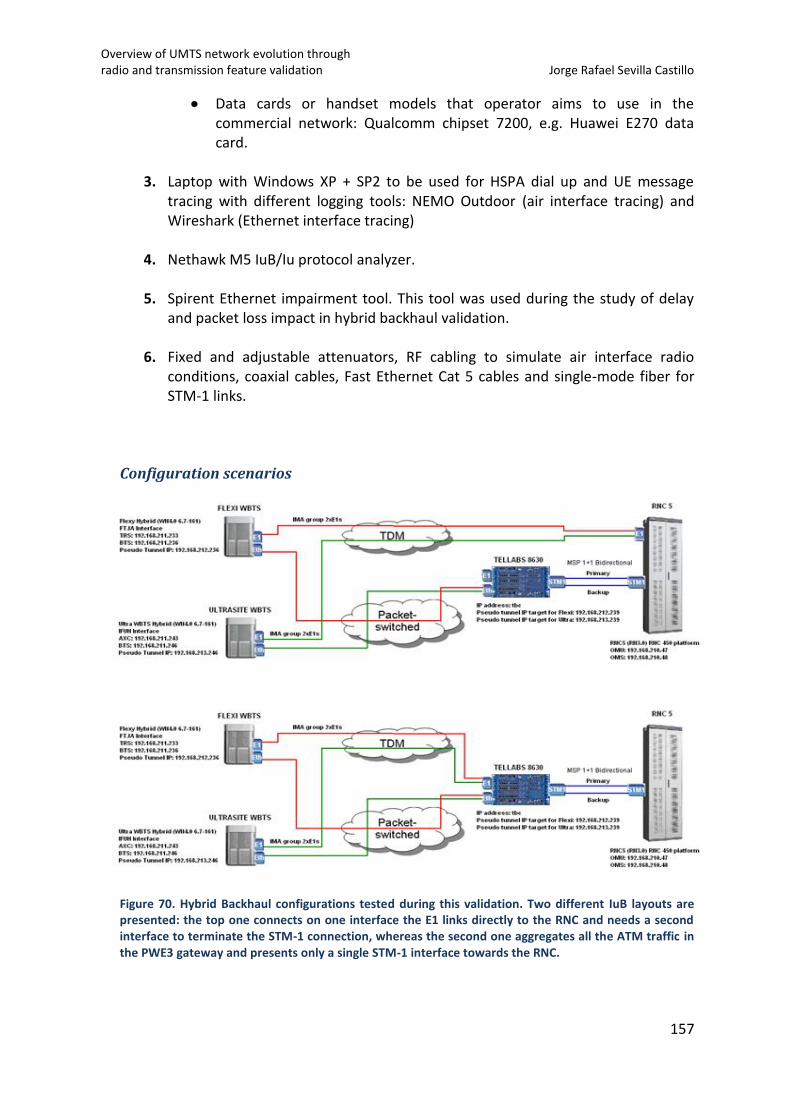
Overview of UMTS network evolution through radio and transmission feature validation Jorge Rafael Sevilla Castillo
157
Data cards or handset models that operator aims to use in the commercial network: Qualcomm chipset 7200, e.g. Huawei E270 data card.
3. Laptop with Windows XP + SP2 to be used for HSPA dial up and UE message
tracing with different logging tools: NEMO Outdoor (air interface tracing) and Wireshark (Ethernet interface tracing)
4. Nethawk M5 IuB/Iu protocol analyzer.
5. Spirent Ethernet impairment tool. This tool was used during the study of delay and packet loss impact in hybrid backhaul validation.
6. Fixed and adjustable attenuators, RF cabling to simulate air interface radio conditions, coaxial cables, Fast Ethernet Cat 5 cables and single-mode fiber for STM-1 links.
Configuration scenarios
Figure 70. Hybrid Backhaul configurations tested during this validation. Two different IuB layouts are presented: the top one connects on one interface the E1 links directly to the RNC and needs a second interface to terminate the STM-1 connection, whereas the second one aggregates all the ATM traffic in the PWE3 gateway and presents only a single STM-1 interface towards the RNC.
Overview of UMTS network evolution through radio and transmission feature validation Jorge Rafael Sevilla Castillo
158
Two different configurations of Hybrid Backhaul are tested (see Figure 70). In
both cases, HSPA is offloaded from the TDM links and is conveyed over fast Ethernet
media until the PWE3 gateway (Tellabs 8630), where the transport is converted again
into pure ATM and sent to the RNC’s Network Interface for SDH connections (NIS board)
via channelized STM-1.
However, since Tellabs 8630 has also the functionality of an ATM cross-
connector, TDM links can be either terminated directly into the RNC’s Network Interface
for PDH connections (NIP board) or cross-connected in Tellabs 8630 in order to combine
all the traffic into the same channelized STM-1 link towards the RNC.
The second option offers advantages in terms of connectivity. It can be more
cost-effective to aggregate TDM links and Fast Ethernet connections near the Node B
into one traffic gateway and make use of only STM-1 optical fiber infrastructure towards
the RNC rather than use parallel TDM and STM-1, raising the cost of the IuB link. In
addition, no more than one interface connection is needed in the RNC, so extra board
capacity is released.
Nonetheless, it is also worth mention that the first option can be more reliable in
terms of link failures produced by a malfunction of Tellabs 8630 router. In this case, all
the traffic could be easily routed back through the TDM links, causing no major impact
for both user and operator. So again, system robustness versus cost-efficiency comes to
light.
Redundancy configuration based on Multiplex Section Protection (MSP) scheme
In addition, note that in both cases the STM-1 link between the PWE3 gateway
and the RNC is duplicated. The purpose of that is to apply redundancy in the transport
node, to protect the link against possible failures on either the physical links or the
interface cards controlling the end points. After a bit of research on the link protection
mechanisms supported by both PWE3 gateway and RNC, SDH Multiplex Section
Protection 1+1 (MSP 1+1), defined in the standard ITU-T G.783, was chosen.
In the basic MSP functionality, the service line (primary link) is protected using a
secondary line (backup link) which is called the protection line: if an error occurs, for
instance a Loss of Signal (LOS), the protection mechanism switches over to the
protection line. In the variant MSP 1+1, the user traffic is simultaneously transmitted
Overview of UMTS network evolution through radio and transmission feature validation Jorge Rafael Sevilla Castillo
159
over the working and protection link in order to minimize the protection switching time,
which means that in the egress direction the traffic is copied in both sections. In the
reception direction, the selector is used to choose the traffic from either working or
protection sections. At the far end, the line delivering the signal in best conditions is the
selected one.
MSP protection scheme has two operation modes: the revertive and non-
revertive operational mode.
In the revertive mode, the traffic is switched back from the protecting link to the
working link once this has recovered from the fault. To prevent a frequent operation of
the protection switch because of an intermittent failure, the faulty section needs to
remain error-free for a fixed period of time before it is used again as the working
channel. This period is called Wait-to-Restore (WTR) time.
In the non-revertive mode, the traffic is not switched back to the other link once
the fault is solved. That means that non-revertive mode does not have a preferred
working link and switching will only happen upon failure detection.
Both operation modes have been tested in order to verify the most convenient
in terms of traffic drop and network element behavior (PWE3 gateway and RNC in this
case).
Transport network configuration
This section describes the steps followed for the configuration of a hybrid
backhaul network. Apart from the validation itself, this step was key in the development
of the project due to the intensive amount of concepts related to transport network and
the lack of existing guidelines to configure Tellabs 8630 equipment for this brand new
solution.
The main contents of this section are:
Tellabs 8630 configuration.
RAN transport commissioning: Node B and RNC.
In order to diversify the nature of this validation, two different transport
configuration strategies are used and implemented separately on each type of Node B,
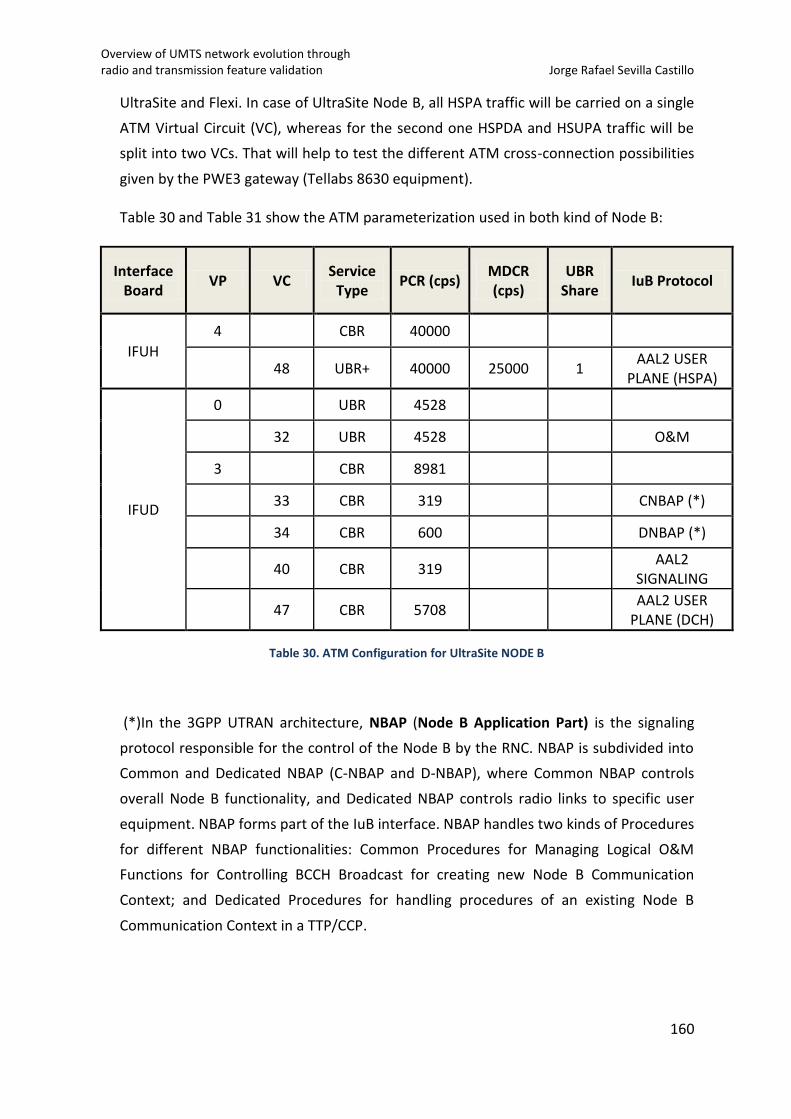
Overview of UMTS network evolution through radio and transmission feature validation Jorge Rafael Sevilla Castillo
160
UltraSite and Flexi. In case of UltraSite Node B, all HSPA traffic will be carried on a single
ATM Virtual Circuit (VC), whereas for the second one HSPDA and HSUPA traffic will be
split into two VCs. That will help to test the different ATM cross-connection possibilities
given by the PWE3 gateway (Tellabs 8630 equipment).
Table 30 and Table 31 show the ATM parameterization used in both kind of Node B:
Interface Board
VP VC Service
Type PCR (cps)
MDCR (cps)
UBR Share
IuB Protocol
IFUH
4 CBR 40000
48 UBR+ 40000 25000 1 AAL2 USER
PLANE (HSPA)
IFUD
0 UBR 4528
32 UBR 4528 O&M
3 CBR 8981
33 CBR 319 CNBAP (*)
34 CBR 600 DNBAP (*)
40 CBR 319 AAL2
SIGNALING
47 CBR 5708 AAL2 USER
PLANE (DCH)
Table 30. ATM Configuration for UltraSite NODE B
(*)In the 3GPP UTRAN architecture, NBAP (Node B Application Part) is the signaling
protocol responsible for the control of the Node B by the RNC. NBAP is subdivided into
Common and Dedicated NBAP (C-NBAP and D-NBAP), where Common NBAP controls
overall Node B functionality, and Dedicated NBAP controls radio links to specific user
equipment. NBAP forms part of the IuB interface. NBAP handles two kinds of Procedures
for different NBAP functionalities: Common Procedures for Managing Logical O&M
Functions for Controlling BCCH Broadcast for creating new Node B Communication
Context; and Dedicated Procedures for handling procedures of an existing Node B
Communication Context in a TTP/CCP.
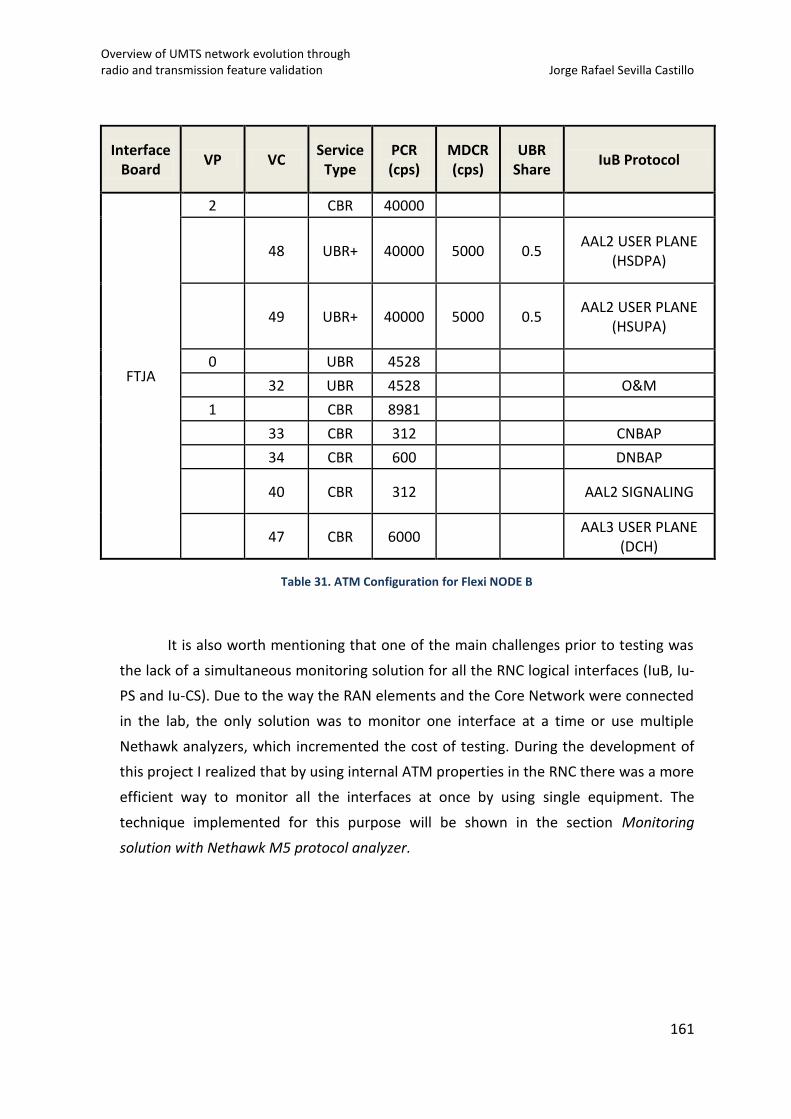
Overview of UMTS network evolution through radio and transmission feature validation Jorge Rafael Sevilla Castillo
161
Interface Board
VP VC Service
Type PCR (cps)
MDCR (cps)
UBR Share
IuB Protocol
FTJA
2 CBR 40000
48 UBR+ 40000 5000 0.5 AAL2 USER PLANE
(HSDPA)
49 UBR+ 40000 5000 0.5 AAL2 USER PLANE
(HSUPA)
0 UBR 4528
32 UBR 4528 O&M
1 CBR 8981
33 CBR 312 CNBAP
34 CBR 600 DNBAP
40 CBR 312 AAL2 SIGNALING
47 CBR 6000 AAL3 USER PLANE
(DCH)
Table 31. ATM Configuration for Flexi NODE B
It is also worth mentioning that one of the main challenges prior to testing was
the lack of a simultaneous monitoring solution for all the RNC logical interfaces (IuB, Iu-
PS and Iu-CS). Due to the way the RAN elements and the Core Network were connected
in the lab, the only solution was to monitor one interface at a time or use multiple
Nethawk analyzers, which incremented the cost of testing. During the development of
this project I realized that by using internal ATM properties in the RNC there was a more
efficient way to monitor all the interfaces at once by using single equipment. The
technique implemented for this purpose will be shown in the section Monitoring
solution with Nethawk M5 protocol analyzer.
Overview of UMTS network evolution through radio and transmission feature validation Jorge Rafael Sevilla Castillo
162
Configuration in Tellabs 8630 (PWE3 gateway)
RNC did not support ATM over Ethernet at the time of the validation. Therefore,
Tellabs 8630 Access Switch, emulating PWE3 gateway function, was used. In this
network element of the IuB is where the traffic conveyed over PWE3 tunnel is converted
into pure ATM and transferred to the RNC via STM-1 (in second configuration of Figure
10, traffic carried over E1 links is merged into the STM-1 as well).
Performance of ATM over Ethernet traffic depends basically on two parameters
involved in the creation of layer 2 Ethernet packets as explained in the section 4.2.1
Concatenation factor, packetization timer and frame structure:
Concatenation Factor (CF): this parameter refers to the maximum number of
ATM cells per packet. It can be configured between 0-28 cells, leading to an
Ethernet frame of 1510 bytes.
Packetization Timer (PT): this parameter refers to the maximum time to wait for
ATM cells to be introduced into the Ethernet packet before it is transmitted.
As we have seen already, there is a trade-off between both parameters in order
to achieve better efficiency in the IuB interface.
In this very first stage, it is tested an ideal scenario in which delay, packet loss
and jitter are not considered, so fixed values for concatenation factor (CF = 26) and
packetization timer (PT = 5000µs) are used.
Second step of the testing phase will be focused on finding the appropriate
combination of CF and PT in non-ideal conditions. It will be achieved by using an
Ethernet impairment tool in order to control the delay, packet loss and jitter variables
affecting the communication across the Ethernet connection.
Physical interfaces and Command Line Interface (CLI) configuration
In order to understand the syntax used during the configuration of Tellabs 8630
for the hybrid backhaul design, a layout of its physical structure is presented in Figure
71.
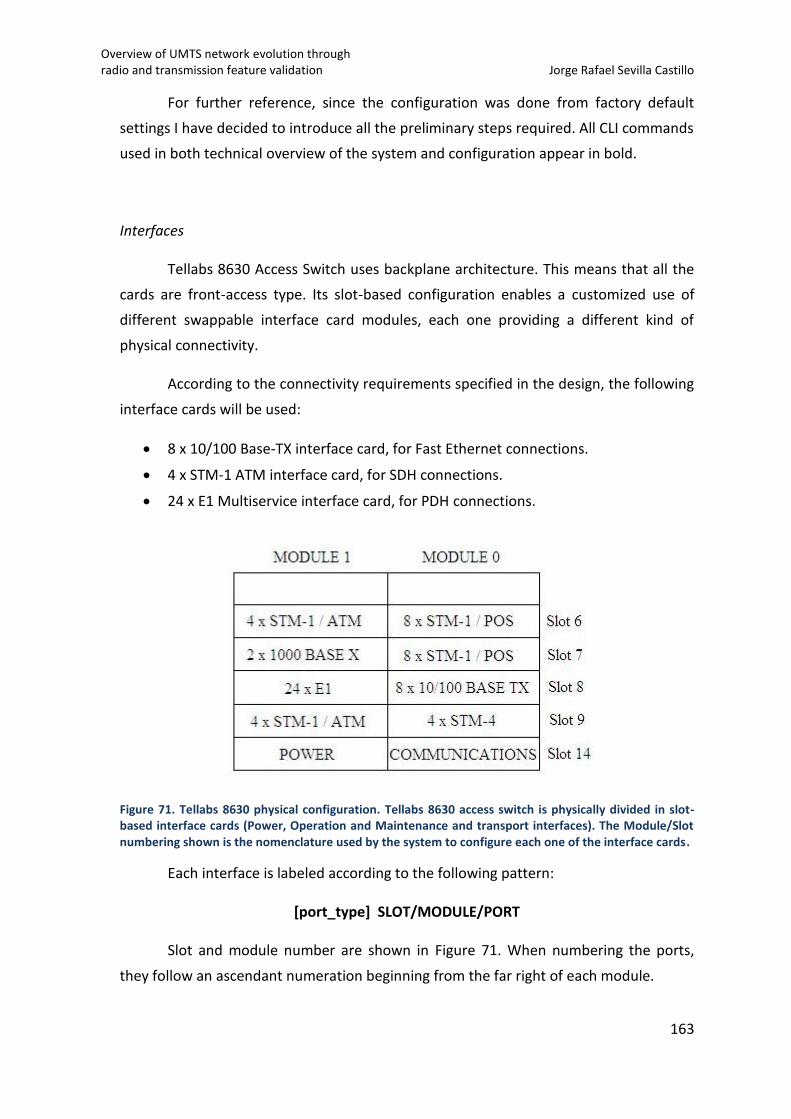
Overview of UMTS network evolution through radio and transmission feature validation Jorge Rafael Sevilla Castillo
163
For further reference, since the configuration was done from factory default
settings I have decided to introduce all the preliminary steps required. All CLI commands
used in both technical overview of the system and configuration appear in bold.
Interfaces
Tellabs 8630 Access Switch uses backplane architecture. This means that all the
cards are front-access type. Its slot-based configuration enables a customized use of
different swappable interface card modules, each one providing a different kind of
physical connectivity.
According to the connectivity requirements specified in the design, the following
interface cards will be used:
8 x 10/100 Base-TX interface card, for Fast Ethernet connections.
4 x STM-1 ATM interface card, for SDH connections.
24 x E1 Multiservice interface card, for PDH connections.
Figure 71. Tellabs 8630 physical configuration. Tellabs 8630 access switch is physically divided in slot-based interface cards (Power, Operation and Maintenance and transport interfaces). The Module/Slot numbering shown is the nomenclature used by the system to configure each one of the interface cards.
Each interface is labeled according to the following pattern:
[port_type] SLOT/MODULE/PORT
Slot and module number are shown in Figure 71. When numbering the ports,
they follow an ascendant numeration beginning from the far right of each module.
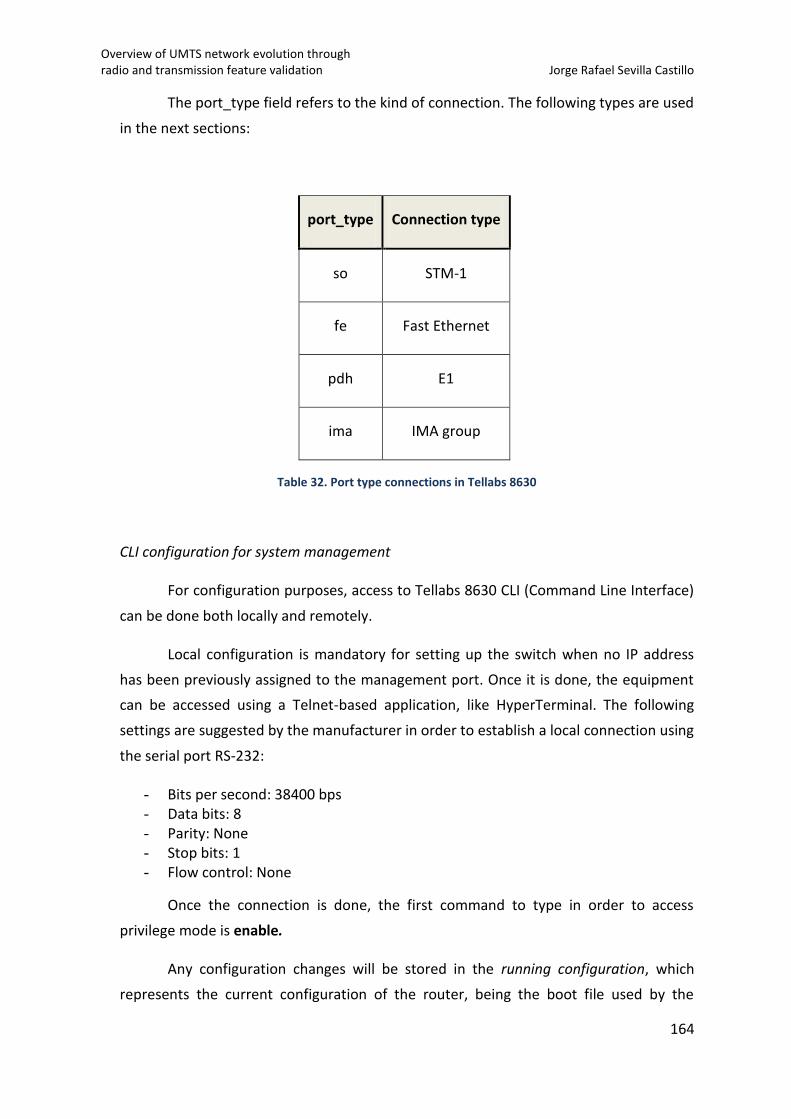
Overview of UMTS network evolution through radio and transmission feature validation Jorge Rafael Sevilla Castillo
164
The port_type field refers to the kind of connection. The following types are used
in the next sections:
port_type Connection type
so STM-1
fe Fast Ethernet
pdh E1
ima IMA group
Table 32. Port type connections in Tellabs 8630
CLI configuration for system management
For configuration purposes, access to Tellabs 8630 CLI (Command Line Interface)
can be done both locally and remotely.
Local configuration is mandatory for setting up the switch when no IP address
has been previously assigned to the management port. Once it is done, the equipment
can be accessed using a Telnet-based application, like HyperTerminal. The following
settings are suggested by the manufacturer in order to establish a local connection using
the serial port RS-232:
- Bits per second: 38400 bps - Data bits: 8 - Parity: None - Stop bits: 1 - Flow control: None
Once the connection is done, the first command to type in order to access
privilege mode is enable.
Any configuration changes will be stored in the running configuration, which
represents the current configuration of the router, being the boot file used by the
Overview of UMTS network evolution through radio and transmission feature validation Jorge Rafael Sevilla Castillo
165
system after each restart. It means that all the commands introduced take immediate
effect.
Running configuration can be inspected with the command show running config
in any command access mode (see scheme in Figure 72).
Before starting any configuration procedure it is advisable to assign an IP address
in order to work remotely. The following sequence of commands shows the procedure
followed:
TELLABS>ena
TELLABS#configure terminal //abbreviate terminology is accepted.
Equivalent command will be conf t
TELLABS(config)#interface mfe 14/0 //Refers to management fast Ethernet
port located in slot 14 – module 0.
TELLABS(cfg-if[mfe14/0])#no shutdown //whilst shutdown typed on its own
shuts down the IP interface (signal is cut between layers 2 and 3), by
adding no at the beginning of the command, the contrary effect is
achieved.
TELLABS(cfg-if[mfe14/0])#ip address 192.168.210.35/27
Initial H/W and S/W configuration
To move into internal configuration steps, the internal logic architecture might
be previously understood. Each slot is provided with an internal flash memory
containing the software needed to control the corresponding unit. The master unit is
located in slot 14 and contains both Ethernet RJ-45 and serial RS-232 management
ports.
A given H/W and S/W configuration of Tellabs 8630 is called snapshot. It can be
stored into the flash memory of the master unit. Different snapshot files can be
generated, allowing the creation of fallback environments in case the current
configuration gets corrupted.
The following commands are useful when managing snapshots and installing
new hardware/software into the equipment:
Overview of UMTS network evolution through radio and transmission feature validation Jorge Rafael Sevilla Castillo
166
Creation/removal of running-configuration and recognition of installed hardware:
- Creation: snapshot-config create flash: [FILE_NAME]
- Deletion: snapshot-config delete flash: [FILE_NAME]
- H/W reset and recognition: hw-inventory add-all-units clean-start etsi
- Restore the desired snapshot: snapshot-config restore
flash:[FILE_NAME]
- In case that an extra hardware unit is needed, it should be configured
individually. In the presented configuration, an extra slot (slot 6) is
needed to allow the redundancy required for MSP1+1 bidirectional
protection of the STM-1 link, since both working and protected links must
be allocated in different interface cards:
hw-inventory slot 6 add unit clean-start
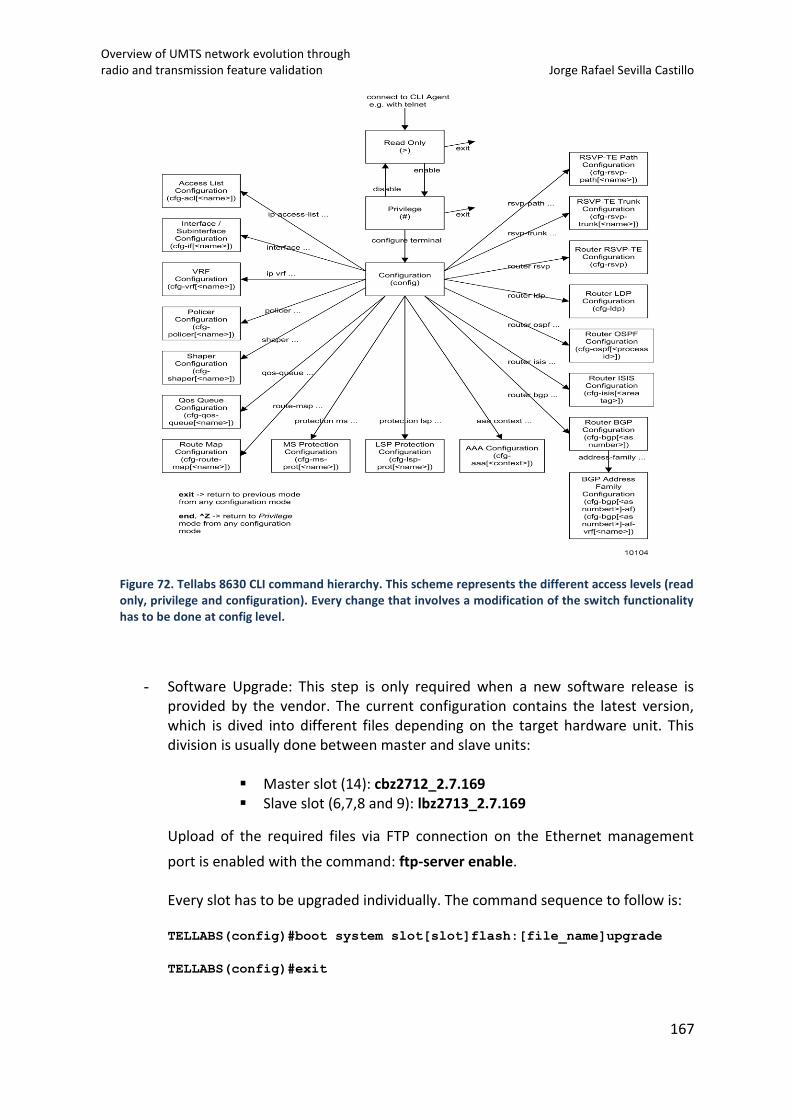
Overview of UMTS network evolution through radio and transmission feature validation Jorge Rafael Sevilla Castillo
167
Figure 72. Tellabs 8630 CLI command hierarchy. This scheme represents the different access levels (read only, privilege and configuration). Every change that involves a modification of the switch functionality has to be done at config level.
- Software Upgrade: This step is only required when a new software release is provided by the vendor. The current configuration contains the latest version, which is dived into different files depending on the target hardware unit. This division is usually done between master and slave units:
Master slot (14): cbz2712_2.7.169 Slave slot (6,7,8 and 9): lbz2713_2.7.169
Upload of the required files via FTP connection on the Ethernet management
port is enabled with the command: ftp-server enable.
Every slot has to be upgraded individually. The command sequence to follow is:
TELLABS(config)#boot system slot[slot]flash:[file_name]upgrade
TELLABS(config)#exit
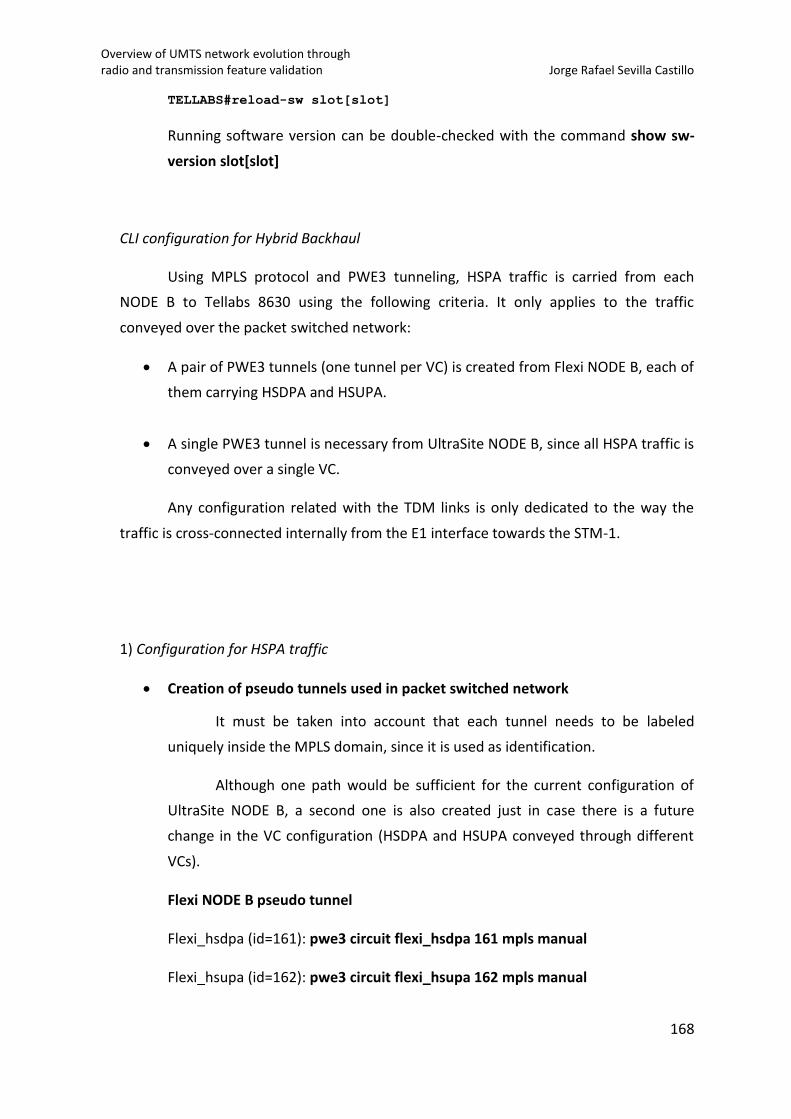
Overview of UMTS network evolution through radio and transmission feature validation Jorge Rafael Sevilla Castillo
168
TELLABS#reload-sw slot[slot]
Running software version can be double-checked with the command show sw-
version slot[slot]
CLI configuration for Hybrid Backhaul
Using MPLS protocol and PWE3 tunneling, HSPA traffic is carried from each
NODE B to Tellabs 8630 using the following criteria. It only applies to the traffic
conveyed over the packet switched network:
A pair of PWE3 tunnels (one tunnel per VC) is created from Flexi NODE B, each of
them carrying HSDPA and HSUPA.
A single PWE3 tunnel is necessary from UltraSite NODE B, since all HSPA traffic is
conveyed over a single VC.
Any configuration related with the TDM links is only dedicated to the way the
traffic is cross-connected internally from the E1 interface towards the STM-1.
1) Configuration for HSPA traffic
Creation of pseudo tunnels used in packet switched network
It must be taken into account that each tunnel needs to be labeled
uniquely inside the MPLS domain, since it is used as identification.
Although one path would be sufficient for the current configuration of
UltraSite NODE B, a second one is also created just in case there is a future
change in the VC configuration (HSDPA and HSUPA conveyed through different
VCs).
Flexi NODE B pseudo tunnel
Flexi_hsdpa (id=161): pwe3 circuit flexi_hsdpa 161 mpls manual
Flexi_hsupa (id=162): pwe3 circuit flexi_hsupa 162 mpls manual
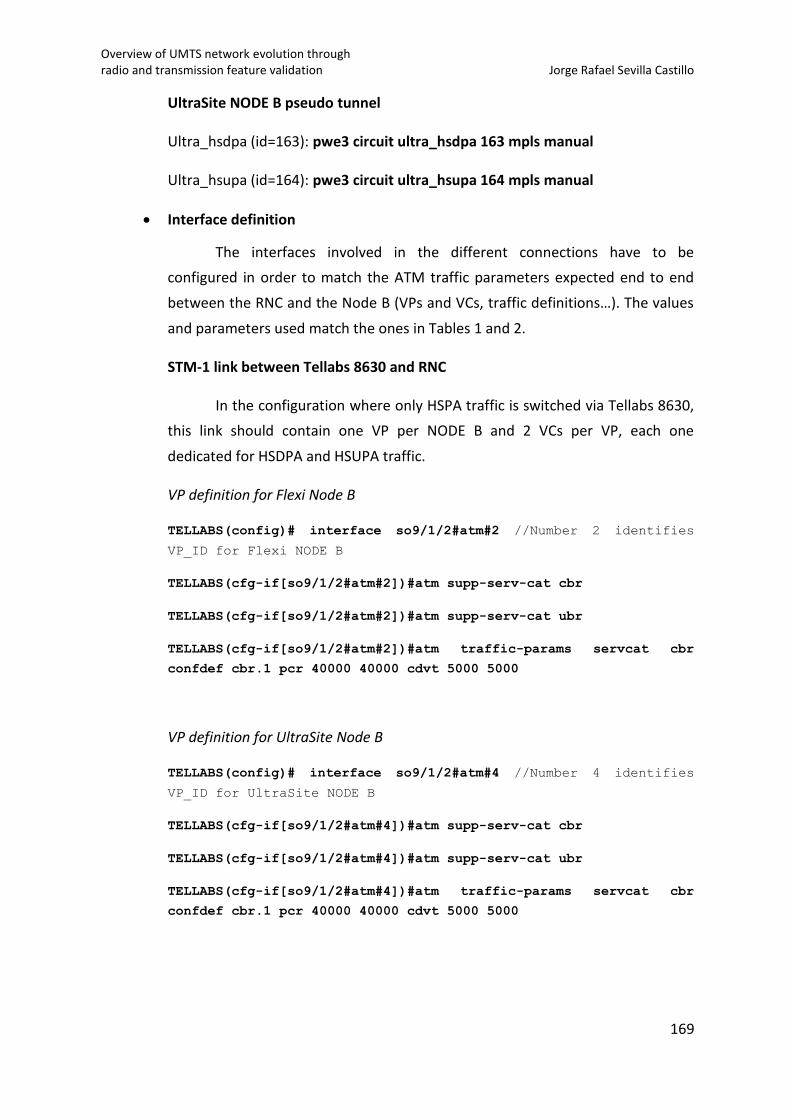
Overview of UMTS network evolution through radio and transmission feature validation Jorge Rafael Sevilla Castillo
169
UltraSite NODE B pseudo tunnel
Ultra_hsdpa (id=163): pwe3 circuit ultra_hsdpa 163 mpls manual
Ultra_hsupa (id=164): pwe3 circuit ultra_hsupa 164 mpls manual
Interface definition
The interfaces involved in the different connections have to be
configured in order to match the ATM traffic parameters expected end to end
between the RNC and the Node B (VPs and VCs, traffic definitions…). The values
and parameters used match the ones in Tables 1 and 2.
STM-1 link between Tellabs 8630 and RNC
In the configuration where only HSPA traffic is switched via Tellabs 8630,
this link should contain one VP per NODE B and 2 VCs per VP, each one
dedicated for HSDPA and HSUPA traffic.
VP definition for Flexi Node B
TELLABS(config)# interface so9/1/2#atm#2 //Number 2 identifies
VP_ID for Flexi NODE B
TELLABS(cfg-if[so9/1/2#atm#2])#atm supp-serv-cat cbr
TELLABS(cfg-if[so9/1/2#atm#2])#atm supp-serv-cat ubr
TELLABS(cfg-if[so9/1/2#atm#2])#atm traffic-params servcat cbr
confdef cbr.1 pcr 40000 40000 cdvt 5000 5000
VP definition for UltraSite Node B
TELLABS(config)# interface so9/1/2#atm#4 //Number 4 identifies
VP_ID for UltraSite NODE B
TELLABS(cfg-if[so9/1/2#atm#4])#atm supp-serv-cat cbr
TELLABS(cfg-if[so9/1/2#atm#4])#atm supp-serv-cat ubr
TELLABS(cfg-if[so9/1/2#atm#4])#atm traffic-params servcat cbr
confdef cbr.1 pcr 40000 40000 cdvt 5000 5000

Overview of UMTS network evolution through radio and transmission feature validation Jorge Rafael Sevilla Castillo
170
VC definition for Flexi NODE B
VC 48 & 49:
TELLABS(config)# interface so9/1/2#atm#2.48 //Number 48
identifies VC dedicated for HSDPA traffic
TELLABS(cfg-if[so9/1/2#atm#2.48])# atm usage switched //Switched
indicates that ATM traffic will be routed through this interface
and not terminated there.
TELLABS(cfg-if[so9/1/2#atm#2.48])# atm cell concatenation 26 5000
//concatenation factor=26 and packetization timer=5000 µs.
TELLABS(cfg-if[so9/1/2#atm#2.48])# atm traffic-params servcat ubr
confdef ubr.1 pcr 40000 40000 //At the time of configuration the
software release of Tellabs 8630 did not support traffic class
ubr+, hence mdcr parameter is not shown. Tellabs has committed to
release this ATM service category in next releases.
TELLABS(cfg-if[so9/1/2#atm#2.48])# pwe3 circuit flexi_hsdpa
//Association between the interface and its corresponding mpls
tunnel.
TELLABS(cfg-if[so9/1/2#atm#2.48])# no shutdown //Activates the
interface
TELLABS(config)# interface so9/1/2#atm#2.49 //Number 49
identifies VC dedicated for HSUPA traffic
TELLABS(cfg-if[so9/1/2#atm#2.49])# atm usage switched
TELLABS(cfg-if[so9/1/2#atm#2.49])# atm cell concatenation 26 5000
TELLABS(cfg-if[so9/1/2#atm#2.49])# atm traffic-params servcat ubr
confdef ubr.1 pcr 40000 40000
TELLABS(cfg-if[so9/1/2#atm#2.49])# pwe3 circuit flexi_hsupa
TELLABS(cfg-if[so9/1/2#atm#2.49])# no shutdown
VC definition for UltraSite NODE B
VC 48 & 49:
TELLABS(config)# interface so9/1/2#atm#4.48 //VC 48
TELLABS(cfg-if[so9/1/2#atm#4.48])# atm usage switched
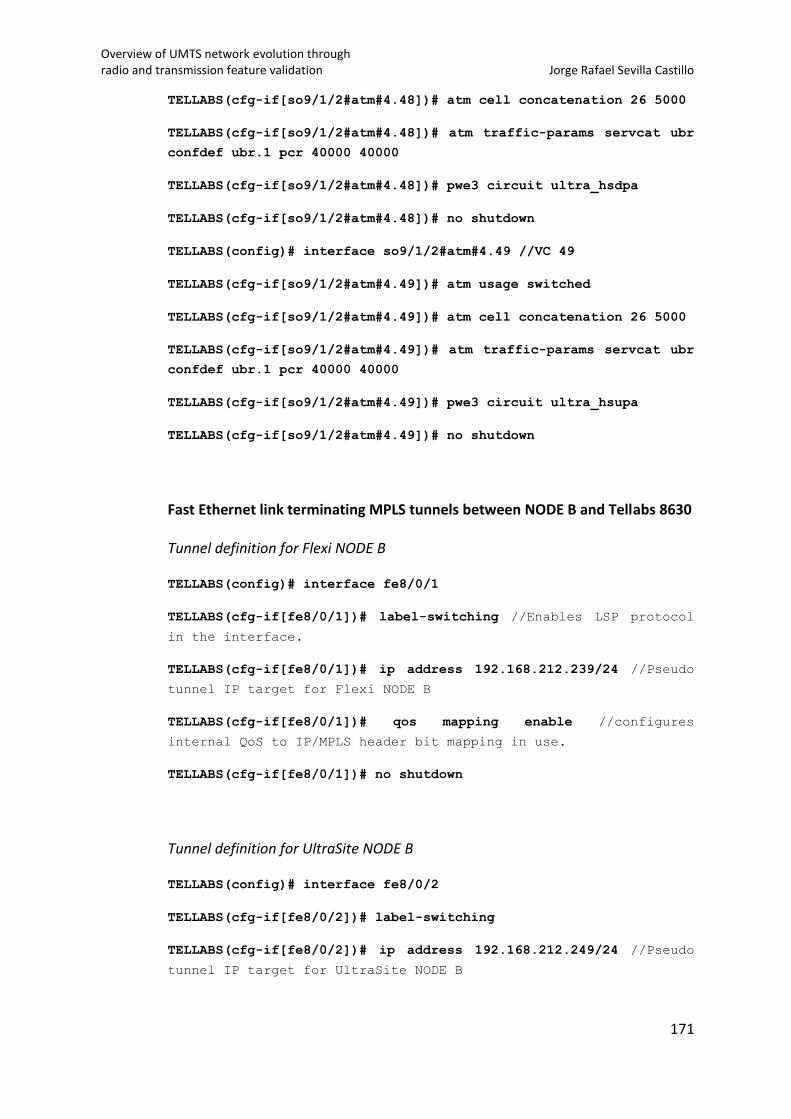
Overview of UMTS network evolution through radio and transmission feature validation Jorge Rafael Sevilla Castillo
171
TELLABS(cfg-if[so9/1/2#atm#4.48])# atm cell concatenation 26 5000
TELLABS(cfg-if[so9/1/2#atm#4.48])# atm traffic-params servcat ubr
confdef ubr.1 pcr 40000 40000
TELLABS(cfg-if[so9/1/2#atm#4.48])# pwe3 circuit ultra_hsdpa
TELLABS(cfg-if[so9/1/2#atm#4.48])# no shutdown
TELLABS(config)# interface so9/1/2#atm#4.49 //VC 49
TELLABS(cfg-if[so9/1/2#atm#4.49])# atm usage switched
TELLABS(cfg-if[so9/1/2#atm#4.49])# atm cell concatenation 26 5000
TELLABS(cfg-if[so9/1/2#atm#4.49])# atm traffic-params servcat ubr
confdef ubr.1 pcr 40000 40000
TELLABS(cfg-if[so9/1/2#atm#4.49])# pwe3 circuit ultra_hsupa
TELLABS(cfg-if[so9/1/2#atm#4.49])# no shutdown
Fast Ethernet link terminating MPLS tunnels between NODE B and Tellabs 8630
Tunnel definition for Flexi NODE B
TELLABS(config)# interface fe8/0/1
TELLABS(cfg-if[fe8/0/1])# label-switching //Enables LSP protocol
in the interface.
TELLABS(cfg-if[fe8/0/1])# ip address 192.168.212.239/24 //Pseudo
tunnel IP target for Flexi NODE B
TELLABS(cfg-if[fe8/0/1])# qos mapping enable //configures
internal QoS to IP/MPLS header bit mapping in use.
TELLABS(cfg-if[fe8/0/1])# no shutdown
Tunnel definition for UltraSite NODE B
TELLABS(config)# interface fe8/0/2
TELLABS(cfg-if[fe8/0/2])# label-switching
TELLABS(cfg-if[fe8/0/2])# ip address 192.168.212.249/24 //Pseudo
tunnel IP target for UltraSite NODE B
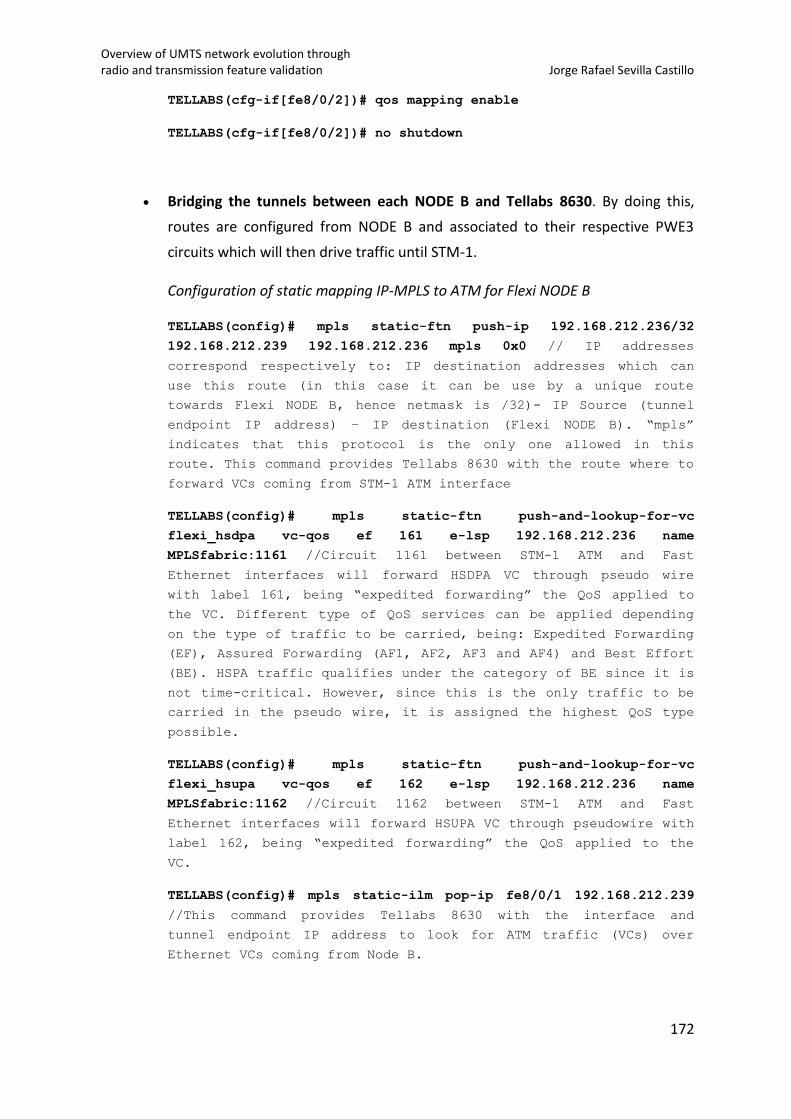
Overview of UMTS network evolution through radio and transmission feature validation Jorge Rafael Sevilla Castillo
172
TELLABS(cfg-if[fe8/0/2])# qos mapping enable
TELLABS(cfg-if[fe8/0/2])# no shutdown
Bridging the tunnels between each NODE B and Tellabs 8630. By doing this,
routes are configured from NODE B and associated to their respective PWE3
circuits which will then drive traffic until STM-1.
Configuration of static mapping IP-MPLS to ATM for Flexi NODE B
TELLABS(config)# mpls static-ftn push-ip 192.168.212.236/32
192.168.212.239 192.168.212.236 mpls 0x0 // IP addresses
correspond respectively to: IP destination addresses which can
use this route (in this case it can be use by a unique route
towards Flexi NODE B, hence netmask is /32)- IP Source (tunnel
endpoint IP address) – IP destination (Flexi NODE B). “mpls”
indicates that this protocol is the only one allowed in this
route. This command provides Tellabs 8630 with the route where to
forward VCs coming from STM-1 ATM interface
TELLABS(config)# mpls static-ftn push-and-lookup-for-vc
flexi_hsdpa vc-qos ef 161 e-lsp 192.168.212.236 name
MPLSfabric:1161 //Circuit 1161 between STM-1 ATM and Fast
Ethernet interfaces will forward HSDPA VC through pseudo wire
with label 161, being “expedited forwarding” the QoS applied to
the VC. Different type of QoS services can be applied depending
on the type of traffic to be carried, being: Expedited Forwarding
(EF), Assured Forwarding (AF1, AF2, AF3 and AF4) and Best Effort
(BE). HSPA traffic qualifies under the category of BE since it is
not time-critical. However, since this is the only traffic to be
carried in the pseudo wire, it is assigned the highest QoS type
possible.
TELLABS(config)# mpls static-ftn push-and-lookup-for-vc
flexi_hsupa vc-qos ef 162 e-lsp 192.168.212.236 name
MPLSfabric:1162 //Circuit 1162 between STM-1 ATM and Fast
Ethernet interfaces will forward HSUPA VC through pseudowire with
label 162, being “expedited forwarding” the QoS applied to the
VC.
TELLABS(config)# mpls static-ilm pop-ip fe8/0/1 192.168.212.239
//This command provides Tellabs 8630 with the interface and
tunnel endpoint IP address to look for ATM traffic (VCs) over
Ethernet VCs coming from Node B.
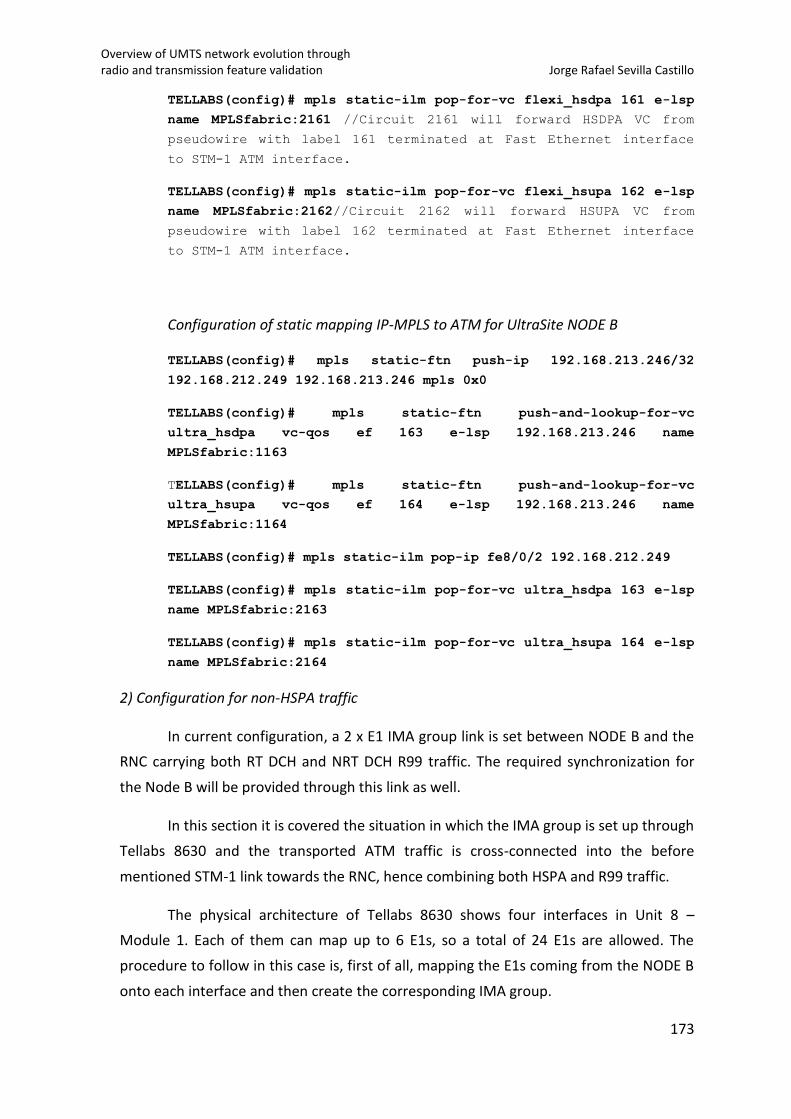
Overview of UMTS network evolution through radio and transmission feature validation Jorge Rafael Sevilla Castillo
173
TELLABS(config)# mpls static-ilm pop-for-vc flexi_hsdpa 161 e-lsp
name MPLSfabric:2161 //Circuit 2161 will forward HSDPA VC from
pseudowire with label 161 terminated at Fast Ethernet interface
to STM-1 ATM interface.
TELLABS(config)# mpls static-ilm pop-for-vc flexi_hsupa 162 e-lsp
name MPLSfabric:2162//Circuit 2162 will forward HSUPA VC from
pseudowire with label 162 terminated at Fast Ethernet interface
to STM-1 ATM interface.
Configuration of static mapping IP-MPLS to ATM for UltraSite NODE B
TELLABS(config)# mpls static-ftn push-ip 192.168.213.246/32
192.168.212.249 192.168.213.246 mpls 0x0
TELLABS(config)# mpls static-ftn push-and-lookup-for-vc
ultra_hsdpa vc-qos ef 163 e-lsp 192.168.213.246 name
MPLSfabric:1163
TELLABS(config)# mpls static-ftn push-and-lookup-for-vc
ultra_hsupa vc-qos ef 164 e-lsp 192.168.213.246 name
MPLSfabric:1164
TELLABS(config)# mpls static-ilm pop-ip fe8/0/2 192.168.212.249
TELLABS(config)# mpls static-ilm pop-for-vc ultra_hsdpa 163 e-lsp
name MPLSfabric:2163
TELLABS(config)# mpls static-ilm pop-for-vc ultra_hsupa 164 e-lsp
name MPLSfabric:2164
2) Configuration for non-HSPA traffic
In current configuration, a 2 x E1 IMA group link is set between NODE B and the
RNC carrying both RT DCH and NRT DCH R99 traffic. The required synchronization for
the Node B will be provided through this link as well.
In this section it is covered the situation in which the IMA group is set up through
Tellabs 8630 and the transported ATM traffic is cross-connected into the before
mentioned STM-1 link towards the RNC, hence combining both HSPA and R99 traffic.
The physical architecture of Tellabs 8630 shows four interfaces in Unit 8 –
Module 1. Each of them can map up to 6 E1s, so a total of 24 E1s are allowed. The
procedure to follow in this case is, first of all, mapping the E1s coming from the NODE B
onto each interface and then create the corresponding IMA group.
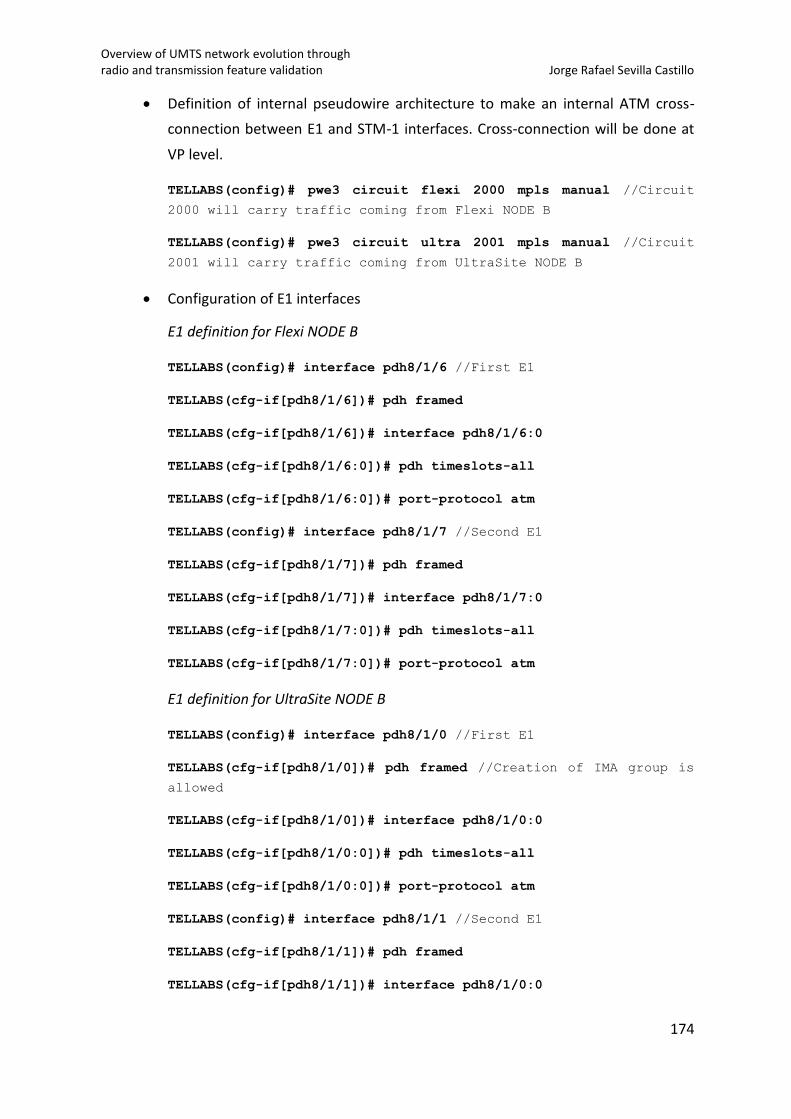
Overview of UMTS network evolution through radio and transmission feature validation Jorge Rafael Sevilla Castillo
174
Definition of internal pseudowire architecture to make an internal ATM cross-
connection between E1 and STM-1 interfaces. Cross-connection will be done at
VP level.
TELLABS(config)# pwe3 circuit flexi 2000 mpls manual //Circuit
2000 will carry traffic coming from Flexi NODE B
TELLABS(config)# pwe3 circuit ultra 2001 mpls manual //Circuit
2001 will carry traffic coming from UltraSite NODE B
Configuration of E1 interfaces
E1 definition for Flexi NODE B
TELLABS(config)# interface pdh8/1/6 //First E1
TELLABS(cfg-if[pdh8/1/6])# pdh framed
TELLABS(cfg-if[pdh8/1/6])# interface pdh8/1/6:0
TELLABS(cfg-if[pdh8/1/6:0])# pdh timeslots-all
TELLABS(cfg-if[pdh8/1/6:0])# port-protocol atm
TELLABS(config)# interface pdh8/1/7 //Second E1
TELLABS(cfg-if[pdh8/1/7])# pdh framed
TELLABS(cfg-if[pdh8/1/7])# interface pdh8/1/7:0
TELLABS(cfg-if[pdh8/1/7:0])# pdh timeslots-all
TELLABS(cfg-if[pdh8/1/7:0])# port-protocol atm
E1 definition for UltraSite NODE B
TELLABS(config)# interface pdh8/1/0 //First E1
TELLABS(cfg-if[pdh8/1/0])# pdh framed //Creation of IMA group is
allowed
TELLABS(cfg-if[pdh8/1/0])# interface pdh8/1/0:0
TELLABS(cfg-if[pdh8/1/0:0])# pdh timeslots-all
TELLABS(cfg-if[pdh8/1/0:0])# port-protocol atm
TELLABS(config)# interface pdh8/1/1 //Second E1
TELLABS(cfg-if[pdh8/1/1])# pdh framed
TELLABS(cfg-if[pdh8/1/1])# interface pdh8/1/0:0
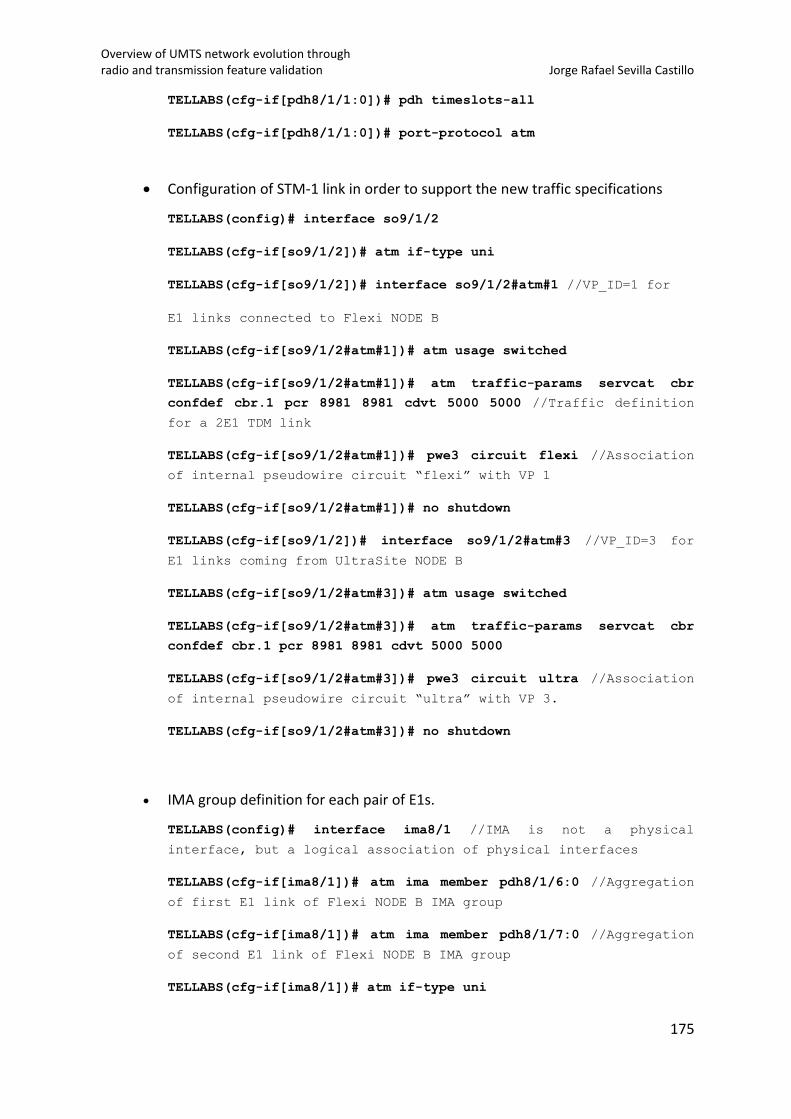
Overview of UMTS network evolution through radio and transmission feature validation Jorge Rafael Sevilla Castillo
175
TELLABS(cfg-if[pdh8/1/1:0])# pdh timeslots-all
TELLABS(cfg-if[pdh8/1/1:0])# port-protocol atm
Configuration of STM-1 link in order to support the new traffic specifications
TELLABS(config)# interface so9/1/2
TELLABS(cfg-if[so9/1/2])# atm if-type uni
TELLABS(cfg-if[so9/1/2])# interface so9/1/2#atm#1 //VP_ID=1 for
E1 links connected to Flexi NODE B
TELLABS(cfg-if[so9/1/2#atm#1])# atm usage switched
TELLABS(cfg-if[so9/1/2#atm#1])# atm traffic-params servcat cbr
confdef cbr.1 pcr 8981 8981 cdvt 5000 5000 //Traffic definition
for a 2E1 TDM link
TELLABS(cfg-if[so9/1/2#atm#1])# pwe3 circuit flexi //Association
of internal pseudowire circuit “flexi” with VP 1
TELLABS(cfg-if[so9/1/2#atm#1])# no shutdown
TELLABS(cfg-if[so9/1/2])# interface so9/1/2#atm#3 //VP_ID=3 for
E1 links coming from UltraSite NODE B
TELLABS(cfg-if[so9/1/2#atm#3])# atm usage switched
TELLABS(cfg-if[so9/1/2#atm#3])# atm traffic-params servcat cbr
confdef cbr.1 pcr 8981 8981 cdvt 5000 5000
TELLABS(cfg-if[so9/1/2#atm#3])# pwe3 circuit ultra //Association
of internal pseudowire circuit “ultra” with VP 3.
TELLABS(cfg-if[so9/1/2#atm#3])# no shutdown
IMA group definition for each pair of E1s.
TELLABS(config)# interface ima8/1 //IMA is not a physical
interface, but a logical association of physical interfaces
TELLABS(cfg-if[ima8/1])# atm ima member pdh8/1/6:0 //Aggregation
of first E1 link of Flexi NODE B IMA group
TELLABS(cfg-if[ima8/1])# atm ima member pdh8/1/7:0 //Aggregation
of second E1 link of Flexi NODE B IMA group
TELLABS(cfg-if[ima8/1])# atm if-type uni
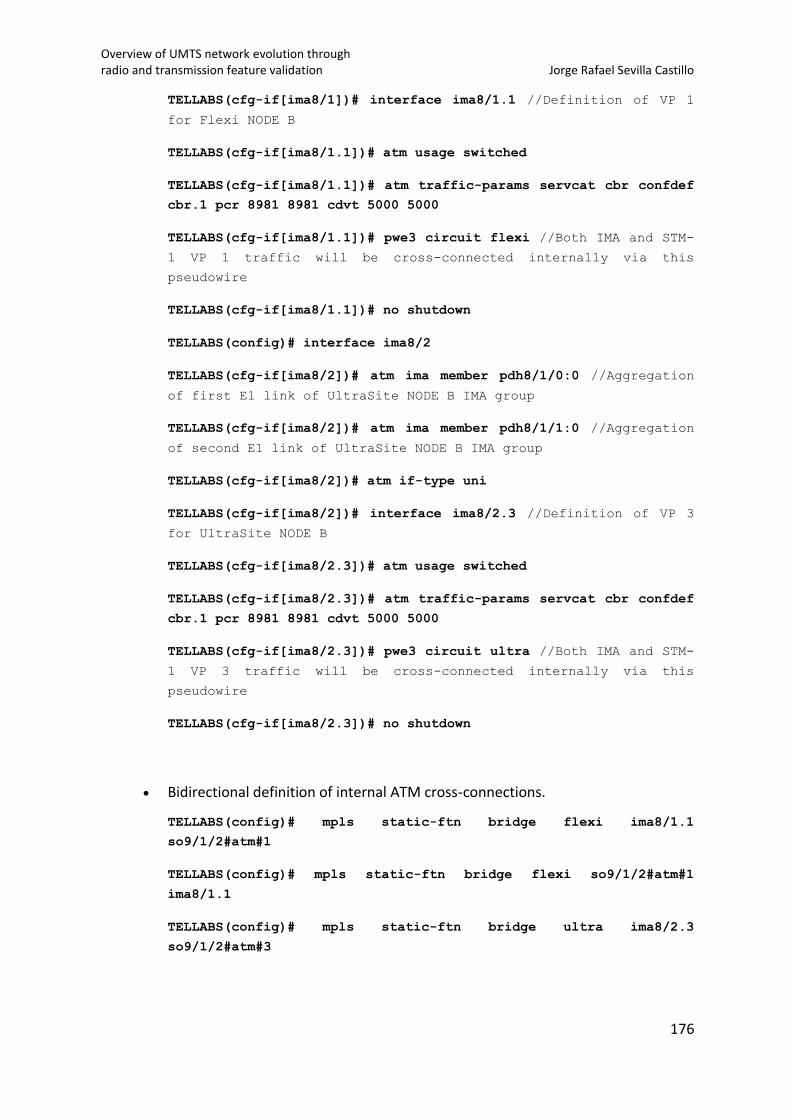
Overview of UMTS network evolution through radio and transmission feature validation Jorge Rafael Sevilla Castillo
176
TELLABS(cfg-if[ima8/1])# interface ima8/1.1 //Definition of VP 1
for Flexi NODE B
TELLABS(cfg-if[ima8/1.1])# atm usage switched
TELLABS(cfg-if[ima8/1.1])# atm traffic-params servcat cbr confdef
cbr.1 pcr 8981 8981 cdvt 5000 5000
TELLABS(cfg-if[ima8/1.1])# pwe3 circuit flexi //Both IMA and STM-
1 VP 1 traffic will be cross-connected internally via this
pseudowire
TELLABS(cfg-if[ima8/1.1])# no shutdown
TELLABS(config)# interface ima8/2
TELLABS(cfg-if[ima8/2])# atm ima member pdh8/1/0:0 //Aggregation
of first E1 link of UltraSite NODE B IMA group
TELLABS(cfg-if[ima8/2])# atm ima member pdh8/1/1:0 //Aggregation
of second E1 link of UltraSite NODE B IMA group
TELLABS(cfg-if[ima8/2])# atm if-type uni
TELLABS(cfg-if[ima8/2])# interface ima8/2.3 //Definition of VP 3
for UltraSite NODE B
TELLABS(cfg-if[ima8/2.3])# atm usage switched
TELLABS(cfg-if[ima8/2.3])# atm traffic-params servcat cbr confdef
cbr.1 pcr 8981 8981 cdvt 5000 5000
TELLABS(cfg-if[ima8/2.3])# pwe3 circuit ultra //Both IMA and STM-
1 VP 3 traffic will be cross-connected internally via this
pseudowire
TELLABS(cfg-if[ima8/2.3])# no shutdown
Bidirectional definition of internal ATM cross-connections.
TELLABS(config)# mpls static-ftn bridge flexi ima8/1.1
so9/1/2#atm#1
TELLABS(config)# mpls static-ftn bridge flexi so9/1/2#atm#1
ima8/1.1
TELLABS(config)# mpls static-ftn bridge ultra ima8/2.3
so9/1/2#atm#3
Overview of UMTS network evolution through radio and transmission feature validation Jorge Rafael Sevilla Castillo
177
TELLABS(config)# mpls static-ftn bridge flexi so9/1/2#atm#3
ima8/2.3
Link redundancy
In order to secure the STM-1 link against any breakages or hardware faults, MSP
1+1 bidirectional protection was configured between Tellabs 8630 and the RNC. For this
purpose, a so called protection group is created taking into account the following
internal protection rules:
High slot numbers are protected by lower ones
Interfaces located on different modules, i.e. module 0 and module 1, within the
same slot, cannot be protected by MSP. Only interfaces situated on different
slots can be MSP-protected.
In this case the interface so9/1/2 (STM-1) situated in slot 9 is protected by
interface so6/1/2 (STM-1) situated in slot 6.
TELLABS(config)# protection ms MyProtection //Protection group
“MyProtection” is created
TELLABS(config)# primary so9/1/2 backup so6/1/2 bidirectional
Node B transmission commissioning
Node B commissioning embraces two major stages: radio commissioning and
transmission commissioning. Radio commissioning configures the NODE B in terms of
sectors, power and frequencies to use and is out of the scope of this project. This
section is focused on the steps followed to set up the necessary transmission
configuration in both NODE B platforms, Flexi and UltraSite, for a hybrid backhaul
solution. A series of screenshots will guide the reader through the commissioning
process followed to configure a hybrid backhaul scenario.
Flexi NODE B commissioning
Figure 73 presents the user interface of a NODE B Element Manager. It shows a
visual description of the NODE B hardware configuration and cells commissioned. It can
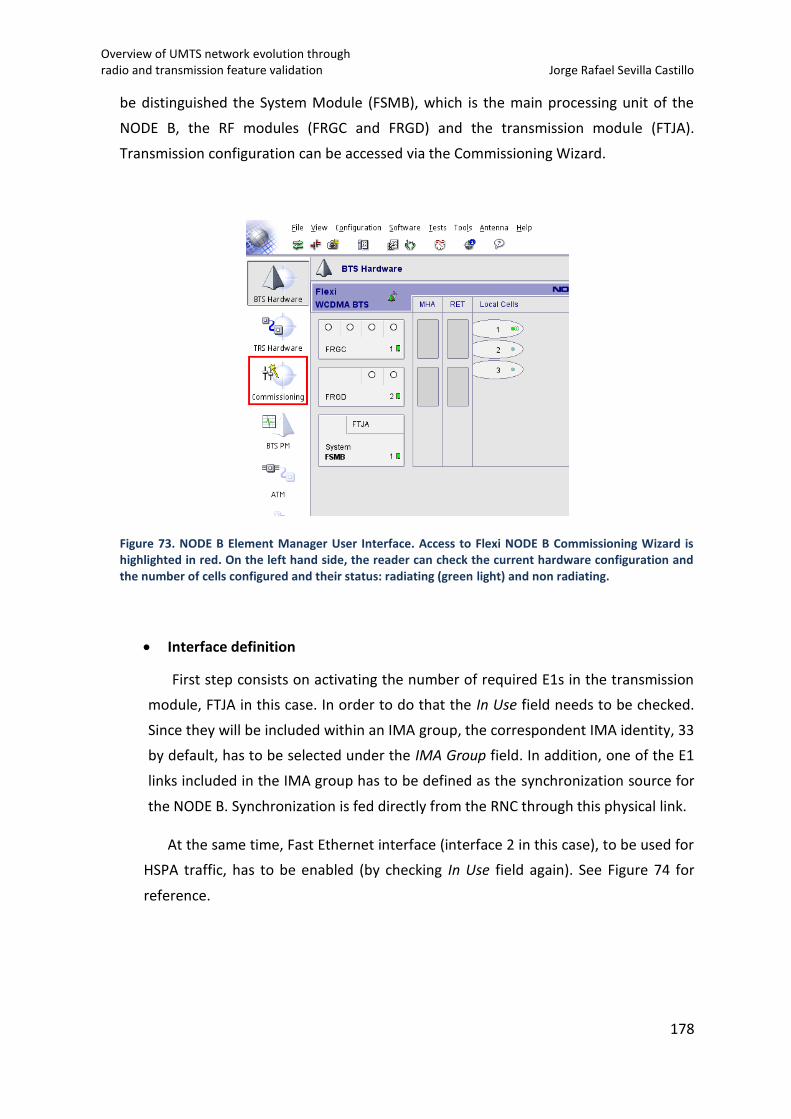
Overview of UMTS network evolution through radio and transmission feature validation Jorge Rafael Sevilla Castillo
178
be distinguished the System Module (FSMB), which is the main processing unit of the
NODE B, the RF modules (FRGC and FRGD) and the transmission module (FTJA).
Transmission configuration can be accessed via the Commissioning Wizard.
Figure 73. NODE B Element Manager User Interface. Access to Flexi NODE B Commissioning Wizard is highlighted in red. On the left hand side, the reader can check the current hardware configuration and the number of cells configured and their status: radiating (green light) and non radiating.
Interface definition
First step consists on activating the number of required E1s in the transmission
module, FTJA in this case. In order to do that the In Use field needs to be checked.
Since they will be included within an IMA group, the correspondent IMA identity, 33
by default, has to be selected under the IMA Group field. In addition, one of the E1
links included in the IMA group has to be defined as the synchronization source for
the NODE B. Synchronization is fed directly from the RNC through this physical link.
At the same time, Fast Ethernet interface (interface 2 in this case), to be used for
HSPA traffic, has to be enabled (by checking In Use field again). See Figure 74 for
reference.
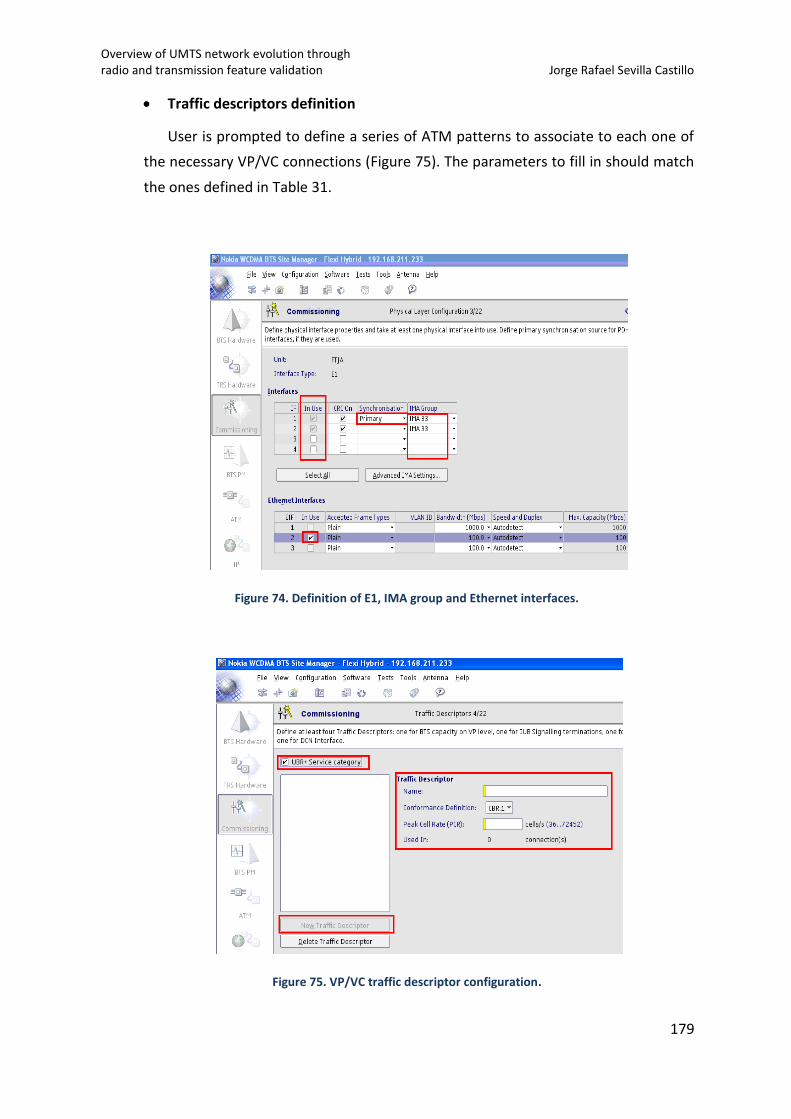
Overview of UMTS network evolution through radio and transmission feature validation Jorge Rafael Sevilla Castillo
179
Traffic descriptors definition
User is prompted to define a series of ATM patterns to associate to each one of
the necessary VP/VC connections (Figure 75). The parameters to fill in should match
the ones defined in Table 31.
Figure 74. Definition of E1, IMA group and Ethernet interfaces.
Figure 75. VP/VC traffic descriptor configuration.
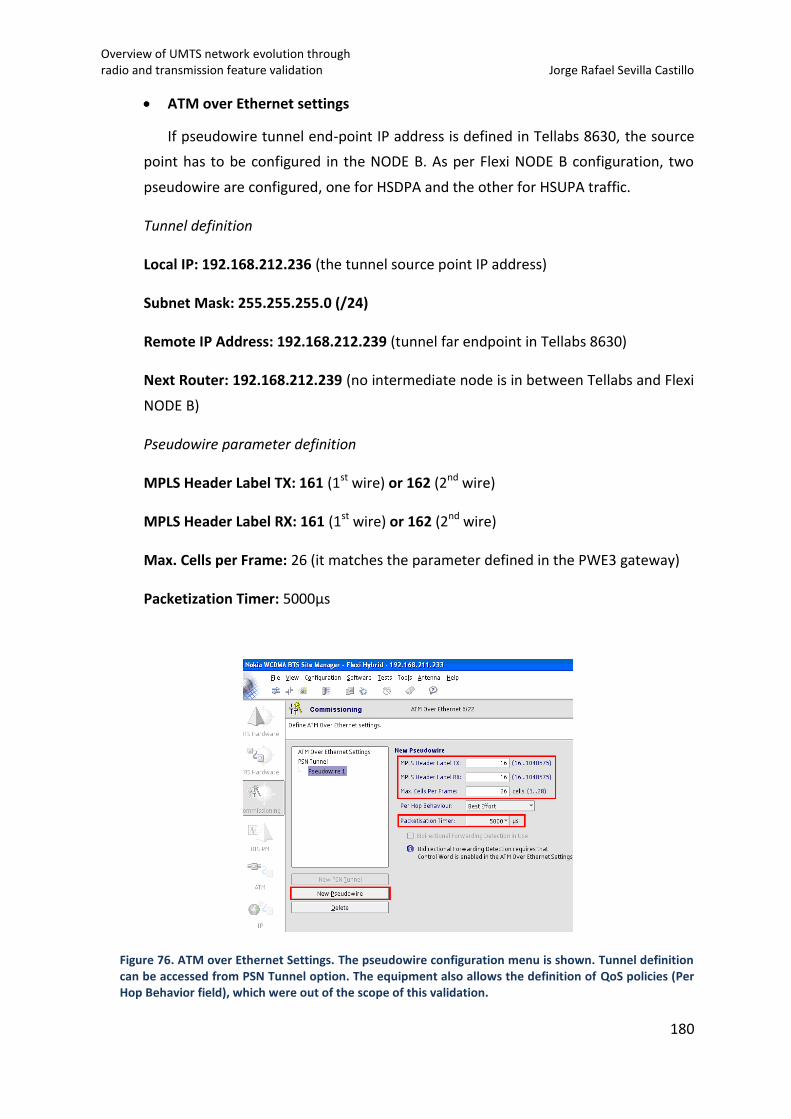
Overview of UMTS network evolution through radio and transmission feature validation Jorge Rafael Sevilla Castillo
180
ATM over Ethernet settings
If pseudowire tunnel end-point IP address is defined in Tellabs 8630, the source
point has to be configured in the NODE B. As per Flexi NODE B configuration, two
pseudowire are configured, one for HSDPA and the other for HSUPA traffic.
Tunnel definition
Local IP: 192.168.212.236 (the tunnel source point IP address)
Subnet Mask: 255.255.255.0 (/24)
Remote IP Address: 192.168.212.239 (tunnel far endpoint in Tellabs 8630)
Next Router: 192.168.212.239 (no intermediate node is in between Tellabs and Flexi
NODE B)
Pseudowire parameter definition
MPLS Header Label TX: 161 (1st wire) or 162 (2nd wire)
MPLS Header Label RX: 161 (1st wire) or 162 (2nd wire)
Max. Cells per Frame: 26 (it matches the parameter defined in the PWE3 gateway)
Packetization Timer: 5000µs
Figure 76. ATM over Ethernet Settings. The pseudowire configuration menu is shown. Tunnel definition can be accessed from PSN Tunnel option. The equipment also allows the definition of QoS policies (Per Hop Behavior field), which were out of the scope of this validation.
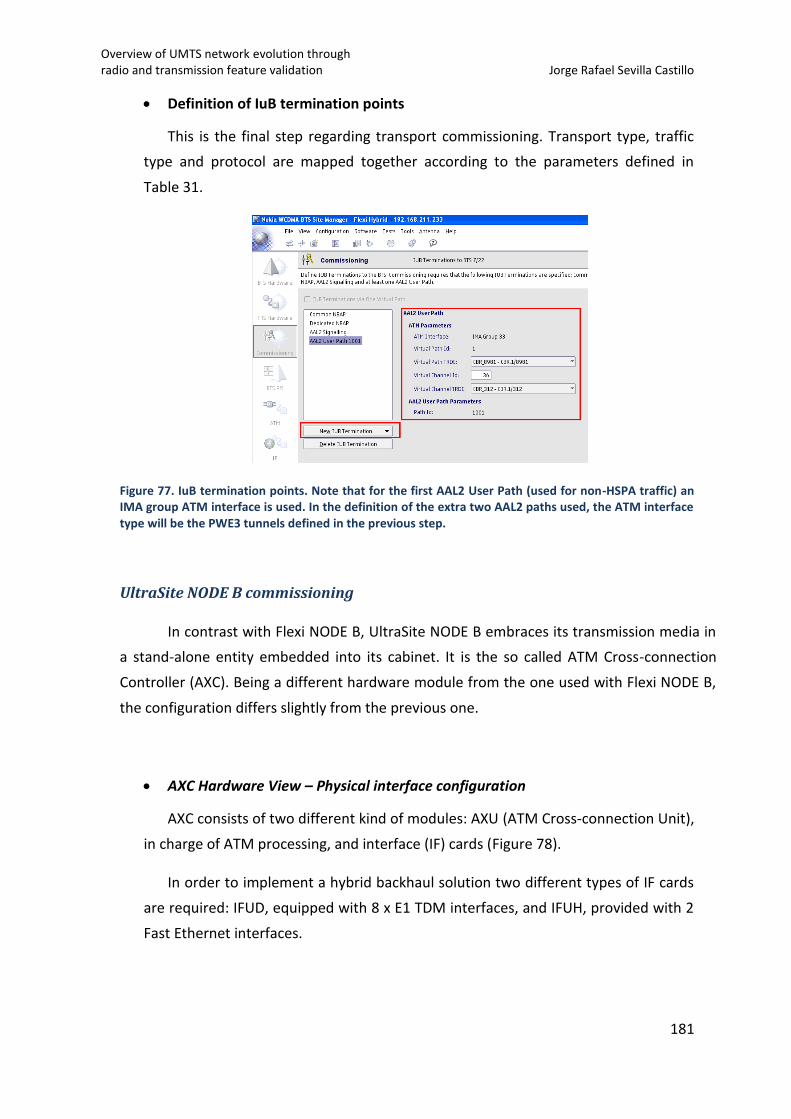
Overview of UMTS network evolution through radio and transmission feature validation Jorge Rafael Sevilla Castillo
181
Definition of IuB termination points
This is the final step regarding transport commissioning. Transport type, traffic
type and protocol are mapped together according to the parameters defined in
Table 31.
Figure 77. IuB termination points. Note that for the first AAL2 User Path (used for non-HSPA traffic) an IMA group ATM interface is used. In the definition of the extra two AAL2 paths used, the ATM interface type will be the PWE3 tunnels defined in the previous step.
UltraSite NODE B commissioning
In contrast with Flexi NODE B, UltraSite NODE B embraces its transmission media in
a stand-alone entity embedded into its cabinet. It is the so called ATM Cross-connection
Controller (AXC). Being a different hardware module from the one used with Flexi NODE B,
the configuration differs slightly from the previous one.
AXC Hardware View – Physical interface configuration
AXC consists of two different kind of modules: AXU (ATM Cross-connection Unit),
in charge of ATM processing, and interface (IF) cards (Figure 78).
In order to implement a hybrid backhaul solution two different types of IF cards
are required: IFUD, equipped with 8 x E1 TDM interfaces, and IFUH, provided with 2
Fast Ethernet interfaces.
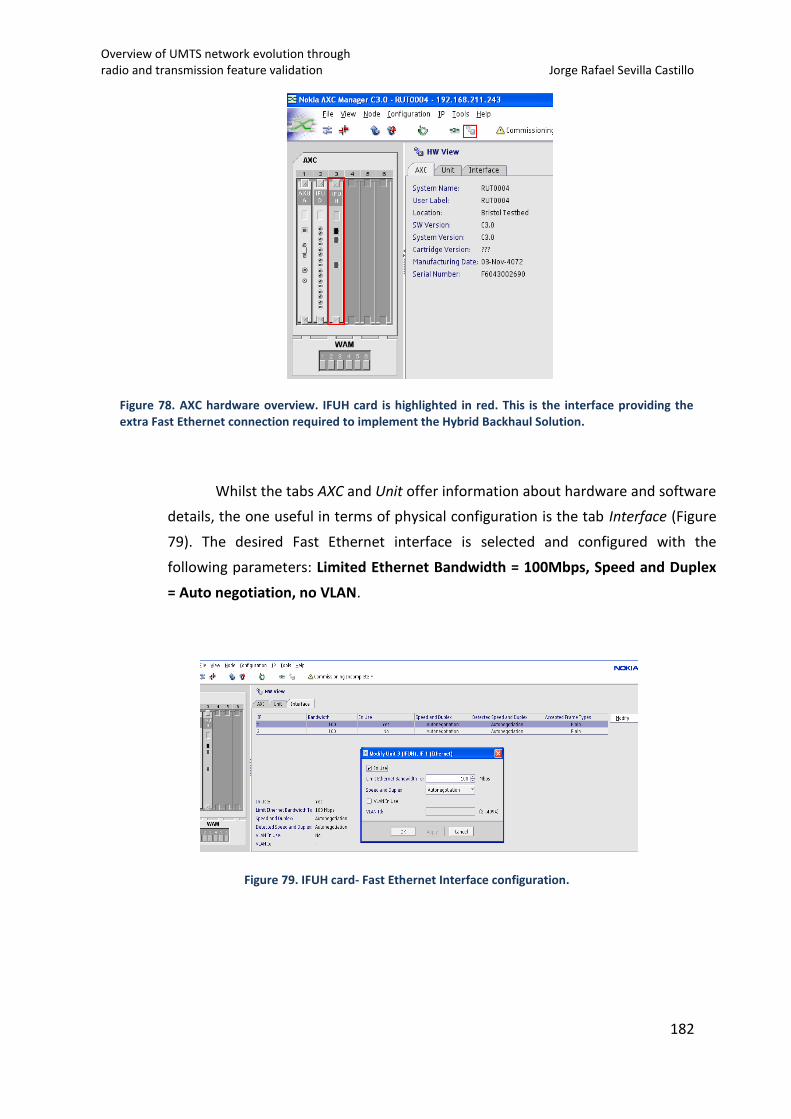
Overview of UMTS network evolution through radio and transmission feature validation Jorge Rafael Sevilla Castillo
182
Figure 78. AXC hardware overview. IFUH card is highlighted in red. This is the interface providing the extra Fast Ethernet connection required to implement the Hybrid Backhaul Solution.
Whilst the tabs AXC and Unit offer information about hardware and software
details, the one useful in terms of physical configuration is the tab Interface (Figure
79). The desired Fast Ethernet interface is selected and configured with the
following parameters: Limited Ethernet Bandwidth = 100Mbps, Speed and Duplex
= Auto negotiation, no VLAN.
Figure 79. IFUH card- Fast Ethernet Interface configuration.
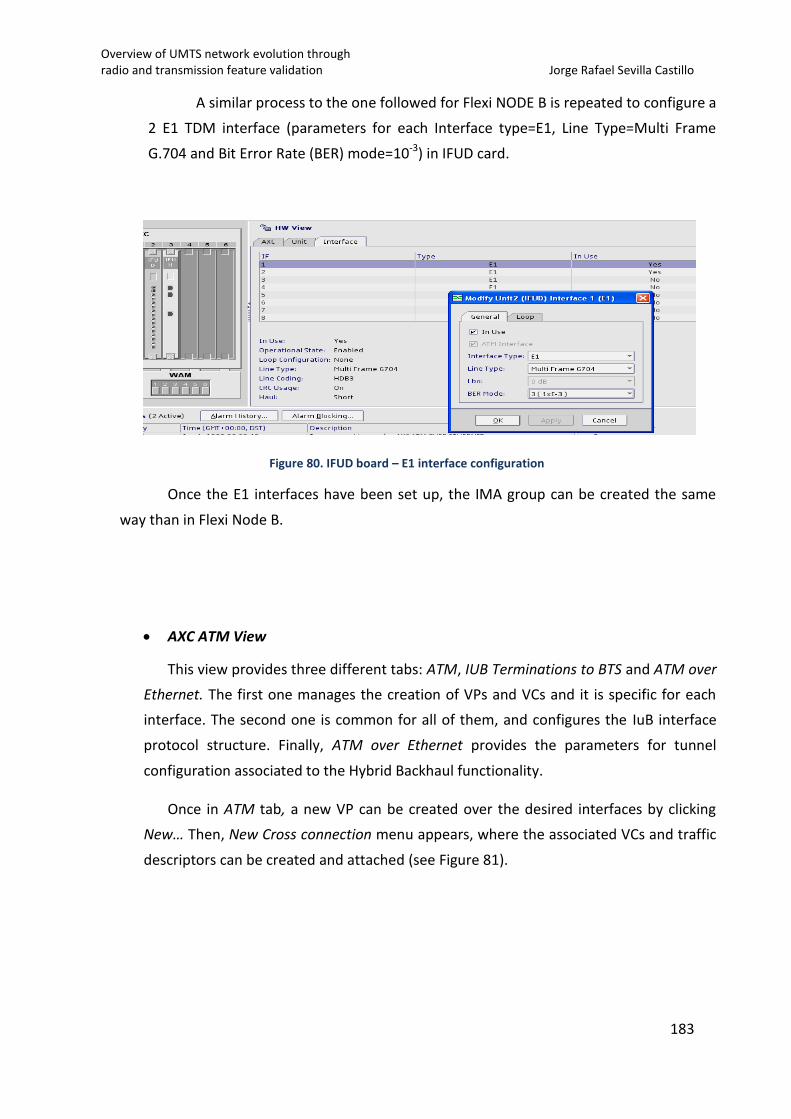
Overview of UMTS network evolution through radio and transmission feature validation Jorge Rafael Sevilla Castillo
183
A similar process to the one followed for Flexi NODE B is repeated to configure a
2 E1 TDM interface (parameters for each Interface type=E1, Line Type=Multi Frame
G.704 and Bit Error Rate (BER) mode=10-3) in IFUD card.
Figure 80. IFUD board – E1 interface configuration
Once the E1 interfaces have been set up, the IMA group can be created the same
way than in Flexi Node B.
AXC ATM View
This view provides three different tabs: ATM, IUB Terminations to BTS and ATM over
Ethernet. The first one manages the creation of VPs and VCs and it is specific for each
interface. The second one is common for all of them, and configures the IuB interface
protocol structure. Finally, ATM over Ethernet provides the parameters for tunnel
configuration associated to the Hybrid Backhaul functionality.
Once in ATM tab, a new VP can be created over the desired interfaces by clicking
New… Then, New Cross connection menu appears, where the associated VCs and traffic
descriptors can be created and attached (see Figure 81).
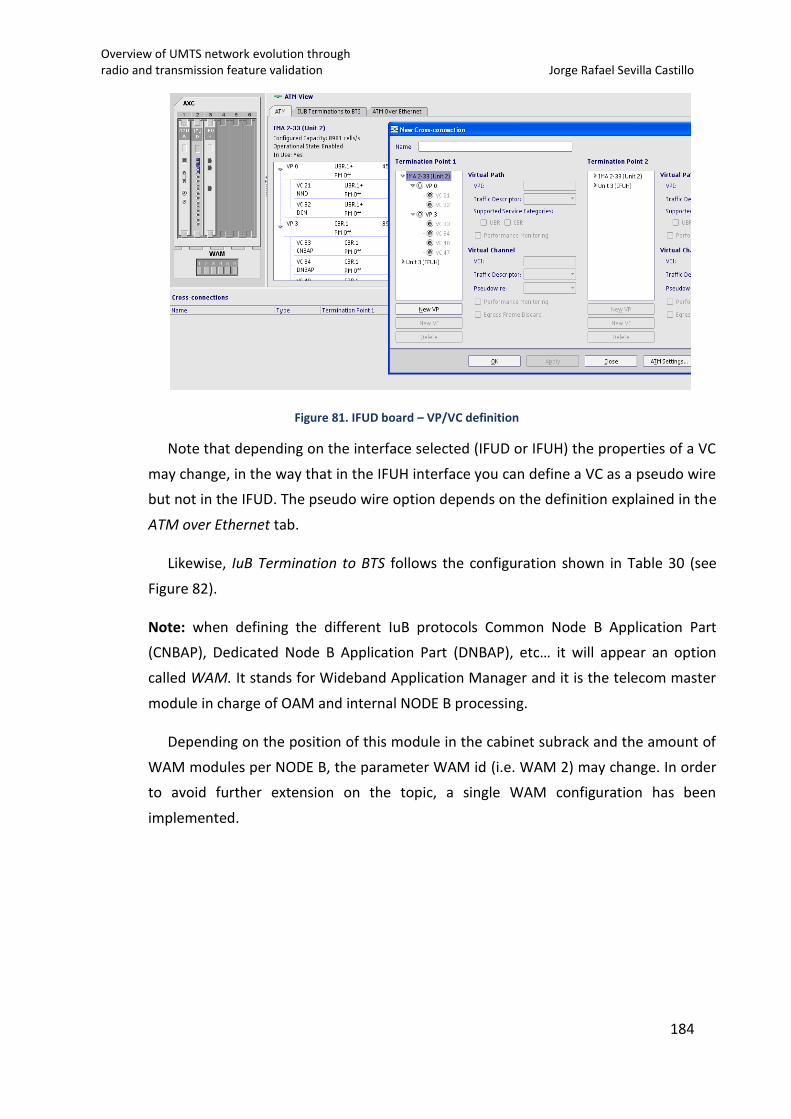
Overview of UMTS network evolution through radio and transmission feature validation Jorge Rafael Sevilla Castillo
184
Figure 81. IFUD board – VP/VC definition
Note that depending on the interface selected (IFUD or IFUH) the properties of a VC
may change, in the way that in the IFUH interface you can define a VC as a pseudo wire
but not in the IFUD. The pseudo wire option depends on the definition explained in the
ATM over Ethernet tab.
Likewise, IuB Termination to BTS follows the configuration shown in Table 30 (see
Figure 82).
Note: when defining the different IuB protocols Common Node B Application Part
(CNBAP), Dedicated Node B Application Part (DNBAP), etc… it will appear an option
called WAM. It stands for Wideband Application Manager and it is the telecom master
module in charge of OAM and internal NODE B processing.
Depending on the position of this module in the cabinet subrack and the amount of
WAM modules per NODE B, the parameter WAM id (i.e. WAM 2) may change. In order
to avoid further extension on the topic, a single WAM configuration has been
implemented.
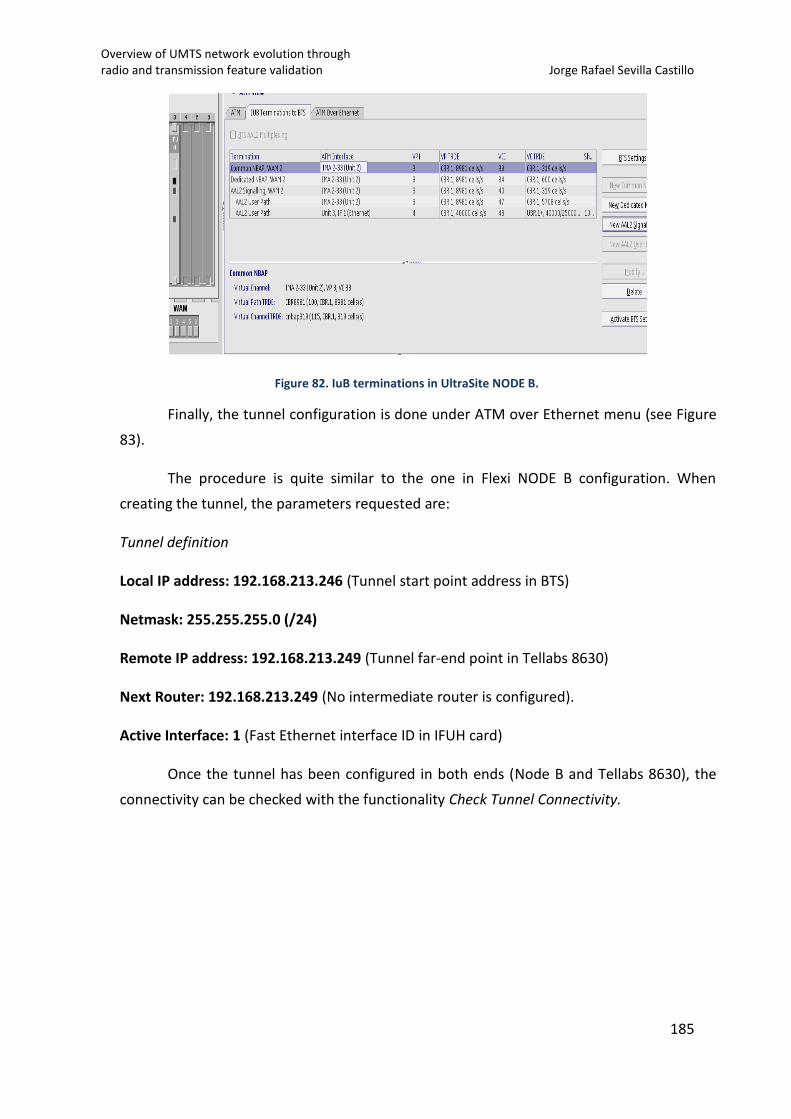
Overview of UMTS network evolution through radio and transmission feature validation Jorge Rafael Sevilla Castillo
185
Figure 82. IuB terminations in UltraSite NODE B.
Finally, the tunnel configuration is done under ATM over Ethernet menu (see Figure
83).
The procedure is quite similar to the one in Flexi NODE B configuration. When
creating the tunnel, the parameters requested are:
Tunnel definition
Local IP address: 192.168.213.246 (Tunnel start point address in BTS)
Netmask: 255.255.255.0 (/24)
Remote IP address: 192.168.213.249 (Tunnel far-end point in Tellabs 8630)
Next Router: 192.168.213.249 (No intermediate router is configured).
Active Interface: 1 (Fast Ethernet interface ID in IFUH card)
Once the tunnel has been configured in both ends (Node B and Tellabs 8630), the
connectivity can be checked with the functionality Check Tunnel Connectivity.
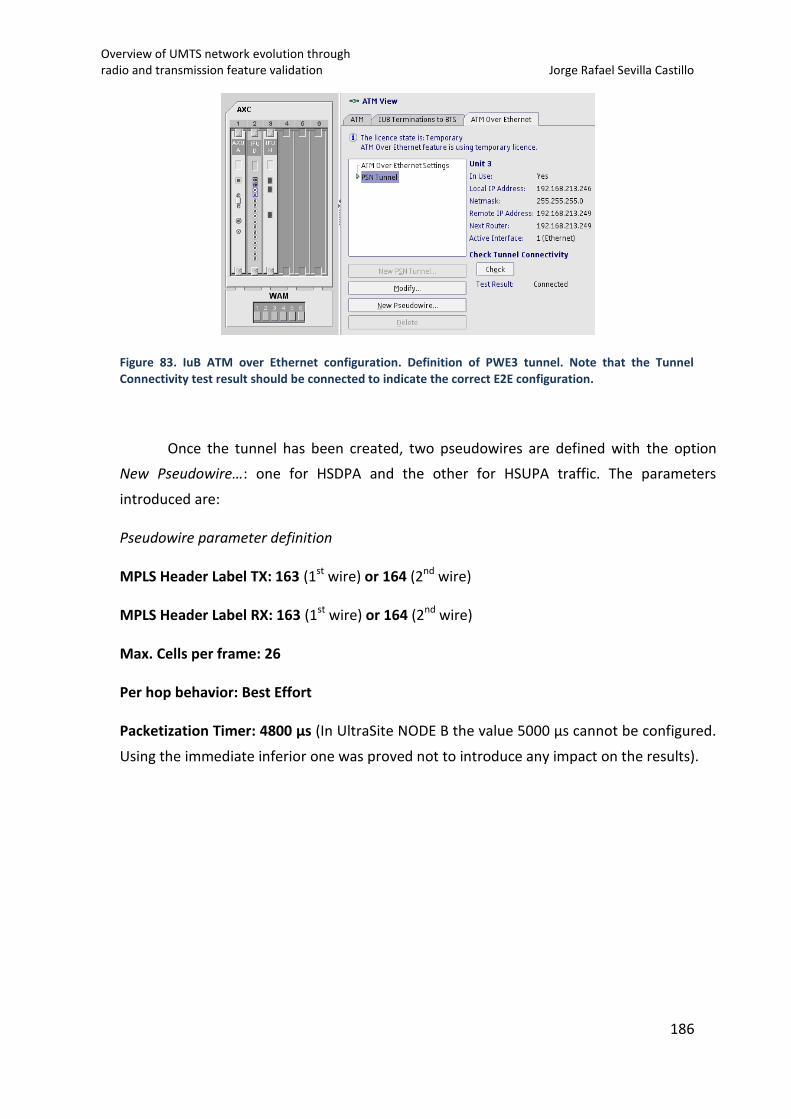
Overview of UMTS network evolution through radio and transmission feature validation Jorge Rafael Sevilla Castillo
186
Figure 83. IuB ATM over Ethernet configuration. Definition of PWE3 tunnel. Note that the Tunnel Connectivity test result should be connected to indicate the correct E2E configuration.
Once the tunnel has been created, two pseudowires are defined with the option
New Pseudowire…: one for HSDPA and the other for HSUPA traffic. The parameters
introduced are:
Pseudowire parameter definition
MPLS Header Label TX: 163 (1st wire) or 164 (2nd wire)
MPLS Header Label RX: 163 (1st wire) or 164 (2nd wire)
Max. Cells per frame: 26
Per hop behavior: Best Effort
Packetization Timer: 4800 µs (In UltraSite NODE B the value 5000 µs cannot be configured.
Using the immediate inferior one was proved not to introduce any impact on the results).
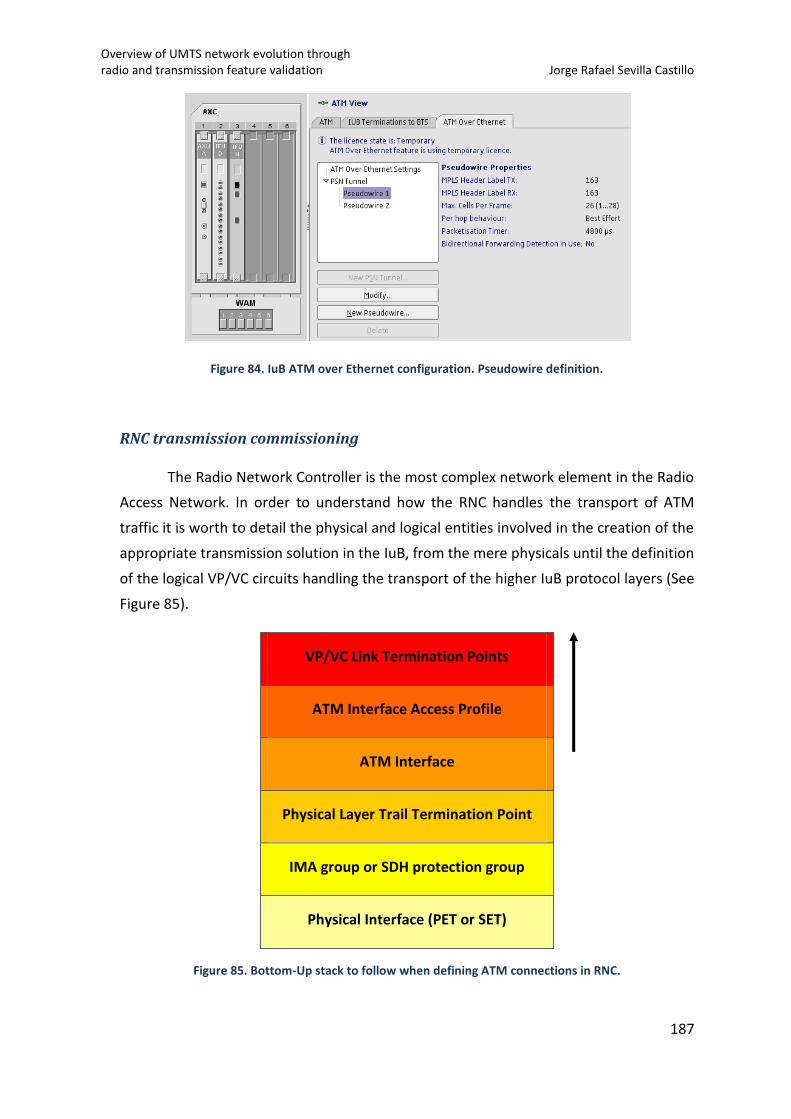
Overview of UMTS network evolution through radio and transmission feature validation Jorge Rafael Sevilla Castillo
187
Figure 84. IuB ATM over Ethernet configuration. Pseudowire definition.
RNC transmission commissioning
The Radio Network Controller is the most complex network element in the Radio
Access Network. In order to understand how the RNC handles the transport of ATM
traffic it is worth to detail the physical and logical entities involved in the creation of the
appropriate transmission solution in the IuB, from the mere physicals until the definition
of the logical VP/VC circuits handling the transport of the higher IuB protocol layers (See
Figure 85).
VP/VC Link Termination Points
ATM Interface Access Profile
ATM Interface
Physical Layer Trail Termination Point
IMA group or SDH protection group
Physical Interface (PET or SET)
Figure 85. Bottom-Up stack to follow when defining ATM connections in RNC.
Overview of UMTS network evolution through radio and transmission feature validation Jorge Rafael Sevilla Castillo
188
RNC Network Interface cards
The RNC has two different interface cards to handle PDH and SDH connections
which are NIP and NIS board, respectively. These cards have a different number of
connection points, called PET (PDH Exchange Terminal) or SET (SDH Exchange Terminal).
These PETs and SETs can be used individually as a single connection or can be grouped
in order to create an IMA group (PDH) or an SDH protection group (required when STM-
1 redundancy mechanisms are in use).
Physical Layer Trail Termination Point (PhyTTP)
The PhyTTP is configured between the physical layer and the ATM layer. The idea
is to provide the higher layers with a physical support to interface with disregarding the
physical media used for that.
ATM Interface
The ATM interface is an external logical interface under which VP and VC
connections are built. The ATM interface can work as User-Network Interface (UNI), for
example in the IuB interface, or as Network-Node Interface (NNI), which is the case of
the connections towards the Core Network. When the ATM Interface is created, it is
linked to a PhyTTP. The system determines automatically the capacity of the ATM
interface (in cps) according to the physical capacity of the PhyTTP.
ATM Interface Access Profile
The access profile created for an ATM interface defines the connection structure
built under the interface. The access profile parameters to be defined are:
maximum number of Virtual Path Identifier (VPI) bits
maximum number of Virtual Channel Identifier (VCI) bits
UPC/NPC (usage/network parameter control or also known as policing)
These parameters will modify the header in the ATM cells. Just for reference,
maximum number of VPI bits defines the number of bits available for specifying the
Virtual Path link termination points, which in turn, define how many VPs can be created
under the ATM interface. Likewise, maximum number of VCI bits defines the amount of
Virtual Channels that can be created inside each VP.
Overview of UMTS network evolution through radio and transmission feature validation Jorge Rafael Sevilla Castillo
189
According to ITU-T Recommendation I.361, VCI values 1 to 31 are reserved for
specific purposes; for example, VCI 3 and VCI 4 are reserved for Operations,
Administration and Maintenance (OAM). Also, VCI value 0 is not allowed. For this
reason, VCI number 32 or higher has to be used for an external VC connection.
Finally, UPC/NPC (Usage/Network Parameter Control) is defined as the set of
actions taken by the network to monitor and control that the traffic contract is
respected in terms of traffic offered and validity of the ATM connection, at the user
access and the network access, respectively.
VP/VC link termination points
Link termination points are created both on VP level and VC level. They are the
terminating ends of VP/VC links. Virtual Path Link termination points (VPLtps) must be
created before creating any Virtual Channel Link termination points (VCLtps) under the
VPLtp.
The interface configuration defines the limits of the total capacity available to
the VPLtps. The number of VCLtps created under each VPLtp depends on the VPLtp
capacity.
Termination points are reserved for:
Signaling links on VC level (AAL2 Signaling, DNBAP and CNBAP).
AAL type 2 paths (VCC endpoints), allowing the creation of AAL type 2
connections for user traffic.
IP over ATM connections on VC level (used to setup the O&M connection
between the RNC and the Node B).
Semi-permanent cross-connections through the ATM network element on VP
and VC level (these will be used as part of the monitoring solution developed).
MML Configuration
The RNC uses a mixture of Man-Machine Language (MML) commands and a
Graphical User Interface. The steps shown provide the configuration for both a 2 E1 IMA
group and 2 STM-1 links IuB based interface as per the top design in Figure 70.
Overview of UMTS network evolution through radio and transmission feature validation Jorge Rafael Sevilla Castillo
190
From step 2 onwards only the creation of the 2 E1 link is followed, because once
the PhyTTP is created both configurations maintain the same rationale and only differ in
the parameters used in the commands:
1) Creation of 2 E1 IMA group 1 (PETs 1 & 2 of NIP1 interface card are used)
ZYBC:1:PET:1&2:1; //1 refers to the minimum number of links without defects
inside the IMA group in order not to report an IMA group failure.
2) Creation of SDH protection group 1 with MSP 1+1 mechanism – non-revertive
(SET 0 in NIS1P-0 and SET 4 in NIS1P-1 are used. Note that each NIS1P card has 4
SETs and NIS1P-0 and NIS1P-1 act as a protected pair of SDH interfaces).
ZYWC:1,,:0,4:; //”,” are used to leave default settings. In this case they refer to
non-revertive protection and MSP 1+1 protocol variant.
3) Creation of PhyTTP 1 for IMA group 1:
ZYDC:1:IMA=1;
4) Creation of ATM Interface 1 for PhyTTP 1:
ZLAC:1:UNI,1,UNLOCKED; //UNLOCKED refers to the administrative state of the
interface. It means “enabled”.
5) Creation of ATM Access Profile associated with ATM Interface 1, with a capacity
for 16 (24) VPs and 128 (27) VCs:
ZLAF:1:4:7:; //Policing is enabled by default.
6) Creation of O&M connection. Since O&M is usually not very interesting for
monitoring purposes, the VP/VC structure is created directly on the ATM
interface where the physical connections of the Node B are terminated. In this
case, ATM interface 1.
6.1) Creation of VP 0. The ATM service class for O&M is UBR with a PCR of 4528
cps. (Refer to Table 30).
ZLCC:1:VP:0,,,U:U:4528:CPS:;
Overview of UMTS network evolution through radio and transmission feature validation Jorge Rafael Sevilla Castillo
191
6.2) Creation of VC 32 inside VP 0. It has the same parameters as VP 0.
ZLCC:1:VC:0:32:U,,U:U,,U:4528,CPS:4528,CPS:;
Monitoring solution with Nethawk M5 protocol analyzer
Introduction
The existence of an integrated monitoring system for all the interfaces in the
RNC is crucial for troubleshooting and investigating problems in the different network
elements of the RAN and Core Network, in particular, for the validation of Hybrid
Backhaul solution. If done inefficiently it can easily increase the cost of testing due to
the high prices of software and licensing of this kind of tools.
The main objective of this monitoring solution is to trace IuB, IuCS and IuPS
interfaces simultaneously for the same RNC irrespective of the amount of Node Bs
connected to it by using only one protocol analyzer.
The reason why IuPS and IuCS monitoring are required together with the IuB is
due to the ciphering method used between the UE and the Core Network. If the tracing
tool is able to get hold of the ciphering keys for a given call it will then be able to
decipher all the messages exchanged between the different protocols. Otherwise, the
tool will only be able to display ciphered messages with no sense for the engineer.
This was a key step not only for this validation but also for the rest of validation
projects managed in the lab environment.
This solution was designed for a single RNC, however, with enough number of
monitoring interfaces, the solution can be easily replicated in different RNCs and a
whole lab network can be traced from a centralized point.
Design
In order to implement this solution, the following is required:
Internal ATM cross-connections in the RNC (This concept will be explained
together with the monitoring layout).
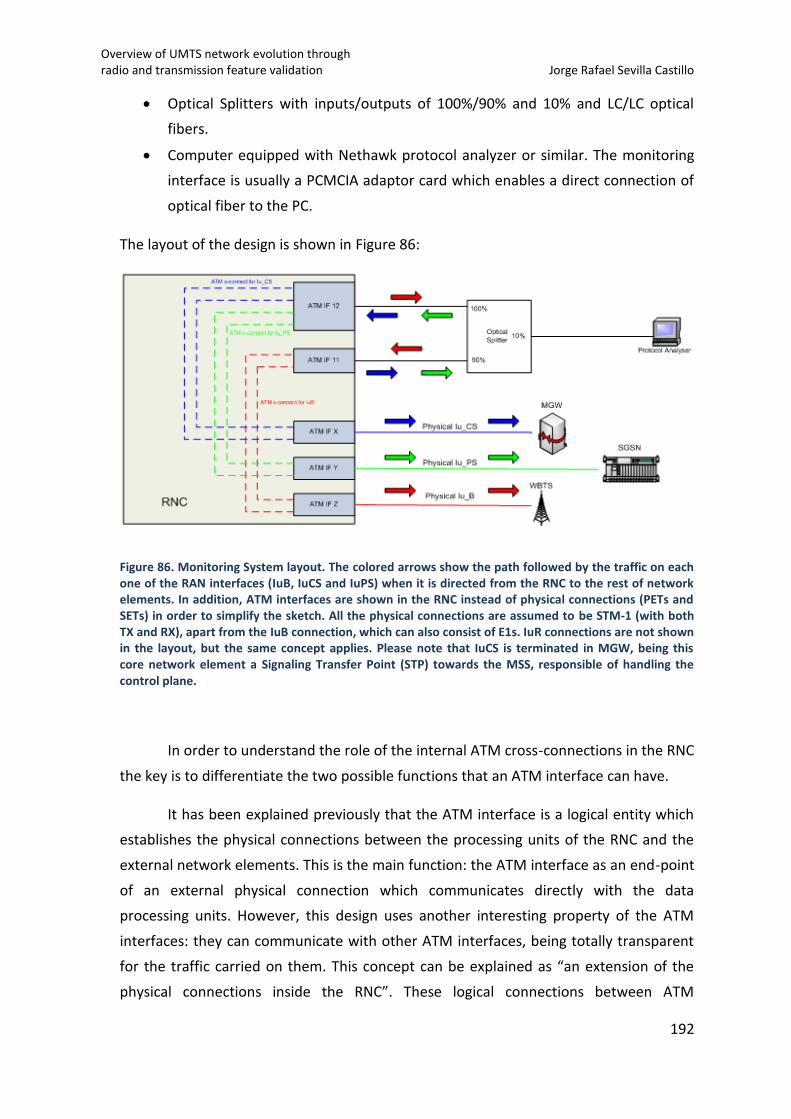
Overview of UMTS network evolution through radio and transmission feature validation Jorge Rafael Sevilla Castillo
192
Optical Splitters with inputs/outputs of 100%/90% and 10% and LC/LC optical
fibers.
Computer equipped with Nethawk protocol analyzer or similar. The monitoring
interface is usually a PCMCIA adaptor card which enables a direct connection of
optical fiber to the PC.
The layout of the design is shown in Figure 86:
Figure 86. Monitoring System layout. The colored arrows show the path followed by the traffic on each one of the RAN interfaces (IuB, IuCS and IuPS) when it is directed from the RNC to the rest of network elements. In addition, ATM interfaces are shown in the RNC instead of physical connections (PETs and SETs) in order to simplify the sketch. All the physical connections are assumed to be STM-1 (with both TX and RX), apart from the IuB connection, which can also consist of E1s. IuR connections are not shown in the layout, but the same concept applies. Please note that IuCS is terminated in MGW, being this core network element a Signaling Transfer Point (STP) towards the MSS, responsible of handling the control plane.
In order to understand the role of the internal ATM cross-connections in the RNC
the key is to differentiate the two possible functions that an ATM interface can have.
It has been explained previously that the ATM interface is a logical entity which
establishes the physical connections between the processing units of the RNC and the
external network elements. This is the main function: the ATM interface as an end-point
of an external physical connection which communicates directly with the data
processing units. However, this design uses another interesting property of the ATM
interfaces: they can communicate with other ATM interfaces, being totally transparent
for the traffic carried on them. This concept can be explained as “an extension of the
physical connections inside the RNC”. These logical connections between ATM

Overview of UMTS network evolution through radio and transmission feature validation Jorge Rafael Sevilla Castillo
193
interfaces are known as ATM cross-connections. Cross-connections can be made at VP
or VC level.
For example, referring back to Figure 85, it can be analyzed how the IuB traffic is
routed across the system from the RNC to the Node (red arrow). In this case, ATM
interface 12 is the end point/start point for the traffic coming/going from/to the Node
B. It then goes via the Optical Splitter, where a 10% of the signal is extracted for
analysis. The other 90% (the RNC SET sensitivity supports a 10% decrease in the signal
power) is routed back to ATM interface 11. Since this is not the ATM interface where the
Node B is connected physically, the traffic needs to be cross-connected from this
interface to ATM interface Z, which is the one containing the physical connection of the
Node B. Since both interface 11 and interface Z wants to remain transparent from the
traffic carried inside the VCs, the cross-connection is made at VP-level. Once there, the
traffic can reach to the Node B and the communication path is closed.
The same applies for IuCS and IuPS connections. In this case, ATM interface 11 is
the traffic end point, and internal cross-connections are set from ATM interface 12 to X
and Y, respectively.
Multiple logical ATM cross-connections can be applied to the same interface, so
in the common case that more than one Node B is connected to the RNC, the only
action required is to set up the required cross-connection between ATM interface 11
and the ATM interface where the physical connection of the Node B is set.
As an example, it is shown the necessary commands required to enable the IuB
interface monitoring of the 2 E1 link (8981cps in ATM capacity) when the Node B is
connected to ATM interface Z=1 (it is assumed that the ATM interface has been already
set up and that the ATM end point, ATM interface 12, has been created in the RNC GUI
as shown in section RNC transmission commissioning).
1) First of all, a VP with the same properties as the one created in ATM interface
12 (VP ID, peak cell rate and ATM service type) has to be created in interface
11. It will close the circuit IF 12 – Optical Splitter – IF 11. For the example it is
used VP ID=6, PCR=8981 cps and service type=CBR:
ZLCC:11,VP,6,,VP::C,,,C1,:C,,,C1::8981,CPS,:8981,CPS;
2) Creation of the cross-connection from interface 11 to interface 1. Usually the
VP configured in NODE B has an ID=1. When creating a cross-connection there
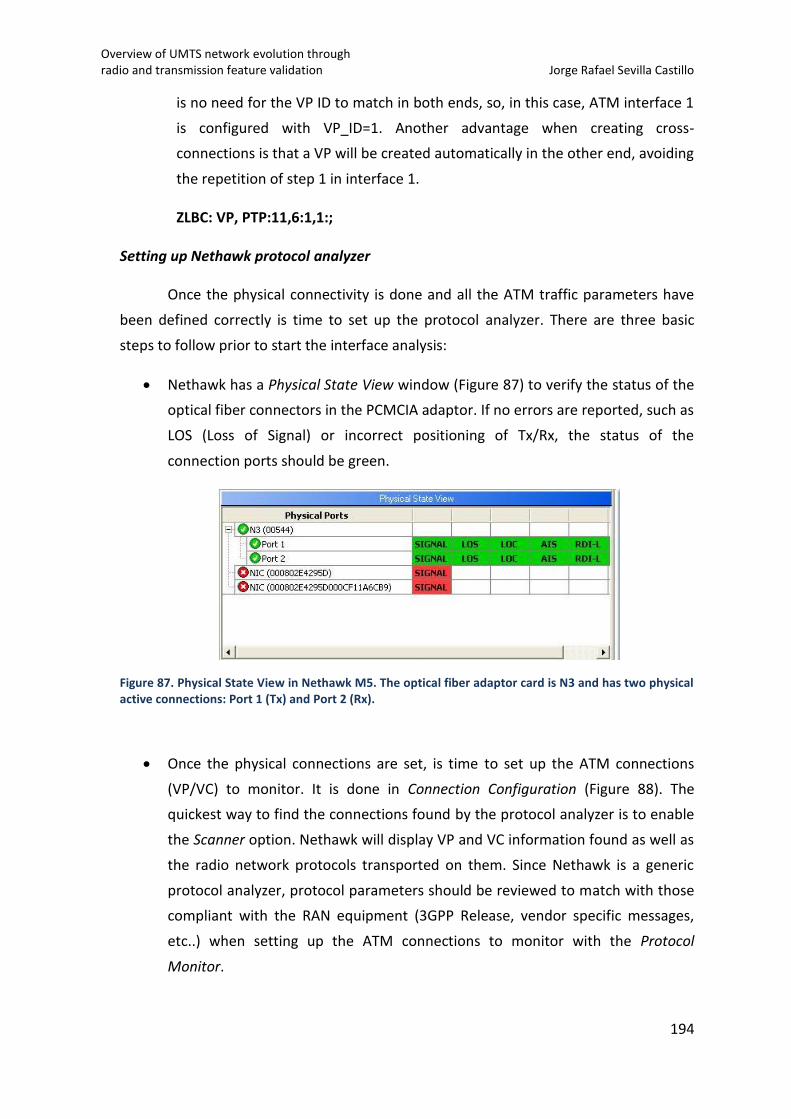
Overview of UMTS network evolution through radio and transmission feature validation Jorge Rafael Sevilla Castillo
194
is no need for the VP ID to match in both ends, so, in this case, ATM interface 1
is configured with VP_ID=1. Another advantage when creating cross-
connections is that a VP will be created automatically in the other end, avoiding
the repetition of step 1 in interface 1.
ZLBC: VP, PTP:11,6:1,1:;
Setting up Nethawk protocol analyzer
Once the physical connectivity is done and all the ATM traffic parameters have
been defined correctly is time to set up the protocol analyzer. There are three basic
steps to follow prior to start the interface analysis:
Nethawk has a Physical State View window (Figure 87) to verify the status of the
optical fiber connectors in the PCMCIA adaptor. If no errors are reported, such as
LOS (Loss of Signal) or incorrect positioning of Tx/Rx, the status of the
connection ports should be green.
Figure 87. Physical State View in Nethawk M5. The optical fiber adaptor card is N3 and has two physical active connections: Port 1 (Tx) and Port 2 (Rx).
Once the physical connections are set, is time to set up the ATM connections
(VP/VC) to monitor. It is done in Connection Configuration (Figure 88). The
quickest way to find the connections found by the protocol analyzer is to enable
the Scanner option. Nethawk will display VP and VC information found as well as
the radio network protocols transported on them. Since Nethawk is a generic
protocol analyzer, protocol parameters should be reviewed to match with those
compliant with the RAN equipment (3GPP Release, vendor specific messages,
etc..) when setting up the ATM connections to monitor with the Protocol
Monitor.
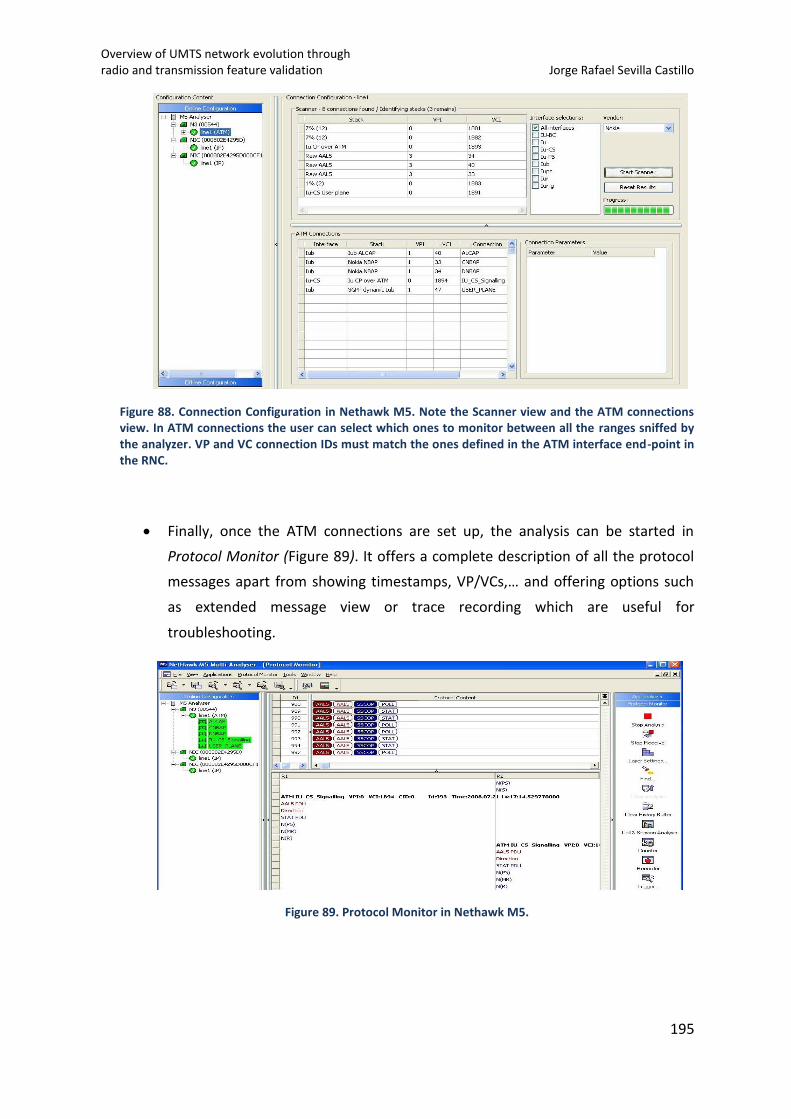
Overview of UMTS network evolution through radio and transmission feature validation Jorge Rafael Sevilla Castillo
195
Figure 88. Connection Configuration in Nethawk M5. Note the Scanner view and the ATM connections view. In ATM connections the user can select which ones to monitor between all the ranges sniffed by the analyzer. VP and VC connection IDs must match the ones defined in the ATM interface end-point in the RNC.
Finally, once the ATM connections are set up, the analysis can be started in
Protocol Monitor (Figure 89). It offers a complete description of all the protocol
messages apart from showing timestamps, VP/VCs,… and offering options such
as extended message view or trace recording which are useful for
troubleshooting.
Figure 89. Protocol Monitor in Nethawk M5.
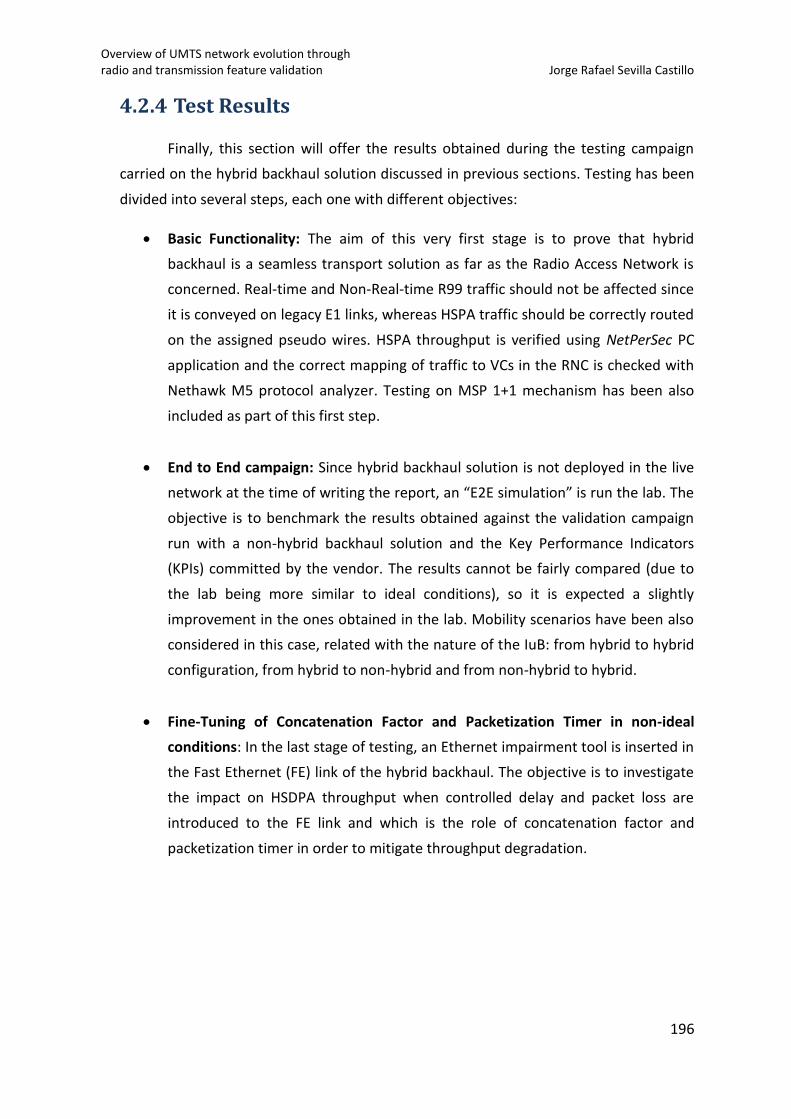
Overview of UMTS network evolution through radio and transmission feature validation Jorge Rafael Sevilla Castillo
196
4.2.4 Test Results
Finally, this section will offer the results obtained during the testing campaign
carried on the hybrid backhaul solution discussed in previous sections. Testing has been
divided into several steps, each one with different objectives:
Basic Functionality: The aim of this very first stage is to prove that hybrid
backhaul is a seamless transport solution as far as the Radio Access Network is
concerned. Real-time and Non-Real-time R99 traffic should not be affected since
it is conveyed on legacy E1 links, whereas HSPA traffic should be correctly routed
on the assigned pseudo wires. HSPA throughput is verified using NetPerSec PC
application and the correct mapping of traffic to VCs in the RNC is checked with
Nethawk M5 protocol analyzer. Testing on MSP 1+1 mechanism has been also
included as part of this first step.
End to End campaign: Since hybrid backhaul solution is not deployed in the live
network at the time of writing the report, an “E2E simulation” is run the lab. The
objective is to benchmark the results obtained against the validation campaign
run with a non-hybrid backhaul solution and the Key Performance Indicators
(KPIs) committed by the vendor. The results cannot be fairly compared (due to
the lab being more similar to ideal conditions), so it is expected a slightly
improvement in the ones obtained in the lab. Mobility scenarios have been also
considered in this case, related with the nature of the IuB: from hybrid to hybrid
configuration, from hybrid to non-hybrid and from non-hybrid to hybrid.
Fine-Tuning of Concatenation Factor and Packetization Timer in non-ideal
conditions: In the last stage of testing, an Ethernet impairment tool is inserted in
the Fast Ethernet (FE) link of the hybrid backhaul. The objective is to investigate
the impact on HSDPA throughput when controlled delay and packet loss are
introduced to the FE link and which is the role of concatenation factor and
packetization timer in order to mitigate throughput degradation.
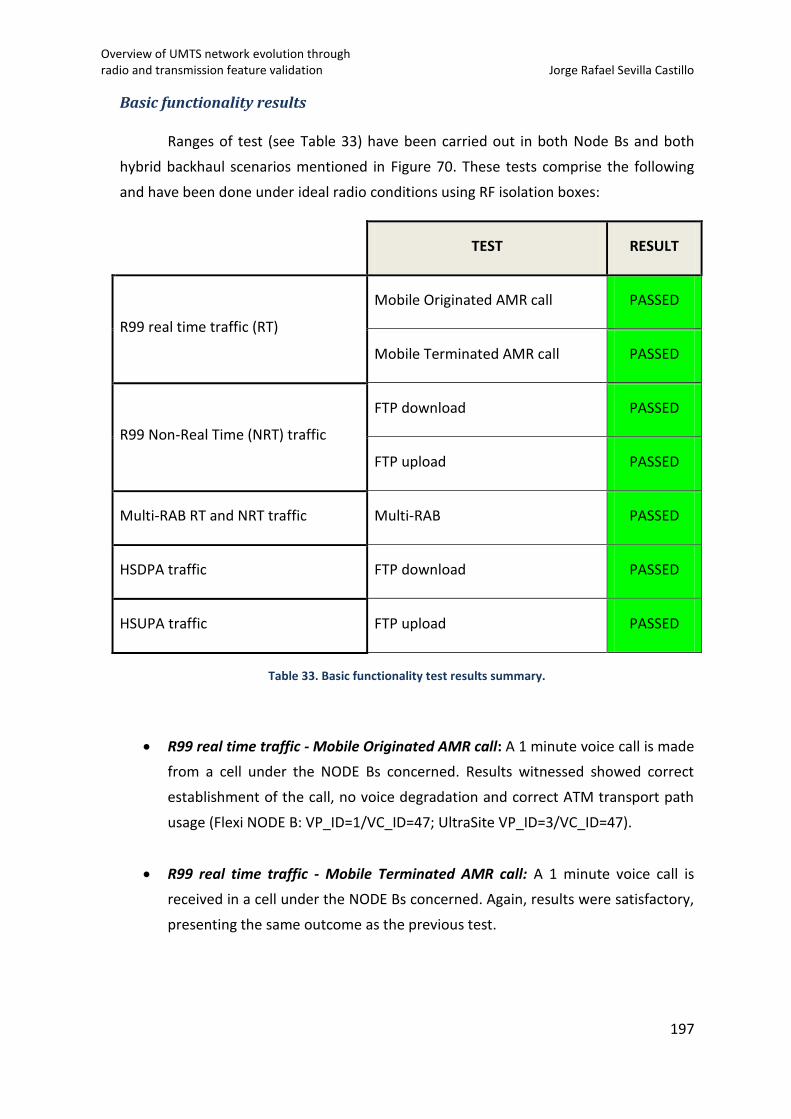
Overview of UMTS network evolution through radio and transmission feature validation Jorge Rafael Sevilla Castillo
197
Basic functionality results
Ranges of test (see Table 33) have been carried out in both Node Bs and both
hybrid backhaul scenarios mentioned in Figure 70. These tests comprise the following
and have been done under ideal radio conditions using RF isolation boxes:
TEST RESULT
R99 real time traffic (RT)
Mobile Originated AMR call PASSED
Mobile Terminated AMR call PASSED
R99 Non-Real Time (NRT) traffic
FTP download PASSED
FTP upload PASSED
Multi-RAB RT and NRT traffic Multi-RAB PASSED
HSDPA traffic FTP download PASSED
HSUPA traffic FTP upload PASSED
Table 33. Basic functionality test results summary.
R99 real time traffic - Mobile Originated AMR call: A 1 minute voice call is made
from a cell under the NODE Bs concerned. Results witnessed showed correct
establishment of the call, no voice degradation and correct ATM transport path
usage (Flexi NODE B: VP_ID=1/VC_ID=47; UltraSite VP_ID=3/VC_ID=47).
R99 real time traffic - Mobile Terminated AMR call: A 1 minute voice call is
received in a cell under the NODE Bs concerned. Again, results were satisfactory,
presenting the same outcome as the previous test.
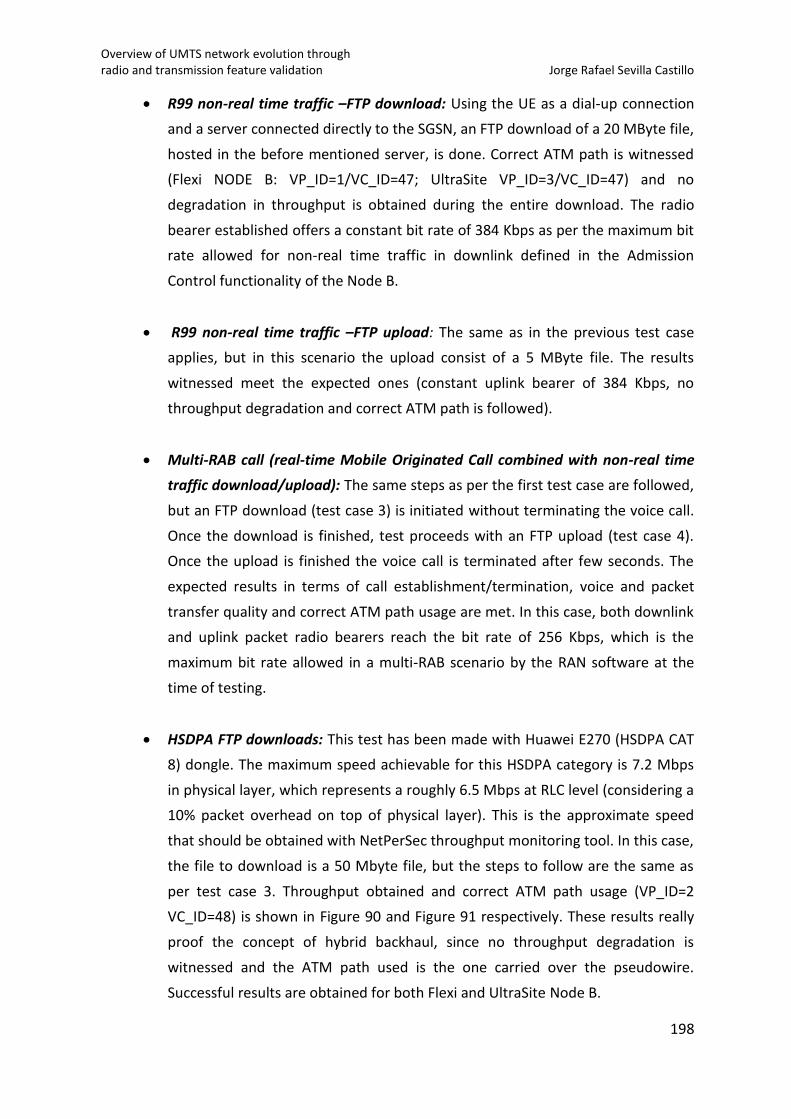
Overview of UMTS network evolution through radio and transmission feature validation Jorge Rafael Sevilla Castillo
198
R99 non-real time traffic –FTP download: Using the UE as a dial-up connection
and a server connected directly to the SGSN, an FTP download of a 20 MByte file,
hosted in the before mentioned server, is done. Correct ATM path is witnessed
(Flexi NODE B: VP_ID=1/VC_ID=47; UltraSite VP_ID=3/VC_ID=47) and no
degradation in throughput is obtained during the entire download. The radio
bearer established offers a constant bit rate of 384 Kbps as per the maximum bit
rate allowed for non-real time traffic in downlink defined in the Admission
Control functionality of the Node B.
R99 non-real time traffic –FTP upload: The same as in the previous test case
applies, but in this scenario the upload consist of a 5 MByte file. The results
witnessed meet the expected ones (constant uplink bearer of 384 Kbps, no
throughput degradation and correct ATM path is followed).
Multi-RAB call (real-time Mobile Originated Call combined with non-real time
traffic download/upload): The same steps as per the first test case are followed,
but an FTP download (test case 3) is initiated without terminating the voice call.
Once the download is finished, test proceeds with an FTP upload (test case 4).
Once the upload is finished the voice call is terminated after few seconds. The
expected results in terms of call establishment/termination, voice and packet
transfer quality and correct ATM path usage are met. In this case, both downlink
and uplink packet radio bearers reach the bit rate of 256 Kbps, which is the
maximum bit rate allowed in a multi-RAB scenario by the RAN software at the
time of testing.
HSDPA FTP downloads: This test has been made with Huawei E270 (HSDPA CAT
8) dongle. The maximum speed achievable for this HSDPA category is 7.2 Mbps
in physical layer, which represents a roughly 6.5 Mbps at RLC level (considering a
10% packet overhead on top of physical layer). This is the approximate speed
that should be obtained with NetPerSec throughput monitoring tool. In this case,
the file to download is a 50 Mbyte file, but the steps to follow are the same as
per test case 3. Throughput obtained and correct ATM path usage (VP_ID=2
VC_ID=48) is shown in Figure 90 and Figure 91 respectively. These results really
proof the concept of hybrid backhaul, since no throughput degradation is
witnessed and the ATM path used is the one carried over the pseudowire.
Successful results are obtained for both Flexi and UltraSite Node B.
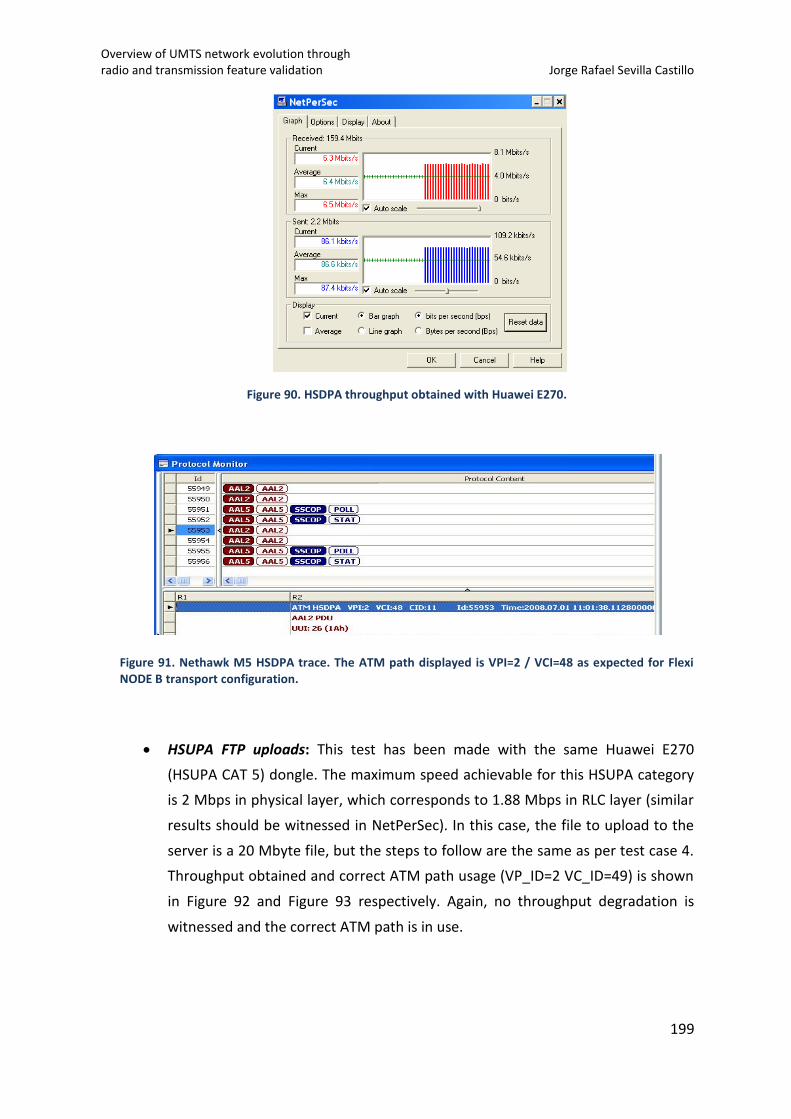
Overview of UMTS network evolution through radio and transmission feature validation Jorge Rafael Sevilla Castillo
199
Figure 90. HSDPA throughput obtained with Huawei E270.
Figure 91. Nethawk M5 HSDPA trace. The ATM path displayed is VPI=2 / VCI=48 as expected for Flexi NODE B transport configuration.
HSUPA FTP uploads: This test has been made with the same Huawei E270
(HSUPA CAT 5) dongle. The maximum speed achievable for this HSUPA category
is 2 Mbps in physical layer, which corresponds to 1.88 Mbps in RLC layer (similar
results should be witnessed in NetPerSec). In this case, the file to upload to the
server is a 20 Mbyte file, but the steps to follow are the same as per test case 4.
Throughput obtained and correct ATM path usage (VP_ID=2 VC_ID=49) is shown
in Figure 92 and Figure 93 respectively. Again, no throughput degradation is
witnessed and the correct ATM path is in use.
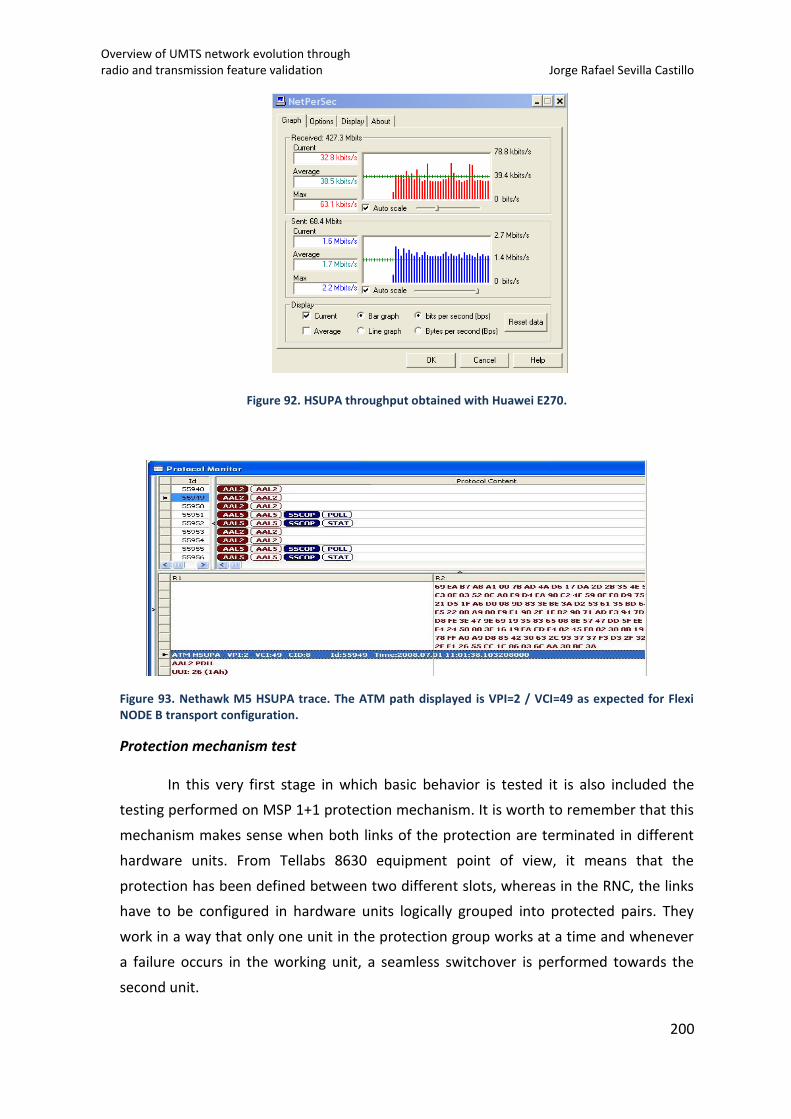
Overview of UMTS network evolution through radio and transmission feature validation Jorge Rafael Sevilla Castillo
200
Figure 92. HSUPA throughput obtained with Huawei E270.
Figure 93. Nethawk M5 HSUPA trace. The ATM path displayed is VPI=2 / VCI=49 as expected for Flexi NODE B transport configuration.
Protection mechanism test
In this very first stage in which basic behavior is tested it is also included the
testing performed on MSP 1+1 protection mechanism. It is worth to remember that this
mechanism makes sense when both links of the protection are terminated in different
hardware units. From Tellabs 8630 equipment point of view, it means that the
protection has been defined between two different slots, whereas in the RNC, the links
have to be configured in hardware units logically grouped into protected pairs. They
work in a way that only one unit in the protection group works at a time and whenever
a failure occurs in the working unit, a seamless switchover is performed towards the
second unit.
Overview of UMTS network evolution through radio and transmission feature validation Jorge Rafael Sevilla Castillo
201
During this study three different scenarios have been tested. Hardware unit
failures have been simulated either by forcing switchovers between units or by setting
virtual faulty flags via MML commands in the RNC. A forced switchover is simulated by
changing the status of the unit to SE-NH (Separated – No Hardware), which indicates to
the system that the unit cannot be used. A continuous HSDPA download is running
during the execution of the test.
1. Forced hardware unit switchover in a non-revertive configuration
Non-revertive implies that once the connection is set up in the protection
link after a fault, traffic will not be returned to the working section even if
recovered from the fault.
Result:
o First of all, a forced switchover is applied between the working and the
protection hardware units, being harmless for the ongoing call.
o Once the status of the working unit is changed back to WO-EX (Working -
Executed), the traffic still is carried over the protection unit, which is the
expected behavior.
o Once in this situation, it was also interesting to see what could happen if
the physical STM-1 link of the protection path was broken (removed from
the interface). The outcome was that the call was diverted back to the
working section without dropping the call. This behavior proved further
robustness of the system since a lack of physical connectivity
automatically triggered a switchover irrespectively of the non-revertive
nature of the MSP 1+1 mechanism applied.
2. Link removal in a revertive configuration
Revertive implies that once the working section of the protection system has
recovered from a fault and once the wait-until-restore timer has expired, the
data is automatically switched from the protection to the working path.
Overview of UMTS network evolution through radio and transmission feature validation Jorge Rafael Sevilla Castillo
202
Result:
o Physical STM-1 link is removed manually from the working section and re-
stored after few seconds. Traffic was then switched to the protection link
and diverted back to the working section once the timer expired, being
that the expected result. It has to be considered that the timer is defined
in both ends of the communication, so the most restrictive timer from
both equipments will define the time to switch the traffic back to the
working section. During the test, a 30 s timer was defined in the RNC and
a 200 s in the Tellabs 8630. The recovering time was 200 s as expected,
since the highest value is the most restrictive in timers dedicated for
redundancy assurance services.
3. Hardware unit failure forced in a revertive configuration
Result:
o “FLTY” (faulty) flag was set to the working hardware unit. It forced the
unit to perform an internal health check and the communication was
switched to the protection unit and traffic remained undisrupted as
expected. However, in the RNC GUI the connection towards the Node B
appeared to be blocked. After the working hardware interface finished
the internal testing and the timer expired, the traffic was switched back
to the working unit and the RNC GUI showed again the connection as
working. Even though the traffic was not disrupted at any time, the issue
related with the RNC GUI was reported to the vendor and a fix was
provided in the next software release.
End to End Campaign Results
Table 34 summarizes the tests executed for hybrid backhaul, together with the
KPIs to meet in order to verify the correct behavior of the system. The test setup used
during this test campaign is the second one presented in Figure 70. Static test have been
run only in Flexi NODE B. UltraSite NODE B has been used for handover scenarios and its
IuB backhaul has been changed to a non-hybrid solution with 4 x E1s when necessary.
All test cases have been done under an RF-controlled environment and the UEs
used are Nokia N95 (HSDPA CAT6) and Huawei E270 (HSDPA CAT8 / HSUPA CAT5).
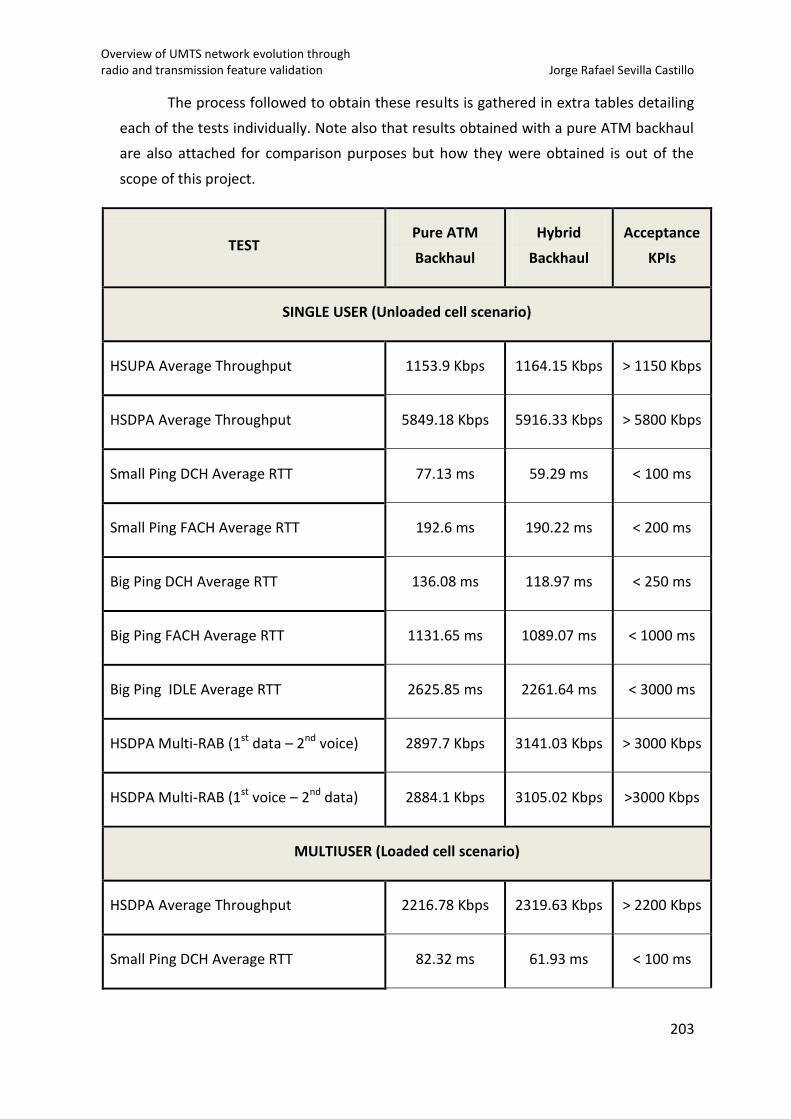
Overview of UMTS network evolution through radio and transmission feature validation Jorge Rafael Sevilla Castillo
203
The process followed to obtain these results is gathered in extra tables detailing
each of the tests individually. Note also that results obtained with a pure ATM backhaul
are also attached for comparison purposes but how they were obtained is out of the
scope of this project.
TEST Pure ATM
Backhaul
Hybrid
Backhaul
Acceptance
KPIs
SINGLE USER (Unloaded cell scenario)
HSUPA Average Throughput 1153.9 Kbps 1164.15 Kbps > 1150 Kbps
HSDPA Average Throughput 5849.18 Kbps 5916.33 Kbps > 5800 Kbps
Small Ping DCH Average RTT 77.13 ms 59.29 ms < 100 ms
Small Ping FACH Average RTT 192.6 ms 190.22 ms < 200 ms
Big Ping DCH Average RTT 136.08 ms 118.97 ms < 250 ms
Big Ping FACH Average RTT 1131.65 ms 1089.07 ms < 1000 ms
Big Ping IDLE Average RTT 2625.85 ms 2261.64 ms < 3000 ms
HSDPA Multi-RAB (1st data – 2nd voice) 2897.7 Kbps 3141.03 Kbps > 3000 Kbps
HSDPA Multi-RAB (1st voice – 2nd data) 2884.1 Kbps 3105.02 Kbps >3000 Kbps
MULTIUSER (Loaded cell scenario)
HSDPA Average Throughput 2216.78 Kbps 2319.63 Kbps > 2200 Kbps
Small Ping DCH Average RTT 82.32 ms 61.93 ms < 100 ms
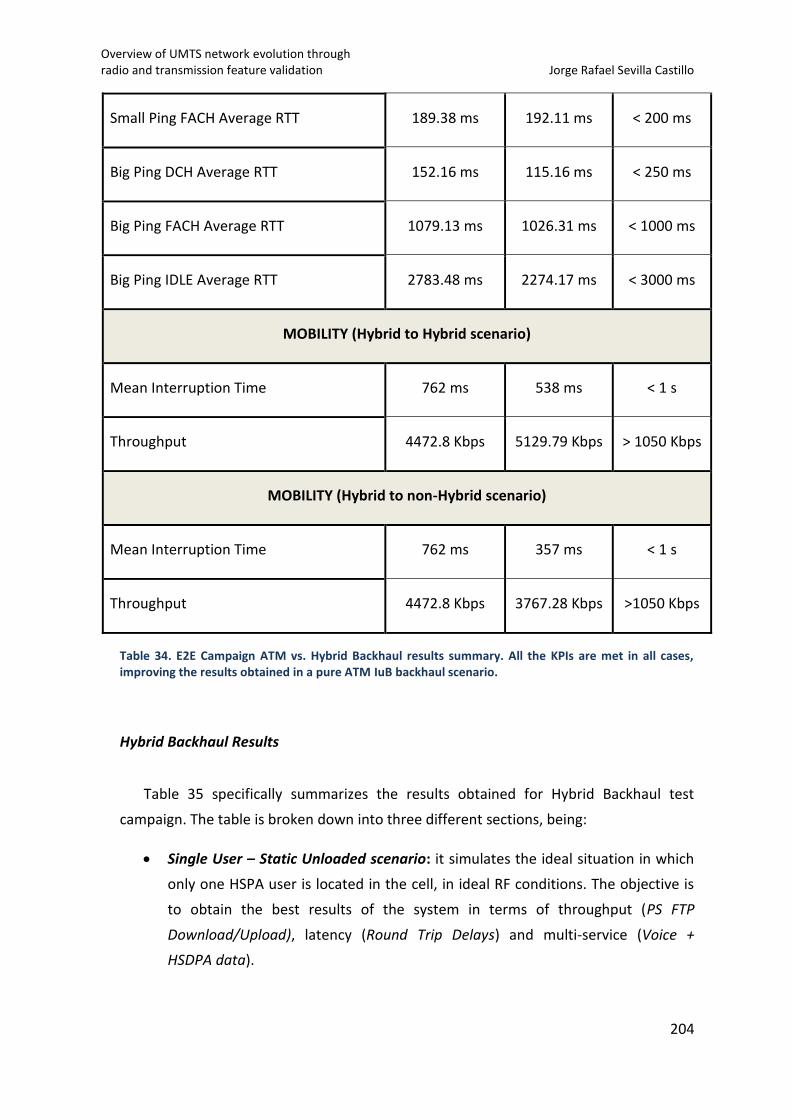
Overview of UMTS network evolution through radio and transmission feature validation Jorge Rafael Sevilla Castillo
204
Small Ping FACH Average RTT 189.38 ms 192.11 ms < 200 ms
Big Ping DCH Average RTT 152.16 ms 115.16 ms < 250 ms
Big Ping FACH Average RTT 1079.13 ms 1026.31 ms < 1000 ms
Big Ping IDLE Average RTT 2783.48 ms 2274.17 ms < 3000 ms
MOBILITY (Hybrid to Hybrid scenario)
Mean Interruption Time 762 ms 538 ms < 1 s
Throughput 4472.8 Kbps 5129.79 Kbps > 1050 Kbps
MOBILITY (Hybrid to non-Hybrid scenario)
Mean Interruption Time 762 ms 357 ms < 1 s
Throughput 4472.8 Kbps 3767.28 Kbps >1050 Kbps
Table 34. E2E Campaign ATM vs. Hybrid Backhaul results summary. All the KPIs are met in all cases, improving the results obtained in a pure ATM IuB backhaul scenario.
Hybrid Backhaul Results
Table 35 specifically summarizes the results obtained for Hybrid Backhaul test
campaign. The table is broken down into three different sections, being:
Single User – Static Unloaded scenario: it simulates the ideal situation in which
only one HSPA user is located in the cell, in ideal RF conditions. The objective is
to obtain the best results of the system in terms of throughput (PS FTP
Download/Upload), latency (Round Trip Delays) and multi-service (Voice +
HSDPA data).
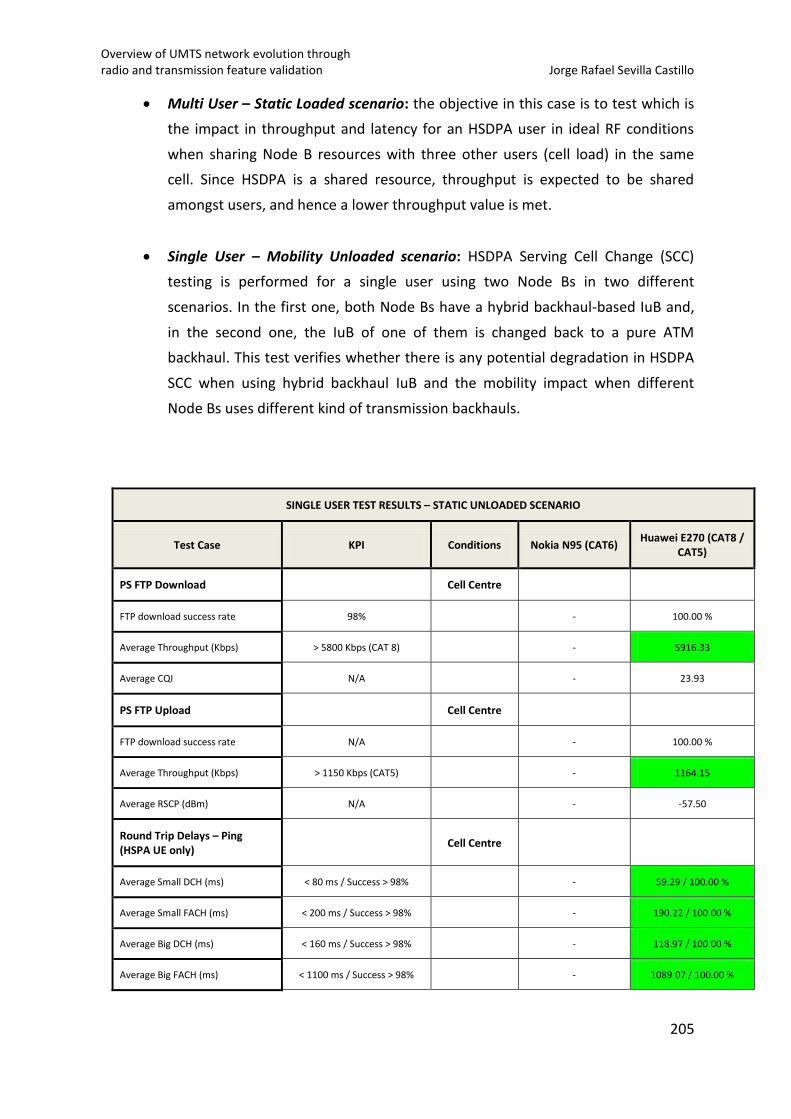
Overview of UMTS network evolution through radio and transmission feature validation Jorge Rafael Sevilla Castillo
205
Multi User – Static Loaded scenario: the objective in this case is to test which is
the impact in throughput and latency for an HSDPA user in ideal RF conditions
when sharing Node B resources with three other users (cell load) in the same
cell. Since HSDPA is a shared resource, throughput is expected to be shared
amongst users, and hence a lower throughput value is met.
Single User – Mobility Unloaded scenario: HSDPA Serving Cell Change (SCC)
testing is performed for a single user using two Node Bs in two different
scenarios. In the first one, both Node Bs have a hybrid backhaul-based IuB and,
in the second one, the IuB of one of them is changed back to a pure ATM
backhaul. This test verifies whether there is any potential degradation in HSDPA
SCC when using hybrid backhaul IuB and the mobility impact when different
Node Bs uses different kind of transmission backhauls.
SINGLE USER TEST RESULTS – STATIC UNLOADED SCENARIO
Test Case KPI Conditions Nokia N95 (CAT6) Huawei E270 (CAT8 /
CAT5)
PS FTP Download Cell Centre
FTP download success rate 98% - 100.00 %
Average Throughput (Kbps) > 5800 Kbps (CAT 8) - 5916.33
Average CQI N/A - 23.93
PS FTP Upload Cell Centre
FTP download success rate N/A - 100.00 %
Average Throughput (Kbps) > 1150 Kbps (CAT5) - 1164.15
Average RSCP (dBm) N/A - -57.50
Round Trip Delays – Ping (HSPA UE only)
Cell Centre
Average Small DCH (ms) < 80 ms / Success > 98% - 59.29 / 100.00 %
Average Small FACH (ms) < 200 ms / Success > 98% - 190.22 / 100.00 %
Average Big DCH (ms) < 160 ms / Success > 98% - 118.97 / 100.00 %
Average Big FACH (ms) < 1100 ms / Success > 98% - 1089.07 / 100.00 %
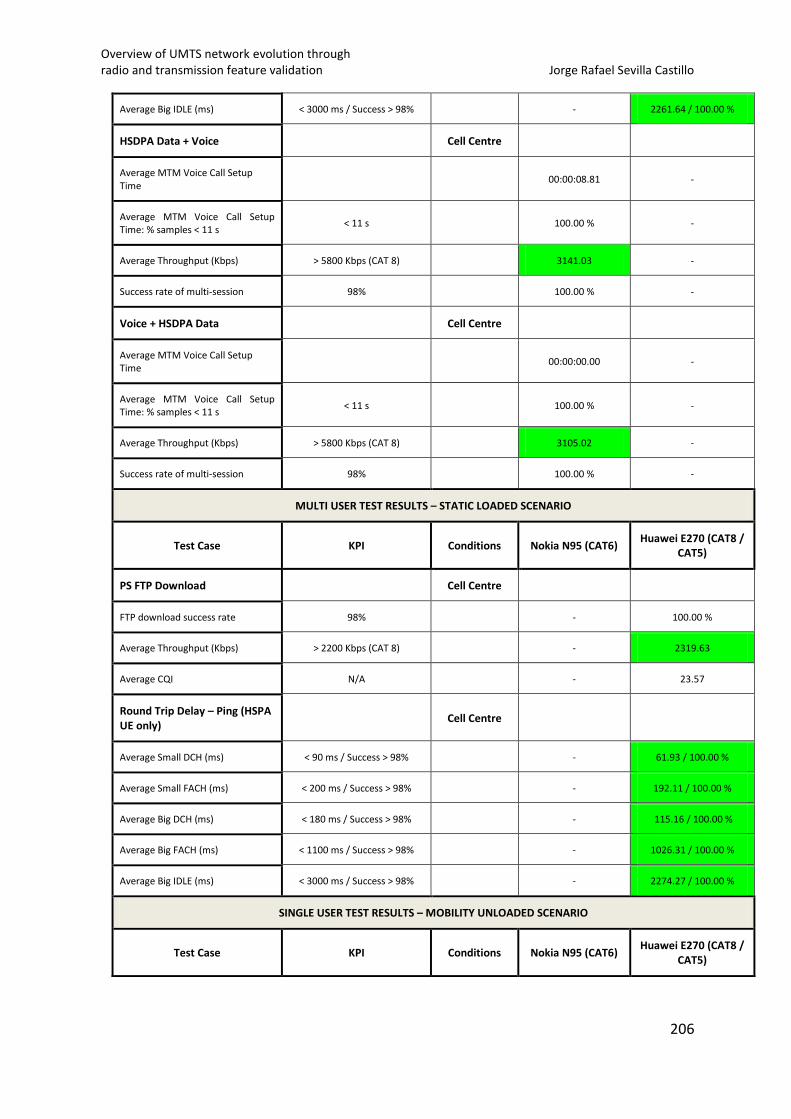
Overview of UMTS network evolution through radio and transmission feature validation Jorge Rafael Sevilla Castillo
206
Average Big IDLE (ms) < 3000 ms / Success > 98% - 2261.64 / 100.00 %
HSDPA Data + Voice Cell Centre
Average MTM Voice Call Setup Time
00:00:08.81 -
Average MTM Voice Call Setup Time: % samples < 11 s
< 11 s
100.00 % -
Average Throughput (Kbps) > 5800 Kbps (CAT 8) 3141.03 -
Success rate of multi-session 98% 100.00 % -
Voice + HSDPA Data Cell Centre
Average MTM Voice Call Setup Time
00:00:00.00 -
Average MTM Voice Call Setup Time: % samples < 11 s
< 11 s 100.00 % -
Average Throughput (Kbps) > 5800 Kbps (CAT 8) 3105.02 -
Success rate of multi-session 98% 100.00 % -
MULTI USER TEST RESULTS – STATIC LOADED SCENARIO
Test Case KPI Conditions Nokia N95 (CAT6) Huawei E270 (CAT8 /
CAT5)
PS FTP Download Cell Centre
FTP download success rate 98% - 100.00 %
Average Throughput (Kbps) > 2200 Kbps (CAT 8) - 2319.63
Average CQI N/A - 23.57
Round Trip Delay – Ping (HSPA UE only)
Cell Centre
Average Small DCH (ms) < 90 ms / Success > 98% - 61.93 / 100.00 %
Average Small FACH (ms) < 200 ms / Success > 98% - 192.11 / 100.00 %
Average Big DCH (ms) < 180 ms / Success > 98% - 115.16 / 100.00 %
Average Big FACH (ms) < 1100 ms / Success > 98% - 1026.31 / 100.00 %
Average Big IDLE (ms) < 3000 ms / Success > 98% - 2274.27 / 100.00 %
SINGLE USER TEST RESULTS – MOBILITY UNLOADED SCENARIO
Test Case KPI Conditions Nokia N95 (CAT6) Huawei E270 (CAT8 /
CAT5)
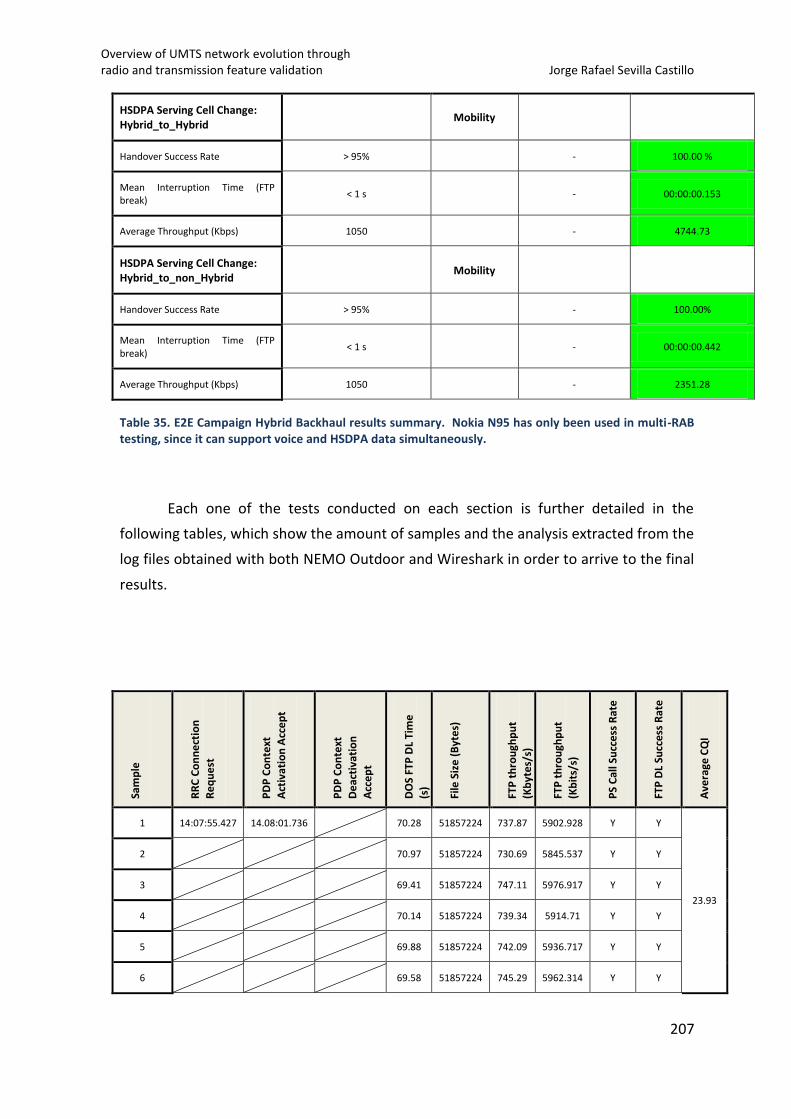
Overview of UMTS network evolution through radio and transmission feature validation Jorge Rafael Sevilla Castillo
207
HSDPA Serving Cell Change: Hybrid_to_Hybrid
Mobility
Handover Success Rate > 95% - 100.00 %
Mean Interruption Time (FTP break)
< 1 s - 00:00:00.153
Average Throughput (Kbps) 1050 - 4744.73
HSDPA Serving Cell Change: Hybrid_to_non_Hybrid
Mobility
Handover Success Rate > 95% - 100.00%
Mean Interruption Time (FTP break)
< 1 s - 00:00:00.442
Average Throughput (Kbps) 1050 - 2351.28
Table 35. E2E Campaign Hybrid Backhaul results summary. Nokia N95 has only been used in multi-RAB testing, since it can support voice and HSDPA data simultaneously.
Each one of the tests conducted on each section is further detailed in the
following tables, which show the amount of samples and the analysis extracted from the
log files obtained with both NEMO Outdoor and Wireshark in order to arrive to the final
results.
Sam
ple
RR
C C
on
ne
ctio
n
Re
qu
est
PD
P C
on
text
Act
ivat
ion
Acc
ep
t
PD
P C
on
text
De
acti
vati
on
Acc
ep
t
DO
S FT
P D
L Ti
me
(s)
File
Siz
e (
Byt
es)
FTP
th
rou
ghp
ut
(Kb
yte
s/s)
FTP
th
rou
ghp
ut
(Kb
its/
s)
PS
Cal
l Su
cce
ss R
ate
FTP
DL
Succ
ess
Rat
e
Ave
rage
CQ
I
1 14:07:55.427 14.08:01.736 70.28 51857224 737.87 5902.928 Y Y
23.93
2 70.97 51857224 730.69 5845.537 Y Y
3 69.41 51857224 747.11 5976.917 Y Y
4 70.14 51857224 739.34 5914.71 Y Y
5 69.88 51857224 742.09 5936.717 Y Y
6 69.58 51857224 745.29 5962.314 Y Y
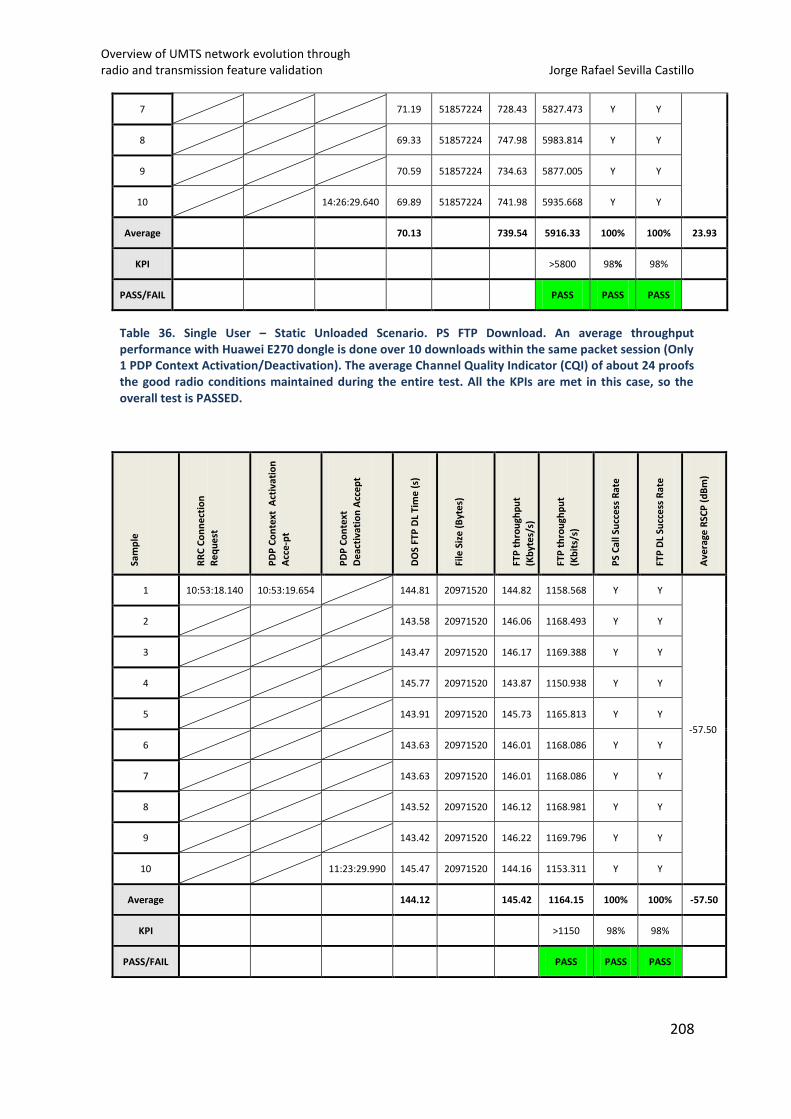
Overview of UMTS network evolution through radio and transmission feature validation Jorge Rafael Sevilla Castillo
208
7 71.19 51857224 728.43 5827.473 Y Y
8 69.33 51857224 747.98 5983.814 Y Y
9 70.59 51857224 734.63 5877.005 Y Y
10 14:26:29.640 69.89 51857224 741.98 5935.668 Y Y
Average 70.13 739.54 5916.33 100% 100% 23.93
KPI >5800 98% 98%
PASS/FAIL PASS PASS PASS
Table 36. Single User – Static Unloaded Scenario. PS FTP Download. An average throughput performance with Huawei E270 dongle is done over 10 downloads within the same packet session (Only 1 PDP Context Activation/Deactivation). The average Channel Quality Indicator (CQI) of about 24 proofs the good radio conditions maintained during the entire test. All the KPIs are met in this case, so the overall test is PASSED.
Sam
ple
RR
C C
on
ne
ctio
n
Re
qu
est
PD
P C
on
text
Act
ivat
ion
A
cce-
pt
PD
P C
on
text
De
acti
vati
on
Acc
ep
t
DO
S FT
P D
L Ti
me
(s)
File
Siz
e (
Byt
es)
FTP
th
rou
ghp
ut
(Kb
yte
s/s)
FTP
th
rou
ghp
ut
(Kb
its/
s)
PS
Cal
l Su
cces
s R
ate
FTP
DL
Succ
ess
Rat
e
Ave
rage
RSC
P (
dB
m)
1 10:53:18.140 10:53:19.654 144.81 20971520 144.82 1158.568 Y Y
-57.50
2 143.58 20971520 146.06 1168.493 Y Y
3 143.47 20971520 146.17 1169.388 Y Y
4 145.77 20971520 143.87 1150.938 Y Y
5 143.91 20971520 145.73 1165.813 Y Y
6 143.63 20971520 146.01 1168.086 Y Y
7 143.63 20971520 146.01 1168.086 Y Y
8 143.52 20971520 146.12 1168.981 Y Y
9 143.42 20971520 146.22 1169.796 Y Y
10 11:23:29.990 145.47 20971520 144.16 1153.311 Y Y
Average 144.12 145.42 1164.15 100% 100% -57.50
KPI >1150 98% 98%
PASS/FAIL PASS PASS PASS
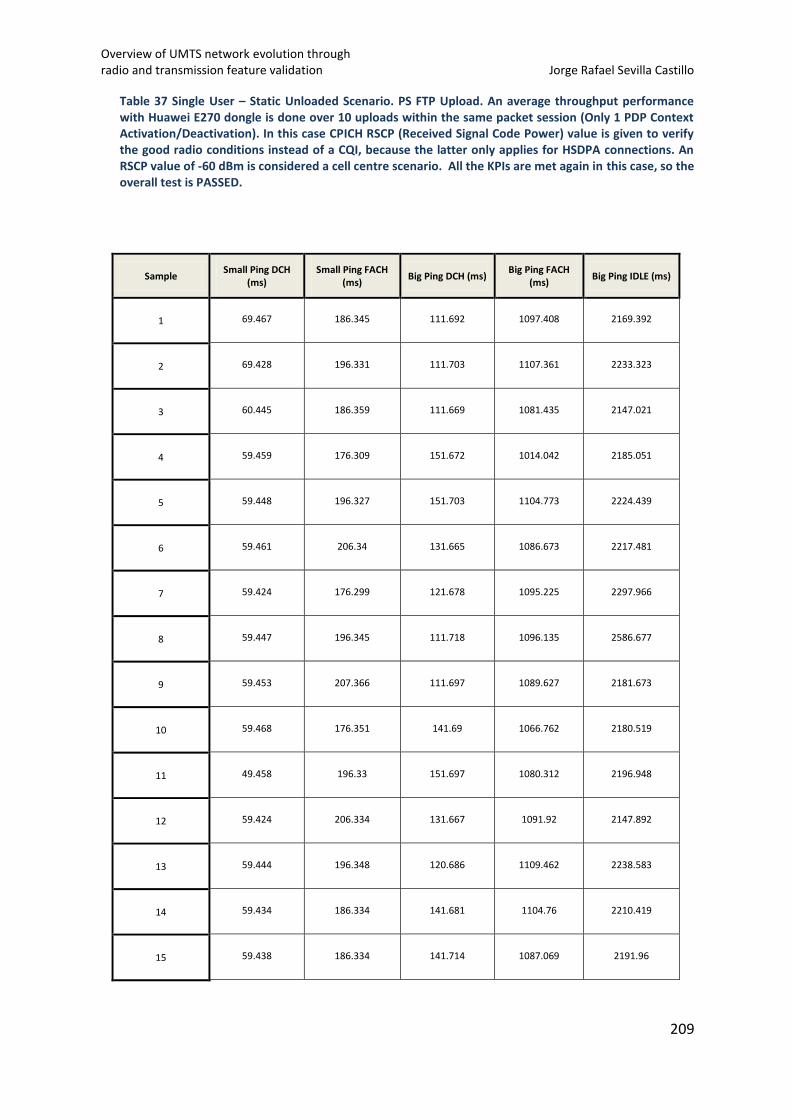
Overview of UMTS network evolution through radio and transmission feature validation Jorge Rafael Sevilla Castillo
209
Table 37 Single User – Static Unloaded Scenario. PS FTP Upload. An average throughput performance with Huawei E270 dongle is done over 10 uploads within the same packet session (Only 1 PDP Context Activation/Deactivation). In this case CPICH RSCP (Received Signal Code Power) value is given to verify the good radio conditions instead of a CQI, because the latter only applies for HSDPA connections. An RSCP value of -60 dBm is considered a cell centre scenario. All the KPIs are met again in this case, so the overall test is PASSED.
Sample Small Ping DCH
(ms) Small Ping FACH
(ms) Big Ping DCH (ms)
Big Ping FACH (ms)
Big Ping IDLE (ms)
1 69.467 186.345 111.692 1097.408 2169.392
2 69.428 196.331 111.703 1107.361 2233.323
3 60.445 186.359 111.669 1081.435 2147.021
4 59.459 176.309 151.672 1014.042 2185.051
5 59.448 196.327 151.703 1104.773 2224.439
6 59.461 206.34 131.665 1086.673 2217.481
7 59.424 176.299 121.678 1095.225 2297.966
8 59.447 196.345 111.718 1096.135 2586.677
9 59.453 207.366 111.697 1089.627 2181.673
10 59.468 176.351 141.69 1066.762 2180.519
11 49.458 196.33 151.697 1080.312 2196.948
12 59.424 206.334 131.667 1091.92 2147.892
13 59.444 196.348 120.686 1109.462 2238.583
14 59.434 186.334 141.681 1104.76 2210.419
15 59.438 186.334 141.714 1087.069 2191.96
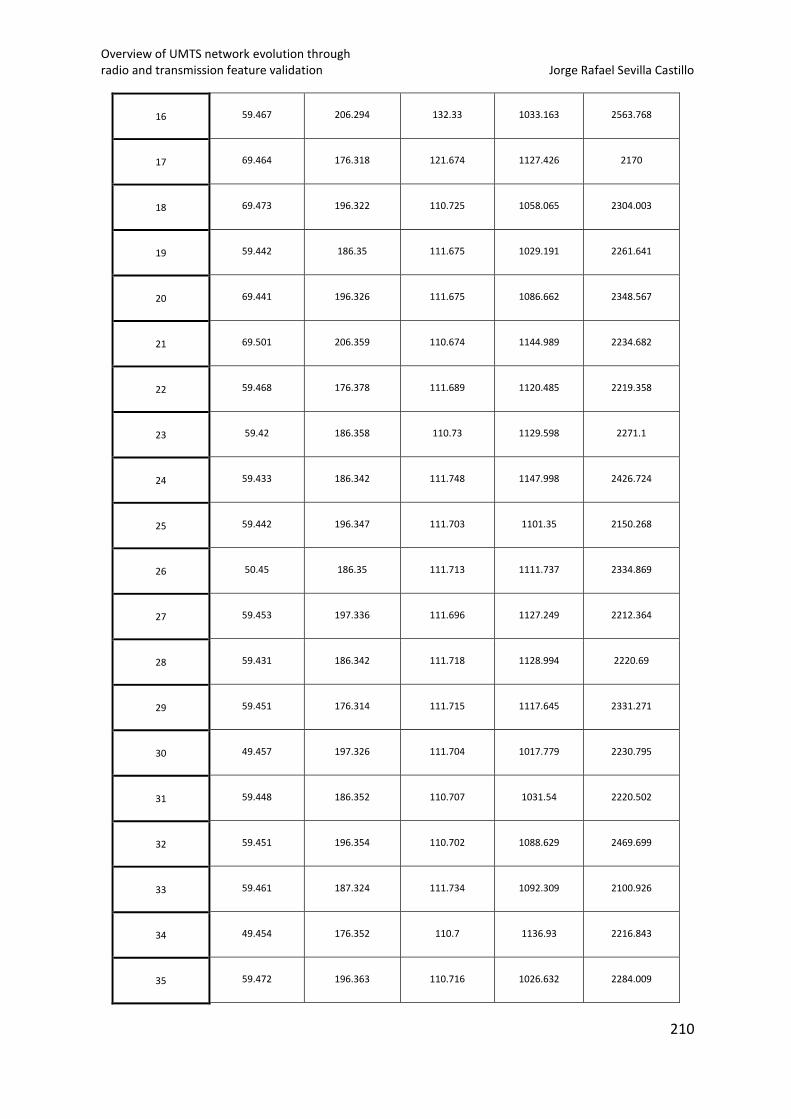
Overview of UMTS network evolution through radio and transmission feature validation Jorge Rafael Sevilla Castillo
210
16 59.467 206.294 132.33 1033.163 2563.768
17 69.464 176.318 121.674 1127.426 2170
18 69.473 196.322 110.725 1058.065 2304.003
19 59.442 186.35 111.675 1029.191 2261.641
20 69.441 196.326 111.675 1086.662 2348.567
21 69.501 206.359 110.674 1144.989 2234.682
22 59.468 176.378 111.689 1120.485 2219.358
23 59.42 186.358 110.73 1129.598 2271.1
24 59.433 186.342 111.748 1147.998 2426.724
25 59.442 196.347 111.703 1101.35 2150.268
26 50.45 186.35 111.713 1111.737 2334.869
27 59.453 197.336 111.696 1127.249 2212.364
28 59.431 186.342 111.718 1128.994 2220.69
29 59.451 176.314 111.715 1117.645 2331.271
30 49.457 197.326 111.704 1017.779 2230.795
31 59.448 186.352 110.707 1031.54 2220.502
32 59.451 196.354 110.702 1088.629 2469.699
33 59.461 187.324 111.734 1092.309 2100.926
34 49.454 176.352 110.7 1136.93 2216.843
35 59.472 196.363 110.716 1026.632 2284.009
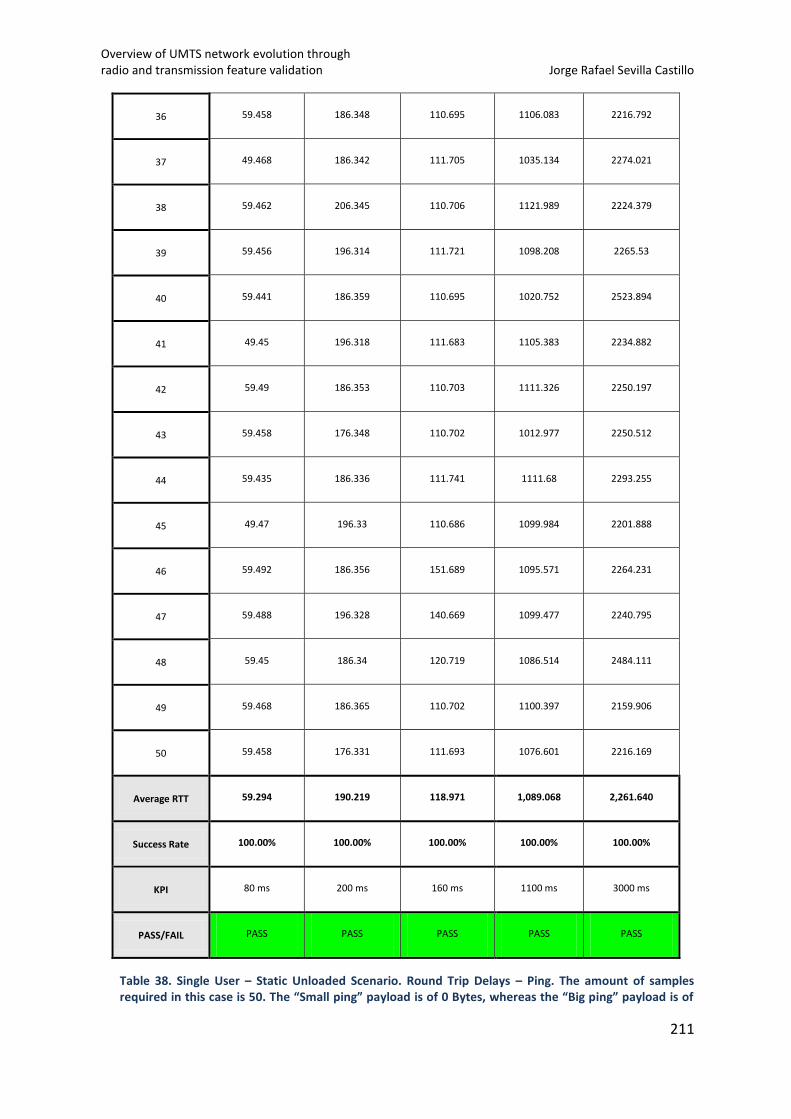
Overview of UMTS network evolution through radio and transmission feature validation Jorge Rafael Sevilla Castillo
211
36 59.458 186.348 110.695 1106.083 2216.792
37 49.468 186.342 111.705 1035.134 2274.021
38 59.462 206.345 110.706 1121.989 2224.379
39 59.456 196.314 111.721 1098.208 2265.53
40 59.441 186.359 110.695 1020.752 2523.894
41 49.45 196.318 111.683 1105.383 2234.882
42 59.49 186.353 110.703 1111.326 2250.197
43 59.458 176.348 110.702 1012.977 2250.512
44 59.435 186.336 111.741 1111.68 2293.255
45 49.47 196.33 110.686 1099.984 2201.888
46 59.492 186.356 151.689 1095.571 2264.231
47 59.488 196.328 140.669 1099.477 2240.795
48 59.45 186.34 120.719 1086.514 2484.111
49 59.468 186.365 110.702 1100.397 2159.906
50 59.458 176.331 111.693 1076.601 2216.169
Average RTT 59.294 190.219 118.971 1,089.068 2,261.640
Success Rate 100.00% 100.00% 100.00% 100.00% 100.00%
KPI 80 ms 200 ms 160 ms 1100 ms 3000 ms
PASS/FAIL PASS PASS PASS PASS PASS
Table 38. Single User – Static Unloaded Scenario. Round Trip Delays – Ping. The amount of samples required in this case is 50. The “Small ping” payload is of 0 Bytes, whereas the “Big ping” payload is of
Overview of UMTS network evolution through radio and transmission feature validation Jorge Rafael Sevilla Castillo
212
1460 Bytes. Latency has to be tested in three different RRC Status: IDLE, FACH and DCH. When the UE is in IDLE mode it does not have any transport channel allocated, so in order to establish a ping, first of all it has to request for a connection. That is why we are expecting higher latency values whilst in this state. In order to collect the results in this state, a continuous ping is sent from IDLE mode and only the first sample of the series is taken. This process is repeated 50 times, and after each sample it is ensured that the UE returns to IDLE state. On the other hand, when the UE is in FACH or DCH mode, it has already setup a connection. The main difference is that whilst in FACH, the UE is using a Common Channel, rather than a dedicated channel (DCH), so the amount of data allowed to transmit will be lower and hence the higher value in latency compared to DCH. During the test it was noticed that when sending the 0 bytes ping, the UE will remain in FACH state, so all the 50 samples can be taken by running the command ping <IP address> -n 50 –l 0. However, when sending 1460 bytes the latency values where correct for the first sample of the series (higher value than the rest). This is because after the first ping the UE is allocated a dedicated channel (DCH) to speed up the data flow. So, in this case, instead of running a single command once, a script was created in order to record the relevant data. In order to record the samples in DCH, the only thing to do is to run a continuous ping and stop once the relevant samples are collected. All KPIs are accomplished, so the test is PASSED.
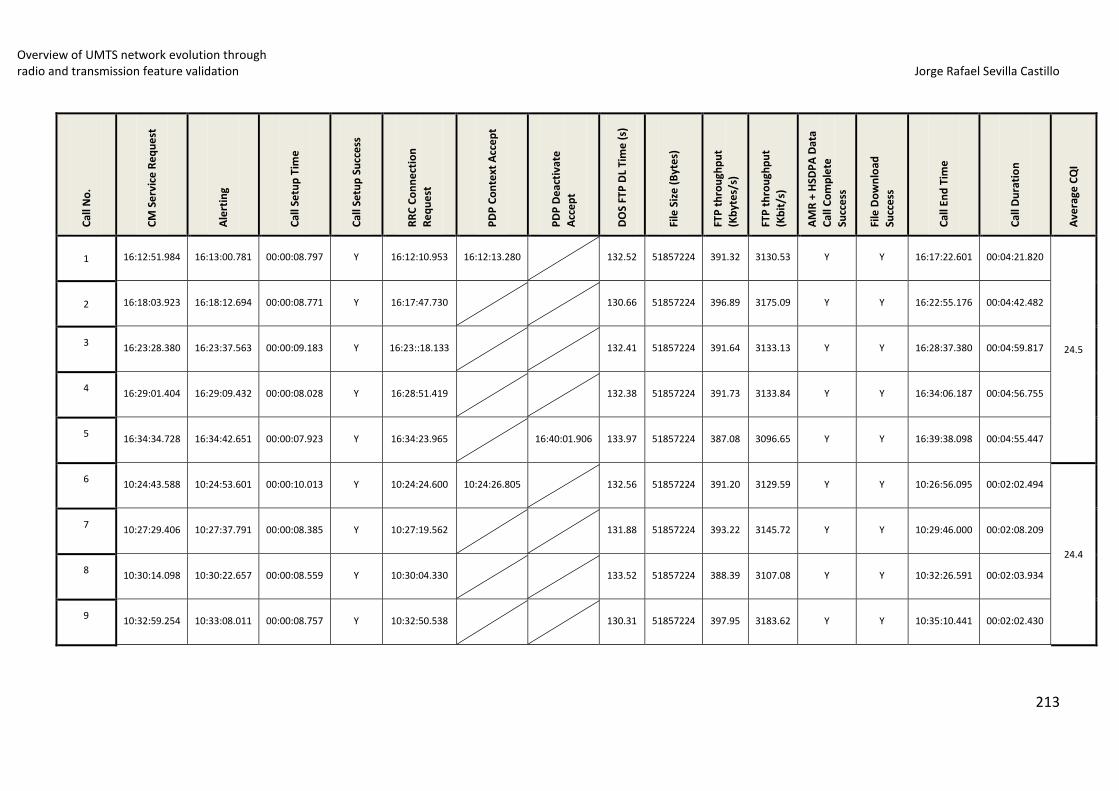
Overview of UMTS network evolution through radio and transmission feature validation Jorge Rafael Sevilla Castillo
213
Cal
l No
.
CM
Se
rvic
e R
eq
ue
st
Ale
rtin
g
Cal
l Se
tup
Tim
e
Cal
l Se
tup
Su
cce
ss
RR
C C
on
ne
ctio
n
Re
qu
est
PD
P C
on
text
Acc
ep
t
PD
P D
eac
tiva
te
Acc
ep
t
DO
S FT
P D
L Ti
me
(s)
File
Siz
e (
Byt
es)
FTP
th
rou
ghp
ut
(Kb
yte
s/s)
FTP
th
rou
ghp
ut
(Kb
it/s
)
AM
R +
HSD
PA
Dat
a
Cal
l Co
mp
lete
Succ
ess
File
Do
wn
load
Succ
ess
Cal
l En
d T
ime
Cal
l Du
rati
on
Ave
rage
CQ
I
1 16:12:51.984 16:13:00.781 00:00:08.797 Y 16:12:10.953 16:12:13.280 132.52 51857224 391.32 3130.53 Y Y 16:17:22.601 00:04:21.820
24.5
2 16:18:03.923 16:18:12.694 00:00:08.771 Y 16:17:47.730 130.66 51857224 396.89 3175.09 Y Y 16:22:55.176 00:04:42.482
3 16:23:28.380 16:23:37.563 00:00:09.183 Y 16:23::18.133 132.41 51857224 391.64 3133.13 Y Y 16:28:37.380 00:04:59.817
4 16:29:01.404 16:29:09.432 00:00:08.028 Y 16:28:51.419 132.38 51857224 391.73 3133.84 Y Y 16:34:06.187 00:04:56.755
5 16:34:34.728 16:34:42.651 00:00:07.923 Y 16:34:23.965 16:40:01.906 133.97 51857224 387.08 3096.65 Y Y 16:39:38.098 00:04:55.447
6 10:24:43.588 10:24:53.601 00:00:10.013 Y 10:24:24.600 10:24:26.805 132.56 51857224 391.20 3129.59 Y Y 10:26:56.095 00:02:02.494
24.4
7 10:27:29.406 10:27:37.791 00:00:08.385 Y 10:27:19.562 131.88 51857224 393.22 3145.72 Y Y 10:29:46.000 00:02:08.209
8 10:30:14.098 10:30:22.657 00:00:08.559 Y 10:30:04.330 133.52 51857224 388.39 3107.08 Y Y 10:32:26.591 00:02:03.934
9 10:32:59.254 10:33:08.011 00:00:08.757 Y 10:32:50.538 130.31 51857224 397.95 3183.62 Y Y 10:35:10.441 00:02:02.430
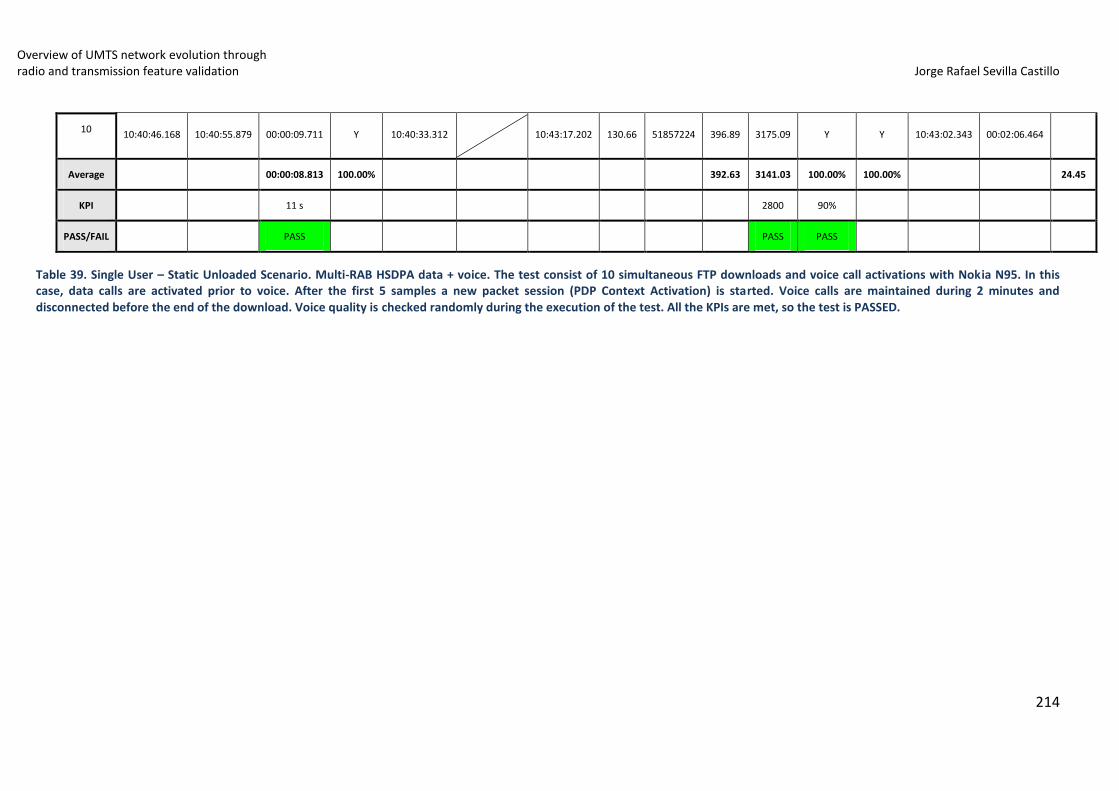
Overview of UMTS network evolution through radio and transmission feature validation Jorge Rafael Sevilla Castillo
214
10 10:40:46.168 10:40:55.879 00:00:09.711 Y 10:40:33.312 10:43:17.202 130.66 51857224 396.89 3175.09 Y Y 10:43:02.343 00:02:06.464
Average 00:00:08.813 100.00% 392.63 3141.03 100.00% 100.00% 24.45
KPI 11 s 2800 90%
PASS/FAIL PASS PASS PASS
Table 39. Single User – Static Unloaded Scenario. Multi-RAB HSDPA data + voice. The test consist of 10 simultaneous FTP downloads and voice call activations with Nokia N95. In this case, data calls are activated prior to voice. After the first 5 samples a new packet session (PDP Context Activation) is started. Voice calls are maintained during 2 minutes and disconnected before the end of the download. Voice quality is checked randomly during the execution of the test. All the KPIs are met, so the test is PASSED.
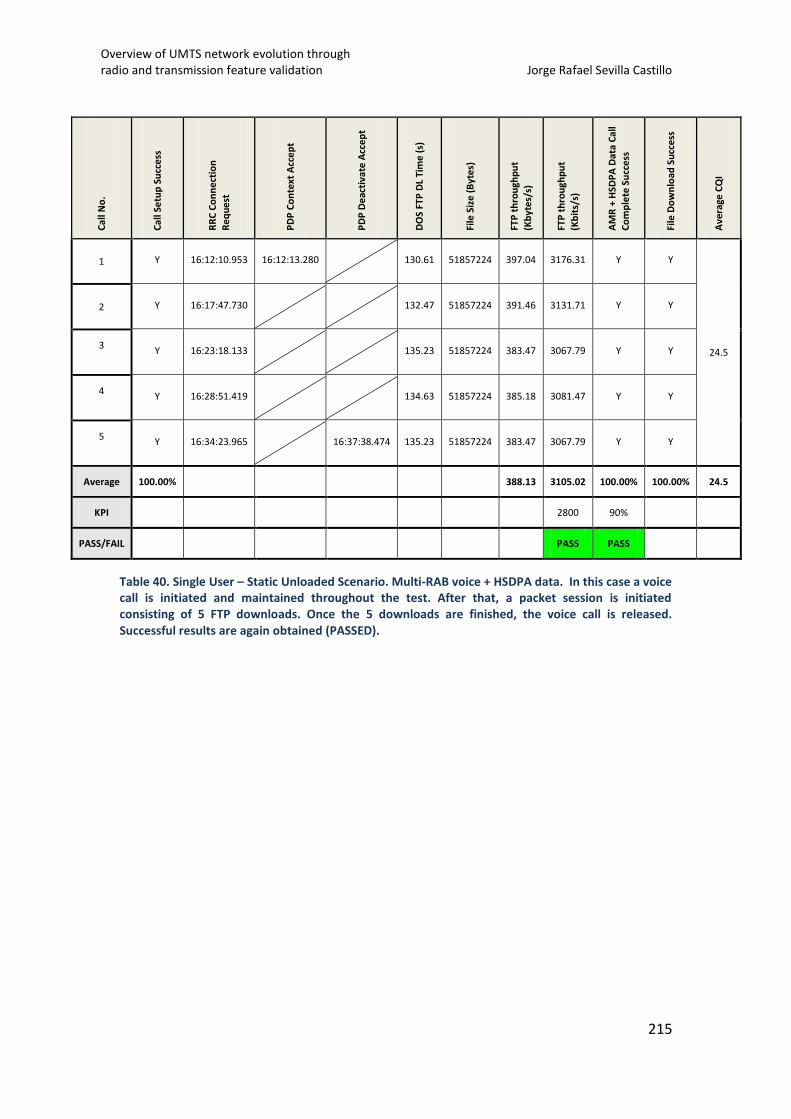
Overview of UMTS network evolution through radio and transmission feature validation Jorge Rafael Sevilla Castillo
215
C
all N
o.
Cal
l Se
tup
Su
cce
ss
RR
C C
on
ne
ctio
n
Re
qu
est
PD
P C
on
text
Acc
ep
t
PD
P D
eac
tiva
te A
cce
pt
DO
S FT
P D
L Ti
me
(s)
File
Siz
e (
Byt
es)
FTP
th
rou
ghp
ut
(Kb
yte
s/s)
FTP
th
rou
ghp
ut
(Kb
its/
s)
AM
R +
HSD
PA
Dat
a C
all
Co
mp
lete
Su
cce
ss
File
Do
wn
load
Su
cce
ss
Ave
rage
CQ
I
1 Y 16:12:10.953 16:12:13.280 130.61 51857224 397.04 3176.31 Y Y
24.5
2 Y 16:17:47.730 132.47 51857224 391.46 3131.71 Y Y
3 Y 16:23:18.133 135.23 51857224 383.47 3067.79 Y Y
4 Y 16:28:51.419 134.63 51857224 385.18 3081.47 Y Y
5 Y 16:34:23.965 16:37:38.474 135.23 51857224 383.47 3067.79 Y Y
Average 100.00% 388.13 3105.02 100.00% 100.00% 24.5
KPI 2800 90%
PASS/FAIL PASS PASS
Table 40. Single User – Static Unloaded Scenario. Multi-RAB voice + HSDPA data. In this case a voice call is initiated and maintained throughout the test. After that, a packet session is initiated consisting of 5 FTP downloads. Once the 5 downloads are finished, the voice call is released. Successful results are again obtained (PASSED).
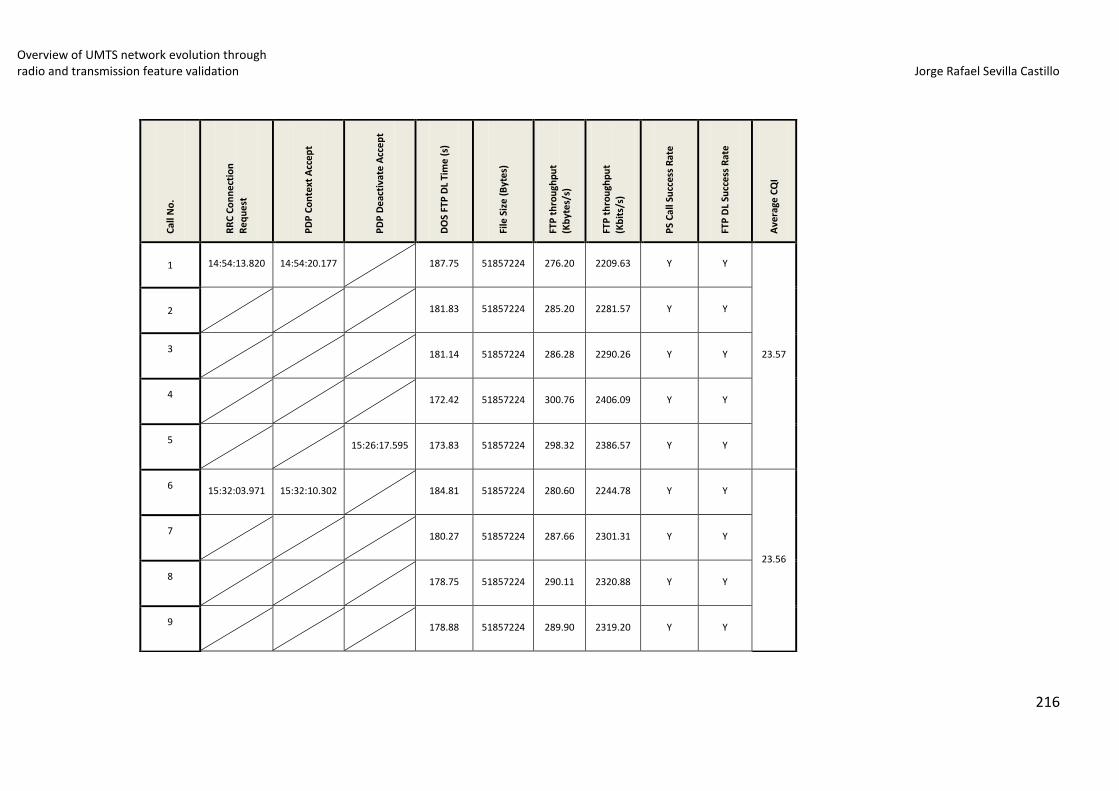
Overview of UMTS network evolution through radio and transmission feature validation Jorge Rafael Sevilla Castillo
216
Cal
l No
.
RR
C C
on
ne
ctio
n
Re
qu
est
PD
P C
on
text
Acc
ep
t
PD
P D
eac
tiva
te A
cce
pt
DO
S FT
P D
L Ti
me
(s)
File
Siz
e (
Byt
es)
FTP
th
rou
ghp
ut
(Kb
yte
s/s)
FTP
th
rou
ghp
ut
(Kb
its/
s)
PS
Cal
l Su
cces
s R
ate
FTP
DL
Succ
ess
Rat
e
Ave
rage
CQ
I
1 14:54:13.820 14:54:20.177 187.75 51857224 276.20 2209.63 Y Y
23.57
2 181.83 51857224 285.20 2281.57 Y Y
3 181.14 51857224 286.28 2290.26 Y Y
4 172.42 51857224 300.76 2406.09 Y Y
5 15:26:17.595 173.83 51857224 298.32 2386.57 Y Y
6 15:32:03.971 15:32:10.302 184.81 51857224 280.60 2244.78 Y Y
23.56
7 180.27 51857224 287.66 2301.31 Y Y
8 178.75 51857224 290.11 2320.88 Y Y
9 178.88 51857224 289.90 2319.20 Y Y
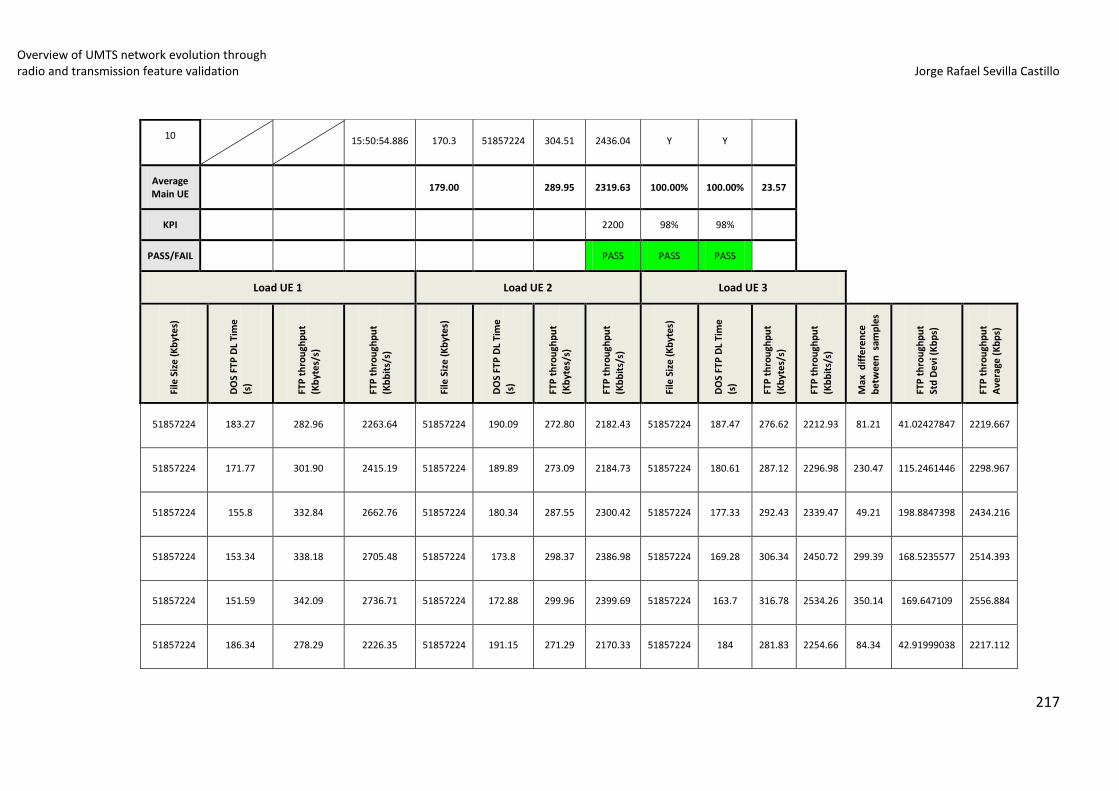
Overview of UMTS network evolution through radio and transmission feature validation Jorge Rafael Sevilla Castillo
217
10 15:50:54.886 170.3 51857224 304.51 2436.04 Y Y
Average Main UE
179.00 289.95 2319.63 100.00% 100.00% 23.57
KPI 2200 98% 98%
PASS/FAIL PASS PASS PASS
Load UE 1 Load UE 2 Load UE 3
File
Siz
e (
Kb
yte
s)
DO
S FT
P D
L Ti
me
(s
)
FTP
th
rou
ghp
ut
(Kb
yte
s/s)
FTP
th
rou
ghp
ut
(Kb
bit
s/s)
File
Siz
e (
Kb
yte
s)
DO
S FT
P D
L Ti
me
(s)
FTP
th
rou
ghp
ut
(Kb
yte
s/s)
FTP
th
rou
ghp
ut
(Kb
bit
s/s)
File
Siz
e (
Kb
yte
s)
DO
S FT
P D
L Ti
me
(s
)
FTP
th
rou
ghp
ut
(Kb
yte
s/s)
FTP
th
rou
ghp
ut
(Kb
bit
s/s)
Max
dif
fere
nce
be
twee
n s
amp
les
FTP
th
rou
ghp
ut
Std
De
vi (
Kb
ps)
FTP
th
rou
ghp
ut
Ave
rage
(K
bp
s)
51857224 183.27 282.96 2263.64 51857224 190.09 272.80 2182.43 51857224 187.47 276.62 2212.93 81.21 41.02427847 2219.667
51857224 171.77 301.90 2415.19 51857224 189.89 273.09 2184.73 51857224 180.61 287.12 2296.98 230.47 115.2461446 2298.967
51857224 155.8 332.84 2662.76 51857224 180.34 287.55 2300.42 51857224 177.33 292.43 2339.47 49.21 198.8847398 2434.216
51857224 153.34 338.18 2705.48 51857224 173.8 298.37 2386.98 51857224 169.28 306.34 2450.72 299.39 168.5235577 2514.393
51857224 151.59 342.09 2736.71 51857224 172.88 299.96 2399.69 51857224 163.7 316.78 2534.26 350.14 169.647109 2556.884
51857224 186.34 278.29 2226.35 51857224 191.15 271.29 2170.33 51857224 184 281.83 2254.66 84.34 42.91999038 2217.112
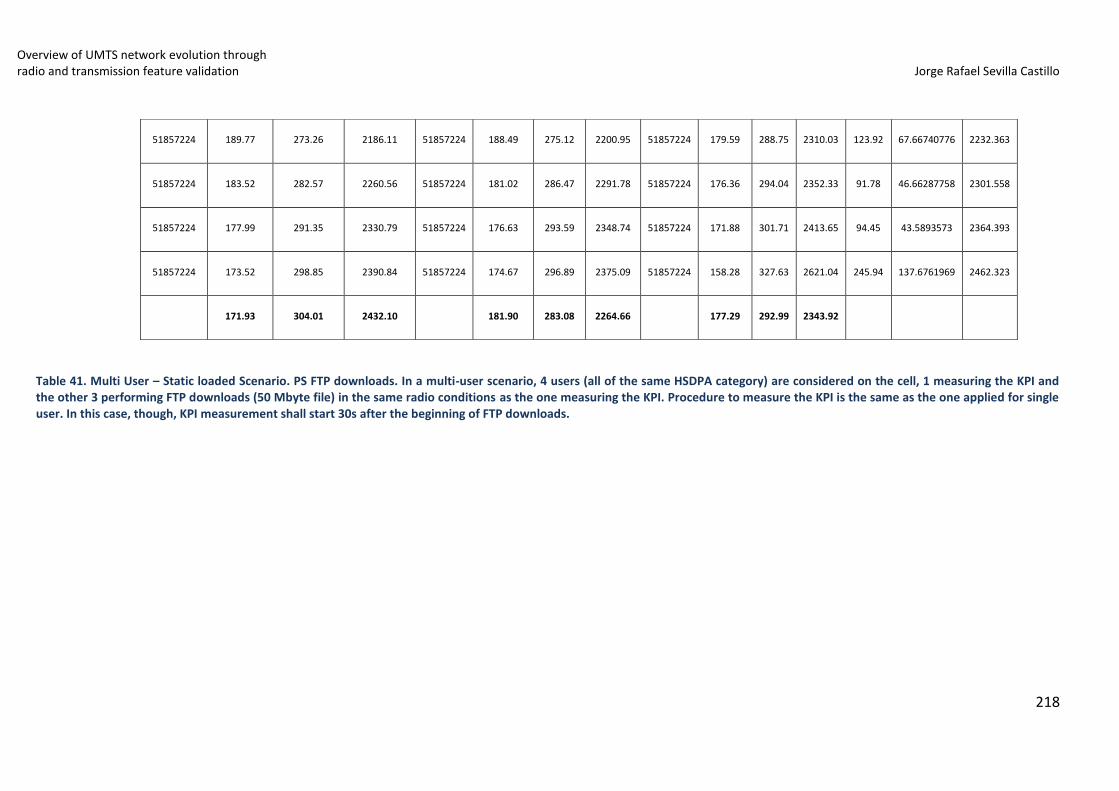
Overview of UMTS network evolution through radio and transmission feature validation Jorge Rafael Sevilla Castillo
218
Table 41. Multi User – Static loaded Scenario. PS FTP downloads. In a multi-user scenario, 4 users (all of the same HSDPA category) are considered on the cell, 1 measuring the KPI and the other 3 performing FTP downloads (50 Mbyte file) in the same radio conditions as the one measuring the KPI. Procedure to measure the KPI is the same as the one applied for single user. In this case, though, KPI measurement shall start 30s after the beginning of FTP downloads.
51857224 189.77 273.26 2186.11 51857224 188.49 275.12 2200.95 51857224 179.59 288.75 2310.03 123.92 67.66740776 2232.363
51857224 183.52 282.57 2260.56 51857224 181.02 286.47 2291.78 51857224 176.36 294.04 2352.33 91.78 46.66287758 2301.558
51857224 177.99 291.35 2330.79 51857224 176.63 293.59 2348.74 51857224 171.88 301.71 2413.65 94.45 43.5893573 2364.393
51857224 173.52 298.85 2390.84 51857224 174.67 296.89 2375.09 51857224 158.28 327.63 2621.04 245.94 137.6761969 2462.323
171.93 304.01 2432.10 181.90 283.08 2264.66 177.29 292.99 2343.92
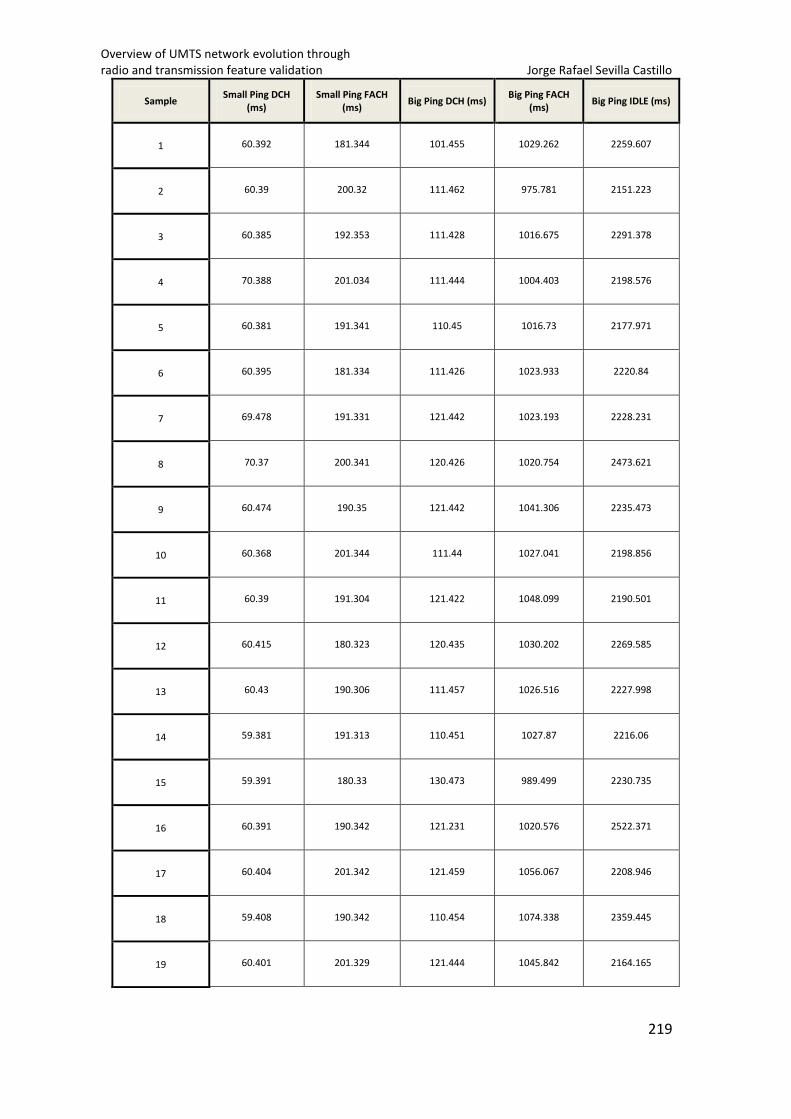
Overview of UMTS network evolution through radio and transmission feature validation Jorge Rafael Sevilla Castillo
219
Sample Small Ping DCH
(ms) Small Ping FACH
(ms) Big Ping DCH (ms)
Big Ping FACH (ms)
Big Ping IDLE (ms)
1 60.392 181.344 101.455 1029.262 2259.607
2 60.39 200.32 111.462 975.781 2151.223
3 60.385 192.353 111.428 1016.675 2291.378
4 70.388 201.034 111.444 1004.403 2198.576
5 60.381 191.341 110.45 1016.73 2177.971
6 60.395 181.334 111.426 1023.933 2220.84
7 69.478 191.331 121.442 1023.193 2228.231
8 70.37 200.341 120.426 1020.754 2473.621
9 60.474 190.35 121.442 1041.306 2235.473
10 60.368 201.344 111.44 1027.041 2198.856
11 60.39 191.304 121.422 1048.099 2190.501
12 60.415 180.323 120.435 1030.202 2269.585
13 60.43 190.306 111.457 1026.516 2227.998
14 59.381 191.313 110.451 1027.87 2216.06
15 59.391 180.33 130.473 989.499 2230.735
16 60.391 190.342 121.231 1020.576 2522.371
17 60.404 201.342 121.459 1056.067 2208.946
18 59.408 190.342 110.454 1074.338 2359.445
19 60.401 201.329 121.444 1045.842 2164.165
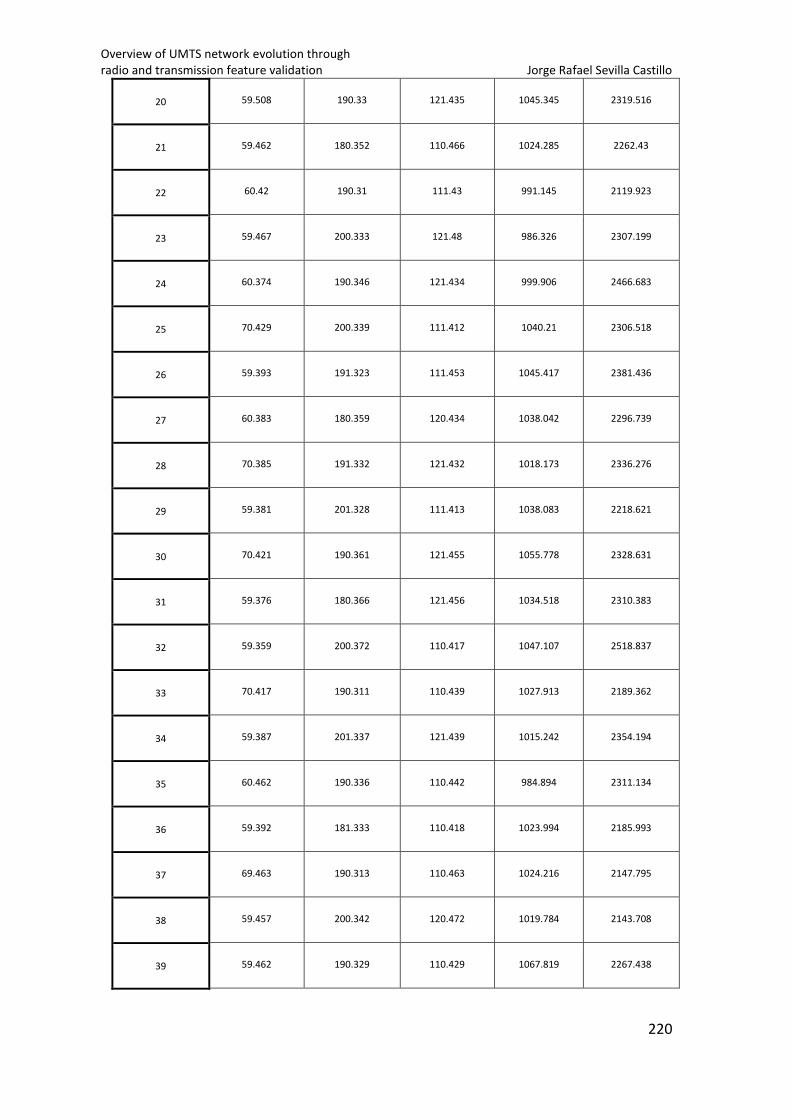
Overview of UMTS network evolution through radio and transmission feature validation Jorge Rafael Sevilla Castillo
220
20 59.508 190.33 121.435 1045.345 2319.516
21 59.462 180.352 110.466 1024.285 2262.43
22 60.42 190.31 111.43 991.145 2119.923
23 59.467 200.333 121.48 986.326 2307.199
24 60.374 190.346 121.434 999.906 2466.683
25 70.429 200.339 111.412 1040.21 2306.518
26 59.393 191.323 111.453 1045.417 2381.436
27 60.383 180.359 120.434 1038.042 2296.739
28 70.385 191.332 121.432 1018.173 2336.276
29 59.381 201.328 111.413 1038.083 2218.621
30 70.421 190.361 121.455 1055.778 2328.631
31 59.376 180.366 121.456 1034.518 2310.383
32 59.359 200.372 110.417 1047.107 2518.837
33 70.417 190.311 110.439 1027.913 2189.362
34 59.387 201.337 121.439 1015.242 2354.194
35 60.462 190.336 110.442 984.894 2311.134
36 59.392 181.333 110.418 1023.994 2185.993
37 69.463 190.313 110.463 1024.216 2147.795
38 59.457 200.342 120.472 1019.784 2143.708
39 59.462 190.329 110.429 1067.819 2267.438
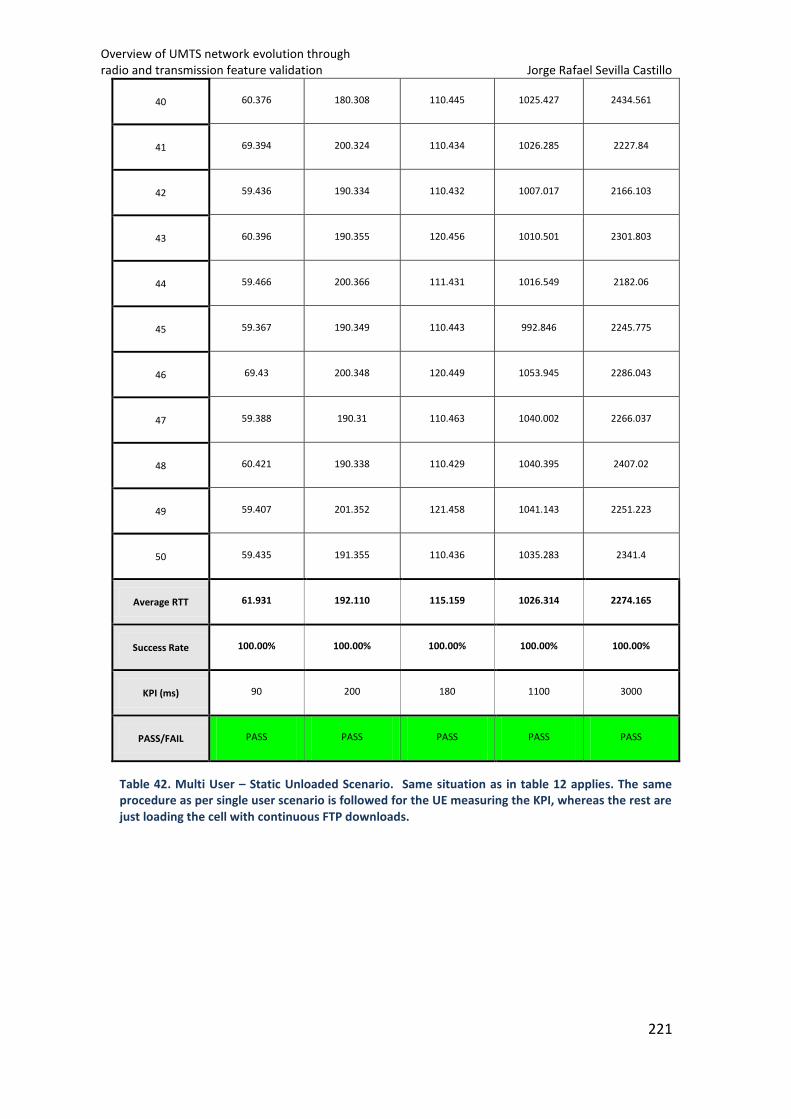
Overview of UMTS network evolution through radio and transmission feature validation Jorge Rafael Sevilla Castillo
221
40 60.376 180.308 110.445 1025.427 2434.561
41 69.394 200.324 110.434 1026.285 2227.84
42 59.436 190.334 110.432 1007.017 2166.103
43 60.396 190.355 120.456 1010.501 2301.803
44 59.466 200.366 111.431 1016.549 2182.06
45 59.367 190.349 110.443 992.846 2245.775
46 69.43 200.348 120.449 1053.945 2286.043
47 59.388 190.31 110.463 1040.002 2266.037
48 60.421 190.338 110.429 1040.395 2407.02
49 59.407 201.352 121.458 1041.143 2251.223
50 59.435 191.355 110.436 1035.283 2341.4
Average RTT 61.931 192.110 115.159 1026.314 2274.165
Success Rate 100.00% 100.00% 100.00% 100.00% 100.00%
KPI (ms) 90 200 180 1100 3000
PASS/FAIL PASS PASS PASS PASS PASS
Table 42. Multi User – Static Unloaded Scenario. Same situation as in table 12 applies. The same procedure as per single user scenario is followed for the UE measuring the KPI, whereas the rest are just loading the cell with continuous FTP downloads.
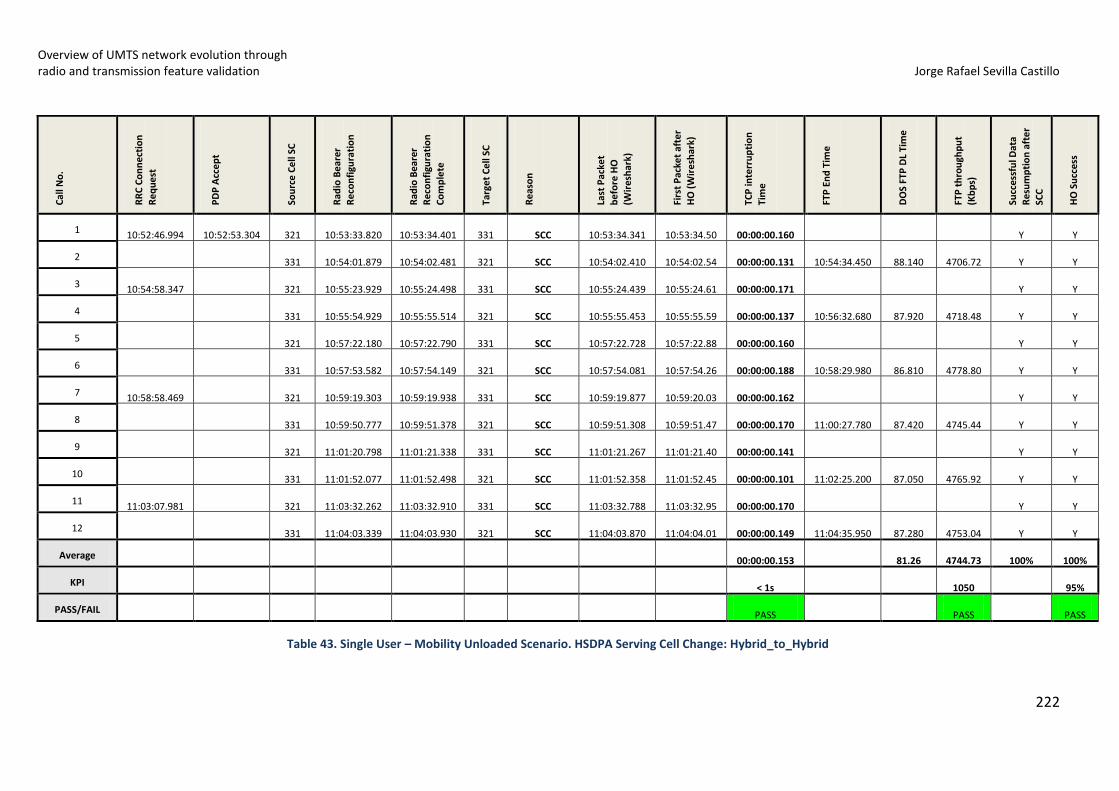
Overview of UMTS network evolution through radio and transmission feature validation Jorge Rafael Sevilla Castillo
222
Table 43. Single User – Mobility Unloaded Scenario. HSDPA Serving Cell Change: Hybrid_to_Hybrid
Cal
l No
.
RR
C C
on
ne
ctio
n
Re
qu
est
PD
P A
cce
pt
Sou
rce
Ce
ll SC
Rad
io B
ear
er
Re
con
figu
rati
on
Rad
io B
ear
er
Re
con
figu
rati
on
Co
mp
lete
Targ
et
Ce
ll SC
Re
aso
n
Last
Pac
ket
be
fore
HO
(Wir
esh
ark)
Firs
t P
acke
t af
ter
HO
(W
ire
shar
k)
TCP
inte
rru
pti
on
Tim
e
FTP
En
d T
ime
DO
S FT
P D
L Ti
me
FTP
th
rou
ghp
ut
(Kb
ps)
Succ
essf
ul D
ata
Re
sum
pti
on
aft
er
SCC
HO
Su
cces
s
1 10:52:46.994 10:52:53.304 321 10:53:33.820 10:53:34.401 331 SCC 10:53:34.341 10:53:34.50
1
00:00:00.160 Y Y
2 331 10:54:01.879 10:54:02.481 321 SCC 10:54:02.410 10:54:02.54
1
00:00:00.131 10:54:34.450 88.140 4706.72 Y Y
3 10:54:58.347 321 10:55:23.929 10:55:24.498 331 SCC 10:55:24.439 10:55:24.61
0
00:00:00.171 Y Y
4 331 10:55:54.929 10:55:55.514 321 SCC 10:55:55.453 10:55:55.59
0
00:00:00.137 10:56:32.680 87.920 4718.48 Y Y
5 321 10:57:22.180 10:57:22.790 331 SCC 10:57:22.728 10:57:22.88
8
00:00:00.160 Y Y
6 331 10:57:53.582 10:57:54.149 321 SCC 10:57:54.081 10:57:54.26
9
00:00:00.188 10:58:29.980 86.810 4778.80 Y Y
7 10:58:58.469 321 10:59:19.303 10:59:19.938 331 SCC 10:59:19.877 10:59:20.03
9
00:00:00.162 Y Y
8 331 10:59:50.777 10:59:51.378 321 SCC 10:59:51.308 10:59:51.47
8
00:00:00.170 11:00:27.780 87.420 4745.44 Y Y
9 321 11:01:20.798 11:01:21.338 331 SCC 11:01:21.267 11:01:21.40
8
00:00:00.141 Y Y
10 331 11:01:52.077 11:01:52.498 321 SCC 11:01:52.358 11:01:52.45
9
00:00:00.101 11:02:25.200 87.050 4765.92 Y Y
11 11:03:07.981 321 11:03:32.262 11:03:32.910 331 SCC 11:03:32.788 11:03:32.95
8
00:00:00.170 Y Y
12 331 11:04:03.339 11:04:03.930 321 SCC 11:04:03.870 11:04:04.01
9
00:00:00.149 11:04:35.950 87.280 4753.04 Y Y
Average 00:00:00.153 81.26 4744.73 100% 100%
KPI < 1s 1050 95%
PASS/FAIL PASS PASS PASS
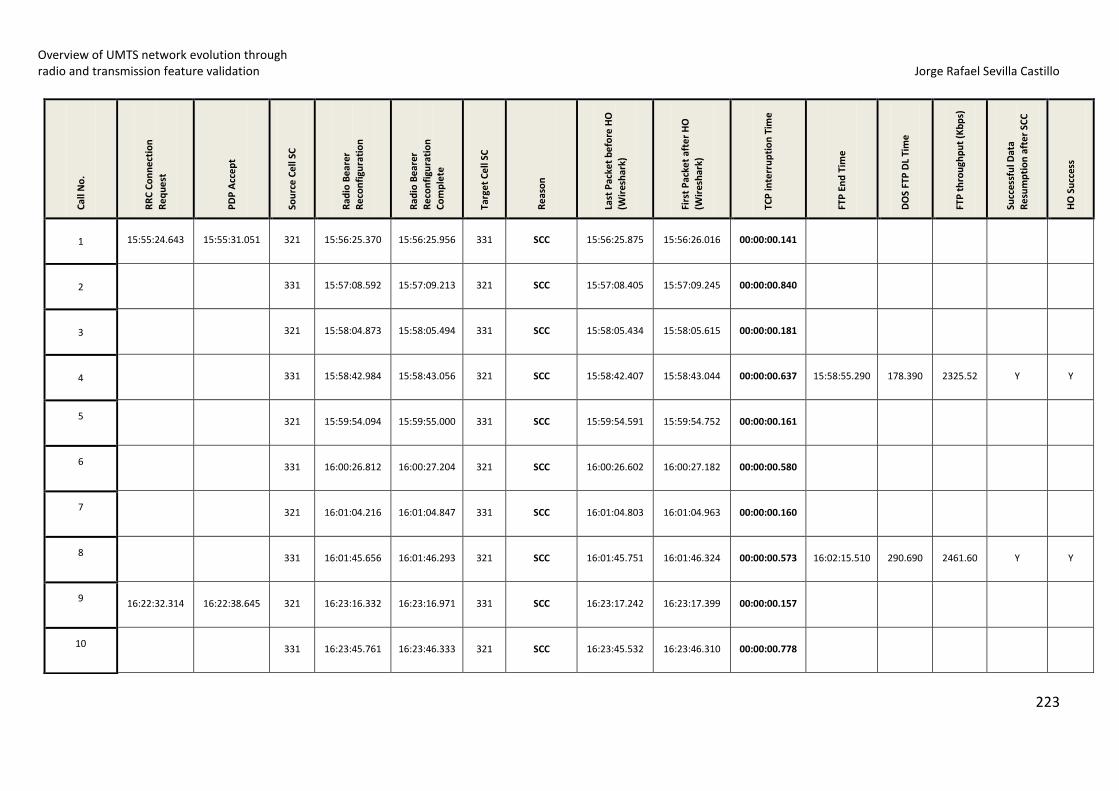
Overview of UMTS network evolution through radio and transmission feature validation Jorge Rafael Sevilla Castillo
223
Cal
l No
.
RR
C C
on
ne
ctio
n
Re
qu
est
PD
P A
cce
pt
Sou
rce
Ce
ll SC
Rad
io B
ear
er
Re
con
figu
rati
on
Rad
io B
ear
er
Re
con
figu
rati
on
C
om
ple
te
Targ
et
Ce
ll SC
Re
aso
n
Last
Pac
ket
be
fore
HO
(Wir
esh
ark)
Firs
t P
acke
t af
ter
HO
(Wir
esh
ark)
TCP
inte
rru
pti
on
Tim
e
FTP
En
d T
ime
DO
S FT
P D
L Ti
me
FTP
th
rou
ghp
ut
(Kb
ps)
Succ
essf
ul D
ata
Re
sum
pti
on
aft
er
SCC
HO
Su
cces
s
1 15:55:24.643 15:55:31.051 321 15:56:25.370 15:56:25.956 331 SCC 15:56:25.875 15:56:26.016 00:00:00.141
2 331 15:57:08.592 15:57:09.213 321 SCC 15:57:08.405 15:57:09.245 00:00:00.840
3 321 15:58:04.873 15:58:05.494 331 SCC 15:58:05.434 15:58:05.615 00:00:00.181
4 331 15:58:42.984 15:58:43.056 321 SCC 15:58:42.407 15:58:43.044 00:00:00.637 15:58:55.290 178.390 2325.52 Y Y
5 321 15:59:54.094 15:59:55.000 331 SCC 15:59:54.591 15:59:54.752 00:00:00.161
6 331 16:00:26.812 16:00:27.204 321 SCC 16:00:26.602 16:00:27.182 00:00:00.580
7 321 16:01:04.216 16:01:04.847 331 SCC 16:01:04.803 16:01:04.963 00:00:00.160
8 331 16:01:45.656 16:01:46.293 321 SCC 16:01:45.751 16:01:46.324 00:00:00.573 16:02:15.510 290.690 2461.60 Y Y
9 16:22:32.314 16:22:38.645 321 16:23:16.332 16:23:16.971 331 SCC 16:23:17.242 16:23:17.399 00:00:00.157
10 331 16:23:45.761 16:23:46.333 321 SCC 16:23:45.532 16:23:46.310 00:00:00.778
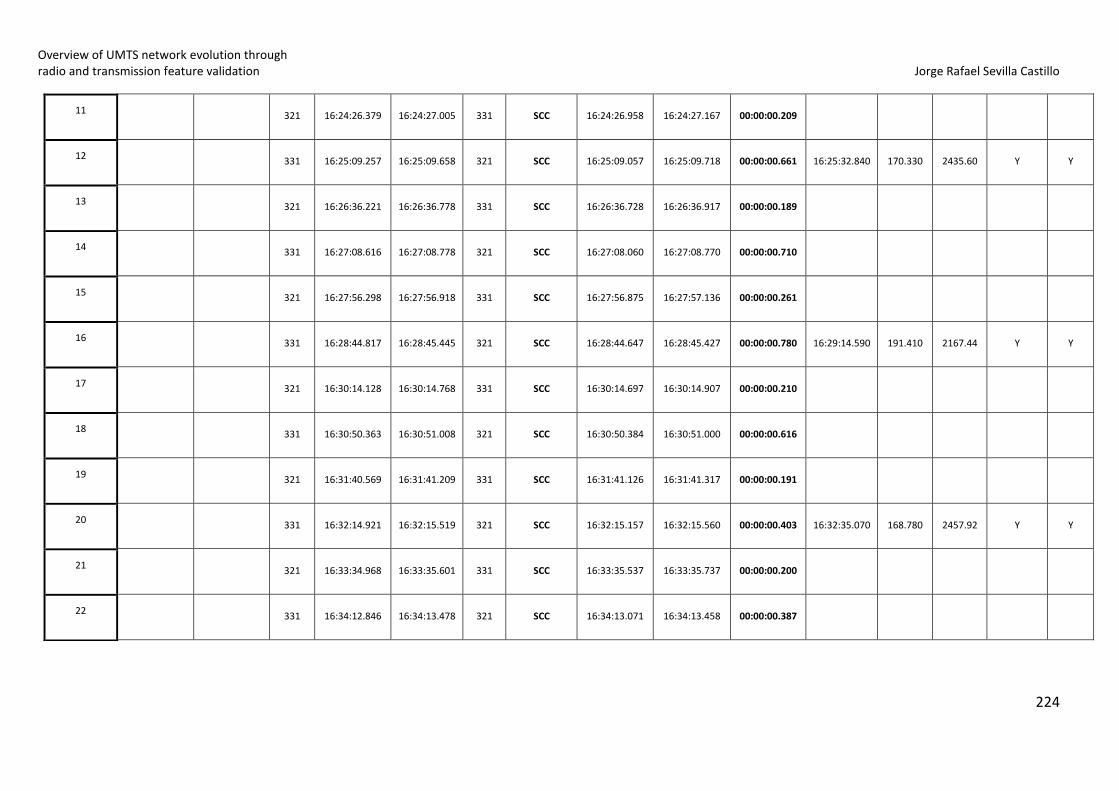
Overview of UMTS network evolution through radio and transmission feature validation Jorge Rafael Sevilla Castillo
224
11 321 16:24:26.379 16:24:27.005 331 SCC 16:24:26.958 16:24:27.167 00:00:00.209
12 331 16:25:09.257 16:25:09.658 321 SCC 16:25:09.057 16:25:09.718 00:00:00.661 16:25:32.840 170.330 2435.60 Y Y
13 321 16:26:36.221 16:26:36.778 331 SCC 16:26:36.728 16:26:36.917 00:00:00.189
14 331 16:27:08.616 16:27:08.778 321 SCC 16:27:08.060 16:27:08.770 00:00:00.710
15 321 16:27:56.298 16:27:56.918 331 SCC 16:27:56.875 16:27:57.136 00:00:00.261
16 331 16:28:44.817 16:28:45.445 321 SCC 16:28:44.647 16:28:45.427 00:00:00.780 16:29:14.590 191.410 2167.44 Y Y
17 321 16:30:14.128 16:30:14.768 331 SCC 16:30:14.697 16:30:14.907 00:00:00.210
18 331 16:30:50.363 16:30:51.008 321 SCC 16:30:50.384 16:30:51.000 00:00:00.616
19 321 16:31:40.569 16:31:41.209 331 SCC 16:31:41.126 16:31:41.317 00:00:00.191
20 331 16:32:14.921 16:32:15.519 321 SCC 16:32:15.157 16:32:15.560 00:00:00.403 16:32:35.070 168.780 2457.92 Y Y
21 321 16:33:34.968 16:33:35.601 331 SCC 16:33:35.537 16:33:35.737 00:00:00.200
22 331 16:34:12.846 16:34:13.478 321 SCC 16:34:13.071 16:34:13.458 00:00:00.387
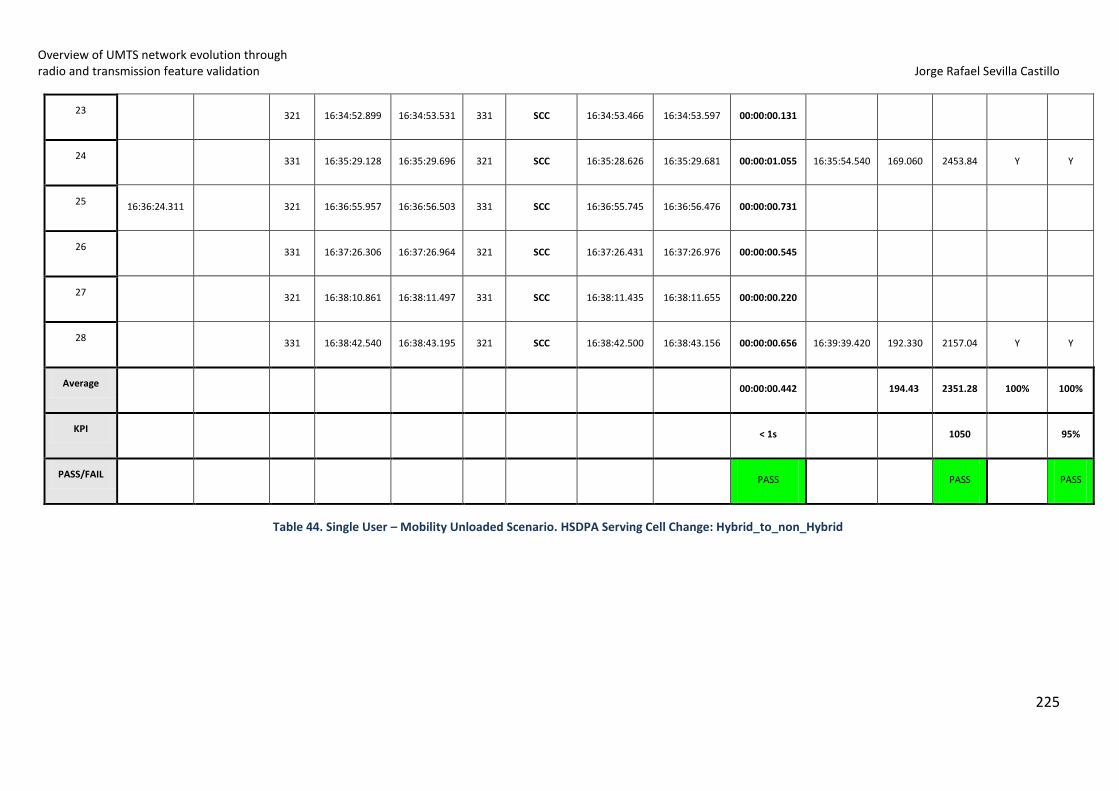
Overview of UMTS network evolution through radio and transmission feature validation Jorge Rafael Sevilla Castillo
225
Table 44. Single User – Mobility Unloaded Scenario. HSDPA Serving Cell Change: Hybrid_to_non_Hybrid
23 321 16:34:52.899 16:34:53.531 331 SCC 16:34:53.466 16:34:53.597 00:00:00.131
24 331 16:35:29.128 16:35:29.696 321 SCC 16:35:28.626 16:35:29.681 00:00:01.055 16:35:54.540 169.060 2453.84 Y Y
25 16:36:24.311 321 16:36:55.957 16:36:56.503 331 SCC 16:36:55.745 16:36:56.476 00:00:00.731
26 331 16:37:26.306 16:37:26.964 321 SCC 16:37:26.431 16:37:26.976 00:00:00.545
27 321 16:38:10.861 16:38:11.497 331 SCC 16:38:11.435 16:38:11.655 00:00:00.220
28 331 16:38:42.540 16:38:43.195 321 SCC 16:38:42.500 16:38:43.156 00:00:00.656 16:39:39.420 192.330 2157.04 Y Y
Average 00:00:00.442 194.43 2351.28 100% 100%
KPI < 1s 1050 95%
PASS/FAIL PASS PASS PASS
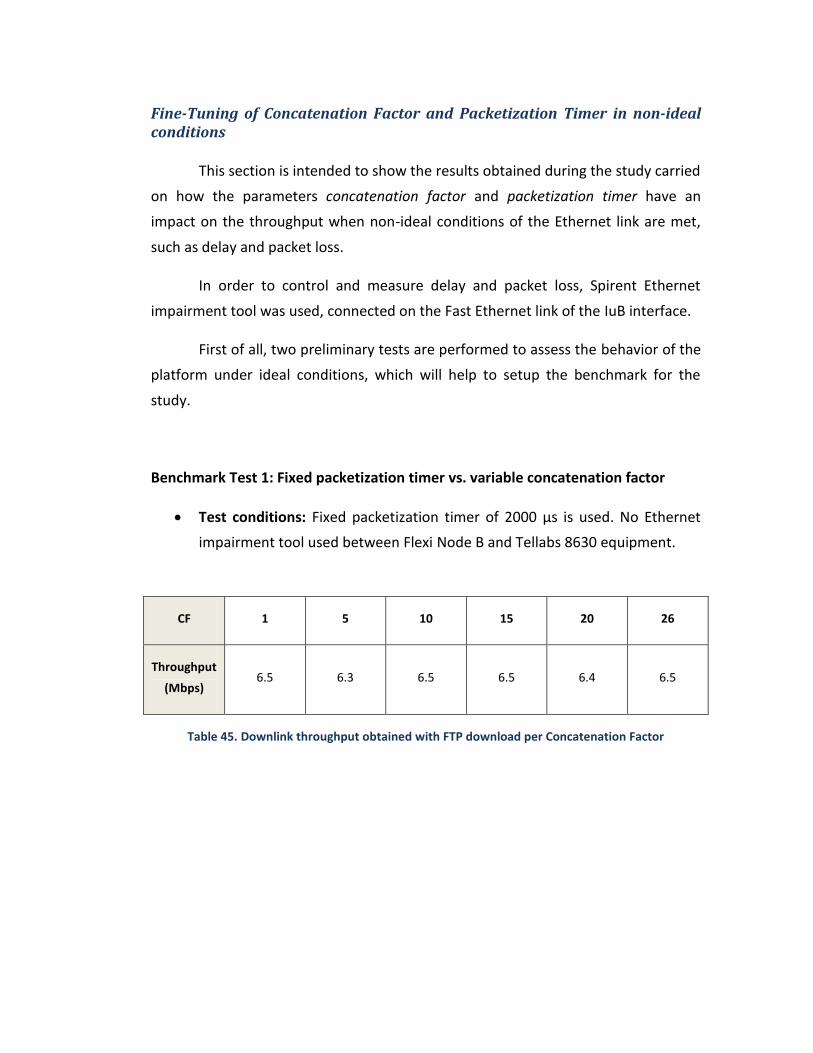
Fine-Tuning of Concatenation Factor and Packetization Timer in non-ideal conditions
This section is intended to show the results obtained during the study carried
on how the parameters concatenation factor and packetization timer have an
impact on the throughput when non-ideal conditions of the Ethernet link are met,
such as delay and packet loss.
In order to control and measure delay and packet loss, Spirent Ethernet
impairment tool was used, connected on the Fast Ethernet link of the IuB interface.
First of all, two preliminary tests are performed to assess the behavior of the
platform under ideal conditions, which will help to setup the benchmark for the
study.
Benchmark Test 1: Fixed packetization timer vs. variable concatenation factor
Test conditions: Fixed packetization timer of 2000 µs is used. No Ethernet
impairment tool used between Flexi Node B and Tellabs 8630 equipment.
CF 1 5 10 15 20 26
Throughput
(Mbps) 6.5 6.3 6.5 6.5 6.4 6.5
Table 45. Downlink throughput obtained with FTP download per Concatenation Factor
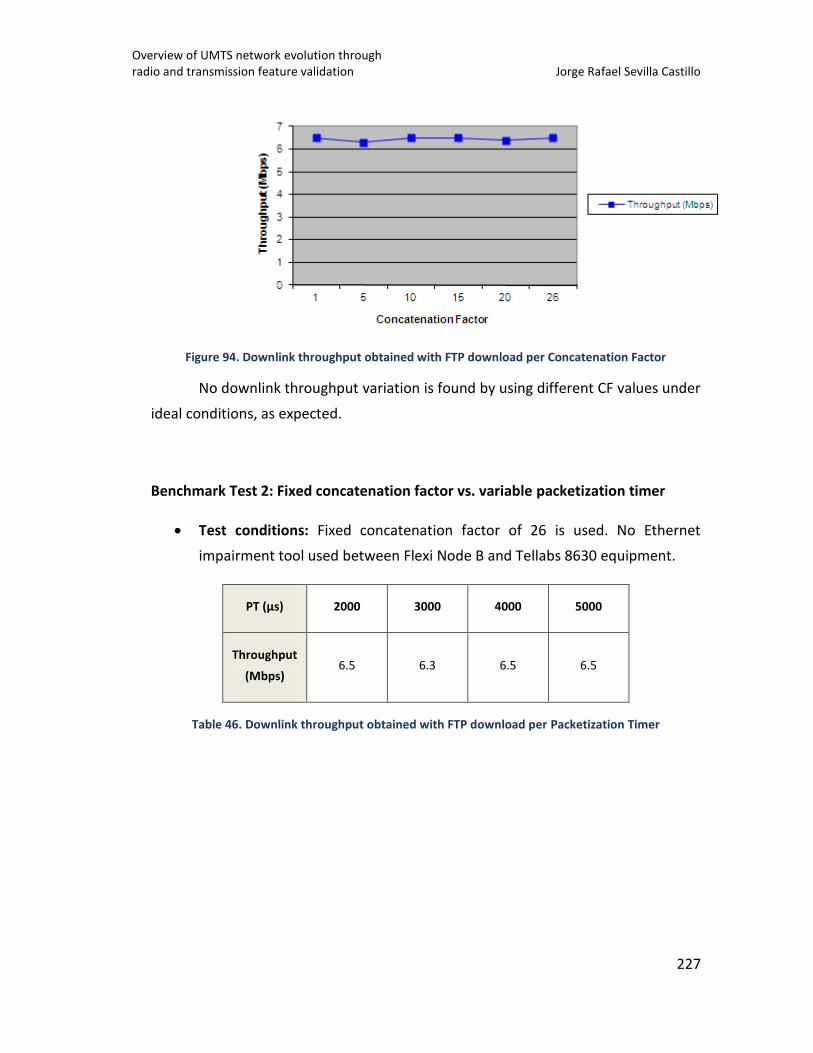
Overview of UMTS network evolution through radio and transmission feature validation Jorge Rafael Sevilla Castillo
227
Figure 94. Downlink throughput obtained with FTP download per Concatenation Factor
No downlink throughput variation is found by using different CF values under
ideal conditions, as expected.
Benchmark Test 2: Fixed concatenation factor vs. variable packetization timer
Test conditions: Fixed concatenation factor of 26 is used. No Ethernet
impairment tool used between Flexi Node B and Tellabs 8630 equipment.
PT (µs) 2000 3000 4000 5000
Throughput
(Mbps) 6.5 6.3 6.5 6.5
Table 46. Downlink throughput obtained with FTP download per Packetization Timer
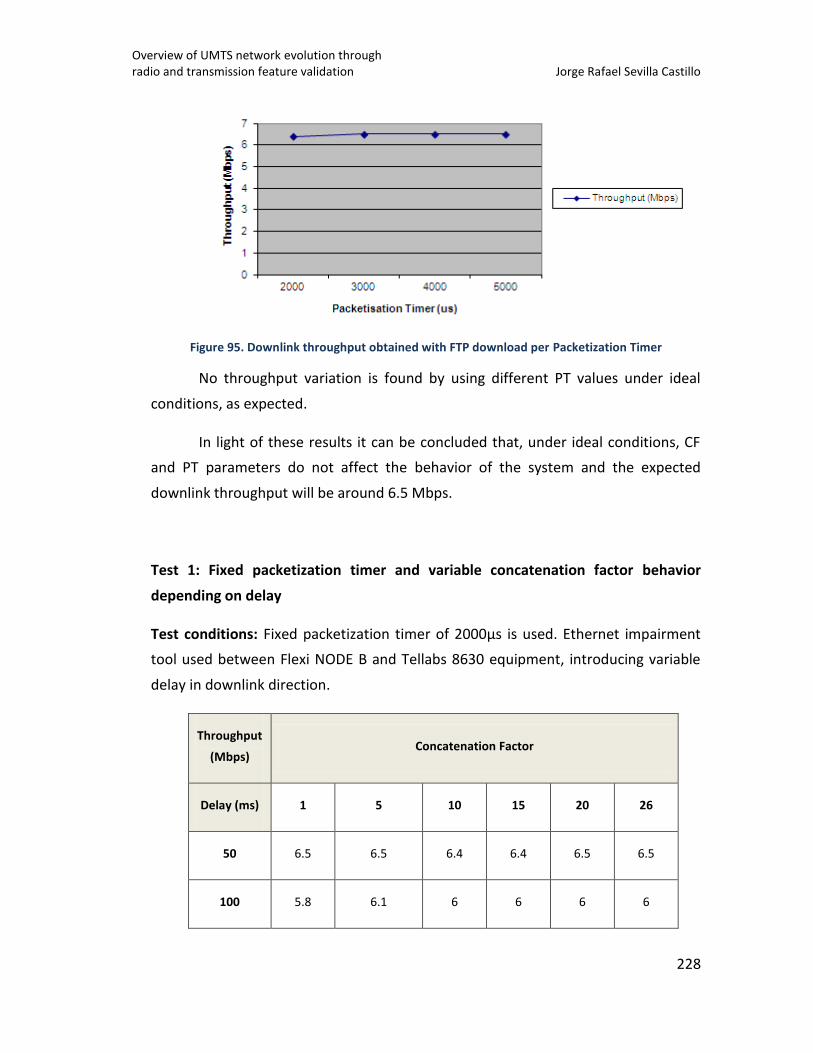
Overview of UMTS network evolution through radio and transmission feature validation Jorge Rafael Sevilla Castillo
228
Figure 95. Downlink throughput obtained with FTP download per Packetization Timer
No throughput variation is found by using different PT values under ideal
conditions, as expected.
In light of these results it can be concluded that, under ideal conditions, CF
and PT parameters do not affect the behavior of the system and the expected
downlink throughput will be around 6.5 Mbps.
Test 1: Fixed packetization timer and variable concatenation factor behavior
depending on delay
Test conditions: Fixed packetization timer of 2000µs is used. Ethernet impairment
tool used between Flexi NODE B and Tellabs 8630 equipment, introducing variable
delay in downlink direction.
Throughput
(Mbps) Concatenation Factor
Delay (ms) 1 5 10 15 20 26
50 6.5 6.5 6.4 6.4 6.5 6.5
100 5.8 6.1 6 6 6 6
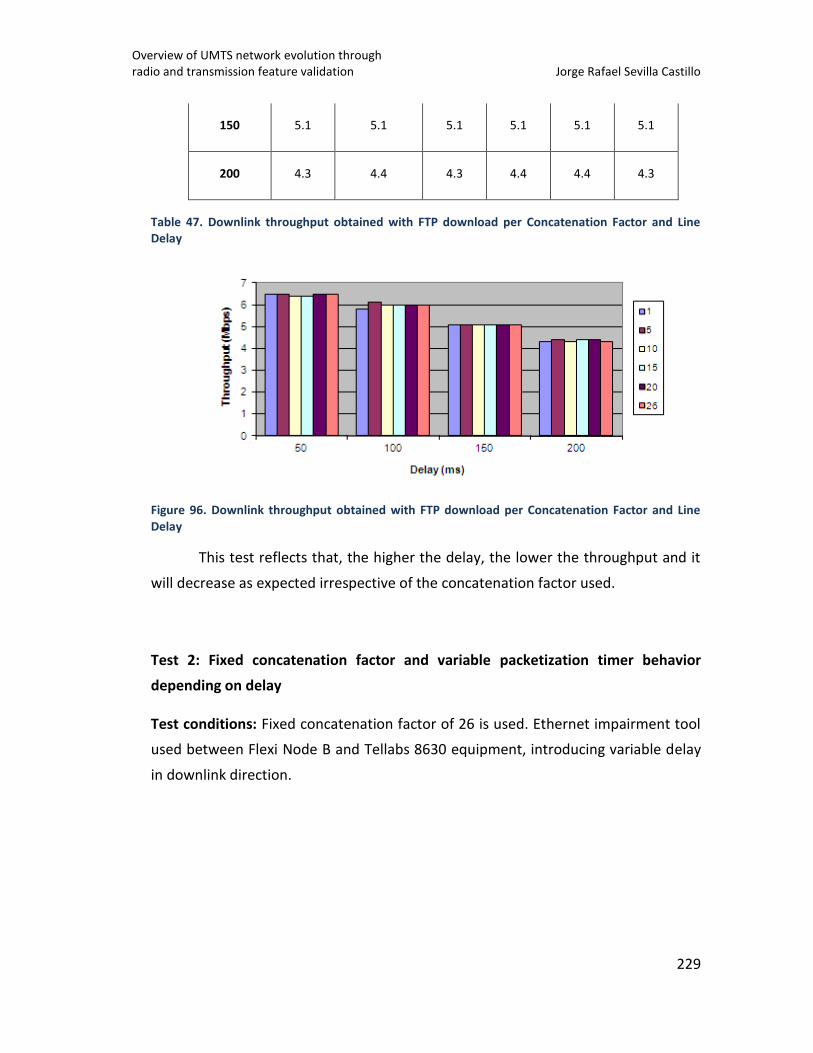
Overview of UMTS network evolution through radio and transmission feature validation Jorge Rafael Sevilla Castillo
229
150 5.1 5.1 5.1 5.1 5.1 5.1
200 4.3 4.4 4.3 4.4 4.4 4.3
Table 47. Downlink throughput obtained with FTP download per Concatenation Factor and Line Delay
Figure 96. Downlink throughput obtained with FTP download per Concatenation Factor and Line Delay
This test reflects that, the higher the delay, the lower the throughput and it
will decrease as expected irrespective of the concatenation factor used.
Test 2: Fixed concatenation factor and variable packetization timer behavior
depending on delay
Test conditions: Fixed concatenation factor of 26 is used. Ethernet impairment tool
used between Flexi Node B and Tellabs 8630 equipment, introducing variable delay
in downlink direction.
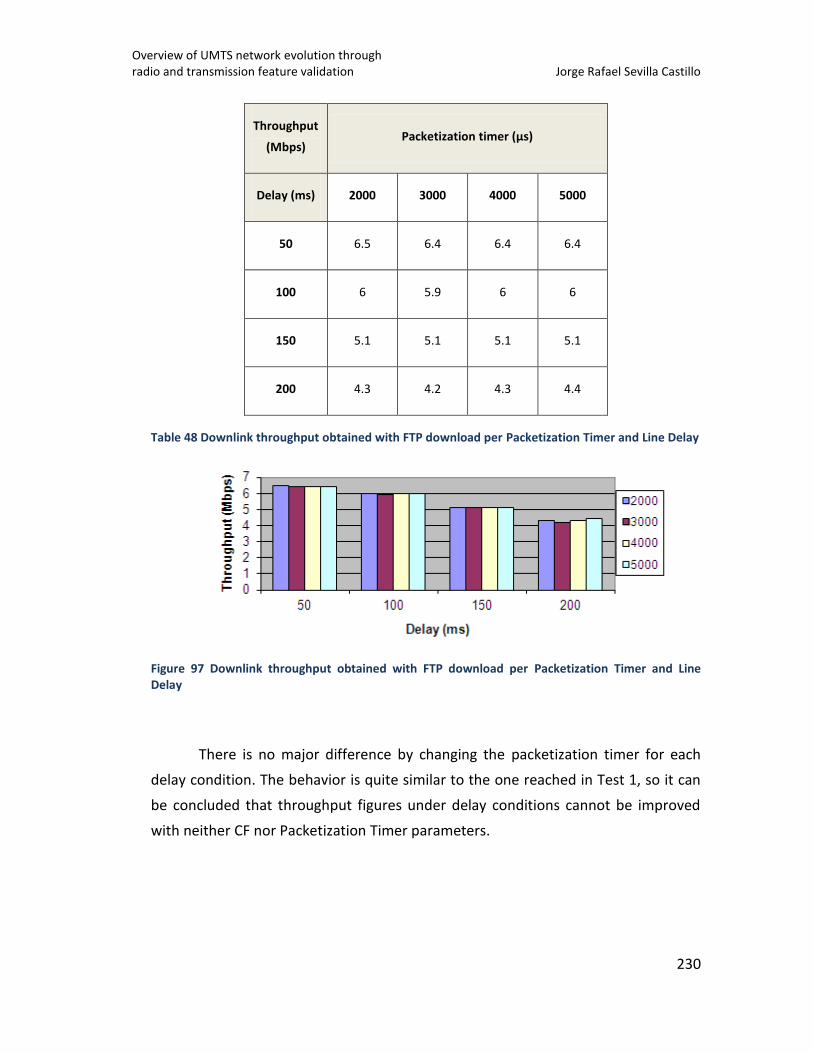
Overview of UMTS network evolution through radio and transmission feature validation Jorge Rafael Sevilla Castillo
230
Throughput
(Mbps) Packetization timer (µs)
Delay (ms) 2000 3000 4000 5000
50 6.5 6.4 6.4 6.4
100 6 5.9 6 6
150 5.1 5.1 5.1 5.1
200 4.3 4.2 4.3 4.4
Table 48 Downlink throughput obtained with FTP download per Packetization Timer and Line Delay
Figure 97 Downlink throughput obtained with FTP download per Packetization Timer and Line Delay
There is no major difference by changing the packetization timer for each
delay condition. The behavior is quite similar to the one reached in Test 1, so it can
be concluded that throughput figures under delay conditions cannot be improved
with neither CF nor Packetization Timer parameters.
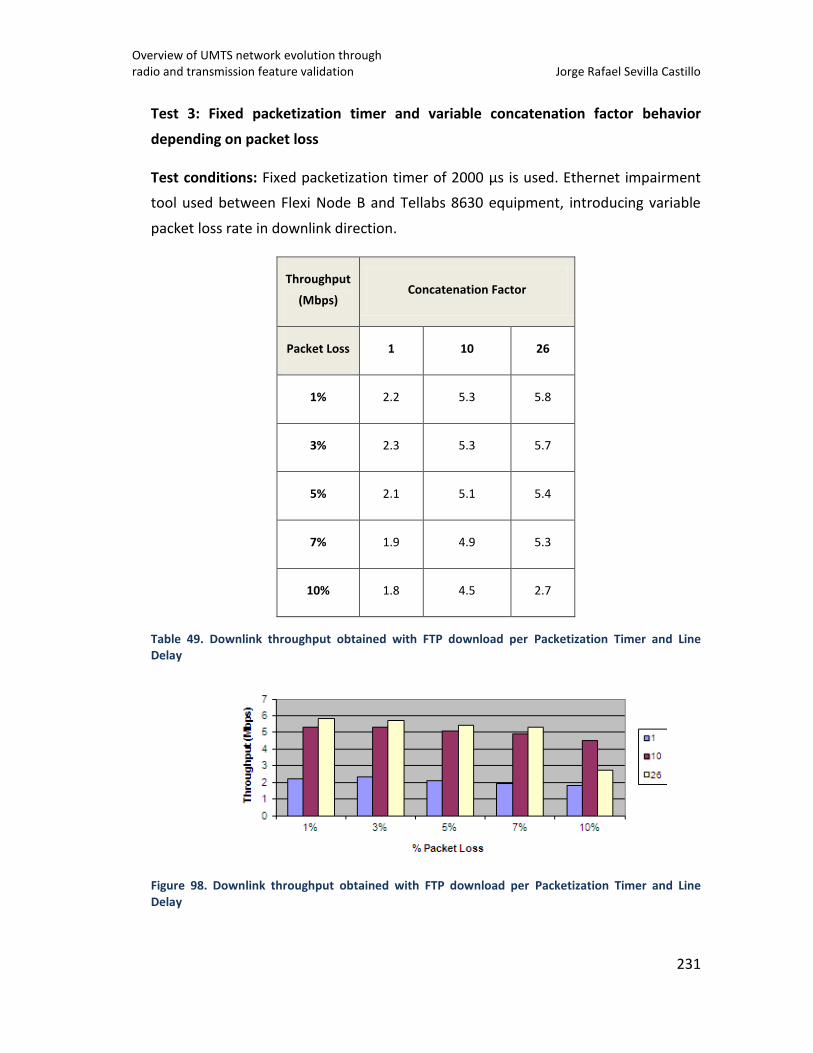
Overview of UMTS network evolution through radio and transmission feature validation Jorge Rafael Sevilla Castillo
231
Test 3: Fixed packetization timer and variable concatenation factor behavior
depending on packet loss
Test conditions: Fixed packetization timer of 2000 µs is used. Ethernet impairment
tool used between Flexi Node B and Tellabs 8630 equipment, introducing variable
packet loss rate in downlink direction.
Throughput
(Mbps) Concatenation Factor
Packet Loss 1 10 26
1% 2.2 5.3 5.8
3% 2.3 5.3 5.7
5% 2.1 5.1 5.4
7% 1.9 4.9 5.3
10% 1.8 4.5 2.7
Table 49. Downlink throughput obtained with FTP download per Packetization Timer and Line Delay
Figure 98. Downlink throughput obtained with FTP download per Packetization Timer and Line Delay
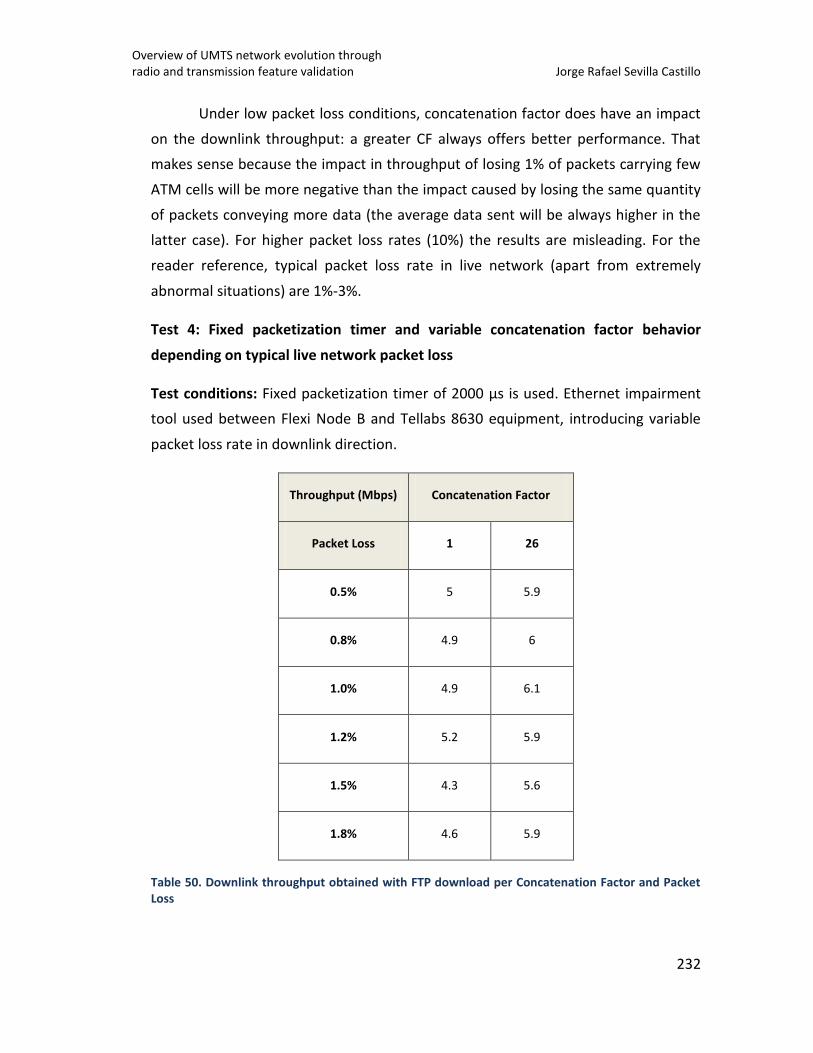
Overview of UMTS network evolution through radio and transmission feature validation Jorge Rafael Sevilla Castillo
232
Under low packet loss conditions, concatenation factor does have an impact
on the downlink throughput: a greater CF always offers better performance. That
makes sense because the impact in throughput of losing 1% of packets carrying few
ATM cells will be more negative than the impact caused by losing the same quantity
of packets conveying more data (the average data sent will be always higher in the
latter case). For higher packet loss rates (10%) the results are misleading. For the
reader reference, typical packet loss rate in live network (apart from extremely
abnormal situations) are 1%-3%.
Test 4: Fixed packetization timer and variable concatenation factor behavior
depending on typical live network packet loss
Test conditions: Fixed packetization timer of 2000 µs is used. Ethernet impairment
tool used between Flexi Node B and Tellabs 8630 equipment, introducing variable
packet loss rate in downlink direction.
Throughput (Mbps) Concatenation Factor
Packet Loss 1 26
0.5% 5 5.9
0.8% 4.9 6
1.0% 4.9 6.1
1.2% 5.2 5.9
1.5% 4.3 5.6
1.8% 4.6 5.9
Table 50. Downlink throughput obtained with FTP download per Concatenation Factor and Packet Loss
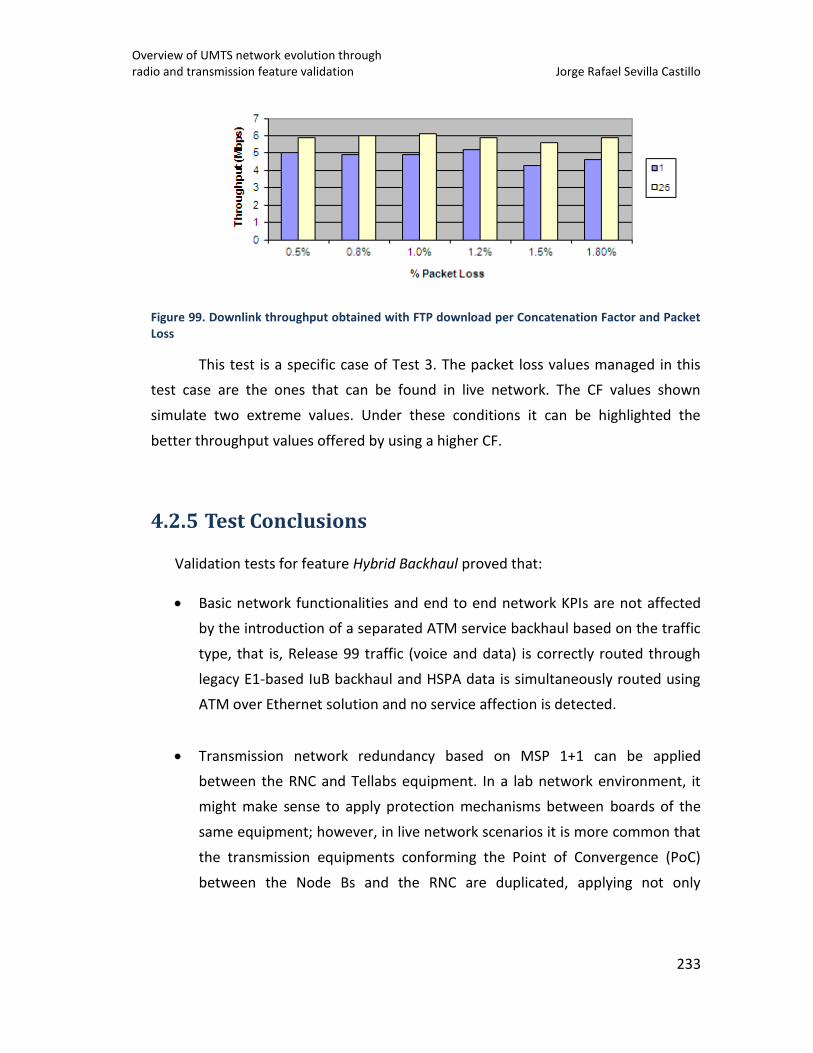
Overview of UMTS network evolution through radio and transmission feature validation Jorge Rafael Sevilla Castillo
233
Figure 99. Downlink throughput obtained with FTP download per Concatenation Factor and Packet Loss
This test is a specific case of Test 3. The packet loss values managed in this
test case are the ones that can be found in live network. The CF values shown
simulate two extreme values. Under these conditions it can be highlighted the
better throughput values offered by using a higher CF.
4.2.5 Test Conclusions
Validation tests for feature Hybrid Backhaul proved that:
Basic network functionalities and end to end network KPIs are not affected
by the introduction of a separated ATM service backhaul based on the traffic
type, that is, Release 99 traffic (voice and data) is correctly routed through
legacy E1-based IuB backhaul and HSPA data is simultaneously routed using
ATM over Ethernet solution and no service affection is detected.
Transmission network redundancy based on MSP 1+1 can be applied
between the RNC and Tellabs equipment. In a lab network environment, it
might make sense to apply protection mechanisms between boards of the
same equipment; however, in live network scenarios it is more common that
the transmission equipments conforming the Point of Convergence (PoC)
between the Node Bs and the RNC are duplicated, applying not only
Overview of UMTS network evolution through radio and transmission feature validation Jorge Rafael Sevilla Castillo
234
equipment but also TX path redundancy as well, to improve system
robustness.
Seamless mobility can be executed between Node Bs with different TX
solutions (non-hybrid to hybrid Node B and vice versa), ensuring a smooth
deployment in live network.
Under non-ideal conditions of packet loss in the TX media, ATM over
Ethernet parameter Concatenation Factor can be tuned whilst leaving a Fixed
Packetization timer to minimize the impact in throughput. It has also been
proved that under heavy delay conditions, none of these parameters can
help to avoid throughput degradation.
Overview of UMTS network evolution through radio and transmission feature validation Jorge Rafael Sevilla Castillo
235
4.3 IuB over IP feature validation
Once the reader has understood the principles and results of a smooth
migration from pure ATM transmission backhauls to Hybrid Backhaul scenarios, it is
time to present the last step in the IuB interface evolution: the IP-based
transmission design. During this section, the basics and principles of IuB over IP
interface are explained, giving both the theoretical and practical point of view.
From testing activity point of view, the objective was to design the test
environment to validate the new software features involved with IuB over IP. The
following test cases will be discussed:
Layer 2 vs. Layer 3 design. These solutions offer a different approach from
the transmission design point of view. In case of live network deployments, it
is common to define a layer 2 solution which separates the IP addressing for
signaling and data services from maintenance services on a per VLAN basis.
That allows the configuration of different QoS policies per service, for
instance.
IuB over IP maintenance: Bidirectional Forwarding Detection (BFD)
configuration is introduced as a monitoring mechanism of packet data
networks. In this case, it will allow the maintenance of IuB over IP solution.
IuB QoS Transport: this feature allows QoS differentiation over IuB interface
in an All-IP network. Differentiated Service Code Point (DSCP) concept will be
introduced.
Overview of UMTS network evolution through radio and transmission feature validation Jorge Rafael Sevilla Castillo
236
4.3.1 Feature Description
IP packet backhaul
Packet Backhaul refers to the last step in the substitution of E1 links by a
packet-switched network based on full IP protocol stack. Transporting all the IuB
traffic over packets implies tighter requirements:
Hard Quality of Service (QoS): DCH real time traffic requirements should be
accomplished.
Minimum restoration time: if the packet network is disrupted, the service
has to be re-started within the same restoration time of a current E1 link.
Synchronization: maintaining synchronization with former E1 links,
synchronous Ethernet solutions, IP clock mechanism or GPS are the
alternative for synchronization.
Security: As control plane and maintenance traffic is not sufficiently
encrypted, this requirement is one of the most important.
QoS Awareness: Prioritization might be used between the different traffic
types in order to achieve the desired QoS.
Introduction to IuB over IP
Starting with 3GPP Release 6, WCDMA allows the use of IP as universal
transport protocol in the UMTS Radio Access Network.
The main driver to support IP transport is the reduction in OPEX:
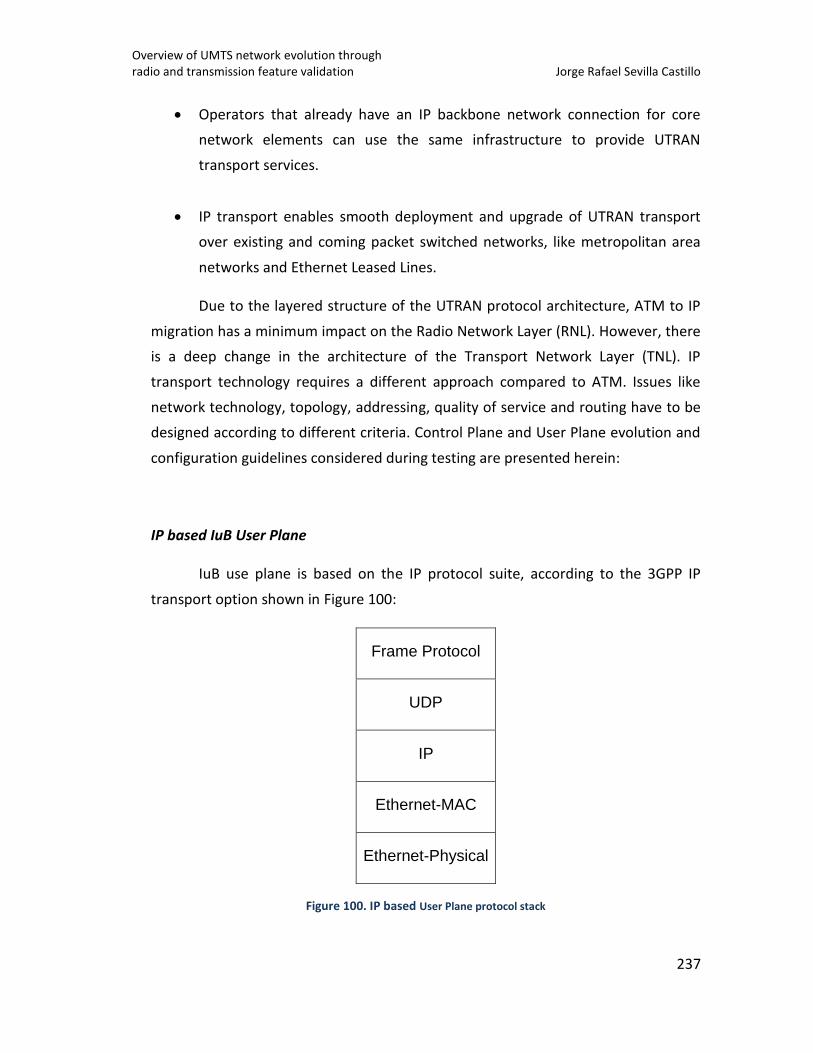
Overview of UMTS network evolution through radio and transmission feature validation Jorge Rafael Sevilla Castillo
237
Operators that already have an IP backbone network connection for core
network elements can use the same infrastructure to provide UTRAN
transport services.
IP transport enables smooth deployment and upgrade of UTRAN transport
over existing and coming packet switched networks, like metropolitan area
networks and Ethernet Leased Lines.
Due to the layered structure of the UTRAN protocol architecture, ATM to IP
migration has a minimum impact on the Radio Network Layer (RNL). However, there
is a deep change in the architecture of the Transport Network Layer (TNL). IP
transport technology requires a different approach compared to ATM. Issues like
network technology, topology, addressing, quality of service and routing have to be
designed according to different criteria. Control Plane and User Plane evolution and
configuration guidelines considered during testing are presented herein:
IP based IuB User Plane
IuB use plane is based on the IP protocol suite, according to the 3GPP IP
transport option shown in Figure 100:
Frame Protocol
UDP
IP
Ethernet-MAC
Ethernet-Physical
Figure 100. IP based User Plane protocol stack
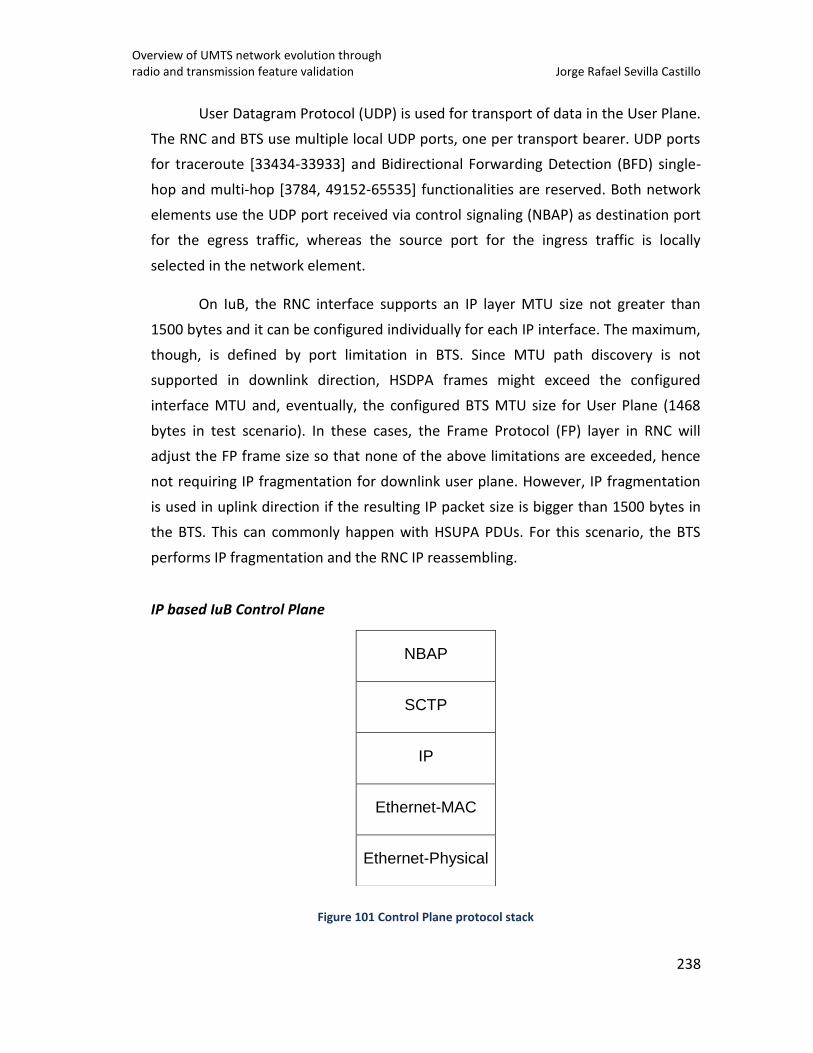
Overview of UMTS network evolution through radio and transmission feature validation Jorge Rafael Sevilla Castillo
238
User Datagram Protocol (UDP) is used for transport of data in the User Plane.
The RNC and BTS use multiple local UDP ports, one per transport bearer. UDP ports
for traceroute [33434-33933] and Bidirectional Forwarding Detection (BFD) single-
hop and multi-hop [3784, 49152-65535] functionalities are reserved. Both network
elements use the UDP port received via control signaling (NBAP) as destination port
for the egress traffic, whereas the source port for the ingress traffic is locally
selected in the network element.
On IuB, the RNC interface supports an IP layer MTU size not greater than
1500 bytes and it can be configured individually for each IP interface. The maximum,
though, is defined by port limitation in BTS. Since MTU path discovery is not
supported in downlink direction, HSDPA frames might exceed the configured
interface MTU and, eventually, the configured BTS MTU size for User Plane (1468
bytes in test scenario). In these cases, the Frame Protocol (FP) layer in RNC will
adjust the FP frame size so that none of the above limitations are exceeded, hence
not requiring IP fragmentation for downlink user plane. However, IP fragmentation
is used in uplink direction if the resulting IP packet size is bigger than 1500 bytes in
the BTS. This can commonly happen with HSUPA PDUs. For this scenario, the BTS
performs IP fragmentation and the RNC IP reassembling.
IP based IuB Control Plane
Figure 101 Control Plane protocol stack
NBAP
SCTP
IP
Ethernet-MAC
Ethernet-Physical
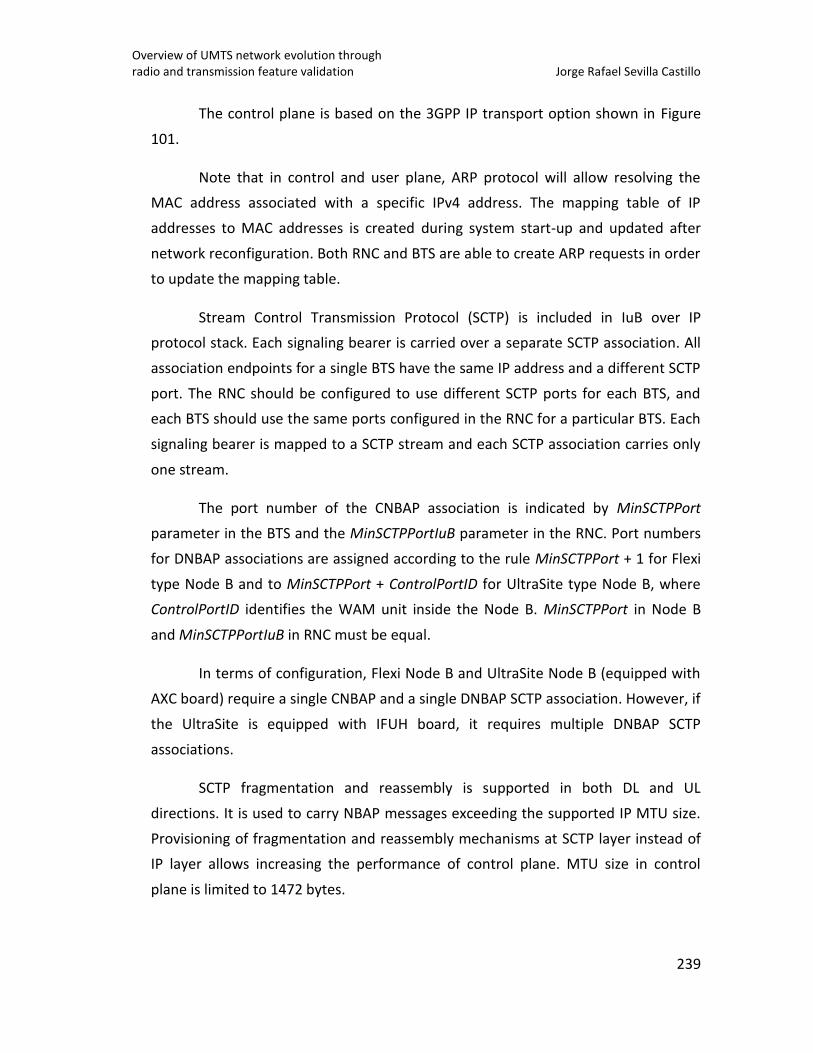
Overview of UMTS network evolution through radio and transmission feature validation Jorge Rafael Sevilla Castillo
239
The control plane is based on the 3GPP IP transport option shown in Figure
101.
Note that in control and user plane, ARP protocol will allow resolving the
MAC address associated with a specific IPv4 address. The mapping table of IP
addresses to MAC addresses is created during system start-up and updated after
network reconfiguration. Both RNC and BTS are able to create ARP requests in order
to update the mapping table.
Stream Control Transmission Protocol (SCTP) is included in IuB over IP
protocol stack. Each signaling bearer is carried over a separate SCTP association. All
association endpoints for a single BTS have the same IP address and a different SCTP
port. The RNC should be configured to use different SCTP ports for each BTS, and
each BTS should use the same ports configured in the RNC for a particular BTS. Each
signaling bearer is mapped to a SCTP stream and each SCTP association carries only
one stream.
The port number of the CNBAP association is indicated by MinSCTPPort
parameter in the BTS and the MinSCTPPortIuB parameter in the RNC. Port numbers
for DNBAP associations are assigned according to the rule MinSCTPPort + 1 for Flexi
type Node B and to MinSCTPPort + ControlPortID for UltraSite type Node B, where
ControlPortID identifies the WAM unit inside the Node B. MinSCTPPort in Node B
and MinSCTPPortIuB in RNC must be equal.
In terms of configuration, Flexi Node B and UltraSite Node B (equipped with
AXC board) require a single CNBAP and a single DNBAP SCTP association. However, if
the UltraSite is equipped with IFUH board, it requires multiple DNBAP SCTP
associations.
SCTP fragmentation and reassembly is supported in both DL and UL
directions. It is used to carry NBAP messages exceeding the supported IP MTU size.
Provisioning of fragmentation and reassembly mechanisms at SCTP layer instead of
IP layer allows increasing the performance of control plane. MTU size in control
plane is limited to 1472 bytes.
Overview of UMTS network evolution through radio and transmission feature validation Jorge Rafael Sevilla Castillo
240
In addition, SCTP also supports path and endpoint fault detection. If the peer
endpoint is considered unreachable, the fault is properly reported to the upper layer
for further recovery actions.
BFD
BFD (Bidirectional Forwarding Detection) is defined by IETF as a mechanism
to monitor the connectivity in packet networks, BFD can be used to monitor the
status of the IP paths between the Node and the RNC (IuB) or between RNCs (Iur). In
this case it is only shown the behavior in IuB interface.
At IuB, BFD control packets are encapsulated over UDP/IPv4/Ethernet, the
same as the user plane. VLAN tagging is applied if selected for the rest of the traffic.
Limitation of this feature is that only one IP address in the RNC can be used
for BFD, irrespective of VLAN ID.
BFD Control Packets (24 bytes)
UDP (8 bytes)
IPv4 (20 bytes)
Ethernet-MAC
Ethernet-Physical
Figure 102. Encapsulation of BFD in IuB/Iur
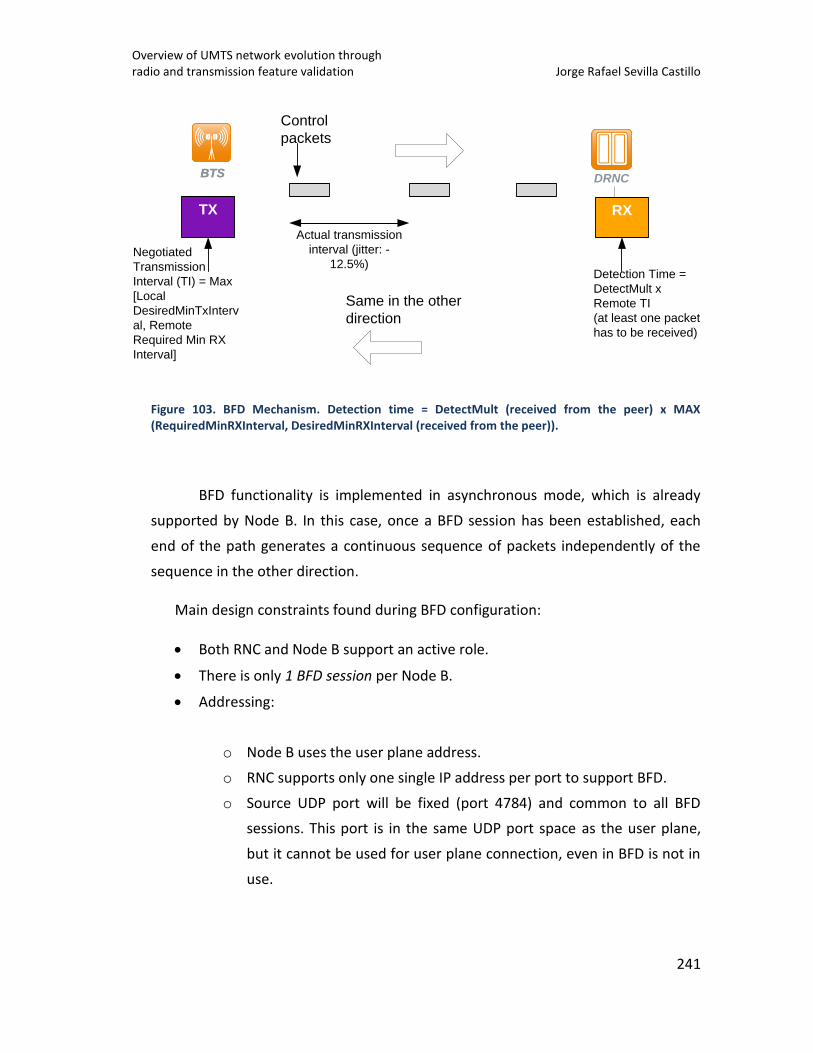
Overview of UMTS network evolution through radio and transmission feature validation Jorge Rafael Sevilla Castillo
241
Figure 103. BFD Mechanism. Detection time = DetectMult (received from the peer) x MAX (RequiredMinRXInterval, DesiredMinRXInterval (received from the peer)).
BFD functionality is implemented in asynchronous mode, which is already
supported by Node B. In this case, once a BFD session has been established, each
end of the path generates a continuous sequence of packets independently of the
sequence in the other direction.
Main design constraints found during BFD configuration:
Both RNC and Node B support an active role.
There is only 1 BFD session per Node B.
Addressing:
o Node B uses the user plane address.
o RNC supports only one single IP address per port to support BFD.
o Source UDP port will be fixed (port 4784) and common to all BFD
sessions. This port is in the same UDP port space as the user plane,
but it cannot be used for user plane connection, even in BFD is not in
use.
Actual transmission
interval (jitter: -
12.5%)
TX
Control
packets
Negotiated
Transmission
Interval (TI) = Max
[Local
DesiredMinTxInterv
al, Remote
Required Min RX
Interval]
RX
Detection Time =
DetectMult x
Remote TI
(at least one packet
has to be received)
Same in the other
direction
BTSBTS DRNC
Overview of UMTS network evolution through radio and transmission feature validation Jorge Rafael Sevilla Castillo
242
Session Activation:
o A decision has to be made for which destinations the BFD sessions are
going to be established. IP addresses are not configured automatically
based on the user plane addresses, but they are configured
separately.
o Transmission interval parameters are configured.
o Each session can individually be activated.
4.3.2 Testbed configuration and settings
In addition to the before mentioned RAN network elements (RNC and Node
B), the whole end-to-end scenario including UEs, laptops, Core Network elements,
interfaces, additional routers, switches and servers should support the preferred
new features in terms of configuration, licenses and available bandwidth. The
following subsections list all the designs implemented during this validation phase.
Scenario 1: Layer 3 transport design overview
From the implementation point of view, IP addressing plan and network
element configuration can be divided into two main steps: external configuration
(including RNC external IP interface, layer 3 router and NODE B) and internal
configuration (including connectivity with ICSUs – which are the control plane
interface processing board in the RNC- and OMU – which handles the operation and
maintenance traffic of the Node B).
External Configuration
Figure 104 shows the elements involved concerning RNC external
configuration. This scenario emulates a situation in which the RNC - Node B
connectivity is divided in different IP subnets:
Overview of UMTS network evolution through radio and transmission feature validation Jorge Rafael Sevilla Castillo
243
IP Subnet 1: dedicated for the link between the RNC and the traffic
aggregation equipment. In this case, NPGE-1 is the Ethernet interface board
of the RNC where the IuB link is terminated. A Gigabit Ethernet port, IFGE-0,
will be used. On the other hand, Tellabs 8630 will be used as the layer 3
router and the physical connection will be terminated in a Gigabit Ethernet
interface board.
IP Subnet 2: dedicated for the link between the traffic aggregation
equipment and the transmission interface board of the Node B. In this case a
Fast Ethernet port will be used in both sides, replicating what would be a real
implementation scenario, where many Node Bs using Fast Ethernet
connections are aggregated into a Gigabit Ethernet trunk towards the RNC.
The reader can already foresee the scalability of this solution (where many
Node Bs can be connected to a Fast Ethernet interface of the traffic
aggregation equipment by connection other transmission equipments in
cascade). However, from an IP addressing planning point of view, a point to
point dedicated subnet per Node B is inefficient. For that reason, point to
multi-point IP addressing combined with Layer 2 design is most commonly
used in live network deployments (1 IP address in the traffic aggregation
equipment, 1 IP address per Node B and many layer 2 transmission
equipments, usually packet microwave nodes, defining a star or ring
topology). Lately in this chapter, it will be shown how this transmission
design can be reused for current 4G network deployments and which are the
most common topologies involved
IP Subnet 3: dedicated for the Node B O&M domain. It is internally defined
within the Node B.
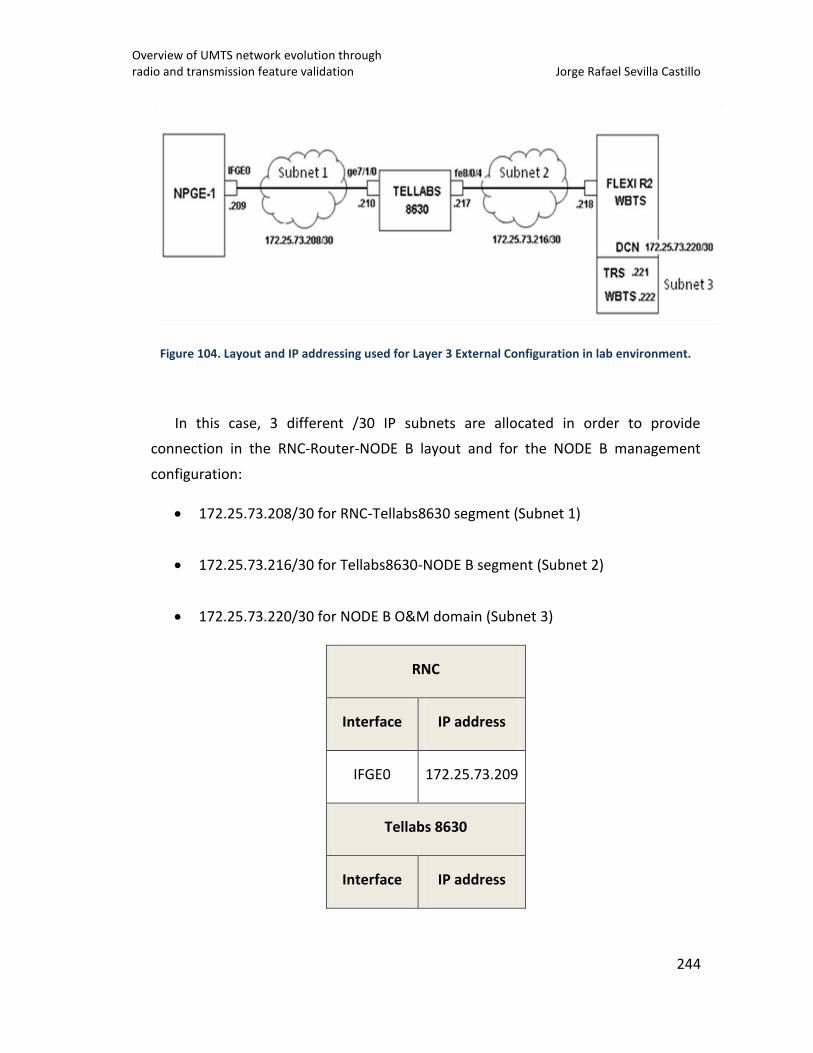
Overview of UMTS network evolution through radio and transmission feature validation Jorge Rafael Sevilla Castillo
244
Figure 104. Layout and IP addressing used for Layer 3 External Configuration in lab environment.
In this case, 3 different /30 IP subnets are allocated in order to provide
connection in the RNC-Router-NODE B layout and for the NODE B management
configuration:
172.25.73.208/30 for RNC-Tellabs8630 segment (Subnet 1)
172.25.73.216/30 for Tellabs8630-NODE B segment (Subnet 2)
172.25.73.220/30 for NODE B O&M domain (Subnet 3)
RNC
Interface IP address
IFGE0 172.25.73.209
Tellabs 8630
Interface IP address
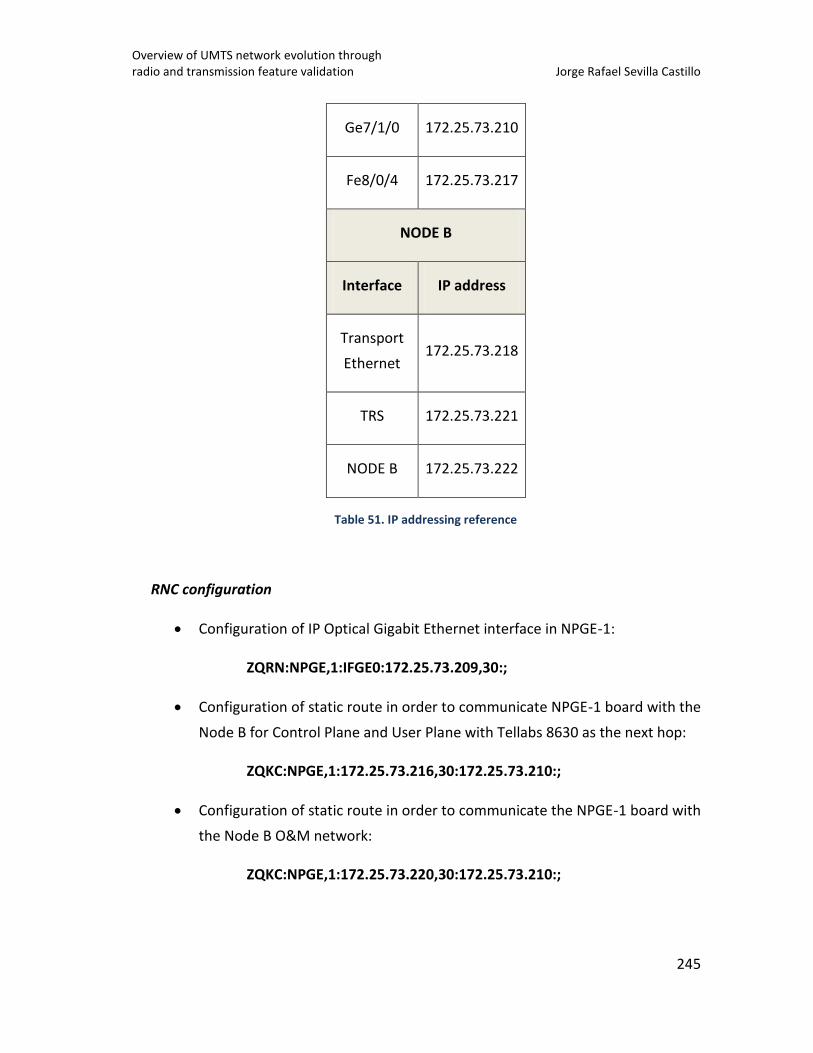
Overview of UMTS network evolution through radio and transmission feature validation Jorge Rafael Sevilla Castillo
245
Ge7/1/0 172.25.73.210
Fe8/0/4 172.25.73.217
NODE B
Interface IP address
Transport
Ethernet 172.25.73.218
TRS 172.25.73.221
NODE B 172.25.73.222
Table 51. IP addressing reference
RNC configuration
Configuration of IP Optical Gigabit Ethernet interface in NPGE-1:
ZQRN:NPGE,1:IFGE0:172.25.73.209,30:;
Configuration of static route in order to communicate NPGE-1 board with the
Node B for Control Plane and User Plane with Tellabs 8630 as the next hop:
ZQKC:NPGE,1:172.25.73.216,30:172.25.73.210:;
Configuration of static route in order to communicate the NPGE-1 board with
the Node B O&M network:
ZQKC:NPGE,1:172.25.73.220,30:172.25.73.210:;
Overview of UMTS network evolution through radio and transmission feature validation Jorge Rafael Sevilla Castillo
246
Assign DSPM profile to the IP interface in NPGE-1, which allows the definition
of QoS policies over the IP connections on the selected Ethernet interface.
This will be used in the validation step dedicated to QoS.
ZQ8S:NPGE,1:IFGE0:ENA:;
Tellabs 8630 Configuration
Configuration of Fast Ethernet interface (Tellabs 8630 – Node B segment)
Tellabs(config)# interface fe8/0/4
Tellabs(cfg-if[fe8/0/4])# ip address 172.25.73.217/30
Tellabs(cfg-if[fe8/0/4])# no shutdown
Tellabs(cfg-if[fe8/0/4])# exit
Configuration of Gigabit Ethernet interface (Tellabs – RNC)
Tellabs(config)# interface ge7/1/0
Tellabs(cfg-if[fe8/0/2])# ip address 172.25.73.210/30
Tellabs(cfg-if[fe8/0/2])# no shutdown
Tellabs(cfg-if[fe8/0/2])# exit
Addition of necessary static routes. In the command it is indicated both the
destination IP subnet and the next hop IP to reach that subnet.
Tellabs(config)# ip route 172.25.73.220/30 172.25.73.218 // To
enable the communication towards subnet 3 via Node B transmission
interface.
Tellabs(config)# ip route 172.25.73.203/32 172.25.73.209 //To
enable the Node B to communicate with the Operation and
Management System within the RNC. Please refer to Figure 38.
Overview of UMTS network evolution through radio and transmission feature validation Jorge Rafael Sevilla Castillo
247
Tellabs(config)# ip route 172.25.73.200/32 172.25.73.209 //To
enable the Node B to communicate with the Operation and
Management Unit in the RNC.
Tellabs(config)# ip route 172.25.102.0/24 172.25.83.209 //To allow
communication between the Node B and NetAct network for O&M
purposes.
Tellabs(config)# ip route 10.16.76.64/26 172.25.73.209 //To allow
communication between the Node B and the RNC internal SCTP
subnet (see internal configuration) for signaling control purposes.
Note that user plane is directly handled by NPGE logical instance.
Configuration of Node B and RNC Object Browser is explained after the
internal configuration is explained.
Internal Configuration
Figure 105 explains the RNC internal logical and physical architecture
involved in the definition of an IuB over IP in the hardware under test.
Considering the evolution of the external interface with regards the
implementation of a full IP protocol stack, it is expected beforehand an internal
architecture evolution at logical level, so the legacy hardware units can be reused
and only few extra boards are required to make a cost-effective evolution for the
operator.
Hardware Units
NPGE/N2PGE: new interface board, supporting FE/GE interfaces and
processing IuB over IP user plane data.
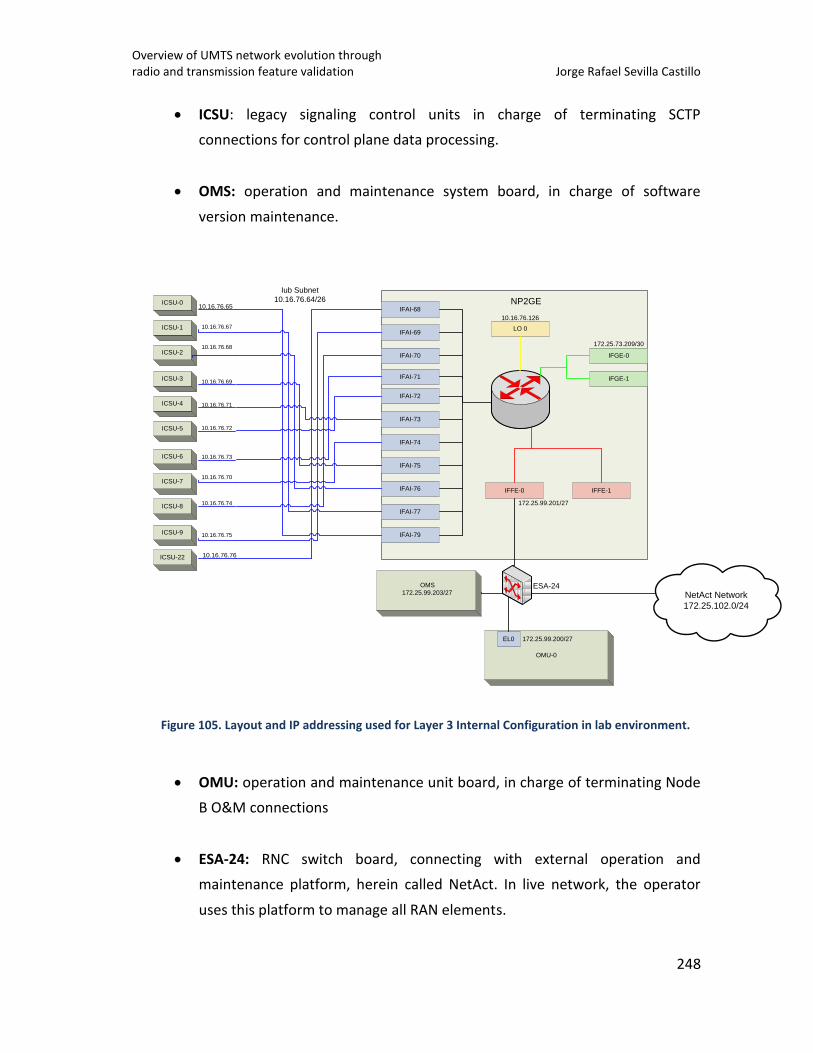
Overview of UMTS network evolution through radio and transmission feature validation Jorge Rafael Sevilla Castillo
248
ICSU: legacy signaling control units in charge of terminating SCTP
connections for control plane data processing.
OMS: operation and maintenance system board, in charge of software
version maintenance.
ICSU-0
ICSU-1
ICSU-2
ICSU-3
ICSU-5
ICSU-4
ICSU-6
ICSU-7
ICSU-8
ICSU-9
ICSU-22
IFAI-72
IFAI-73
IFAI-74
IFAI-75
IFAI-69
IFAI-70
IFAI-71
IFAI-76
IFAI-77
IFAI-79
IFAI-6810.16.76.65
10.16.76.67
10.16.76.68
10.16.76.69
10.16.76.71
10.16.76.72
10.16.76.73
10.16.76.70
10.16.76.74
10.16.76.75
10.16.76.76
Iub Subnet
10.16.76.64/26
LO 0
IFGE-1
IFGE-0
IFFE-0 IFFE-1
10.16.76.126
ESA-24
172.25.73.209/30
NP2GE
172.25.99.201/27
OMU-0
172.25.99.200/27EL0
NetAct Network
172.25.102.0/24
OMS
172.25.99.203/27
Figure 105. Layout and IP addressing used for Layer 3 Internal Configuration in lab environment.
OMU: operation and maintenance unit board, in charge of terminating Node
B O&M connections
ESA-24: RNC switch board, connecting with external operation and
maintenance platform, herein called NetAct. In live network, the operator
uses this platform to manage all RAN elements.
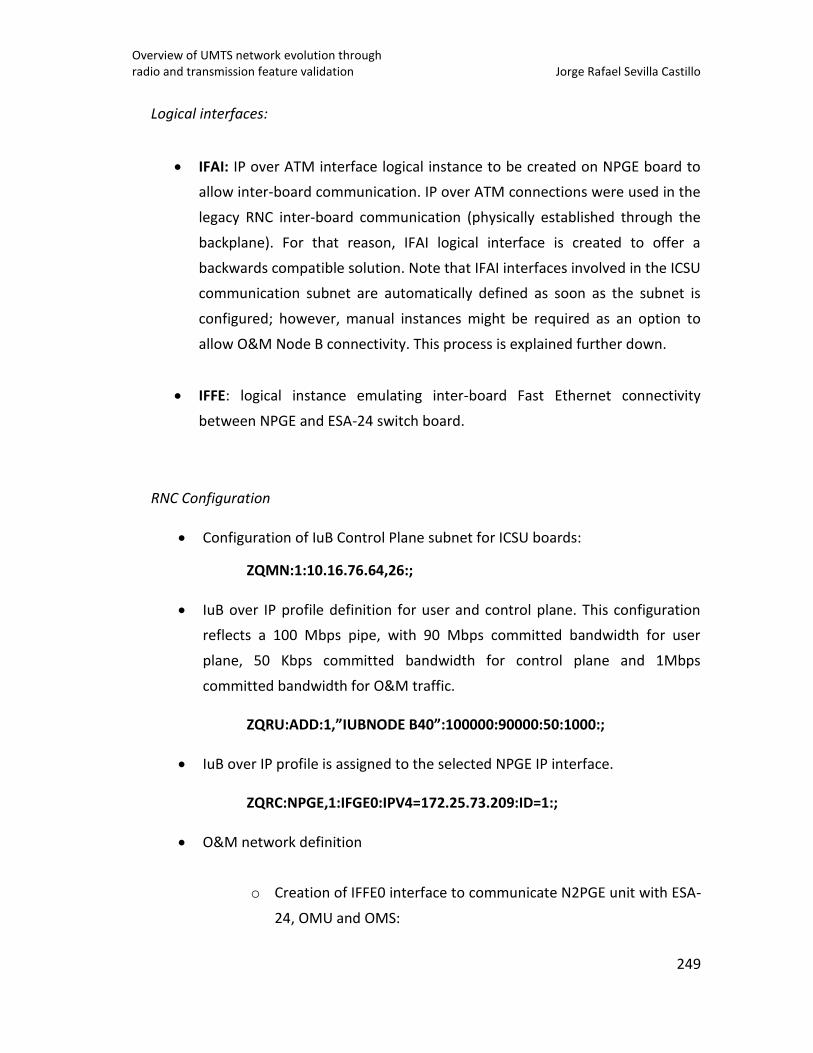
Overview of UMTS network evolution through radio and transmission feature validation Jorge Rafael Sevilla Castillo
249
Logical interfaces:
IFAI: IP over ATM interface logical instance to be created on NPGE board to
allow inter-board communication. IP over ATM connections were used in the
legacy RNC inter-board communication (physically established through the
backplane). For that reason, IFAI logical interface is created to offer a
backwards compatible solution. Note that IFAI interfaces involved in the ICSU
communication subnet are automatically defined as soon as the subnet is
configured; however, manual instances might be required as an option to
allow O&M Node B connectivity. This process is explained further down.
IFFE: logical instance emulating inter-board Fast Ethernet connectivity
between NPGE and ESA-24 switch board.
RNC Configuration
Configuration of IuB Control Plane subnet for ICSU boards:
ZQMN:1:10.16.76.64,26:;
IuB over IP profile definition for user and control plane. This configuration
reflects a 100 Mbps pipe, with 90 Mbps committed bandwidth for user
plane, 50 Kbps committed bandwidth for control plane and 1Mbps
committed bandwidth for O&M traffic.
ZQRU:ADD:1,”IUBNODE B40”:100000:90000:50:1000:;
IuB over IP profile is assigned to the selected NPGE IP interface.
ZQRC:NPGE,1:IFGE0:IPV4=172.25.73.209:ID=1:;
O&M network definition
o Creation of IFFE0 interface to communicate N2PGE unit with ESA-
24, OMU and OMS:
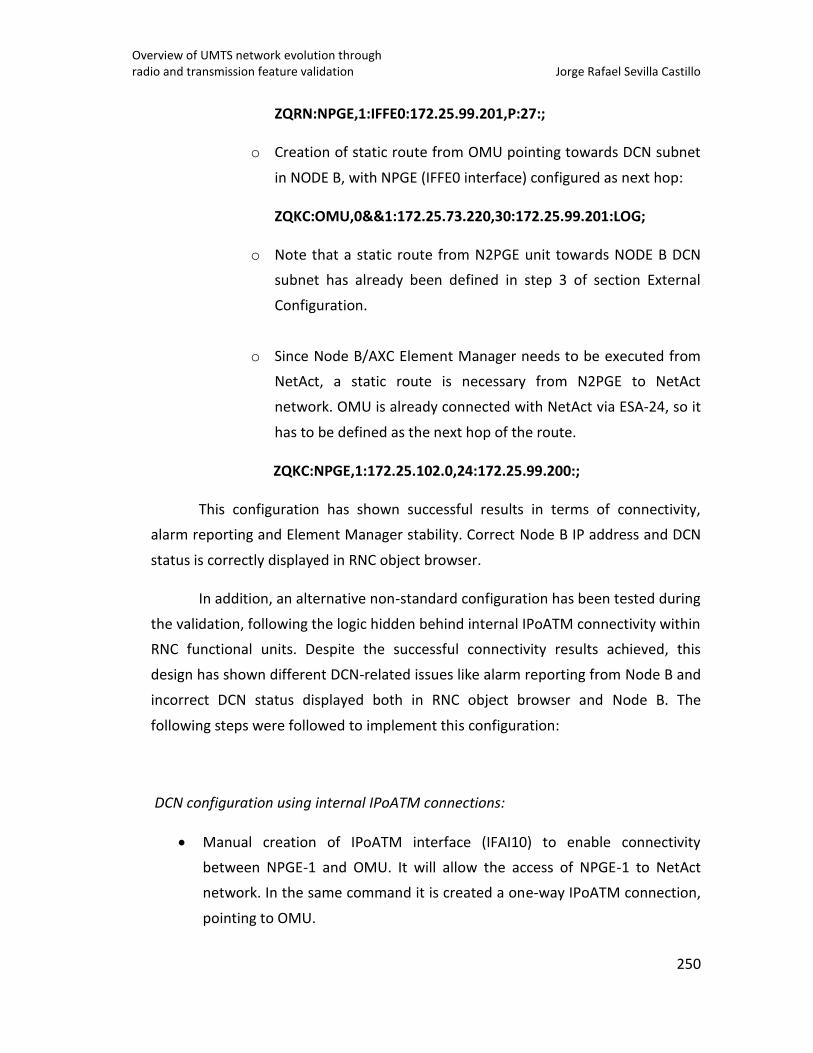
Overview of UMTS network evolution through radio and transmission feature validation Jorge Rafael Sevilla Castillo
250
ZQRN:NPGE,1:IFFE0:172.25.99.201,P:27:;
o Creation of static route from OMU pointing towards DCN subnet
in NODE B, with NPGE (IFFE0 interface) configured as next hop:
ZQKC:OMU,0&&1:172.25.73.220,30:172.25.99.201:LOG;
o Note that a static route from N2PGE unit towards NODE B DCN
subnet has already been defined in step 3 of section External
Configuration.
o Since Node B/AXC Element Manager needs to be executed from
NetAct, a static route is necessary from N2PGE to NetAct
network. OMU is already connected with NetAct via ESA-24, so it
has to be defined as the next hop of the route.
ZQKC:NPGE,1:172.25.102.0,24:172.25.99.200:;
This configuration has shown successful results in terms of connectivity,
alarm reporting and Element Manager stability. Correct Node B IP address and DCN
status is correctly displayed in RNC object browser.
In addition, an alternative non-standard configuration has been tested during
the validation, following the logic hidden behind internal IPoATM connectivity within
RNC functional units. Despite the successful connectivity results achieved, this
design has shown different DCN-related issues like alarm reporting from Node B and
incorrect DCN status displayed both in RNC object browser and Node B. The
following steps were followed to implement this configuration:
DCN configuration using internal IPoATM connections:
Manual creation of IPoATM interface (IFAI10) to enable connectivity
between NPGE-1 and OMU. It will allow the access of NPGE-1 to NetAct
network. In the same command it is created a one-way IPoATM connection,
pointing to OMU.
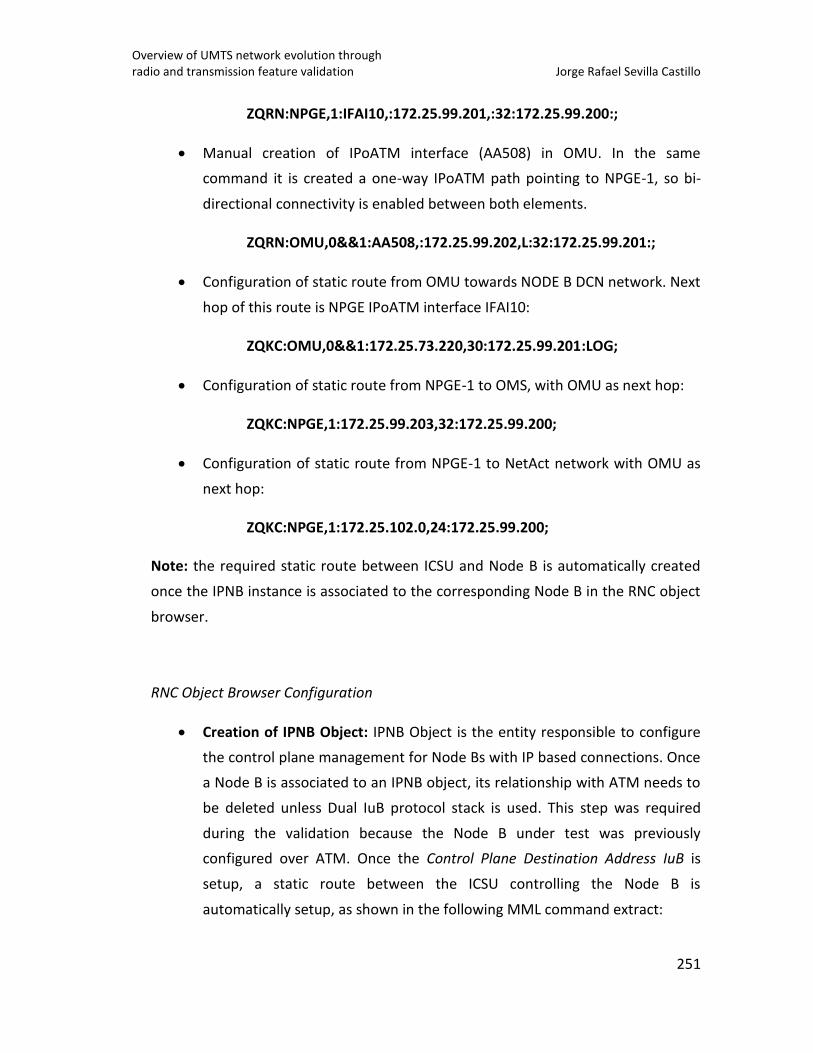
Overview of UMTS network evolution through radio and transmission feature validation Jorge Rafael Sevilla Castillo
251
ZQRN:NPGE,1:IFAI10,:172.25.99.201,:32:172.25.99.200:;
Manual creation of IPoATM interface (AA508) in OMU. In the same
command it is created a one-way IPoATM path pointing to NPGE-1, so bi-
directional connectivity is enabled between both elements.
ZQRN:OMU,0&&1:AA508,:172.25.99.202,L:32:172.25.99.201:;
Configuration of static route from OMU towards NODE B DCN network. Next
hop of this route is NPGE IPoATM interface IFAI10:
ZQKC:OMU,0&&1:172.25.73.220,30:172.25.99.201:LOG;
Configuration of static route from NPGE-1 to OMS, with OMU as next hop:
ZQKC:NPGE,1:172.25.99.203,32:172.25.99.200;
Configuration of static route from NPGE-1 to NetAct network with OMU as
next hop:
ZQKC:NPGE,1:172.25.102.0,24:172.25.99.200;
Note: the required static route between ICSU and Node B is automatically created
once the IPNB instance is associated to the corresponding Node B in the RNC object
browser.
RNC Object Browser Configuration
Creation of IPNB Object: IPNB Object is the entity responsible to configure
the control plane management for Node Bs with IP based connections. Once
a Node B is associated to an IPNB object, its relationship with ATM needs to
be deleted unless Dual IuB protocol stack is used. This step was required
during the validation because the Node B under test was previously
configured over ATM. Once the Control Plane Destination Address IuB is
setup, a static route between the ICSU controlling the Node B is
automatically setup, as shown in the following MML command extract:
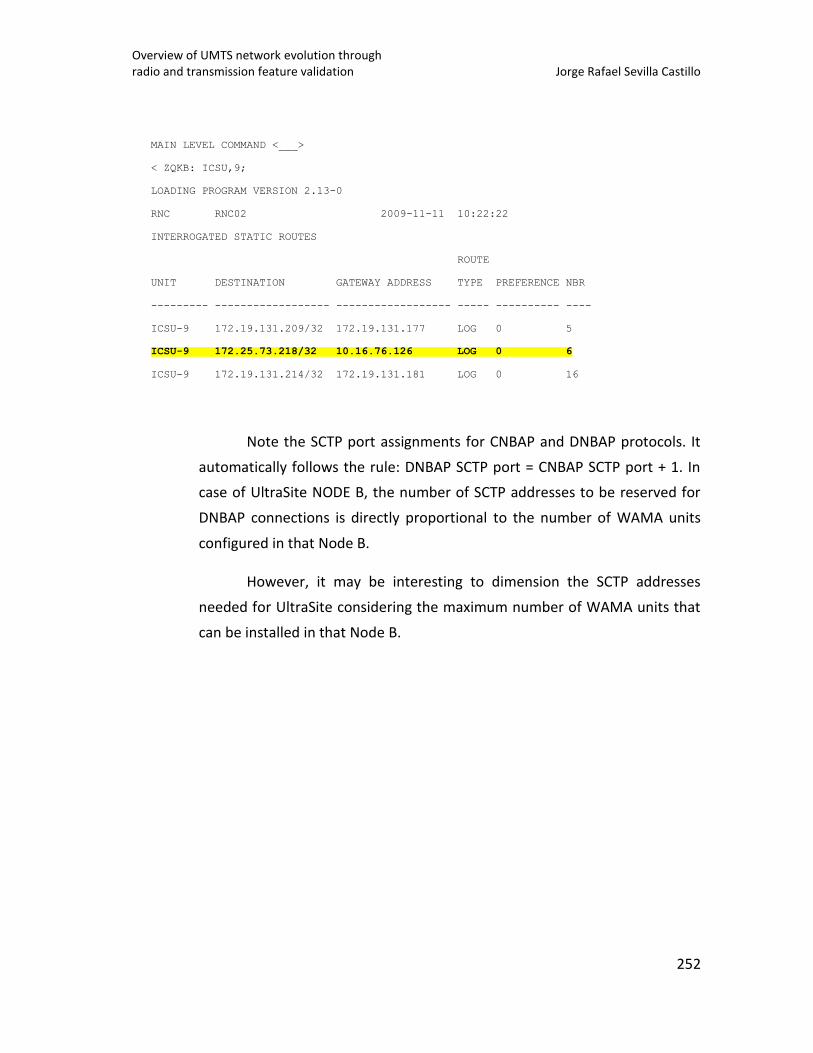
Overview of UMTS network evolution through radio and transmission feature validation Jorge Rafael Sevilla Castillo
252
MAIN LEVEL COMMAND <___>
< ZQKB: ICSU,9;
LOADING PROGRAM VERSION 2.13-0
RNC RNC02 2009-11-11 10:22:22
INTERROGATED STATIC ROUTES
ROUTE
UNIT DESTINATION GATEWAY ADDRESS TYPE PREFERENCE NBR
--------- ------------------ ------------------ ----- ---------- ----
ICSU-9 172.19.131.209/32 172.19.131.177 LOG 0 5
ICSU-9 172.25.73.218/32 10.16.76.126 LOG 0 6
ICSU-9 172.19.131.214/32 172.19.131.181 LOG 0 16
Note the SCTP port assignments for CNBAP and DNBAP protocols. It
automatically follows the rule: DNBAP SCTP port = CNBAP SCTP port + 1. In
case of UltraSite NODE B, the number of SCTP addresses to be reserved for
DNBAP connections is directly proportional to the number of WAMA units
configured in that Node B.
However, it may be interesting to dimension the SCTP addresses
needed for UltraSite considering the maximum number of WAMA units that
can be installed in that Node B.
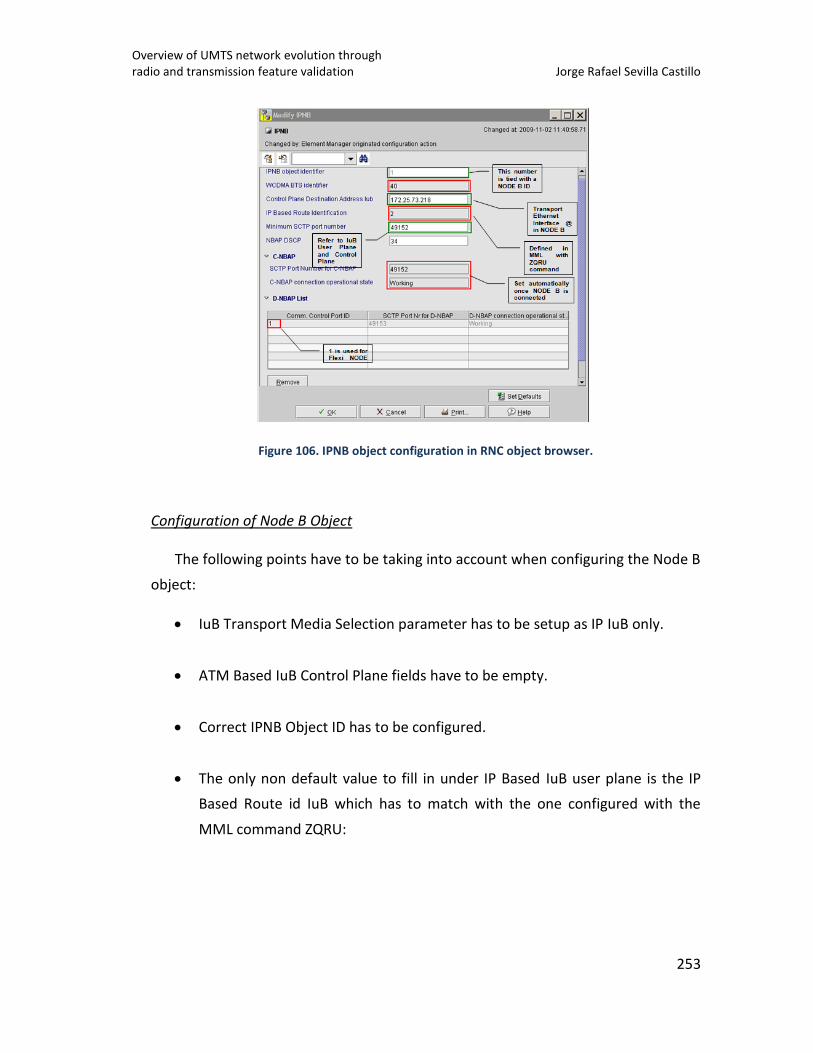
Overview of UMTS network evolution through radio and transmission feature validation Jorge Rafael Sevilla Castillo
253
Figure 106. IPNB object configuration in RNC object browser.
Configuration of Node B Object
The following points have to be taking into account when configuring the Node B
object:
IuB Transport Media Selection parameter has to be setup as IP IuB only.
ATM Based IuB Control Plane fields have to be empty.
Correct IPNB Object ID has to be configured.
The only non default value to fill in under IP Based IuB user plane is the IP
Based Route id IuB which has to match with the one configured with the
MML command ZQRU:
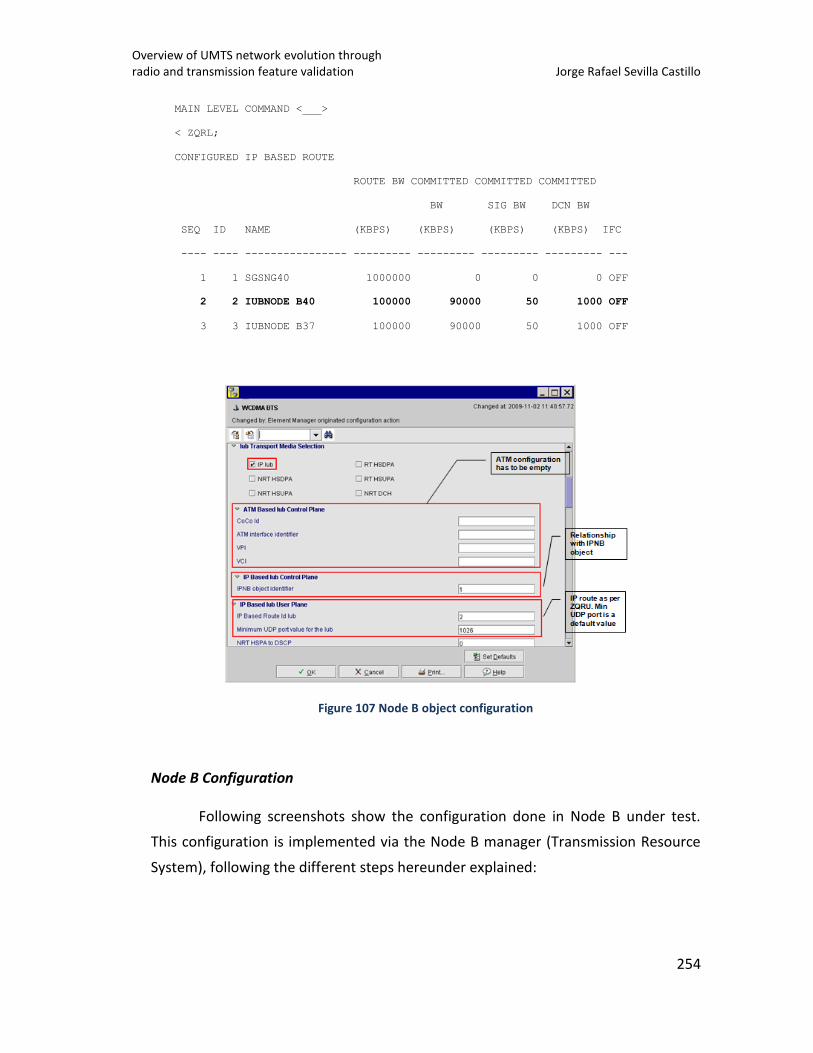
Overview of UMTS network evolution through radio and transmission feature validation Jorge Rafael Sevilla Castillo
254
MAIN LEVEL COMMAND <___>
< ZQRL;
CONFIGURED IP BASED ROUTE
ROUTE BW COMMITTED COMMITTED COMMITTED
BW SIG BW DCN BW
SEQ ID NAME (KBPS) (KBPS) (KBPS) (KBPS) IFC
---- ---- ---------------- --------- --------- --------- --------- ---
1 1 SGSNG40 1000000 0 0 0 OFF
2 2 IUBNODE B40 100000 90000 50 1000 OFF
3 3 IUBNODE B37 100000 90000 50 1000 OFF
Figure 107 Node B object configuration
Node B Configuration
Following screenshots show the configuration done in Node B under test.
This configuration is implemented via the Node B manager (Transmission Resource
System), following the different steps hereunder explained:
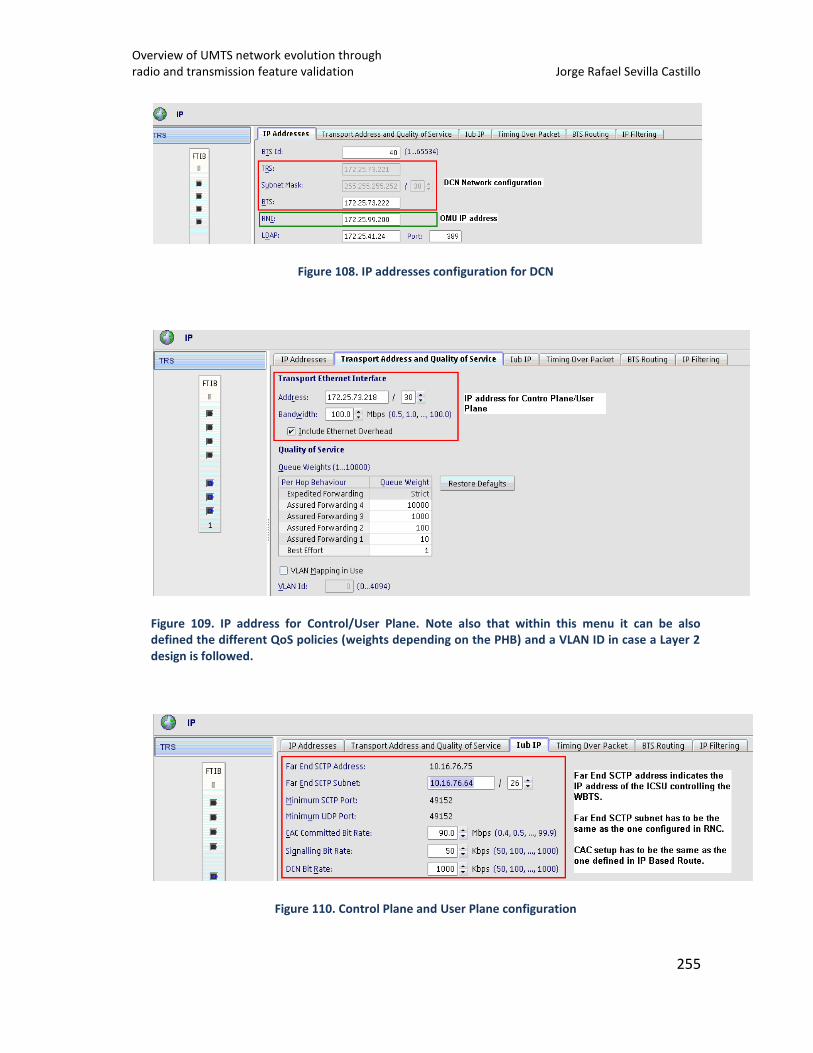
Overview of UMTS network evolution through radio and transmission feature validation Jorge Rafael Sevilla Castillo
255
Figure 108. IP addresses configuration for DCN
Figure 109. IP address for Control/User Plane. Note also that within this menu it can be also defined the different QoS policies (weights depending on the PHB) and a VLAN ID in case a Layer 2 design is followed.
Figure 110. Control Plane and User Plane configuration
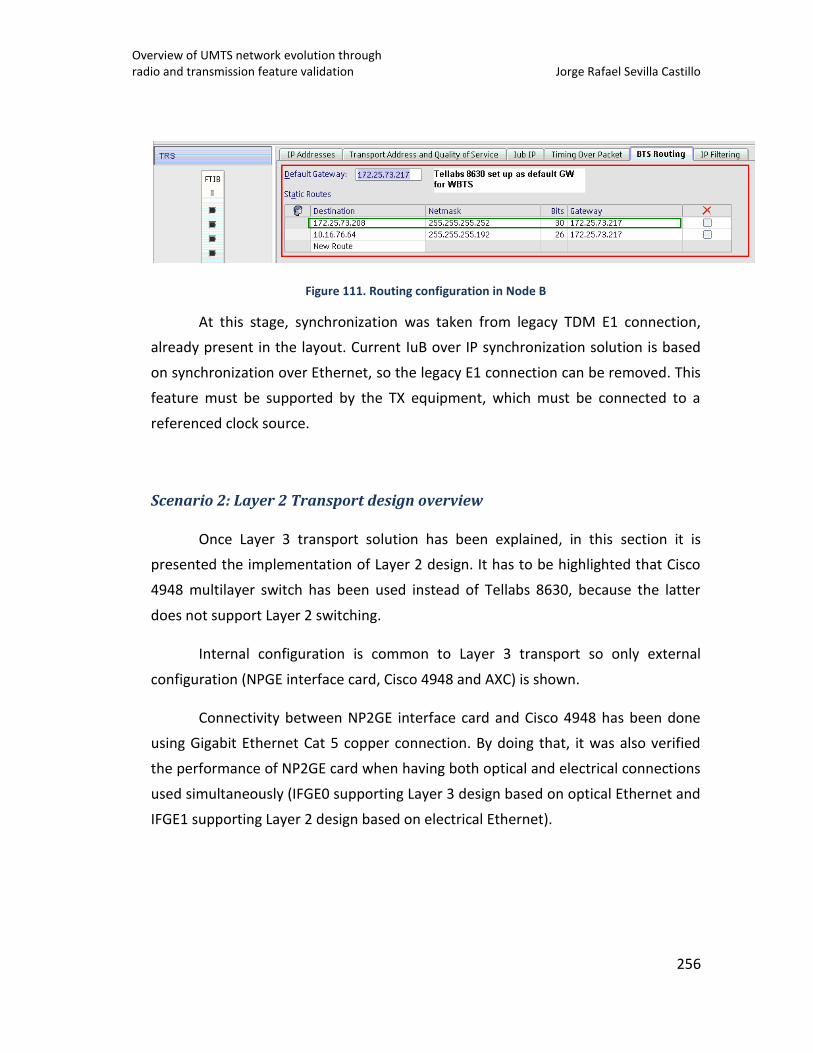
Overview of UMTS network evolution through radio and transmission feature validation Jorge Rafael Sevilla Castillo
256
Figure 111. Routing configuration in Node B
At this stage, synchronization was taken from legacy TDM E1 connection,
already present in the layout. Current IuB over IP synchronization solution is based
on synchronization over Ethernet, so the legacy E1 connection can be removed. This
feature must be supported by the TX equipment, which must be connected to a
referenced clock source.
Scenario 2: Layer 2 Transport design overview
Once Layer 3 transport solution has been explained, in this section it is
presented the implementation of Layer 2 design. It has to be highlighted that Cisco
4948 multilayer switch has been used instead of Tellabs 8630, because the latter
does not support Layer 2 switching.
Internal configuration is common to Layer 3 transport so only external
configuration (NPGE interface card, Cisco 4948 and AXC) is shown.
Connectivity between NP2GE interface card and Cisco 4948 has been done
using Gigabit Ethernet Cat 5 copper connection. By doing that, it was also verified
the performance of NP2GE card when having both optical and electrical connections
used simultaneously (IFGE0 supporting Layer 3 design based on optical Ethernet and
IFGE1 supporting Layer 2 design based on electrical Ethernet).
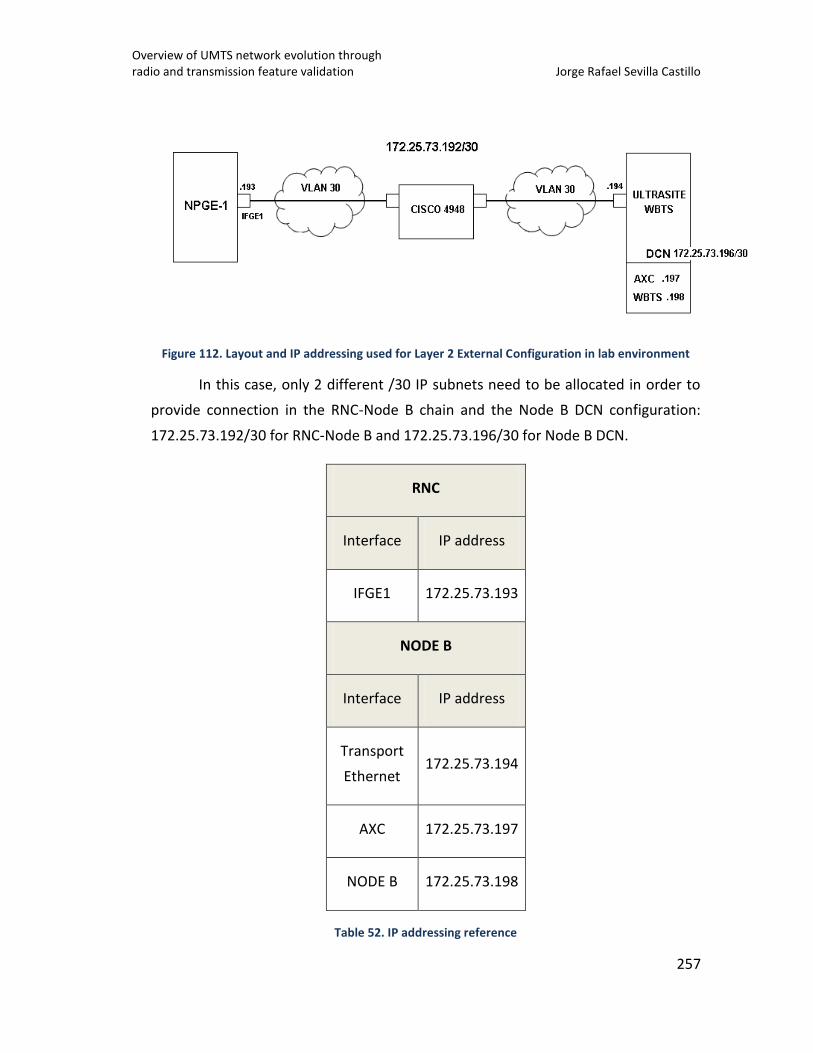
Overview of UMTS network evolution through radio and transmission feature validation Jorge Rafael Sevilla Castillo
257
Figure 112. Layout and IP addressing used for Layer 2 External Configuration in lab environment
In this case, only 2 different /30 IP subnets need to be allocated in order to
provide connection in the RNC-Node B chain and the Node B DCN configuration:
172.25.73.192/30 for RNC-Node B and 172.25.73.196/30 for Node B DCN.
RNC
Interface IP address
IFGE1 172.25.73.193
NODE B
Interface IP address
Transport
Ethernet 172.25.73.194
AXC 172.25.73.197
NODE B 172.25.73.198
Table 52. IP addressing reference
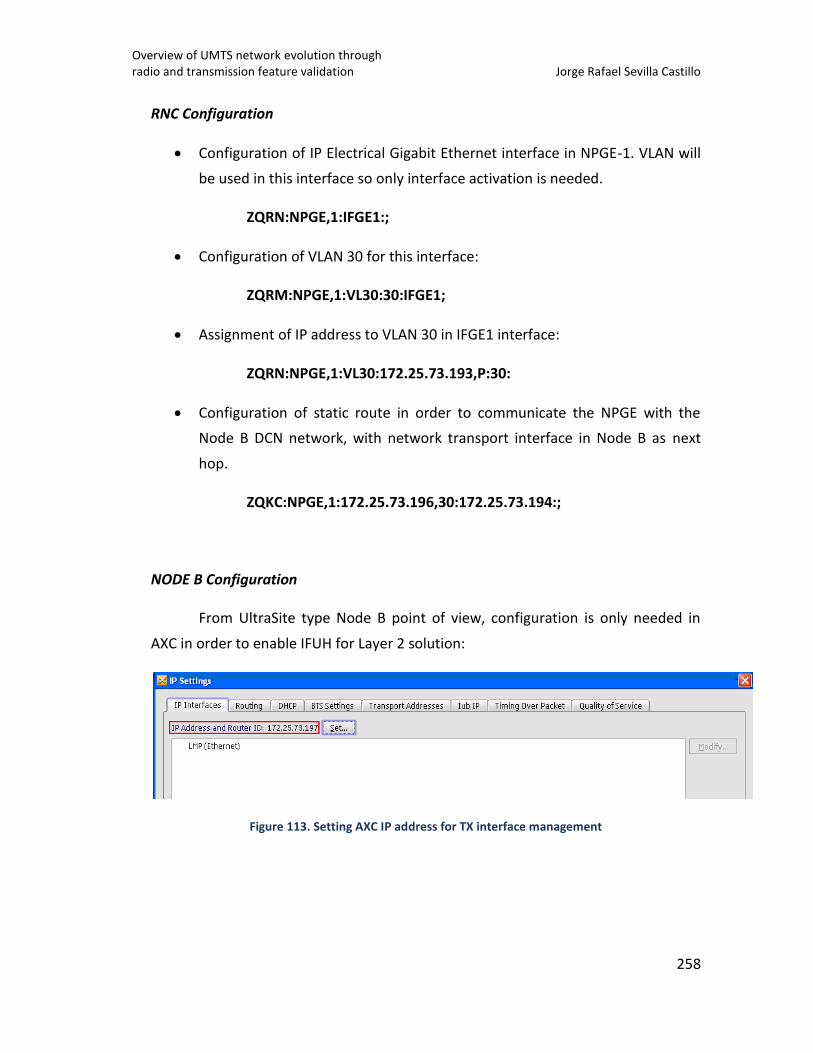
Overview of UMTS network evolution through radio and transmission feature validation Jorge Rafael Sevilla Castillo
258
RNC Configuration
Configuration of IP Electrical Gigabit Ethernet interface in NPGE-1. VLAN will
be used in this interface so only interface activation is needed.
ZQRN:NPGE,1:IFGE1:;
Configuration of VLAN 30 for this interface:
ZQRM:NPGE,1:VL30:30:IFGE1;
Assignment of IP address to VLAN 30 in IFGE1 interface:
ZQRN:NPGE,1:VL30:172.25.73.193,P:30:
Configuration of static route in order to communicate the NPGE with the
Node B DCN network, with network transport interface in Node B as next
hop.
ZQKC:NPGE,1:172.25.73.196,30:172.25.73.194:;
NODE B Configuration
From UltraSite type Node B point of view, configuration is only needed in
AXC in order to enable IFUH for Layer 2 solution:
Figure 113. Setting AXC IP address for TX interface management
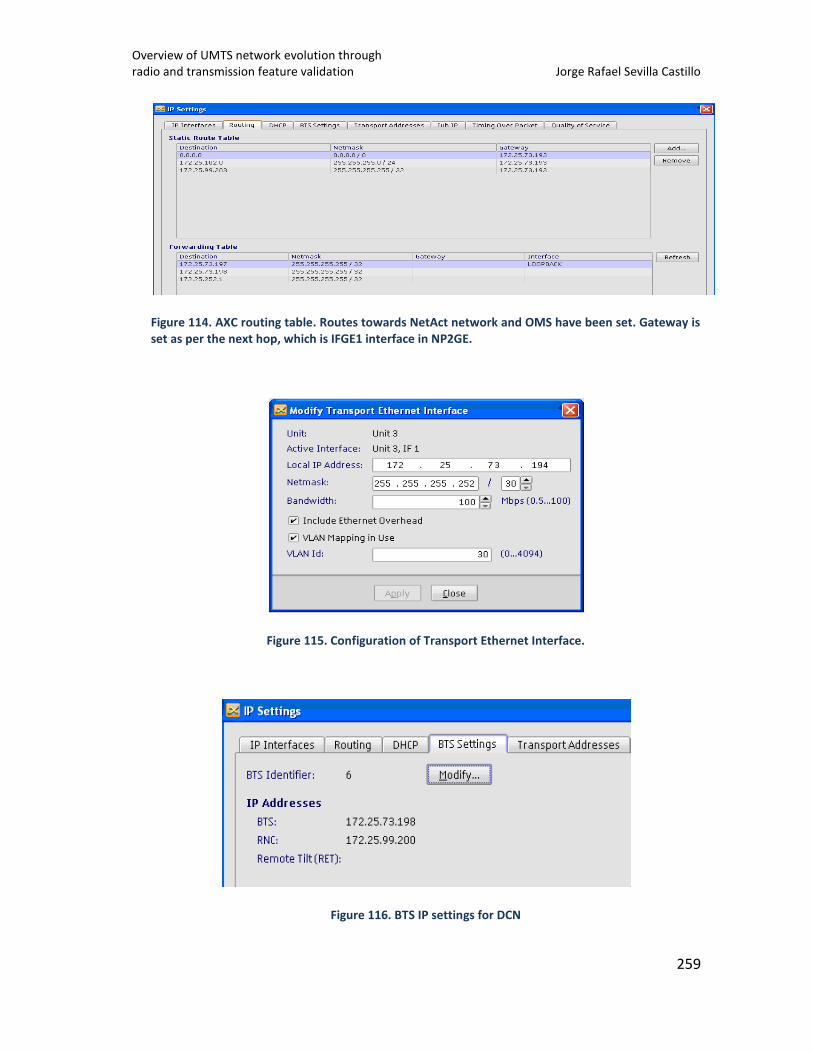
Overview of UMTS network evolution through radio and transmission feature validation Jorge Rafael Sevilla Castillo
259
Figure 114. AXC routing table. Routes towards NetAct network and OMS have been set. Gateway is set as per the next hop, which is IFGE1 interface in NP2GE.
Figure 115. Configuration of Transport Ethernet Interface.
Figure 116. BTS IP settings for DCN
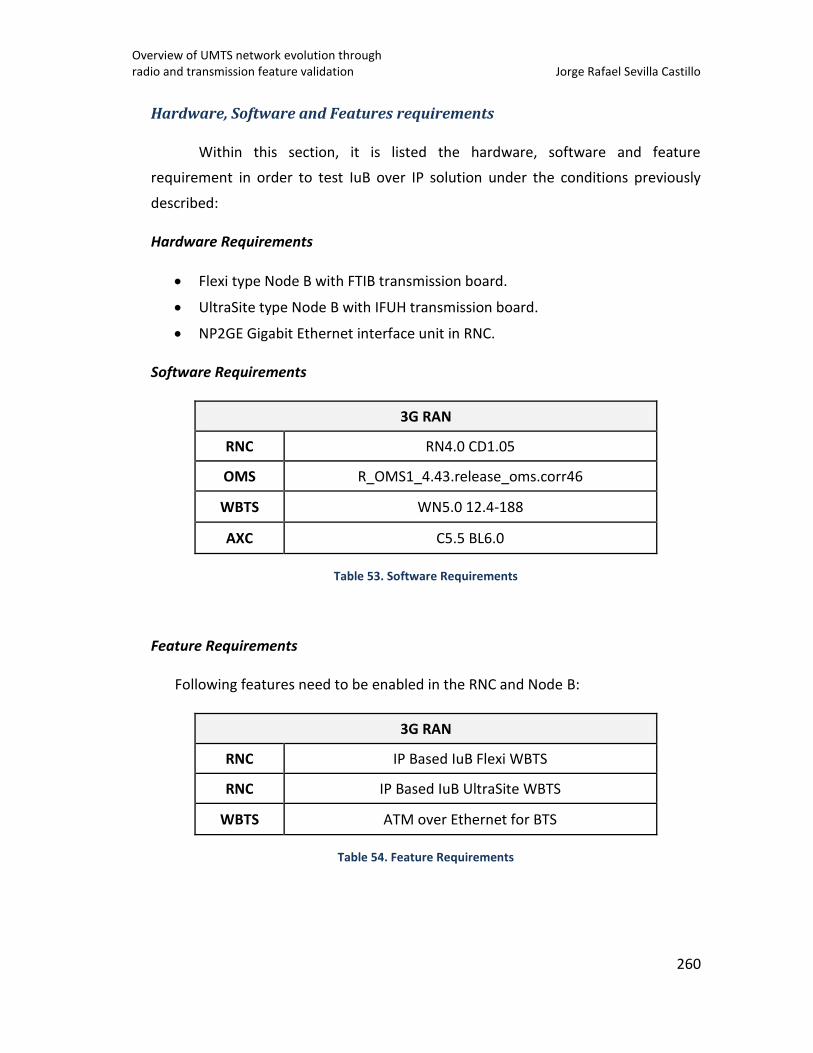
Overview of UMTS network evolution through radio and transmission feature validation Jorge Rafael Sevilla Castillo
260
Hardware, Software and Features requirements
Within this section, it is listed the hardware, software and feature
requirement in order to test IuB over IP solution under the conditions previously
described:
Hardware Requirements
Flexi type Node B with FTIB transmission board.
UltraSite type Node B with IFUH transmission board.
NP2GE Gigabit Ethernet interface unit in RNC.
Software Requirements
3G RAN
RNC RN4.0 CD1.05
OMS R_OMS1_4.43.release_oms.corr46
WBTS WN5.0 12.4-188
AXC C5.5 BL6.0
Table 53. Software Requirements
Feature Requirements
Following features need to be enabled in the RNC and Node B:
3G RAN
RNC IP Based IuB Flexi WBTS
RNC IP Based IuB UltraSite WBTS
WBTS ATM over Ethernet for BTS
Table 54. Feature Requirements
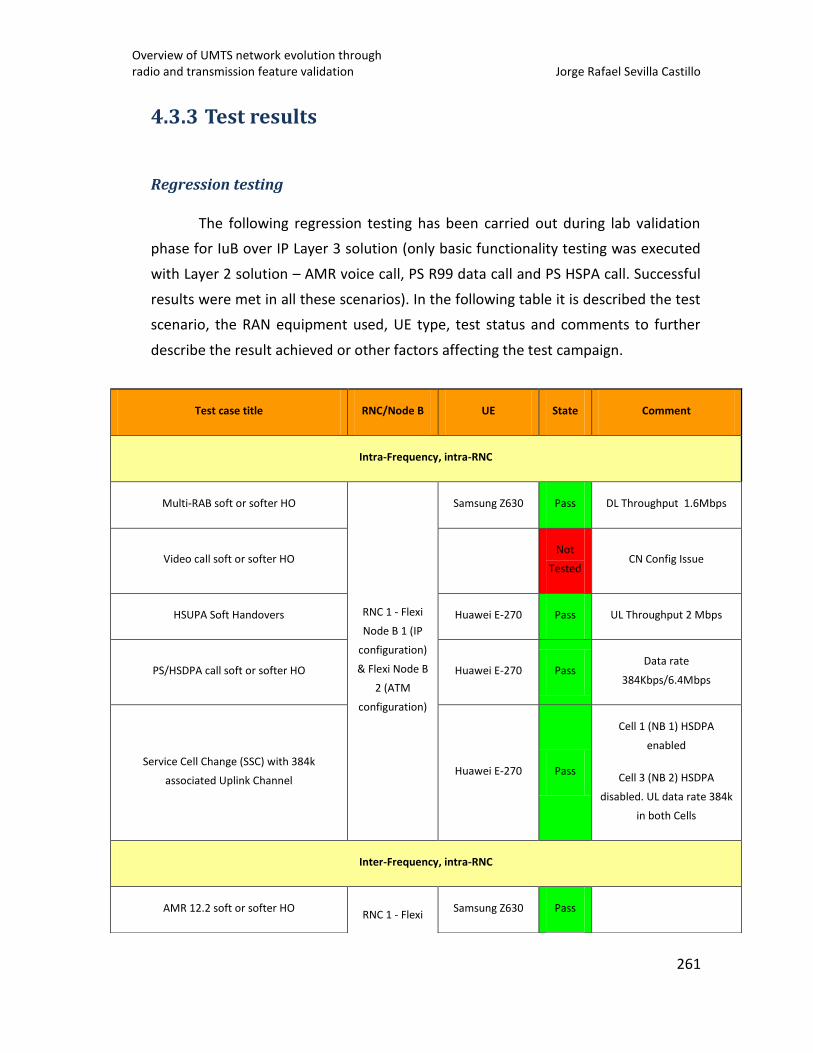
Overview of UMTS network evolution through radio and transmission feature validation Jorge Rafael Sevilla Castillo
261
4.3.3 Test results
Regression testing
The following regression testing has been carried out during lab validation
phase for IuB over IP Layer 3 solution (only basic functionality testing was executed
with Layer 2 solution – AMR voice call, PS R99 data call and PS HSPA call. Successful
results were met in all these scenarios). In the following table it is described the test
scenario, the RAN equipment used, UE type, test status and comments to further
describe the result achieved or other factors affecting the test campaign.
Test case title RNC/Node B UE State Comment
Intra-Frequency, intra-RNC
Multi-RAB soft or softer HO
RNC 1 - Flexi
Node B 1 (IP
configuration)
& Flexi Node B
2 (ATM
configuration)
Samsung Z630 Pass DL Throughput 1.6Mbps
Video call soft or softer HO Not
Tested CN Config Issue
HSUPA Soft Handovers Huawei E-270 Pass UL Throughput 2 Mbps
PS/HSDPA call soft or softer HO Huawei E-270 Pass Data rate
384Kbps/6.4Mbps
Service Cell Change (SSC) with 384k
associated Uplink Channel Huawei E-270 Pass
Cell 1 (NB 1) HSDPA
enabled
Cell 3 (NB 2) HSDPA
disabled. UL data rate 384k
in both Cells
Inter-Frequency, intra-RNC
AMR 12.2 soft or softer HO RNC 1 - Flexi
Samsung Z630 Pass
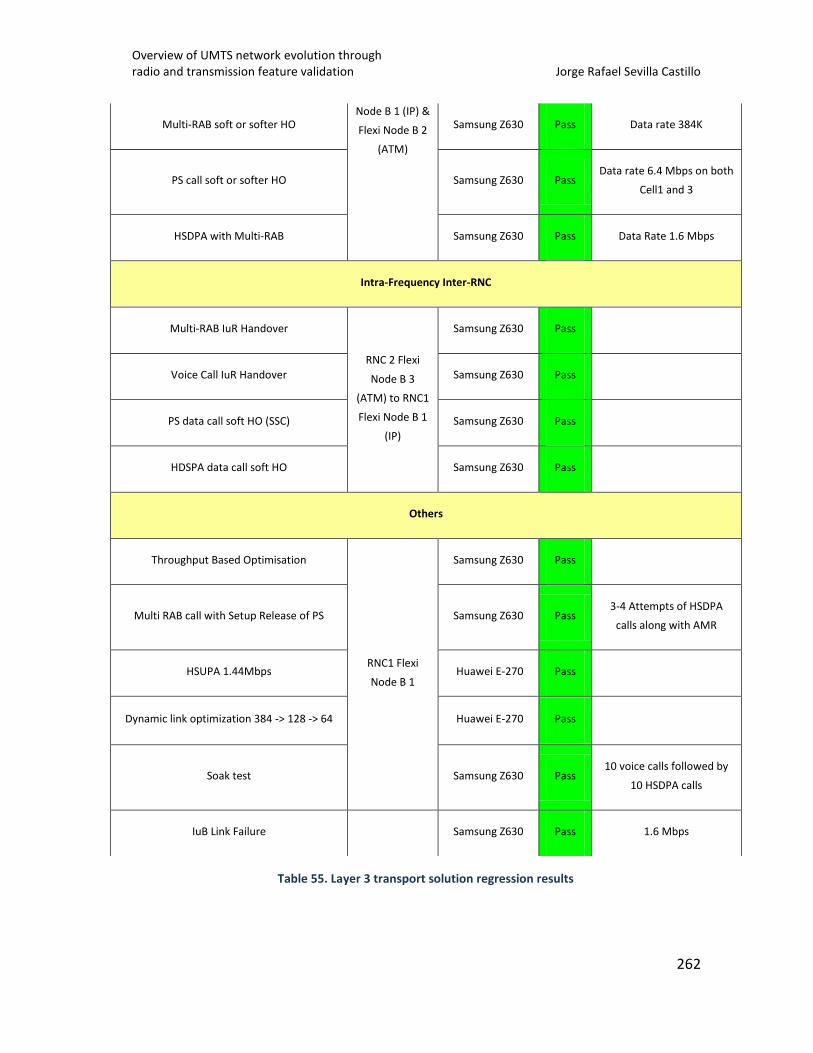
Overview of UMTS network evolution through radio and transmission feature validation Jorge Rafael Sevilla Castillo
262
Table 55. Layer 3 transport solution regression results
Multi-RAB soft or softer HO Node B 1 (IP) &
Flexi Node B 2
(ATM)
Samsung Z630 Pass Data rate 384K
PS call soft or softer HO Samsung Z630 Pass Data rate 6.4 Mbps on both
Cell1 and 3
HSDPA with Multi-RAB Samsung Z630 Pass Data Rate 1.6 Mbps
Intra-Frequency Inter-RNC
Multi-RAB IuR Handover
RNC 2 Flexi
Node B 3
(ATM) to RNC1
Flexi Node B 1
(IP)
Samsung Z630 Pass
Voice Call IuR Handover Samsung Z630 Pass
PS data call soft HO (SSC) Samsung Z630 Pass
HDSPA data call soft HO Samsung Z630 Pass
Others
Throughput Based Optimisation
RNC1 Flexi
Node B 1
Samsung Z630 Pass
Multi RAB call with Setup Release of PS Samsung Z630 Pass 3-4 Attempts of HSDPA
calls along with AMR
HSUPA 1.44Mbps Huawei E-270 Pass
Dynamic link optimization 384 -> 128 -> 64 Huawei E-270 Pass
Soak test Samsung Z630 Pass 10 voice calls followed by
10 HSDPA calls
IuB Link Failure Samsung Z630 Pass 1.6 Mbps
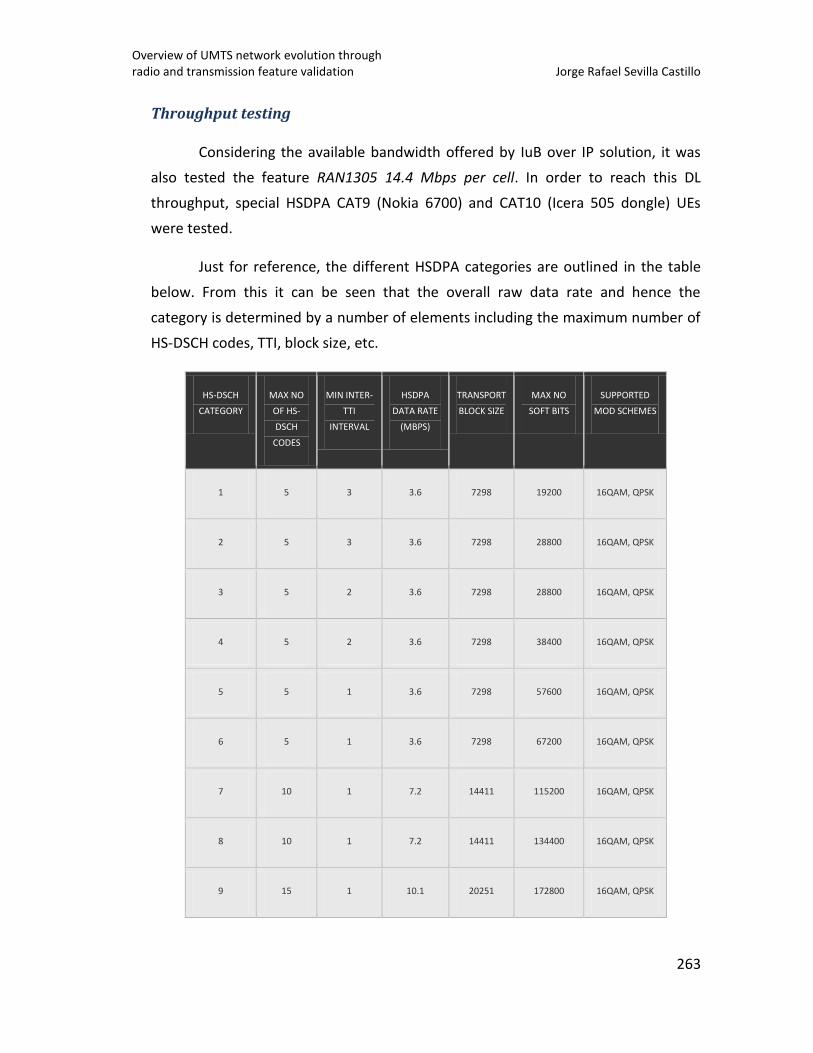
Overview of UMTS network evolution through radio and transmission feature validation Jorge Rafael Sevilla Castillo
263
Throughput testing
Considering the available bandwidth offered by IuB over IP solution, it was
also tested the feature RAN1305 14.4 Mbps per cell. In order to reach this DL
throughput, special HSDPA CAT9 (Nokia 6700) and CAT10 (Icera 505 dongle) UEs
were tested.
Just for reference, the different HSDPA categories are outlined in the table
below. From this it can be seen that the overall raw data rate and hence the
category is determined by a number of elements including the maximum number of
HS-DSCH codes, TTI, block size, etc.
HS-DSCH
CATEGORY
MAX NO
OF HS-
DSCH
CODES
MIN INTER-
TTI
INTERVAL
HSDPA
DATA RATE
(MBPS)
TRANSPORT
BLOCK SIZE
MAX NO
SOFT BITS
SUPPORTED
MOD SCHEMES
1 5 3 3.6 7298 19200 16QAM, QPSK
2 5 3 3.6 7298 28800 16QAM, QPSK
3 5 2 3.6 7298 28800 16QAM, QPSK
4 5 2 3.6 7298 38400 16QAM, QPSK
5 5 1 3.6 7298 57600 16QAM, QPSK
6 5 1 3.6 7298 67200 16QAM, QPSK
7 10 1 7.2 14411 115200 16QAM, QPSK
8 10 1 7.2 14411 134400 16QAM, QPSK
9 15 1 10.1 20251 172800 16QAM, QPSK
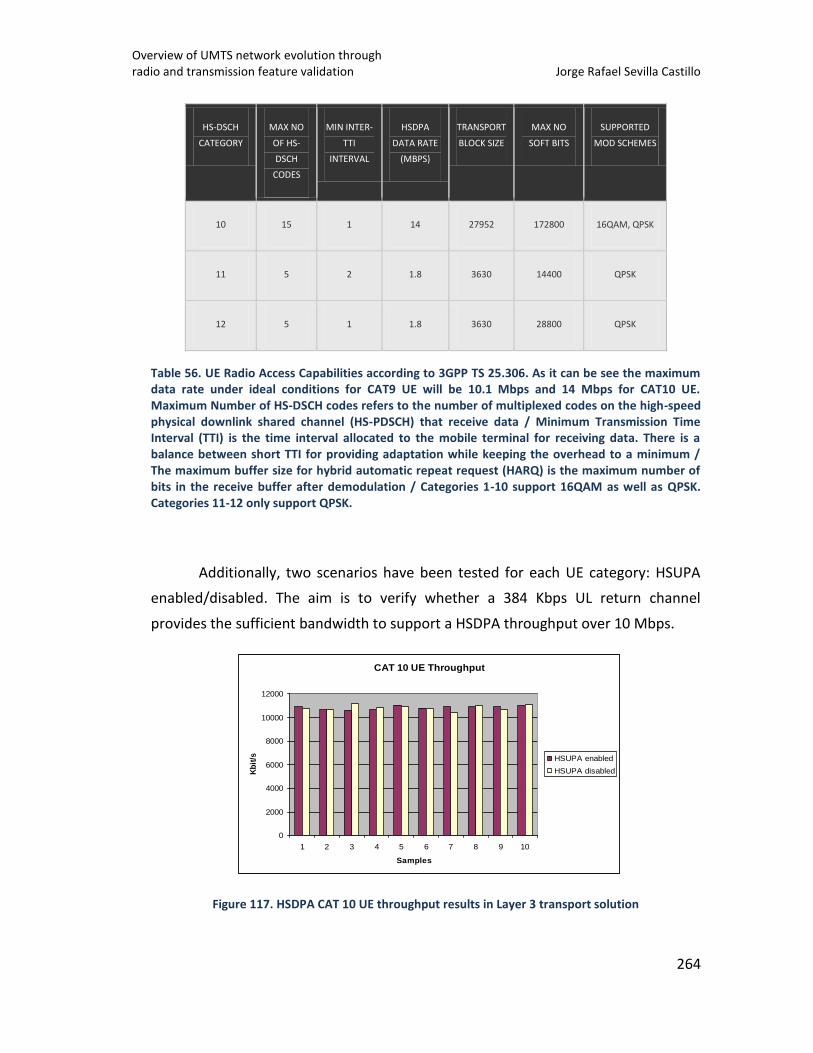
Overview of UMTS network evolution through radio and transmission feature validation Jorge Rafael Sevilla Castillo
264
HS-DSCH
CATEGORY
MAX NO
OF HS-
DSCH
CODES
MIN INTER-
TTI
INTERVAL
HSDPA
DATA RATE
(MBPS)
TRANSPORT
BLOCK SIZE
MAX NO
SOFT BITS
SUPPORTED
MOD SCHEMES
10 15 1 14 27952 172800 16QAM, QPSK
11 5 2 1.8 3630 14400 QPSK
12 5 1 1.8 3630 28800 QPSK
Table 56. UE Radio Access Capabilities according to 3GPP TS 25.306. As it can be see the maximum data rate under ideal conditions for CAT9 UE will be 10.1 Mbps and 14 Mbps for CAT10 UE. Maximum Number of HS-DSCH codes refers to the number of multiplexed codes on the high-speed physical downlink shared channel (HS-PDSCH) that receive data / Minimum Transmission Time Interval (TTI) is the time interval allocated to the mobile terminal for receiving data. There is a balance between short TTI for providing adaptation while keeping the overhead to a minimum / The maximum buffer size for hybrid automatic repeat request (HARQ) is the maximum number of bits in the receive buffer after demodulation / Categories 1-10 support 16QAM as well as QPSK. Categories 11-12 only support QPSK.
Additionally, two scenarios have been tested for each UE category: HSUPA
enabled/disabled. The aim is to verify whether a 384 Kbps UL return channel
provides the sufficient bandwidth to support a HSDPA throughput over 10 Mbps.
Figure 117. HSDPA CAT 10 UE throughput results in Layer 3 transport solution
CAT 10 UE Throughput
0
2000
4000
6000
8000
10000
12000
1 2 3 4 5 6 7 8 9 10
Samples
Kb
it/s HSUPA enabled
HSUPA disabled
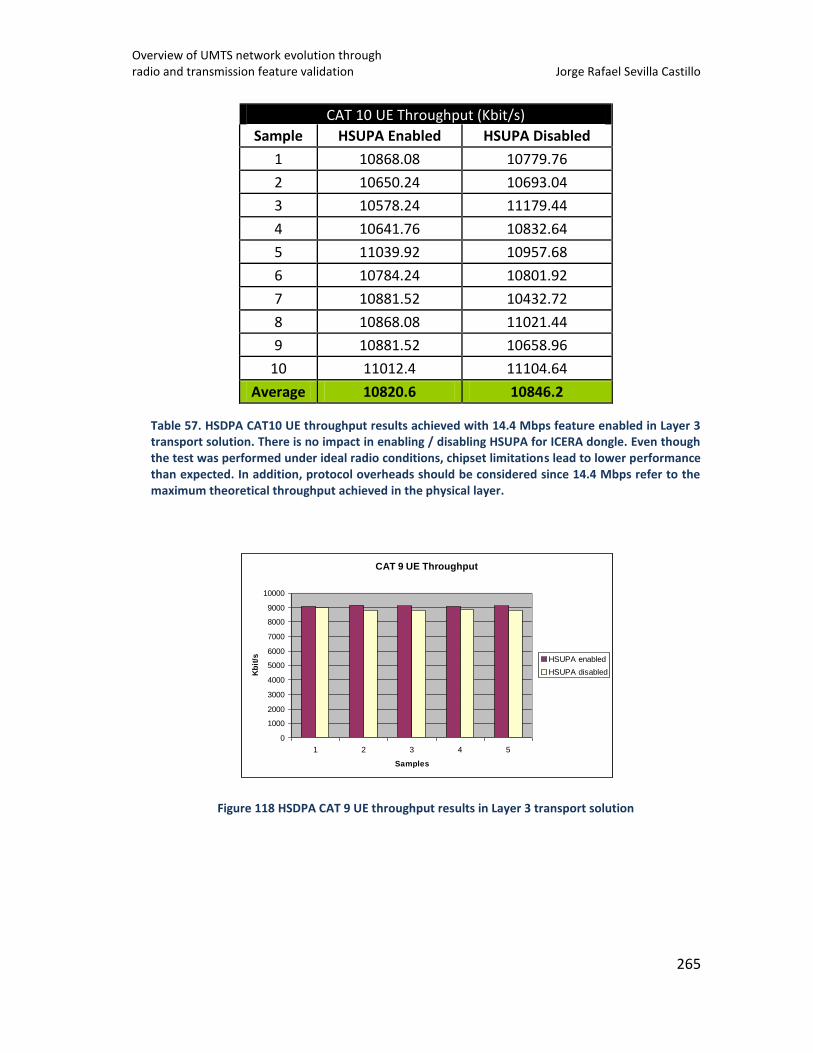
Overview of UMTS network evolution through radio and transmission feature validation Jorge Rafael Sevilla Castillo
265
CAT 10 UE Throughput (Kbit/s)
Sample HSUPA Enabled HSUPA Disabled
1 10868.08 10779.76
2 10650.24 10693.04
3 10578.24 11179.44
4 10641.76 10832.64
5 11039.92 10957.68
6 10784.24 10801.92
7 10881.52 10432.72
8 10868.08 11021.44
9 10881.52 10658.96
10 11012.4 11104.64
Average 10820.6 10846.2
Table 57. HSDPA CAT10 UE throughput results achieved with 14.4 Mbps feature enabled in Layer 3 transport solution. There is no impact in enabling / disabling HSUPA for ICERA dongle. Even though the test was performed under ideal radio conditions, chipset limitations lead to lower performance than expected. In addition, protocol overheads should be considered since 14.4 Mbps refer to the maximum theoretical throughput achieved in the physical layer.
Figure 118 HSDPA CAT 9 UE throughput results in Layer 3 transport solution
CAT 9 UE Throughput
0
1000
2000
3000
4000
5000
6000
7000
8000
9000
10000
1 2 3 4 5
Samples
Kb
it/s HSUPA enabled
HSUPA disabled
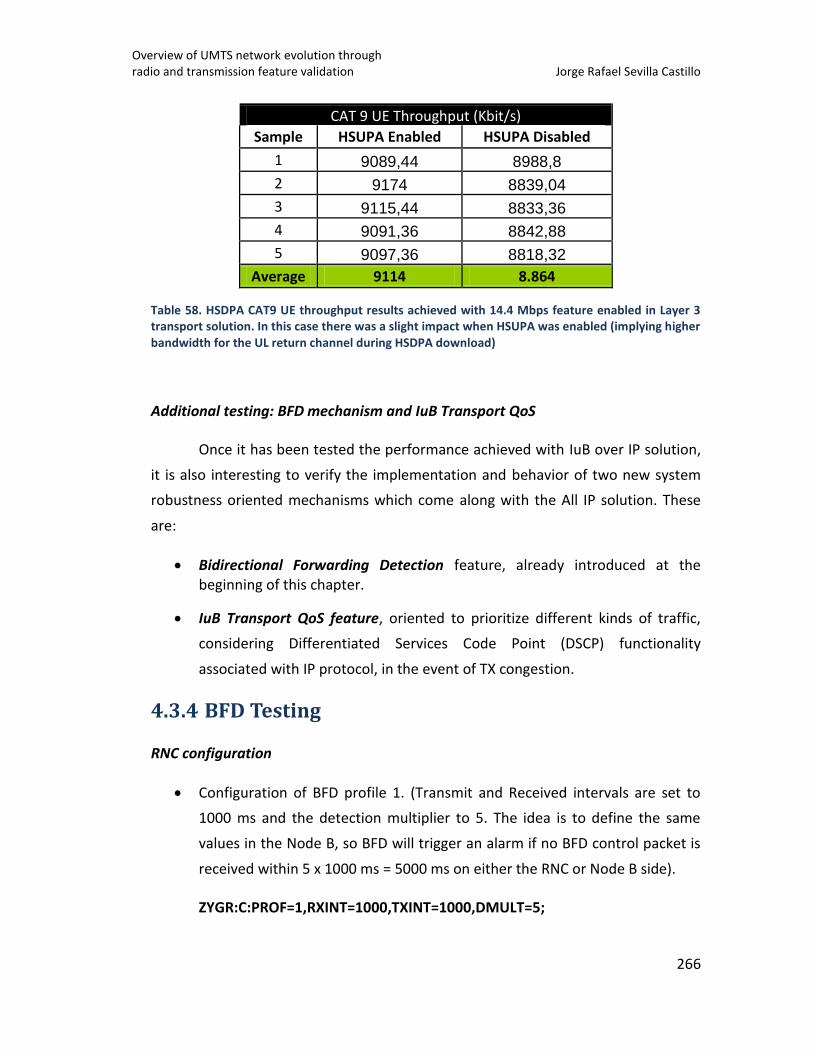
Overview of UMTS network evolution through radio and transmission feature validation Jorge Rafael Sevilla Castillo
266
CAT 9 UE Throughput (Kbit/s)
Sample HSUPA Enabled HSUPA Disabled
1 9089,44 8988,8
2 9174 8839,04
3 9115,44 8833,36
4 9091,36 8842,88
5 9097,36 8818,32
Average 9114 8.864
Table 58. HSDPA CAT9 UE throughput results achieved with 14.4 Mbps feature enabled in Layer 3 transport solution. In this case there was a slight impact when HSUPA was enabled (implying higher bandwidth for the UL return channel during HSDPA download)
Additional testing: BFD mechanism and IuB Transport QoS
Once it has been tested the performance achieved with IuB over IP solution,
it is also interesting to verify the implementation and behavior of two new system
robustness oriented mechanisms which come along with the All IP solution. These
are:
Bidirectional Forwarding Detection feature, already introduced at the beginning of this chapter.
IuB Transport QoS feature, oriented to prioritize different kinds of traffic,
considering Differentiated Services Code Point (DSCP) functionality
associated with IP protocol, in the event of TX congestion.
4.3.4 BFD Testing
RNC configuration
Configuration of BFD profile 1. (Transmit and Received intervals are set to
1000 ms and the detection multiplier to 5. The idea is to define the same
values in the Node B, so BFD will trigger an alarm if no BFD control packet is
received within 5 x 1000 ms = 5000 ms on either the RNC or Node B side).
ZYGR:C:PROF=1,RXINT=1000,TXINT=1000,DMULT=5;
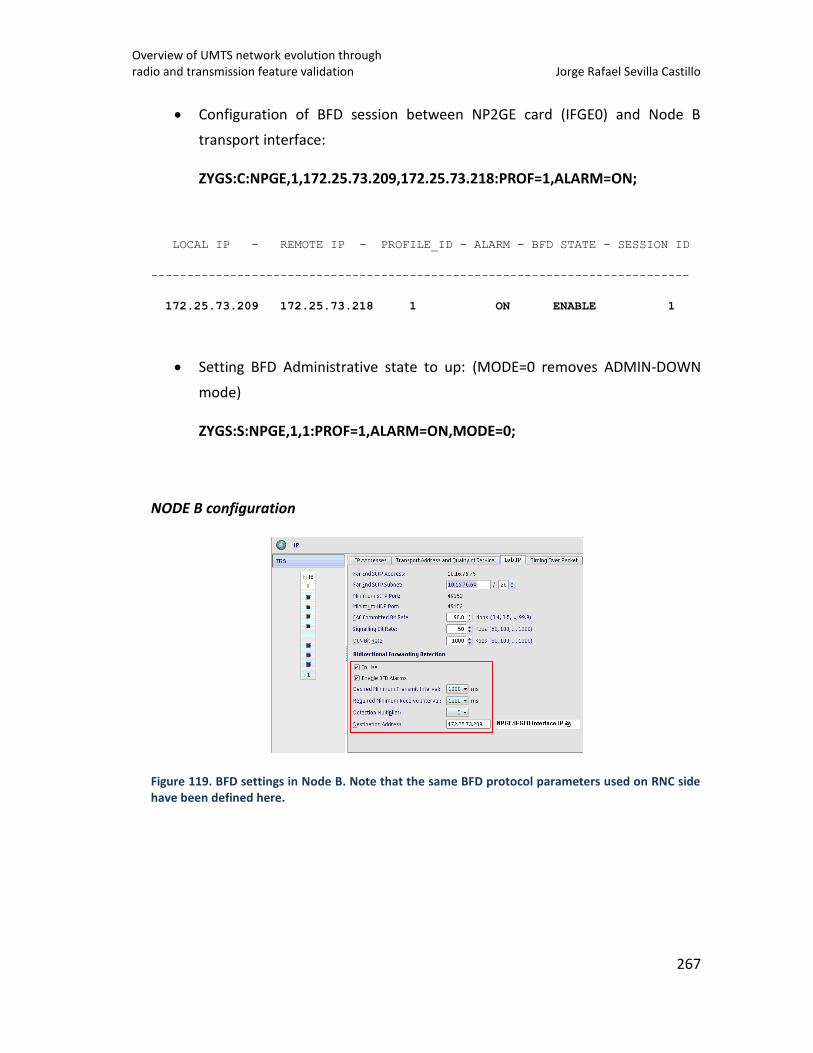
Overview of UMTS network evolution through radio and transmission feature validation Jorge Rafael Sevilla Castillo
267
Configuration of BFD session between NP2GE card (IFGE0) and Node B
transport interface:
ZYGS:C:NPGE,1,172.25.73.209,172.25.73.218:PROF=1,ALARM=ON;
LOCAL IP - REMOTE IP - PROFILE_ID - ALARM - BFD STATE - SESSION ID
---------------------------------------------------------------------------
172.25.73.209 172.25.73.218 1 ON ENABLE 1
Setting BFD Administrative state to up: (MODE=0 removes ADMIN-DOWN
mode)
ZYGS:S:NPGE,1,1:PROF=1,ALARM=ON,MODE=0;
NODE B configuration
Figure 119. BFD settings in Node B. Note that the same BFD protocol parameters used on RNC side have been defined here.
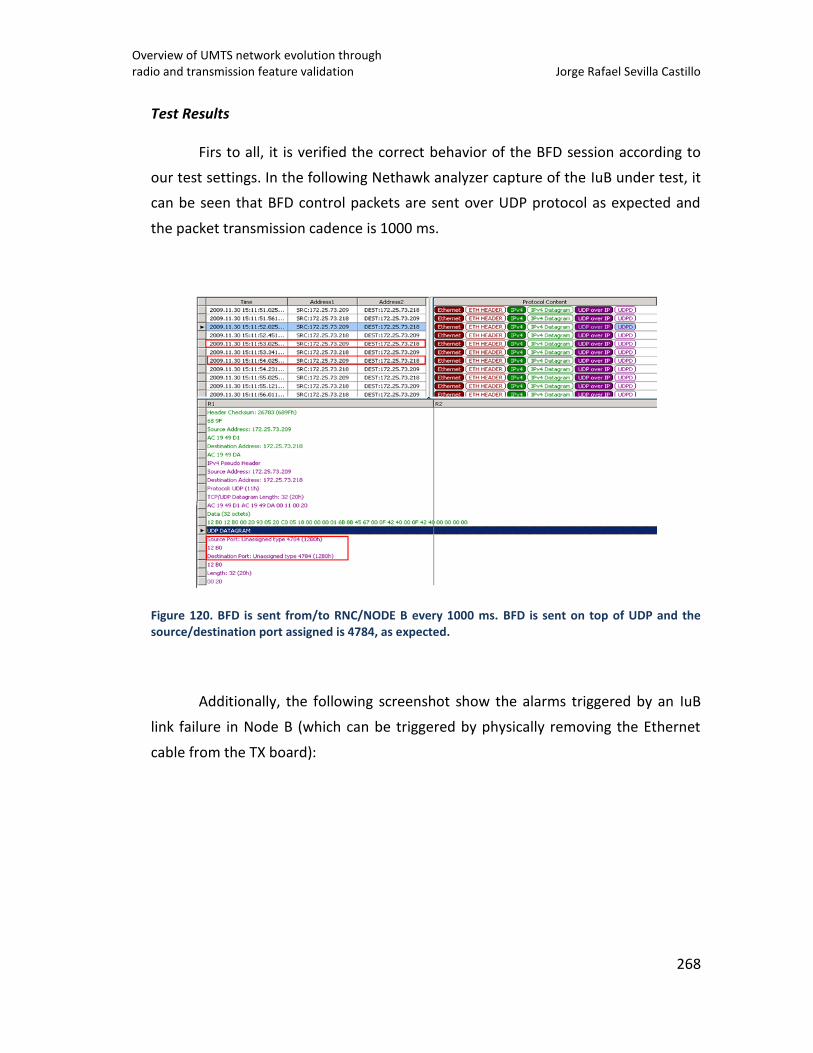
Overview of UMTS network evolution through radio and transmission feature validation Jorge Rafael Sevilla Castillo
268
Test Results
Firs to all, it is verified the correct behavior of the BFD session according to
our test settings. In the following Nethawk analyzer capture of the IuB under test, it
can be seen that BFD control packets are sent over UDP protocol as expected and
the packet transmission cadence is 1000 ms.
Figure 120. BFD is sent from/to RNC/NODE B every 1000 ms. BFD is sent on top of UDP and the source/destination port assigned is 4784, as expected.
Additionally, the following screenshot show the alarms triggered by an IuB
link failure in Node B (which can be triggered by physically removing the Ethernet
cable from the TX board):
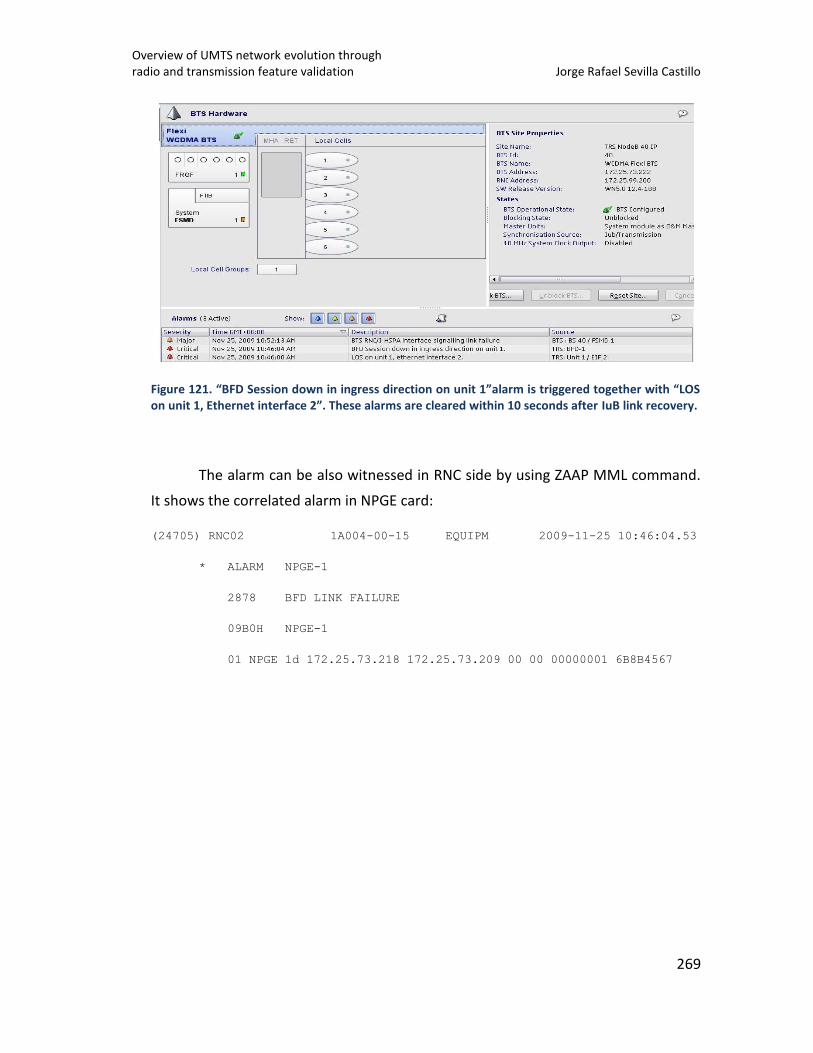
Overview of UMTS network evolution through radio and transmission feature validation Jorge Rafael Sevilla Castillo
269
Figure 121. “BFD Session down in ingress direction on unit 1”alarm is triggered together with “LOS on unit 1, Ethernet interface 2”. These alarms are cleared within 10 seconds after IuB link recovery.
The alarm can be also witnessed in RNC side by using ZAAP MML command.
It shows the correlated alarm in NPGE card:
(24705) RNC02 1A004-00-15 EQUIPM 2009-11-25 10:46:04.53
* ALARM NPGE-1
2878 BFD LINK FAILURE
09B0H NPGE-1
01 NPGE 1d 172.25.73.218 172.25.73.209 00 00 00000001 6B8B4567
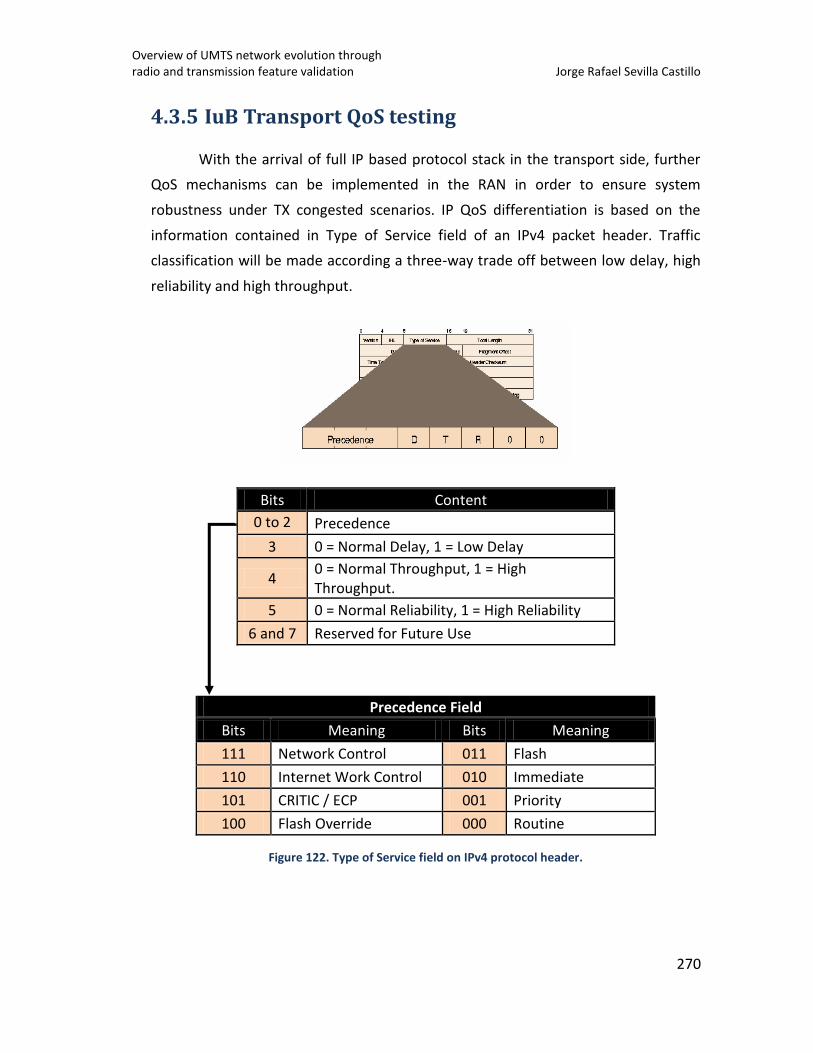
Overview of UMTS network evolution through radio and transmission feature validation Jorge Rafael Sevilla Castillo
270
4.3.5 IuB Transport QoS testing
With the arrival of full IP based protocol stack in the transport side, further
QoS mechanisms can be implemented in the RAN in order to ensure system
robustness under TX congested scenarios. IP QoS differentiation is based on the
information contained in Type of Service field of an IPv4 packet header. Traffic
classification will be made according a three-way trade off between low delay, high
reliability and high throughput.
Bits Content
0 to 2 Precedence
3 0 = Normal Delay, 1 = Low Delay
4 0 = Normal Throughput, 1 = High Throughput.
5 0 = Normal Reliability, 1 = High Reliability
6 and 7 Reserved for Future Use
Precedence Field
Bits Meaning Bits Meaning
111 Network Control 011 Flash
110 Internet Work Control 010 Immediate
101 CRITIC / ECP 001 Priority
100 Flash Override 000 Routine
Figure 122. Type of Service field on IPv4 protocol header.
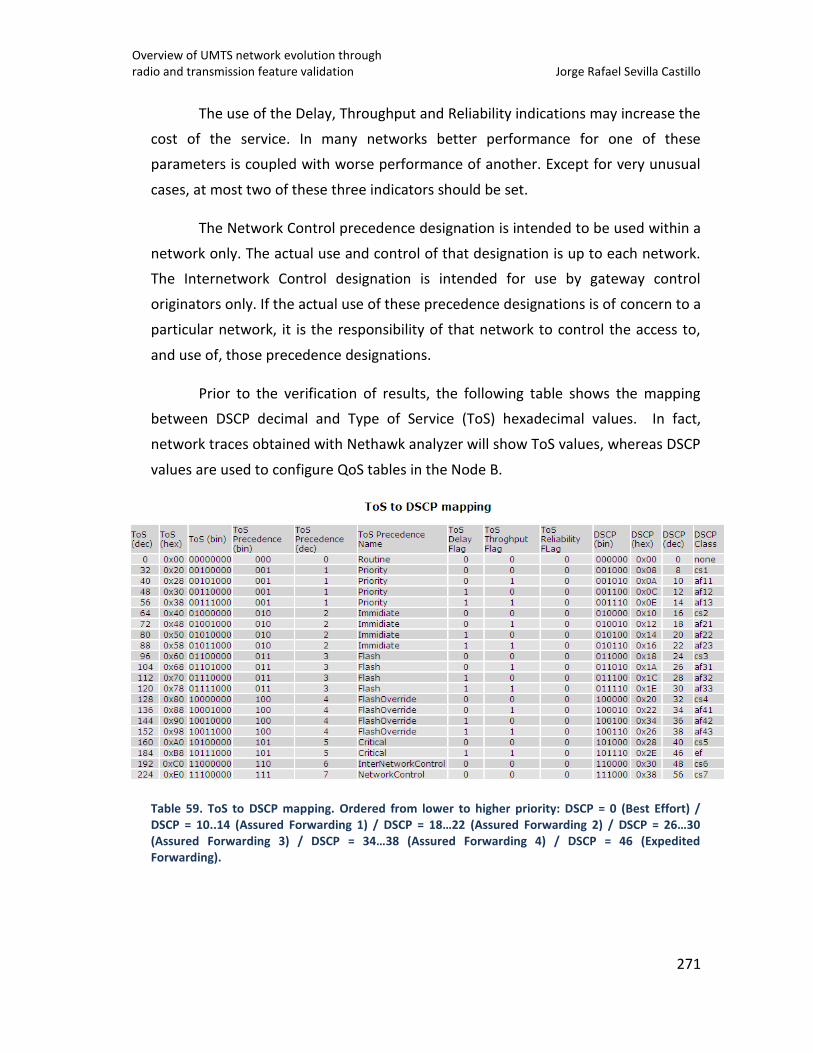
Overview of UMTS network evolution through radio and transmission feature validation Jorge Rafael Sevilla Castillo
271
The use of the Delay, Throughput and Reliability indications may increase the
cost of the service. In many networks better performance for one of these
parameters is coupled with worse performance of another. Except for very unusual
cases, at most two of these three indicators should be set.
The Network Control precedence designation is intended to be used within a
network only. The actual use and control of that designation is up to each network.
The Internetwork Control designation is intended for use by gateway control
originators only. If the actual use of these precedence designations is of concern to a
particular network, it is the responsibility of that network to control the access to,
and use of, those precedence designations.
Prior to the verification of results, the following table shows the mapping
between DSCP decimal and Type of Service (ToS) hexadecimal values. In fact,
network traces obtained with Nethawk analyzer will show ToS values, whereas DSCP
values are used to configure QoS tables in the Node B.
Table 59. ToS to DSCP mapping. Ordered from lower to higher priority: DSCP = 0 (Best Effort) / DSCP = 10..14 (Assured Forwarding 1) / DSCP = 18…22 (Assured Forwarding 2) / DSCP = 26…30 (Assured Forwarding 3) / DSCP = 34…38 (Assured Forwarding 4) / DSCP = 46 (Expedited Forwarding).
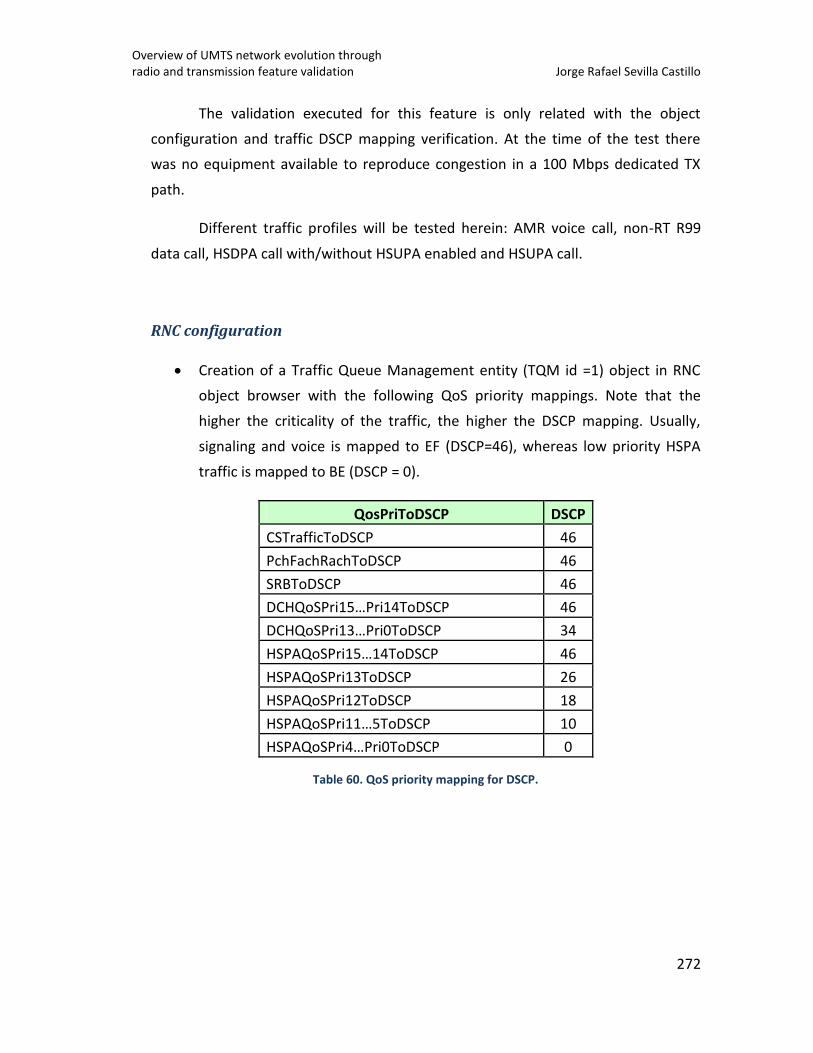
Overview of UMTS network evolution through radio and transmission feature validation Jorge Rafael Sevilla Castillo
272
The validation executed for this feature is only related with the object
configuration and traffic DSCP mapping verification. At the time of the test there
was no equipment available to reproduce congestion in a 100 Mbps dedicated TX
path.
Different traffic profiles will be tested herein: AMR voice call, non-RT R99
data call, HSDPA call with/without HSUPA enabled and HSUPA call.
RNC configuration
Creation of a Traffic Queue Management entity (TQM id =1) object in RNC
object browser with the following QoS priority mappings. Note that the
higher the criticality of the traffic, the higher the DSCP mapping. Usually,
signaling and voice is mapped to EF (DSCP=46), whereas low priority HSPA
traffic is mapped to BE (DSCP = 0).
QosPriToDSCP DSCP
CSTrafficToDSCP 46
PchFachRachToDSCP 46
SRBToDSCP 46
DCHQoSPri15…Pri14ToDSCP 46
DCHQoSPri13…Pri0ToDSCP 34
HSPAQoSPri15…14ToDSCP 46
HSPAQoSPri13ToDSCP 26
HSPAQoSPri12ToDSCP 18
HSPAQoSPri11…5ToDSCP 10
HSPAQoSPri4…Pri0ToDSCP 0
Table 60. QoS priority mapping for DSCP.
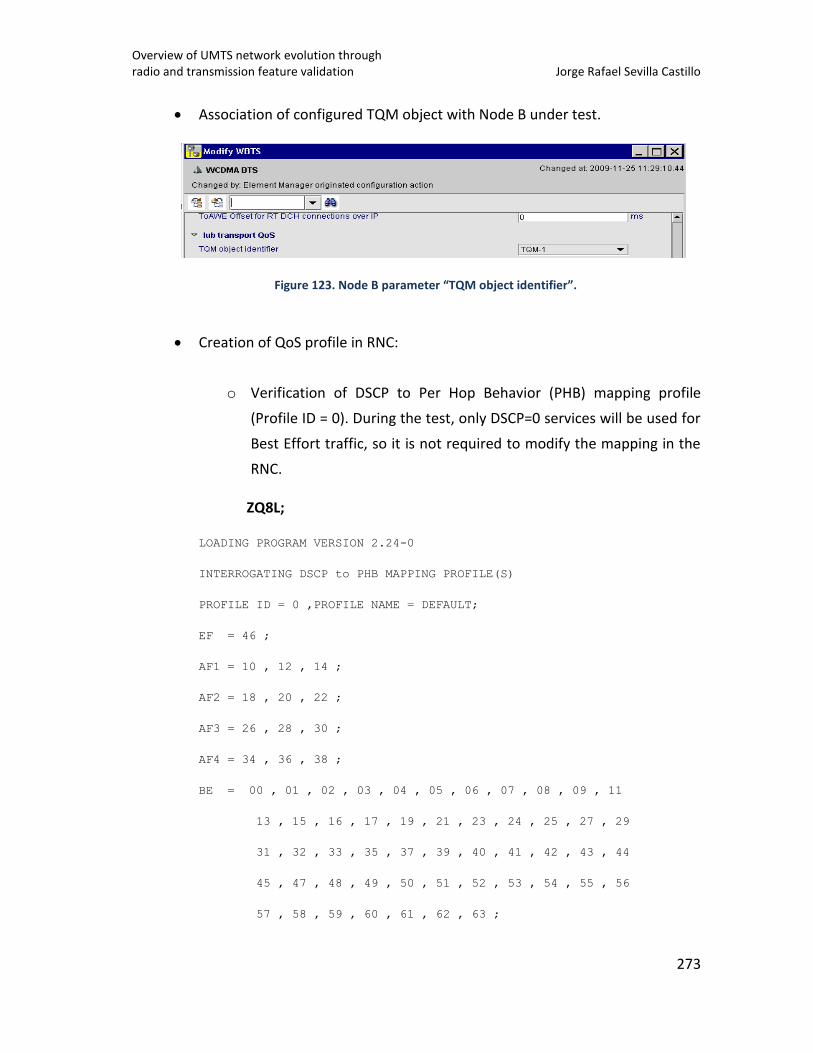
Overview of UMTS network evolution through radio and transmission feature validation Jorge Rafael Sevilla Castillo
273
Association of configured TQM object with Node B under test.
Figure 123. Node B parameter “TQM object identifier”.
Creation of QoS profile in RNC:
o Verification of DSCP to Per Hop Behavior (PHB) mapping profile
(Profile ID = 0). During the test, only DSCP=0 services will be used for
Best Effort traffic, so it is not required to modify the mapping in the
RNC.
ZQ8L;
LOADING PROGRAM VERSION 2.24-0
INTERROGATING DSCP to PHB MAPPING PROFILE(S)
PROFILE ID = 0 ,PROFILE NAME = DEFAULT;
EF = 46 ;
AF1 = 10 , 12 , 14 ;
AF2 = 18 , 20 , 22 ;
AF3 = 26 , 28 , 30 ;
AF4 = 34 , 36 , 38 ;
BE = 00 , 01 , 02 , 03 , 04 , 05 , 06 , 07 , 08 , 09 , 11
13 , 15 , 16 , 17 , 19 , 21 , 23 , 24 , 25 , 27 , 29
31 , 32 , 33 , 35 , 37 , 39 , 40 , 41 , 42 , 43 , 44
45 , 47 , 48 , 49 , 50 , 51 , 52 , 53 , 54 , 55 , 56
57 , 58 , 59 , 60 , 61 , 62 , 63 ;
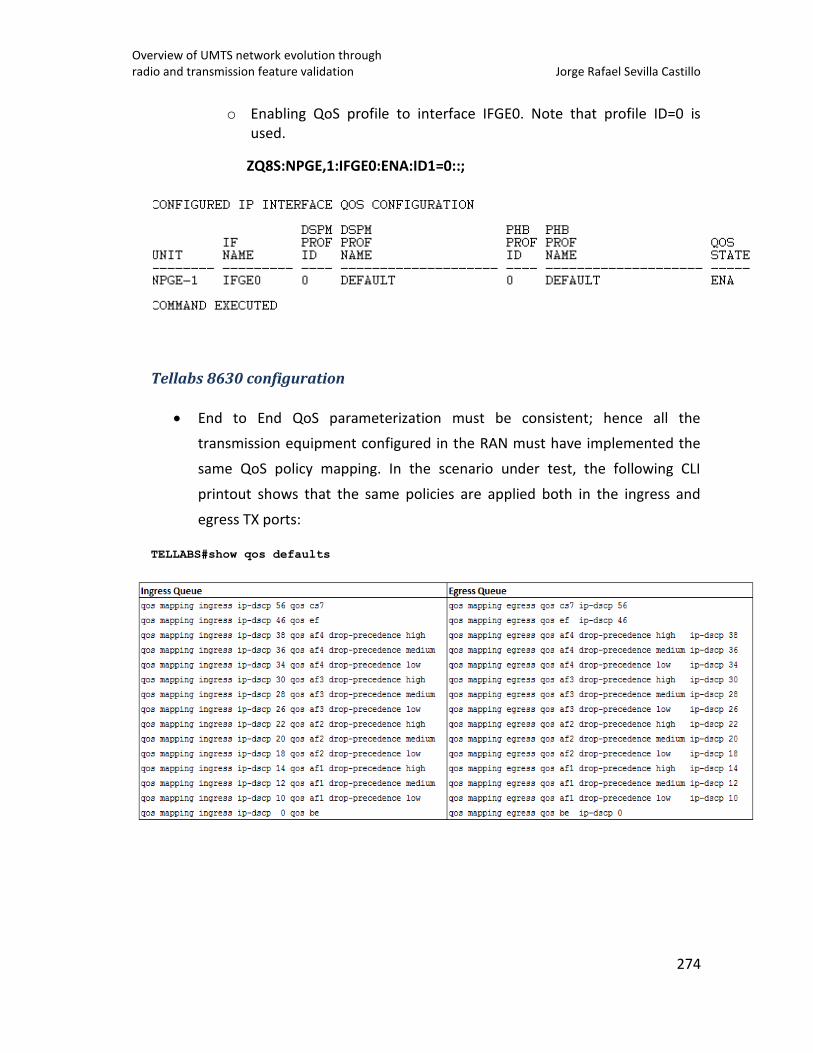
Overview of UMTS network evolution through radio and transmission feature validation Jorge Rafael Sevilla Castillo
274
o Enabling QoS profile to interface IFGE0. Note that profile ID=0 is used.
ZQ8S:NPGE,1:IFGE0:ENA:ID1=0::;
Tellabs 8630 configuration
End to End QoS parameterization must be consistent; hence all the
transmission equipment configured in the RAN must have implemented the
same QoS policy mapping. In the scenario under test, the following CLI
printout shows that the same policies are applied both in the ingress and
egress TX ports:
TELLABS#show qos defaults
Overview of UMTS network evolution through radio and transmission feature validation Jorge Rafael Sevilla Castillo
275
Test Results
As mentioned before, the objective of this test is to ensure that different
kind of traffic is correctly mapped to its corresponding QoS policy, according to the
configuration implemented in RAN equipments as per the previous section. The
following traffic types were generated ranging from more to less critical in terms of
delay and packet loss: Signaling traffic, AMR voice traffic, downlink Non-real time
R99 data traffic, downlink HSDPA data traffic with UL DCH return channel, downlink
HSDPA data traffic with HSUPA enabled and uplink HSUPA data traffic.
The following network analyzer captures from IuB interface help to verify the
correctness of QoS mapping. In order to do that, the IPv4 datagram header
containing the traffic under study is analyzed: ToS field is extracted and ToS to DSCP
mapping table is used to check the corresponding DSCP value.
Note that no captures are attached for the scenarios HSDPA data traffic with
HSUPA enabled and HSUPA data traffic because the same QoS mapping than
downlink HSDPA traffic applies.
Test case 1: Signaling traffic
For this scenario, ToS included in IPv4 datagram containing RRC Connection
Request signaling message is verified:
Type of Service (B8)
- Precedence: CRITIC/ECP
- Low Delay (1)
- High Throughput (1)
- Normal Reliability (0)
With this information, ToS to DSCP mapping table indicates that the
corresponding DSCP value is 46, matching with Expedited Forwarding (EF) Per Hop
Behavior (PHB, noted in the table as DSCP class). This is the highest priority QoS
policy configured for the test, matching with the importance of signaling traffic.
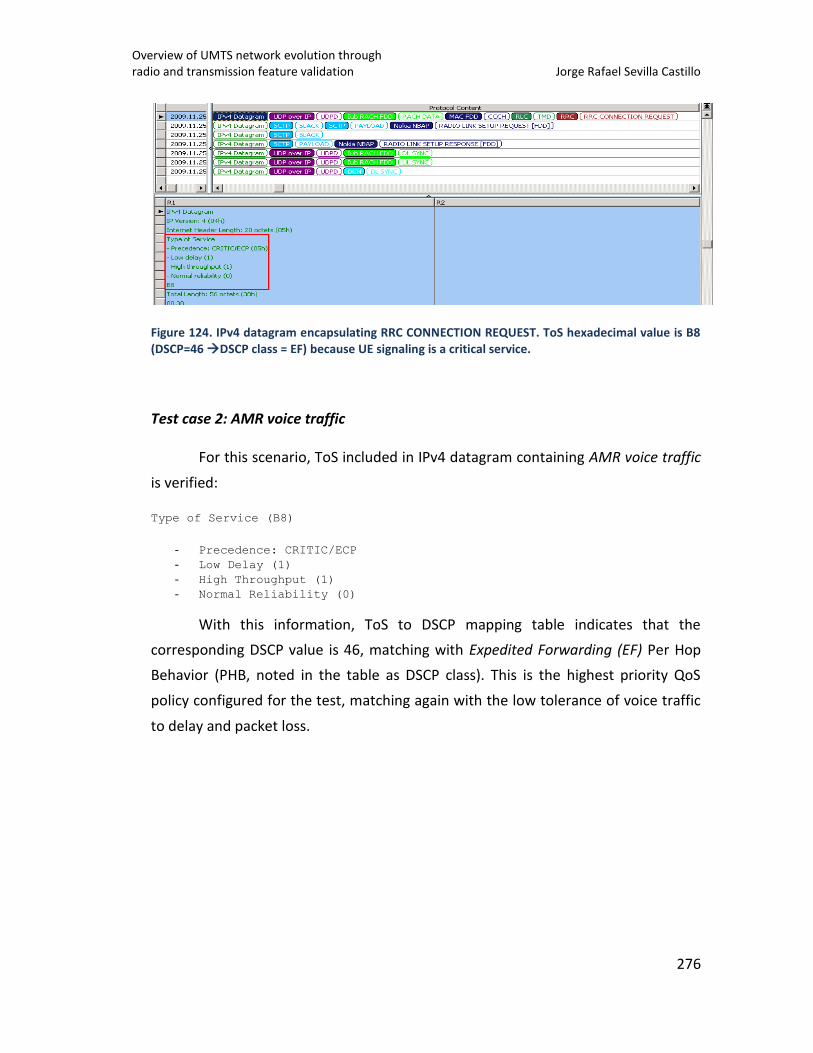
Overview of UMTS network evolution through radio and transmission feature validation Jorge Rafael Sevilla Castillo
276
Figure 124. IPv4 datagram encapsulating RRC CONNECTION REQUEST. ToS hexadecimal value is B8 (DSCP=46 DSCP class = EF) because UE signaling is a critical service.
Test case 2: AMR voice traffic
For this scenario, ToS included in IPv4 datagram containing AMR voice traffic
is verified:
Type of Service (B8)
- Precedence: CRITIC/ECP
- Low Delay (1)
- High Throughput (1)
- Normal Reliability (0)
With this information, ToS to DSCP mapping table indicates that the
corresponding DSCP value is 46, matching with Expedited Forwarding (EF) Per Hop
Behavior (PHB, noted in the table as DSCP class). This is the highest priority QoS
policy configured for the test, matching again with the low tolerance of voice traffic
to delay and packet loss.
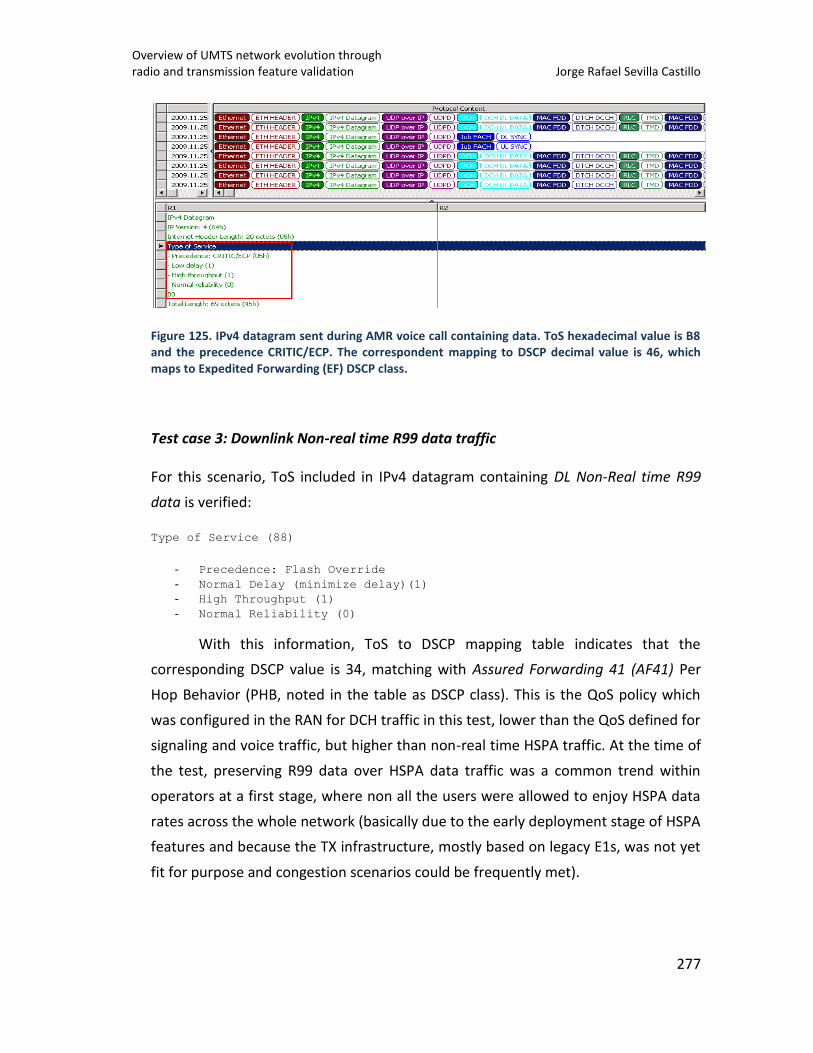
Overview of UMTS network evolution through radio and transmission feature validation Jorge Rafael Sevilla Castillo
277
Figure 125. IPv4 datagram sent during AMR voice call containing data. ToS hexadecimal value is B8 and the precedence CRITIC/ECP. The correspondent mapping to DSCP decimal value is 46, which maps to Expedited Forwarding (EF) DSCP class.
Test case 3: Downlink Non-real time R99 data traffic
For this scenario, ToS included in IPv4 datagram containing DL Non-Real time R99
data is verified:
Type of Service (88)
- Precedence: Flash Override
- Normal Delay (minimize delay)(1)
- High Throughput (1)
- Normal Reliability (0)
With this information, ToS to DSCP mapping table indicates that the
corresponding DSCP value is 34, matching with Assured Forwarding 41 (AF41) Per
Hop Behavior (PHB, noted in the table as DSCP class). This is the QoS policy which
was configured in the RAN for DCH traffic in this test, lower than the QoS defined for
signaling and voice traffic, but higher than non-real time HSPA traffic. At the time of
the test, preserving R99 data over HSPA data traffic was a common trend within
operators at a first stage, where non all the users were allowed to enjoy HSPA data
rates across the whole network (basically due to the early deployment stage of HSPA
features and because the TX infrastructure, mostly based on legacy E1s, was not yet
fit for purpose and congestion scenarios could be frequently met).
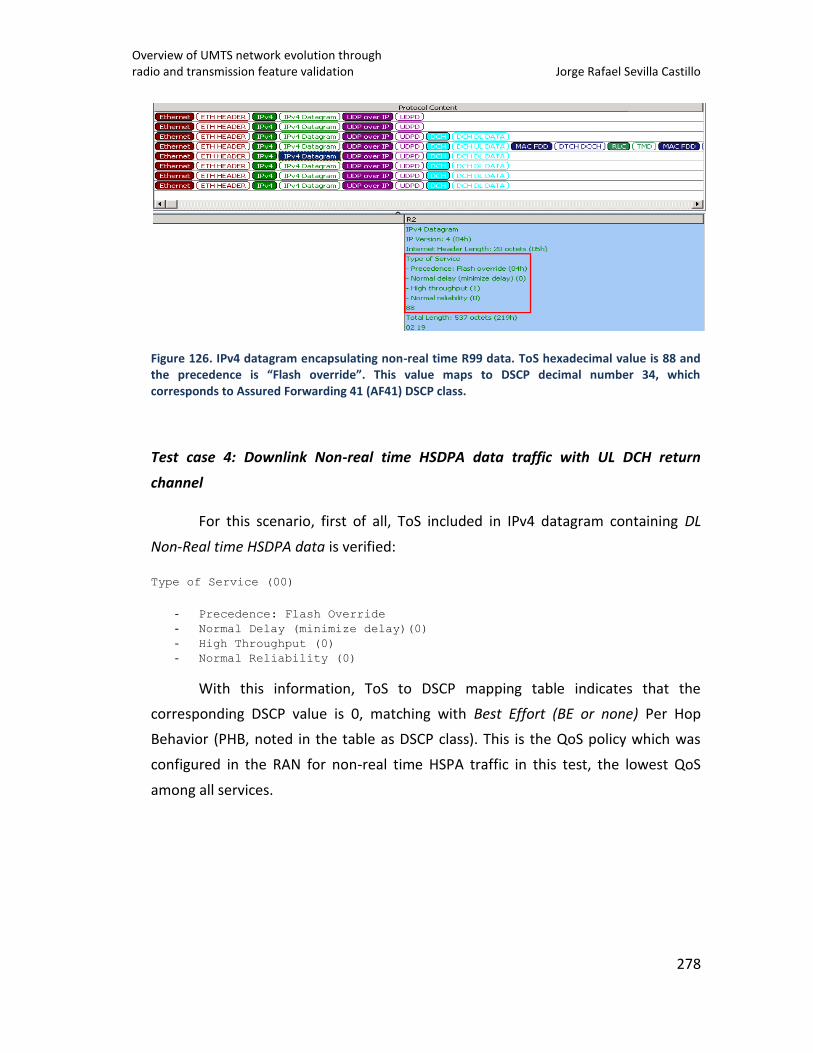
Overview of UMTS network evolution through radio and transmission feature validation Jorge Rafael Sevilla Castillo
278
Figure 126. IPv4 datagram encapsulating non-real time R99 data. ToS hexadecimal value is 88 and the precedence is “Flash override”. This value maps to DSCP decimal number 34, which corresponds to Assured Forwarding 41 (AF41) DSCP class.
Test case 4: Downlink Non-real time HSDPA data traffic with UL DCH return
channel
For this scenario, first of all, ToS included in IPv4 datagram containing DL
Non-Real time HSDPA data is verified:
Type of Service (00)
- Precedence: Flash Override
- Normal Delay (minimize delay)(0)
- High Throughput (0)
- Normal Reliability (0)
With this information, ToS to DSCP mapping table indicates that the
corresponding DSCP value is 0, matching with Best Effort (BE or none) Per Hop
Behavior (PHB, noted in the table as DSCP class). This is the QoS policy which was
configured in the RAN for non-real time HSPA traffic in this test, the lowest QoS
among all services.
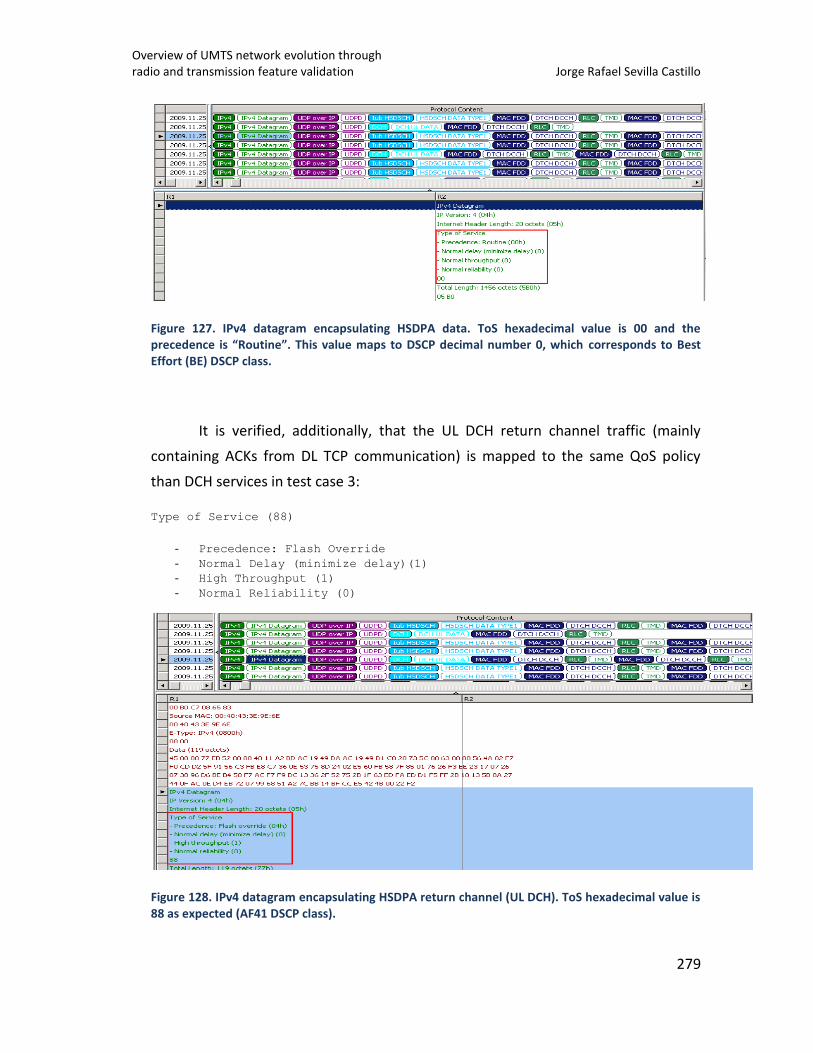
Overview of UMTS network evolution through radio and transmission feature validation Jorge Rafael Sevilla Castillo
279
Figure 127. IPv4 datagram encapsulating HSDPA data. ToS hexadecimal value is 00 and the precedence is “Routine”. This value maps to DSCP decimal number 0, which corresponds to Best Effort (BE) DSCP class.
It is verified, additionally, that the UL DCH return channel traffic (mainly
containing ACKs from DL TCP communication) is mapped to the same QoS policy
than DCH services in test case 3:
Type of Service (88)
- Precedence: Flash Override
- Normal Delay (minimize delay)(1)
- High Throughput (1)
- Normal Reliability (0)
Figure 128. IPv4 datagram encapsulating HSDPA return channel (UL DCH). ToS hexadecimal value is 88 as expected (AF41 DSCP class).
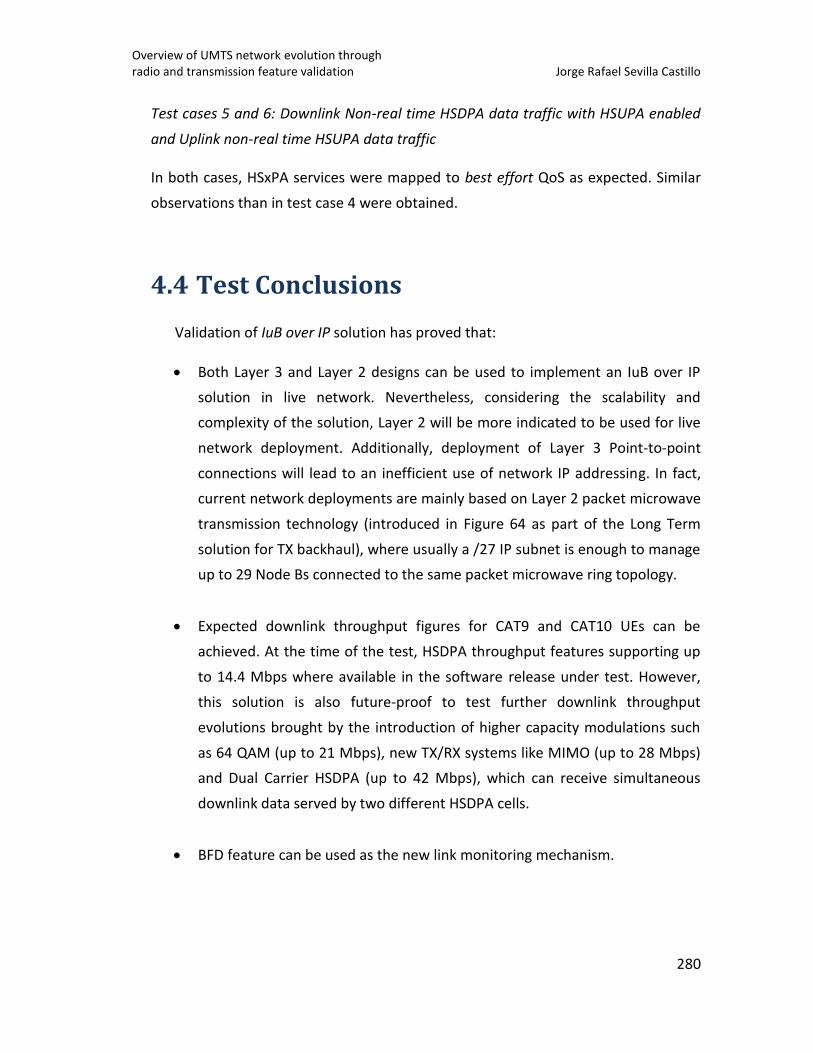
Overview of UMTS network evolution through radio and transmission feature validation Jorge Rafael Sevilla Castillo
280
Test cases 5 and 6: Downlink Non-real time HSDPA data traffic with HSUPA enabled
and Uplink non-real time HSUPA data traffic
In both cases, HSxPA services were mapped to best effort QoS as expected. Similar
observations than in test case 4 were obtained.
4.4 Test Conclusions
Validation of IuB over IP solution has proved that:
Both Layer 3 and Layer 2 designs can be used to implement an IuB over IP
solution in live network. Nevertheless, considering the scalability and
complexity of the solution, Layer 2 will be more indicated to be used for live
network deployment. Additionally, deployment of Layer 3 Point-to-point
connections will lead to an inefficient use of network IP addressing. In fact,
current network deployments are mainly based on Layer 2 packet microwave
transmission technology (introduced in Figure 64 as part of the Long Term
solution for TX backhaul), where usually a /27 IP subnet is enough to manage
up to 29 Node Bs connected to the same packet microwave ring topology.
Expected downlink throughput figures for CAT9 and CAT10 UEs can be
achieved. At the time of the test, HSDPA throughput features supporting up
to 14.4 Mbps where available in the software release under test. However,
this solution is also future-proof to test further downlink throughput
evolutions brought by the introduction of higher capacity modulations such
as 64 QAM (up to 21 Mbps), new TX/RX systems like MIMO (up to 28 Mbps)
and Dual Carrier HSDPA (up to 42 Mbps), which can receive simultaneous
downlink data served by two different HSDPA cells.
BFD feature can be used as the new link monitoring mechanism.

Overview of UMTS network evolution through radio and transmission feature validation Jorge Rafael Sevilla Castillo
281
Different network traffic (signaling, voice and data) can be applied a different
QoS class by using the information in Type of Service field within the IP
protocol header.
Overview of UMTS network evolution through radio and transmission feature validation Jorge Rafael Sevilla Castillo
282
5 Conclusions and future work
5.1 Conclusions
The test methodology studied during this thesis, has highlighted the
importance for the operator to implement lab validation campaigns prior to live
network deployment, but also should be considered as a mandatory experience
required for all engineers involved in transmission dimensioning, radio network
planning and radio network optimization.
In particular, the mobility test cases herein described have provided
solutions to mitigate specific 2G/3G inter-RAT mobility pitfalls, by testing features
oriented to reduce cell reselection time for Release 5 and Release 6 UEs and by
including the possibility of cancellation for an ongoing inter-RAT handover from 3G
to 2G, preserving a better user experience as a result. On the other hand, it has also
been reached the objective to successfully test a feature oriented to provide better
HSDPA throughput to a given premium user in a multi-user scenario. It has been
checked that if the end to end quality of service parameterization is consistent,
starting from the core network and finishing by the RAN, the Node B scheduling
priority could be useful for this purpose. Finally, it has been tested the evolution of
IuB interface in two steps: firstly, successful results have been achieved with the
implementation of Hybrid Backhaul feature. In this section, it has been introduced
the concept of ATM over Ethernet, involving two major parameters, which are the
concatenation factor and the packetization timer. This solution has also been tested
under non-ideal conditions in terms of delay and packet loss in the IuB interface, and
it can be concluded that none of the before mentioned parameters can improve the
downlink throughput figures under high delay conditions, but it has been proved
Overview of UMTS network evolution through radio and transmission feature validation Jorge Rafael Sevilla Castillo
283
that a higher ATM cell concatenation factor can contribute to a better performance
in the event of packet loss. Secondly, it has been presented the required steps to
configure and test the evolution towards a Full IP IuB interface. The increase in
transmission capacity brought by this solution scenario has allowed the downlink
throughput test for 3GPP Cat 9 and Cat 10 UE and sets the pace for future high
throughput demanding features.
5.2 Future work
Network system verification and performance testing is a continuous
process. As new software and hardware are implemented to the 3G network, not
only the new features need to be tested but also existing features and
functionalities need to be verified. But the future work should be mainly focused on
LTE. Even though legacy 3G and 2G networks are still being developed, it can be
expected that the development of LTE technology will continue for years to come. In
the field of mobility, the important areas to work will include more complex
scenarios in terms of inter-RAT mobility between 2G/3G/4G, since the operators will
focus on keeping the users in the coverage layer offering the best service. One
interesting topic is the implementation of voice services in a network which is
conceived for data. In a first stage, Circuit Switch Fallback, which leans on legacy
2G/3G networks to carry voice services, will be the first feature to test. Afterwards,
it is expected to appear the first implementations of VoIP in LTE networks, the so
called Voice over LTE (VoLTE). After the introduction of this feature, the main
challenge will be to maintain seamless user experience whilst moving across the
different RATs, since voice services are critical for the operator KPI. For that reason,
performance of Single Radio Voice Call Continuity (SRVCC), which is an inter-RAT
handover of an existing voice call in LTE to legacy 2G/3G networks, becomes an
important issue and should be intensively tested in lab environment. In parallel,
mobility towards non-3GPP standard networks, such as WLAN, will then remain as
one of the major areas of investigation. This will create the so called Heterogeneous
Networks (HetNets) environment, involving a mix of radio technologies and cell
Overview of UMTS network evolution through radio and transmission feature validation Jorge Rafael Sevilla Castillo
284
types working together seamlessly. Definitely, it will play an important role in
creating the optimal customer experience, especially in crowded areas.
Concerning data rates which can be transmitted over a capacity expansion of
the evolved backhauls studies during this thesis, future 3GPP releases, such as
Release 10, introduce the called LTE-Advanced, providing user data rates of up to
Gigabits per second. These challenges will imply the testing of enhanced MIMO
techniques of up to 8 TX antennas in downlink and 4 TX antennas in uplink. Cell with
transmission bandwidth of up to 100 MHz could be deployed by aggregating up to 5
LTE Release 8 20 MHz bandwidths.
All in all, new challenges can be expected as yet another radio access
technology with increased performance demands is to come: 5G standard is
expected to be included in 3GPP Release 14 and Release 15, in preparation for a
commercial deployment in 2020.
Overview of UMTS network evolution through radio and transmission feature validation Jorge Rafael Sevilla Castillo
285
References
[1] Holma, H., Toskala, A., UMTS Les réseaux mobiles de troisène génération. 2e
edition. OEM.
[2] Holma, H., Toskala, A., WCDMA for UMTS – HSPA evolution and LTE. Fourth
Edition. Wiley.
[3] 23.107 TS 2001 Universal Mobile Telecommunications System (UMTS); QoS
Concept and Architecture, 3rd Generation Partnership Project (3GPP).
[4] 25.306 TS 2009 UE Radio Access Capabilities, 3rd Generation Partnership Project
(3GPP).
[5] 25.331 TS 2009 Radio Resource Control (RRC); Protocol Specification, 3rd
Generation Partnership Project (3GPP).
[6] 36.300 TS Evolved Universal Terrestrial Radio Access (E-UTRA) and Evolved
Universal Terrestrial Radio Access Network (E-UTRAN); Overall description; Stage 2,
3rd Generation Partnership Project (3GPP).
[7] Alsenmyr, G., Bergström, J., Hagberg, M., Milén, A., Müller, W., Palm, H., van der
Velde, H., Walletin, P. and Wallgren, F. “Handover between WCDMA and GSM.”
Ericsson Review Vol.1 (2003): 11.
[8] Dimensioning WCDMA RAN, Nokia Siemens Networks WCDMA RAN, Rel. RAS06,
System Library, v.1
[9] Dimensioning Flexi WCDMA BTS, Nokia Siemens Networks WCDMA RAN, Rel.
RU10, System Library, v.2
[10] Deal, R. Cisco Certified Network Associated Study Guide. Exam 640-802. Mc
Graw Hill
[11] Tellabs 8600 Technical Documentation v6.3 April 2005
Copyright © 2022 FDOKUMEN